food additive intakes in ireland · • infid developed in conjunction with irish national food...
TRANSCRIPT

Food Additive Intakes in Ireland
Dr. Áine Hearty
UCD Institute of Food & Health

Presentation overview
• Why important to monitor additive intake
• Introduction to exposure assessment
• Data requirements
• Irish data – INFID: Ingredient database
• Case study of how additive intakes assessed
– Comparison with ‘Southampton study’
• Additive usages in foods on Irish market

Food additives – what’s the hype?
• Food safer
• Food look & taste better
Bad press....Consumer awareness

Monitoring Safety
• UK: COT - FSA
• EU: EFSAADI
•ADME studies•Safety factors•Body weight
Requirement: Continued monitoring of intakes within countries

Monitoring in practice...estimating EXPOSURE to food additives
Purpose: to provide a quantitative evaluation of the likely exposure from possible risk sources
Allows risk assessors to characterise the hazard in the context of real life.
Required:Information about sources of exposureLevels & duration of exposure
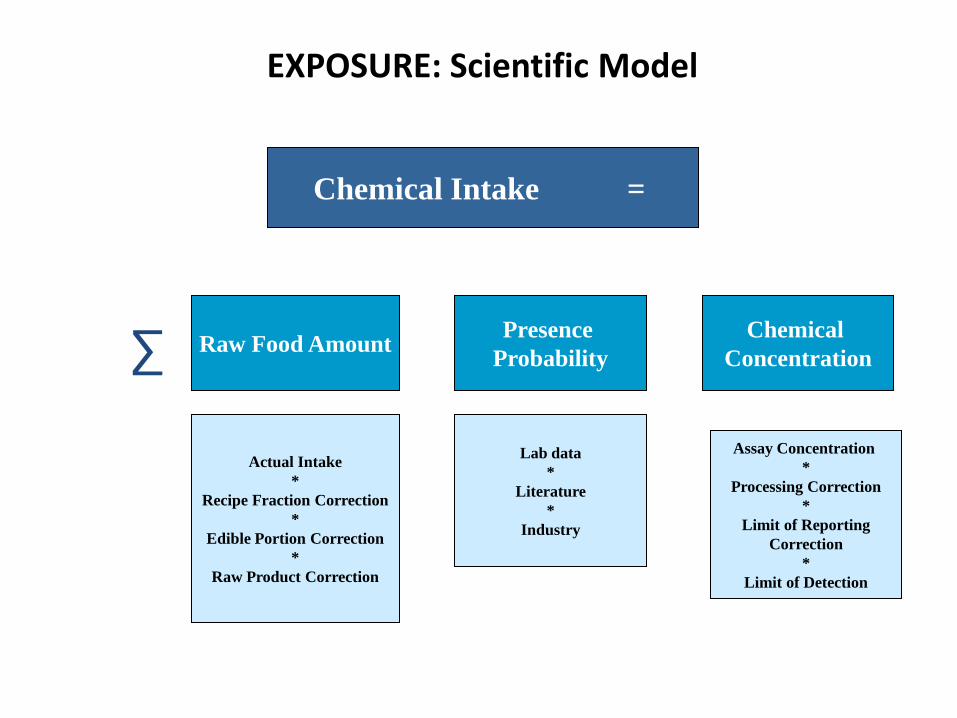
EXPOSURE: Scientific Model
Raw Food AmountPresence
Probability
Actual Intake
*
Recipe Fraction Correction
*
Edible Portion Correction
*
Raw Product Correction
Assay Concentration
*
Processing Correction
*
Limit of Reporting
Correction
*
Limit of Detection
Lab data
*
Literature
*
Industry
Chemical Intake =
∑Chemical
Concentration

Data requirements
Body weight (kg)
EU Legislation: Permitted Food Categories
Concentration Data:MPL’s, Industry use levels
Occurrence data: Branded foods
Food intake (target foods): Adults, children

Food additive occurrence data
• Often major source of uncertainty is knowledge of the actual occurrence of the chemical of interest
• Food ingredient databases - provide occurrence data e.g. INFID (Gilsenan et al., 2002)
FACET: Flavourings, Additives & food Contact materials Exposure Task
•EU Framework 7 project, 2008-2012•20 partners •UCD = coordinator•32 target food additives

Countries involved in occurrence data collection
Ireland
UK Finland
Portugal Italy
Poland
HungaryFrance

In general, the presence of
a food additive in a food
product must be indicated
on the label, by stating the
category and its name or E
number
The EU system has additives numbered in the range from E100 up to E1520
Occurrence data: Food labels

Food ingredient databaseIrish example: INFID
Normally, food intake studies do not record brand level data.
– Coca Cola & Pepsi Cola =“Carbonated soft drinks containing sugars”
In Ireland, we collect brand level data and brand packaging
– From brand packaging = ingredients & brand specific nutrition information

Methods
• INFID developed in conjunction with Irish national food consumption surveys: Children, teenagers, now adults
• 7-day, semi-weighed dietary surveys , recorded the habitual eating habits of participants
• NCFS = 594 children aged 5–12 y, 2003-04• NTFS = 441 teens aged 13–17 y, 2005-06
• Information food products examined and entered into INFID
• Information from INFID on the occurrence of additives merged with information from the food surveys
INFID and food intakes

Brand Food label data INFID database
Field work Coordinating research centre UCD

General brand information table
Brand IDFood Name
Food description
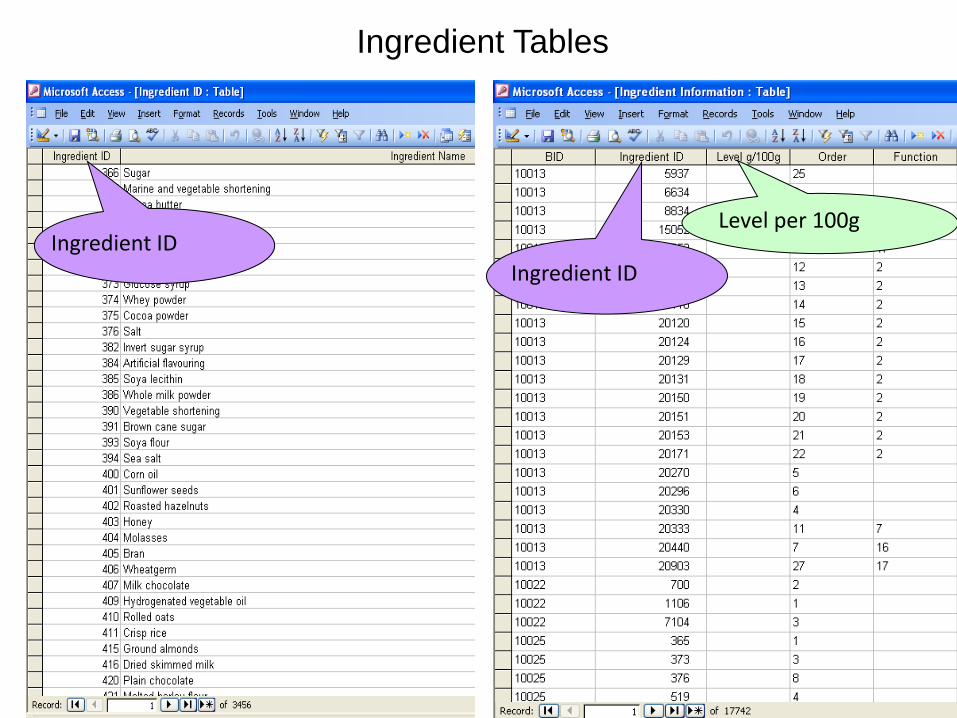
Ingredient Tables
Ingredient ID
Ingredient ID
Level per 100g

Application of INFID Irish children’s exposure to food additives


Southampton study: findings
• 153 3-year old and 144 8/9 year old UK children given a juice cocktail of 6 colours & 1 preservative or a placebo juice
• Study design: 6 week ‘additive-free’ diet, with fortnightly challenges with either an additive mix (twice) or placebo (once)
• Outcome: Those exposed to the 6 colour & 1 additive cocktail were more “hyper”

Additives Investigated
Colours:
• E129 Allura Red
• E110 Sunset yellow
• E122 Carmosine
• E124 Ponceau 4R
• E102 Tartrazine
• E104 Quinoline Yellow
Preservative:
• E211 Sodium Benzoate
“artificial colours or a sodium benzoate preservative (or both) in the diet result in increased hyperactivity in 3-year-old and 8/9-year old children in the general population.”
“Southampton Six”

Background…
• Amendment to Regulation (EC) No 1333/2008 - food(s) containing any of the 6 colours to carry additional label information (mid 2010)“may have an adverse effect on activity and attention in children”
- In 2009, UK government supported a voluntary ban on the 6 food colours by manufacturers“Name & Shame”
- Many branded products, including private branded foods have removed these additives
- Acceptable Daily Intakes (ADI’s) of three of the colours (QuinolineYellow, Sunset Yellow and Ponceau 4R) were lowered by EFSA, November 2009
Implications of study findings

“New fears over additives in children's food”Felicity Lawrence: The Guardian, Tuesday 8 May 2007
“Danger to children from food and drink
additives is exposed”Rebecca Smithers, The Guardian, Thursday 6 September 2007
“Parents warned about artificial
food additives”Harry Wallop, Telegraph, 06 Sep 2007
“Food additives making kids crazy”Kate Sikora, Health Reporter, The Daily Telegraph, December 17, 2007


Additives investigated: frequency in the diet of Irish children
Colours:
• E129 Allura Red
• E110 Sunset yellow
• E122 Carmosine
• E124 Ponceau 4R
• E102 Tartrazine
• E104 Quinoline Yellow
Preservative:
• E211 Sodium Benzoate
Irish children: 72,024 eating events
n=343
n=557
n=443
n=544
n=138
n=539
n=2188

Frequency of foods consumed containing 1 or more of the target additives
No. of target Additives
Children (total no. of food consumed =
72,024)
1 2,745 (3.8%)
2 312 (0.4%)
3 254 (0.35%)
4 83 (0.12%)
5 56 (0.08%)
6 0 (0%)
7 0 (0%)

Frequency of additive eating occasions per day over a 7 day period
No. of targetadditives
Children (total no. of child days = 4,158)
1 1271 (30.5%)
2 322 (7.7%)
3 211 (5.1%)
4 118 (2.8%)
5 92 (2.2%)
6 or 7 30 (0.7%)

Of total foods consumed (72,024), how many times were target additives eaten?
0% of any food contained all 7 additives
Concurrent intake of target additives
Of total meals consumed (19,795), how many times were target additives eaten?
Only 16% of all meals/snacks contained >1 additive

Exposure AssessmentsThree scenarios were run to conduct the exposure analyses
Scenario 1: Using the Maximum Permitted Level
(MPL) and assuming that if the additive is legally
permitted in a food group, it is present
Scenario 2: Using the MPL and chemical occurrence
data (from INFID)
Scenario 3: Using chemical concentration data
(from 4 sources) and chemical occurrence data (from INFID)• Industry
• Food Safety Authority of Ireland (FSAI)(2007)
• United Kingdom Food Standards Agency (UKFSA)(2000,2002,2003)
• Food Standards Australia and New Zealand (FSANZ)(2008)

Conclusions• In Irish children, levels of exposure to the target
additives rarely, if ever, reached the levels used
in the Southampton study
• Levels of exposure did not exceed ADI’s
• This is true when applying 3 different
scenario’s – ranging from conservative to more refined.
• Running the three scenarios also illustrate that the application of chemical occurrence and concentration data is necessary to provide realistic chemical exposure analyses.
Children 'don't eat enough junk' to be hyperactive
EXPOSURE RESULTS: IRISH CHILDREN

Food additive usage in Irish foods

Food group %
Desserts 90.9
Confectionery 90.7
Nutritional Supplements 87.5
Cakes, buns, pastries, biscuits 86.9
Meat products 84.8
Savouries 82.2
Beverages 78.1
Bread 77.6
Snacks 77.4
Soups, sauces and miscellaneous foods 77.0
Fish 66.7
Fat spreads & oils 64.3
Breakfast cereal 62.5
Dairy 57.5
Meat & dishes 44.0
Sugars, syrups, preserves and sweetners 42.9
Vegetables, including potatoes 28.8
Fruit & juices 18.4
Rice and pasta, flours, grains 17.9
Eggs & dishes 0.0
% branded foods within each food group containing an additive
INFID = 1806 branded foods
20 major food categories

Functional ingredient
20%
Emulsifier14%
Colour14%
Preservative9%
Stabiliser10%
Acidity regulator5%
Antioxidant5%
Raising agent6%
Flavour enhancer5%
Sweetener4%
Flour treatment agent
2%
Glazing agent1%
Humectant1%
Others4%
Additive functions according to foods in INFID: % usage

Most commonly recorded food additive per function
Additive category n Additive Additive name
Emulsifier 39 E322 Lecithin
Colour 36 E160a Carotenes, Mixed Carotenes, Beta-carotene
Preservative 36 E202 Potassium sorbate
Stabiliser 33 E450 Sodium, potassium and calcium diphosphates
Acidity regulator 24 E331 Sodium citrates
Antioxidant 21 E300 L-Ascorbic acid
Raising agent 17 E500 Sodium carbonates
Flavour enhancer 15 E621 Monosodium glutamate
Sweetener 14 E951 Aspartame
Thickener 14 E412 Guar gum

Summary
• Importance occurrence data in exposure assessments
• Food additive usage and intake monitored in Ireland– INFID database– Food consumption surveys– Intake of food additives in Irish populations not of
concern
• >90% desserts and confectionery foods contained additives
• Emulsifiers and Colours most common function of additives in foods– Lecithin (E322) most frequent emulsifier– Carotenes (160a) most frequent colour