food aid quality review burkina faso effectiveness and
TRANSCRIPT

1
Food Aid Quality Review
Burkina Faso Effectiveness and Cost-Effectiveness Study:
First Round of Results
January 31, 2018
Washington, D.C.

We need to “identify strategic opportunities to make global humanitarian assistance more effective and efficient, including prioritizing needs and reducing duplication and costs.”
Gregory C. Gottlieb, Acting Assistant Administrator,
Bureau For Democracy, Conflict and Humanitarian Assistance,
March 22, 2017 to Senate Committee on Foreign Relations
2
Background: Improve Efficiency of Food Aid
Photo courtesy of USAID

FY2016 –Title II Food Aid
Ø ~$2 billion spent (emergency + non-emergency)
Ø 60,000 metric tons of nutrition value-added products
Ø 73,000 metric tons of vegetable oil
3

Big Questions:
• Are we spending public money wisely when it comes to selecting and delivering nutritionally enhanced products?
• Are we programming products optimally for desired outcomes?
• What roles do non-food factors play in driving outcomes?
• Can we manage wasting by preventing stunting (or visa versa)?
• Are stunting and wasting episodes related in ways that food aid can address?
4

Institutional Roles and Research Project Responsibilities.
5
USAID
Title II Funds Donor
Tufts UniversityStudy Management
Data management and analysis
IRSSData Collection and Entry:
Field surveys and focus groupsAnthro data collected at FDPs
ACDI/VOCA
Ensure Commodity Reception/Treatment in Ouaga
Save the Children
Ensure delivery to caregivers & BCC programming
ViM Program
Food procurement and storageFood distribution at FDPs
ProgramActivitiesStudyActivities

• Introduction
–Background and overview of study design
• Results
–Effectiveness
–Cost-effectiveness
–Factors potentially influencing effectiveness
• Discussion
–What have we learned?
–What questions remain?
– Implications
6
Today’s Presentation

Overview of study design
7

Aims of the Burkina Faso Field Study
Evaluate the comparative effectiveness and cost-effectiveness of 4 food aid products in preventing stunting and wasting in children 6-24 months of age in Burkina Faso, and describe potential influencing factors.
8

9
Study Arms:CSB+ with oil
CSWB with oil, SC+RUSF
Effectiveness: Prevention of Stunting and
Wasting
Controlling for Potential Confounders:Household & Community level characteristics
Factors Potentially Influencing
Effectiveness:Utilization of study food
Cost-Effectiveness: Cost of stunting
and wasting averted compared to CSB+ with oil
Study Design | Conceptual framework & Objectives

Study Food Contents
CSB Plus + Oil* (CSB+)
Cornmeal, whole soybeans, vitamin/mineral premix
Corn Soy Whey Blend + Oil* (CSWB)
Cornmeal, soy flour, whey protein concentrate, vitamin/mineral premix
Super Cereal Plus (SC+)
Corn, dehulled soybeans, dried skim milk powder, vitamin/mineral premix
Ready-to-Use Supplementary Food (RUSF)
Oilseeds, tree nuts, pulses, cereals, sugar, dairy protein, vegetable oil, vitamin/mineral premix
10
Study Design | The 4 supplementary study foods
Monthly ration ~500 kcal/day (as delivered).
*Fortified with Vitamin A & D

Study Setting
11
• Existing Title II USAID supplementary feeding program (VIM) targeting all pregnant and lactating mothers and children 6-23 months in Sanmatenga Province
• Four geographic regions randomly assigned one of four foods distributed at 48 distribution sites
CSWB
RUSF
CSB+SC+

Study Sampling
12
• Target of 6,000 children, enrolled at age ~6 months (1,500 per study food arm)
• Each child measured monthly for ~18 months during the ViM program plus 3 consecutive monthly post-intervention follow-ups
• Randomly selected sub-samples for interviews and in-home observations
CSWB
RUSF
CSB+SC+

Data Collection Methods
§ Anthropometry: monthly
§ Morbidity & treatment survey: monthly
§ Socio-economic survey: enrollment & exit
§ Community questionnaire: enrollment
Effectiveness Cost-Effectiveness Influencing Factors
§ Distribution observations
§ Warehouse observations
§ Individual surveys with beneficiaries & lead mothers
§ In-home observations with beneficiaries
§ Distribution observations
§ Individual surveys with beneficiaries, lead mothers, health & nutrition promoters
§ In-home observations with beneficiaries
§ Focus Group Discussions with beneficiaries & distribution committees
13

14
Effectiveness Results

15
Conceptual Framework
Study Arms:CSB+ with oil
CSWB with oil, SC+RUSF
Effectiveness: Prevention of Stunting and
Wasting
Controlling for Potential Confounders:Household & Community level characteristics
Factors PotentiallyInfluencing
Effectiveness:Utilization of study food
Cost-Effectiveness: Cost of stunting
and wasting averted compared to CSB+ with oil

• Compare the effectiveness of four foods as used in a real-world programmatic setting in preventing:
– Stunting (length-for-age Z-score < -2)
– Wasting (weight-for-length Z-score < -2)
• Evaluate 3-month post-intervention follow-up.
– Measurement where child’s age was between 22.9 and 23.9 months
16
Objectives
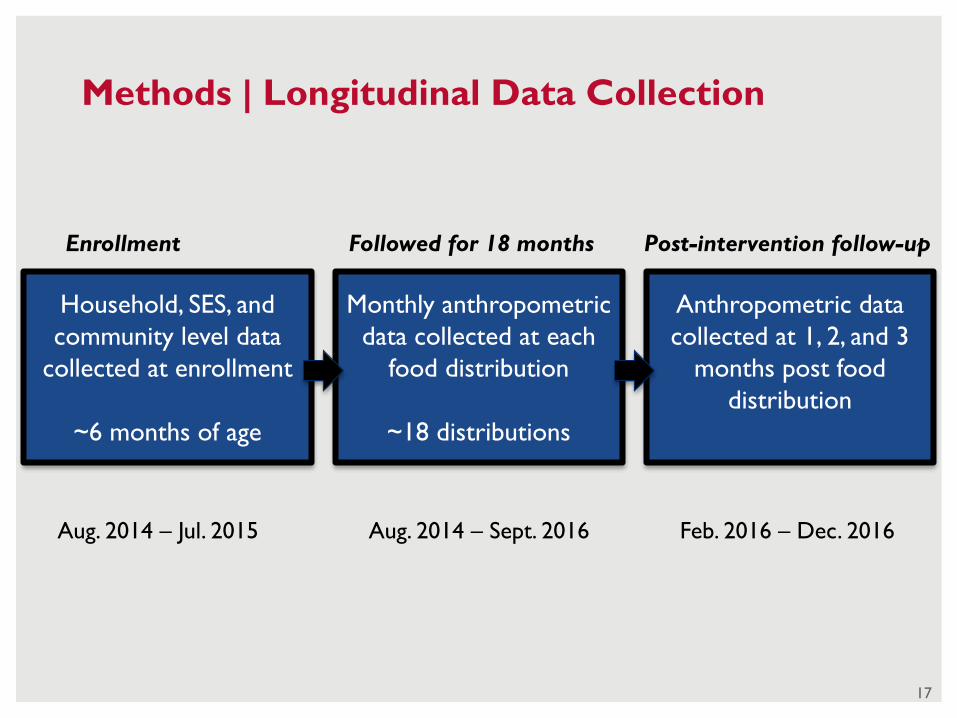
17
Methods | Longitudinal Data Collection
Household, SES, and community level data
collected at enrollment
~6 months of age
Monthly anthropometric data collected at each
food distribution
~18 distributions
Anthropometric data collected at 1, 2, and 3
months post food distribution
Enrollment Followed for 18 months Post-intervention follow-up
Aug. 2014 – Jul. 2015 Aug. 2014 – Sept. 2016 Feb. 2016 – Dec. 2016

• Selection of covariates based on conceptual framework• Statistical models à
– Prevalence of stunting at endline à Logistic Regression – Total number of months wasted à Negative Binomial
Regression– Mean LAZ and WLZ throughout study period à Mixed-
effects Regression– Time to first stunted and wasted measures à Cox Model
• Models fit with and without those who had an endline measurement
• Multiple imputation for missing data• Models evaluated for collinearity and influential outliers
18
Methods | Data Analysis
Y=β0+βstudyfood+βindividualcharacteristics…βcommunitycharacteristics+ε

19
Study Arms Similar with Regard to Programmatic Exposure and Loss-to-follow-up

20
Enrollment Characteristics
CSB+
(n=1519)
CSWB
(n=1503)
SC+
(n=1564)
RUSF
(n=1526)
Age(months) 5.9± 0.8 6.6± 0.9 6.3± 0.7 6.2± 1.2
Malesex 774(51%) 779(52%) 802(51%) 755(49%)
Severely food
insecure230(15%) 201(14%) 204(13%) 209(14%)
Poorest SES 375(25%) 267(18%) 294(19%) 260(17%)
LAZ -0.72± 1.07 -0.56 ± 1.16 -0.53± 1.04 -0.58± 1.11
WLZ -0.54± 1.05 -0.58± 1.04 -0.44± 1.04 -0.59± 1.04
MUAC Z -0.46± 0.97 -0.43± 0.96 -0.31± 0.96 -0.45± 0.96
Stunted~6mos. 148(10%) 135(9%) 110(7%) 138(9%)
Wasted~6mos. 121(8%) 125(8%) 111(7%) 121(8%)

Results on Stunting Prevention
21

The odds of stunting at endline were similar in SC+ and RUSF; twice as high in the CSWB arm
AdjustedORs à
Ref. 2.07* 1.02 1.21
*p<0.05
22

23
LAZ declined in all arms, with greatest decline in the CSWB arm

24
Non-stunted time was similar among the arms, but slightly lower in the CSWB arm

Results on Wasting Prevention
25

26
Number of monthly measures wasted were similar in the SC+ and RUSF arms, but higher in the CSWB arm
ADJUSTED NUMBER OF MONTHLY MEASURES WASTED
Ref. 1.25* 0.96 0.92
*p<0.05
AdjustedIRRs à

27
WLZ trajectories are similar, with the RUSF arm showing a slower rate of decline

28
Non-wasted time was similar among the arms, but slightly lower in the CSWB arm
Relationships between stunting and wasting
29

• At Baseline (6 months)
– 13% of stunted children were also wasted
– 15% of wasted children were also stunted
• 64% of those who were stunted at endline were also wasted at least once throughout the study period
• Of those who were stunted at endline, the percentage never wasted ranged from 32-44% by study arm
• Of those who were ever stunted, 30% had their first stunted measure preceded by wasting
30
Coexistence of stunting and wasting

31
Percentages never wasted among those who were stunted at endline

• None of the foods prevented linear growth faltering
• Children in the CSWB arm experienced higher rates of stunting and wasting, while rates in the SC+ and RUSF arms were similar to CSB+
• Understanding these effectiveness results requires understanding factors that may influence effectiveness
32
Summary points
33
Factors Influencing Effectiveness

34
Conceptual Framework
Study Arms:CSB+ with oil
CSWB with oil, SC+RUSF
Effectiveness: Prevention of Stunting and
Wasting
Controlling for Potential Confounders:Household & Community level characteristics
Factors Potentially Influencing
Effectiveness:Utilization of study food
Cost-Effectiveness: Cost of stunting
and wasting averted compared to CSB+ with oil

Behaviors explored:
• Sharing
• Preparation
• Consumption
35
Need to understand influencing factors

– In-home observations (n=209)
– Individual interviews with beneficiary mothers (n=1,463)
– Focus Group Discussions with beneficiary mothers and distribution committees (n=48)
– Lead mother and promoter interviews (n=308)36
Qualitative Data Collection Methods

Results –
Diversion (sharing, giving away or selling ration)
37

Ration diversion: Caregivers report diverting the ration from the intended beneficiary most often in the CSWB arm
• No selling reported in any study arm• Giving away any of the ration was rare (8-13%)• Giving away oil was also rare (7-8%)• 18-21% of people report using oil for other household cooking
68% 69%75% 74%
54%
OVERALL
(N=1,632)
CSB+
(N=415)
CSWB
(N=406)
SC+
(N=409)
RUSF
(N=401)
38

Observed presence of food in households:Study foods were observed to be present in the households most often in CSB+ and least often in CSWB
Average over 4 days of observation
92%
53% 55%60%
4%
45%
25% 25%
4% 2%
20%15%
CSB+ (N=50) CSWB (N=55) SC+ (N=51) RUSF (N=53)
Study food present Study food not present Not documented
39
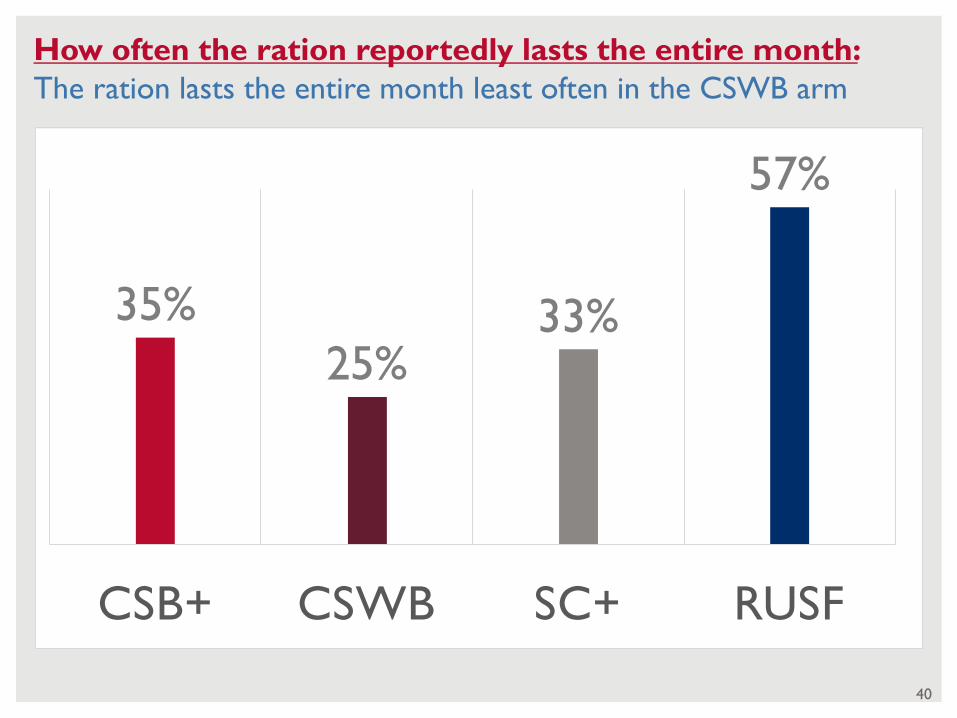
How often the ration reportedly lasts the entire month: The ration lasts the entire month least often in the CSWB arm
35%25%
33%
57%
CSB+ CSWB SC+ RUSF
40

24%
36%
25%23%
CSB+ (N=46)
CSWB (N=29)
SC+ (N=28)
RUSF (N=32)
When study food was present, HH average over 4 days of observation
Someone other than beneficiary observed eating the food: Others were observed eating the food most often in the CSWB arm
41

57%71% 68%
44%
CSB+ CSWB SC+ RUSFAdjusted ORs à Ref. 1.9* 1.63* 0.60**p<0.05
Adjusted percentages of diversion: Caregivers are more likely to report diverting CSWB than the other foods
42

“Even when we are getting ready to make porridge, the big brother can approach and say ‘can I have some?’. We cannot refuse so we give him a bit. Everywhere, it’s the same.”
Ration sharing quotes from focus groups:
43
“They told us that if the mother eats some herself at night, the next morning she will have plenty of milk for her child.”
“It’s true that it was said that it is for the child only, but often we give some to his older brothers, that’s how it is. If we do not give it to them they will cry, so we give them a bit to calm them down and we save the rest.”
“Often the mother tastes a bit and if the big brother of the child is nearby we also give him some.”

Results - Preparation
44

Fat content in household porridge samples: Samples indicate lower fat content than would be expected if porridge prepared according to recommendations
Intrinsic Oil
Average qty added: 7.3 g/100g 6.6 g/100g
Target quantity of added oil (FAQR)
Required fat content range for RUSF
45
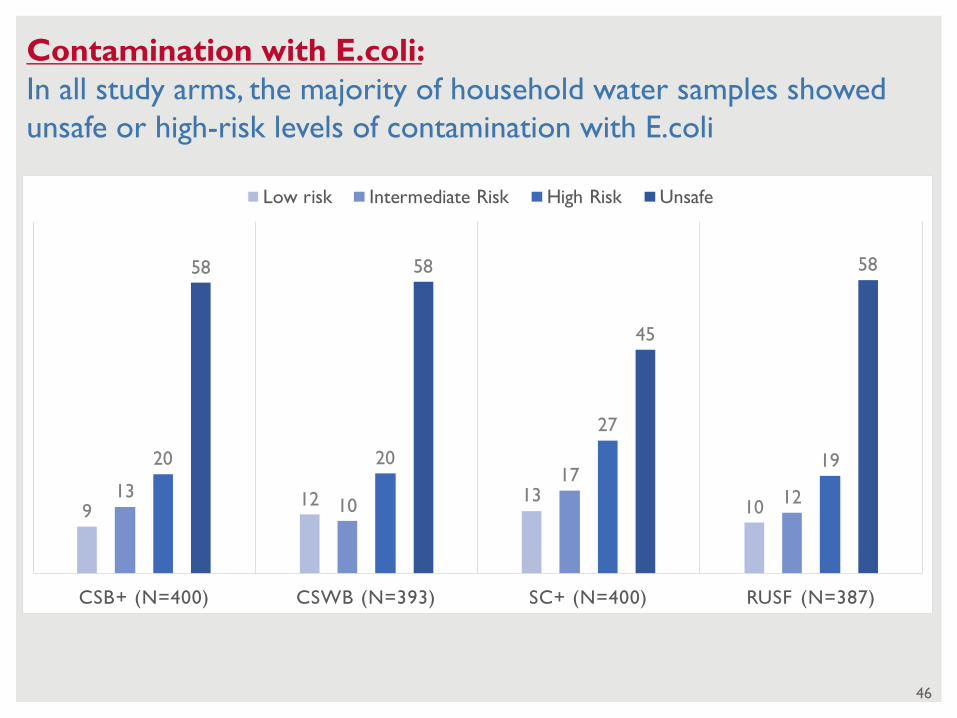
Contamination with E.coli:In all study arms, the majority of household water samples showed unsafe or high-risk levels of contamination with E.coli
46
912 13
1013
10
1712
20 20
27
19
58 58
45
58
CSB+ (N=400) CSWB (N=393) SC+ (N=400) RUSF (N=387)
Low risk Intermediate Risk High Risk Unsafe

Results - Consumption
47
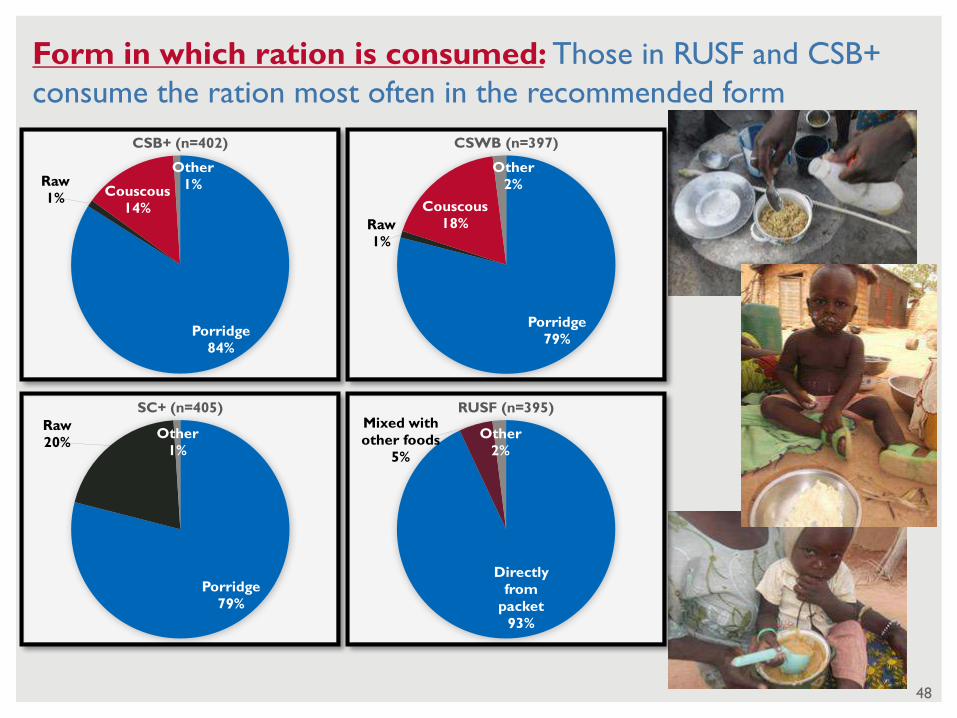
Form in which ration is consumed: Those in RUSF and CSB+ consume the ration most often in the recommended form
Directly from
packet93%
Mixed with other foods
5%
Other2%
RUSF (n=395)
Porridge79%
Raw20%
Other1%
SC+ (n=405)
Porridge84%
Raw1% Couscous
14%
Other1%
CSB+ (n=402)
Porridge79%
Raw1%
Couscous18%
Other2%
CSWB (n=397)
48
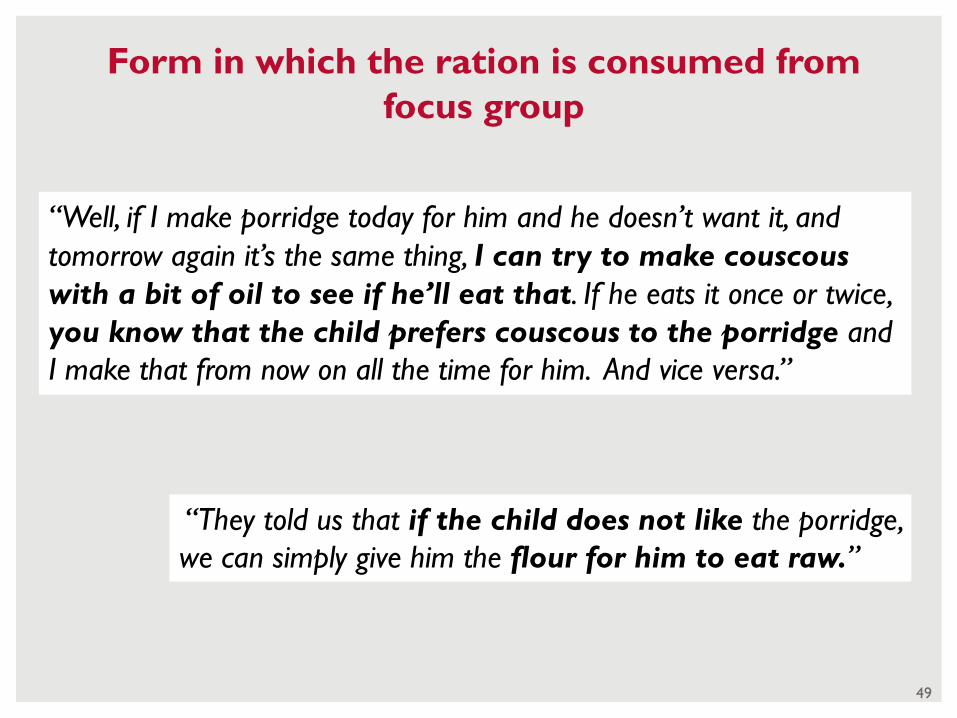
Form in which the ration is consumed from focus group
49
“Well, if I make porridge today for him and he doesn’t want it, and tomorrow again it’s the same thing, I can try to make couscous with a bit of oil to see if he’ll eat that. If he eats it once or twice, you know that the child prefers couscous to the porridge and I make that from now on all the time for him. And vice versa.”
“They told us that if the child does not like the porridge, we can simply give him the flour for him to eat raw.”

Adjusted ORs à Ref. 0.60* 1.14 1.80**p<0.05
Adjusted percentages for recommended form: Caregivers report consuming CSWB in its recommended form significantly less often than the other foods, and RUSF significantly more often
72%
61%
74%82%
CSB+ CSWB SC+ RUSF
50

38%
18%
52%
60%
CSB+ (N=46) CSWB (N=29) SC+ (N=28) RUSF (N=32)
51
Observed consumption:Children were most often observed consuming the study food in the RUSF arm, and least often in the CSWB arm
When study food was present, HH average over 4 days of observation
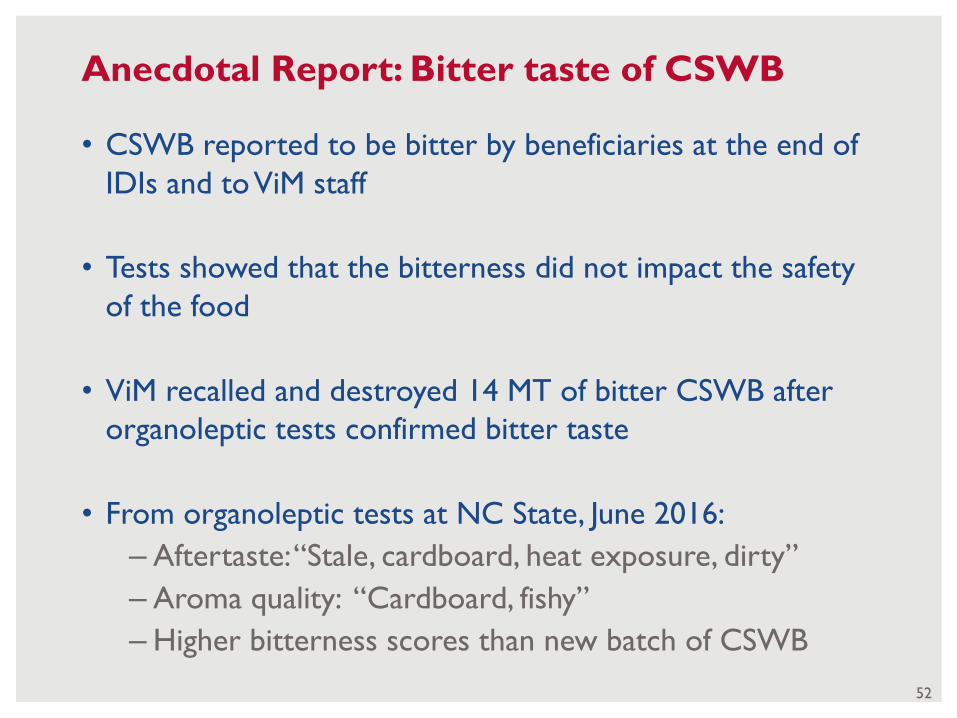
• CSWB reported to be bitter by beneficiaries at the end of IDIs and to ViM staff
• Tests showed that the bitterness did not impact the safety of the food
• ViM recalled and destroyed 14 MT of bitter CSWB after organoleptic tests confirmed bitter taste
• From organoleptic tests at NC State, June 2016:
– Aftertaste: “Stale, cardboard, heat exposure, dirty”
– Aroma quality: “Cardboard, fishy”
– Higher bitterness scores than new batch of CSWB
52
Anecdotal Report: Bitter taste of CSWB

Summary Points
53
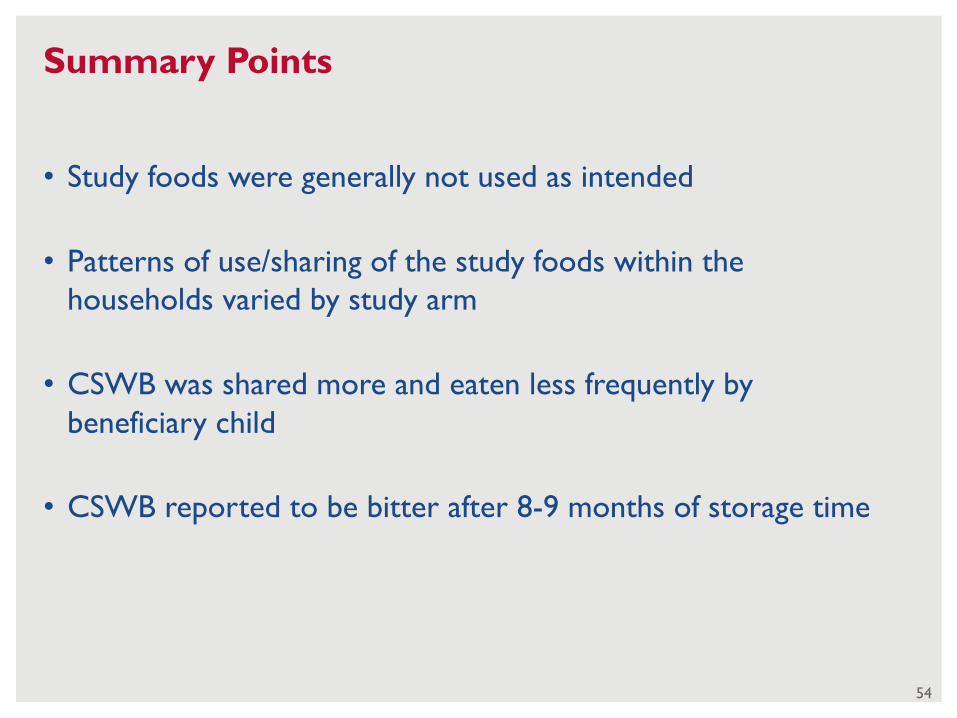
• Study foods were generally not used as intended
• Patterns of use/sharing of the study foods within the households varied by study arm
• CSWB was shared more and eaten less frequently by beneficiary child
• CSWB reported to be bitter after 8-9 months of storage time
54
Summary Points

55
Cost and Cost-Effectiveness

56
Conceptual Framework
4 Study Arms:CSB+ with oil
CSWB with oil, SC+RUSF
Effectiveness: Prevention of Stunting and
Wasting
Controlling for Potential Confounders:Household & Community level characteristics
Factors Potentially Influencing
Effectiveness:Utilization of study food
Cost-Effectiveness: Cost of stunting
and wasting averted compared to CSB+ with oil

Costing Methods
• Two Cost Lenses (for procurement and international freight):
- Study-Incurred
- Realistic
57
• Two Costing Perspectives:
- Program Perspective (e.g. Product, Supply Chain, Distribution, etc)
- Caregiver Perspective (Opportunity Cost of Caregiver Time)
• Activity-based Costing Approach
• Ongoing Cost (existing program, no start-up cost)

Costing Matrix
Loss-adjusted
Average Cost per Child Reached
Average Cost per Monthly Ration
Average Cost per Metric Ton 58

59
Assessing Cost-Effectiveness Across Study Arms
∆ Cost Estimates
Difference in
Average Cost per Child Reached
∆ Measured Effect
Primary Outcome for Stunting
• Difference in % Stunted at Endline
Primary Outcome for Wasting
• Difference in # of Monthly Measurements Showing Wasting
Comparative Cost-
Effectiveness
Each Arm Compared to
Reference Arm
(CSB+ with oil)

60
Results on Costs: Program Perspective
Image Source: UNICEF

Cost/MT ($USD)Breakdown by Food Product and Supply Chain
(Realistic Procurement & Freight)
61
0
500
1000
1500
2000
2500
3000
3500
4000
Oil CSB+ CSWB RUSF SC+
Storage
Reconditioning
Repacking
Inland transportation
International Freight
Food Product/Commodity
1811
1169
1532
3707
2704

Cost per Child Reached ($USD)Breakdown by Food and Other Program Cost
(Realistic Procurement & Freight)
62
0
50
100
150
200
250
300
CSB+ w/oil CSWB w/ oil RUSF SC+
Administrative & Fixed Cost
Distribution
Storage
Reconditioning
Repacking
Inland transportation
International Freight
Food Product/Commodity
122
253
223
135

63
•Photo
court
esy
of U
SAID
Cost-Effectiveness Results
Photo courtesy of USAID

64
Analysis: Excluding Lost-To-Follow-UpCSB+ w/ oil
CSWB w/ oil
RUSF SC+
Program Cost per Child Reached*Realistic Procurement & Freight
122.4 135.2 252.4 223.0
Predicted % Stunted at Endline (95%CI)
*Adjusted for baseline stunting and other confounders
20.1%
(18.0%,
22.2%)
27.5%
(25.0%,
30.0%)
20.3%
(18.3%,
22.4%)
21.9%
(20.0%,
23.9%)
Linking Cost to Effectiveness: Stunting— Average Cost per Child Reached ($USD) — % Stunted at Endline

CE Plane Graph Stunting Program Cost Study
65
Less Costly
More Costly
More EffectiveLess Effective

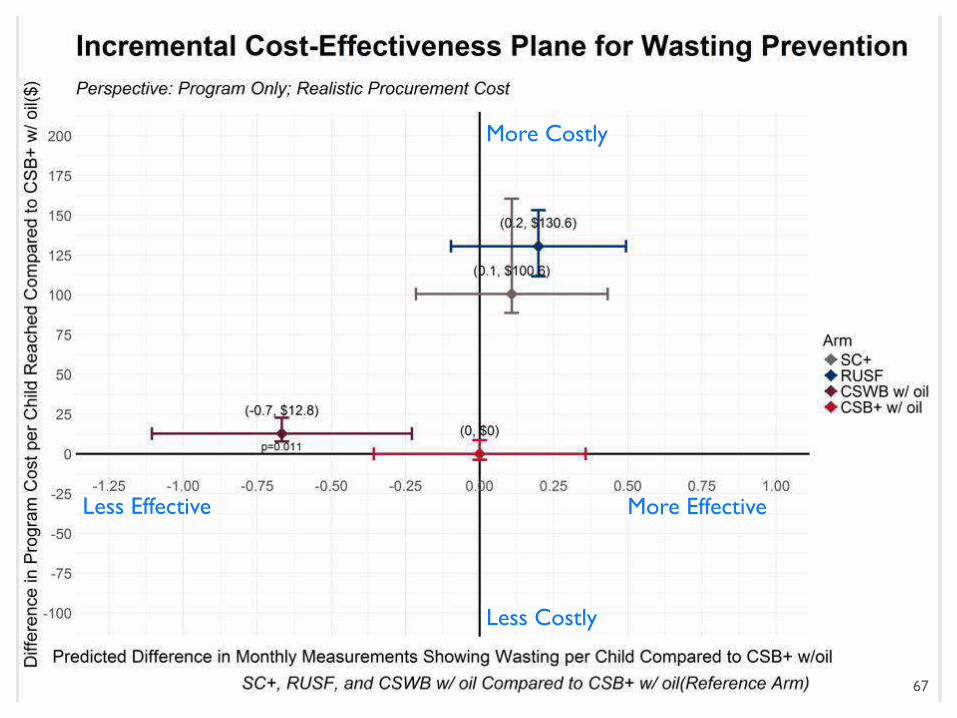
Linking Cost to Effectiveness: Wasting— Average Cost per Child Reached ($USD)— # Monthly Measurements Showing Wasting per Child
66
Analysis: Excluding Lost-To-Follow-Up
CSB+ w/ oil
CSWB w/ oil
RUSF SC+
Program Cost per Child Reached*Realistic Procurement & Freight
122.41 135.2 252.4 223.0
Predicted # Monthly Measurements Showing Wasting per Child (95%CI)*Adjusted for total number of monthly measurements received and other confounders
2.6
(2.3,3.0)
3.3
(2.8,3.7)
2.4
(2.1,2.7)
2.5
(2.2, 2.8)
CE Plane Graph Stunting Program Cost USAID
67
More EffectiveLess Effective
Less Costly
More Costly
Caregiver Perspective
Photo courtesy of USAID
68

Opportunity cost of time =
hours of time x estimated hourly wage
69
Opportunity Cost of Caregiver Time
Self-reported & observed time(Mother IDI and IHO)
$0.21/hrCalculated by:• Mandated minimum
monthly wage in the formal sector: 30684 CFA
• Standard workweek of 60 hours for household workers

70
Opportunity Cost of Caregiver Time per Monthly Ration
Breakdown by Caregivers’ Activity Types
$0.00
$2.00
$4.00
$6.00
$8.00
$10.00
$12.00
CSB+ w/oil CSWB w/oil RUSF SC+
Study Food Feeding
Study Food Preparation
Waiting at Distribution Site
Traveling to Distribution Site

The Impact of Adding Caregiver Opportunity Cost on Comparative Total Cost/Child by Arm
71

$Cost/Child ReachedProgram & Caregiver Perspective
(Realistic Procurement & Freight)
@$0.21/hr
174 152
99 179
0
50
100
150
200
250
300
350
400
450
CSB+ w/oil CSWB w/ oil
RUSF SC+
Caregiver Opportunity Cost
Total Cost to Program
72

CE Plane Graph Stunting Program Cost Study
73
Less Costly
More Costly
More EffectiveLess Effective

CE Plane Graph Stunting Program Cost Study
74
Less Costly
More Costly
More EffectiveLess Effective

CE Plane Graph Stunting Program Cost USAID
75
More EffectiveLess Effective
Less Costly
More Costly

CE Plane Graph Stunting Program Cost USAID
76
More EffectiveLess Effective
Less Costly
More Costly

• Cost and cost-effectiveness analysis provides information needed in the
selection of supplementary foods.
• Cost-Effectiveness Results for stunting and wasting are similar:
– CSB+ with oil was most cost-effective
– RUSF was the most expensive from the program perspective; SC+
was most expensive from the program & caregiver perspective
– CSWB had the second lowest cost, but also lower effectiveness
• Valuing caregiver time affects relative rankings of cost-effectiveness, but
not conclusion that CSB+/oil was most cost-effective in this study.77
Summary Points

78
What have we learned?

79
• “RUTF used as part of the WHO 2013 protocol
is effective in promoting recovery from SAM
and reducing mortality.”
• “Use of RUSF to treat MAM.. has the potential to improve nutritional recovery.” [treatment]
• “Weight gain reported by studies for children given RUSF or CSB was small. There were no substantial differences in mortality rates reported for children who received RUSF compared with children in CSB groups.”
Recent Systematic Review on targeted treatment of MAM shows similar findings

Fig 5. Forest plot: Lipid-based nutrient supplement versus Specially formulated micronutrient fortified foods, outcome:
1.3 Recovery from moderate acute malnutrition.
Gera T, Pena-Rosas JP, Boy-Mena E, Sachdev HS (2017) Lipid based nutrient supplements (LNS) for treatment of children (6 months to 59 months) with moderate acute malnutrition (MAM): A systematic review. PLOS ONE 12(9): e0182096. https://doi.org/10.1371/journal.pone.0182096http://journals.plos.org/plosone/article?id=10.1371/journal.pone.0182096
“Subset analyses
suggested higher
recovery rates with
greater amount of
calories provided.”
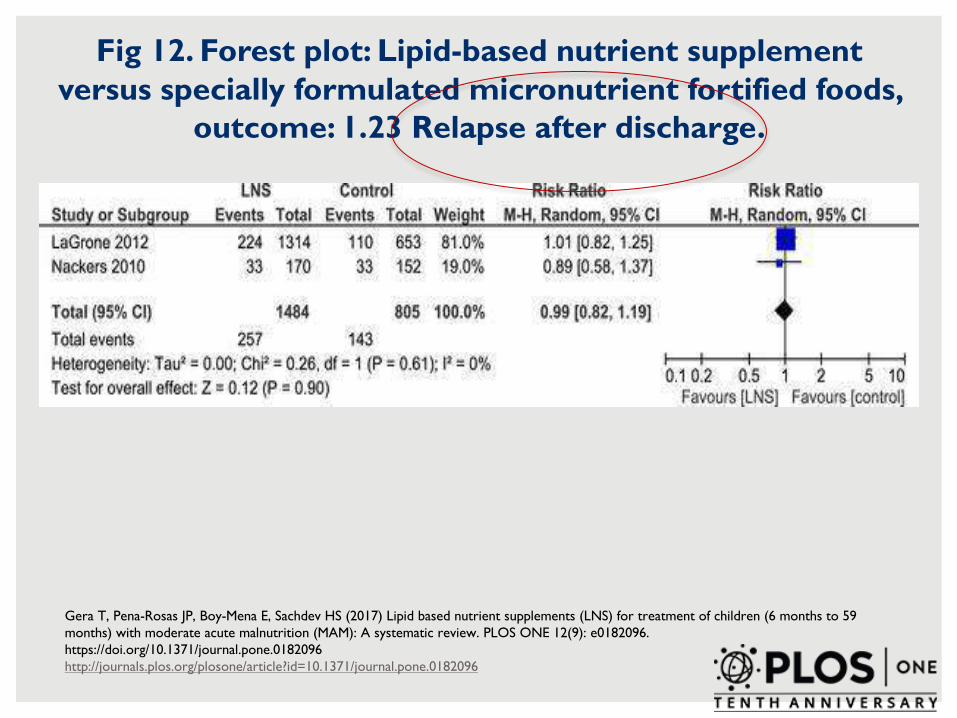
Fig 12. Forest plot: Lipid-based nutrient supplement versus specially formulated micronutrient fortified foods,
outcome: 1.23 Relapse after discharge.
Gera T, Pena-Rosas JP, Boy-Mena E, Sachdev HS (2017) Lipid based nutrient supplements (LNS) for treatment of children (6 months to 59 months) with moderate acute malnutrition (MAM): A systematic review. PLOS ONE 12(9): e0182096. https://doi.org/10.1371/journal.pone.0182096http://journals.plos.org/plosone/article?id=10.1371/journal.pone.0182096

• Foods used in blanket supplementation in this context had limited effect in preventing stunting and wasting.
• Food products have to be consumed by intended index individual to have any chance of achieving intended outcome. Mostly this is not happening, regardless of product.
• Some ingredients may matter more (protein source, ASF, potassium, zinc, amino acids, etc.). But all foods performed in similar ways, so beware too much tinkering a) absent evidence of real physiological significance b) more findings on dosing.
Some things were confirmed by this study
82

Growth Faltering: What, when, and can we disrupt the curve?
Victora et al. 2010 83
Hei
ght
for
age

84
WHO growth curves
v Burkina study children

85
What have we learned? (i)
1. None of the foods prevented decline in LAZ over time. All foods performed comparably, but carry very different costs.
2. Most cost-effective re: defined outcome was CSB+.
3. Least cost-effective: CSWB (least often observed in-home; most shared; most often reported ‘not lasting entire month’).
4. We can’t ascribe performance to product composition. Relatively poor performance of children in the CSWB arm does NOT mean that adding WPC80 resulted in stunting.

• South Sudan (Doocy et al 2013) -
“Household food security remained poor despite ration receipt.”
• Burundi (Leroy et al 2017) –
“Positive effect on household access to food…[but minimal
impact] on household and mothers’ dietary diversity.”
• Guatemala (Ruel et al 2017) –
“Larger [family] ration led to greater participation and impacts.”
• Haiti (Donegan et al 2013) –
“Rigorous evaluations of food-assisted…programs are stymied by the ethics of randomizing recipients to a control.”
86
Other PM2A evidence: food security matters

87
What have we learned (from Burkina Faso)? (ii)
5. Children in CSWB arm experiencing stunting earlier (than in other arms) may suggest insufficient food intake not ameliorated by supplementary food (which was shared more).
6. Sharing/diversion of foods typical for all foods (incl. >50% RUSF); children in CSWB arm seem least likely to be consuming adequate product. [We are not seeing reports of ‘bitter taste’ of CSWB in ongoing Sierra Leone study.]
7. Quality of programming matters at least as much as quality of products being programmed. We need much more evidence of effective programming actions surrounding delivery of food aid.
8. To better understand programming requires much more attention to drivers of community participation, compliance, substitution, links among programming components, etc.
88
What have we learned? (iii)

“While WASH alone will not eliminate stunting, it does have the potential to accelerate progress on eliminating stunting as a critical component of comprehensive strategies.”
89

“There was no benefit to the integration of water, sanitation, and handwashing with nutrition.
Adherence was high in all groups and diarrhoeaprevalence was reduced in all intervention groups except water treatment.
Combined water, sanitation, and handwashing interventions provided no additive benefit over single interventions.”
90

What have we learned? (iii)
8. To better understand programming requires much more attention to drivers of community participation, compliance, substitution, links among programming components, etc.
9. Broader range of outcomes need to be considered in assessing ‘growth’: cognitive function, lean mass, inflammation markets?
10. CSB+ has no dairy ingredient; the other foods studied do. We’re not able to conclude anything about the role of dairy per se in this study, but the option of continued programming of food aid (in blanket supplementation) without dairy should be discussed.
11. The role of such foods in targeted (recuperative) programming needs to be determined separately. But, the interacting etiology of stunting with wasting needs to be better understood.
91
92
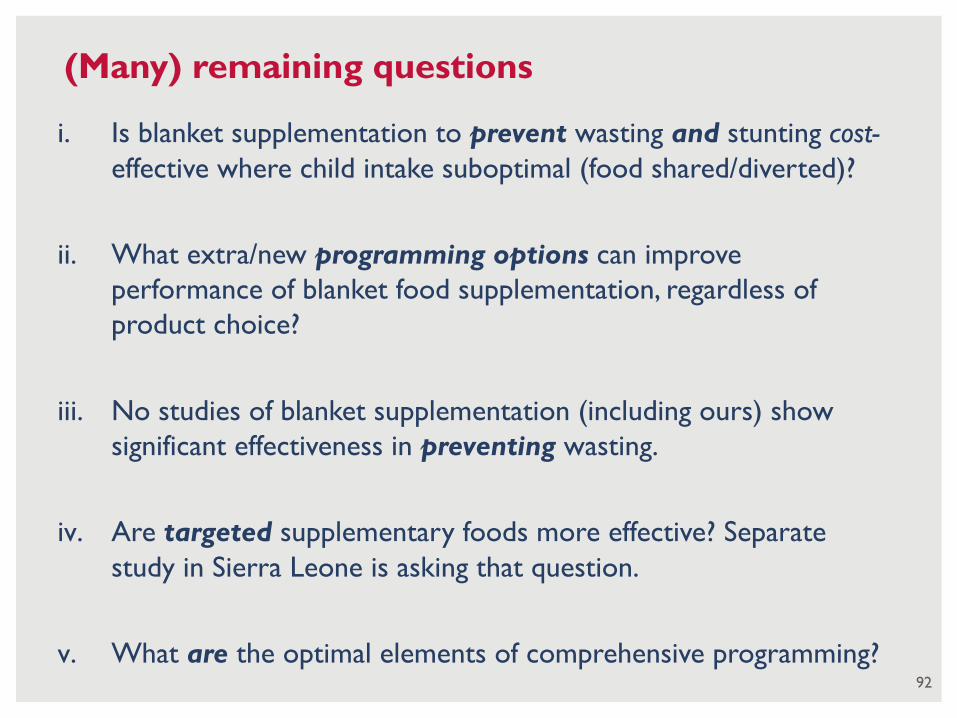
(Many) remaining questions
i. Is blanket supplementation to prevent wasting and stunting cost-effective where child intake suboptimal (food shared/diverted)?
ii. What extra/new programming options can improve performance of blanket food supplementation, regardless of product choice?
iii. No studies of blanket supplementation (including ours) show significant effectiveness in preventing wasting.
iv. Are targeted supplementary foods more effective? Separate study in Sierra Leone is asking that question.
v. What are the optimal elements of comprehensive programming?

• Huge $$$ invested in food assistance; ensuring more cost-effective programming is essential going forward.
• Investment in such research is critical to offering value-for-money to US taxpayers, and to intended beneficiaries.
• Greater impact of food aid interventions demands quality programming (design, implementation fidelity, coverage, duration, compliance), not just choice of food product.
• USG support for operations-relevant studies is key to making all-of-government actions on nutrition effective and sustained.
93
Important implications

• Cost per healthy child (i.e. never stunted nor wasted)
• Cost per incremental 1cm growth/length (% point improvements)
• Multiple interactions between wasting and stunting
• Analysis of detailed 24hr food/calorie/nutrient intake of child
• Analysis of post-intervention follow-up period (outcomes)
• Analysis of in-home observations and self-reported behaviors.
94
Upcoming Analytical Steps …
So please join Evidence Summit June 2018 for more…

95
This work was made possible through support provided by the Office of Food For Peace, Bureau for Democracy, Conflict, and Humanitarian Assistance, U.S. Agency for International Development, under the terms of Contract No. AID-OAA-C-16-00020. The opinions expressed herein are those of the author(s) and do not necessarily reflect the views of the U.S. Agency for International Development.

Thank you for the collaboration!
§ USAID: Funder
§ Tufts University: Beneficiary of Food For Peace/USAID grant for food aid research
§ Institut de Recherche en Sciences de la Santé (IRSS): Research implementation partner
§ ACDI/VOCA: Prime awardee implementing Title II program, Victoire sur la Malnutrition (ViM).
§ Save the Children: Sub-prime in consortium implementing the ViM program
§ Study participants from Sanmatenga Province, Burkina Faso
§ Industry partners who produce the foods. 96