food and beverage sector: working conditions and...
TRANSCRIPT
Food and beverage sector: Working conditions and job quality
‘Work plays a significant role in people’s lives, in the functioning of companies and in society atlarge. But what is work? How can we describe it? Is it changing, and if so, is it for better or forworse? Is it fulfilling the numerous and at times conflicting expectations we have of it? How canwe take steps to improve work for the well-being of all?’
Eurofound, Fifth European Working Conditions Survey: Overview report, 2012
This report gives an overview of working conditions,job quality, workers’ health and job sustainability in thefood and beverage service activities sector(NACE 56).1 It is based mostly on the fifth EuropeanWorking Conditions Survey (EWCS), which gathersdata on working conditions and the quality of workacross 34 European countries. Additional informationon the structural characteristics of the sector isderived from Eurostat data. The fifth EWCS containsresponses from 1,349 workers in the food andbeverage sector. The report compares aspects ofwork in the sector with the EU28 as a whole.
Structural characteristics
In 2010, 7,275,400 European workers worked in thefood and beverage sector, comprising 3.3% of theEU28 workforce (Eurostat, 2013). Employment in thesector slightly increased (2.7 percentage points)between 2008 and 2010, and increased slightly again(1.4 percentage points) between 2010 and 2012(Eurostat, 2013) .
Countries where the food and beverage sector is arelatively large employer are Spain (5.7%), Greece(5.5%), Portugal (4.7%) and Cyprus (4.5%). Thesector has relatively little prominence in Romania(1.5%), Poland (1.6%), Luxembourg (1.8%) andEstonia (2.2%).
A large proportion of workers in the food andbeverage sector (61%) work in micro-workplaces(1–9 employees), compared to 42% of workers in theEU28. Consequently, the percentage of workers in thefood and beverage sector in small and medium-sized(SMEs, 10–249 employees, 38%) and large(250+ employees, 0.6%) workplaces is smaller thanin the EU28 (46% and 12% respectively).2 The sectoremploys slightly more women (53%) than men (47%),and it employs a relatively large proportion of youngpeople: 22% of workers in the sector are under 25years of age, compared to 9% in the EU28. Relativelymany workers in the sector are self-employed withemployees (10%) compared to the EU28 as a whole(4%). However, relatively few workers in the sectorare self-employed without employees (6%) comparedto the EU28 as a whole (11%). Fixed-term contractsand workers without a formal contract are much moreprevalent in the food and beverage sector than in theEU28 as a whole (Figure 1).
1
European Foundation for theImprovement of Living and
Working Conditions
Food and beverage sector in a nutshell
l Many workers express a preference for working more
hours than currently
l Fixed-term workers and workers without a formal
contract are very prevalent
l Working atypical hours is very common
l Employer-paid training is much less common than in
the EU28 as a whole
l The sector scores very low on indicators measuring
quality of working time and job prospects
1Nomenclature statistique des activités économiques dans laCommunauté européenne (statistical classification of economicactivities in the European Community).
2When a breakdown category contains less than 30 cases, noreliable estimates can be calculated. As a consequence, somegraphs will have bars missing.
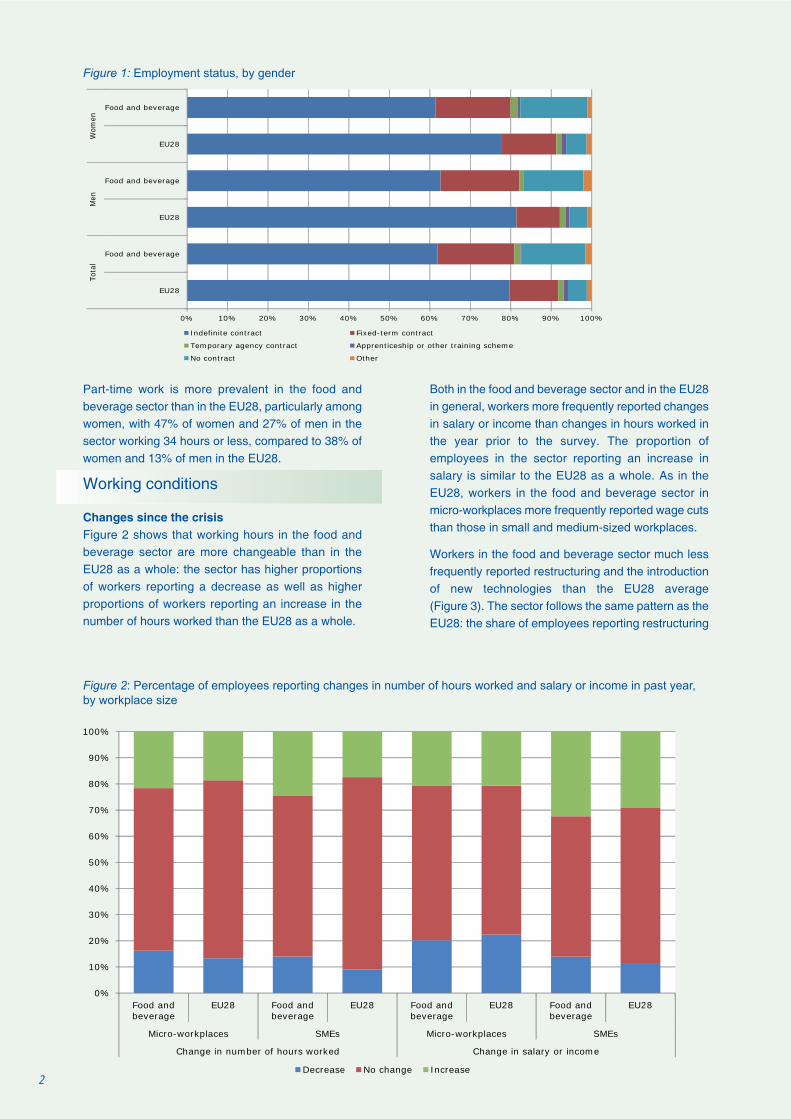
Part-time work is more prevalent in the food andbeverage sector than in the EU28, particularly amongwomen, with 47% of women and 27% of men in thesector working 34 hours or less, compared to 38% ofwomen and 13% of men in the EU28.
Working conditions
Changes since the crisisFigure 2 shows that working hours in the food andbeverage sector are more changeable than in theEU28 as a whole: the sector has higher proportionsof workers reporting a decrease as well as higherproportions of workers reporting an increase in thenumber of hours worked than the EU28 as a whole.
Both in the food and beverage sector and in the EU28in general, workers more frequently reported changesin salary or income than changes in hours worked inthe year prior to the survey. The proportion ofemployees in the sector reporting an increase insalary is similar to the EU28 as a whole. As in theEU28, workers in the food and beverage sector inmicro-workplaces more frequently reported wage cutsthan those in small and medium-sized workplaces.
Workers in the food and beverage sector much lessfrequently reported restructuring and the introductionof new technologies than the EU28 average(Figure 3). The sector follows the same pattern as theEU28: the share of employees reporting restructuring
2
Figure 1: Employment status, by gender
0% 10% 20% 30% 40% 50% 60% 70% 80% 90% 100%
Food and beverage
EU28
Food and beverage
EU28
Food and beverage
EU28
Wom
enM
enTo
tal
Indefinite contract Fixed-term contract
Temporary agency contract Apprenticeship or other training scheme
No contract Other
Figure 2: Percentage of employees reporting changes in number of hours worked and salary or income in past year,
by workplace size
0%
10%
20%
30%
40%
50%
60%
70%
80%
90%
100%
Food andbeverage
EU28 Food andbeverage
EU28 Food andbeverage
EU28 Food andbeverage
EU28
Micro-workplaces SMEs Micro-workplaces SMEs
Change in number of hours worked Change in salary or income
Decrease No change Increase
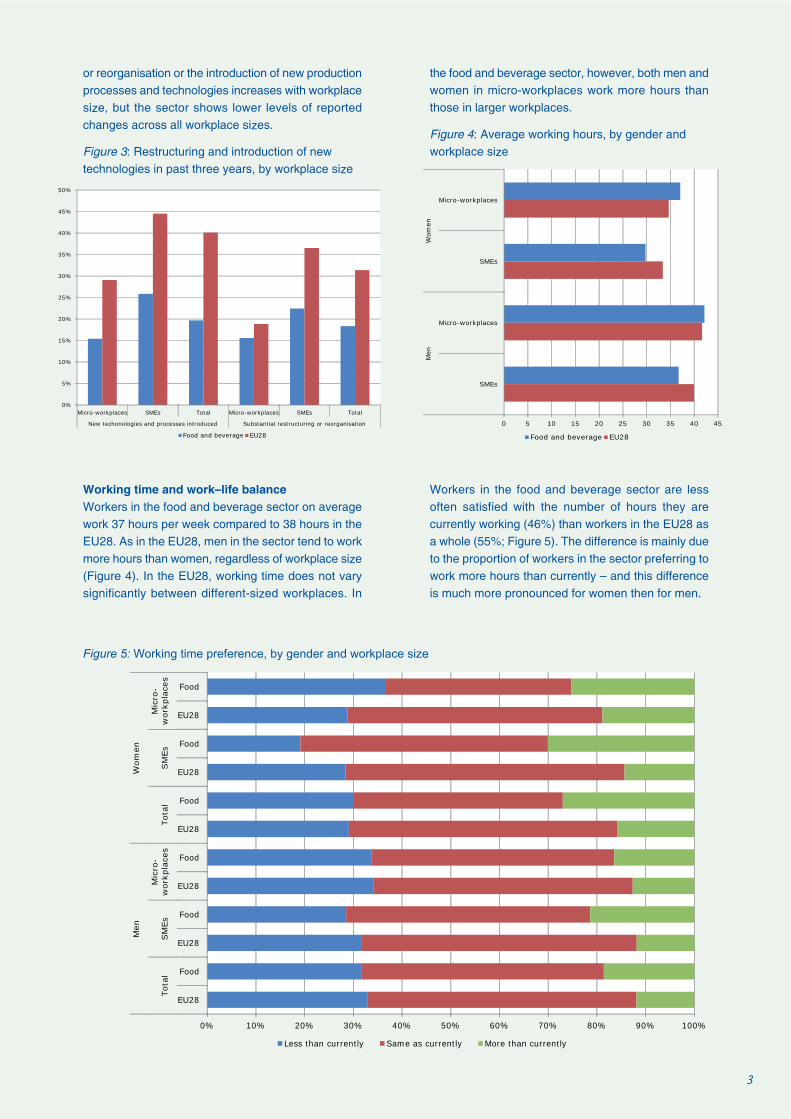
or reorganisation or the introduction of new productionprocesses and technologies increases with workplacesize, but the sector shows lower levels of reportedchanges across all workplace sizes.
Figure 3: Restructuring and introduction of newtechnologies in past three years, by workplace size
Working time and work–life balanceWorkers in the food and beverage sector on averagework 37 hours per week compared to 38 hours in theEU28. As in the EU28, men in the sector tend to workmore hours than women, regardless of workplace size(Figure 4). In the EU28, working time does not varysignificantly between different-sized workplaces. In
the food and beverage sector, however, both men andwomen in micro-workplaces work more hours thanthose in larger workplaces.
Figure 4: Average working hours, by gender andworkplace size
Workers in the food and beverage sector are lessoften satisfied with the number of hours they arecurrently working (46%) than workers in the EU28 asa whole (55%; Figure 5). The difference is mainly dueto the proportion of workers in the sector preferring towork more hours than currently – and this differenceis much more pronounced for women then for men.
3
Figure 5: Working time preference, by gender and workplace size
0%
5%
10%
15%
20%
25%
30%
35%
40%
45%
50%
Micro-workplaces SMEs Total Micro-workplaces SMEs Total
New techonologies and processes introduced Substantial restructuring or reorganisation
Food and beverage EU28
0 5 10 15 20 25 30 35 40 45
Micro-workplaces
SMEs
Micro-workplaces
SMEs
Wom
enM
enFood and beverage EU28
0% 10% 20% 30% 40% 50% 60% 70% 80% 90% 100%
Food
EU28
Food
EU28
Food
EU28
Food
EU28
Food
EU28
Food
EU28
Mic
ro-
wor
kpla
ces
SM
EsTo
tal
Mic
ro-
wor
kpla
ces
SM
EsTo
tal
Wom
enM
en
Less than currently Same as currently More than currently
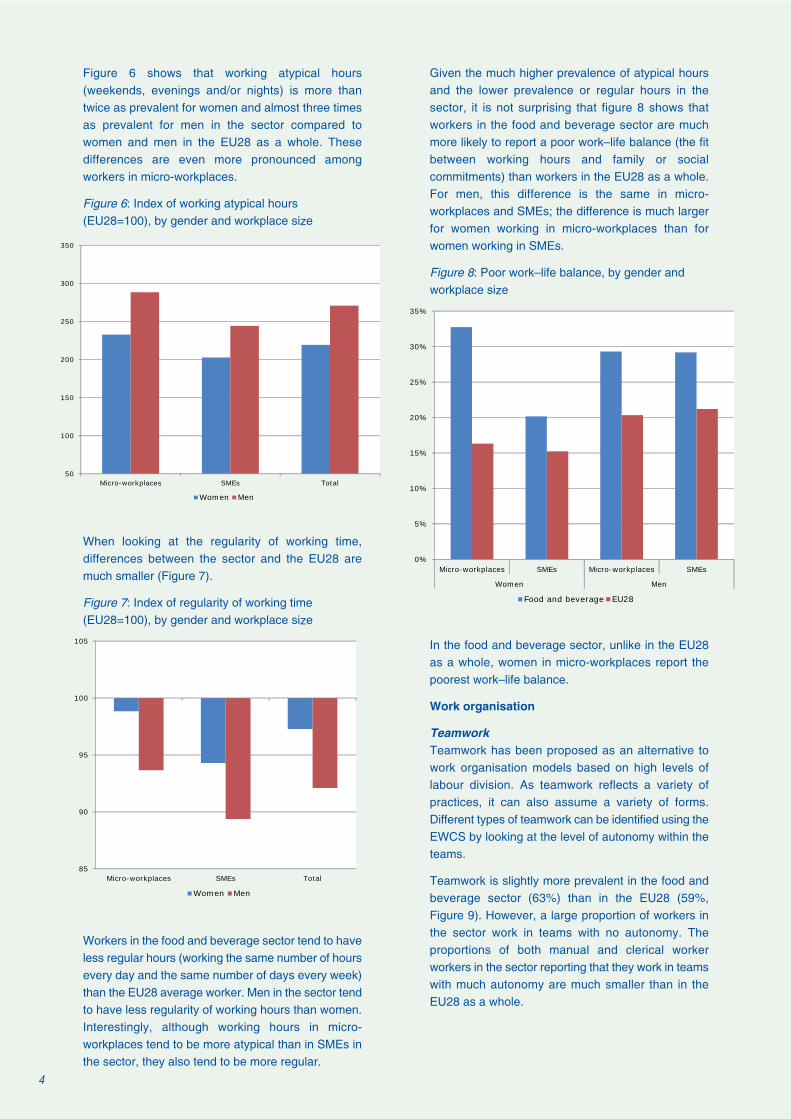
Figure 6 shows that working atypical hours(weekends, evenings and/or nights) is more thantwice as prevalent for women and almost three timesas prevalent for men in the sector compared towomen and men in the EU28 as a whole. Thesedifferences are even more pronounced amongworkers in micro-workplaces.
Figure 6: Index of working atypical hours(EU28=100), by gender and workplace size
When looking at the regularity of working time,differences between the sector and the EU28 aremuch smaller (Figure 7).
Figure 7: Index of regularity of working time(EU28=100), by gender and workplace size
Workers in the food and beverage sector tend to haveless regular hours (working the same number of hoursevery day and the same number of days every week)than the EU28 average worker. Men in the sector tendto have less regularity of working hours than women.Interestingly, although working hours in micro-workplaces tend to be more atypical than in SMEs inthe sector, they also tend to be more regular.
Given the much higher prevalence of atypical hoursand the lower prevalence or regular hours in thesector, it is not surprising that figure 8 shows thatworkers in the food and beverage sector are muchmore likely to report a poor work–life balance (the fitbetween working hours and family or socialcommitments) than workers in the EU28 as a whole.For men, this difference is the same in micro-workplaces and SMEs; the difference is much largerfor women working in micro-workplaces than forwomen working in SMEs.
Figure 8: Poor work–life balance, by gender andworkplace size
In the food and beverage sector, unlike in the EU28as a whole, women in micro-workplaces report thepoorest work–life balance.
Work organisation
TeamworkTeamwork has been proposed as an alternative towork organisation models based on high levels oflabour division. As teamwork reflects a variety ofpractices, it can also assume a variety of forms.Different types of teamwork can be identified using theEWCS by looking at the level of autonomy within theteams.
Teamwork is slightly more prevalent in the food andbeverage sector (63%) than in the EU28 (59%,Figure 9). However, a large proportion of workers inthe sector work in teams with no autonomy. Theproportions of both manual and clerical workerworkers in the sector reporting that they work in teamswith much autonomy are much smaller than in theEU28 as a whole.
4
50
100
150
200
250
300
350
Micro-workplaces SMEs Total
Women Men
85
90
95
100
105
Micro-workplaces SMEs Total
Women Men
0%
5%
10%
15%
20%
25%
30%
35%
Micro-workplaces SMEs Micro-workplaces SMEs
Women Men
Food and beverage EU28

Figure 9: Teamwork and team autonomy, byoccupational category
Task rotation
Task rotation is also an important feature of work
organisation. Depending on how it is implemented,
task rotation may require different skills from the
worker (‘multiskilling’) or may not (‘fixed task rotation’)
and is either controlled by management or by the
workers themselves (‘autonomous’). Task rotation has
been shown to be beneficial for workers’ well-being,
and autonomous multiskilling systems in particular are
associated with higher worker motivation as well as
better company performance.
The percentage of workers in the sector working in a
task rotation system is higher than in the EU28 (Figure
10). This difference is found in micro-workplaces and
SMEs for all types of task rotation, except for
autonomous multiskilling, which is slightly more
prevalent in micro-workplaces in the food and
beverage sector than in micro-workplaces in the EU28
as a whole and slightly less prevalent in SMEs in the
sector than in SMEs in the EU28 as a whole.
Female bosses
The proportion of workers in the food and beverage
sector reporting they have a female boss (25%) falls
well short of the proportion of female workers in the
sector (53%). Interestingly, although women in the
sector much less often report having a female boss
(30%) than women in the EU28 as a whole (47%),
men in the sector (18%) are more likely to have a
female boss than their EU28 counterparts (12%).
Skills and training
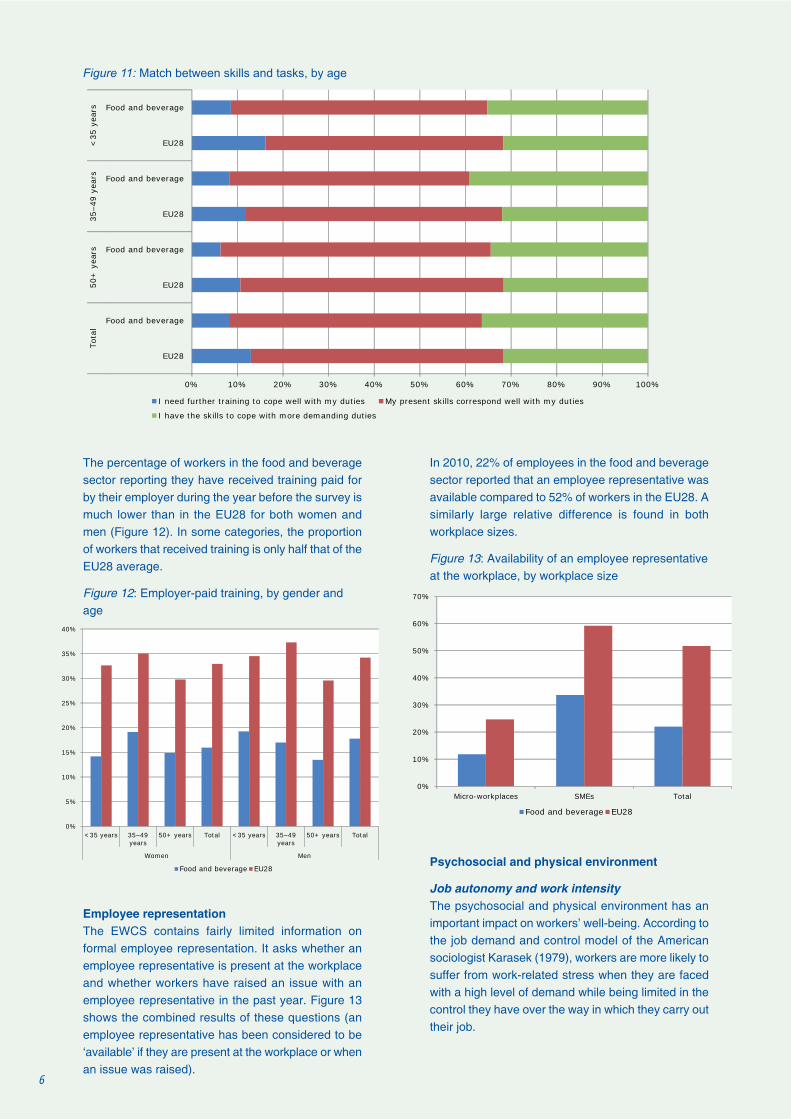
Overall, the majority of workers in the sector say that
their present skills correspond well with their duties
(Figure 11). In food and beverages, workers are
slightly more likely to report being ‘over-skilled’ than
in the EU28, and less likely to report being ‘under-
skilled’. The pattern is more or less the same across
the different age groups.
5
Figure 10: Prevalence of task rotation, by workplace size
0%
10%
20%
30%
40%
50%
60%
70%
80%
90%
100%
Food and beverage EU28 Food and beverage EU28
Micro-workplaces SMEs
No task rotation Management-controlled fixed task rotation
Autonomous fixed task rotation Management-controlled multiskilling
Autonomous multiskilling
0% 5% 10% 15% 20% 25% 30% 35% 40% 45%
No teamwork
Team with no autonomy
Team with some autonomy
Team with much autonomy
No teamwork
Team with no autonomy
Team with some autonomy
Team with much autonomy
Man
ual
Cle
rica
l
Food and beverage EU28
The percentage of workers in the food and beveragesector reporting they have received training paid forby their employer during the year before the survey ismuch lower than in the EU28 for both women andmen (Figure 12). In some categories, the proportionof workers that received training is only half that of theEU28 average.
Figure 12: Employer-paid training, by gender andage
Employee representationThe EWCS contains fairly limited information onformal employee representation. It asks whether anemployee representative is present at the workplaceand whether workers have raised an issue with anemployee representative in the past year. Figure 13shows the combined results of these questions (anemployee representative has been considered to be‘available’ if they are present at the workplace or whenan issue was raised).
In 2010, 22% of employees in the food and beveragesector reported that an employee representative wasavailable compared to 52% of workers in the EU28. Asimilarly large relative difference is found in bothworkplace sizes.
Figure 13: Availability of an employee representativeat the workplace, by workplace size
Psychosocial and physical environment
Job autonomy and work intensityThe psychosocial and physical environment has animportant impact on workers’ well-being. According tothe job demand and control model of the Americansociologist Karasek (1979), workers are more likely tosuffer from work-related stress when they are facedwith a high level of demand while being limited in thecontrol they have over the way in which they carry outtheir job.
6
0%
5%
10%
15%
20%
25%
30%
35%
40%
<35 years 35–49 years
50+ years Total <35 years 35–49 years
50+ years Total
Women Men
Food and beverage EU28
0%
10%
20%
30%
40%
50%
60%
70%
Micro-workplaces SMEs Total
Food and beverage EU28
Figure 11: Match between skills and tasks, by age
0% 10% 20% 30% 40% 50% 60% 70% 80% 90% 100%
Food and beverage
EU28
Food and beverage
EU28
Food and beverage
EU28
Food and beverage
EU28
<35
yea
rs35
–49
year
s50
+ y
ears
Tota
l
I need further training to cope well with my duties My present skills correspond well with my duties
I have the skills to cope with more demanding duties
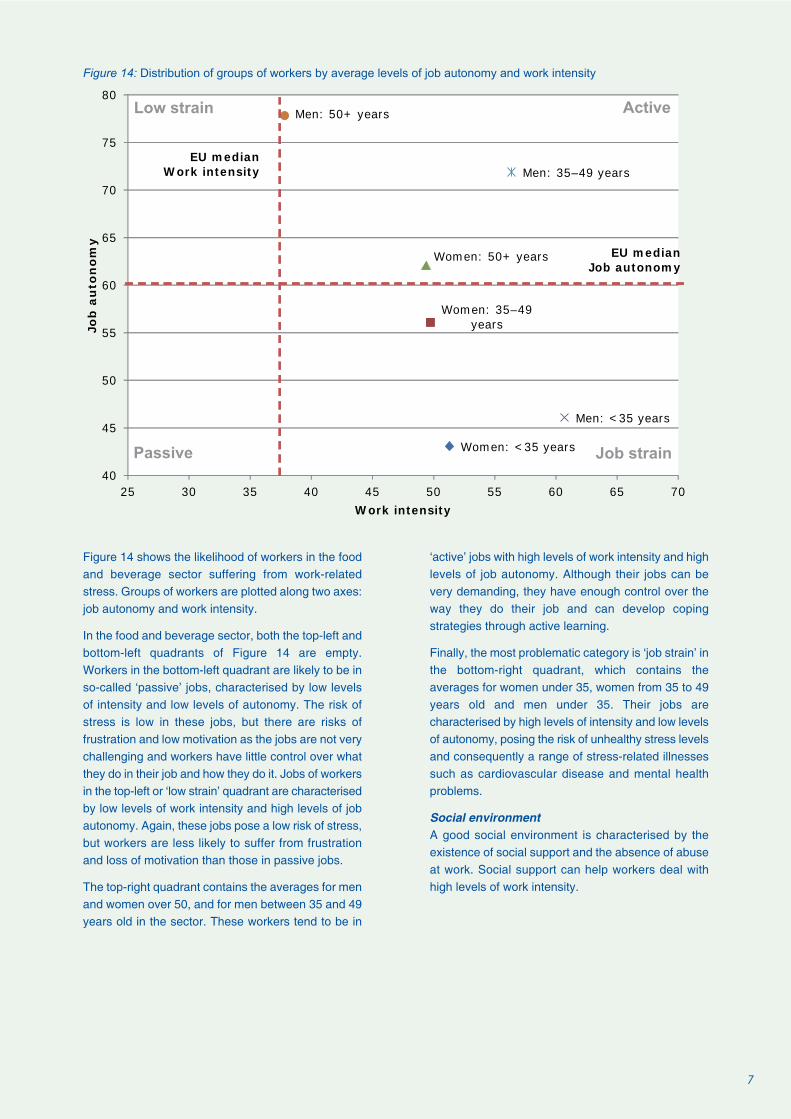
Figure 14 shows the likelihood of workers in the foodand beverage sector suffering from work-relatedstress. Groups of workers are plotted along two axes:job autonomy and work intensity.
In the food and beverage sector, both the top-left andbottom-left quadrants of Figure 14 are empty.Workers in the bottom-left quadrant are likely to be inso-called ‘passive’ jobs, characterised by low levelsof intensity and low levels of autonomy. The risk ofstress is low in these jobs, but there are risks offrustration and low motivation as the jobs are not verychallenging and workers have little control over whatthey do in their job and how they do it. Jobs of workersin the top-left or ‘low strain’ quadrant are characterisedby low levels of work intensity and high levels of jobautonomy. Again, these jobs pose a low risk of stress,but workers are less likely to suffer from frustrationand loss of motivation than those in passive jobs.
The top-right quadrant contains the averages for menand women over 50, and for men between 35 and 49years old in the sector. These workers tend to be in
‘active’ jobs with high levels of work intensity and highlevels of job autonomy. Although their jobs can bevery demanding, they have enough control over theway they do their job and can develop copingstrategies through active learning.
Finally, the most problematic category is ‘job strain’ inthe bottom-right quadrant, which contains theaverages for women under 35, women from 35 to 49years old and men under 35. Their jobs arecharacterised by high levels of intensity and low levelsof autonomy, posing the risk of unhealthy stress levelsand consequently a range of stress-related illnessessuch as cardiovascular disease and mental healthproblems.
Social environmentA good social environment is characterised by theexistence of social support and the absence of abuseat work. Social support can help workers deal withhigh levels of work intensity.
7
Figure 14: Distribution of groups of workers by average levels of job autonomy and work intensity
Women: <35 years
Women: 35–49 years
Women: 50+ years
Men: <35 years
Men: 35–49 years
Men: 50+ years
40
45
50
55
60
65
70
75
80
25 30 35 40 45 50 55 60 65 70
Job
au
ton
om
y
Work intensity
EU medianJob autonomy
EU medianWork intensity
Low strain Active
Job strainPassive

Figure 15: Index of good social environment(EU28 = 100), by gender and workplace size
The differences between the food and beveragesector and the EU28 average are relatively small(Figure 15). Women in the sector tend to have slightlylower social environment scores than men in bothworkplace size categories, with women working inSMEs scoring considerably below the EU28 average.
Physical risksExposure to posture- and movement-related risks ismost prevalent in the food and beverage sector,followed by ambient risks. Reported levels ofexposure to biological and chemical risks in the sectorare well below the EU28 average (Figure 16).
Women in both manual and clerical occupationsreport above-average levels of exposure to posture-and movement-related risks, while only men in clericaljobs also report above-average levels of exposure tothese risks. On the other hand, men in manual jobsreport higher level of exposure to ambient risks.
Figure 17: Not very well or not at all well informedabout health and safety risks at work, by workplacesize
12% workers in the food and beverage sector reportthey were not very well or not at all well informedabout workplace risks, which is a little bit above theEU28 average (10%; Figure 17). Micro-workplaces donot differ from SMEs in this regard.
Job quality
In the report Trends in job quality in Europe, theauthors constructed four indices of job quality:earnings, prospects, intrinsic job quality and workingtime quality. The indices are built using jobcharacteristics that are unambiguously associatedwith workers’ well-being.
Figure 18 summarises job quality in the food andbeverage sector. It shows the average score for thesector on each of the indicators, with and without
8
80 90 100 110 120
Manual
Clerical
Manual
Clerical
Wom
enM
enAl
l
Posture- and movement-related risks Biological and chemical risks Ambient risks
Figure 16: Indices of exposure to physical risks (EU28 = 100), by gender and occupation
0%
2%
4%
6%
8%
10%
12%
14%
Micro-workplaces SMEs Total
Food and beverage EU28
92
94
96
98
100
102
Micro-workplaces SMEs Total
Women Men
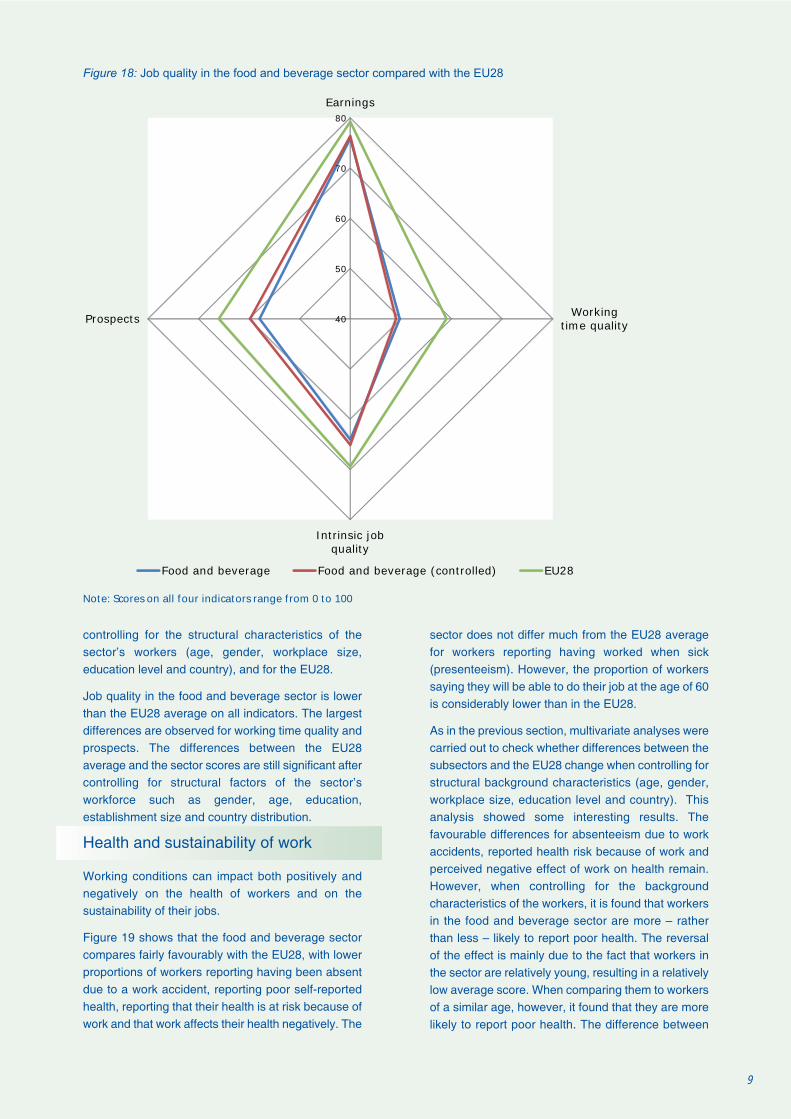
controlling for the structural characteristics of thesector’s workers (age, gender, workplace size,education level and country), and for the EU28.
Job quality in the food and beverage sector is lowerthan the EU28 average on all indicators. The largestdifferences are observed for working time quality andprospects. The differences between the EU28average and the sector scores are still significant aftercontrolling for structural factors of the sector’sworkforce such as gender, age, education,establishment size and country distribution.
Health and sustainability of work
Working conditions can impact both positively andnegatively on the health of workers and on thesustainability of their jobs.
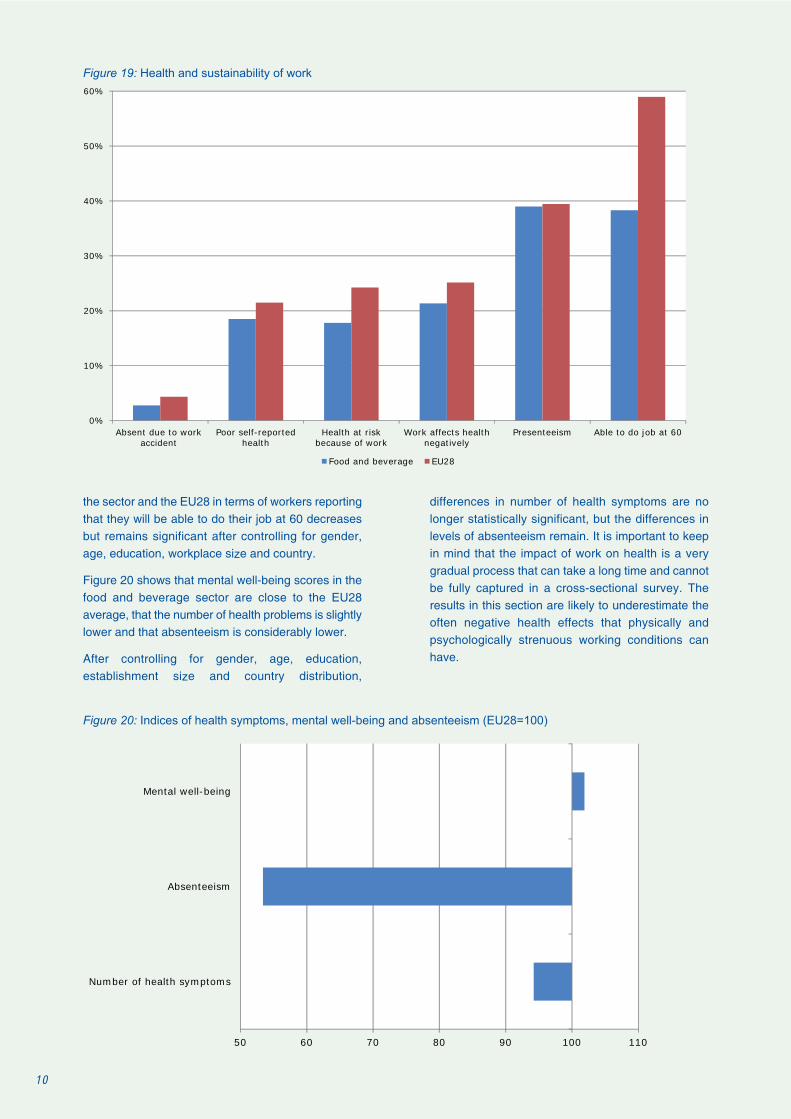
Figure 19 shows that the food and beverage sectorcompares fairly favourably with the EU28, with lowerproportions of workers reporting having been absentdue to a work accident, reporting poor self-reportedhealth, reporting that their health is at risk because ofwork and that work affects their health negatively. The
sector does not differ much from the EU28 averagefor workers reporting having worked when sick(presenteeism). However, the proportion of workerssaying they will be able to do their job at the age of 60is considerably lower than in the EU28.
As in the previous section, multivariate analyses werecarried out to check whether differences between thesubsectors and the EU28 change when controlling forstructural background characteristics (age, gender,workplace size, education level and country). Thisanalysis showed some interesting results. Thefavourable differences for absenteeism due to workaccidents, reported health risk because of work andperceived negative effect of work on health remain.However, when controlling for the backgroundcharacteristics of the workers, it is found that workersin the food and beverage sector are more – ratherthan less – likely to report poor health. The reversalof the effect is mainly due to the fact that workers inthe sector are relatively young, resulting in a relativelylow average score. When comparing them to workersof a similar age, however, it found that they are morelikely to report poor health. The difference between
9
Figure 18: Job quality in the food and beverage sector compared with the EU28
40
50
60
70
80Earnings
Workingtime quality
Intrinsic jobquality
Prospects
Food and beverage Food and beverage (controlled) EU28
Note: Scores on all four indicators range from 0 to 100
the sector and the EU28 in terms of workers reportingthat they will be able to do their job at 60 decreasesbut remains significant after controlling for gender,age, education, workplace size and country.
Figure 20 shows that mental well-being scores in thefood and beverage sector are close to the EU28average, that the number of health problems is slightlylower and that absenteeism is considerably lower.
After controlling for gender, age, education,establishment size and country distribution,
differences in number of health symptoms are nolonger statistically significant, but the differences inlevels of absenteeism remain. It is important to keepin mind that the impact of work on health is a verygradual process that can take a long time and cannotbe fully captured in a cross-sectional survey. Theresults in this section are likely to underestimate theoften negative health effects that physically andpsychologically strenuous working conditions canhave.
10
Figure 19: Health and sustainability of work
0%
10%
20%
30%
40%
50%
60%
Absent due to workaccident
Poor self-reportedhealth
Health at riskbecause of work
Work affects healthnegatively
Presenteeism Able to do job at 60
Food and beverage EU28
Figure 20: Indices of health symptoms, mental well-being and absenteeism (EU28=100)
50 60 70 80 90 100 110
Number of health symptoms
Absenteeism
Mental well-being

References
Eurofound (2012), Trends in job quality in Europe,Publications Office of the European Union,Luxembourg.
Eurostat (2013), EU Labour Force survey database,available athttp://epp.eurostat.ec.europa.eu/portal/page/portal/statistics/search_database
Karasek, R. A. Jr (1979), ‘Job demands, jobdecision latitude, and mental strain: Implications forjob redesign’, Administrative Science Quarterly,Vol. 24, pp. 285–308.
11
Further information
Gijs van Houten, Research [email protected]
European Foundation for the Improvement of Living andWorking ConditionsWyattville Road, Loughlinstown, Dublin 18, IrelandTelephone: (+35 1) 204 32 00Email: [email protected]: http://www.eurofound.europa.eu/
EF/13/84/EN 21
European Working Conditions Survey
Eurofound developed its European Working Conditions Survey (EWCS) in 1990 in order to provide high-quality information on living
and working conditions in Europe. Five waves of the survey have been carried out to date, enabling long-term trends to be observed
and analysed.
The EWCS interviews both employees and self-employed people on key issues related to their work and employment. Fieldwork for
the fifth EWCS took place from January to June 2010, with almost 44,000 workers interviewed in their homes in 34 countries – EU28,
Norway, the former Yugoslav Republic of Macedonia, Turkey, Albania, Montenegro and Kosovo. The 5th EWCS was implemented
by Gallup Europe, who worked within a strong quality assurance framework to ensure the highest possible standards in all data
collection and editing processes.
The questionnaire covered issues such as precarious employment, leadership styles and worker participation as well as the general
job context, working time, work organisation, pay, work-related health risks, cognitive and psychosocial factors, work-life balance and
access to training. A number of questions were included to capture the impact of the economic downturn on working conditions.
For more information on the EWCS, see http://www.eurofound.europa.eu/surveys/ewcs/index.htm
Sectoral analysis
The report Working conditions and job quality: Comparing sectors in Europe and the series of 33 sectoral information sheets aim to
capture the diversity prevalent across sectors in Europe in terms of working conditions and job quality. The report pinpoints trends
across sectors in areas such as working time and work–life balance, work organisation, skills and training, employee representation
and the psychosocial and physical environment. It identifies sectors that score particularly well or particularly poorly in terms of job
quality and sheds light on differences between sectors in terms of health and well-being.
For more information, see http://www.eurofound.europa.eu/surveys/ewcs/2010/sectorprofiles.htm