food and nutrition bulletin - united nations universityarchive.unu.edu/unupress/food/fnb25-3.pdf ·...
TRANSCRIPT

Volume 25, Number 3, September 2004
Changes in nutritional status after 30 years of economic growth in India
Complementary feeding practices and micronutrient intake in Bangladesh
Ecuadorian Andean women’s nutrition, age, and economic status
Vitamin A supplementation and dietary intake of children in Nepal
Vitamin A consumption of breastfeeding children in Kenya
Stability of double-fortified salt
Rethinking food aid to fight AIDS
HIV/AIDS and humanitarian action
Overweight and obesity in Iranian girls
WHO GLOBAL STRATEGY ON DIET, PHYSICAL ACTIVITY AND HEALTH
FOO
D A
ND
NU
TRITIO
N B
ULLETIN
Vol. 25, no. 3, Septem
ber 200
4Pp. 219
–316
Food and Nutrition BulletinISSN 0379-5721
FOOD ANDNUTRITIONBULLETIN
International Nutrition Foundation for
United NationsUniversity Press

FOOD AND NUTRITION BULLETINPublished by the International Nutrition Foundation for the United Nations UniversityEditorial address: Food and Nutrition Bulletin Susan Karcz, Managing Editor 150 Harrison Ave. Boston, MA 02111 USA Tel: (617) 636-3778 Fax: (617) 636-3781 E-mail: [email protected] address: International Nutrition Foundation 150 Harrison Ave. Boston, MA 02111 USA Tel: (617) 636-3778 Fax: (617) 636-3781 E-mail: [email protected]
The Food and Nutrition Bulletin incorporates and continues the PAG Bulletin of the former Protein-Calorie Advisory Group of the United Nations system and is published quarterly by the International Nutrition Foundation for the United Nations University (www.unu.edu) in collaboration with the United Nations System Standing Committee on Nutrition (SCN) (www.unsystem.org/scn). All correspondence concerning the content of the Bulletin, comments, news, and notices should be sent to the Managing Editor at the editorial office address given above. All material in the Bulletin may be reproduced freely provided acknowledgement is given and a copy of the publication containing the reproduction is sent to the editorial office. For advertising orders and inquiries, please contact our editorial office.
Editorial policy
The Food and Nutrition Bulletin is intended to make available policy analyses, state-of-the-art summaries, and original scientific articles relating to multidisciplinary efforts to alleviate the problems of hunger and malnutrition in the developing world. It is not intended for the publication of scientific articles of principal interest only to individuals in a single discipline or within a single country or region. Reviews or notices of relevant books and other publications will be published if they are received for review. The Bulletin is also a vehicle for notices of forthcoming international meetings that satisfy the above criteria and for summaries of such meetings. The Food and Nutrition Bulletin also serves as the principal outlet for the publication of reports of working groups and other activities of the SCN and its Advisory Group on Nutrition. The SCN itself is a focal point for coordinating activities of the Food and Agriculture Organization of the United Nations (FAO) (www.fao.org), the World Health Organization (WHO) (www.who.int/en), the International
Atomic Energy Agency (IAEA) (www.iaea.org), the United Nations Children’s Fund (UNICEF) (www.unicef.org), the United Nations University (UNU) (www.unu.edu), the World Bank (www.worldbank.org), the World Food Programme (WFP) (www.wfp.org/index2.html), and other bodies of the United Nations (www.un.org) system that have an interest in food and nutrition. Submissions. Unsolicited manuscripts of articles of the type published in this and previous issues may be sent to the Managing Editor at the address given above electronically or by mail. For mail submissions, manuscripts must be typed, double-spaced, with complete references, original copy for any figures used, and should include the file on a floppy disk. We strongly encourage electronic submissions. Figures and tables may also be submitted electronically. (Please refer to the Note for Contributors in the back of this issue.) Any disciplinary or conceptual approach relevant to problems of world hunger and malnutrition is welcome, and controversy over some of the articles is anticipated. Letters to the editor are encouraged and will be printed if judged to have an adequate basis and to be of sufficient general interest. Also of interest are “Short Communications,” defined as papers that explore a topic with the customary scientific rigor but that do not need extensive analysis and discussion of the data or that have useful information that is not sufficient for a full article. These would be identified as such at the beginning of each article. Peer review. The Bulletin is a peer-reviewed journal. Every article is submitted first to editorial review. If it is consistent with the editorial policy and is not obviously deficient in some way, it is sent to two or sometimes three experienced and knowledgeable reviewers. Occasionally a paper may be returned to the authors by the editor with suggestions for improvement before it is submitted to the reviewers. If two reviewers agree that the paper should be published in the Bulletin, it is accepted and either sent immediately for copy-editing or returned to the authors for consideration of suggestions from the reviewers and the editor. If both reviewers agree that the paper should not be accepted, the authors will receive a letter from the editor explaining the reason and enclosing the comments of the reviewers anonymously. If the reviewers do not agree with each other, either the paper is sent to a third reviewer or a decision is made by the editor. In these cases, the authors are usually given a chance to respond to the reviewers’ comments. Disclaimer. It is expressly understood that articles published in the Bulletin do not necessarily represent the views of the UNU, SCN, or any United Nations organization. The views expressed and the accuracy of the information on which they are based are the responsibility of the authors. Some articles in the Bulletin are reports of various international committees and working groups and do represent the consensus of the individuals involved; whether or not they also represent the opinions or policies of the sponsoring organizations is expressly stated.
The United Nations University (UNU) is an organ of the United Nations established by the General Assembly in 1972 to be an international community of scholars engaged in research, advanced training, and the dissemination of knowledge related to the pressing global problems of human survival, development, and welfare. Its activities focus mainly on peace and conflict resolution, development in a changing world, and science and technology in relation to human welfare. The University operates through a worldwide network of research and postgraduate training centres, with its planning and coordinating headquarters in Tokyo. The United Nations University Press, the publishing division of the UNU, publishes scholarly books and periodicals in the social sciences, humanities, and pure and applied natural sciences related to the University’s research.
Contents
Nutrition and economic growth
Morinda revisited: Changes in nutrional well-being and gender differences after 30 years of rapid economic growth in rural Punjab, India —F. J. Levinson, S. Mehra, D. Levinson, A. K. Chauhan, G. Koppe, B. Bence, and A. M. Almedom ......................................................................................................... 221
Complementary feeding
Behavior-change trials to assess the feasibility of improving complementary feeding practices and micronutrient intake of infants in rural Bangladesh —J. E. Kimmons, K. G. Dewey, E. Haque, J. Chakraborty, S. J. M. Osendarp, and K. H. Brown ........................................................................................ 228
Economic status and malnutrition
Ecuadorian Andean women’s nutrition varies with age and socioeconomic status —B. Macdonald, T. Johns, K. Gray-Donald, and O. Receveur......................................................................... 239
Vitamin A sources for children
Children aged 6 to 60 months in Nepal may require a vitamin A supplement regardless of dietary intake from plant and animal food sources —R. B. Grubesic ............................................................................. 248
Consumption of vitamin A by breastfeeding children in rural Kenya —G. Ettyang, A. Oloo, W. van Marken Lichtenbelt, and W. Saris ......................................................................................................... 256
Salt iodization
Stability of salt double-fortified with ferrous fumarate and potassium iodate or iodide under storage and distribution conditions in Kenya —T. Oshinowo, L. Diosady, R. Yusufali, and L. Laleye....................... 264
Policy discussion papers: HIV/AIDS
Rethinking food aid to fight AIDS —S. Kadiyala and S. Gillespie ............................................................... 271HIV/AIDS and humanitarian action —P. Harvey ........................................................................................ 283
Short communication
Prevalence of overweight and obesity among high-school girls in Tabriz, Iran, in 2001 —B. P. Gargari, M. H. Behzad, S. Ghassabpour, and A. Ayat ........................................................................... 288
Chronic disease prevention
WHO global strategy on diet, physical activity and health ................................................................................. 292
Letter to the Editor
In response to Piwoz et al., Promotion and advocacy for improved complementary feeding: Can we apply the lessons learned from breastfeeding? —M. F. McCann and D. E. Bender .......................................... 303
Authors’ response: B. Daelmans, E. Piwoz, and M. Ruel...................................................................................... 304
Book reviews .......................................................................................................................................................... 306
News and notes ..................................................................................................................................................... 310
In memoriam .......................................................................................................................................................... 313
The Food and Nutrition Bulletin encourages letters to the editor regarding issues dealt with in its contents.

Food and Nutrition Bulletin, vol. 25, no. 3© The United Nations University, 2004United Nations University PressPublished by the International Nutrition Foundation for The United Nations University53-70 Jingumae 5-chome, Shibuya-ku, Tokyo 150-8925, JapanTel.: (03) 3499-2811 Fax: (03) 3406-7345E-mail: [email protected] 0379-5721Design and production by Digital Design Group, Newton, MA USAPrinted on acid-free paper by Webcom Ltd., Toronto, ON Canada
Food and Nutrition Bulletin
Editor: Dr. Irwin H. Rosenberg, Friedman School of Nutrition Science and Policy, Tufts University, Boston, Mass., USA
Senior Associate Editor: Dr. Nevin S. ScrimshawAssociate Editor—Food Policy and Agriculture:
Dr. Suresh Babu, International Food Policy Research Institute (IFPRI),Washington, DC, USA
Associate Editor—Food Science and Technology: Dr. V. Prakash, Central Food Technological Research Institute (CFTRI), Mysore, India
Statistical Advisor—Dr. William M. Rand, Tufts University School of Medicine, Boston, Mass., USA
Managing Editor: Ms. Susan KarczManuscripts Editor: Mr. Jonathan HarringtonCopyeditor: Ms. Ellen DuffEditorial Assistants: Ms. Isabelita Mendoza, Ms. Shauna Sadowski
Editorial Board:Dr. Ricardo Bressani, Institute de Investigaciones, Universidad del Valle
de Guatemala, Guatemala City, GuatemalaDr. Hernán Delgado, Director, Institute of Nutrition of Central America
and Panama (INCAP), Guatemala City, GuatemalaDr. Cutberto Garza, Professor, Division of Nutritional Sciences, Cornell
University, Ithaca, N.Y., USADr. Joseph Hautvast, Secretary General, International Union of Nutritional
Sciences (IUNS), Department of Human Nutrition, Agricultural University, Wageningen, Netherlands
Dr. Peter Pellett, Professor, Department of Food Science and Nutrition, University of Massachusetts, Amherst, Mass., USA
Dr. Zewdie Wolde-Gabreil, Director, Ethiopian Nutrition Institute, Addis Ababa, Ethiopia
Dr. Aree Valyasevi, Professor and Institute Consultant, Mahidol University, Bangkok, Thailand

Food and Nutrition Bulletin, vol. 25, no. 3 © 2004, The United Nations University. 221
Abstract
A follow-up study of malnutrition and its determinants among children 6 to 24 months of age was carried out in rural areas of Punjab State in India 30 years after the original study, and following a period of rapid economic growth. The original 1971 study had found a high preva-lence of mortality and malnutrition and the worst gender difference in nutritional status ever recorded in an Indian study. The 2001 follow-up study found dramatic reduc-tions in child mortality, child malnutrition, gender-based imbalances in child well-being and care, and family size, the result of participatory economic growth coupled with broad-based educational, health, and family-planning services. Despite overall improvements in caloric intake, however, 40% of lower-class children in 2001 were still consuming less than 50% of their caloric allowance. With minimal gender-based abortion and significantly reduced neglect and mortality of female children, gender balance among children in this area of rural Punjab improved markedly over the 30-year period.
Key words: Childhood malnutrition, gender, India, Punjab
Introduction
In 1971, the first author, in collaboration with the Gov-ernment of India Food and Nutrition Board, carried out a study of the determinants of malnutrition among children aged 6 to 24 months in 18 villages surrounding the market town of Morinda in Rupnagar (formerly Ropar) District in Punjab State in India [1]. That study, which identified important behavioral and economic determinants, also found substantial malnutrition (47.8% moderate and severe malnutrition according to the Harvard standards and the Gomez classification utilized at that time) and the most extreme gender dis-parity in nutritional status ever recorded in an Indian study (87.5% of severely malnourished children, according to these same standards, were girls).
In the 1971 study, both nutritional intake and infec-tion proved to be highly important determinants of nutritional status. When food intake was used as the independent variable, the most important determi-nants, beyond gender and age, were economic status, particularly among the lower income, landless Ramda-sias, and caring practices relating to age of introduction of complementary food, particularly for the landed, higher income Jats. Diarrheal infection proved to be the most important component of infection.
Since 1971, the Punjab has experienced remarkable agricultural development (see table 1) plus major increases in rural electricity and road construction [2]. The magnitude of these changes is reflected dramati-
Morinda revisited: Changes in nutritional well-being and gender differences after 30 years of rapid economic growth in rural Punjab, India
F. James Levinson, Sucheta Mehra, Guy Koppe, and Brian Bence are affiliated with the Friedman School of Nutrition Science and Policy, Tufts University, Boston, Mass, USA; Dorothy Levinson is affiliated with Tufts University, Med-ford, Mass, USA; Anita Kumari Chauhan is affiliated with the Morinda Health Center, Punjab Department of Health, Morinda, Punjab, India; and Astier M. Almedom is Henry R. Luce Professor in Science and Humanitarianism, Tufts University, Medford, Mass, USA.
Please address queries to the corresponding author: F. James Levinson, Friedman School of Nutrition Science and Policy, Tufts University, 150 Harrison Ave., Boston MA 02111 USA; e-mail: [email protected].
Mention of the names of firms and commercial products does not imply endorsement by the United Nations University.
TABLE 1. Indicators of agricultural development in Punjab State in 1971 and 2000
Indicator 1971 2000
Wheat yield (kg/ha) 2,270 4,696Maize yield (kg/ha) 1,470 2,577Percentage of cultivated
land that is irrigated 74% 96%
ha, hectare.
F. James Levinson, Sucheta Mehra, Dorothy Levinson, Anita Kumari Chauhan, Guy Koppe, Brian Bence, and Astier M. Almedom

222 223
cally by the number of registered tractors in Rupnagar District: 164 in 1971 and 17,013 in 2000 [2]. Incomes in the study area relative to the cost of living more than doubled over this 30-year period, both among the traditionally landowning Jat caste (all Sikhs) and the traditionally landless Ramdasias (Sikhs and Hindus). (It should be noted that this period of rapid economic growth in the Punjab also included a period of political instability resulting from a Sikh separatist struggle.) Several of the tables presented in this article distinguish findings for the Jats and Ramdasias as well as a third heterogeneous caste group of “others.” During the same period, the Punjab State Government introduced an intensive immunization campaign, launched a mas-sive safe water and sanitation program in rural areas, intensified family-planning services, and introduced compulsory primary education while continuing its adult literacy campaigns.
The 2001 study, undertaken 30 years later, was designed to assess the changes in nutritional status, mortality, gender discrimination, and malnutrition causality that took place over this period of rapid economic growth. This paper presents findings on the first three of these sets of changes. Comparative analy-sis is somewhat limited, in that although tables from the 1971 study are available, the raw data are not. In a postscript, the paper examines the effect in this area of gender-based abortion, which has had a substantial effect on gender balance in Punjab State as a whole.
Methods
Sample
A cross-sectional household survey was conducted in December 2001 in the same 18 villages studied in 1971, plus 3 villages in the same area that had been bypassed in the earlier study. Unlike the initial study (sample size, 496), which sought to collect data on every 6- to 24-month-old child in every village, the 2001 study, for purposes of convenience, utilized Anganwadi workers of the Integrated Child Development Service (ICDS) project (nonexistent in 1971) to identify a sample of 202 children. ICDS, developed by the Government of India in 1979, now provides services for preschool-age children and pregnant women in nearly 90 percent of India’s development blocks. The Anganwadi worker (AWW), responsible for delivery of these services at the village level, takes her title from the anganwadi or traditional courtyard in which she normally works.
The result was a sample somewhat biased toward lower-income and non-Jat households (who are more likely to utilize ICDS services, while their more afflu-ent neighbors frequently seek private health services). Neither the investigators nor the Anganwadi workers were aware of any children who were not served either
by the combination of ICDS and primary health care services or by private health practitioners. The 2001 sample also was slightly younger (see table 2).
Survey instrument
The survey instrument, which was similar to that used in the original survey, was pretested, modified, and administered by three of the study authors, assisted by staff of the Punjab Department of Health located in Morinda. The 2001 questionnaire updated the family possessions or wealth index and collected more detailed pregnancy histories to permit an examination of the gender-based abortion issue. Anthropometric data were collected to estimate nutritional status. Data were collected on food intake and morbidity, particu-larly diarrheal infection, the immediate determinants of nutritional status, and on economic status (income calculations plus the wealth index), family size, and caring practices as underlying determinants. Informa-tion also was collected on the water and sanitation practices of the household and the pregnancy history of the mother.
Anthropometric procedures
Weights and heights of the children were measured at the time that other data on the child and the house-hold were collected. Weight was measured with mini-mal clothing and without shoes to the nearest 100 g. Length was measured with a locally constructed length board, following the standardized procedure. The cor-rect age of the child was determined both by asking the mother and by asking the Anganwadi worker to check her register.
Weight-for-age data from the 2001 follow-up study were analyzed in three ways: by using the Harvard standards and the Gomez classification to permit a comparison of 2001 data with the 1971 data; by using the percentage of median of the Centers for Disease Control/World Health Organization (CDC/WHO)
TABLE 2. Samples of the 1971 and 2001 studies in Morinda disaggregated according to caste and age of child
Characteristic
1971 2001
%No.
(n = 496) %No.
(n = 202)
CasteJatRamdasiaOther
42.139.118.8
209194 93
24.843.132.2
508765
Age (mo)6 – <1212 – <1818 – 24
32.931.635.5
163157176
33.739.626.7
688054
F. J. Levinson et al. Morinda revisited
222 223
international growth standards, again using the Gomez classification; and by conversion of the latter values to Z scores using the Nutritional Anthropometry (Epi Info 2002 System) from the Division of Nutrition, CDC, to permit international comparisons. According to the Gomez classification, normal: ≥ 90% of Harvard weight-for-age standards; mild malnutrition: 89% to 75%; moderate: 74% to 60%; severe: < 60% [3]. Using Z scores, normal: Z score ≥ –1; mild malnutrition: Z score ≥ –2 and < –1; moderate: Z score ≥ –3 and < –2; severe: Z score < –3. It should be noted that the Har-vard standards pool the genders, whereas CDC/WHO provides gender-specific standards.
Caloric intake
The caloric intake of each child was determined by a standard 24-hour food-recall questionnaire using the same standardized vessels and utensils that had been used in 1971. The weight of each food was obtained for these vessels and utensils, translated into available calories using the standard Indian reference [4], and finally compared with nutrient allowances set by the Indian Council of Medical Research. Information also was collected on the breastfeeding status of the child (caloric intake data are presented as a percentage of these allowances rather than as absolute caloric figures, which are no longer available from the 1971 study).
Infection
Data were collected on morbidity histories of the children. In addition, the index developed in the 1971 study to capture the frequency and severity of diarrheal infection was used as well in 2001.
Economic status
The wealth indices developed for the two studies, although useful for causality analysis on their respective samples, were not appropriate for comparative analysis
(the 2001 wealth index included such items as televi-sions and VCRs, which were not generally available in 1971). Household income data, however, were carefully collected in both studies, and the concept of monthly income was well understood by all households. The imputed value of home-grown and consumed food was included.
Caring practices and beliefs
An index of deleterious child-feeding and pregnancy self-care practices was developed for subsequent cau-sality analysis of the 2001 sample. Data comparable across the two surveys were the age of introduction of complementary food; continuity of feeding during bouts of infection; and beliefs about the causes of severe malnutrition.
Self-care data relating to the mother’s most recent pregnancy collected in the 2001 survey include the regularity of daytime rest during pregnancy and the amount of food consumed during pregnancy relative to prepregnancy
Birthweight data are not yet regularly collected for rural home births.
Results
Nutritional status
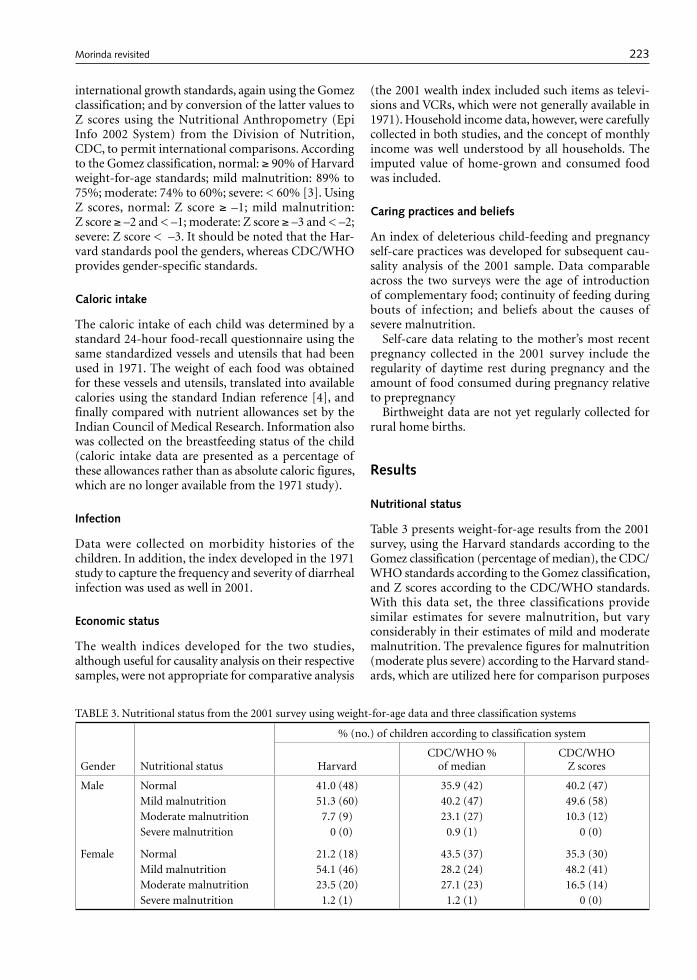
Table 3 presents weight-for-age results from the 2001 survey, using the Harvard standards according to the Gomez classification (percentage of median), the CDC/WHO standards according to the Gomez classification, and Z scores according to the CDC/WHO standards. With this data set, the three classifications provide similar estimates for severe malnutrition, but vary considerably in their estimates of mild and moderate malnutrition. The prevalence figures for malnutrition (moderate plus severe) according to the Harvard stand-ards, which are utilized here for comparison purposes
TABLE 3. Nutritional status from the 2001 survey using weight-for-age data and three classification systems
Gender Nutritional status
% (no.) of children according to classification system
HarvardCDC/WHO %
of medianCDC/WHO
Z scores
Male Normal 41.0 (48) 35.9 (42) 40.2 (47)Mild malnutrition 51.3 (60) 40.2 (47) 49.6 (58)Moderate malnutrition 7.7 (9) 23.1 (27) 10.3 (12)Severe malnutrition 0 (0) 0.9 (1) 0 (0)
Female Normal 21.2 (18) 43.5 (37) 35.3 (30)Mild malnutrition 54.1 (46) 28.2 (24) 48.2 (41)Moderate malnutrition 23.5 (20) 27.1 (23) 16.5 (14)Severe malnutrition 1.2 (1) 1.2 (1) 0 (0)
F. J. Levinson et al. Morinda revisited

224 225
across the two surveys, are somewhat lower than the Z scores for males but much higher than those for females, in part because the Harvard standards pool the genders.
By using the Harvard standards and the Gomez classification, the nutritional status of children from the two surveys can be compared. These results are presented in table 4. The prevalence of malnutrition (moderate plus severe) decreased dramatically, from 47.8% in 1971 to 14.9% 30 years later. The prevalence of severe malnutrition fell from 8.3% to 0.5%, and the percentage of “normal” children more than doubled over the 30-year period. Remarkably, among the Jat children, the prevalence of malnutrition fell from 38.8% to 2.0%, whereas among the poorer Ramdasia children, malnutrition was reduced by a still impres-sive 66%.
Table 5 compares malnutrition prevalence by gender. The prevalence of moderate plus severe malnutrition among girls decreased by 75%, from 68.6% in 1971 to 17.5% in 2001 (compared with a 68% reduction among boys). Although a gender gap still exists, its significance with such small numbers is greatly reduced.
Mortality and family size
These changes in nutritional status are consistent with the reduced child mortality reflected in table 6. As indi-cated on the right side of table 6, the average number of liveborn siblings of the children studied decreased eightfold, from 0.64 (meaning, on average, more than one dead sibling for every two children studied) in 1971
to 0.08 in 2001.The left side of table 6 highlights an important
causal factor in this improved well-being, the reduc-tion in family size. In 1971, the average child studied had 2.22 living siblings. Thirty years later, the figure was less than 1 (0.93).
Caloric intake
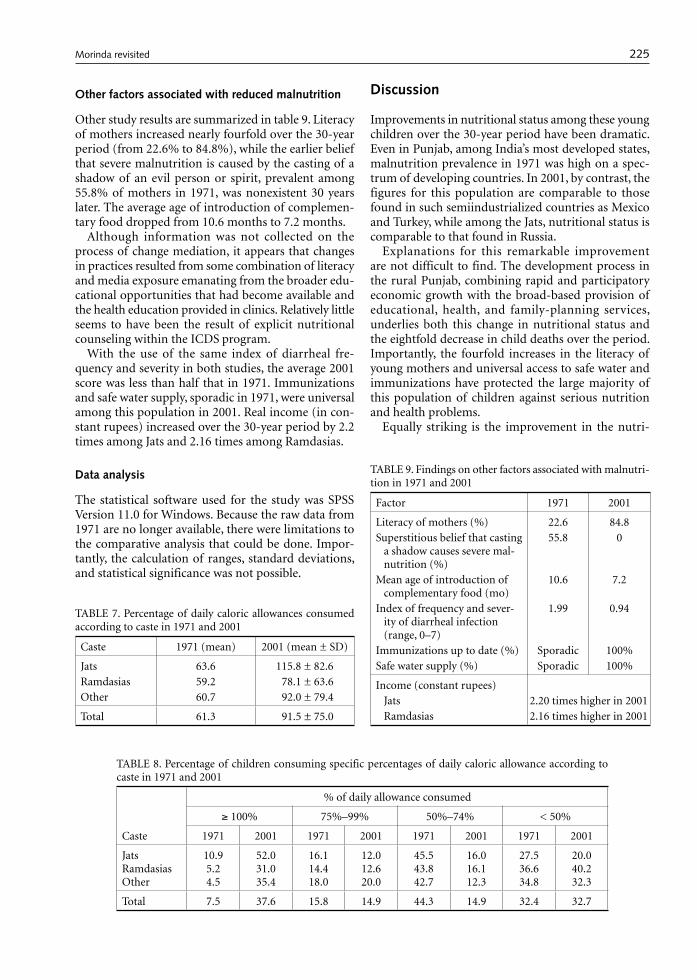
For this young child population as a whole, caloric intake increased by 49% from an average of 61.3% of caloric allowances to 91.5% (see table 7). Here, and in table 8, the caste/class disaggregation is particularly important. For the Jats, although the mean caloric intake in 2001 is, on average, 115% of allowances, and although the percentage of Jat children consuming 100% of caloric allowances or higher has increased nearly fivefold over the 30 years, only just over half of Jat children (52%) are meeting their total caloric needs, while fully 20% are consuming less than half of the caloric allowance. Breastfeeding, as in 1971, was nearly universal into the second year.
Among Ramdasia children, although the proportion of children consuming at least 100% of allowances also has increased dramatically (sixfold), only 31% of Ram-dasia children are actually consuming this much, while an alarming 40.2% are consuming less than 50% of their caloric allowances (not significantly better than 30 years earlier). A disaggregation of these data indicates that, in 2001, poorly fed Ramdasia children are evenly distributed by gender.
TABLE 4. Comparison of nutritional status in 1971 and 2001 according to the Harvard standards and the Gomez classifica-tion (weight-for-age)
Group
Normal (%) Mild malnutrition (%)Moderate malnutrition
(%) Severe malnutrition (%)
1971 2001 1971 2001 1971 2001 1971 2001
JatsRamdasiasOther
19.6 6.920.8
48.026.429.2
41.635.831.3
50.054.052.3
35.245.137.5
2.018.418.5
3.612.310.4
0.01.10.0
Total 14.8 32.7 37.3 52.5 39.5 14.4 8.3 0.5
TABLE 5. Prevalence of malnutrition according to gender in 1971 and 2001
Degree of malnutrition
1971 (%) 2001 (%)
Male Female Male Female
Moderate 32.1 54.2 11.0 17.4Severe 2.8 14.4 0 0.1
TABLE 6. Living and dead siblings per sample child according to caste in 1971 and 2001
Caste
No. of living siblings
No. of live-born dead siblings
1971 (mean)
2001 (mean ± SD)
1971 (mean)
2001 (mean ± SD)
Jats 2.16 0.90 ± 0.84 0.49 0.04 ± 0.20Ramdasias 2.36 0.93 ± 0.96 0.85 0.06 ± 0.23Other 2.08 0.94 ± 0.95 0.53 0.17 ± 0.52
Total 2.22 0.93 ± 0.92 0.64 0.08 ± 0.35
F. J. Levinson et al. Morinda revisited
224 225
Other factors associated with reduced malnutrition
Other study results are summarized in table 9. Literacy of mothers increased nearly fourfold over the 30-year period (from 22.6% to 84.8%), while the earlier belief that severe malnutrition is caused by the casting of a shadow of an evil person or spirit, prevalent among 55.8% of mothers in 1971, was nonexistent 30 years later. The average age of introduction of complemen-tary food dropped from 10.6 months to 7.2 months.
Although information was not collected on the process of change mediation, it appears that changes in practices resulted from some combination of literacy and media exposure emanating from the broader edu-cational opportunities that had become available and the health education provided in clinics. Relatively little seems to have been the result of explicit nutritional counseling within the ICDS program.
With the use of the same index of diarrheal fre-quency and severity in both studies, the average 2001 score was less than half that in 1971. Immunizations and safe water supply, sporadic in 1971, were universal among this population in 2001. Real income (in con-stant rupees) increased over the 30-year period by 2.2 times among Jats and 2.16 times among Ramdasias.
Data analysis
The statistical software used for the study was SPSS Version 11.0 for Windows. Because the raw data from 1971 are no longer available, there were limitations to the comparative analysis that could be done. Impor-tantly, the calculation of ranges, standard deviations, and statistical significance was not possible.
Discussion
Improvements in nutritional status among these young children over the 30-year period have been dramatic. Even in Punjab, among India’s most developed states, malnutrition prevalence in 1971 was high on a spec-trum of developing countries. In 2001, by contrast, the figures for this population are comparable to those found in such semiindustrialized countries as Mexico and Turkey, while among the Jats, nutritional status is comparable to that found in Russia.
Explanations for this remarkable improvement are not difficult to find. The development process in the rural Punjab, combining rapid and participatory economic growth with the broad-based provision of educational, health, and family-planning services, underlies both this change in nutritional status and the eightfold decrease in child deaths over the period. Importantly, the fourfold increases in the literacy of young mothers and universal access to safe water and immunizations have protected the large majority of this population of children against serious nutrition and health problems.
Equally striking is the improvement in the nutri-
TABLE 7. Percentage of daily caloric allowances consumed according to caste in 1971 and 2001
Caste 1971 (mean) 2001 (mean ± SD)
Jats 63.6 115.8 ± 82.6Ramdasias 59.2 78.1 ± 63.6Other 60.7 92.0 ± 79.4
Total 61.3 91.5 ± 75.0
TABLE 8. Percentage of children consuming specific percentages of daily caloric allowance according to caste in 1971 and 2001
Caste
% of daily allowance consumed
≥ 100% 75%–99% 50%–74% < 50%
1971 2001 1971 2001 1971 2001 1971 2001
JatsRamdasiasOther
10.95.24.5
52.031.035.4
16.114.418.0
12.012.620.0
45.543.842.7
16.016.112.3
27.536.634.8
20.040.232.3
Total 7.5 37.6 15.8 14.9 44.3 14.9 32.4 32.7
TABLE 9. Findings on other factors associated with malnutri-tion in 1971 and 2001
Factor 1971 2001
Literacy of mothers (%) 22.6 84.8Superstitious belief that casting
a shadow causes severe mal-nutrition (%)
55.8 0
Mean age of introduction of complementary food (mo)
10.6 7.2
Index of frequency and sever-ity of diarrheal infection (range, 0–7)
1.99 0.94
Immunizations up to date (%) Sporadic 100%Safe water supply (%) Sporadic 100%
Income (constant rupees) Jats 2.20 times higher in 2001 Ramdasias 2.16 times higher in 2001
F. J. Levinson et al. Morinda revisited
226 227
tional status of young girls. From an imbalance in nutritional status in 1971 as serious as that found any-where in the world, malnutrition among young girls fell to a quarter of earlier levels, and the male-female differentials were reduced.
Here explanations surely lie in the economic and educational improvements that have taken place over the 30-year period, coupled with a highly significant reduction in the mean number of children in these young families (from 3.2 to 1.9). With a much higher proportion of young children surviving, and an aggres-sive family-planning program, young couples clearly have found it to their advantage to have smaller fami-lies. With smaller families, a much smaller number of less desired female children, and incomes adequate to support female as well as male children, young girls are now fed better and kept healthier.
These understandings were further reinforced by questions asked of both mothers and grandmothers in the 2001 study about gender preferences. In that study, 72.5% of mothers indicated a desire (at the time of marriage) for two children (one boy and one girl); 93.6% of mothers and 93.8% of grandmothers indicated a desire to educate male and female children in the household equally; and 97.1% of mothers and 94.8% of grandmothers indicated a willingness for female children to seek outside employment after schooling.
Although nutritional status, health status, and child survival improved significantly, food consumption among young children remains an issue of some con-cern. Relative to the 1971 findings, the proportion of children consuming adequate calories improved mark-edly, both among the more advantaged Jats and among the less advantaged Ramdasias. However, at the lower end of the food-consumption spectrum, over 40% of Ramdasia children and 20% of Jat children were still consuming less than 50% of their caloric allowance in 2001. Whereas in 1971 most of the poorly fed children were girls, this was not the case in 2001. There also may be a problem at the upper end of the food-con-sumption spectrum. Among Jat children, whose caloric intake averaged 115% of allowances, a significant pro-portion are consuming far more than 100 percent of allowances, raising concerns about childhood obesity. (The investigators, however, noticed few cases of overt obesity.)
With good health care and safe water, most of those children who were inadequately fed, particularly among the Jats, managed to grow reasonably well and to survive minor childhood illness. (The specific mechanisms by which this occurs would be worthy of
future study.) However, such low levels of caloric intake clearly leave these children vulnerable, particularly to a more serious epidemic of childhood illness. The problem deserves attention. At present, ICDS services cover most of Punjab State, but with services that still pay inadequate attention to the nutritional well-being of children under the age of two. ICDS services, well targeted to children at the low end of the nutritional spectrum and with a strong behavioral-change com-munications component, could be expected to remedy this gap.
A postscript on gender-based abortion and gender balance
Serious concerns have been raised, particularly in northern and western India and in China, about the problem of gender-based abortion. The traditionally strong preference for sons in these areas, relating to issues ranging from social security and inheritance to death rituals and dowries, has led, in the past, to the neglect of unwanted or “excess” girls (note the unusu-ally high percentage of malnourished females in 1971) and, in extreme cases, to infanticide. With the advent of ultrasound testing, gender-based abortion has provided a newer means of eliminating such “excess” females.
The effects of this technology are reflected in recent Punjab State census data indicating that among chil-dren 6 years of age or younger, the number of girls per 1,000 boys decreased from 875 in 1991 to 793 in 2001.
Data carefully gathered as part of this study in 2001 indicate that sonogram testing and gender-based abor-tion are relatively rare in this rural area. In the 204 sample households, nine women had had sonograms, four of these for medical problems. Of the remain-ing five women (three Jat, two Ramdasia; three with two or more previous female children, two with one previous female child), four tests found a male fetus, while one test found a female fetus, which resulted in an abortion.
The likelihood of increases in future sonogram test-ing appears low in Punjab, given newly enforced state laws (including large fines and the registration and monitoring of private clinics) and increased vigilance by religious communities.
With minimal gender-based abortion and sig-nificantly reduced neglect and mortality of female children, gender balance in this area of rural Punjab actually has improved, from 894 girls per 1,000 boys 6 years of age or younger in 1971 to 965 in 2001.
F. J. Levinson et al. Morinda revisited

226 227
References
1. Levinson FJ. Morinda: an economic analysis of malnu-trition among young children in rural India. Cambridge, Mass, USA: Cornell/MIT International Nutrition Policy Series, 1974.
2. Government of Punjab. Statistical abstract of Punjab. Chandigarh, India, 1970 and 2000.
3. Gomez F, Galvan RR, Cravioto J, Frenk S. Malnutri-tion in infancy and childhood with special reference to kwashiorkor. Adv Pediatrics 1955;7:131.
4. National Institute of Nutrition. Nutritive value of Indian foods. Hyderabad, India, 2000.
F. J. Levinson et al. Morinda revisited
228 Food and Nutrition Bulletin, vol. 25, no. 3 © 2004, The United Nations University.
229
Abstract
This study used simple rapid-assessment techniques to test the feasibility of increasing the consumption of complementary foods by infants by asking mothers to increase meal quantity or frequency or by altering the viscosity/energy density of the food. The feasibility of using micronutrient supplements either added directly to food or administered as liquid drops was also exam-ined. The study was conducted in rural Bangladesh and involved four separate short-term behavioral change trials. Depending on the trial, fieldworkers recruited 30 to 45 infants 6 to 12 months of age. Following recommenda-tions to increase the amount of food provided to infants, the mean intakes from single meals increased from 40 ± 23 g on day 1 to 64 ± 30 g on day 7 (p < 0.05). In a second trial, the mean meal frequency increased from 2.2 ± 1.3 on day 1 to 4.1 ± 1.3 on day 7 (p < 0.05). Provision of high-energy-density diets, prepared by decreasing viscos-ity with α-amylase or by hand-mashing rice and dhal into a paste before feeding, increased single-meal energy consumption from 54 ± 35 kcal to 79 ± 52 kcal or 75 ± 37 kcal (p < 0.05), respectively. Both types of micronutrient supplements were well accepted and used according to recommendations. In conclusion, it was possible to change short-term child-feeding behaviors to promote increased food intake, meal frequency, energy density, and micronu-
trient consumption. Because each of these interventions lasted for only about 1 week, however, the long-term sustainability of these changes is not known. Moreover, the effect of increased feeding of complementary foods on intakes of breastmilk and total daily consumption of energy and nutrients requires further study.
Key words: Bangladesh, breastfeeding, complementary feeding, energy density, infant nutrition, meal frequency, micronutrient, viscosity
Introduction
Critical components of appropriate complementary feeding include the introduction of foods other than breastmilk at about six months of age, adequate energy density and frequency of feeding of these complemen-tary foods, and satisfactory nutrient density of these foods [1]. Implementation of these guidelines at the local level requires an understanding of current child-feeding practices, the factors that influence these practices, and possible constraints to improving them. The Bangladesh Integrated Nutrition Project (BINP) finished in 2001 and has now been succeeded by the National Nutrition Program (NNP). The BINP targeted children less than two years of age, but prior to this study it had not yet developed educational messages to improve complementary feeding practices. Therefore, we conducted a series of studies using quantitative and qualitative techniques to determine the optimal means of improving complementary feeding of rural Bang-ladeshi infants, considering issues of local feasibility, acceptability, and likely sustainability. Prior to the stud-ies reported herein, we conducted a weighed dietary intake study of 135 infants between 6 and 12 months of age. The average daily energy intake from comple-mentary foods was only 134 kcal (561 kJ), whereas the expected intake, given the actual breast milk intakes by infants in the study, was 193 kcal (808 kJ) at 6 to 8 months and 241 kcal (1,008 kJ) at 9 to 11 months [2].
Behavior-change trials to assess the feasibility of improving complementary feeding practices and micronutrient intake of infants in rural Bangladesh
Joel Kimmons, Kathryn Dewey, and Kenneth Brown are affiliated with the Program in International Nutrition in the Department of Nutrition at the University of California, Davis, California, USA. Emdadul Haque, J. Chakraborty, and Saskia J.M. Osendarp are affiliated with the Interna-tional Centre for Diarrhoeal Diseases Research, Bangladesh (ICDDR, B) Centre for Health and Population Research.
Please address queries to the corresponding author: Kath-ryn G. Dewey, Department of Nutrition, One Shields Ave., University of California, Davis, CA 95616-8669, USA; e-mail: [email protected].
This study was funded by a grant from the Bangladesh Integrated Nutrition Project (BINP). Fortified spread was provided by Nutriset, Malaunay, France.
Mention of the names of firms and commercial products does not imply endorsement by the United Nations University.
Behavior-change trials
Joel E. Kimmons, Kathryn G. Dewey, Emdadul Haque, J. Chakraborty, Saskia J. M. Osendarp, and Kenneth H. Brown

228 Food and Nutrition Bulletin, vol. 25, no. 3 © 2004, The United Nations University.
229
Meal frequency and energy density of complementary foods were generally consistent with recommendations, but the amounts offered were less than recommended. Despite this, the average consumption was only 73% of the amount of food offered. The foods offered and diets consumed during the weighed-intake study were well below recommended levels with respect to several micronutrients. Accordingly, the behavior-change trials reported herein were designed to explore the flexibility of local infant-feeding practices with regard to increas-ing the amount of food offered at each meal, increasing meal frequency, using recipes with different viscosities and energy densities, and enhancing micronutrient intake either by adding micronutrient supplements to existing foods at the time of preparation or serving, or by providing liquid supplements directly to infants.
Methods
General
All studies were conducted in several small villages in Matlab thana, Comilla District, Bangladesh. The Matlab field research unit of the International Centre for Diarrhoeal Diseases Research, Bangladesh (ICDDR, B) Centre for Health and Population Research served as the project’s central office. Matlab is located 55 km southeast of Dhaka in the low-lying deltaic plain that makes up most of southern Bangladesh. The human subjects committees at the University of California, Davis, California, USA and ICDDR,B approved the research protocol.
The villages were within an hour’s travel from the ICDDR,B Matlab Centre by a nonmotorized boat. Within these villages, all infants who were 6 to 12 months of age and receiving complementary foods along with breastmilk were eligible to participate in the studies. All infants in each village were recruited, and new villages were added to the study as needed to attain the desired sample size. For the most part, differ-ent subjects were enrolled in each of the four studies, although a few of the subjects participated in more than one. Oral consent was obtained from mothers who agreed to participate. Study subjects were visited on alternate days for the duration of each study.
To gain insight into the feasibility and acceptability of the behavior changes, mothers were asked specific questions and also encouraged to comment freely on their experience. Data were collected by fieldworkers who were selected from the villages in which the studies took place. All questions were asked in the local Bangla dialect. Three native Bangla speakers who were fluent in English participated in discussions with the fieldwork-ers to ensure that the questions were asked as intended and in a consistent manner. A single person translated the responses into English only after the meaning of all
responses was agreed upon by the study team.During each study, mothers were advised not to
change their breastfeeding practices, and were told that any modifications of the infants’ foods or feeding practices were intended to complement breastmilk, not replace it. The fieldworkers also emphasized the importance of hygiene, suggesting that foods be freshly prepared; hands, dishware, and eating utensils be washed before meals; foods be stored in clean, sealed containers; and leftover foods be reheated appropriately before feeding.
Meal quantity study
This study was undertaken to determine the feasibil-ity of using an educational message to increase the quantity of food offered to and consumed by infants at each meal. On the first day of the study, before any feeding recommendations were given, the amount of food offered to and consumed by each of 30 infants at a single meal was measured, as well as the time the mother spent feeding. After the feeding session ended, the mother was asked to try to continue the feeding to see if the child would eat more. The observer recorded whether the infant still appeared to be hungry, based on whether the infant consumed the food eagerly and with ease. The intake from this second offering was also weighed. The age-specific amount of energy to be given daily was then demonstrated by showing the mother the quantity of rice and dhal necessary to satisfy her infant’s theoretical energy needs. After the initial rec-ommendations and demonstrations, the participants were asked to increase the amount of food they fed to their infants at each meal. Observations of a single meal were then repeated on alternate days for seven days. No food was supplied to the study participants.
On each subsequent day of observation, we observed the child being fed at the usual mealtime. The amount consumed and time spent feeding were measured at this single meal. Fieldworkers observed the meals and recorded why the mother stopped feeding (coded as “infant finished all of the food,” “infant appeared sati-ated,” “mother had other responsibilities,” or “other reason”); whether the infant was offered more food after he or she appeared to be satiated; the viscosity of the food; and the infant’s acceptance of the food.
Operational definitions for the above outcomes were developed during training sessions with input from the fieldworkers. An infant was judged to be satiated after a complementary feeding if he or she began losing interest in being fed and began playing or moving about; appeared satisfied by becoming silent or calm or by falling asleep; or refused to take more food or spit food out. The fieldworkers judged viscosity by observation and recorded it using a five-point scale in which values were defined as watery (like tea), thicker (like lentil soup dhal), thicker (like halua pudding), wet
Behavior-change trials
230 231
solid (like rice), or dry solid (like biscuit). Acceptance of the food was ranked on a four-point scale, ranging from 1 (the infant ate the food readily) to 4 (the infant spit the food out).
In addition, the fieldworkers asked the mothers open-ended questions about why they fed the quantity they did, their impressions or comments about being asked to increase meal size, and how many times they fed their infant on the previous day.
Meal frequency study
This study was undertaken to determine the feasibility of using an educational message to increase the fre-quency of complementary food meals. Thirty mothers were asked to feed at least three meals per day, and more if possible. They were advised that snack foods (amounts less than 10 g) were not to be considered as meals, and they were encouraged to continue to give snacks as usual. A meal was defined as a separate feed-ing of greater than 10 g. The fieldworkers showed the study mothers a 10-g portion of rice to assist them in making this distinction. Meal frequency was deter-mined on each subsequent alternate-day visit by recall of the previous day.
On the first and last day of the study, the mothers were asked, “Why do you not feed more frequently?” and “Do you think feeding more frequently will be healthy for your infant?” On each subsequent alternate-day visit, the mothers were asked if they had noticed any behavior changes in their infant, if they would continue to feed at the recommended frequency, and whether feeding more often influenced their breast-feeding practices. The study lasted for seven days. No food was provided by the study team.
Viscosity/energy density study
Although the mean energy density of the complemen-tary foods in the weighed-intake studies was adequate, the most commonly offered food was plain parboiled rice, which may be difficult for young infants to con-sume with ease because of its consistency and viscos-ity. This study was carried out to determine if food or energy consumption at a meal could be augmented by decreasing viscosity by changing the recipe or adding
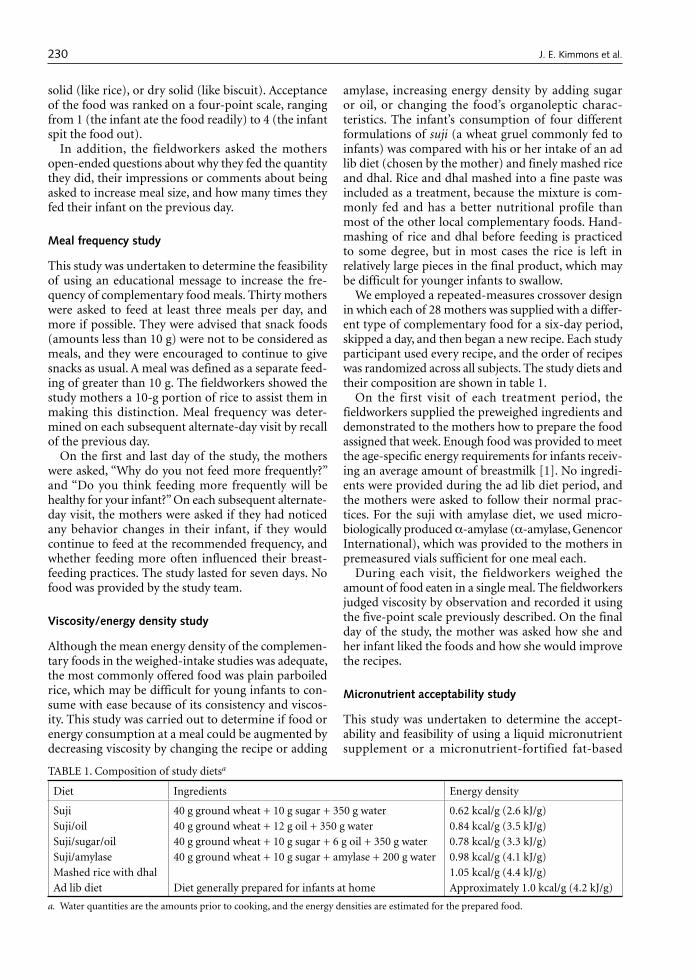
amylase, increasing energy density by adding sugar or oil, or changing the food’s organoleptic charac-teristics. The infant’s consumption of four different formulations of suji (a wheat gruel commonly fed to infants) was compared with his or her intake of an ad lib diet (chosen by the mother) and finely mashed rice and dhal. Rice and dhal mashed into a fine paste was included as a treatment, because the mixture is com-monly fed and has a better nutritional profile than most of the other local complementary foods. Hand-mashing of rice and dhal before feeding is practiced to some degree, but in most cases the rice is left in relatively large pieces in the final product, which may be difficult for younger infants to swallow.
We employed a repeated-measures crossover design in which each of 28 mothers was supplied with a differ-ent type of complementary food for a six-day period, skipped a day, and then began a new recipe. Each study participant used every recipe, and the order of recipes was randomized across all subjects. The study diets and their composition are shown in table 1.
On the first visit of each treatment period, the fieldworkers supplied the preweighed ingredients and demonstrated to the mothers how to prepare the food assigned that week. Enough food was provided to meet the age-specific energy requirements for infants receiv-ing an average amount of breastmilk [1]. No ingredi-ents were provided during the ad lib diet period, and the mothers were asked to follow their normal prac-tices. For the suji with amylase diet, we used micro-biologically produced α-amylase (α-amylase, Genencor International), which was provided to the mothers in premeasured vials sufficient for one meal each.
During each visit, the fieldworkers weighed the amount of food eaten in a single meal. The fieldworkers judged viscosity by observation and recorded it using the five-point scale previously described. On the final day of the study, the mother was asked how she and her infant liked the foods and how she would improve the recipes.
Micronutrient acceptability study
This study was undertaken to determine the accept-ability and feasibility of using a liquid micronutrient supplement or a micronutrient-fortified fat-based
TABLE 1. Composition of study dietsa
Diet Ingredients Energy density
Suji 40 g ground wheat + 10 g sugar + 350 g water 0.62 kcal/g (2.6 kJ/g)Suji/oil 40 g ground wheat + 12 g oil + 350 g water 0.84 kcal/g (3.5 kJ/g)Suji/sugar/oil 40 g ground wheat + 10 g sugar + 6 g oil + 350 g water 0.78 kcal/g (3.3 kJ/g)Suji/amylase 40 g ground wheat + 10 g sugar + amylase + 200 g water 0.98 kcal/g (4.1 kJ/g)Mashed rice with dhal 1.05 kcal/g (4.4 kJ/g)Ad lib diet Diet generally prepared for infants at home Approximately 1.0 kcal/g (4.2 kJ/g)
a. Water quantities are the amounts prior to cooking, and the energy densities are estimated for the prepared food.
J. E. Kimmons et al. Behavior-change trials
230 231
product to improve infant micronutrient intake. The liquid supplement used was a locally available mul-tivitamin supplement called V-Plex (ACME Global), which is packaged in a tinted glass bottle with a plastic dropper built into the lid. Each bottle provides a 15-day supply of nutrients, as listed in appendix 1. V-Plex is commonly provided by local doctors and is available in the local market for 10 to 15 taka (approximately US$0.20). V-Plex was chosen because it was locally available and people were familiar with it. A liquid supplement that contained both vitamins and miner-als was not available locally.
The fat-based product was supplied by the Institut de Recherche pour le Développement (Paris) and Nutri-set (Malaunay, France). It resembled peanut butter in appearance and tasted like a dilute, oily peanut butter with a slightly gritty texture. Fortified fat-based foods have the advantage of being safe because children cannot eat large quantities, thus reducing the risk of accidental overdose, as could occur with liquid, powder, or pill supplements. Also, because the product is fat based, and thus free of water and oxygen, chemical reactions between vitamins and minerals are reduced. This improves the storage life and probably reduces the breakdown of vitamins. Nutriset reports very good acceptability by populations studied in Chad and Alge-ria [3, 4]. The composition of the product is detailed in Appendix 1. This product is not presently available for consumer purchase in Bangladesh.
On the first day of the study, a fieldworker explained the possible benefits of providing a micronutrient sup-plement. The study participants were supplied with the respective supplement and advised to give either 0.5 ml of the liquid supplement two times each day (n = 30, duration 7 days) or 30 g of the spread, divided into three 10-g portions and mixed with food each day (n = 44, duration 4 days). The mothers were advised to give the supplement only to the infant enrolled in the study. Each infant received only one type of supplement. On the first day of the fat-based prod-uct trial, a fieldworker observed the mother mix the spread with food and feed it to the infant. The same observer weighed the amount of food and fortified product consumed during the meal. Questions were asked to elicit the mother’s opinions on using the supplement and whether the infant liked it. Possible responses included “Yes,” “No,” or “Do not know,” plus the mother’s explanation. Acceptance was assessed by disappearance of the samples and recall of the number of times the supplements were used.
Data analysis
Statistical analyses were performed with SAS-PC for Windows Version 6.10 (SAS Institute, Cary, NC, USA). Data on meal quantity (grams per meal) and frequency (number per day) were analyzed by repeated-measures
analysis of variance (ANOVA). Post hoc pairwise com-parisons between means were performed with Tukey’s test. Data on viscosity/energy density were examined with a two-way ANOVA (SAS GLM LSM), with pair-wise comparisons (grams per meal and kilocalories per meal) using Tukey’s test. P values of less than 0.05 were considered to indicate statistical significance. Values are reported as means ± SD.
Results
Meal quantity study
Thirty mothers with infants between 6 and 12 months of age (mean, 9.5 ± 1.5 months) completed this study (table 2). On day 1, the initial quantity of food offered at the observed meal was 67 g, of which 40 g was con-sumed. The fieldworkers judged, by observation, that in 80% of the cases the meal ended because the infant appeared satiated, and in 20% of the cases the infant consumed all of the food that was prepared. After this first feeding attempt, the mothers were asked why they stopped feeding. They unanimously reported that the infant did not want any more food. Further explana-tions included “The baby does not want to eat more” (18 mothers); “The baby will spit food out if I force it into his or her mouth” (4 mothers); “I encouraged the baby and he or she refused” (4 mothers); “I plan to breastfeed” (1 mother); “The baby will vomit if I feed more” (1 mother); “The baby has taken the total serving” (1 mother); and “No particular reason” (1 mother).
The mothers were then asked to attempt to feed their children more. The mothers’ comments on being asked to feed their infants this second time included “If it is good for the baby, I will try” (15 mothers); “The baby will vomit or cry if pressured to eat” (5 mothers); “The baby is full” (4 mothers); “I think I fed enough” (4 mothers); “The baby will only eat if food has sugar on it” (1 mother); and “Eating more will upset the baby and he or she will not take breastmilk” (1 mother).
During the second feeding, a mean of 9 ± 10 g (median, 5 g) of additional food was consumed. As the mothers fed their infants this second time, the fieldworkers observed that 20% of the infants (n = 6) still appeared to be hungry. These infants consumed a mean of 25 ± 14 g of food. The 80% of infants who were judged to be not hungry (satiated) consumed a mean of 5 ± 3 g of food during this second feeding.
Over the subsequent days of observation, the quan-tity of food offered to and consumed by the infants increased (table 2). The amounts consumed on days 5 and 7 were significantly greater than the amount consumed on day 1, and the duration of the meals was significantly longer on days 4 and 7 than on day 1. The viscosity decreased over the study period, but the
J. E. Kimmons et al. Behavior-change trials

232 233
increase in the amount consumed was still significant after viscosity was controlled for. Infant acceptance of the food remained stable throughout the study. As determined by recall, the average meal frequency did not change significantly over the study period.
On days 4 and 7, all infants were judged by the fieldworkers to be hungry as the mother started to feed. The mothers’ comments on days 4 and 7 about trying to increase meal size included “I try to feed but the baby doesn’t want to eat more” (13 mothers); “If it is good for the baby I will try” (19 mothers); “The baby makes less disturbance when I feed more” (16 mothers); “The baby will vomit or cry if pressured to eat” (5 mothers); “Feeding more takes too much time” (2 mothers); “My baby is eating more; I am surprised” (2 mothers); and “The baby only wants breastmilk” (1 mother). The fieldworkers observed that on day 4, 93% of the mothers ended the meal because the infant appeared satiated; this proportion increased to 97% on day 7. In the remaining cases, the infants finished the entire portion offered.
On day 7, all of the mothers said they would continue to feed the increased amount fed during the study. Also on day 7, in response to the question “Has feeding more food affected your breastfeeding practices?”, 63% of the mothers responded that the increase in meal quantity had decreased the infant’s breastmilk consumption or the amount of time the infant spent at the breast, 3% (one mother) reported an increase in the infant’s breastmilk consumption, and 34% reported that feed-ing more did not affect breastfeeding.
Meal frequency study
Thirty mothers with infants between 6 and 12 months
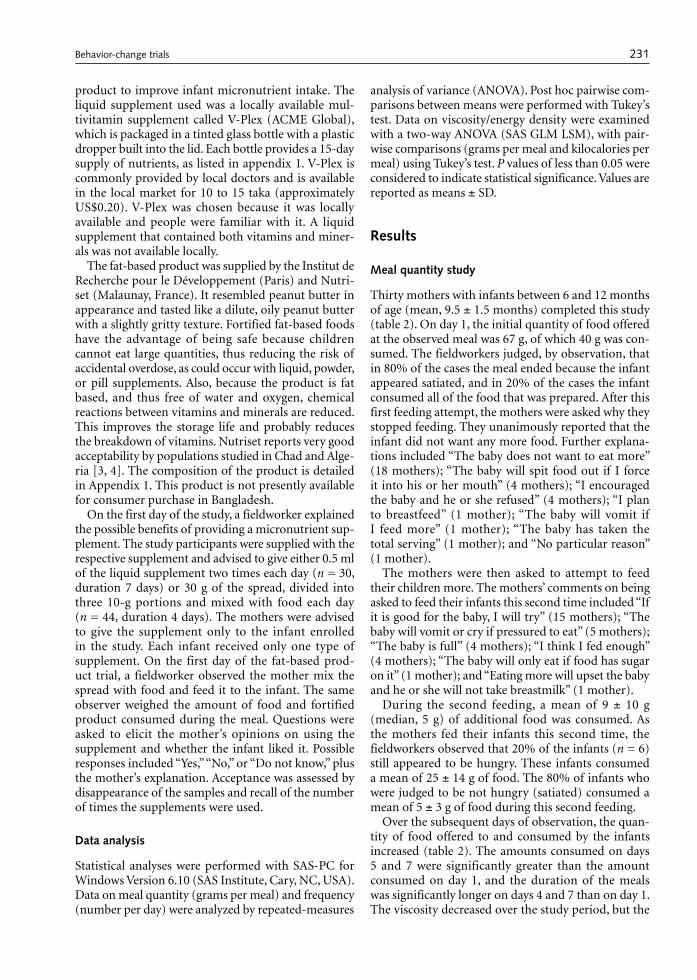
of age (9.3 ± 1.5 months) completed the study (table 3). The reported daily meal frequency increased from 2.2 to 4.1 during the study. The number of meals reported on days 3, 5, and 7 was significantly greater than on day 1, and the number of meals on day 7 was greater than on days 3 and 5.
In response to the question “Why do you not feed more frequently?”, the percentage of women who cited time constraints decreased from 47% to 33% during the study, the percentage citing lack of money decreased from 33% to 23%, and the percentage citing lack of food decreased from 13% to 7%. During 6 of the 120 visits, the observers noted that food was not available to feed the infant. The percentage who responded that the baby did not want to eat more meals than the current level increased from 37% to 47%, whereas the percentage of mothers who felt that the amount of breastmilk and other foods usually fed was enough for the infant decreased from 37% to 13%. As the study progressed, the mothers increasingly reported infant behavior changes. By the final day of the study, 33% reported less crying and 23% mentioned that the infant had more energy. On the first day of the study, 90% of the participants reported believing that feeding more frequently would benefit their infants’ health by either preventing illness (77%) or improving growth (13%). This increased to 97% of the mothers by the final day of the study. At the end of the study, 29 of the 30 participants said they could continue to feed with the increased frequency practiced during the study.
On each day of observation, 27% of the study par-ticipants (n = 8) reported that feeding more frequently caused their infant to be less hungry and thus take less breastmilk. Six of these eight women gave the same response on each day of observation.
TABLE 2. Meal quantity study (N = 30): amounts offered and consumed and observations of feeding practicesa
Measurement or observation Day 1 Day 4 Day 7
Quantity of food offered (g) 67 ± 42x 82 ± 33x 95 ± 37x
Quantity of food consumed (g) 40 ± 23b 55 ± 28c 64 ± 30c
Reason mother stopped feedingInfant appeared satiated 80% (n = 24) 93% (n = 28) 97% (n = 29)Infant finished all of the food 20% (n = 6) 7% (n = 2) 3% (n = 1)
Duration of meal (min) 6 ± 2b 12 ± 2cx 13 ± 2cx
Viscosity of foodd 3.7 ± 0.6 3.4 ± 0.7 3.1 ± 0.8
Infant’s acceptance of foode 1.1 ± 0.3 1.2 ± 0.4 1.0 ± 0.2
Infant offered more to eat after satiated 70% 57% 70%
Meal frequency (previous day) 2.3 ± 0.9 2.4 ± 1.0 2.9 ± 0.8
a. Plus-minus values are means ± SD. b, c. Values with different superscript letters within a row are significantly different (p < 0.05). d. Scale ranges from 1 (like tea) to 4 (like cooked rice).e. Scale ranges from 1 (very well liked) to 4 (did not like).
J. E. Kimmons et al. Behavior-change trials
232 233
Viscosity/energy density study
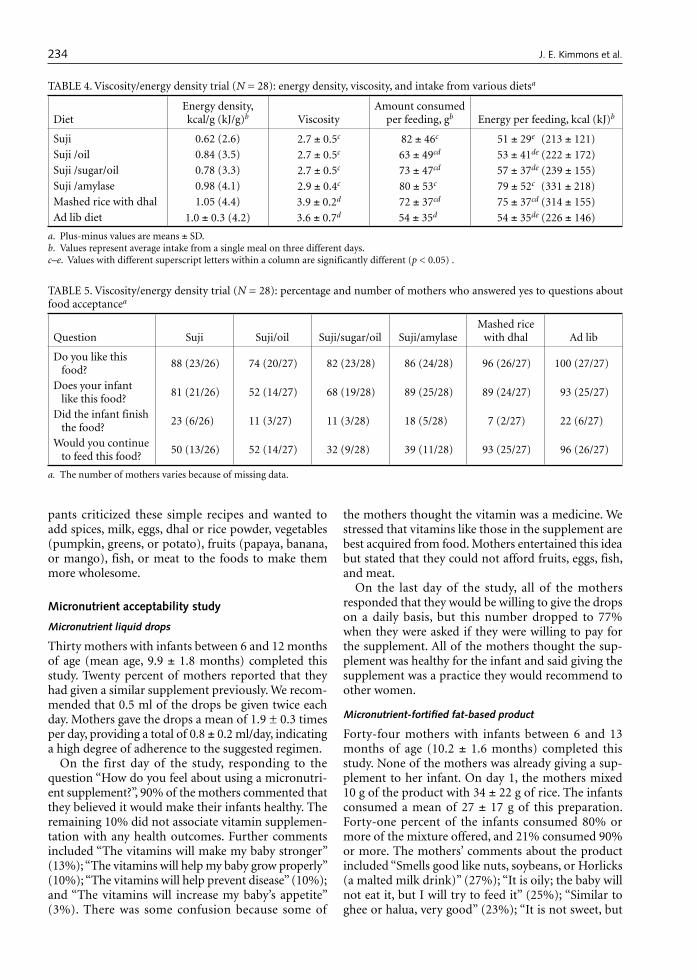
Twenty-eight mothers with infants between 6 and 12 months of age completed this study. There was no difference in observed viscosity between suji, suji with oil, suji with sugar and oil, and suji with amylase, but mashed rice with dhal and the ad lib diet were sig-nificantly thicker than these four diets (table 4). The amounts consumed (in grams) did not vary signifi-cantly among suji, suji with oil, suji with sugar and oil, suji with amylase, and mashed rice with dhal, although infants consumed significantly more of suji and suji with amylase than of their ad lib diet. The ad lib diet was most commonly plain rice, but it also included rice with dhal; rice with sugar; and rice with vegetables, suji, and luta (rice-flour porridge). Energy intake from the meal was highest for suji with amylase, which had both a high energy density and a low viscosity. The second highest energy intake was from mashed rice with dhal, which had similarly high energy density but relatively high viscosity.
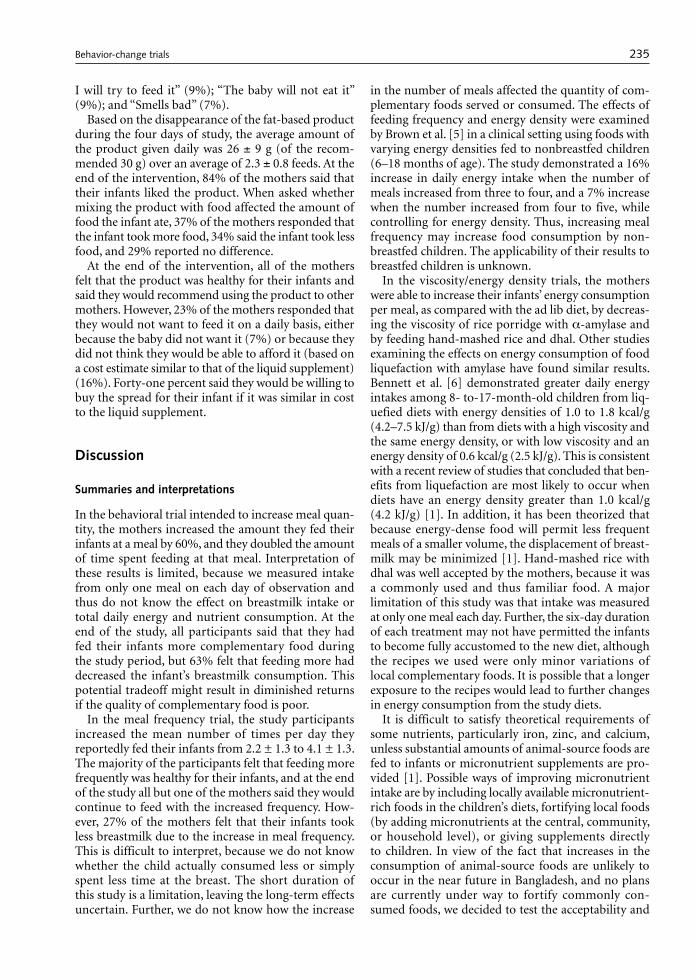
On the final day of the study, the participants were asked the questions shown in table 5. The women were also encouraged to provide open-ended remarks about the recipes. The ad lib diet and the rice and dhal diet were the favorites among both mothers (96% to 97%) and infants (89% to 90%). The mothers’ comments on the ad lib diet included “My infant likes it because
he or she is accustomed to it” (n = 24); “It is a family food so I do not have to prepare special foods” (n = 19); and “I can afford it” (n = 6). Comments on the rice and dhal diet included “It is a family food so I do not have to prepare special foods” (n = 21) and “My infant likes it because he or she is accustomed to it” (n = 15). Suji, suji with sugar and oil, and suji with amylase were liked by a large percentage of the mothers (82% to 89%) and infants (68% to 89%), although only half or less of the mothers said they would continue to feed these foods. Comments on suji included “It is easy to feed” (n = 24); “It is easy to prepare” (n = 20); and “My baby eats more of it than the usual diet” (n = 14). Comments on suji with sugar and oil included “I cannot afford this food” (n = 9); “It is quick to fill the stomach and satisfy the appetite” (n = 8); and “My baby eats more than usual” (n = 7). Comments on suji with amylase included “My baby eats more than usual” (n = 23); “It is easy to feed” (n = 17); “This food may be costly” (n = 5); and “It is not available in the market” (n = 3). Suji with oil was the least liked food, with only about half of the mothers reporting that their infants liked it. Comments on suji with oil included “I cannot afford this food” (n = 9); “It is quick to fill the stomach and satisfy the appetite” (n = 8); “My baby eats more than usual” (n = 7); and “I like it because it does not contain sugar which causes worms” (n = 3).
Interestingly, 79% (n = 22) of the study partici-
TABLE 3. Meal frequency study (N = 30): number of meals and responses to behavior-change questions
Question Response Day 1 Day 3 Day 5 Day 7
Complementary food meal frequency (mean ± SD)
2.2 ± 1.3a 3.1 ± 0.6b 3.4 ± 1.3b 4.1 ± 1.3bc
Why do you not feed more frequently?
Time constraints 47% (n = 14) 33% (n = 10)Baby does not want 37% (n = 11) 47% (n = 14)Current amount is
enough 37% (n = 11) 13% (n = 4)
Lack of money 33% (n = 10) 23% (n = 7)Not enough food 13% (n = 4) 7% (n = 2)
Have you noticed any behav-ior changes in your infant?
Infant cries less 10% (n = 3) 23% (n = 7) 33% (n = 10)
Infant has more energy
7% (n = 2) 17% (n = 5) 23% (n = 7)
Do you think feeding more frequently will be healthy for your infant?
Yes 90% (n = 27) 97% (n = 29)
Will you continue to try to feed at the recommended frequency?
Yes 97% (n = 29) 100% (n = 30) 97% (n = 29)
Has feeding more food affected your breastfeed-ing practices?
Yes 27% (n = 8) 27% (n = 8) 27% (n = 8)
a,b. Values with different superscript letters within a row are significantly different (p < 0.05).
J. E. Kimmons et al. Behavior-change trials
234 235
pants criticized these simple recipes and wanted to add spices, milk, eggs, dhal or rice powder, vegetables (pumpkin, greens, or potato), fruits (papaya, banana, or mango), fish, or meat to the foods to make them more wholesome.
Micronutrient acceptability study
Micronutrient liquid drops
Thirty mothers with infants between 6 and 12 months of age (mean age, 9.9 ± 1.8 months) completed this study. Twenty percent of mothers reported that they had given a similar supplement previously. We recom-mended that 0.5 ml of the drops be given twice each day. Mothers gave the drops a mean of 1.9 ± 0.3 times per day, providing a total of 0.8 ± 0.2 ml/day, indicating a high degree of adherence to the suggested regimen.
On the first day of the study, responding to the question “How do you feel about using a micronutri-ent supplement?”, 90% of the mothers commented that they believed it would make their infants healthy. The remaining 10% did not associate vitamin supplemen-tation with any health outcomes. Further comments included “The vitamins will make my baby stronger” (13%); “The vitamins will help my baby grow properly” (10%); “The vitamins will help prevent disease” (10%); and “The vitamins will increase my baby’s appetite” (3%). There was some confusion because some of
the mothers thought the vitamin was a medicine. We stressed that vitamins like those in the supplement are best acquired from food. Mothers entertained this idea but stated that they could not afford fruits, eggs, fish, and meat.
On the last day of the study, all of the mothers responded that they would be willing to give the drops on a daily basis, but this number dropped to 77% when they were asked if they were willing to pay for the supplement. All of the mothers thought the sup-plement was healthy for the infant and said giving the supplement was a practice they would recommend to other women.
Micronutrient-fortified fat-based product
Forty-four mothers with infants between 6 and 13 months of age (10.2 ± 1.6 months) completed this study. None of the mothers was already giving a sup-plement to her infant. On day 1, the mothers mixed 10 g of the product with 34 ± 22 g of rice. The infants consumed a mean of 27 ± 17 g of this preparation. Forty-one percent of the infants consumed 80% or more of the mixture offered, and 21% consumed 90% or more. The mothers’ comments about the product included “Smells good like nuts, soybeans, or Horlicks (a malted milk drink)” (27%); “It is oily; the baby will not eat it, but I will try to feed it” (25%); “Similar to ghee or halua, very good” (23%); “It is not sweet, but
TABLE 5. Viscosity/energy density trial (N = 28): percentage and number of mothers who answered yes to questions about food acceptancea
Question Suji Suji/oil Suji/sugar/oil Suji/amylaseMashed rice
with dhal Ad lib
Do you like this food?
88 (23/26) 74 (20/27) 82 (23/28) 86 (24/28) 96 (26/27) 100 (27/27)
Does your infant like this food?
81 (21/26) 52 (14/27) 68 (19/28) 89 (25/28) 89 (24/27) 93 (25/27)
Did the infant finish the food?
23 (6/26) 11 (3/27) 11 (3/28) 18 (5/28) 7 (2/27) 22 (6/27)
Would you continue to feed this food?
50 (13/26) 52 (14/27) 32 (9/28) 39 (11/28) 93 (25/27) 96 (26/27)
a. The number of mothers varies because of missing data.
TABLE 4. Viscosity/energy density trial (N = 28): energy density, viscosity, and intake from various dietsa
DietEnergy density, kcal/g (kJ/g)b Viscosity
Amount consumed per feeding, gb Energy per feeding, kcal (kJ)b
Suji 0.62 (2.6) 2.7 ± 0.5c 82 ± 46c 51 ± 29ex (213 ± 121)Suji /oil 0.84 (3.5) 2.7 ± 0.5c 63 ± 49cd 53 ± 41de (222 ± 172)Suji /sugar/oil 0.78 (3.3) 2.7 ± 0.5c 73 ± 47cd 57 ± 37de (239 ± 155)Suji /amylase 0.98 (4.1) 2.9 ± 0.4c 80 ± 53cx 79 ± 52cx (331 ± 218)Mashed rice with dhal 1.05 (4.4) 3.9 ± 0.2d 72 ± 37cd 75 ± 37cd (314 ± 155)Ad lib diet 1.0 ± 0.3 (4.2) 3.6 ± 0.7d 54 ± 35dx 54 ± 35de (226 ± 146)
a. Plus-minus values are means ± SD. b. Values represent average intake from a single meal on three different days.c–e. Values with different superscript letters within a column are significantly different (p < 0.05) .
J. E. Kimmons et al. Behavior-change trials
234 235
I will try to feed it” (9%); “The baby will not eat it” (9%); and “Smells bad” (7%).
Based on the disappearance of the fat-based product during the four days of study, the average amount of the product given daily was 26 ± 9 g (of the recom-mended 30 g) over an average of 2.3 ± 0.8 feeds. At the end of the intervention, 84% of the mothers said that their infants liked the product. When asked whether mixing the product with food affected the amount of food the infant ate, 37% of the mothers responded that the infant took more food, 34% said the infant took less food, and 29% reported no difference.
At the end of the intervention, all of the mothers felt that the product was healthy for their infants and said they would recommend using the product to other mothers. However, 23% of the mothers responded that they would not want to feed it on a daily basis, either because the baby did not want it (7%) or because they did not think they would be able to afford it (based on a cost estimate similar to that of the liquid supplement) (16%). Forty-one percent said they would be willing to buy the spread for their infant if it was similar in cost to the liquid supplement.
Discussion
Summaries and interpretations
In the behavioral trial intended to increase meal quan-tity, the mothers increased the amount they fed their infants at a meal by 60%, and they doubled the amount of time spent feeding at that meal. Interpretation of these results is limited, because we measured intake from only one meal on each day of observation and thus do not know the effect on breastmilk intake or total daily energy and nutrient consumption. At the end of the study, all participants said that they had fed their infants more complementary food during the study period, but 63% felt that feeding more had decreased the infant’s breastmilk consumption. This potential tradeoff might result in diminished returns if the quality of complementary food is poor.
In the meal frequency trial, the study participants increased the mean number of times per day they reportedly fed their infants from 2.2 ± 1.3 to 4.1 ± 1.3. The majority of the participants felt that feeding more frequently was healthy for their infants, and at the end of the study all but one of the mothers said they would continue to feed with the increased frequency. How-ever, 27% of the mothers felt that their infants took less breastmilk due to the increase in meal frequency. This is difficult to interpret, because we do not know whether the child actually consumed less or simply spent less time at the breast. The short duration of this study is a limitation, leaving the long-term effects uncertain. Further, we do not know how the increase
in the number of meals affected the quantity of com-plementary foods served or consumed. The effects of feeding frequency and energy density were examined by Brown et al. [5] in a clinical setting using foods with varying energy densities fed to nonbreastfed children (6–18 months of age). The study demonstrated a 16% increase in daily energy intake when the number of meals increased from three to four, and a 7% increase when the number increased from four to five, while controlling for energy density. Thus, increasing meal frequency may increase food consumption by non-breastfed children. The applicability of their results to breastfed children is unknown.
In the viscosity/energy density trials, the mothers were able to increase their infants’ energy consumption per meal, as compared with the ad lib diet, by decreas-ing the viscosity of rice porridge with α-amylase and by feeding hand-mashed rice and dhal. Other studies examining the effects on energy consumption of food liquefaction with amylase have found similar results. Bennett et al. [6] demonstrated greater daily energy intakes among 8- to-17-month-old children from liq-uefied diets with energy densities of 1.0 to 1.8 kcal/g (4.2–7.5 kJ/g) than from diets with a high viscosity and the same energy density, or with low viscosity and an energy density of 0.6 kcal/g (2.5 kJ/g). This is consistent with a recent review of studies that concluded that ben-efits from liquefaction are most likely to occur when diets have an energy density greater than 1.0 kcal/g (4.2 kJ/g) [1]. In addition, it has been theorized that because energy-dense food will permit less frequent meals of a smaller volume, the displacement of breast-milk may be minimized [1]. Hand-mashed rice with dhal was well accepted by the mothers, because it was a commonly used and thus familiar food. A major limitation of this study was that intake was measured at only one meal each day. Further, the six-day duration of each treatment may not have permitted the infants to become fully accustomed to the new diet, although the recipes we used were only minor variations of local complementary foods. It is possible that a longer exposure to the recipes would lead to further changes in energy consumption from the study diets.
It is difficult to satisfy theoretical requirements of some nutrients, particularly iron, zinc, and calcium, unless substantial amounts of animal-source foods are fed to infants or micronutrient supplements are pro-vided [1]. Possible ways of improving micronutrient intake are by including locally available micronutrient-rich foods in the children’s diets, fortifying local foods (by adding micronutrients at the central, community, or household level), or giving supplements directly to children. In view of the fact that increases in the consumption of animal-source foods are unlikely to occur in the near future in Bangladesh, and no plans are currently under way to fortify commonly con-sumed foods, we decided to test the acceptability and
J. E. Kimmons et al. Behavior-change trials

236 237
feasibility of using a liquid micronutrient supplement and a micronutrient-fortified fat-based product. Both supplements were well accepted and used correctly at the household level for the duration of the study. Limitations of this study were the short time span and lack of direct observation of consumption. The ability and willingness of women to maintain the use of a supplement over a long time period will need further investigation, but the majority of mothers in this study said they were willing to feed a supplement daily. Interestingly, most of the mothers commented that they would prefer food instead of the supplement and that they would not need the supplement if they could provide proper food. Such local wisdom should be complemented with public health advice on meth-ods to achieve optimal nutrition. Ideally, any project or program that advocates or administers nutritional supplements should also promote recommendations that encourage a population to satisfy its nutritional needs through appropriate dietary practices and assist in the development of social and economic structures that will make this possible.
Although the participants in this study responded positively to the educational messages, the questions remain whether the changes were sufficient to achieve adequate energy intake, and what are the potential tradeoffs or problems that may arise due to the adop-tion of these practices. The mean recommended energy from complementary food for 6- to 11-month-olds has been estimated to be about 250 kcal (1,047 kJ) for those receiving average levels of breastmilk and 46 kcal (193 kJ) for those receiving high levels of breastmilk [2]. In the weighed-intake studies, we observed aver-age to high intakes of breastmilk in this population. By combining the potential increase from the meal fre-quency and meal quantity studies (four meals/day at 64 g each and an energy density of 1.1 kcal/g [4.6 kJ/g], the median energy density observed during the weighed-intake studies), we can estimate a potential intake from complementary food of about 260 kcal/day (1,088 kJ). This may be an overestimate due to tradeoffs between increases in meal quantity and frequency. Neverthe-less, this potential intake meets the needs of infants with average breastmilk intake, and is approximately twice the present intake of energy from complementary food observed in the weighed-intake studies. Larger increases in energy intake might be realized if we con-sider effects due to increasing the diet’s energy density. However, these estimations might not be generalizable to a large-scale intervention, since the frequent home visits in this study may have enhanced adherence to the recommendations.
On the other hand, it is possible that interventions such as these might lead to a displacement of breast-milk as a result of the infant’s appetite being satisfied by complementary foods, the mother’s feeling she does not need to breastfeed as often or as long because she
has fed other food, or the mother’s not having as much time to breastfeed due to the increased time spent pre-paring and feeding complementary foods. There is limited information on the effects of complementary food intake on breastmilk intake. Drewett et al. [7] followed 60 Thai infants for the first year of life and measured breastmilk and complementary food intake at several time points. They concluded that energy from complementary food displaces breastmilk and that the magnitude of the effect declines progressively with age. For example, they found that at the age of 6 months, each additional 1 kcal (4.2 kJ) from complementary food was associated with a decrease of 0.57 kcal (2.4 kJ) from breastmilk, whereas at 12 months each additional 1.0 kcal was associated with a decrease of only 0.28 kcal (1.2 kJ) from breastmilk. Increased meal frequency has also been associated with a decrease in breastfeeding frequency and time spent nursing [8]. In the weighed-intake study, we observed that an increase of 1 kcal (4.2 kJ) from complementary food was associated with a decrease of 0.46 kcal (1.9 kJ) from breastmilk. Thus, if we assume that the educational interventions could increase complementary food intake by 130 kcal (544 kJ), then total energy intake may only increase by 70 kcal (293 kJ). It is also important to consider other potential risks associated with increasing complemen-tary food quantity or meal frequency, depending on demographic or individual characteristics. For example, increases in meal frequency may lead to an increased risk of illness from food-borne pathogens if mothers who lack refrigeration or adequate fuel for cooking or reheating decide to hold food over from one meal to the next instead of freshly preparing it. In populations where food availability is sporadic, a greater depend-ence on complementary foods (as compared with a high percentage of energy from breastmilk) might make an infant more vulnerable to a severe reduction in intake during transitory food shortages.
Conclusions
Improving infant health in less-industrialized countries will require more than making appropriate food and health care available. Caregivers must also understand and follow recommended infant-feeding practices. Although general recommendations have been pub-lished on breastfeeding practices, infant nutrient needs, meal frequency, complementary food energy density, and other caregiving needs [9], these recommenda-tions need to be adapted according to locally obtained empirical data on current feeding practices. The present studies were designed to assess current com-plementary feeding practices in Bangladesh quickly and inexpensively. In the first stage of this project, we quantitatively assessed the dietary intake and feed-ing practices of rural Bangladeshi infants. Based on
J. E. Kimmons et al. Behavior-change trials

236 237
this assessment, changes in current feeding practices that might improve infant nutrition were identified. These behavior-change trials were then conducted to determine the ability and willingness of caregivers to adopt the suggested changes. The fieldwork for both the quantitative assessment and the behavior-change trials, including the training of villagers as fieldworkers, data collection, and data entry, was completed in 4.5 months at relatively low cost. We were able to carry out this wide-ranging assessment within this time frame by using short-term interventions and both qualita-tive and quantitative research methods. As resources permitted, quantitative data were collected to assess the effects and acceptance of behavior changes objectively. Qualitative information was then elicited to illumi-nate caregivers’ feelings about the behavior changes and assess the likelihood that the changes would be
sustained. The behavior-change trials reported herein were intended to assess the flexibility of feeding prac-tices in rural Bangladesh. The results will be useful in planning longer-term trials to develop programmatic recommendations to resolve the previously identified shortfalls in energy and micronutrients.
Acknowledgments
The authors would like to thank the fieldworkers and participating mothers from the Matlab area for their dedication to this project. We also extend our thanks to the staff at the University of California, Davis, and ICDDR,B, who managed the complicated logis-tics of this project, and to Jan Peerson for statistical assistance.
References
1. WHO/UNICEF. Complementary feeding of young children in developing countries: a review of current scientific knowledge. (WHO/NUT/98.1) Geneva: World Health Organization, 1998.
2. Dewey KG, Brown KH. Update on technical issues con-cerning complementary feeding of young children in developing countries and implications for intervention programs. Food Nutr Bull 2003;24:5–28.
3. Briend A, Lacsala R, Prudhon C, Mounier B, Grellety Y, Golden MH. Ready-to-use therapeutic food for treat-ment of marasmus. Lancet 1999;353:1767–8.
4. Instituto Nazionale della Nutrizione. Strategies to fight anemia and growth retardation in Saharawi children. Rome: Comitato Internazionale per lo Sviluppo dei Popoli, 1999.
5. Brown KH, Sanchez-Grinan M, Perez F, Peerson JM, Ganoza L, Stern J. Effects of dietary energy density and feeding frequency on total daily energy intakes of recover-ing malnourished children. Am J Clin Nutr 1995;62:13–8.
6. Bennett VA, Morales E, Gonzalez J, Peerson JM, Lopez de Romana G, Brown KH. Effects of dietary viscosity
and energy density on total daily energy consumption by young Peruvian children. Am J Clin Nutr 1999;70:285–91.
7. Drewett R, Amatayakul K, Wongsawasdii L, Mangkla-bruks A, Ruckpaopunt S, Ruangyuttikam C, Baum D, Imong S, Jackson D, Woolridge M. Nursing frequency and the energy intake from breast milk and supplemen-tary food in a rural Thai population: a longitudinal study. Eur J Clin Nutr 1993;47:880–91.
8. Rivera J, Santizo MC, Hurtado E. Diseño y evaluación de un programa educativo para mejorar las prácticas de alimentación en niños de 6 a 24 meses de edad en comu-nidades rurales de Guatemala. (Design and evaluation of an educational program to improve feeding practices of children 6 to 24 months of age in rural communities of Guatemala.) Washington, DC: Organización Panameri-cana de la Salud, 1998.
9. Pan American Health Organization/World Health Organization. Guiding principles for complementary feeding of the breastfed child. Washington, DC: Pan American Health Organization, 2003.
J. E. Kimmons et al. Behavior-change trials
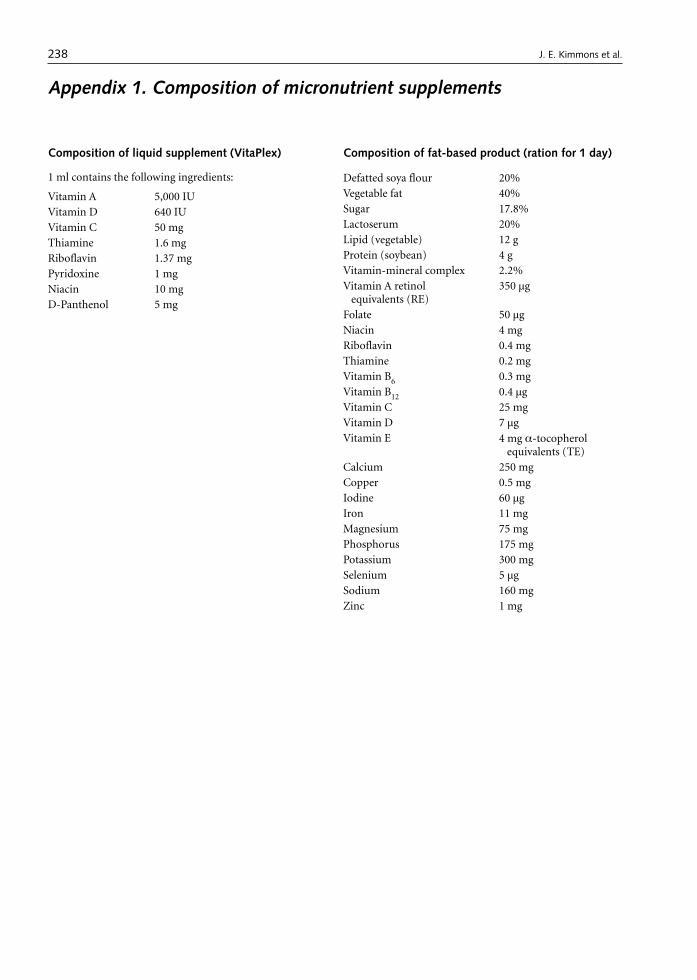
238
Composition of liquid supplement (VitaPlex)
1 ml contains the following ingredients:
Vitamin A 5,000 IUVitamin D 640 IUVitamin C 50 mgThiamine 1.6 mgRiboflavin 1.37 mgPyridoxine 1 mgNiacin 10 mgD-Panthenol 5 mg
Appendix 1. Composition of micronutrient supplements
Composition of fat-based product (ration for 1 day)
Defatted soya flour 20%Vegetable fat 40%Sugar 17.8%Lactoserum 20%Lipid (vegetable) 12 gProtein (soybean) 4 gVitamin-mineral complex 2.2%Vitamin A retinol
equivalents (RE) 350 µg
Folate 50 µgNiacin 4 mgRiboflavin 0.4 mgThiamine 0.2 mgVitamin B6 0.3 mgVitamin B12 0.4 µgVitamin C 25 mgVitamin D 7 µgVitamin E 4 mg α-tocopherol
equivalents (TE)Calcium 250 mgCopper 0.5 mgIodine 60 µgIron 11 mgMagnesium 75 mgPhosphorus 175 mgPotassium 300 mgSelenium 5 µgSodium 160 mgZinc 1 mg
J. E. Kimmons et al.

Food and Nutrition Bulletin, vol. 25, no. 3 © 2004, The United Nations University. 239
Abstract
An agricultural project in Highland Ecuador provided a model context to better understand the nutrition of rural women. The adequacy of women’s nutrition and the strength of associations with age and socioeconomic status were studied in 104 rural households over four rounds (two seasons) during the 1995–1996 agricultural year using a cross-sectional with repeated-measures design. Women were at high risk for micronutrient deficiencies (calcium, iron, riboflavin, and vitamin B12) due to low intakes of animal products. Two distinct constructs rep-resenting socioeconomic status were identified: modern lifestyle and farming wealth. In multivariate models, farming wealth was associated with quality of women’s diet (animal protein adjusted for energy, p = 0.01). Diet quality, in turn, was positively associated with anthro-pometric status (p = 0.02). Women over the age of 50 weighed approximately 3.7 kg less than younger women and consumed less energy (300 kcal) and micronutrients (p < 0.05). Age was positively associated with respiratory morbidity (p = 0.01). These findings, while directly relevant
to a specific context, suggest the need for cross-cultural stud-ies to identify the extent of, and factors contributing to, the risk of nutritional inadequacy in postreproductive women in developing countries.
Key words: Ecuador, Andean, nutrition, micronutri-ents, women, socioeconomic status
Introduction
The harsh environmental and economic conditions faced by small-scale farming households in develop-ing countries often lead to marked food insecurity and malnutrition.The impacts on children are well docu-mented, with inadequate nutrient intake, high rates of infant morbidity and mortality, and compromised linear growth among the outcomes reported. Less well studied is the nutritional status of rural adults, par-ticularly those beyond their reproductive years, as they are frequently excluded by sampling protocols focused on young children. Women, in particular, are at risk, as their multiple roles exact a heavy nutritional toll. Gender biases in food distribution and access to health services compound these strains [1, 2] and may become more pronounced as women move beyond their repro-ductive years. Valuable insights into the true extent of rural poverty and food insecurity may be gained by better documenting the nutritional status of women.
An agricultural project in Highland Ecuador pro-vided a model context to study the nutrition of rural women. Data were collected in 1995 and 1996 as part of a larger study of the impact of the reintroduction of an indigenous crop (quinoa) to the farming system. Drought, freezing temperatures, soil erosion, and mal-nutrition characterize this region. Among children, 52% of those under five years of age are stunted, and approximately 25% suffer from riboflavin and iron deficiencies [3, 4].
The specific objectives of this study were to establish
Ecuadorian Andean women’s nutrition varies with age and socioeconomic status
Barbara Macdonald is affiliated with Multilateral Pro-grammes Branch, Canadian International Development Agency (CIDA) in Gatineau, Quebec, Canada. Timothy Johns and Katherine Gray-Donald are affiliated with the School of Dietetics and Human Nutrition at McGill University in Ste. Anne de Bellevue, Quebec, Canada. Olivier Receveur is affili-ated with the Department of Nutrition, Faculty of Medicine, University of Montreal, Montreal, Quebec, Canada.
Please address queries to the corresponding author: Bar-bara Macdonald, Multilateral Programmes Branch, Canadian International Development Agency (CIDA), 200 Promenade du Portage, Gatineau, Quebec, Canada, K1A 0G4; e-mail: [email protected].
This study was conducted at McGill University and formed part of the corresponding author’s doctoral research.
Support for this study was provided by the International Development Research Centre (IDRC, Ottawa) and the Eco-research Programme of the Canadian Government.
Mention of the names of firms and commercial products does not imply endorsement by the United Nations University.
Barbara Macdonald, Timothy Johns, Katherine Gray-Donald, and Olivier Receveur

240 241
the adequacy of diet and anthropometric status among Ecuadorian women residing in an Andean rural setting, including those of advanced age; and to apply multivar-iate analyses and determine the strength of associations between socioeconomic status and women’s nutritional status in this population.
Materials and methods
Study design, sampling, and research team
Anthropometry, repeated 24-hour dietary recalls, and agricultural and socioeconomic surveys were conducted in the province of Chimborazo (2,400 to 4,000 m above sea level) over four study rounds timed to cover the pre- and post-quinoa-harvest seasons. In order to participate in the study, households had to maintain their principal residence in the community and own less than 10 hectares of land. The sample comprised all quinoa producers in three communities as well as a randomly selected group of non-quinoa producers. Because of the small size of the communi-ties, sampling resulted in a near-census of households. Only one woman from each household was studied. The nonresponse rate was 14%, and the final sample con-sisted of 104 households. Of those 104 households, 91 provided dietary data over both seasons (12.5% were lost to follow-up), and 63 provided anthropometric data. There were no differences in level of education or socioeconomic status between women who completed the study and those lost to follow-up (data not shown).
The research team consisted of four indigenous women from the region, a local university-trained nutritionist, and the corresponding author. All data were collected in the local language, Quichua, and then translated into Spanish.
Dietary assessment
Dietary intake was assessed with four nonconsecu-tive 24-hour recalls covering both seasons. We asked the female head of the household to recall all foods and beverages consumed during the previous day. Common-pot eating predominates in this region, so research assistants obtained full ingredient lists including portion sizes from the subjects. For meals consumed away from home, the subjects recalled as many ingredients as possible, and standardized recipes were applied. Serving sizes were estimated with stand-ard-sized cups, bowls, and spoons, and local foods were weighed to improve the precision of the estimates.
In addition to absolute nutrient intakes, the ratio of energy intake to basal metabolic rate (physical activity level or PAL) was calculated to estimate energy ade-quacy and to determine the extent of under- or over-reporting in the dietary intake data [5, 6]. The basal
metabolic rate was calculated for each woman apply-ing age and weight-specific equations presented by the Food and Agriculture Organization/World Health Organization/United Nations University (FAO/WHO/UNU) [5]. If a woman’s actual weight was unavailable, her weight was estimated by taking the average weight of women of the same age.
Anthropometric methods
Anthropometric measurements included height, weight, mid-upper-arm circumference (MUAC), and triceps skinfold thickness. Arm fat area (AFA) and arm muscle area (AMA) were calculated according to formulas in Frisancho [7]. Shorr height measuring boards (Shorr Corporation, Olney, MD, USA), a Seca electronic balance (Seca Corporation, Columbia, MD, USA), nonstretch-able plastic measuring tapes for arm circumference, and Lange calipers (Cambridge Scientific, Cambridge, MA, USA) were utilized. All measurements were made in trip-licate in accordance with standardized methods [8, 9]. The subjects removed the majority of their clothing, with the remaining items recorded and sample items repre-senting jewellery and clothing weighed and subtracted from the measures.
Household socioeconomic and health variables
Household socioeconomic and health variables were measured with gender-disaggregated questionnaires and direct observation of assets both at baseline (preharvest) and postharvest. The survey tools were pretested with 20 families not participating in the study. Male respondents provided data on age, sex, formal and informal education of household members, occupa-tion, water supply, human waste and garbage disposal, ownership of durable goods, landholdings, and land in cultivation. The female head of the household provided details on her occupation, morbidity, and household use of health services. Housing characteristics, latrine ownership, and water supply were determined by direct observation.
Morbidity was determined by recall. The women reported the occurrence, severity, and duration of five symptoms characteristic of gastrointestinal or respi-ratory illness during the previous two weeks. These symptoms were diarrhea, fever, vomiting, cough, and difficulty breathing.
Data entry and analysis
Questionnaire and anthropometric data were entered by a single clerk into the Epi Info 6 program, Version 6.02 [10]. All data were reviewed twice to ensure cor-rect coding. Dietary recall data were entered similarly and analyzed with an Ecuadorian food-composition database created with the Worldfood Dietary Assess-
B. Macdonald et al. Ecuadorian Andean women’s nutrition
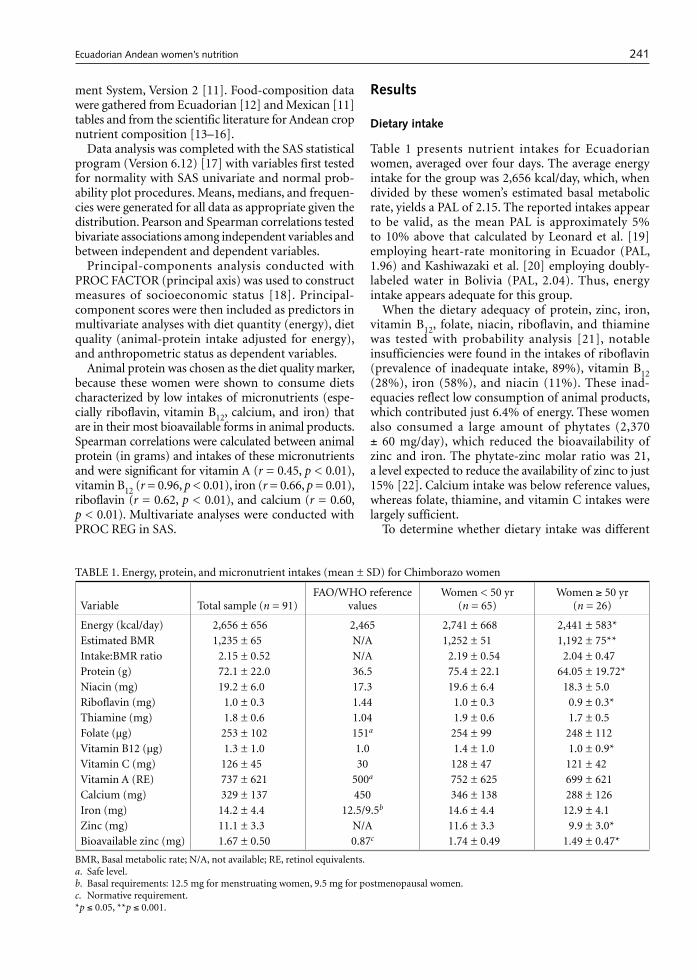
240 241
ment System, Version 2 [11]. Food-composition data were gathered from Ecuadorian [12] and Mexican [11] tables and from the scientific literature for Andean crop nutrient composition [13–16].
Data analysis was completed with the SAS statistical program (Version 6.12) [17] with variables first tested for normality with SAS univariate and normal prob-ability plot procedures. Means, medians, and frequen-cies were generated for all data as appropriate given the distribution. Pearson and Spearman correlations tested bivariate associations among independent variables and between independent and dependent variables.
Principal-components analysis conducted with PROC FACTOR (principal axis) was used to construct measures of socioeconomic status [18]. Principal-component scores were then included as predictors in multivariate analyses with diet quantity (energy), diet quality (animal-protein intake adjusted for energy), and anthropometric status as dependent variables.
Animal protein was chosen as the diet quality marker, because these women were shown to consume diets characterized by low intakes of micronutrients (espe-cially riboflavin, vitamin B12, calcium, and iron) that are in their most bioavailable forms in animal products. Spearman correlations were calculated between animal protein (in grams) and intakes of these micronutrients and were significant for vitamin A (r = 0.45, p < 0.01), vitamin B12 (r = 0.96, p < 0.01), iron (r = 0.66, p = 0.01), riboflavin (r = 0.62, p < 0.01), and calcium (r = 0.60, p < 0.01). Multivariate analyses were conducted with PROC REG in SAS.
Results
Dietary intake
Table 1 presents nutrient intakes for Ecuadorian women, averaged over four days. The average energy intake for the group was 2,656 kcal/day, which, when divided by these women’s estimated basal metabolic rate, yields a PAL of 2.15. The reported intakes appear to be valid, as the mean PAL is approximately 5% to 10% above that calculated by Leonard et al. [19] employing heart-rate monitoring in Ecuador (PAL, 1.96) and Kashiwazaki et al. [20] employing doubly-labeled water in Bolivia (PAL, 2.04). Thus, energy intake appears adequate for this group.
When the dietary adequacy of protein, zinc, iron, vitamin B12, folate, niacin, riboflavin, and thiamine was tested with probability analysis [21], notable insufficiencies were found in the intakes of riboflavin (prevalence of inadequate intake, 89%), vitamin B12 (28%), iron (58%), and niacin (11%). These inad-equacies reflect low consumption of animal products, which contributed just 6.4% of energy. These women also consumed a large amount of phytates (2,370 ± 60 mg/day), which reduced the bioavailability of zinc and iron. The phytate-zinc molar ratio was 21, a level expected to reduce the availability of zinc to just 15% [22]. Calcium intake was below reference values, whereas folate, thiamine, and vitamin C intakes were largely sufficient.
To determine whether dietary intake was different
TABLE 1. Energy, protein, and micronutrient intakes (mean ± SD) for Chimborazo women
Variable Total sample (n = 91)FAO/WHO reference
valuesWomen < 50 yr
(n = 65)Women ≥ 50 yr
(n = 26)
Energy (kcal/day) 2,656 ± 656 2,465 2,741 ± 668 2,441 ± 583*Estimated BMR 1,235 ± 65 N/A 1,252 ± 51 1,192 ± 75**Intake:BMR ratio 2.15 ± 0.52 N/A 2.19 ± 0.54 2.04 ± 0.47Protein (g) 72.1 ± 22.0 36.5 75.4 ± 22.1 64.05 ± 19.72*Niacin (mg) 19.2 ± 6.0 17.3 19.6 ± 6.4 18.3 ± 5.0Riboflavin (mg) 1.0 ± 0.3 1.44 1.0 ± 0.3 0.9 ± 0.3*Thiamine (mg) 1.8 ± 0.6 1.04 1.9 ± 0.6 1.7 ± 0.5Folate (µg) 253 ± 102 151a 254 ± 99 248 ± 112Vitamin B12 (µg) 1.3 ± 1.0 1.0 1.4 ± 1.0 1.0 ± 0.9*Vitamin C (mg) 126 ± 45 30 128 ± 47 121 ± 42Vitamin A (RE) 737 ± 621 500a 752 ± 625 699 ± 621Calcium (mg) 329 ± 137 450 346 ± 138 288 ± 126Iron (mg) 14.2 ± 4.4 12.5/9.5b 14.6 ± 4.4 12.9 ± 4.1Zinc (mg) 11.1 ± 3.3 N/A 11.6 ± 3.3 9.9 ± 3.0*Bioavailable zinc (mg) 1.67 ± 0.50 0.87c 1.74 ± 0.49 1.49 ± 0.47*
BMR, Basal metabolic rate; N/A, not available; RE, retinol equivalents.a. Safe level.b. Basal requirements: 12.5 mg for menstruating women, 9.5 mg for postmenopausal women.c. Normative requirement.*p ≤ 0.05, **p ≤ 0.001.
B. Macdonald et al. Ecuadorian Andean women’s nutrition

242 243
among women in their postreproductive years, we cal-culated the mean nutrient intakes for women below and above 50 years of age. Estimated energy and protein intakes differed between the two age groups, with the younger women consuming approximately 300 kcal/day more than the older women. The older women maintained an acceptable PAL at this lower intake (2.04), but only because their weight was lower. In line with the energy results, older women had lower absolute intakes of riboflavin, vitamin B12, calcium (p = 0.07), and zinc. The results of age group tests repeated for micronutrient intakes adjusted for energy were not significant, indicating that older women ate less food, but not different foods, than their younger counterparts.
Anthropometric status
Table 2 presents data on mean height, weight, and body mass index (BMI) according to age category. Six pregnant or lactating women were excluded from the analysis, resulting in a sample size of 57 with a mean age of 41.5 years.
At first glance, these values reflect the typical short Andean physique [19, 23, 24]. The mean heights for all age categories fall below 150 cm, but at an average of 22.52, the BMIs for these women indicate maintenance of a “normal” weight for that height.
Classification of BMI distribution according to the World Health Organization (WHO) criteria [25] showed little evidence of protein/energy stress, with
80% of the sample falling within the normal range of 18.5 to 25. Only one woman (aged 55 years) out of 57 (1.8%) was “thin”; in addition, with no BMI found to be higher than 30, obesity was a minimal problem. Interpretation requires caution, however, as South American populations possess short legs relative to body length and may have higher BMIs for weight than European and Indo-Mediterranean populations [25]. Sitting height was not measured, disallowing correc-tions to BMI based on the Cormic Index [26].
Consistent with the dietary data, older women (50 years and older) weighed 3.7 kg less than younger women and had a lower BMI. MUAC, triceps skinfold thickness, and the calculated indices of AFA and AMA [7] pre-sented in table 3 aid in pinpointing the source of weight differences. Although the data cannot be extrapolated to account for the composition of the entire body, arm fat stores were lower in the women over 50.
Morbidity
Spearman correlations showed a positive association between age and the number of days ill with respira-tory symptoms (r = 0.36, p = 0.01), indicating increased respiratory morbidity among the older women. Close to one-half of the women studied reported days ill with respiratory symptoms, and Spearman correlations showed a negative association with MUAC (r = –0.27, p = 0.05). Vomiting and diarrhea failed to correlate with any of the anthropometric indicators.
Socioeconomic effects
Principal-components analysis was used to reduce redundancy among the many socioeconomic vari-ables measured. This technique reduces several corre-lated variables to a few independent components that account for a significant proportion of the variation in the original data set [27].
Table 4 presents the two socioeconomic compo-nents identified and the individual factor loadings for the 13 socioeconomic variables analyzed. Eigenvalues, the scree test, and interpretability were applied in the selection of components to be retained. Factor load-
TABLE 2. Height, weight, and body mass index (BMI) of Chim-borazo women (mean ± SD)
Age (yr)
n Height (m) Weight (kg) BMI (kg/m2)
20–29 10 1.48 ± 0.04 49.4 ± 5.5a x22.6 ± 1.6ab
30–39 18 1.48 ± 0.07 50.8 ± 6.7a 23.1 ± 2.2b
40–49 11 1.44 ± 0.05 49.4 ± 6.3a 23.6 ± 2.3b
≥ 50 18 1.47 ± 0.05 45.7 ± 5.3b 21.2 ± 2.0a
Total 57 1.47 ± 0.05 48.7 ± 6.2x 22.5 ± 2.2x
a,b. Means with different superscript letters are significantly different (p ≤ 0.05).
TABLE 3. Mid-upper-arm measurements and related indices of Chimborazo women (mean ± SD)
Age (yr) naTriceps skinfold thickness (mm) MUAC (cm) AMA (cm2) AFA (cm2)
20–29 9 10.1 ± 2.2b 25.7 ± 1.2b 34.0 ± 4.8 12.1 ± 2.5b
30–39 17 12.4 ± 3.1c 26.4 ± 2.1b 34.2 ± 7.0 15.3 ± 4.0c
40–49 10 11.5 ± 3.4bc 25.0 ± 2.5bc 30.2 ± 7.6 13.5 ± 4.4bc
≥ 50 17 8.4 ± 3.0d** 24.3 ± 2.4c* 31.2 ± 6.1 9.9 ± 3.8d**
Total 53 10.6 ± 3.4 25.4 ± 2.3 32.4 ± 6.6 12.7 ± 4.3
MUAC, Mid-upper-arm circumference; AMA, arm muscle area; AFA, arm fat area. a. The sample size was reduced from 57 to 53 because four women refused to have arm measurements made.b–d. Means with different superscript letters are significantly different (*p ≤ 0.05, **p ≤ 0.01).
B. Macdonald et al. Ecuadorian Andean women’s nutrition

242 243
ings are bivariate correlations between the variable and the component. A factor loading greater than 0.40 is deemed large. An eigenvalue is the amount of original variance in the data accounted for by a component. A scree test plots eigenvalues to identify natural separations between components with high and low eigenvalues. Principal-components analysis stand-ardizes variables (mean = 0, standard deviation = 1). A component with an eigenvalue <1 accounts for less variance than an individual variable and is normally not retained for further analysis [27].
Although four components had eigenvalues greater than 1 and jointly explained 66% of the variance, the scree appeared to begin after the second component, with the third and fourth components difficult to interpret. Thus, only the first two components, which jointly explained 50% of the variance in the original variables, were retained.
Nine of the 13 variables had large loadings for com-ponent 1, which accounted for 30.6% of the variance. These variables are marked with asterisks in table 4 and include possession of small durable goods and improved housing materials, forming a construct that may be described as “modern lifestyle” [28, 29]. Com-ponent 2 represents the construct of “farming wealth” and accounted for 16.7% of the variance in the original variables. Variables with large loadings for this com-ponent included land ownership, land in cultivation during the study year, and small livestock. When the
principal-components analysis was performed, some variables originally measured were dropped because they did not load on the retained components or they loaded on both components. These included work migration patterns and ownership of radios, vehicles, back-pack sprayers, sheep, swine, horses, and mules. Variables that do not load clearly on components are often removed from an analysis [27]. Total income loaded equally on both components and was therefore dropped.
Bivariate correlations calculated between these components and age and education demonstrated significant potential for confounding (data not shown). Specifically, women’s age was negatively associated with both education (r = –0.56, p < 0.001) and modern life-style (r = –0.29, p = 0.006). An inverse relationship between age and literacy has been reported previously in these communities [30] and may be due to a secu-lar trend in access to education. Therefore, to reduce collinearity, education was excluded in multivariate models as it is important to retain age in nutritional analyses.
Table 5 presents models demonstrating the relation-ships between the socioeconomic constructs (adjusted for age) and women’s nutrition. The socioeconomic variables, especially farming wealth, were positively associated with diet quality (animal-protein intake adjusted for energy), but not with diet quantity (energy). For anthropometry, the only significant model was for AFA, with a trend towards larger fat stores with increased modern lifestyle.
The question remains whether diet quality is related to anthropometric status. Multivariate models pre-sented in table 6 demonstrate that animal protein (adjusted for energy) is indeed a predictor of BMI, MUAC, and AFA when adjusted for age. Adjusted for age, each additional gram of animal protein per 1,000 kcal consumed was associated with a 0.19 kg/m2
increase in BMI, a 0.25 cm increase in MUAC, and a 35.8 mm2 increase in AFA. In addition, of particular interest to nutritionists, when the components were included in these models, the effect of animal protein remained significant, while the socioeconomic compo-nents did not (data not shown). Therefore, animal-pro-tein intake is not likely to be acting merely as a proxy for socioeconomic status in this population.
Discussion
Despite the pivotal role played by women in household production and reproduction, their nutritional status has been largely neglected as a serious topic of study.
The high probabilities of inadequate micronutri-ent intakes among rural Ecuadorian women reported here illustrate the situation facing women and children worldwide. Micronutrient deficiencies place women at
TABLE 4. Principal-components analysis of socioeconomic markers in the Ecuadorian Andes (N = 89)
Variable
Component 1 “modern lifestyle”
Component 2 “farming wealth”
Roof material (straw, zinc, eternit)
39* –180
Floor material (earth, wood, cement)
66* –140
Wall material (adobe, cement/brick)
48* –300
Stoves (no.) 70* 9Furniture (no. of pieces) 80* 10Bicycles (no.) 63* 24Stereos (no.) 65* –9Television sets (no.) 67* –3Blenders (no.) 80* 0Land (hectares owned) –150 78*Land in cultivation
1995–96 (hectares)–4 85*
Fowl (no. owned) 26 52*Guinea pigs (no. owned) 17 59*Eigenvalue 3.985 2.161Cumulative variance
explained0.306 0.473
* Large factor loading.
B. Macdonald et al. Ecuadorian Andean women’s nutrition

244 245
high risk of anemias, compromised immunocompe-tence, and, for those of childbearing age, maternal mortality [31]. High rates of micronutrient deficiencies among women also place infants at risk both pre- and postpartum, and the lethargy associated with anemias and mild energy insufficiency may compromise mater-nal caring capacity and labor productivity.
Although a broad literature now details inadequate micronutrient intakes among Latin American children, including Ecuadorians [4, 32–35], similar high-quality data describing women’s intake in the Andes are limited. In fact, only Kim et al. [33] and Berti et al. [32] provide information for Bolivia and Ecuador, respectively. Kim et al. [33] observed low intakes of calcium and vitamin A relative to Bolivian recommended intakes. Similar to our findings, Berti et al. [32] reported inadequate intakes of calcium, vitamin A, riboflavin, and vitamin B12. More recently, in a Mexican sample, more than one-third of women of reproductive age had low fer-ritin, hemoglobin, and plasma B12 values [36].
A number of the micronutrients found to be lacking in the diet (riboflavin, iron, calcium, and vitamin B12) are found in the highest amounts and most bioavailable form in animal products. The low intake of these foods (approximately 6% of total energy) among this popu-lation confirms other reports from Ecuador, where the contribution of animal products to total energy intake ranged from 5% to 7.7% [37, 38]. Animal-
product intake is a significant predictor of child size in Ecuador* and Mexico [39]. The demonstrated association between animal-protein intake (adjusted for energy and socioeconomic status) and increased anthropometric status in adult women is a novel contribution of the present study. As with children, it may be hypothesized that the high protein quality and micronutrient bioavailability associated with animal products may help to maintain women’s health.
The interpretation of the adequacy of anthropo-metric stores among these women is less clear-cut. When compared with WHO references for BMI, these women appear to be largely normal. Yet, when com-pared with elite women in developing countries [40], these women have a lower mean BMI (22.5 compared with 24.1). In addition, when these findings are com-pared with those from similar Andean populations, the values for BMI and triceps skinfold thickness fall closer to those published for Peru and Bolivia 15 to 20 years ago (BMI, 22.8 to 23.7; triceps skinfold thickness, 9.8 mm) than to values reported more recently from the Ecuadorian Andes (BMI, 25.6 to 26.1; triceps skinfold thickness, 17.3 mm) [19, 23, 24, 38].
TABLE 5. Multivariate models of Chimborazo women’s nutrition
Variable
Energy (kcal) (n = 85a)Animal protein
(g/1,000 kcal) (n = 85) AFA (mm2) (n = 47)
β-Coefficient Prob > T β-Coefficient Prob > T β-Coefficient Prob > T
Intercept 2,914.96 < 0.01 7.59 < 0.01 1,557.29 < 0.01Woman’s age (yr) –8.20 0.09 –0.11 0.10 –7.53 0.11Modern lifestyle (standardized)
27.70 0.70 1.99 0.11 137.30 0.07
Farming wealth (standardized)
33.97 0.59 2.62 0.01 45.59 0.45
p value 0.30 < 0.01 0.04R2 0.04 0.14 0.17
AFA, Arm fat area.a. The sample size was reduced because four households did not have an adult female.
TABLE 6. Multivariate models demonstrating the effect of diet quality on Chimborazo women’s anthropometric status
Variable
BMI (kg/m2) (n = 51) MUAC (cm) (n = 47) AFA (mm2) (n = 47)
β-Coefficient Prob > T β-Coefficient Prob > T β-Coefficient Prob > T
Intercept 22.94 < 0.01 24.68 < 0.01 1,409.47 < 0.01Woman’s age (yr) –0.04 0.09 –0.02 0.39 –8.86 0.05Animal protein
(g/1,000 kcal) 0.19 0.03 0.25 0.01 35.79 0.04
p value 0.02 0.02 0.01R2 0.16 0.17 0.18
BMI, Body mass index; MUAC, mid-upper-arm circumference; AFA, arm fat area.
* Leonard WR, Dewalt KM, Stansbury J, McCaston MK. Biocultural determinants of nutritional status and growth failure in rural Ecuador. Paper presented at the symposium: Biocultural models: a coming of age. Atlanta, Ga, USA: American Anthropological Association Meetings, 1994.
B. Macdonald et al. Ecuadorian Andean women’s nutrition

244 245
In terms of socioeconomic predictors, the principal-components analysis demonstrated that indicators that are often used interchangeably to denote socioeconomic status measured two distinct constructs: modern life-style and farming wealth. The distinction between these markers has also been identified by Weismantel [28], Bindon and Vitzthum [29], and DeWalt et al. [41], the latter authors referring to a scale similar to the modern lifestyle as the “material style of life.” The important implication for nutritionists is that both of these con-structs must be measured and included in models to fully understand the role of socioeconomic status. In addition, the correlations among predictors demon-strated here underline the importance of adjusting the commonly measured variable of women’s education for age and socioeconomic markers [29, 42, 43].
The impacts of economic variables have been pre-viously studied mainly in relation to the nutritional status of children. The positive effects of education and literacy on children’s diet and growth are frequently reported [39, 44], and education has also been found to covary with adult females’ anthropometric status in Kenya and Mexico [35]. In line with our results, Boliv-ian women’s anthropometry was reported to be asso-ciated with modern lifestyle but not with traditional farming lifestyle [29]. As noted by Bindon and Vitz-thum [29], in addition to being a potential marker of wealth, modern lifestyle may signal less active exercise patterns, a concern given the increasing documentation of obesity among women in Latin America [45].
The age-associated effects merit further considera-tion. In this population, women in their postreproduc-tive years consumed less food, had lower fat stores, and spent more days ill with respiratory symptoms than younger women. Similar age-related trends have been reported in Papua New Guinea, India, Ethiopia, Zim-babwe, Brazil, and Congo [46–49]. In the Collaborative Research Support Program on Nutrition and Human Function (NCRSP) studies, age was positively associ-ated with BMI in Mexican and Egyptian women but not in Kenyan women [35]. In North America, contrary to the present results, this stage of the life cycle (50 to 65 years) is associated with an increase in fat stores and a decrease in lean body mass and bone density, body composition changes that are associated with such health problems as osteoporosis and sarcopenia.
So, although age seems to be linked to body composi-tion, the changes may depend very much on locale and lifestyle, with little information available to guide the interpretation of “adequate stores.” Notably, in the present near-census sample of the study communities, no woman was more than 66 years old, suggesting limited survival beyond this stage of life.
The cross-sectional nature of these data leaves the etiology of the lower stores in the Andean postrepro-ductive women unclear. The respiratory symptoms may have resulted in anorexia and thinness, a plausible argument given the existence of tuberculosis in these communities and the practice of cooking over smoky fires. However, energy intake:expenditure imbalance is also a tenable explanation. Energy expenditure may still be high at this age, as these women remain responsible for farm and domestic chores, the cost of which may be compounded by the absence of child labor in post-reproductive households.
Conclusions
The present study highlighted variation in access to a high-quality diet by women living in rural communi-ties in the Ecuadorian highlands. Despite consuming a diet largely adequate in energy and protein, the popula-tion showed a marked prevalence of inadequate intake of many micronutrients. In line with data demonstrat-ing compromised dietary quality, the economic data showed that Ecuadorian Highland families chose to consume more animal products, as opposed to more energy, as their socioeconomic status increased. This change in dietary quality was in turn positively associ-ated with women’s anthropometric measurements in this resource-poor environment.
The observation that older women consumed less food, had lower fat stores, and experienced greater respiratory morbidity, while directly relevant to this specific Andean context, suggests a need for extended cross-cultural studies of the nutritional and health status of postreproductive women. Comparisons among developing countries and with countries in Europe and North America could explore why women in this age group eat less and the factors that appear to put them at risk.
B. Macdonald et al. Ecuadorian Andean women’s nutrition

246 247
References
1. McGuire JS, Popkin BM. Helping women improve nutrition in the developing world: beating the zero sum game. World Bank Technical Paper 114. Washing-ton, DC: World Bank, 1990.
2. Ojanuga DN, Gilbert C. Women’s access to health care in developing countries. Soc Sci Med 1992;35:613–7.
3. Freire WB, Bacallao J, Carrasco F. Desnutrición y condi-ciones socioeconomicas en el Ecuador. Quito, Ecuador: CONADE/UNICEF/OPS/OMS, 1992.
4. Freire WB, Dirren H, Mora JO, Arenales P, Granda E, Breilh J, Campaña A, Paéz R, Darquea L, Molina E. Diagnostico de la situación alimentaria, nutricional y de salud de la población Ecuatoriana menor de cinco años. Quito, Ecuador: CONADE/Ministerio de Salud Publica, 1988.
5. Food and Agriculture Organization/World Health Organization/United Nations University. Energy and protein requirements. WHO Technical Report Series 724. Geneva: World Health Organization, 1985.
6. Goldberg GR, Black AE, Jebb SA, Cole TJ, Murgatroyd PR, Coward WA. Critical evaluation of energy intake data using fundamental principles of energy physiology. 1. Derivation of cut-off limits to identify under-record-ing. Eur J Clin Nutr 1991;45:569–81.
7. Frisancho AR. Anthropometric standards for the assess-ment of growth and nutritional status. Ann Arbor, Mich, USA: University of Michigan Press, 1990.
8. Lohman TG, Roche AF, Martorell R, eds. Anthropomet-ric standardization reference manual. Champaign, Ill, USA: Human Kinetics Books, 1991.
9. Gibson RS. Principles of nutritional assessment. New York: Oxford University Press, 1990.
10. Centers for Disease Control and Prevention/World Health Organization. Epi Info 6 (Version 6.02). Geneva: World Health Organization, 1994.
11. University of California at Berkeley. Worldfood. Ver-sion 2. Berkeley, Calif, USA: Regents of the University of California, 1996.
12. Ministerio de Salud Pública del Ecuador. Tabla de com-posición química de los alimentos ecuatorianos. Quito, Ecuador: Instituto de Investigaciones Nutricionales y Médico Sociales, División de Investigaciones Operativas y Organización Panamericana de la Salud, 1988.
13. Koziol MJ. Composición química. In: Wahli C, ed. Quinua: hacia su cultivo comercial. Quito, Ecuador: Latinreco S.A., 1990.
14. Ruales Nájera J. Development of an infant food from quinoa (Chenopodium quinoa Willd): technological aspects and nutritional consequences. Lund, Sweden: University of Lund, 1992.
15. Galwey NW, Leakey CLA, Price KR, Fenwick GR. Chemical composition and nutritional characteristics of quinoa (Chenopodium quinoa Willd). Food Sci Nutr 1990;42F:245–61.
16. Gross R, Koch F, Malaga I, de Miranda AF, Schoeneberger H, Trugo LC. Chemical composition and protein quality of some local Andean food sources. Food Chem 1989;34:25–34.
17. SAS Institute. SAS Version 6.12. Cary, NC, USA: SAS Institute, 1996.
18. Kleinbaum DG, Kupper LL, Muller KE. Applied regres-sion analysis and other multivariable methods, 2nd ed. Boston, Mass, USA: PWS-Kent, 1988.
19. Leonard WR, Katzmarzyk PT, Stephen MA, Ross AG. Comparison of the heart rate-monitoring and factorial methods: assessment of energy expenditure in high-land and coastal Ecuadoreans. Am J Clin Nutr 1995;61:1146–52.
20. Kashiwazaki H, Dejima Y, Orias-Rivera J, Coward WA. Energy expenditure determined by the doubly labeled water method in Bolivian Aymara living in a high alti-tude agropastoral community. Am J Clin Nutr 1995;62:901–10.
21. National Research Council (Subcommittee on Criteria for Dietary Evaluation, Committee on Evaluation of Food Consumption Surveys, Food and Nutrition Board, Commission on Life Sciences). Nutrient adequacy: assessment using food consumption surveys. Washing-ton, DC: National Academy Press, 1986.
22. Murphy SP, Beaton GH, Calloway DH. Estimated mineral intakes of toddlers: predicted prevalence of inadequacy in village populations in Egypt, Kenya and Mexico. Am J Clin Nutr 1992;56:565–72.
23. Frisancho AR, Borkan GA, Klayman JE. Pattern of growth of lowland and highland Peruvian Quechua of similar genetic composition. Hum Biol 1975;47:233–43.
24. Mueller WH, Murillo F, Palamino H, Badzioch M, Chakraborty R, Fuerst P, Schull WJ. The Aymara of western Bolivia: V. Growth and development in an hypoxic environment. Hum Biol 1980;52:529–46.
25. World Health Organization. Physical status: the use and interpretation of anthropometry. WHO Technical Report Series 854. Geneva: World Health Organization, 1995.
26. Collins S, Duffield A, Myatt M. Assessment of nutri-tional status in emergency-affected populations: adults. Geneva: Administrative Committee on Coordination, Subcommittee on Nutrition, 2000.
27. Hatcher L, Stepanski EJ. A step-by-step approach to using the SAS system for univariate and multivariate statistics. Cary, NC, USA: SAS Institute, 1994.
28. Weismantel MJ. Food, gender, and poverty in the Ecuadorian Andes. Philadelphia, Pa, USA: University of Pennsylvania Press, 1988.
29. Bindon JR, Vitzthum VJ. Household economic strategies and nutritional anthropometry of women in American Samoa and highland Bolivia. Soc Sci Med 2002;54:1299–1308.
30. Nieto Cabrera C, Vimos Naranjo C. Agroindustrial ICU: un módelo de empresa de gestión campesina-indígena. Quito, Ecuador: Instituto Nacional Autónomo de Inves-tigaciones Agropecuarias, 1995.
31. Gillespie S. Major issues in the control of iron deficiency. Ottawa, Canada: Micronutrient Initiative/UNICEF, 1998.
32. Berti PR, Leonard WR, Berti WJ. Malnutrition in rural highland Ecuador: the importance of intrahousehold food distribution, diet composition, and nutrient requirements. Food Nutr Bull 1997;18:352–362.
B. Macdonald et al. Ecuadorian Andean women’s nutrition

246 247
33. Kim SW, Kashiwazaki H, Imai H, Moji K, Orias-Rivera J. Food consumption and energy expenditure of Aymara in a herding community of the Bolivian Altiplano. J Hum Ergol 1991;20:181–197.
34. Brown KH. The importance of dietary quality versus quantity for weanlings in less developed countries: a framework for discussion. Food Nutr Bull 1991;13:86–94.
35. Calloway DH, Murphy S, Balderston J, Receveur O, Lein D, Hudes M. Village nutrition in Egypt, Kenya and Mexico: looking across the CRSP projects. Final Report to the US Agency for International Development. Ber-keley, Calif, USA: University of California, 1992.
36. Backstrand JR, Allen LH, Black AK, de Mata M, Pelto GH. Diet and iron status of nonpregnant women in rural Central Mexico. Am J Clin Nutr 2002;76:156–164.
37. Leonard WR, DeWalt KM, Uquillas JE, DeWalt BR. Ecological correlates of dietary consumption and nutri-tional status in highland and coastal Ecuador. Ecol Food Nutr 1993;31:67–85.
38. Berti PR. Dietary adequacy and its relationship to anthropometric status in a highland Ecuadorian com-munity. Doctoral Dissertation, University of Guelph, Guelph, Ontario, Canada, 1996.
39. Allen LH, Backstrand JR, Stanek EJ III, Pelto GH, Chávez A, Molina E, Castillo JB, Mata A. The interactive effects of dietary quality on the growth and attained size of young Mexican children. Am J Clin Nutr 1992;56:353–64.
40. Nestel P, Rutstein S. Defining nutritional status of women in developing countries. Public Health Nutr 2002;5:17–27.
41. DeWalt KM, DeWalt BR, Escudero JC, Barkin D. Shifts from maize to sorghum production: nutrition effects in four Mexican communities. Food Policy 1990;15:395–407.
42. Desai S, Alva S. Maternal education and child health: Is there a strong causal relationship? Demography 1998;35:71–81.
43. Behrman JR. Household behavior and micronutrients: what we know and what we don’t know. IFPRI Working Papers on Agricultural Strategies for Micronutrients 2. Washington, DC: International Food Policy Research Institute, 1995.
44. Franklin DL, Harrell MW. Resource allocation decisions in low-income households. Food Policy 1985;10:100-8.
45. Martorell R, Kettel Khan L, Hughes ML, Grummer-Strawn LM. Obesity in women from developing coun-tries. Eur J Clin Nutr 2000;54:247–52.
46. Norgan NG. Body mass index and body energy stores in developing countries. Eur J Clin Nutr 1990;44(supp1 1):S79–84.
47. Allain TJ, Wilson AO, Gomo ZA, Adamchak DJ, Matenga JA. Diet and nutritional status in elderly Zimbabweans. Age Ageing 1997;26:463–70.
48. de Vasconcellos MTL. Body mass index: its relationship with food consumption and socioeconomic variables in Brazil. Eur J Clin Nutr 1994;48(suppl 3):S115–23.
49. Delpeuch F, Cornu A, Massamba JP, Traissac P, Maire B. Is body mass index sensitively related to socio-economic status and economic adjustment? A case study from the Congo. Eur J Clin Nutr 1994;48(suppl 3):S141–7.
B. Macdonald et al. Ecuadorian Andean women’s nutrition

248 Food and Nutrition Bulletin, vol. 25, no. 3 © 2004, The United Nations University.
249
Abstract
The purpose of this survey was to explore the relation-ship between the prevalence of the health indicators of malnutrition, diarrhea, and acute respiratory infection and the consumption of vitamin A–rich food and the sup-plementation status of three groups of children in Nepal (supplemented, supplemented only once, and never sup-plemented). A trained female community health worker interviewed mothers about vitamin A–rich food feeding practices to children aged 6 to 60 months using a stand-ardized questionnaire and then estimated the nutritional status of the children using mid-upper-arm circumference measurements and recording the incidence of diarrhea and acute respiratory infection from mothers’ interviews. Regardless of the amount of vitamin A–rich foods con-sumed, children who were regularly supplemented with high doses of vitamin A were protected against malnutri-tion, diarrhea, and acute respiratory infection at a higher rate than children who were supplemented only once or were never supplemented. Regularly providing a high-dose (200,000 IU) capsule of vitamin A to children aged 6 to 60 months, including those who eat vitamin A–rich foods, may be effective in decreasing the prevalence of morbidity from malnutrition, diarrhea, and acute res-piratory infection.
Key words: Carotenoids, child health, Nepal, retinol, vitamin A plant and animal food sources, vitamin A supplementation
Introduction
Increasing vitamin A intake among children deficient in that vitamin through diet or supplementation is an important component of comprehensive child-survival programs [1]. Most families in Nepal do not have a vegetable garden, and those who do tend to cultivate vegetables with a low vitamin A content. However, vitamin A–rich foods, such as green leafy vegetables and yellow fruits, are generally available and are found in abundance in most of Nepal.
Animal food sources of vitamin A are available but limited in Nepal because of cultural and finan-cial constraints. Studies have shown that low dietary intakes of vitamin A (both plant and animal) may be related to a variety of reasons: low socioeconomic status, traditional food beliefs and practices, household food-distribution patterns, maternal education, and the fact that young children often are not fed green leafy vegetables [2–4].
The diet in Nepal consists of white rice, a variety of lentils, and a small amount of seasonal vegetables. Most Nepalese eat only two meals a day, but in the morning they will typically have sweet milk tea and fried dough or biscuits. The two “real” meals consist of rice, lentils, and vegetables. In the higher elevations where rice does not grow, potatoes and barley are substituted. Meat is either prohibitively expensive or not eaten for religious reasons. Most Nepalese are therefore restricted to a veg-etarian diet for financial reasons.
In Nepal, dark-green leafy vegetables are often considered low-status foods [4]; therefore, even with access to this rich source of β-carotene, mothers may not feed this food to their children. Also, poor hygiene practices in the household, infections, malnutrition, and a low intake of animal food, which is an excellent source of retinol, all contribute to vitamin A deficiency disease [4–6].
Vitamin A occurs as retinol (preformed vitamin A) in animal sources of food [7]. Although food high in retinol may be available, it is expensive and sporadically
Children aged 6 to 60 months in Nepal may require a vitamin A supplement regardless of dietary intake from plant and animal food sources
The author is affiliated with the Texas Woman’s University College of Nursing-Houston Center, Houston, Texas, USA.
Please direct queries to the author: Ruth B. Grube-sic, Texas Woman’s University, College of Nursing, 1130 John Freeman Blvd., Houston, TX 77030, USA; e-mail: [email protected].
Mention of the names of firms or commercial products does not imply endorsement by the United Nations University.
Vitamin A consumption in children
Ruth B. Grubesic
248 Food and Nutrition Bulletin, vol. 25, no. 3 © 2004, The United Nations University.
249
consumed by vulnerable populations [8]. In some cul-tures, including that of Nepal, it is not currently feasible to recommend increasing the consumption of animal products because of socioeconomic, religious, and cultural constraints [3, 9].
Provitamin A carotenoids (from plant sources) account for 60% to 70% of vitamin A intake, espe-cially in southeast Asia, Africa, and the western Pacific [2]. Whereas preformed retinol from animal sources (eggs, milk, cheese, liver, and fish oils) is assumed to be 70% to 90% bioavailable when consumed in normal amounts, provitamin A carotenoids are less bioavail-able. Only about 16% of the β-carotene contained in the provitamin A carotenoids of food is absorbed and converted to retinol [10]. To obtain 1 µg of retinol equivalent (RE) from food, 6 µg of β-carotene (provi-tamin A) or 12 µg of other provitamin A carotenoids must be consumed. Some research studies have indi-cated that the conversion factor is even higher. One study showed that the amount of β-carotene required to obtain 1 µg RE was 26 µg if it was obtained from dark-green leafy vegetables and 12 µg if it was obtained from yellow or orange fruits [11].* A safe daily require-ment for vitamin A consumption in children aged 1 to 10 years is 350 to 375 µg RE, with a basal requirement of at least 200 µg RE [10].
This paper addresses vitamin A supplementation and consumption of vitamin A–rich foods (both plant and animal sources) by children 6 to 60 months of age in two districts of Nepal. We examine how the consump-tion of vitamin A–rich plant and animal foods affected rates of malnutrition, diarrhea, and acute respiratory infection in supplemented, supplemented only once, and never-supplemented children.
Methods
A cross-sectional survey was conducted during June and July 2000 in the mid-hills of Nepal. Children 6 to 60 months of age and their mothers comprised the study group. The study was conducted in Doti and Dhading Districts. Children in Doti received regular vitamin A supplementation. Children in Dhading either received supplementation only once or were never supplemented. Thus, there were three groups of subjects: supplemented (Doti), supplemented once (Dhading), and never supplemented (Dhading).
Within each district, the village leader selected vil-lage development committees (VDCs) from areas that were safe enough for fieldwork. (Maoist rebel groups were active in some areas of Nepal at the time.) A VDC is a cluster of up to nine wards composed of a certain number of villages determined by geographic structure and population size. VDC leaders provided lists of villages located within each VDC. The research team visited all listed villages (n = 83) from 43 wards in 8 VDCs selecting a probability sample of households with children aged 6 to 60 months. Households were sampled using a systematic sampling technique by dividing the number of households in the village by 12 and visiting every nth household until 12 children aged 6 to 59 months from each village were sampled. Some villages were too small to allow collection of data on 12 children.
In Doti District, all children in sampled households who had been supplemented with vitamin A capsules during the National Vitamin A Program were included in the study. No cases of never-supplemented children were found in this district.
In Dhading District, all children in sampled house-holds who had not been supplemented were included in the study. Children were excluded if they had been supplemented in the past six months. In this district during polio National Immunization Days (NID) in November 1999, some children received a vitamin A capsule, but it is unclear who decided which children would be the recipients of these capsules. The children who received this vitamin A capsule during the NID were included in the study as a separate group (sup-plemented only once), since the vitamin A capsule was administered more than six months prior to our field-work. Supplementation status within each household was determined by the mother’s report (the mother stated if the child received a vitamin A capsule during the NID).
The children came from 304 households in 40 vil-lages in Doti and 283 households from 43 villages in Dhading. More than one child was included per household if the mother had several children between 6 to 60 months of age. However, to allow for some heterogeneity in the sample, only one child from each of three different age groups (6–18, 19–38, and 39–60 months) was included per household. Of the total sample of 876 children, 587 (67%) came from house-holds with one child, 271 (31%) from households with two children, and only 18 (2%) from households with three children.
Socioeconomic status was determined by the father’s occupation. These included farmer (on own land or another person’s land), India servant/worker (works in India as a taxi driver, house servant, hotel worker, etc.), service occupations (goldsmith, coppersmith, tailor, radio repairman, bank teller, brickmaker, car-penter, construction worker, cycle maker, machine
* As a result of recent research findings, there are currently two units quantifying vitamin A activity in foods, Both refer to 1 μg of all-trans-retinol (vitamin A). The retinol equivalent (RE) is defined as equivalent to 6 μg of dietary all-trans-β-carotene. The more recently recommended retinol activity equivalent (RAE) is defined as equivalent to 12 μg of dietary all-trans-β-carotene. Current food-composition research may still use the 6:1 ratio, because that is what is available in food-composition tables.
Vitamin A consumption in children
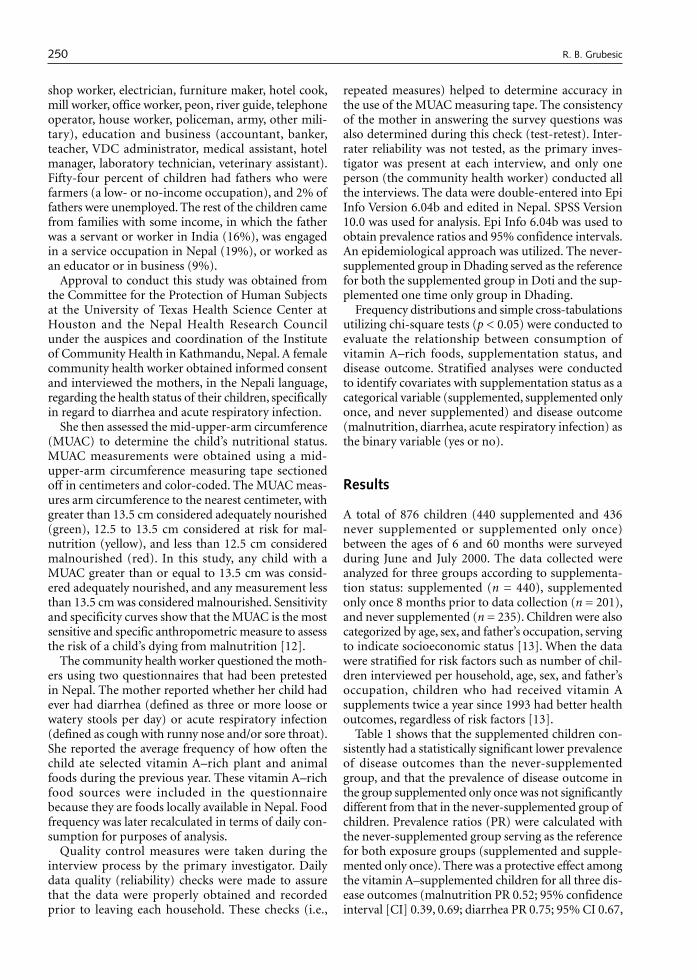
250 251
shop worker, electrician, furniture maker, hotel cook, mill worker, office worker, peon, river guide, telephone operator, house worker, policeman, army, other mili-tary), education and business (accountant, banker, teacher, VDC administrator, medical assistant, hotel manager, laboratory technician, veterinary assistant). Fifty-four percent of children had fathers who were farmers (a low- or no-income occupation), and 2% of fathers were unemployed. The rest of the children came from families with some income, in which the father was a servant or worker in India (16%), was engaged in a service occupation in Nepal (19%), or worked as an educator or in business (9%).
Approval to conduct this study was obtained from the Committee for the Protection of Human Subjects at the University of Texas Health Science Center at Houston and the Nepal Health Research Council under the auspices and coordination of the Institute of Community Health in Kathmandu, Nepal. A female community health worker obtained informed consent and interviewed the mothers, in the Nepali language, regarding the health status of their children, specifically in regard to diarrhea and acute respiratory infection.
She then assessed the mid-upper-arm circumference (MUAC) to determine the child’s nutritional status. MUAC measurements were obtained using a mid-upper-arm circumference measuring tape sectioned off in centimeters and color-coded. The MUAC meas-ures arm circumference to the nearest centimeter, with greater than 13.5 cm considered adequately nourished (green), 12.5 to 13.5 cm considered at risk for mal-nutrition (yellow), and less than 12.5 cm considered malnourished (red). In this study, any child with a MUAC greater than or equal to 13.5 cm was consid-ered adequately nourished, and any measurement less than 13.5 cm was considered malnourished. Sensitivity and specificity curves show that the MUAC is the most sensitive and specific anthropometric measure to assess the risk of a child’s dying from malnutrition [12].
The community health worker questioned the moth-ers using two questionnaires that had been pretested in Nepal. The mother reported whether her child had ever had diarrhea (defined as three or more loose or watery stools per day) or acute respiratory infection (defined as cough with runny nose and/or sore throat). She reported the average frequency of how often the child ate selected vitamin A–rich plant and animal foods during the previous year. These vitamin A–rich food sources were included in the questionnaire because they are foods locally available in Nepal. Food frequency was later recalculated in terms of daily con-sumption for purposes of analysis.
Quality control measures were taken during the interview process by the primary investigator. Daily data quality (reliability) checks were made to assure that the data were properly obtained and recorded prior to leaving each household. These checks (i.e.,
repeated measures) helped to determine accuracy in the use of the MUAC measuring tape. The consistency of the mother in answering the survey questions was also determined during this check (test-retest). Inter-rater reliability was not tested, as the primary inves-tigator was present at each interview, and only one person (the community health worker) conducted all the interviews. The data were double-entered into Epi Info Version 6.04b and edited in Nepal. SPSS Version 10.0 was used for analysis. Epi Info 6.04b was used to obtain prevalence ratios and 95% confidence intervals. An epidemiological approach was utilized. The never-supplemented group in Dhading served as the reference for both the supplemented group in Doti and the sup-plemented one time only group in Dhading.
Frequency distributions and simple cross-tabulations utilizing chi-square tests (p < 0.05) were conducted to evaluate the relationship between consumption of vitamin A–rich foods, supplementation status, and disease outcome. Stratified analyses were conducted to identify covariates with supplementation status as a categorical variable (supplemented, supplemented only once, and never supplemented) and disease outcome (malnutrition, diarrhea, acute respiratory infection) as the binary variable (yes or no).
Results
A total of 876 children (440 supplemented and 436 never supplemented or supplemented only once) between the ages of 6 and 60 months were surveyed during June and July 2000. The data collected were analyzed for three groups according to supplementa-tion status: supplemented (n = 440), supplemented only once 8 months prior to data collection (n = 201), and never supplemented (n = 235). Children were also categorized by age, sex, and father’s occupation, serving to indicate socioeconomic status [13]. When the data were stratified for risk factors such as number of chil-dren interviewed per household, age, sex, and father’s occupation, children who had received vitamin A supplements twice a year since 1993 had better health outcomes, regardless of risk factors [13].
Table 1 shows that the supplemented children con-sistently had a statistically significant lower prevalence of disease outcomes than the never-supplemented group, and that the prevalence of disease outcome in the group supplemented only once was not significantly different from that in the never-supplemented group of children. Prevalence ratios (PR) were calculated with the never-supplemented group serving as the reference for both exposure groups (supplemented and supple-mented only once). There was a protective effect among the vitamin A–supplemented children for all three dis-ease outcomes (malnutrition PR 0.52; 95% confidence interval [CI] 0.39, 0.69; diarrhea PR 0.75; 95% CI 0.67,
R. B. Grubesic Vitamin A consumption in children

250 251
0.83; acute respiratory infection PR 0.60; 95% CI 0.53, 0.69). In the supplemented only once group, there was a significant protective effect for malnutrition (PR 0.68; 95% CI 0.49, 0.94), but not for diarrhea (PR 0.94; 95% CI 0.84, 1.05) or acute respiratory infection (PR 1.03; 95% CI 0.92, 1.16). The small number of cases pre-cluded analysis for protein-energy malnutrition, kwashiorkor, or marasmus (table 1). Diagnosis of these conditions was determined during the interview when the mother was shown a photograph of children with the condition and asked if her child had ever had the condition (yes, no, or don’t know).
The mothers reported the frequency of feeding green leafy vegetables, pumpkin, coriander, dried pepper, mango, papaya, milk, ghee (milkfat), meat or fish, and eggs to their children. Data were obtained for average frequency of feeding when the food item was available (many sources are available only seasonally).
According to mothers’ reports, only 13.6% of sup-plemented children in Doti ate more than 3 vitamin A–rich plant sources daily (table 2) and only 10% ate more than 3 vitamin A–rich animal food sources daily (table 3). In Dhading, more children in the supple-mented only once group consumed vitamin A–rich foods more than 3 times daily (23.4% for plant sources; 27.9% for animal sources) than children in the never-supplemented group (20.4% for plant sources; 24.3% for animal sources) (tables 2 and 3).
A higher percentage of supplemented children (18.9%) never consumed animal sources of vitamin A compared with supplemented only once (2.5%) and never supplemented children (6%) (table 3). Measure-ments were not obtained for amount per serving for each source consumed by the child.
Comparisons were made of the daily number of vitamin A–rich foods consumed by children and sup-plementation status by disease outcome to determine any differences between these groups of children dif-ferentiating plant sources (table 2) from animal sources (table 3). Children in the supplemented group, in general, had significantly lower prevalence of all three
disease outcomes than children in the unsupplemented group (never supplemented or supplemented once only), regardless of their consumption volume of vitamin A–rich plant or animal foods. Children who never consumed vitamin A–rich food sources had a higher prevalence of malnutrition regardless of their supplementation status; for example, the prevalence of malnutrition among supplemented children who never consumed vitamin A–rich plant sources was 35.6%, compared with a prevalence of 10% for sup-plemented children who consumed more than 3 plant sources of vitamin A daily. A similar pattern occurs for vitamin A–rich animal sources. This was not the case for diarrhea and acute respiratory infection. The amount of vitamin A–rich plant food consumed did not make a consistent difference in the health outcomes of diarrhea or acute respiratory infection in any of the consumption categories. A child who ate more than 3 vitamin A–rich foods from either plant or animal sources was just as likely to have diarrhea or acute respiratory infection as a child who consumed no vitamin A–rich foods. There were also no significant differences between the supplemented one-time-only and the never-supplemented groups (tables 2 and 3).
Discussion
The Ministry of Health in Nepal initiated a National Vitamin A Program in 1993. This program provides high-dose (200,000 IU as retinyl palmitate) capsule supplementation to reduce child mortality and mor-bidity related to vitamin A deficiency.
Supplementation is provided twice a year, once in April at the time when food stores are diminished and measles incidence is high, and again in October prior to the rice harvest. The dates are fixed, which facilitates yearly planning. Female community health volunteers distribute the capsules in their individual communities to all children under the age of five years during the two-day supplementation campaign. Capsule cover-
TABLE 1. Prevalence of common childhood diseases in children aged 6 to 60 months in Nepal, June and July 2000, according to supplementation status of children
Disease
Supplemented (Doti) (n = 440)Supplemented 1 time only
(Dhading) (n = 201)Never supplemented (Dhading)a (n = 235)
% PR 95% CI % PR 95% CI % PR
Malnourished 16.6 0.52 0.39–0.69 21.7 0.68 0.49–0.94 32.0 1.00Protein-energy
malnutrition 1.4 0.12 0.05–0.32 15.4 1.65 0.99–2.75 9.4 1.00
Kwashiorkor 0.5 0.05 0.01–0.20 14.4 1.50 0.88–2.52 9.4 1.00Marasmus 0.2 0.53 0.03–8.50 2.0 4.60 0.53–41.51 0.4 1.00Diarrhea 57.0 0.75 0.67–0.83 71.6 0.94 0.84–1.05 75.3 1.00ARI 43.4 0.60 0.53–0.69 74.6 1.03 0.92–1.16 72.3 1.00
PR, Prevalence ratio; CI, confidence interval; ARI, acute respiratory infection.a. Reference group.
R. B. Grubesic Vitamin A consumption in children
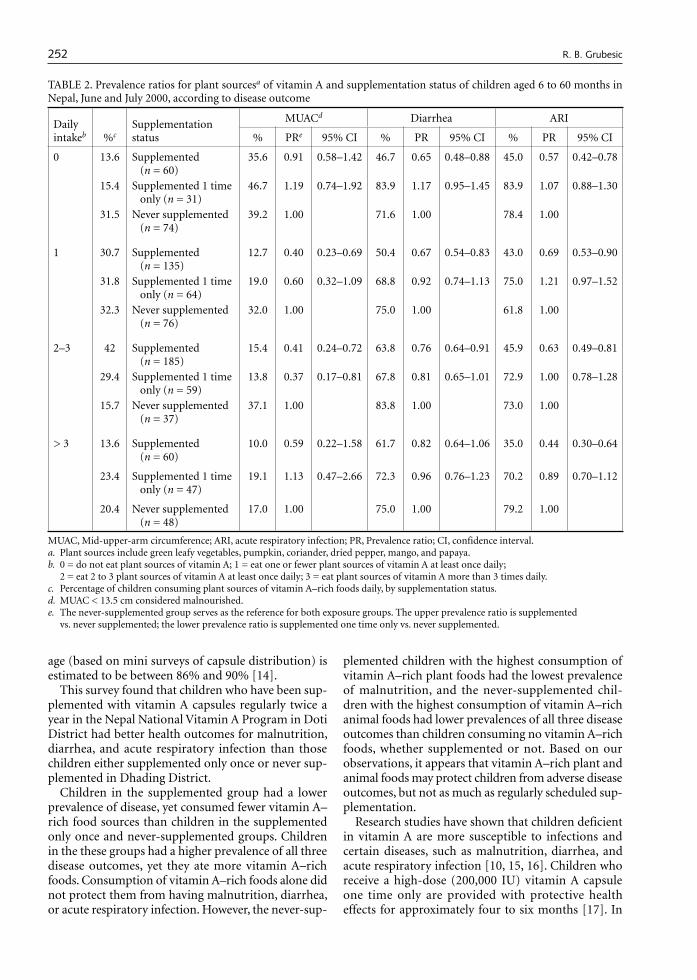
252 253
age (based on mini surveys of capsule distribution) is estimated to be between 86% and 90% [14].
This survey found that children who have been sup-plemented with vitamin A capsules regularly twice a year in the Nepal National Vitamin A Program in Doti District had better health outcomes for malnutrition, diarrhea, and acute respiratory infection than those children either supplemented only once or never sup-plemented in Dhading District.
Children in the supplemented group had a lower prevalence of disease, yet consumed fewer vitamin A–rich food sources than children in the supplemented only once and never-supplemented groups. Children in the these groups had a higher prevalence of all three disease outcomes, yet they ate more vitamin A–rich foods. Consumption of vitamin A–rich foods alone did not protect them from having malnutrition, diarrhea, or acute respiratory infection. However, the never-sup-
plemented children with the highest consumption of vitamin A–rich plant foods had the lowest prevalence of malnutrition, and the never-supplemented chil-dren with the highest consumption of vitamin A–rich animal foods had lower prevalences of all three disease outcomes than children consuming no vitamin A–rich foods, whether supplemented or not. Based on our observations, it appears that vitamin A–rich plant and animal foods may protect children from adverse disease outcomes, but not as much as regularly scheduled sup-plementation.
Research studies have shown that children deficient in vitamin A are more susceptible to infections and certain diseases, such as malnutrition, diarrhea, and acute respiratory infection [10, 15, 16]. Children who receive a high-dose (200,000 IU) vitamin A capsule one time only are provided with protective health effects for approximately four to six months [17]. In
TABLE 2. Prevalence ratios for plant sourcesa of vitamin A and supplementation status of children aged 6 to 60 months in Nepal, June and July 2000, according to disease outcome
Daily intakeb %c
Supplementation status
MUACd Diarrhea ARI
% PRe 95% CI % PR 95% CI % PR 95% CI
0 13.6 Supplemented (n = 60)
35.6 0.91 0.58–1.42 46.7 0.65 0.48–0.88 45.0 0.57 0.42–0.78
15.4 Supplemented 1 time only (n = 31)
46.7 1.19 0.74–1.92 83.9 1.17 0.95–1.45 83.9 1.07 0.88–1.30
31.5 Never supplemented (n = 74)
39.2 1.00 71.6 1.00 78.4 1.00
1 30.7 Supplemented (n = 135)
12.7 0.40 0.23–0.69 50.4 0.67 0.54–0.83 43.0 0.69 0.53–0.90
31.8 Supplemented 1 time only (n = 64)
19.0 0.60 0.32–1.09 68.8 0.92 0.74–1.13 75.0 1.21 0.97–1.52
32.3 Never supplemented (n = 76)
32.0 1.00 75.0 1.00 61.8 1.00
2–3 42 Supplemented (n = 185)
15.4 0.41 0.24–0.72 63.8 0.76 0.64–0.91 45.9 0.63 0.49–0.81
29.4 Supplemented 1 time only (n = 59)
13.8 0.37 0.17–0.81 67.8 0.81 0.65–1.01 72.9 1.00 0.78–1.28
15.7 Never supplemented (n = 37)
37.1 1.00 83.8 1.00 73.0 1.00
> 3 13.6 Supplemented (n = 60)
10.0 0.59 0.22–1.58 61.7 0.82 0.64–1.06 35.0 0.44 0.30–0.64
23.4 Supplemented 1 time only (n = 47)
19.1 1.13 0.47–2.66 72.3 0.96 0.76–1.23 70.2 0.89 0.70–1.12
20.4 Never supplemented (n = 48)
17.0 1.00 75.0 1.00 79.2 1.00
MUAC, Mid-upper-arm circumference; ARI, acute respiratory infection; PR, Prevalence ratio; CI, confidence interval.a. Plant sources include green leafy vegetables, pumpkin, coriander, dried pepper, mango, and papaya.b. 0 = do not eat plant sources of vitamin A; 1 = eat one or fewer plant sources of vitamin A at least once daily;
2 = eat 2 to 3 plant sources of vitamin A at least once daily; 3 = eat plant sources of vitamin A more than 3 times daily.c. Percentage of children consuming plant sources of vitamin A–rich foods daily, by supplementation status. d. MUAC < 13.5 cm considered malnourished.e. The never-supplemented group serves as the reference for both exposure groups. The upper prevalence ratio is supplemented
vs. never supplemented; the lower prevalence ratio is supplemented one time only vs. never supplemented.
R. B. Grubesic Vitamin A consumption in children

252 253
the Nepal Micronutrient Status Survey [18], children were found to have an equal chance of having subclini-cal vitamin A deficiency if they were unsupplemented but had adequate dietary intakes of vitamin A or if they were supplemented but lacked adequate dietary intakes of vitamin A–rich foods.
This paper has shown that children from a district with low coverage of vitamin A supplementation with many vegetables available still do not consume enough vitamin A–rich foods to sufficiently protect them from selected disease outcomes. Even those children who received a vitamin A capsule one time only were not as protected as children who received vitamin A on a regular twice-yearly schedule. It does appear that the combination of supplementation with consumption of vitamin A–rich plant foods may provide better protec-tion from malnutrition, and that supplementation with consumption of vitamin A–rich animal food sources may provide better protection from diarrhea. Pre-
school-age children in Nepal still require supplemen-tation on a scheduled twice-yearly regimen, regardless of dietary intake.
Study limitations
This is a descriptive, cross-sectional survey conducted in two mid-hill districts of Nepal. Every effort was made by the researchers to make the samples as homogene-ous as possible between the two districts while allowing for heterogeneity within the villages with respect to the demographics of the children. The findings presented in this study are meant to show associations only, not a cause-and-effect relationship of supplements or diet to disease outcome. Much of the data collected for this survey depended on mothers’ recall during interviews. Mothers were asked to recall how often their children were sick with diarrhea, how often they fed them
TABLE 3. Prevalence ratios for animal sourcesa of vitamin A and supplementation status of children aged 6 to 60 months in Nepal, June and July 2000, according to disease outcome
Daily intakeb %c
Supplementation status
MUACd Diarrhea ARI
% PRe 95% CI % PR 95% CI % PR 95% CI
0 18.9 Supplemented (n = 83)
20.7 0.30 0.17–0.52 60.2 0.70 0.53–0.93 41.0 0.41 0.32–0.53
2.5 Supplemented 1 time only (n = 5)
50.0 0.72 0.25–2.05 40.0 0.47 0.16–1.39 40.0 0.40 0.14–1.17
6 Never supplemented (n = 14)
69.2 1.00 85.7 1.00 100.00 1.00
1 23.6 Supplemented (n = 104)
10.7 0.32 0.17–0.61 54.8 0.67 0.55–0.82 39.4 0.52 0.39–0.67
27.9 Supplemented 1 time only (n = 56)
27.8 0.83 0.49–1.42 76.8 0.94 0.79–1.13 69.6 0.91 0.74–1.12
34.5 Never supplemented (n = 81)
33.3 1.00 81.5 1.00 76.5 1.00
2–3 47.5 Supplemented (n = 209)
19.9 0.79 0.50–1.25 57.9 0.81 0.68–0.97 44.0 0.62 0.50–0.76
41.8 Supplemented 1 time only(n = 84)
20.2 0.80 0.46–1.40 71.4 1.00 0.83–1.22 81.0 1.14 0.96–1.35
35.3 Never supplemented (n = 83)
25.3 1.00 71.1 1.00 71.1 1.00
> 3 10 Supplemented (n = 44)
6.8 0.22 0.07–0.69 52.3 0.74 0.54–1.04 54.5 0.89 0.63–1.25
27.9 Supplemented 1 time only (n = 56)
16.1 0.51 0.25–1.04 69.6 0.99 0.78–1.26 73.2 1.19 0.92–1.55
24.3 Never supplemented (n = 57)
31.6 1.00 70.2 1.00 61.4 1.00
MUAC, Mid-upper-arm circumference; ARI, acute respiratory infection; PR, Prevalence ratio; CI, confidence interval.a. Animal sources include milk, ghee, meat, fish, and eggs. b. 0 = do not eat animal sources of vitamin A; 1 = eat one or fewer animal sources of vitamin A at least once daily;
2 = eat 2 to 3 animal sources of vitamin A at least once daily; 3 = eat animal sources of vitamin A more than 3 times daily.c. Percentage of children consuming animal sources of vitamin A–rich foods daily, by supplementation status.d. MUAC < 13.5 cm considered malnourished.e. The never-supplemented group serves as the reference for both exposure groups. The upper prevalence ratio is supplemented
vs. never supplemented; the lower prevalence ratio is supplemented one time only vs. never supplemented.
R. B. Grubesic Vitamin A consumption in children

254 255
vitamin A–rich foods, and whether their children received vitamin A during NID in November 1999. Data on the mothers’ literacy and educational level were not obtained. According to UNICEF, the adult literacy rate for females is 35% [19]. Literacy levels may help explain why some mothers breastfed longer or fed their children more healthful foods. Data were not obtained on portion size of the foods eaten, only the frequency of vitamin A–rich food sources consumed by the child. There is a possibility of selection bias because children who received vitamin A capsules during NID may have other factors that protect them from disease, for example, it may be that a mother with higher education and literacy levels may be more likely to understand the importance of giving her child a vitamin A capsule during NID. Social status determined by caste in Nepal may also play a role.
Conclusions
These results support continued efforts by the National Vitamin A Program in Nepal to supplement children twice a year with vitamin A capsules. The cost of sup-plementation is minimal compared with the positive health outcome of providing capsule supplementation. Infant and child deaths could be reduced globally by vitamin A supplementation at a distribution cost of less than US$1 per year per child [20]. Vitamin A capsules cost only US$0.02 per capsule [10] (dosed two times per year), and supplementation can result in a 23% decrease in mortality for children between 6 months and 5 years of age [21]. As long as there is funding and there are trained Nepali female community health volunteers who are able to take on the task of distribut-ing the capsules, children should continue to receive vitamin A supplementation twice yearly.
To improve vitamin A status in children, it has been suggested that programs emphasize increasing the production and consumption of locally available carotenoid-rich foods [16], and that promoting dietary change be recommended for combating vitamin A defi-ciency in young children [3, 10]. Research studies have shown that access to home gardening and animals does not always ensure that the diet is sufficient to prevent vitamin A deficiency [4, 22]. An intervention conducted on kindergarten children in China [23] suggested that for effective long-term improvement of vitamin A status, interventions should be food based and started early in life. Vitamin A status did improve in children in the Chinese study who were fed vitamin A–rich foods in school when the type and amount of food consumed was closely monitored. In Bangladesh, mothers who were provided education on the appropriate prepara-tion of vegetables were more likely to feed their chil-
dren vegetables two months post-intervention [10]. These approaches may not be practical in field condi-tions with large populations at risk.
Supplementation with vitamin A capsules reduces morbidity from malnutrition, diarrhea, and acute respiratory infection. It also reduces mortality associ-ated with certain diseases [10]. By the end of the year 2001, the National Vitamin A Program should have supplemented all of the children in Nepal at least once. The health of Nepal’s children depends in part on the efforts of this program. If sustainability of the National Vitamin A Program in Nepal is not feasible for financial or other reasons, the necessity of food-based interventions will be inevitable. Most children in Nepal do not receive vitamin A in sufficient quantities from their diet, for both cultural and financial reasons. More research is needed on dietary approaches that are effective to combat vitamin A deficiency in Nepal. Determining how to implement a food-based interven-tion that will provide adequate amounts of vitamin A in the case that supplementation is no longer feasible is of utmost importance at this time. Efforts made now will assure a smooth transition from supplementation to food-based interventions or provide a complement to supplementation if it is sustained. Over the last few years, there has been an emphasis on improving the diet of populations at risk [24]. Ultimately, this will help provide governments in countries like Nepal with an opportunity to shift away from supplementation and develop a more sustainable approach to improv-ing vitamin A status in vulnerable populations.
Acknowledgments
This work was supported in part by a Parry Research Scholarship Award (for the year 2000) at Texas Wom-an’s University College of Nursing, Houston Center; a New Faculty Development Research Award (year 2000) at Texas Woman’s University; Sigma Theta Tau International (Beta Beta Chapter); the Angeline Newland Educational Fund; the McFarlane Founda-tion; the Gulf Coast Council of Returned Peace Corps Volunteers; my parents, Ronald and Inge Wright; and John Martin. This work could not have been completed in Nepal without the assistance of Dr. Chet Raj Pant at the Institute of Community Health, who sponsored the project; Mr. Bhatta, ophthalmology assistant at the Lumbini Eye Hospital, who collected data on vitamin A deficiency disease; and Hema Joshi, who interviewed the mothers and collected MUAC measurements. I also gratefully acknowledge assistance in editing this manuscript from Dr. B. J. Selwyn and Dr. S. McPher-son at the University of Texas School of Public Health, Houston, Texas.
R. B. Grubesic Vitamin A consumption in children

254 255
References
1. Sommer A. Vitamin A deficiency and childhood mortal-ity. Lancet 1992;339:864.
2. Nalubola R, Nestel P (USAID). The effect of vitamin A nutriture on health: a review. Washington, DC: Interna-tional Life Sciences Institute, 1999.
3. Ramakrishnan U, Martorell R, Latham MC, Abel R. Dietary vitamin A intakes of preschool age children in South India. J Nutr 1999;11:2021–7.
4. Shankar AV, Gittelsohn J, Pradhan EK, Dhungel C, West KP Jr. Home gardening and access to animals in house-holds with xerophthalmic children in rural Nepal. Food Nutr Bull 1998;19:34–41.
5. Khatry SK, West KP, Katz J, LeClerq SC, Pradhan EK, Wuls, Thapa MD, Pokhrel RP. Epidemiology of xeroph-thalmia in Nepal. A pattern of household poverty, child-hood illness, and mortality. The Sarlahi Study Group. Arch Ophthalmol 1995;113:425–9.
6. Global prevalence of vitamin A deficiency. Geneva: World Health Organization, 1995.
7. Thurnham D, Northrop-Clewes CA. Optimal nutrition: vitamin A and the carotenoids. Proc Nutr Soc 1999;58:449–57.
8. Reifen R, Wasantwisut E. Vitamin A in pediatric nutri-tion. Pediatr Adolesc Med 1998;8:122–35.
9. Gibson RS, Hotz C, Temple L, Yeudall F, Mititimuni B, Ferguson E. Dietary strategies to combat deficiencies of iron, zinc, and vitamin A in developing countries: devel-opment, implementation, monitoring and evaluation. Food Nutr Bull 2000;21:219–31.
10. Sommer A, West KP. Vitamin A deficiency: health, sur-vival and vision. New York: Oxford University Press, 1996.
11. de Pee S, West CE. Dietary carotenoids and their role in combating vitamin A deficiency: a review of the litera-ture. Eur J Clin Nutr 1996;50:38–53.
12. Briend A. Using anthropometry to identify children with a high risk of dying. Indian Pediatr 1988;25:930–8.
13. Grubesic R. Vitamin A supplementation and health out-comes for children in Nepal. J Nursing Scholarship 2003;35:1,15–20.
14. AMRIT. The Nepal National Vitamin A Program. Kath-mandu: Ministry of Health, Department of Health Serv-
ices, Child Health Division, Nutrition Section, 1997.15. WHO. Indicators for assessing vitamin A deficiency and
their application in monitoring and evaluating interven-tion programmes. Geneva: Bibliothèque, OMS, WHO Library, 1996.
16. OMNI-Brief 1. Can foods rich in provitamin A caro-tenoids provide adequate vitamin A for human needs? Summary of a workshop jointly organized by the Micro-nutrient Initiative and OMNI, 1995.
17. Goodman T, Dalmiya N, de Benoist B, Schultink W. Polio as a platform: using national immunization days to deliver vitamin A supplements. Bull World Health Organ 2000;78:305–14.
18. Nepal Micronutrient Status Survey. Kathmandu, Nepal: Ministry of Health Child Health Division, His Majesty’s Government Nepal, New Era, Micronutrient Initiative, UNICEF Nepal, World Health Organization, 1998.
19. UNICEF. The state of the world’s children 2000. New York: UNICEF, 2000.
20. USAID. Vitamin A Programs, 1996. http://www.usaid.gov/our_work/global_health/mch/ch/techareas/vita_brief.html. Accessed 30 June 2004.
21. Beaton GH, Martorell R, L’Abbe KA, Edmonston B, McCabe G, Ross AC, Harvey B. Effectiveness of Vitamin A supplementation in the control of young child morbidity and mortality in developing countries. ACC/SCN state-of-the-art series. Nutrition policy dis-cussion paper 13. Toronto, Ont.: International Nutri-tion Program, Dept. of Nutritional Sciences, Faculty of Medicine, University of Toronto, 1993.
22. Vijayaraghavan KM, Nayak MU, Bamji MS, Ramana GNV, Reddy V. Home gardening for combating vitamin A deficiency in rural India. Food Nutr Bull 1997;18:337–43.
23. Tang G, Gu X, Hu S, Xu Q, Qin J, Dolnikowski G, Fjeld C, Gao X, Russell R, Yin S. Green and yellow vegetables can maintain body stores of vitamin A in Chinese chil-dren. Am J Clin Nutr 1999;70:1069–76.
24. Bloem MW, de Pee S, Darnton-Hill I. New issues in developing effective approaches for the prevention and control of vitamin A deficiency. Lancet 1998;19:137–48.
R. B. Grubesic Vitamin A consumption in children

256 Food and Nutrition Bulletin, vol. 25, no. 3 © 2004, The United Nations University.
257
Abstract
Vitamin A deficiency remains a significant health risk in developing countries, affecting infants and children in particular. To counter child malnutrition, mothers are encouraged to breastfeed to ensure that their children receive adequate macro- and micronutrients, including vitamin A. However, this assumes that the mother has sufficient vitamin A intake to provide enough vitamin A to her child. This study investigates maternal and infant intakes of locally available foods of high vitamin A content in a rural agricultural community in Kenya. The study aims to establish the community risk for vitamin A deficiency and to assess whether breast milk is adequate to maintain and build retinol reserves of the breastfed infant. The study assesses 62 mother-child pairs and employs several methods to support its objectives, including the Helen Keller International food-frequency survey, maternal and infant anthropometric measure-ments, and maternal breast-milk and blood samples to determine breast-milk and serum retinol levels. We found that mothers with marginal (< 0.700 µmol/l) serum retinol and breast-milk deficient (< 1.05 µmol/l) in retinol accounted for 45.2% and 77.4%, of our sample, respectively. A significant (p < 0.05) proportion (40.3%) of mothers had breast milk deficient in retinol and marginal levels of serum retinol. The risk of vitamin A deficiency in breastfed infants older than six months was high, because 89.5% of them did not consume foods high in vitamin A content three times weekly. The primary source of vitamin A for infants younger than six months
was breast-milk deficient in retinol vitamin A. This study suggests that in this rural community, breastfed infants may not receive appropriate foods with high vitamin A content and that although exclusive breastfeeding is advo-cated, most breast milk is deficient in retinol, further heightening the risk of vitamin A deficiency.
Key words: Breast-milk retinol, dark-green leafy veg-etables, lactation, serum retinol, vitamin A deficiency
Introduction
Vitamin A deficiency remains a significant public health problem, with an estimated 250 million children at risk worldwide [1]. Lack of data from developing countries limits the ability of governments and policy makers to quantify the magnitude of the problem in women and preschool-age children [2, 3]. In healthy populations, less than 5% have subclinical deficiency, defined as serum retinol < 0.70 µmol/l [4]. There are concerns that a high prevalence of marginal vitamin A status may contribute to the etiology of anemia in women [5, 6]. Hemoglobin response to iron supple-mentation is suppressed in those found to be deficient in vitamin A [7]. Vitamin A–deficient lactating women have been reported to produce inadequate vitamin A in breast milk to maintain and build body reserves in their rapidly growing infants [4, 8]. The consequences of vitamin A deficiency in preschool-age children include increased severity of some infections [9] and an increased risk of death [10]. In populations with vitamin A deficiency, improvement in vitamin A status has reduced infant mortality rates by about 23% [11].
All infants are born with low stores of vitamin A and depend on vitamin A–rich breast milk to initially accu-mulate and maintain adequate stores until complemen-tary foods provide significant additional amounts of vitamin A, in keeping with the growing child’s increas-ing requirements. Breast-milk vitamin A concentration is therefore considered a unique indicator of maternal
Consumption of vitamin A by breastfeeding children in rural Kenya
Grace Ettyang and Aggrey Oloo are affiliated with the Faculty of Health Sciences, Moi University, Eldoret, Kenya. Wauter van Marken Lichtenbelt and Wim Saris are affiliated with the Department of Human Biology, Maastricht Univer-sity, Maastricht, The Netherlands.
Please direct queries to the corresponding author: Ms Grace Adisa Ettyang, Department of Human Nutrition, Fac-ulty of Health Sciences, Moi University, PO Box 4606, Eldoret, Kenya; e-mail: [email protected].
Mention of the names of firms and commercial products does not imply endorsement by the United Nations University.
Vitamin A consumption of breastfeeding children
Grace Ettyang, Aggrey Oloo, Wauter van Marken Lichtenbelt, and Wim Saris

256 Food and Nutrition Bulletin, vol. 25, no. 3 © 2004, The United Nations University.
257
and infant vitamin A status [12]. Most retinol in breast milk is in the form of retinyl esters and is related to the fat content of breast milk [4, 7]. Breast-milk proximate composition is relatively stable during the period from one to eight months postpartum, and its vitamin A concentration depends on maternal food intake. When diets are adequate in vitamin A, average breast-milk concentrations for vitamin A range from 1.75 to 2.45 µmol/l [13], and few mothers have breast-milk values under 1.05 µmol/l [4, 13]. In this ideal situation, breast milk is likely to be the major source of dietary vitamin A for the infant, with complementary foods contributing little if any additional amount [4].
Breast milk is not a sensitive indicator for predicting the risk of clinical vitamin A deficiency [4]. In surveys to assess whether vitamin A deficiency is a public health problem, breast-milk data need to be supported by nutritional status and diet-related indicators [4]. In situations in which precise weighing of food intake is not feasible, general eating habits are easier to remember and are therefore more reliably reported than specific quantities of foods [4]. The Helen Keller International food-frequency questionnaire is simple and often used to identify communities at risk for low intake of vitamin A [4, 14]. The method has been validated against serum retinol in Tanzania [15]. The questionnaire allows for incorporation of locally avail-able key plant and animal foods that contain at least 100 retinol equivalents (RE) per 100 g. In view of the new knowledge on the relative efficiency of carotenoids in meeting recommended vitamin A intakes, these REs may be updated in the future [16]. The seven-day food-frequency method captures eating patterns during the course of an entire week.
In vitamin A–deficient women, the immediate ben-efits of vitamin A supplementation are not in dispute and include improvements in the vitamin A status of the breastfed infant [7, 17] and in maternal iron status [18]. However, supplementation alone does not improve overall community consumption patterns for foods of high vitamin A content. Developing countries with a high prevalence of vitamin A deficiency are faced with the challenge of finding community-based alter-natives to single-nutrient supplementation [18]. The documented evidence on links between nutritional status at different stages of the life cycle [2] demands sustained, long-term solutions. A starting point is col-lection of data critical for identifying rural communities and vulnerable groups at risk for vitamin A deficiency [4]. Kenya has a scarcity of data on the vitamin A status of rural communities. The objectives of this investiga-tion were therefore to determine whether, in a rural Kenyan agricultural community, infants and lactating women were at risk for low intake of vitamin A and whether maternal breast-milk vitamin A concentration was adequate to maintain and build body reserves of the breastfed infants.
Materials and methods
Study area
This cross-sectional, population-based survey was carried out in Kokwet, a rural community located in Nandi District, between December 1998 and Janu-ary 1999. This is the end of the short rains and the beginning of the dry season that ends around March, when the long rains begin. Approval for the research was obtained from both the Moi Ethical and Research Committee and the Government of Kenya. The nearest health center to Kokwet is 7 km away, and it provides health services to a catchment area with an estimated 5,000 households. Kokwet, with its seven villages, falls within this catchment area. The community engages in extensive large-scale maize farming. Due to the climate and zone, the maize crop planted in March and April is not harvested until October and November. The majority of farmers also keep dairy cattle. For many years, both maize and milk were important sources of income for families. This income has become more volatile because of fluctuations in maize prices and lib-eralization of the milk market. Traditional dark-green leafy vegetables are grown in every homestead and are abundant during the rainy season. Fruits, though not commonly grown, are seasonal and available at reason-able prices from the weekly local market.
Design and subjects
A register of lactating women in the seven Kokwet villages was compiled with the help of the assistant chief and the village elders. With a relative precision of 50%, we required a minimum sample size of 47 moth-ers for an anticipated prevalence range of 15% to 45% breast milk ≤ 1.05 µmol/l (≤ 8 µg/g milkfat) [4]. In the sampling strategy we used the seven villages of Kokwet as clusters. The number of lactating women in each cluster was recorded, and a maximum of 12 lactating women were selected from each cluster. A total of 88 lactating women between the ages of 15 and 45 years, with their breastfeeding infants aged between 2 weeks and 15 months, were identified to participate in the survey. The women received a detailed explanation of the objectives and procedures of the study and gave consent to participate in the study.
Anthropometric measurements, breastfeeding pat-terns, and intake of key plant and animal sources of vitamin A were recorded for all of the women; how-ever, 15 declined to provide blood and breast milk out of fear that the researchers would use the samples to test for HIV. At the time of data collection, the stigma attached to a positive HIV/AIDS status was very high. For this vitamin A intake survey, 11 infants aged < 2 months were excluded. This avoided collection of high-colostrum breast-milk samples and ensured inclusion
Vitamin A consumption of breastfeeding children

258 259
of the period when supplementary feeding was intro-duced to the breastfed infant. Sixty-two mother-infant pairs met this criterion and provided complete data. Of this group, 48 had infants aged 6 months and older. None of the women in this study received vitamin A supplementation.
Anthropometry and collection of blood and breast milk
Maternal body weight was measured to the nearest 50 g with an electronic scale (Seca) and height to the nearest 0.1 cm with a height meter. The body-mass index (BMI) was computed as the weight in kilograms divided by the square of the height in meters. Mid-upper-arm circumference (MUAC) measurements were also taken. The infant’s body weight was measured to the nearest 50 g with a baby-weighing scale, and height was measured with a height meter. A single investigator recorded all of the measurements. Collections of 5-ml samples of serum were drawn and divided into two tubes, with and without anticoagulant. The samples were stored on ice for transportation to the laboratory. Serum was separated from the blood by centrifugation at approximately 2,000 RPM for 15 minutes at room temperature on arrival, and the samples were stored at –70oC until they were analyzed for serum retinol. Milk was collected during the day from a single breast that had not been used to feed the infant for at least one hour [12]. The mothers used manual expression to collect 10 to 15 ml of breast milk. The breast milk was stored in foiled glass bottles and transported to the laboratory in a cool box with ice packs. Two aliquots were frozen at –70°C, and analysis was carried out within one year of breast-milk collection.
Maternal and infant intake of key vitamin A foods
A questionnaire was used to collect data on breast-feeding patterns. Through observation, focus group discussions, and a rapid survey of the foods available at the local markets, locally available key plant and animal sources of vitamin A were then identified. Of the maximum 28 food items recommended for inclu-sion in the Helen Keller International food-frequency questionnaire, 11 were replaced by locally available substitutes. The selected substitute foods contained at least 100 retinol equivalents (RE) of vitamin A per 100 g [14, 15]. The modifications resulted in a food-frequency questionnaire based on locally available key plant and animal sources of vitamin A.*
The survey’s primary question asked for the number of times a given food item had been consumed during the previous seven days. The survey sought to deter-mine the frequency of consumption of vitamin A–containing food by the Nandi lactating women and their breastfed infants by using qualitative questions. The numbers of days on which dark-green leafy vegetables, yellow fruits and vegetables, and foods of animal origin were consumed were thus determined. A master table adapted to the locally available key plant and animal sources of vitamin A was used to analyze the data. From this table, the frequency of consumption of each category of food was calculated [4, 14, 15].
The community risk for vitamin A deficiency was based on a group of nutrition- and diet-related indicators suggested by the World Health Organiza-tion (WHO) [4]. Based on infant nutritional status [< –2 SD WHO/National Center for Health Statistics (NCHS) growth references], the risk of vitamin A deficiency was present if the prevalence of HAZ < –2 SD (stunting) was ≥ 30% or WHZ < –2 SD (wasting) was ≥ 10%. With regard to food availability, vitamin A deficiency was likely to be present if dark-green leafy vegetables were unavailable in the weekly food market offerings for six or more months per year and foods of high vitamin A content were eaten less than 3 times a week by at least 75% of lactating women [4]. For infants under 6 months of age, the risk of vitamin A deficiency was present if fewer than 50% were receiving breast milk; for those aged 6 months or more, the risk was present if fewer than 75% were receiving foods of high vitamin A content three times weekly in addition to breast milk [4].
Biochemical analysis
Breast-milk and serum retinol levels were assayed by high-performance liquid chromatography. Maternal vitamin A status was based on serum retinol concen-tration; vitamin A status was considered deficient if the retinol concentration was < 0.35 µmol/l (10 µg/dl) and marginal if it was < 0.70 µmol/l (20 µg/dl) [4]. The criterion for vitamin A–deficient breast milk was based on a cutoff of ≤ 1.05 µmol/l [4, 12] with a population prevalence of <10%, 10% – <25%, and ≥25% used to identify vitamin A deficiency as a mild, moder-ate, or severe public health problem, respectively [4]. Milkfat was determined by using the field-tested [19] “creamatocrit” micromethod [20]. The percentage of cream or % creamatic was read from the hematocrit capillary tube.
* As a result of recent research findings, there are currently two units quantifying vitamin A activity in foods. Both refer to 1 µg of all-trans-retinol (vitamin A). The retinol equivalent (RE) is defined as equivalent to 6 µg of dietary all-trans-β-carotene. The more recently recommended retinol activity
equivalent (RAE) is defined as equivalent to 12 µg of dietary all-trans-β-carotene. Current food-composition research may still use the 6:1 ratio, because that is what is available in food-composition tables.
G. Ettyang et al. Vitamin A consumption of breastfeeding children
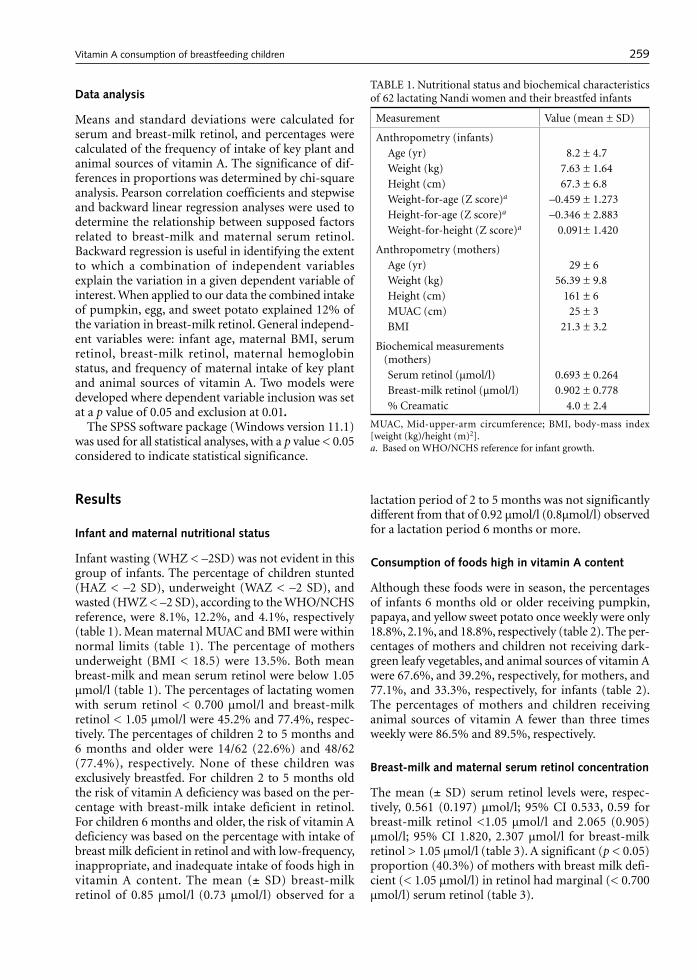
258 259
Data analysis
Means and standard deviations were calculated for serum and breast-milk retinol, and percentages were calculated of the frequency of intake of key plant and animal sources of vitamin A. The significance of dif-ferences in proportions was determined by chi-square analysis. Pearson correlation coefficients and stepwise and backward linear regression analyses were used to determine the relationship between supposed factors related to breast-milk and maternal serum retinol. Backward regression is useful in identifying the extent to which a combination of independent variables explain the variation in a given dependent variable of interest. When applied to our data the combined intake of pumpkin, egg, and sweet potato explained 12% of the variation in breast-milk retinol. General independ-ent variables were: infant age, maternal BMI, serum retinol, breast-milk retinol, maternal hemoglobin status, and frequency of maternal intake of key plant and animal sources of vitamin A. Two models were developed where dependent variable inclusion was set at a p value of 0.05 and exclusion at 0.01.
The SPSS software package (Windows version 11.1) was used for all statistical analyses, with a p value < 0.05 considered to indicate statistical significance.
Results
Infant and maternal nutritional status
Infant wasting (WHZ < –2SD) was not evident in this group of infants. The percentage of children stunted (HAZ < –2 SD), underweight (WAZ < –2 SD), and wasted (HWZ < –2 SD), according to the WHO/NCHS reference, were 8.1%, 12.2%, and 4.1%, respectively (table 1). Mean maternal MUAC and BMI were within normal limits (table 1). The percentage of mothers underweight (BMI < 18.5) were 13.5%. Both mean breast-milk and mean serum retinol were below 1.05 µmol/l (table 1). The percentages of lactating women with serum retinol < 0.700 µmol/l and breast-milk retinol < 1.05 µmol/l were 45.2% and 77.4%, respec-tively. The percentages of children 2 to 5 months and 6 months and older were 14/62 (22.6%) and 48/62 (77.4%), respectively. None of these children was exclusively breastfed. For children 2 to 5 months old the risk of vitamin A deficiency was based on the per-centage with breast-milk intake deficient in retinol. For children 6 months and older, the risk of vitamin A deficiency was based on the percentage with intake of breast milk deficient in retinol and with low-frequency, inappropriate, and inadequate intake of foods high in vitamin A content. The mean (± SD) breast-milk retinol of 0.85 µmol/l (0.73 µmol/l) observed for a
lactation period of 2 to 5 months was not significantly different from that of 0.92 µmol/l (0.8µmol/l) observed for a lactation period 6 months or more.
Consumption of foods high in vitamin A content
Although these foods were in season, the percentages of infants 6 months old or older receiving pumpkin, papaya, and yellow sweet potato once weekly were only 18.8%, 2.1%, and 18.8%, respectively (table 2). The per-centages of mothers and children not receiving dark-green leafy vegetables, and animal sources of vitamin A were 67.6%, and 39.2%, respectively, for mothers, and 77.1%, and 33.3%, respectively, for infants (table 2). The percentages of mothers and children receiving animal sources of vitamin A fewer than three times weekly were 86.5% and 89.5%, respectively.
Breast-milk and maternal serum retinol concentration
The mean (± SD) serum retinol levels were, respec-tively, 0.561 (0.197) µmol/l; 95% CI 0.533, 0.59 for breast-milk retinol <1.05 µmol/l and 2.065 (0.905) µmol/l; 95% CI 1.820, 2.307 µmol/l for breast-milk retinol > 1.05 µmol/l (table 3). A significant (p < 0.05) proportion (40.3%) of mothers with breast milk defi-cient (< 1.05 µmol/l) in retinol had marginal (< 0.700 µmol/l) serum retinol (table 3).
TABLE 1. Nutritional status and biochemical characteristics of 62 lactating Nandi women and their breastfed infants
Measurement Value (mean ± SD)
Anthropometry (infants)Age (yr) 8.2 ± 4.7Weight (kg) 7.63 ± 1.64Height (cm) 67.3 ± 6.8Weight-for-age (Z score)a –0.459 ± 1.273Height-for-age (Z score)a –0.346 ± 2.883Weight-for-height (Z score)a 0.091± 1.420
Anthropometry (mothers)Age (yr) 29 ± 6Weight (kg) 56.39 ± 9.8Height (cm) 161 ± 6MUAC (cm) 25 ± 3BMI 21.3 ± 3.2
Biochemical measurements (mothers)Serum retinol (µmol/l) 0.693 ± 0.264Breast-milk retinol (µmol/l) 0.902 ± 0.778% Creamatic 4.0 ± 2.4
MUAC, Mid-upper-arm circumference; BMI, body-mass index [weight (kg)/height (m)2].a. Based on WHO/NCHS reference for infant growth.
G. Ettyang et al. Vitamin A consumption of breastfeeding children
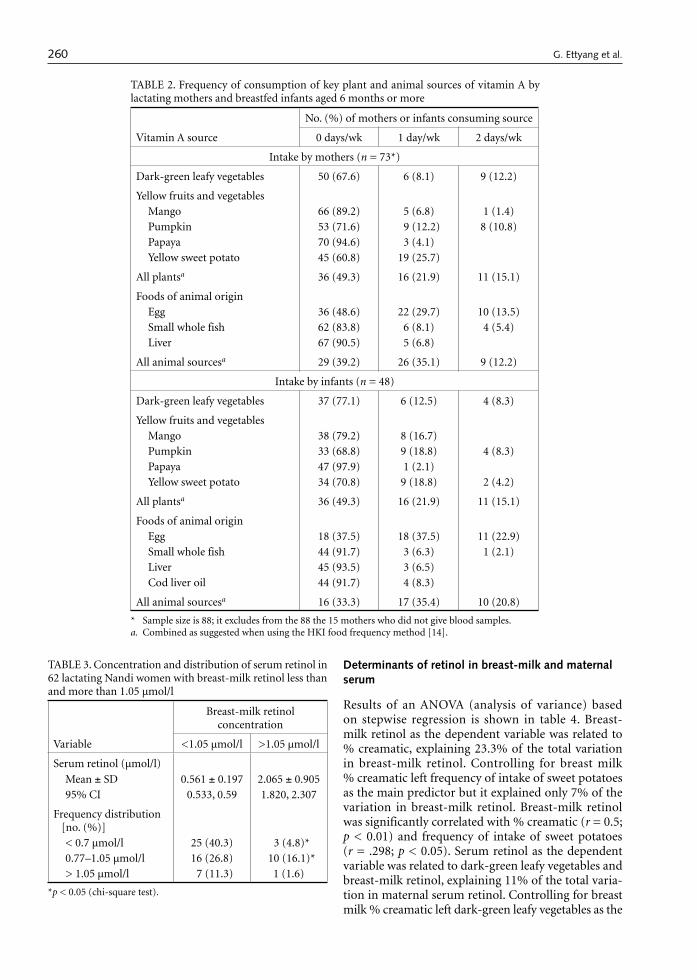
260 261
Determinants of retinol in breast-milk and maternal serum
Results of an ANOVA (analysis of variance) based on stepwise regression is shown in table 4. Breast-milk retinol as the dependent variable was related to % creamatic, explaining 23.3% of the total variation in breast-milk retinol. Controlling for breast milk % creamatic left frequency of intake of sweet potatoes as the main predictor but it explained only 7% of the variation in breast-milk retinol. Breast-milk retinol was significantly correlated with % creamatic (r = 0.5; p < 0.01) and frequency of intake of sweet potatoes (r = .298; p < 0.05). Serum retinol as the dependent variable was related to dark-green leafy vegetables and breast-milk retinol, explaining 11% of the total varia-tion in maternal serum retinol. Controlling for breast milk % creamatic left dark-green leafy vegetables as the
TABLE 2. Frequency of consumption of key plant and animal sources of vitamin A by lactating mothers and breastfed infants aged 6 months or more
Vitamin A source
No. (%) of mothers or infants consuming source
0 days/wk 1 day/wk 2 days/wk
Intake by mothers (n = 73*)
Dark-green leafy vegetables 50 (67.6) 6 (8.1) 9 (12.2)
Yellow fruits and vegetablesMango 66 (89.2) 5 (6.8) 1 (1.4)Pumpkin 53 (71.6) 9 (12.2) 8 (10.8)Papaya 70 (94.6) 3 (4.1)Yellow sweet potato 45 (60.8) 19 (25.7)
All plantsa 36 (49.3) 16 (21.9) 11 (15.1)
Foods of animal originEgg 36 (48.6) 22 (29.7) 10 (13.5)Small whole fish 62 (83.8) 6 (8.1) 4 (5.4)Liver 67 (90.5) 5 (6.8)
All animal sourcesa 29 (39.2) 26 (35.1) 9 (12.2)
Intake by infants (n = 48)
Dark-green leafy vegetables 37 (77.1) 6 (12.5) 4 (8.3)
Yellow fruits and vegetablesMango 38 (79.2) 8 (16.7)Pumpkin 33 (68.8) 9 (18.8) 4 (8.3)Papaya 47 (97.9) 1 (2.1)Yellow sweet potato 34 (70.8) 9 (18.8) 2 (4.2)
All plantsa 36 (49.3) 16 (21.9) 11 (15.1)
Foods of animal originEgg 18 (37.5) 18 (37.5) 11 (22.9)Small whole fish 44 (91.7) 3 (6.3) 1 (2.1)Liver 45 (93.5) 3 (6.5)Cod liver oil 44 (91.7) 4 (8.3)
All animal sourcesa 16 (33.3) 17 (35.4) 10 (20.8)
* Sample size is 88; it excludes from the 88 the 15 mothers who did not give blood samples. a. Combined as suggested when using the HKI food frequency method [14].
TABLE 3. Concentration and distribution of serum retinol in 62 lactating Nandi women with breast-milk retinol less than and more than 1.05 µmol/l
Variable
Breast-milk retinol concentration
<1.05 µmol/l >1.05 µmol/l
Serum retinol (µmol/l)
Mean ± SD 0.561 ± 0.197 2.065 ± 0.90595% CI 0.533, 0.59 1.820, 2.307
Frequency distribution [no. (%)]< 0.7 µmol/l 25 (40.3) 3 (4.8)*0.77–1.05 µmol/l 16 (26.8) 10 (16.1)*> 1.05 µmol/l 7 (11.3) 1 (1.6)
*p < 0.05 (chi-square test).
G. Ettyang et al. Vitamin A consumption of breastfeeding children
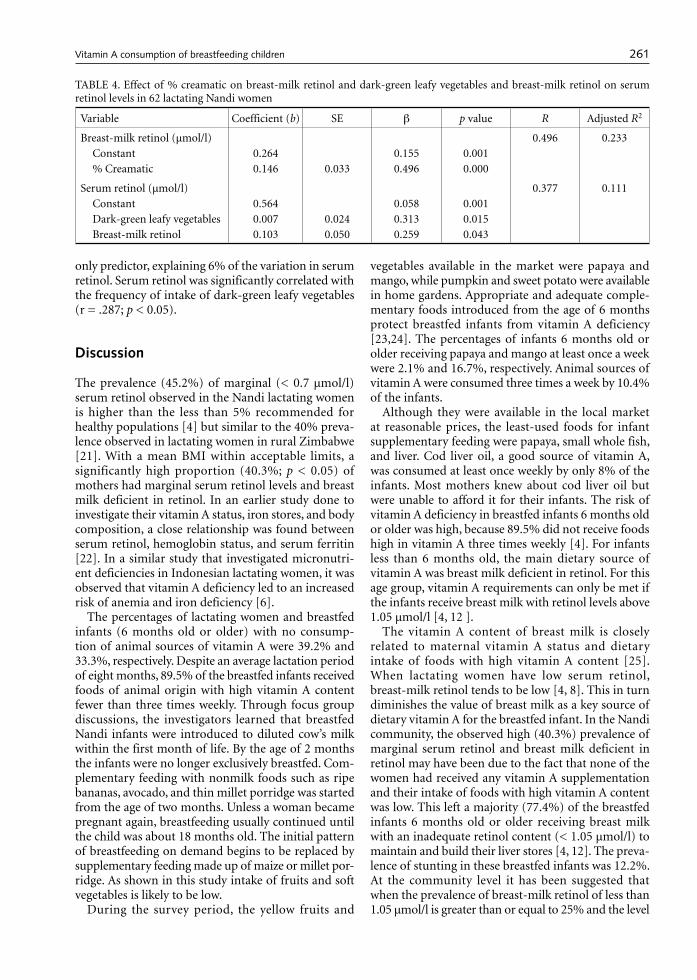
260 261
only predictor, explaining 6% of the variation in serum retinol. Serum retinol was significantly correlated with the frequency of intake of dark-green leafy vegetables (r = .287; p < 0.05).
Discussion
The prevalence (45.2%) of marginal (< 0.7 µmol/l) serum retinol observed in the Nandi lactating women is higher than the less than 5% recommended for healthy populations [4] but similar to the 40% preva-lence observed in lactating women in rural Zimbabwe [21]. With a mean BMI within acceptable limits, a significantly high proportion (40.3%; p < 0.05) of mothers had marginal serum retinol levels and breast milk deficient in retinol. In an earlier study done to investigate their vitamin A status, iron stores, and body composition, a close relationship was found between serum retinol, hemoglobin status, and serum ferritin [22]. In a similar study that investigated micronutri-ent deficiencies in Indonesian lactating women, it was observed that vitamin A deficiency led to an increased risk of anemia and iron deficiency [6].
The percentages of lactating women and breastfed infants (6 months old or older) with no consump-tion of animal sources of vitamin A were 39.2% and 33.3%, respectively. Despite an average lactation period of eight months, 89.5% of the breastfed infants received foods of animal origin with high vitamin A content fewer than three times weekly. Through focus group discussions, the investigators learned that breastfed Nandi infants were introduced to diluted cow’s milk within the first month of life. By the age of 2 months the infants were no longer exclusively breastfed. Com-plementary feeding with nonmilk foods such as ripe bananas, avocado, and thin millet porridge was started from the age of two months. Unless a woman became pregnant again, breastfeeding usually continued until the child was about 18 months old. The initial pattern of breastfeeding on demand begins to be replaced by supplementary feeding made up of maize or millet por-ridge. As shown in this study intake of fruits and soft vegetables is likely to be low.
During the survey period, the yellow fruits and
vegetables available in the market were papaya and mango, while pumpkin and sweet potato were available in home gardens. Appropriate and adequate comple-mentary foods introduced from the age of 6 months protect breastfed infants from vitamin A deficiency [23,24]. The percentages of infants 6 months old or older receiving papaya and mango at least once a week were 2.1% and 16.7%, respectively. Animal sources of vitamin A were consumed three times a week by 10.4% of the infants.
Although they were available in the local market at reasonable prices, the least-used foods for infant supplementary feeding were papaya, small whole fish, and liver. Cod liver oil, a good source of vitamin A, was consumed at least once weekly by only 8% of the infants. Most mothers knew about cod liver oil but were unable to afford it for their infants. The risk of vitamin A deficiency in breastfed infants 6 months old or older was high, because 89.5% did not receive foods high in vitamin A three times weekly [4]. For infants less than 6 months old, the main dietary source of vitamin A was breast milk deficient in retinol. For this age group, vitamin A requirements can only be met if the infants receive breast milk with retinol levels above 1.05 µmol/l [4, 12 ].
The vitamin A content of breast milk is closely related to maternal vitamin A status and dietary intake of foods with high vitamin A content [25]. When lactating women have low serum retinol, breast-milk retinol tends to be low [4, 8]. This in turn diminishes the value of breast milk as a key source of dietary vitamin A for the breastfed infant. In the Nandi community, the observed high (40.3%) prevalence of marginal serum retinol and breast milk deficient in retinol may have been due to the fact that none of the women had received any vitamin A supplementation and their intake of foods with high vitamin A content was low. This left a majority (77.4%) of the breastfed infants 6 months old or older receiving breast milk with an inadequate retinol content (< 1.05 µmol/l) to maintain and build their liver stores [4, 12]. The preva-lence of stunting in these breastfed infants was 12.2%. At the community level it has been suggested that when the prevalence of breast-milk retinol of less than 1.05 µmol/l is greater than or equal to 25% and the level
TABLE 4. Effect of % creamatic on breast-milk retinol and dark-green leafy vegetables and breast-milk retinol on serum retinol levels in 62 lactating Nandi women
Variable Coefficient (b) SE β p value R Adjusted R2
Breast-milk retinol (µmol/l) 0.496 0.233Constant 0.264 0.155 0.001% Creamatic 0.146 0.033 0.496 0.000
Serum retinol (µmol/l) 0.377 0.111Constant 0.564 0.058 0.001Dark-green leafy vegetables 0.007 0.024 0.313 0.015Breast-milk retinol 0.103 0.050 0.259 0.043
G. Ettyang et al. Vitamin A consumption of breastfeeding children

262 263
of stunting is greater than or equal to 30% in children under five years of age, then vitamin A deficiency is a potential problem of public health significance [4, 26]. Nandi infants may not be severely stunted, but nearly a quarter of them experience growth faltering at an early age.
In addition to receiving breast milk deficient in reti-nol, infants 6 months old or older (65.8%; n = 48/73) did not frequently receive appropriate supplementary plant and animal sources of vitamin A. A study inves-tigating infant-feeding practices in Kenya, Mexico, and Malaysia reported that though Kenyan mothers continued to breastfeed for up to 12 months, early supplementation of their breastfed infants with milk and/or other foods was a common practice [27]. In our study population, all infants were breastfed on demand. Breast-milk retinol concentration was found to be low regardless of the duration of lactation. On the other hand, a study investigating factors influenc-ing vitamin A status of lactating Bangladeshi women observed that women with a lactation period of at least six months had significantly lower serum vitamin A levels than women with a lactation period of less than six months. Duration of lactation had an important influence on the vitamin A status of the women [28].
In our study population, % creamatic was identi-fied as a predictor of breast-milk retinol, but when % creamatic was controlled for, intake of sweet pota-toes became the main predictor. In turn, dark-green leafy vegetables and breast-milk retinol were the main predictors of serum retinol. Sweet potatoes are a popu-lar snack food and are generally available throughout the year. All homesteads plant dark-green leafy vegeta-bles that are abundant only during the rainy season. A study investigating vitamin A deficiency in rural lactating Zimbabwe women also found dark-green leafy vegetables to be the main source of vitamin A. Retinol-containing foods and yellow fruits and vegeta-bles were rarely consumed. In these women, vitamin A and iron deficiencies were identified as problems of public health significance [21]. Similarly, in lactating Bangladeshi women, intake of vitamin A was identified as a predictor of breast-milk retinol [28].
We did not obtain data on the prevalence of clini-cal vitamin A deficiency in the breastfed infants. The mothers were not willing to let us draw blood from their infants, and accurate assessment of infant mor-bidity was not possible. The theoretical cutoff of breast-milk retinol < 1.05 µmol/l has not been con-firmed locally but is based on observations made in a population of mothers in central Java, Indonesia. To carry out a three-day precise weighing dietary assess-ment with biochemical analyses of serum and breast milk posed important financial, logistical, and technical constraints. This limited our sample size to 88 lactating mother-infant pairs. We found the Helen Keller Inter-
national food-frequency method simple and fast to use. The data collected, though not quantitative, proved to be useful in assessing community risk for low intake of vitamin A–rich foods.
In summary, despite adequate local availability, mothers and children did not frequently receive foods high in vitamin A content. This low intake requires nutritional improvement, as is supported by the bio-chemical findings among this group of lactating Nandi women. With the apparently low serum retinol during a period of abundance of foods high in vitamin A content, the Nandi women studied may not be able to maintain an optimal vitamin A status during lactation. This may diminish the importance of breast milk as a dietary source of vitamin A for the breastfed infant. This study suggests that increasing vitamin A intake in women of childbearing age may be adequate to ensure that young children receive sufficient amounts of vitamin A. For this study, the low intake of foods high in vitamin A, combined with the high prevalence of marginal serum retinol and breast milk deficient in retinol, identifies vitamin A deficiency as a problem of public health significance for the Nandi community.
Recommendations
Baseline data for monitoring change in vitamin A status over time have been provided, and a modified food-frequency questionnaire that will prove useful in monitoring the impact of community-based vitamin A deficiency interventions has been developed. As a deter-minant of breast-milk retinol, the % creamatic method is recommended as a simple and easy technique for assessing improvements in breast-milk vitamin A. We recommend that intervention strategies involve a mix of measures that will result in improved vitamin A status. For a long-term permanent solution to the problem, we recommend food-based approaches. To increase the dietary intake of vitamin A–containing foods by vulnerable groups, nutrition and social marketing interventions should be considered.
Acknowledgments
This study was supported by the MUNDO Moi Uni-versity and Maastricht University project. I am grateful for the facilitation role played by the Dean Prof. B. O. Khwa-Otsyula and the former Dean of the Faculty of Health Sciences, Prof. H. N. K. arap Mengech. Special thanks go to the assistant chief and the Nandi women of Kokwet. We also give special thanks to Mr. L. C. Kimile for assistance in sample collection and the KEMRI labs for support in sample analysis.
G. Ettyang et al. Vitamin A consumption of breastfeeding children

262 263
References
1. Global prevalence of vitamin A deficiency. Micronutri-ent Deficiency Information System (MDIS) Working Paper No. 2; 1995 Geneva: World Health Organization WHO/NUT/95.3.
2. Fourth report on the world nutrition situation. Nutri-tion throughout the life cycle. 2000; Geneva: ACC/SCN in collaboration with IFPRI.
3. Gross R, de Romana GL, Tomaro J. A life-cycle approach to multi-micronutrient supplementation: rationale and programme concept. Food Nutr Bull 2000;21:270–4.
4. World Health Organization. Indicators for assessing vitamin A deficiency and their application in monitoring and evaluating intervention programmes. World Health Organization . Geneva;1996. WHO/NUT/96.10.
5. Role of vitamin A in iron deficiency anemia. New York: Raven Press. Nestlé Nutrition Workshop Series 1992;Vol 30. 93–101.
6. Dijkhuizen MA, Wieringa FT, West CE, Muherdiyantin-ingsih, Muhilal. Concurrent microntrient deficiencies in lactating mothers and their infants in Indonesia. Am J Clin Nutr 2001;73:786–91.
7. Safe vitamin A dosage during pregnancy and lactation. The micronutrient initiative. World Health Organiza-tion. Geneva; 1998. WHO/NUT/98.
8. Underwood BA. Maternal vitamin A status and its importance in infancy and early childhood. Am J Clin Nutr 1994;59(2 suppl):517S–22S.
9. Hussey G, Klein M. A randomized, controlled trial of vitamin A in children with severe measles. N Engl J Med 1990;323:160–4.
10. West KP Jr, Pokhrel RP, Katz J, LeClerq SC, Khatry SK, Shrestha SR, Pradhan EK, Tielsch JM, Pandey MR, Sommer A. Efficacy of vitamin A in reducing preschool child mortality in Nepal. Lancet 1991;338:67–71.
11. Effectiveness of vitamin A supplementation in the con-trol of young child morbidity and mortality in develop-ing countries. Nutrition Policy Discussion Paper No. 13; 1993; ACC/SCN.
12. Stoltzfus RJ, Underwood BA. Breast-milk vitamin A as an indicator of the vitamin A status of women and infants. Bull World Health Organ 1995;73:703–11.
13. Newman V. Vitamin A and breast-feeding: a comparison of data from developed and developing countries. Food Nutr Bull 1994;15:161–76.
14. Rosen D, Haselow N, Sloan N. How to use the HKI food frequency method to assess community risk of vitamin A deficiency. HKI Vitamin A Technical Assist-ance Program. 1993. New York.
15. Sloan N, Rosen D, de la Paz T, Arita M, Temaliwa C, Solomons N. Identifying areas with vitamin A defi-ciency: the validity of a semiquantitative food frequency method. Am J Public Health 1997;87:186–91.
16. Bender DA. The Vitamins. In: Introduction to human nutrition. Gibney MJ, Vorster HH, Kok FJ, eds. Oxford, UK: Blackwell Publishing; 2002:125–32.
17. Stoltzfus RJ, Hakimi M, Miller KW, Rasmussen KM, Dawiesah S, Habicht JP, Dibley MJ. High dose vitamin A supplementation of breast–feeding Indonesian mothers: effects on the vitamin A status of mother and infant. J Nutr 1993;123:666–75.
18. Muslimatun S. Nutrition of Indonesian women during pregnancy and lactation; a focus on vitamin A and iron. PhD thesis, Wageningen University, The Netherlands, 2001.
19. Prentice A, Prentice AM, Whitehead RG. Breast-milk fat concentration of rural African women. 1. Short-term variations within individuals. Br J Nutr 1981;45:483–94.
20. Lucas A, Gibbs JA, Lyster RL, Baum JD. Creamatocrit: simple clinical technique for estimating fat concentra-tion and energy value of human milk. Br Med J 1978;22:1018–20.
21. Ncube TN, Malaba L, Greiner T, Gebre-Medhin M. Evidence of grave vitamin A deficiency among lactat-ing women in the semi-arid rural area of Makhaza in Zimbabwe. A population-based study. Eur J Clin Nutr 2001;55:229–34.
22. Ettyang GA, van Marken Lichtenbelt WD, Oloo A, Saris WHM. Serum retinol, iron status and body composition of lactating women in Nandi, Kenya. Ann Nutr Metab 2003;47:276–83.
23. Mahalanabis D. Breast feeding and vitamin A deficiency among children attending a diarrhoea treatment center in Bangladesh: a case-control study. Br Med J 1991;303:493–6.
24. Brown KH, Akhtar NA, Robertson AD, Ahmed MG. Lactational capacity of marginally nourished mothers: relationships between maternal nutritional status and quantity and proximate composition of milk. Pediatrics 1986;78:909–19.
25. Allen LH. Maternal micronutrient malnutrition: effects on breast milk and infant nutrition and priorities for intervention. SCN News 1994, No. 11.
26. de Onis M, Monteiro C, Akre J, Glugston G. The world-wide magnitude of protein-energy malnutrition: an overview from the WHO Global Database on Child Growth. Bull World Health Organ 1995;71:703–12.
27. Diamond HJ, Ashworth A. Infant feeding practices in Kenya, Mexico and Malaysia. The rarity of the exclusively breast-fed infant. Hum Nutr Appl Nutr 1987;41:51–64.
28. Ahmed F, Azim A, Akhtaruzzaman M. Vitamin A defi-ciency in poor, urban, lactating women in Bangladesh: factors influencing vitamin A status. Public Health Nutr 2003;6:447–52.
G. Ettyang et al. Vitamin A consumption of breastfeeding children
264 Food and Nutrition Bulletin, vol. 25, no. 3 © 2004, The United Nations University.
265
Abstract
The stability of table salt double-fortified with iron as ferrous fumarate, and with iodine as potassium iodide or potassium iodate, has been investigated under actual field conditions of storage and distribution in the coastal and highland regions of Kenya. Seven 200-g sample packets of double-fortified salt in sealed polyethylene bags and a similar packet containing a datalogger for monitoring temperature and humidity were packaged with 21 sample bags of salt from another study into a bundle, which then entered the distribution network from a salt manufactur-er’s facility to the consumer. Iodine retention values of up to 90% or more were obtained during the three-month study. Double-fortified salt was prepared using ferrous fumarate microencapsulated with a combination of bind-ers and coloring agents and coated with soy stearine, in combination with either iodated salt or salt iodized with potassium iodide microencapsulated with dextrin and coated with soy stearine. Most of the ferrous iron was retained, with less than 17% being oxidized to the ferric state. The polyethylene film overwrap of salt packs in the bundles provided significant protection from ambient humidity. Salt double-fortified with iodine and micro-encapsulated iron ferrous fumarate premix was generally quite stable, because both iodine and ferrous iron were protected during distribution and retail in typical tropical conditions in Kenya’s highlands and humid lowlands.
Key words: Salt, micronutrients, fortification, iodine, iron, datalogger, temperature, humidity, storage, dis-tribution, Kenya
Introduction
Iodine-deficiency disorders and iron-deficiency anemia are preventable ailments that afflict more than 2 billion people globally, with serious consequences for women and young children and for the economic and social development of entire populations [1]. Iron-deficiency anemia can lead to increased maternal mortality, com-promised development of motor skills and learning capacity, and reduced immunity to diseases. A recent national anemia and micronutrient survey in Kenya [2] has shown that nutritional iron-deficiency anemia is a major public health problem affecting some 25% of the population. Iodine-deficiency disorders include a wide spectrum of mental and intellectual effects [3]. Assessments of iodine-deficiency disorders in Kenya reported in 1994 showed prevalence in more than 16% of the population [2].
Deficiencies of iodine or iron can be inexpensively eliminated, prevented, or reduced by increasing dietary intake of these micronutrients by food fortification, which is an important component of the strategy for combating micronutrient malnutrition [4]. It is, however, critical that the vehicle for the fortification be available to the entire population deficient in the micronutrient, and it must be able to be consumed at a constant rate irrespective of social and economic status. Salt is an attractive vehicle for the provision of micronutrients, in view of its almost universal and uni-form regional consumption [5, 6]. Encouraged by the progress made globally with salt iodization during the past decade, we have been examining the feasibility of fortifying salt with both iron and iodine. The physical and social infrastructure developed for salt-iodiza-tion should facilitate putting in place a cost-efficient method of delivering adequate levels of iodine and iron through double-fortified salt.
The major technical challenge for salt double-forti-fication lies in developing a formulation in which both iodine and iron are stable and bioavailable. Our food engineering program at the University of Toronto has a major research program, funded by the Micronutrient
Stability of salt double-fortified with ferrous fumarate and potassium iodate or iodide under storage and distribution conditions in Kenya
Toks Oshinowo and Levente Diosady are affiliated with the Department of Chemical Engineering and Applied Chemis-try, University of Toronto, Ontario, Canada. Rizwan Yusufali is affiliated with UNICEF, Mombasa, Kenya. Louis Laleye is affiliated with the Micronutrient Initiative, Ottawa, Canada.
Please direct queries to the corresponding author: Levente Diosady, University of Toronto, Toronto, Ontario, Canada M5S 3E5; e-mail: [email protected].
Mention of the names of firms and commercial products does not imply endorsement by the United Nations University.
Stability of double-fortified salt
Toks Oshinowo, Levente Diosady, Rizwan Yusufali, and Louis Laleye

264 Food and Nutrition Bulletin, vol. 25, no. 3 © 2004, The United Nations University.
265
Initiative (MI), for the development of technology for salt double-fortification with iodine and iron [7]. In order to verify the validity of our laboratory models for environmental exposure of salt, MI, UNICEF, and our research group arranged to monitor the tempera-ture and humidity experienced by a typical package of household salt in Kenya, and to test the stability of a number of double-fortified salt formulations under actual field conditions. The goal of the work is to con-firm the stability of ferrous iron and the retention of iodine during field distribution. This paper reports on the findings of this study of storage and distribution conditions encountered by double-fortified salts, with ferrous fumarate as the source of iron, and potassium iodide or potassium iodate as the source of iodine, as it travels from the facilities of the salt producer to the consumer. The investigation was carried out in two climatic zones of Kenya: the coastal zone consisting of Mombasa and the surrounding regions, and the high-land zone of Nairobi and the surrounding region.
Experimental methods
Formulations
All formulations of double-fortified salt investigated contained iodine at the 100 ppm (parts per million) level and iron at the 1,000 ppm level. Iodine was introduced either through commercial iodization or by adding an iodine premix to noniodized salt. The iodine premix was produced by a process of granula-tion followed by microencapsulation [8] developed in our laboratory. Potassium iodide crystals were first granulated with dextrin as the binding agent. The resulting particles were then coated with a hot, molten soy stearine. Iodated salt and noniodated salt were pro-duced by Mombasa Salt Works, Mombasa, Kenya.
Several iron premixes used in the formulations were produced using the agglomeration and microencapsu-lation processes developed by the University of Toronto food engineering laboratory. Previous investigations reported in the literature have identified ferrous fumarate as an excellent source of bioavailable iron. It has been shown to be stable, bland tasting, and cost effective [7, 9].
The ferrous fumarate was granulated with various binding, color-stabilizing, and color-masking agents, as listed in table 1. The coating material for encapsu-lation was fully hydrogenated soy stearine containing titanium oxide (TiO2) to mask the reddish-brown color of ferrous fumarate.
Sample preparation
Seven formulations of double-fortified salts were prepared by blending the different iron premixes with either iodated salt or iodine (KI) premix and pure salt. The control was commercially iodated salt. These for-mulations are described in table 2.
Salt in Kenya is typically sold in 200-g packets, usually distributed in bundles of 30 wrapped with a polyethylene film. Each of the seven formulations was prepared as a 200-g sample of double-fortified salt and sealed in a typical commercial polyethylene bag. Each packet was labeled with a random serial number. The seven sample packets and a control packet of commer-cially prepared iodized salt were packaged together with 21 sample bags from another study into a bundle along with a packet containing a datalogger to make up a typical commercial bundle containing 30 salt packets. A total of six bundles (labeled A–F) were prepared.
Two bundles were sent to each of two distribution zones, but in each zone only one bundle contained a datalogger, which recorded temperature and humidity every 30 minutes. Bundles E and F were each prepared with a datalogger. Bundle E was stored at room condi-tions in our laboratory at the University of Toronto. Bundle F was stored in our environmental chamber with conditions preset to a temperature of 40oC and a relative humidity of approximately 100%. The data-logger in each bundle was surrounded with Styrofoam packing material to facilitate air circulation and to absorb shocks during shipping.
Bundles A to D were dispatched by air freight to the UNICEF Kenya Country Office in Gigiri, with A and B designated for the coastal zone and C and D for the highland zone. The bundles were subsequently dispatched to the salt producers, Krystalline Salt in Nairobi and Mombasa Salt Works in Mombasa, for inclusion in their normal distribution networks. The objective was to simulate, as closely as possible, the
TABLE 1. Materials used in making iron premixes
Iron source
Granulation Encapsulation
Material Function Material Function
Ferrous fumarate Methocel (HPMC)a Binder Soy stearine CoatingTiO2 Color-masking TiO2 Color-masking
SHMPb Color stability
a. Methocel is the trade name for HPMC (hydroxypropylmethylcellulose).b. SHMP, Sodium hexametaphosphate.
Stability of double-fortified salt
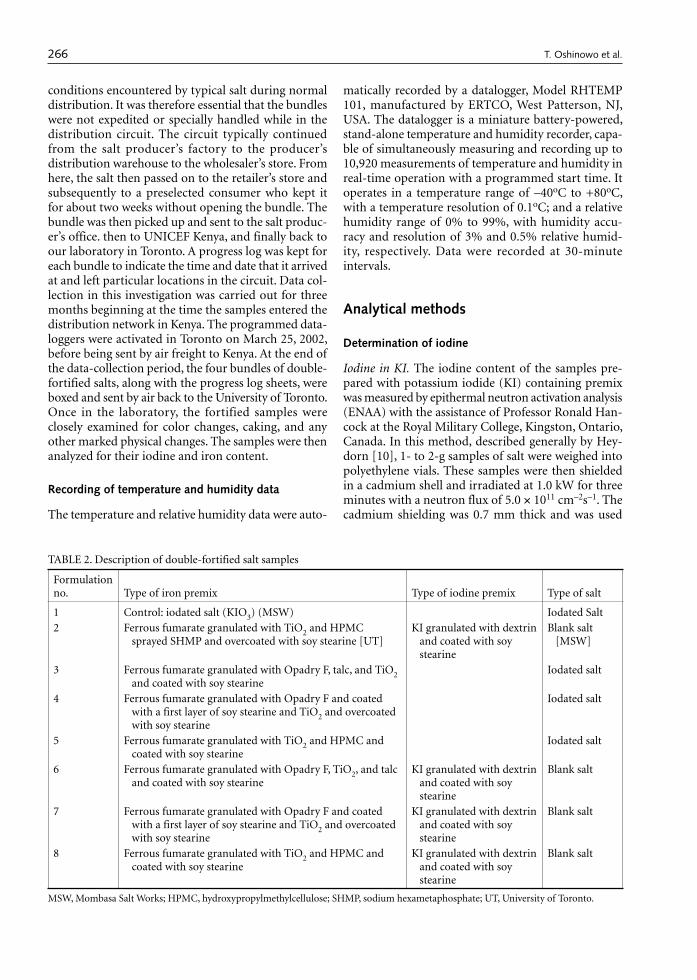
266 267
conditions encountered by typical salt during normal distribution. It was therefore essential that the bundles were not expedited or specially handled while in the distribution circuit. The circuit typically continued from the salt producer’s factory to the producer’s distribution warehouse to the wholesaler’s store. From here, the salt then passed on to the retailer’s store and subsequently to a preselected consumer who kept it for about two weeks without opening the bundle. The bundle was then picked up and sent to the salt produc-er’s office. then to UNICEF Kenya, and finally back to our laboratory in Toronto. A progress log was kept for each bundle to indicate the time and date that it arrived at and left particular locations in the circuit. Data col-lection in this investigation was carried out for three months beginning at the time the samples entered the distribution network in Kenya. The programmed data-loggers were activated in Toronto on March 25, 2002, before being sent by air freight to Kenya. At the end of the data-collection period, the four bundles of double-fortified salts, along with the progress log sheets, were boxed and sent by air back to the University of Toronto. Once in the laboratory, the fortified samples were closely examined for color changes, caking, and any other marked physical changes. The samples were then analyzed for their iodine and iron content.
Recording of temperature and humidity data
The temperature and relative humidity data were auto-
matically recorded by a datalogger, Model RHTEMP 101, manufactured by ERTCO, West Patterson, NJ, USA. The datalogger is a miniature battery-powered, stand-alone temperature and humidity recorder, capa-ble of simultaneously measuring and recording up to 10,920 measurements of temperature and humidity in real-time operation with a programmed start time. It operates in a temperature range of –40oC to +80oC, with a temperature resolution of 0.1oC; and a relative humidity range of 0% to 99%, with humidity accu-racy and resolution of 3% and 0.5% relative humid-ity, respectively. Data were recorded at 30-minute intervals.
Analytical methods
Determination of iodine
Iodine in KI. The iodine content of the samples pre-pared with potassium iodide (KI) containing premix was measured by epithermal neutron activation analysis (ENAA) with the assistance of Professor Ronald Han-cock at the Royal Military College, Kingston, Ontario, Canada. In this method, described generally by Hey-dorn [10], 1- to 2-g samples of salt were weighed into polyethylene vials. These samples were then shielded in a cadmium shell and irradiated at 1.0 kW for three minutes with a neutron flux of 5.0 × 1011 cm–2s–1. The cadmium shielding was 0.7 mm thick and was used
TABLE 2. Description of double-fortified salt samples
Formulation no. Type of iron premix Type of iodine premix Type of salt
1 Control: iodated salt (KIO3) (MSW) Iodated Salt2 Ferrous fumarate granulated with TiO2 and HPMC
sprayed SHMP and overcoated with soy stearine [UT]KI granulated with dextrin
and coated with soy stearine
Blank salt [MSW]
3 Ferrous fumarate granulated with Opadry F, talc, and TiO2 and coated with soy stearine
Iodated salt
4 Ferrous fumarate granulated with Opadry F and coated with a first layer of soy stearine and TiO2 and overcoated with soy stearine
Iodated salt
5 Ferrous fumarate granulated with TiO2 and HPMC and coated with soy stearine
Iodated salt
6 Ferrous fumarate granulated with Opadry F, TiO2, and talc and coated with soy stearine
KI granulated with dextrin and coated with soy stearine
Blank salt
7 Ferrous fumarate granulated with Opadry F and coated with a first layer of soy stearine and TiO2 and overcoated with soy stearine
KI granulated with dextrin and coated with soy stearine
Blank salt
8 Ferrous fumarate granulated with TiO2 and HPMC and coated with soy stearine
KI granulated with dextrin and coated with soy stearine
Blank salt
MSW, Mombasa Salt Works; HPMC, hydroxypropylmethylcellulose; SHMP, sodium hexametaphosphate; UT, University of Toronto.
T. Oshinowo et al. Stability of double-fortified salt

266 267
to reduce interferences due to the high proportion of chlorine and sodium present in the samples. Follow-ing irradiation, the samples were allowed to rest for six minutes, and then gamma emissions at 44.3 keV were measured with a hyperpure germanium-based gamma ray spectrometer. The iodine concentrations within the samples were calculated based on a calibration obtained using a series of iodine standards covering a range of 0 to 1,000 ppm. The relative standard deviation of the analysis was determined to be 5%.
Iodine in KIO3. The iodine content of samples pre-pared with potassium iodate (KIO3) was measured by a titrimetric method, which is a modified form of the official AOAC method [11] and has been successfully used by previous workers [12]. A solution of 5 g of salt sample in 100 ml of deionized water was titrated with sodium thiosulfate of known concentration (µg I+5/ml Na2S2O3). A pinch of potassium iodide crystals and a few drops of hydrochloric or sulfuric acid were added to the solution. The liberated iodine was titrated with the thiosulfate solution until the solution turned pale yellow. Freshly prepared starch solution used as the indicator was added, and the solution turned purple. Titration was then continued until the solution changed from purple to colorless at the endpoint. The concentration of iodine in the sample was calculated from the product of the concentration and volume of sodium thiosulfate consumed per gram of sample.
Determination of iron
The iron content of the double-fortified salt samples was determined by the spectrophotometric method developed by Harvey et al. [13]. In using this method, 5 g of salt sample was dissolved in 50 ml of distilled water slightly acidified with 2 ml of concentrated sul-furic acid to digest the iron compounds in the sample. More distilled water was then added to bring up the solution volume to 100 ml. To 5 ml of this solution, 10 ml of 0.3% 1,10 phenanthroline and 5 ml of buffer solution of 0.2 M potassium biphthalate were added in order to promote the formation of complexes of ferrous and ferric iron with phenanthroline. The solution was topped up to 25 ml with distilled water. The absorbances of the resulting solution were then measured at 396 and 512 μm using an ultraviolet (UV)-visible spectrophotometer. The concentrations of fer-rous and ferric iron in the sample were calculated based on a calibration obtained using a series of ferrous and ferric iron standards. The total iron concentration in the sample was calculated from the absorbance at 396 μm, while that for ferrous iron was calculated essen-tially from the absorbance at 512 μm, because there was very little absorption by the ferric iron complex at this wavelength. Ferric iron concentration was subsequently obtained by the difference between the total iron and the ferrous iron concentrations.
Results
Distribution networks
Four bundles of samples (A–D) were dispatched from Toronto on March 25, 2002, with the dataloggers activated, and were received at UNICEF Kenya on March 28. Bundles A and B were immediately sent to the Mombasa Salt Works plant in Mombasa, where they entered and remained in the distribution network for the coastal zone from April 1 to July 7. Bundles C and D were sent to the Nairobi office of Krystalline Salt and then to the manufacturing plant in Marereni, where they eventually entered the Nairobi distribution network beginning on April 13 and continuing through July 11.
Entries in the logsheets showed that the bundles actually went through the typical network of storage and distribution from the salt producer’s facilities to the wholesaler’s warehouse to the retailer’s store before getting to the consumer’s home. At the end of the study, the bundles were sent to the UNICEF Kenya Central Office and shipped back to the University of Toronto. Bundles A and B were received in Toronto on July 10, and bundles C and D were received in Toronto on July 15, 2002.
Temperature and relative humidity
Mombasa
Temperature and relative humidity variations in the Mombasa distribution network as recorded by the datalogger are shown in figure 1. The data have been summarized in table 3. The minimum and maximum temperatures during the period of investigation were 17.9o and 37.2oC, respectively, with an average of 27.3oC. There was a wide fluctuation of about 14oC in the second half of April. This period coincided with the movement of the samples from the retailer’s store
FIG. 1. Datalogger measurements of temperature and humid-ity of double-fortified salt in the Coastal Zone (Mombasa), Kenya
13.3
18.1
22.9
27.7
32.5
37.3
28.0
34.7
41.4
48.1
54.8
61.5
Tem
pera
ture
(°C
)
Rel
ativ
e hu
mid
ity (
%)
Relative humidity
Temperature
12 pmMar 25,
2002
10 pmApr 15,2002
8 amMay 7,2002
6 pmMay 28,
2002
4 amJun 19,2002
2 pmJul 10,2002
T. Oshinowo et al. Stability of double-fortified salt

268 269
into the consumer’s house. It is interesting, because unexpected, that lower temperatures were recorded after the samples left the consumer’s home for storage at Mombasa Salt Works.
The relative humidity experienced by the packets in the bundles steadily increased from about 32%, when the samples entered the network, to a maximum of 61.5%, attained at the end of the study. The shape of the humidity-time curve indicates that moisture penetrates the salt packages slowly, until equilibrium is established between the salt and the surroundings. About 8 weeks were required for equilibration.
The humidity in the coastal region was expected to be high, and the expectation was confirmed by an equilibrium relative humidity level above 60%. Based on climatic records, the actual humidity in the ambient air was probably higher, in the 70% to 85% range. It is clear from the data that the wrapping protected the salt packages from moisture penetration from the humid surrounding air.
Nairobi
The variations in temperature and relative humidity in the highland (Nairobi) network are shown in figure 2. These variations highlight an important aspect of the coastal zone in the salt industry of Kenya: almost all the distribution networks originate in the coastal region where the salt producers are located. Consequently, placing the salt samples into the Nairobi distribution network required that the samples first travel to Mar-ereni near the coast, where the Krystalline Salt Com-pany has its plant. Thus, the plots in figure 2 consist of two sections. The first section, up to the first week of May, represents the period when the samples were in the humid Mombasa zone, whereas the second section, from May to the end of the investigation, represents the period when the samples were in the drier Nairobi region. The overall average temperature was about 25oC. The minimum and maximum temperatures were 19.4o and 30oC. The temperature in the second section was on average about 4o to 5oC cooler than in the first section.
The rise in the relative humidity and time profile in
figure 2 is similar to that in figure 1, with approximately the same equilibration period of eight weeks. However, once in the Nairobi network, the samples experienced a lower relative humidity of about 48% (fig. 2). The minimum and maximum relative humidity for the entire period of investigation were 28% and 50.5%, and are shown in table 3.
Room conditions and the environmental test chamber
The storage room conditions of the samples in our laboratory are shown in figure 3 and summarized in table 3. The conditions were fairly steady, with a mean temperature of 23.7oC. The relative humidity ranged from a minimum of 23.5% to a maximum of 38.5%, with an average of 28.9%. The conditions in the environmental chamber were kept constant, with a mean temperature of 39.6oC and a relative humidity of 87.5%.
Relative humidity and temperature data for the Mombasa and Nairobi distribution networks, the laboratory room, and the environmental chamber have been plotted for comparison and are shown in figures 3 and 4, respectively. Figure 3 shows that the humidity of the laboratory was always lower than the humidity in the distribution networks. Figure 4 also shows that the laboratory temperatures were always lower than the temperature in the Mombasa network. More impor-
TABLE 3. Summary of environmental conditions during the study period
Measurement Mombasa NairobiRoom
conditionsEnvironmental
chamber
Minimum temperature (oC) 17.9 19.4 18.1 38.2Maximum temperature (oC) 37.2 30.6 28.0 42.9Mean temperature (oC) 27.3 25.1 23.7 39.6Standard deviation of the mean temperature (oC) 2.5 3.2 4.2 0.74Minimum RH (%) 32.0 33.5 23.5 83.0Maximum RH (%) 61.5 49.5 38.5 91.0Mean RH (%) 51.2 46.3 28.9 87.5Standard deviation of the mean RH (%) 6.5 3.0 4.2 1.4
RH, Relative humidity
FIG. 2. Datalogger measurements of temperature and humid-ity of double-fortified salt in the Highland Zone (Nairobi), Kenya
13.0
16.5
20.0
23.5
27.0
30.5
27.0
31.7
36.4
41.1
45.8
50.5
Tem
pera
ture
(°C
)
Rel
ativ
e hu
mid
ity (
%)
Relative humidity
Temperature
12 pmMar 25,
2002
9:12 pmApr 16,2002
6:24 amMay 9,2002
3:36 pmMay 31,
2002
12:48 amJun 23,2002
10 amJul 15,2002
T. Oshinowo et al. Stability of double-fortified salt

268 269
tant, the two figures show that the conditions of 40oC temperature and about 90% relative humidity in the environmental chamber were always higher than those obtained in the networks. The conditions in the labora-tory and the environmental chamber represented valid lower and upper levels of temperature and humidity expected and experienced in the field.
Discussion
Iron stability
The iron added to the salt was in the ferrous state. Fer-rous iron can be oxidized to the less bioavailable ferric form by oxygen, potassium iodate, and salt impurities. The stability of ferrous iron in the double-fortified salts is shown in table 4. As expected on the basis of earlier laboratory tests, the ferrous iron concentration was not significantly reduced while in the distribution networks. Ferrous iron retention values were generally
greater than 83% for both the Mombasa and Nairobi zones, in all formulations prepared with iodated salt or with microencapsulated potassium iodide premix.
Iodine stability
Iodine stability is critical for the success of salt double-fortification. Many of the earlier attempts to produce double-fortified salts were unsuccessful in protecting iodine from loss through sublimation. The iodine sta-bility of most formulations was satisfactory, as shown in table 4. The commercially iodated salt retained more than 96% of its iodine after going through the distri-bution networks. Formulations with ferrous fumarate premix and iodated salt or potassium iodide premix generally exhibited good iodine stability in both dis-tribution networks, with the exception of formulation 4. The data confirmed that microencapsulation of iron is effective in preventing the loss of iodine from refined double-fortified salt stored and distributed under tropical conditions.
TABLE 4. Retention of micronutrients in double-fortified salts after three months in the distribution network
Formula-tion no.a
Iodine retention (%) Ferrous iron retention (%)
Mombasa (average of A and B)
Nairobi (average
of C and D)
UT lab (E)
UT environmental chamber (F)
Mombasa (average of A and B)
Nairobi (average
of C and D)
UT lab (E)
UT environmental chamber (F)
Control 99 96 95 962 92 87 58 68 90 86 90 853 51 71 79 79 85 83 91 85
4 71 28 1000 1000 83 91 98 915 67 78 87 98 90 84 88 876 92 77 33 39 91 83 96 897 91 75 67 85 95 93 100 918 91 69 32 1000 91 84 92 85
UT, University of Torontoa. Refer to table 2 for descriptions of the formulations.
FIG. 3. Comparison of the various levels of relative humidity
Rel
ativ
e hu
mid
ity (
%)
0
20
40
60
80
100
Date
Mombasa Nairobi Room conditions
Environmental chamber
Mar25,
2002
Apr8,
2002
Apr 22,
2002
May 6,
2002
Jun 3,
2002
Jun 17,
2002
Jul 1,
2002
May 20,
2002
FIG. 4. Comparison of the various temperatures
Tem
pera
ture
(°C
)
0
10
20
30
40
50
60
70
Date
Mombasa Nairobi Room conditions
Environmental chamber
Mar25,
2002
Apr8,
2002
Apr 22,
2002
May 6,
2002
Jun 3,
2002
Jun 17,
2002
Jul 1,
2002
May 20,
2002
T. Oshinowo et al. Stability of double-fortified salt
270
Color stability
All the samples, on their arrival back in Toronto from the distribution networks in Kenya, were closely exam-ined for visible physical changes in texture and color. No caking was observed in any of the field samples, but there was some caking in some of the samples stored at high temperature and humidity in the environmental chamber.
Double-fortified salts prepared with various formu-lations of ferrous fumarate premix were color stable in the Mombasa and Nairobi networks. These salts were also stable in storage at room conditions in our labora-tory and in the severe climate of the environmental test chamber. The only exception was formulation 2, which developed pink stains in the Mombasa network and purple spots in the environmental chamber. This was most likely due to the release of iodine by the leakage of iron from the microcapsule, mediated by elevated temperature and humidity. A blue or purple color is expected if free iodine is produced by a redox reaction with impurities or iron in the presence of starch from the encapsulating system. A reddish, brown, or yellow color can be produced by iron oxidation from ferrous to ferric fumarate.
Conclusions
The results confirmed the stability of double-fortified salts prepared with ferrous fumarate under typical environmental conditions of the salt distribution net-works in Kenya. The microencapsulated double-forti-
fied salt formulations retained most of the ferrous iron and iodine during the three-month study period.
Although the actual temperatures and the various levels of relative humidity experienced by the data-loggers were somewhat lower than the values in our environmental chambers, the results indicate that tests in our ambient laboratory conditions and in our envi-ronmental chamber set at 40°C with a relative humid-ity of approximately 100% provide realistic lower and upper levels for modeling stability under tropical field conditions.
The polyethylene film bundle wrapping of the salt packs provides significant protection from ambient humidity, as exposure of some eight weeks elapsed before the relative humidity in the packs equilibrated with the ambient humidity levels.
The field tests clearly demonstrated that salt double-fortified with iodine and microencapsulated iron can protect both iodine and the ferrous iron during dis-tribution and retail in typical tropical conditions in Kenya’s highlands and humid lowlands. This paves the way for large-scale effectiveness and efficacy testing of double-fortified salt.
Acknowledgments
We gratefully acknowledge the financial support of the Micronutrient Initiative and the assistance of UNICEF and its field offices in handling and closely monitor-ing the salt samples while they were in the distribution networks.
References
1. Clydesdale FM, Wiemer KL, eds. Iron fortification of foods. Monograph Series, Food Science and Technology. Orlando, Fla, USA: Academic Press, 1985.
2. Mwaniki DL, Omwega AM, Muniu E. Anaemia and status of iron, vitamin A and zinc in Kenya. KEMRI/UNICEF/Ministry of Health 1999, Nairobi: National Micronutrients Survey, Kenya, 2001.
3. Venkatesh Mannar MG. Control of iodine deficiency disorders by iodization of salt: strategy for developing countries. In: Hertzel BS, ed. The prevention and con-trol of iodine deficiency disorders. Amsterdam: Elsevier, 1987:111–125.
4. Hurrel RF, Cook JD. Strategies for iron fortification of foods. Trends Food Sci Tech 1990;3:56–61.
5. Rao BS, Vijyasarathy C. Fortification of common salt with iron: effect of chemical additives on stability and bioavailabilty. Am J Clin Nutr 1975;28:1395–401.
6. Zoller JM, Wollinsky I, Paden CA, Hoskin JC, Lewis KC, Lineback DR, McCarthy RK. Fortification of non-staple food items with iron. Food Tech 1980;34:39–47.
7. Diosady LL, Alberti JO, Ramcharan K, Venkatesh Mannar MG. Iodine stability in salt double fortified with iron and iodine. Food Nutr Bull 2002;23:196–207.
8. Yusufali R. Appropriate technologies for double forti-fication of salt. M.A.Sc. Thesis, University of Toronto, Canada, 2001.
9. Lofti M, Venkatesh Mannar MG, Merx RJHM, Naber van den Heuvel P. Micronutrient fortification of foods, current practices, research and opportunities. Ottawa, Canada: Micronutrient Initiative, International Devel-opment Research Centre, and International Agriculture Centre, 1996.
10. Heydorn K. CRC’s neutron activation analysis for clini-cal trace elemental research. Boca Raton, Fla, USA: CRC Press, 1984;1:84–112.
11. Association of Official Analytical Chemists. Official method of analysis, 14th ed. Method 33.149. Arlington, Va, USA: AOAC, 1984.
12. Diosady LL, Alberti JO, Venkatesh Mannar MG, Fitz-gerald S. Stability of iodine in iodized salt used for cor-rection of iodine-deficiency disorder. II. Food Nutr Bull 1998;19;240–50.
13. Harvey AE, Smart JA, Amis ES. Simultaneous spectro-photometric determination of iron (II) and total iron with 1,10-phenanthroline. Anal Chem 1955;27:26–9.
T. Oshinowo et al.

Food and Nutrition Bulletin, vol. 25, no. 3 © 2004, The United Nations University. 271
Abstract
While the realization that AIDS is far more than a health problem has dawned only recently, many development organizations have yet to undertake thorough analyses of what this means for what they do, and how they do it. Even fewer have actually changed their policies and procedures to adjust to these new realities. We know that food and nutrition are fundamentally intertwined with HIV transmission and the impacts of AIDS. Food and nutrition security is fundamentally relevant to all four of the conventional pillars of HIV/AIDS response—pre-vention, care, treatment, and mitigation—and food aid can be an important weapon in the arsenal. This paper, based on a detailed review of the relevant literature and the findings of a mission to eastern and southern Africa, highlights the implications of the HIV/AIDS pandemic for food aid strategy and programming. By viewing food aid programs through an “HIV/AIDS lens” and in the context of a livelihoods approach, the authors argue that organizations can effectively design interventions that reduce both susceptibility to HIV and vulnerability to AIDS impacts. Though there is little empirical evidence regarding the effectiveness of food aid in responding to HIV/AIDS, the authors argue that this should not con-strain action. Using past experience as a guide, organiza-tions can learn by doing, documenting, and continually reassessing their programs using the evolving lens, so as to ensure maximal relevance and impact.
Key words: Africa, food aid, HIV/AIDS, HIV/AIDS lens
Introduction
It has taken two decades for HIV/AIDS to be recognized as a serious threat to development and human security by governments and by humanitarian and development agencies. Given the socioeconomic, cultural, and political underpinnings of the pandemic, there is an urgent need for all sectors to reassess their roles, both actual and potential, in combating HIV/AIDS. Such a response is critical if the Millennium Development Goal of halving the spread of HIV/AIDS by 2015 is to be met, just as it is critical for the achievement of other Millennium Development Goals, including the pivotal poverty and hunger goal.
Evidence of the two-way linkages between food and nutrition insecurity and HIV/AIDS is increasingly well documented. The 2002–03 southern African food crisis highlights how vulnerable households, communities, and countries are to shocks that disrupt food produc-tion and consumption. Unlike earlier famines, e.g., that in mid-1980s Ethiopia, HIV/AIDS is not only deepen-ing vulnerability, but changing its nature, in ways that have profound implications for response strategies. The response to HIV/AIDS is conventionally disaggregated into the four pillars of prevention, care, treatment, and mitigation. Food and nutrition security is fundamen-tally relevant to all four strategies [1].
Many policy and project instruments exist for tack-ling food insecurity, including measures to enhance agricultural productivity, investments in market infra-structure, and implementation of community-based nutrition programs. Given the interactions between HIV/AIDS, food, and nutrition, national HIV/AIDS policies are also important, not only for combating the epidemic, but also for promoting food and nutri-tion security.
No one instrument can deal with the scale and many dimensions of food insecurity, now further
Rethinking food aid to fight AIDS
Suneetha Kadiyala is affiliated with the International Food Policy Research Institute, Washington, DC, and the Fried-man School of Nutrition Science and Policy, Tufts University, Boston, Massachusetts, USA. Stuart Gillespie is affiliated with the International Food Policy Research Institute, Washington DC.
Please address inquiries to corresponding author: Suneetha Kadiyala, International Food Policy Research Institute (IFPRI), 2033 K St., Washington, DC, 20006 USA; e-mail: [email protected].
A working version of this paper was previously posted on the IFPRI website as a discussion paper (www.ifpri.org/divs/fcnd/dp/papers/fcndp159.pdf ).
Mention of the names of firms and commercial products does not imply endorsement by the United Nations University.
Suneetha Kadiyala and Stuart Gillespie

272 273
exacerbated by HIV/AIDS. In this paper we consider whether food aid* can be an effective weapon in the war against AIDS. It has been argued that such a role might detract from preexisting food security goals. This, however, assumes that AIDS and food insecurity are unrelated problems. They are not. In fact, they are becoming inextricably intertwined. Where food inse-curity and AIDS coexist, proceeding with “business as usual” (where AIDS is often viewed as “someone else’s responsibility”) may compromise not only an organi-zation’s ability to achieve its preset goals, but also the very relevance of these goals.
To help practitioners understand the dynamic interactions of HIV transmission and AIDS impacts on different sectoral concerns, and to then identify appropriate policy and program modifications in the face of these realities, we propose the use of an “HIV/AIDS lens” [1]. The lens is essentially a tool to help review situations and/or policy/program actions, draw-ing upon knowledge of the way HIV/AIDS interacts with another given problem. For example, poverty may force families to split up temporarily as an adult goes in search of work. The benefits may include increased household income but—if we apply the lens—we may highlight some major costs if this dislocation leads to more frequent sexual interactions. There may be a sig-nificantly greater risk of the migrating individual (as well as his/her partner who remains) being infected with HIV. This is just one example of the changes to the policy context wrought by the various HIV risks and AIDS-related vulnerabilities.
Such a reviewing of policies and programs precludes the common reflex of “new problems, new programs.” Clearly, not everything needs to change because of AIDS, but it is important to have a mechanism for thinking through the various options. Though there is no hard evidence yet showing the effectiveness of food aid in responding to HIV/AIDS, guidance based on experience is becoming more available [2, 3]. A learn-ing-by-doing approach should be adopted, including documentation and continual monitoring of program relevance and effectiveness so as to maximize impact.
The first section of this paper provides some back-ground on the nature of the HIV/AIDS shock, its implications for people’s livelihoods, and thus on the potential role of development food aid, both in terms of preserving livelihoods and in terms of basic survival. We do not discuss the specifics of how to mainstream HIV/AIDS into emergency food aid distribution. Rather, we refer the reader to the growing body of knowledge and guidelines on this issue elsewhere [4–7].
We introduce concepts such as susceptibility/resistance and vulnerability/resilience. The next sec-
tion looks into the important issue of targeting, before analyzing in detail current food aid program types and their possible contribution to reducing susceptibility to HIV and/or vulnerability to AIDS impacts. Prior to concluding, the last section demonstrates how the HIV/AIDS lens can be applied to some cross-cutting strategic issues relating to capacity, advocacy, imple-mentation, monitoring, evaluation, and operational research.
Adopting a livelihoods approach
In order to better understand how interventions may support people’s livelihoods, it is useful to differenti-ate two important aspects of these livelihoods—their susceptibility to HIV and their vulnerability to AIDS impacts [1]. Susceptibility to HIV relates to the chance that an individual, household, community, or livelihood system will become exposed to HIV or to significant HIV infection rates. The positive converse of susceptibility is resistance. Vulnerability relates to features of the social, economic, cultural, and physical environment or process that make it more likely that HIV/AIDS will have negative impacts at a certain level (e.g., the individual, household, or community level). Much has been written about this in recent years [8, 9] and more hard data are emerging from new studies [10]. The positive flipside of vulnerability is resilience, or the ability to bounce back after a shock.
Figure 1 places susceptibility and vulnerability to HIV/AIDS in a livelihoods context. HIV/AIDS is likely to have an impact on the assets of households and on institutions, community-based or otherwise. The type and severity of these impacts will be conditioned by the vulnerability of the system, community, or household. These impacts will lead to strategic responses made at different levels, which in turn will lead to certain outcomes, e.g., on food security, nutrition, etc. It is important here to realize that these outcomes them-selves condition future susceptibility and vulnerability of livelihoods and of the households and communities that depend upon them. These relations demonstrate the interconnectedness and the intergenerational aspect of HIV/AIDS impacts.
Rethinking targeting
Targeting is a dynamic and iterative process that involves defining target groups, identifying individu-als within target groups, and ensuring that assistance reaches beneficiaries and meets their needs. Usually a combination of methods is used to identify who is most vulnerable in terms of risks to livelihoods and food and nutrition insecurity, and where they are. Most com-monly, geographic targeting (to identify food-insecure
* For the purposes of this paper food aid and food assist-ance are defined as targeted in-kind transfers to vulnerable groups.
S. Kadiyala and S. Gillespie Rethinking food aid for AIDS
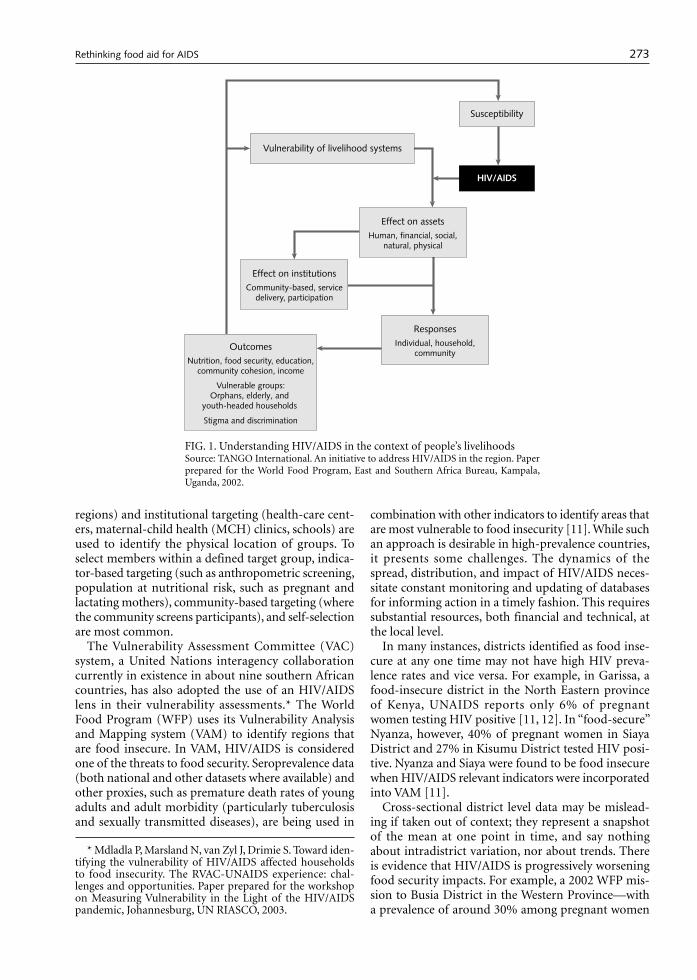
272 273
regions) and institutional targeting (health-care cent-ers, maternal-child health (MCH) clinics, schools) are used to identify the physical location of groups. To select members within a defined target group, indica-tor-based targeting (such as anthropometric screening, population at nutritional risk, such as pregnant and lactating mothers), community-based targeting (where the community screens participants), and self-selection are most common.
The Vulnerability Assessment Committee (VAC) system, a United Nations interagency collaboration currently in existence in about nine southern African countries, has also adopted the use of an HIV/AIDS lens in their vulnerability assessments.* The World Food Program (WFP) uses its Vulnerability Analysis and Mapping system (VAM) to identify regions that are food insecure. In VAM, HIV/AIDS is considered one of the threats to food security. Seroprevalence data (both national and other datasets where available) and other proxies, such as premature death rates of young adults and adult morbidity (particularly tuberculosis and sexually transmitted diseases), are being used in
combination with other indicators to identify areas that are most vulnerable to food insecurity [11]. While such an approach is desirable in high-prevalence countries, it presents some challenges. The dynamics of the spread, distribution, and impact of HIV/AIDS neces-sitate constant monitoring and updating of databases for informing action in a timely fashion. This requires substantial resources, both financial and technical, at the local level.
In many instances, districts identified as food inse-cure at any one time may not have high HIV preva-lence rates and vice versa. For example, in Garissa, a food-insecure district in the North Eastern province of Kenya, UNAIDS reports only 6% of pregnant women testing HIV positive [11, 12]. In “food-secure” Nyanza, however, 40% of pregnant women in Siaya District and 27% in Kisumu District tested HIV posi-tive. Nyanza and Siaya were found to be food insecure when HIV/AIDS relevant indicators were incorporated into VAM [11].
Cross-sectional district level data may be mislead-ing if taken out of context; they represent a snapshot of the mean at one point in time, and say nothing about intradistrict variation, nor about trends. There is evidence that HIV/AIDS is progressively worsening food security impacts. For example, a 2002 WFP mis-sion to Busia District in the Western Province—with a prevalence of around 30% among pregnant women
FIG. 1. Understanding HIV/AIDS in the context of people’s livelihoodsSource: TANGO International. An initiative to address HIV/AIDS in the region. Paper prepared for the World Food Program, East and Southern Africa Bureau, Kampala, Uganda, 2002.
Susceptibility
Vulnerability of livelihood systems
Effect on assetsHuman, financial, social,
natural, physical
ResponsesIndividual, household,
community
Effect on institutionsCommunity-based, service
delivery, participation
OutcomesNutrition, food security, education,
community cohesion, income
Vulnerable groups:Orphans, elderly, and
youth-headed households
Stigma and discrimination
HIV/AIDS
* Mdladla P, Marsland N, van Zyl J, Drimie S. Toward iden-tifying the vulnerability of HIV/AIDS affected households to food insecurity. The RVAC-UNAIDS experience: chal-lenges and opportunities. Paper prepared for the workshop on Measuring Vulnerability in the Light of the HIV/AIDS pandemic, Johannesburg, UN RIASCO, 2003.
S. Kadiyala and S. Gillespie Rethinking food aid for AIDS

274 275
[12]—found a large number of households with severely compromised access to food and an unusu-ally high number of orphans on the street. Even though affected households reside in food-secure regions, they are vulnerable to future food insecurity and other developmental impacts of HIV/AIDS.
The effects of the pandemic at an aggregate level are not immediate, and their cumulative effect may not be seen for some time. A food-secure region may have a high prevalence of HIV because it has attracted people (“men, mobility, and money” conventionally viewed as being the first ingredients of an epidemic), but this does not indicate what might happen in the future. Moreover, there is evidence of strong interlink-ages between the HIV status of richer households and the food security of poorer households. A study by the Famine Early Warning Systems Network (FEWSNET) in Makueni District, Kenya, has shown that as HIV-related expenditures of richer households increase, there is less money for hiring in labor from poorer households who also suffer. A recent study analyzing current and earlier data has now shown that the 2002 drought in southern Africa interacted with HIV/AIDS in high-prevalence areas to bring about a rapid dete-rioration in child nutrition, but mainly in areas that previously had better child nutrition, so the effect is not so obvious when averages are viewed. There appears to be a leveling out with regard to child malnutrition rates between urban and rural areas [13].
In this way, food insecurity and HIV/AIDS may increasingly converge over time. Within high-preva-lence regions, it may be justifiable to target food assistance to vulnerable groups as defined by the communities, regardless of the food security status of the province as a whole. In Mbeere District, Kenya, which has an HIV prevalence rate of 26% but is food secure at the district level, WFP Kenya aims to provide take-home family rations through the School Feeding Project as an incentive for labor-poor households to send children to school and to make it possible for foster families to absorb orphans [14].
In community-based targeting, community members decide who participates and benefits from a food assist-ance project. Communities, however, are heterogene-ous groups where discrimination, stigma, and social exclusion towards those afflicted by HIV/AIDS are still a serious problem. Exclusively targeting individuals or households affected by HIV/AIDS may exacerbate stigma and discrimination. To ensure that the most vulnerable households and groups are included in food assistance programs, implementing organizations need to establish a dialogue with the community to understand the level of stigma and norms and practices with regard to HIV/AIDS and to gauge the likelihood of HIV-related exclusion from the program.
Rethinking interventions
The choice of the intervention can enable or hinder the participation of HIV/AIDS-affected populations. Food-assisted projects should be relevant to the needs and capacities (including labor, time, and risk-taking capacities) of these populations. Our point of depar-ture is thus the question: How best can food assist-ance be tailored to respond to the various impacts of HIV/AIDS? We suggest ways in which organizations can design programs that potentially reduce both susceptibility to HIV and vulnerability to its impacts. The application of an HIV/AIDS lens highlights some cross-cutting issues that should be considered in all food aid interventions:» First, do no harm. “Do no harm” should be the
minimum standard on which all food aid should be programmed.
» Revise the food assistance package. The epidemic is drastically changing the composition and size of households. There is a critical need to factor the implications of these changes into the design (size and composition) of a food assistance package.
» Ensure nutritional quality of the food ration. Good nutrition is both the first line of defense and the first line of attack against HIV/AIDS. Energy require-ments of people living with HIV/AIDS (PLWHAs) are raised by between 10% in the asymptomatic phase and 20% to 30% in the symptomatic HIV infection. Further, children experiencing weight loss have increased energy requirements of 50% to 100% over normal requirements [15]. Although the guidelines do not propose increased requirements for protein, fat, and micronutrients, even a slight shortfall below the recommended dietary allowance (RDA) may hasten the progression of HIV to AIDS. Others affected by the pandemic are highly vulner-able to malnutrition. It is critical that the food assist-ance package for populations in high-prevalence communities provide adequate macro- and micro-nutrients. Special efforts should be made to fortify staple foods with multivitamins and minerals and to provide locally acceptable fortified and blended micronutrient foods to PLWHAs, as they are easy to prepare, swallow, and digest and they are highly nutrient dense. In addition, food assistance, to the extent possible, should be coupled with nutrition education, to make the best use of locally available resources.
» Focus on women. Women are more susceptible to HIV infection for biological, socioeconomic, and cultural reasons. In sub-Saharan Africa, 58% of the people infected are women. They are also severely vulnerable to AIDS impacts. All food aid interven-tions should aim to increase the resistance and resil-ience of women to HIV/AIDS.
S. Kadiyala and S. Gillespie Rethinking food aid for AIDS

274 275
» Reduce susceptibility to HIV. Whenever a food aid program is likely to increase the susceptibility to HIV, it is critical that such interventions be accompanied by effective prevention activities. In addition, food aid and its distributions points can be the entry point for prevention activities. For example, food for train-ing could be provided to teachers in counseling stu-dents on safe sexual behavior; food-distribution sites in refugee camps could be used for disseminating information regarding HIV/AIDS, rights of children, encouragement of utilization of health services, and so on.
Enabling vulnerable groups to meet nutritional needs
There is a need to expand and intensify food assistance to respond to the needs of groups who are at risk for malnutrition in the dynamic vulnerability context of HIV/AIDS. Nutrition interventions are crucial to sup-port the increasing numbers of affected populations including, but not necessarily limited to, PLWHAs and orphans and vulnerable children (OVCs). They may also play an important role in reducing the risk of mother-to-child transmission of HIV (MTCT).
Prevention of mother-to-child transmission (PMTCT)
Improved maternal nutrition, combined with HIV test-ing, information, counseling, and antiretroviral drug provision, is key in PMTCT. Many studies suggest the importance of maternal nutritional status in vertical transmission of HIV by the following:» Enhancing systemic immune function in the mother
or fetus and reducing the rate of clinical, immuno-logical, or viral progression in the mother [16–20];
» Reducing viral load or the risk of viral shedding in lower genital secretions or breastmilk [21–24];
» Reducing the risk of low birthweight and prema-turity or by maintaining the child’s gastrointestinal integrity [18, 25–28]. A few observational studies suggest that low serum
levels of vitamin A among HIV-positive pregnant women are associated with a higher risk of vertical transmission of HIV [29, 30]. However, antenatal sup-plementation of vitamin A in Malawi and South Africa did not reduce the risk of vertical transmission in utero, intrapartum, and through early breastfeeding, although it decreased the risk of adverse birth outcomes [26, 27]. In Tanzania, multivitamin supplementation of lactating mothers (6 to 24 weeks postpartum) had a protective effect on transmission through breastfeeding and on mortality among nutritionally and imunologically compromised women [31].
In order to reduce the risks of vertical transmission, UN guidelines advise HIV-positive mothers to exclu-
sively breastfeed up to six months after delivery where safe alternatives are not “acceptable, feasible, afford-able, sustainable and safe” [32, 33]. After this time, the guidelines suggest that mothers switch exclusively to breastmilk substitutes.
HIV-positive mothers in food-insecure households may require support to enable this. Through the usual MCH channels or PMTCT initiatives, food aid organi-zations could consider providing take-home, micro-nutrient-fortified food rations for infants to help the transition from exclusive breastfeeding to complete replacement feeding at six months. Such support could be extended until the infant is 30 months old. This is a difficult area, in which our knowledge of risks, benefits, and operational feasibility is still evolving. Operational research here could shed some light on the practicalities of implementing current World Health Organization (WHO) guidelines and help understand if and where food assistance may be useful.
Food supplementation in home-based care (HBC)
Food aid has a major role to play in providing nutri-tional support through home-based care. To date, such efforts are still disjointed and inadequate. A majority of the existing HBC programs do not have a food component [34].
Research shows that adequate nutrition has multiple positive effects for PLWHAs, including enhancement of the body’s ability to resist opportunistic infections, delaying the progression of HIV to AIDS, increasing the effectiveness of drug treatment, and improving psychosociological status and general quality of life [35–37]. Adequate nutrition can thus prolong the economically active life of PLWHAs and contribute to their “positive living,” enabling them to pass on impor-tant skills and knowledge to their children, plan for their children’s future, prepare them psychologically, and delay orphanhood. Food, indeed, may very well be their most important medicine. Here, operational research is necessary to provide much-needed empiri-cal evidence on the role of food and nutrition in the socioeconomic and nutritional well-being of PLWHAS and their families.
HBC should, as far as possible, be a holistic package, which includes health (basic drugs and hygiene), nutri-tional and psychological support to the sick individual, guidance to caregivers in taking care of the sick, HIV prevention, and nutrition education.
Ideally, HBC interventions should link other family members to programs that strengthen resilience through preserving livelihoods and/or building human capital. But in many cases, there may be no surviving adult members—just the elderly and children who may need continued assistance. Some children may be placed with extended families. There are many different potential scenarios, and depending on local realities,
S. Kadiyala and S. Gillespie Rethinking food aid for AIDS

276 277
vulnerable members could be reached through other targeting and programming modalities.
HBC is often constrained by problems of inadequate resources, an unreliable supply of basic medicines, and inconsistent volunteerism [38]. With the burgeoning numbers of people affected by HIV/AIDS, nongovern-mental organizations report consistently high dropout rates of volunteers, often leading to compromised pro-gram quality and high recurring costs of training new volunteers. It is time to explore new mechanisms to reinforce volunteerism and self-reliance in communi-ties. An important operational research question here is: Can food be used to cover opportunity costs in high-prevalence communities and promote volunteerism, without undermining community self-reliance?
Supplementary feeding for orphans and vulnerable children (OVC)
One of the most disturbing long-term consequences of the AIDS pandemic is the growing number of orphans. The survival, food security, health, and development of many other children is also increasingly jeopardized due to the effects of AIDS on families and communities. These children are referred to as vulnerable children. A recent WFP report cautions treating orphans and vulnerable children as a homogeneous group, as they face different risks, and boys face different risks than girls. These differences should be taken into account in designing and targeting policies and programs [39]. According to recent estimates, 10 countries in southern Africa have orphan rates higher than 15%. Both the number and the percentage of orphans due to AIDS are estimated to increase rapidly in the next decade [40].
Orphans are particularly vulnerable to a range of problems, including early school dropout, malnutri-tion, and psychosocial deprivation. Community mem-bers themselves have constrained resources, including food and time for child care [41]. Exploitation of orphans may increase the susceptibility of children to HIV.
Strengthening community capacity to care for OVCs is critical in the fight against HIV/AIDS, and food aid has a role to play here. For example, establishment of day-care centers (for all preschool children and not just for OVCs) eases the burden of caring, permitting adults to be involved in economically productive activities (see Box 1). On-site feeding at these centers could ease household food security constraints and supplement the diets of preschool children. Food aid organiza-tions will need to partner with government and other organizations to ensure that interventions are holistic (for example, providing deworming and immuniza-tion services). Food for training can be provided to health and nutrition workers who are responsible for growth promotion, immunizations, and other services,
depending on the context. Such interventions are criti-cal in an HIV/AIDS context, where health centers may be increasingly overburdened and households increas-ingly impoverished and thus unable to afford the time, transport, or user fees to access health services.
Given the enormity of the orphan crisis in sub-Saha-ran Africa, the role of orphanages cannot be ruled out, especially in urban settings. Institutional care may be the only option for orphans in conflict and postconflict situations, where foster care is infeasible [43]. Com-munity-based institutions such as small group homes and children’s villages are also emerging in response to the burgeoning orphan population [39]. Food aid organizations should carefully assess the pros and cons of food assistance to orphanages and other commu-nity-based institutions. Such interventions should, as far as possible, be conditional on orphans’ attendance at school or vocational training (see the next section). Training of youth (especially in community-based care settings) in home gardening and raising farm animals to supplement income and diet has a potential to increase access to food and improve diet quality [39].
Enabling education and training
“Everything—from the demand for education, the supply of education, the availability of resources for education, the clientele, to the actual process of educa-tion—is affected” [39].
Food for education (FFE)
Food for education may have an important role to play in combating HIV/AIDS in some of the following ways: in the long run, it has the potential to increase house-hold resilience by expanding the economic opportuni-
BOX 1. Mentoring OVCS in Rwanda: nkundabanas
CARE Rwanda is currently piloting projects where child heads of households choose a person they trust within the community as mentor or nkundabana, (“one who loves children”). CARE provides a family food basket to these child-headed households (covering 70% of their food needs) as well as to nkundabanas who are trained in counseling, psychosocial support, and life skills. The food basket allows older children in child-headed households to participate in productive activities, such as skills train-ing and income-generating activities, while the younger ones are able to continue formal education.
Freedom from Hunger International (FHI) also reaches child-headed households in and around Gitarama with its Nkundabanas project. In addition to linking heads of child-headed households and training them in income-generating skills, FHI brings them together in mutual support groups [42].
S. Kadiyala and S. Gillespie Rethinking food aid for AIDS
276 277
ties that come with education; educated children are more likely to internalize information on prevention of HIV; and girls especially may become empowered and therefore less susceptible to HIV.
FFE programs usually aim to reach school-going chil-dren in chronically food-insecure regions. Food is pro-vided either as on-site school feeding or as take home rations. In some regions, girls are provided a take-home ration as an incentive for families to send their girls to school—counteracting the common tendency of girls’ education to be curtailed first [44]. Studies have shown that school feeding can reduce hunger-related lethargy, improve academic performance, and provide an incentive for enrolment and attendance in schools [45, 46]. In response to the crisis in formal schooling due to HIV/AIDS, communities have started informal community schools and other informal education modalities, such as interactive radio listening groups in Zambia, often run by volunteers.
Food has a role to make education more accessible to affected children, including OVCs. This role includes continuing to support school feeding in formal schools in chronic food-insecure regions; expanding formal school feeding to high-prevalence areas regardless of the food security situation at the district level to decelerate dropout of OVCs; expanding food for education to informal community schools in high-prevalence communities where the most vulnerable children tend to access education; providing food to cover the opportunity costs of volunteer teachers and mentors in the informal education system, including for their training, so even the most vulnerable children can access better-quality education; providing food for HIV/AIDS training to all teachers and volunteers (in both formal and informal schools) to ensure that they have necessary skills and information to communicate, guide, and counsel students; and supporting HIV/AIDS education in all schools through appropriate partner-ships (Box 2).
In food-secure, high-prevalence areas, a take-home ration for OVCs is less likely to be stigmatizing. For
example, in Malawi and Mozambique, WFP aims to provide take-home rations to girls and orphans [47, 48].
Many orphans and vulnerable children drop out or do not go to school because of the prohibitive cost of school fees, textbooks, and uniform. Food aid organiza-tions could work with other partners to provide such nonfood items, which are crucial for increasing the enrolment rate and lowering the school dropout rate.
Food for training (FFT)
Children who lose one or more parents are less likely to be in school and more likely to be working more than 40 hours a week [40]. Youth should be pro-vided with opportunities for vocational training to enable them to acquire livelihood skills to offset the loss of intergenerational skills transfer when parents die prematurely (e.g., to inculcate agricultural skills required to maintain land productivity). Food rations could be provided as an incentive to attend the train-ing for the duration of training and for a few months after, to enable the beneficiaries to get a foothold in the market. Vocational training of youth may lead to urban migration and therefore increased susceptibility. FFT should therefore be combined with HIV awareness and life skills training. Linkages to microcredit serv-ices or start-up financing schemes should be explored wherever possible.
FFT could also be used as an incentive (and to cover the opportunity costs) to train peer-support volunteers, home-based care, and other volunteers involved in pre-vention, care, and mitigation activities, as illustrated throughout this paper. For example, traditional birth attendants could also be trained in improved delivery techniques to reduce MTCT.
Enabling the poor to preserve and gain assets
As shown in figure 1, asset stripping is a major destruc-tive response to HIV/AIDS impacts at the household and community levels. Food assistance has an impor-tant potential in buffering such impacts to the point at which assets may be preserved in the short term and even augmented over a longer period.
Food for work (FFW) programs
Food for work programs use food as an income transfer in exchange for work. They typically seek to address chronic food insecurity by creating assets such as roads to improve access to markets, irrigation facilities, or land terracing to reduce erosion or forestry. But what is the relevance of FFW programs in a high HIV-preva-lence, chronically food-insecure area? Self-targeting for
BOX 2. Comic books for HIV/AIDS education in Ethiopia
WFP Ethiopia along with the Ministry of Education is promoting HIV awareness through the existing program structure in five food-insecure communities. Recognizing that schoolchildren are potential channels of information dissemination and communication to other household members, WFP aims to mobilize resources to develop age–suitable educational materials on HIV/AIDS, includ-ing comic books, leaflets, and posters in local languages to be distributed to children in formal and nonformal schools. Anti-AIDS clubs are being supported to pro-vide peer group volunteers and community support groups [49].
S. Kadiyala and S. Gillespie Rethinking food aid for AIDS

278 279
labor-intensive programs may leave out a large portion of the needy population who are too weak or busy with intrahousehold caretaking to participate. Households headed by children and the elderly will also be excluded. The premises of labor abundance and self-targeting, on which FFW is based, are unlikely to apply in high HIV-prevalence areas [50]. There may well be skilled labor shortages as a result of HIV/AIDS, and this will need to be addressed in the design and implementation of projects. There is a need also to think creatively about how labor-scarce households can be assisted at times of the agricultural year when labor is especially impor-tant, for plowing, for instance. For example, an FFW program could pay labor-surplus households to work the fields of labor-constrained households (Box 3).
On the other hand, by ensuring food wages to other people in the community, FFW projects may indirectly enable communities to deal with the crisis. FFW projects aimed at reducing distress migration have a high potential to reduce susceptibility to HIV. Yet, it is important to understand how certain projects may also increase susceptibility to HIV. For example, von Braun et al. [51] report multiplier effects of an FFW-built road in Ethiopian lowlands, where result-ing improved market access led to the establishment of water mills and fruit plantations and revival of tra-ditional spinning and weaving in the three years after the road was built.
Where such projects “crowd in” private investment, they may also potentially increase risky behaviors, especially if they cause greater labor mobility, result-ing in the formation of new sexual networks and an expansion of sex work [52]. This is not to suggest that well-conceived and well-managed FFW projects be abandoned, but it is vital to anticipate such potentially
risk-increasing effects and address them in project design and implementation. Partnerships should be explored for linking to local community-based organizations and nongovernmental organizations that can help to deliver complementary services such as Voluntary Counseling and Testing (VCT), peer education programs, access to condoms, access to treatment of sexually transmitted infections (STIs), and basic drugs.
Income-generating activities (IGA) and microcredit
Food rations may be used to permit poor households to dedicate time and energy to developing and expand-ing income-generating activities. Target groups have conventionally been women’s groups. Food assistance is provided to cover the opportunity costs of learning new skills and as an income transfer.
Microcredit can be an important element in ini-tiating income-generating activity and sustaining it. Parker et al. [53] note that the inherent limitation of conventional microcredit in HIV/AIDS contexts is that it cannot serve the most needy, as the terms of loans tend to be fairly inflexible. Microcredit programs are also often limited in reaching the ultra-poor, a group with a high risk of loan default.* Webb et al. [54] report that many ultra-poor women feel that IGA investments are either too risky or too time consuming, thus limit-ing their participation. A survey carried out by CARE in Lusaka showed that among the participants in the PULSE microfinance project, death and illness of the family members were major causes of loan default [55]. Webb et al. [54] made similar observations in Bangladesh. In places where women depend on men for marketing the outputs, HIV/AIDS poses particular problems, with men often being the first fatality of AIDS within households. Thus, if microcredit activi-ties are not sensitive to the dynamics of the HIV/AIDS shock at the household level, they may drive the recipi-ents into greater destitution [34].
However, there are some examples of innovations within microcredit (e.g., Opportunity International, serving 30,000 clients throughout Africa [55]), includ-ing provision of death insurance and health insurance for clients and families (including coverage for AIDS treatment), flexible savings plans, greater flexibility on loan sizes and payment schedules, the writing off of loan failures, emergency loans, and HIV/AIDS aware-ness training. An understanding of how women and children allocate their time and whether they can make time for additional activities should drive the IGA intervention. Savings mobilization schemes with
* RESAL. Report on the RESAL seminar “Prospects and limitations of income generating activities as instruments for food security of the poor” held on March 27-28, 2000. in Dhaka, 2001.
BOX 3. Innovations in FFW: labor banks
To counteract neglect of farmland due to labor deple-tion, some agencies have started exploring the formation of labor banks, where willing laborers are engaged in working on individual plots of land owned by those who cannot tend to them. World Vision in Rwanda is exploring the possibility of providing food aid to such laborers.
In Malawi, the STEPS project supported by Save the Children US encourages the establishment and main-tenance of cereal banks and community gardens so that communities can better withstand other shocks. Produce from the community gardens may be used to supplement the diets of OVCs.
In Zambia, in order to ease time constraints of women participating in their FFW project, CARE’s PUSH/PROSPECT project has supported women to establish a crèche (day nursery) close to the FFW site. Through a lot-tery system, women take turns in taking care of children (Eleonore Seumo-Fosso, FANTA Project, Academy of Edu-cational Development [AED], personal communication).
S. Kadiyala and S. Gillespie Rethinking food aid for AIDS
278 279
flexible savings withdrawals and links to innovative microcredit schemes for sustainability of IGAs in an HIV/AIDS context are crucial.
Attention should again be paid to the possible increase in susceptibility to HIV. Frequent contacts with markets to sell outputs could lead to increased adoption of risky behaviors. Vocational training of youth could lead to urban migration and increased susceptibility. Education for behavior change and life-skills training should thus be an integral part of all such programs.
Often, the types of skills that women and youth are trained in are limited by the implementing part-ners’ capacities and expertise. Food aid organizations should seek to partner with organizations that have strong comparative advantage in microcredit activities (rather than food aid management).
HIV/AIDS-related targeting mechanisms, such as PLWHA associations, youth clubs, and child-headed and elderly-headed households should be used in addi-tion to other traditional targeting groups and modali-ties. The duration of programs that aim to reach those affected by HIV/AIDS may have to change. Rahman [56] notes that longer time is required to motivate the risk-averse hardcore poor to participate in microcredit activities and to ensure that they benefit from the serv-ices. Budgets should reflect this with increased admin-istrative costs in the initiation phase of the project. This may also mean that food aid may have to be provided for a longer period of time.
Ensuring the relevance of food aid strategy in an HIV context
In this section we consider some important crosscutting strategic issues. In order to ensure that development assistance of all types remains relevant and appropriate in the context of high HIV prevalence rates, organiza-tions must review their mission, vision, objectives, timelines, and capacities, taking into account these new realities. This may entail restating organizational goals and, within the broad scope of the organization’s mandate, embarking on new initiatives. In this section we apply an HIV/AIDS lens to some of these crosscut-ting issues and then suggest some possible responses.
Capacity development
Rethinking the role of food aid in order to better respond to the changing needs of AIDS-affected pop-ulations is impossible unless modifications are made within organizations. Organizations need to facilitate a process by which people internalize the implications of AIDS for their work, and harness and develop this capacity to respond at the broadest level. This is the essence of mainstreaming.
Recognizing that employees of organizations may themselves be HIV positive (PLWHA), may be at risk for HIV infection, or may be affected by the illness or death of others is a crucial first step. Employees may be subject to discrimination within and outside the workplace or be perpetrators of such discrimination. These personal impacts can severely compromise organizational ability to perform effectively and effi-ciently. WFP’s HIV/AIDS training project for truck drivers, porters, and stevedores in Ethiopia provides an example of how organizations can seize opportu-nities to address the issues of HIV/AIDS in the work place [49].
Employees need to be oriented to ask the question: “How does HIV/AIDS affect my work, both what I do and how I do it?” This demands an understand-ing of what AIDS is doing to their “work,” broadly defined, and ultimately the potential advantages and disadvantages of different programming approaches for combating its effects in different situations. To foster such understanding, staff need to employ an HIV lens for reviewing their core business and the way they undertake it. Staff need to be encouraged to think creatively and proactively about these relationships and how they could change their ways of working. Networking with partners and other organizations within the region to exchange ideas and best practices will increase motivation and can go a long way toward improving practice.
Advocacy
Overriding strategy design and linked directly with it, advocacy is crucial. Food aid organizations can and should play a major advocacy role for the follow-ing reasons: they are on the front line, with firsthand experience of what is happening; food is an increasingly high priority for affected populations; they have the capacity to monitor, evaluate, and communicate widely, with regard to both the problem and its possible solu-tions or interventions (what works); food represents a major potential entry point for helping preserve and sustain livelihoods; economically, advocacy is necessary to raise resources and to strengthen capacity to act on a scale commensurate with the epidemic; and socially, advocacy is necessary to destigmatize the problem of HIV/AIDS, emphasizing its nature as a development problem affecting all aspects of a country’s economy and society. Such advocacy should be fueled by evalu-ations of successful initiatives, as well as lessons learned from less successful endeavors.
Forging partnerships
Development of mutually supporting partnerships is critical to the fight against AIDS [3, 14]. Ultimately, the most important partnership is with the commu-
S. Kadiyala and S. Gillespie Rethinking food aid for AIDS

280 281
nity itself, particularly people living with HIV/AIDS. Throughout the paper, we argue that food assistance projects in HIV/AIDS should adopt the dual goal of reducing susceptibility and vulnerability to HIV/AIDS. To enable such synergies, partnering with other organi-zations for nonfood components will be critical for success. Although this is not unique in the context of AIDS, the issue of complementary resources becomes crucial and urgent, as community capacity to contrib-ute resources is highly weakened in high-prevalence regions.
Fostering such partnerships both with people affected by HIV/AIDS and with professionals within other sectors should be built into strategy, not some-thing undertaken on an ad hoc basis. Organizations need to go beyond their usual focus on those partners that have food management capacity, and should seek and identify partners with the capacity to bring to the project the livelihood component, the life-skills development component, or both. Where capacities are weak, investments in developing the capacity of partner organizations, including, for example, provid-ing links to technical support, should also be a part of the core strategy.
Mirroring the shift toward more comprehensive approaches with partners (involving nonfood items), there is also a need for a greater focus on achieving outcomes, not just food-delivery outputs. This has implications for monitoring and evaluation systems as well as for project timelines, which may need to be extended.
Monitoring and evaluation
Three forms of monitoring are required: geographic monitoring and monitoring at the levels of project performance and capacity development. A project-monitoring system that is relatively simple but able to track the changing HIV/AIDS situation and its impacts on food and nutrition security, with the required accu-racy and reliability to guide timely ameliorative action, is essential. The key data required to improve program decision making in real time need to be generated by such a system and communicated to those who can use them. It will usually not be necessary to reinvent food and nutrition security indicators—rather, the HIV lens should be applied to existing ones.
Given the fact that this type of programming is relatively new, there is an urgent need to demonstrate what works. Evaluations of programs and projects will be key to highlighting success and thus providing the fuel for advocacy to generate the resources to scale up successful approaches.
Finally, there is a need to track the implementa-
tion and performance of such organizational capac-ity-development initiatives. Performance in this case relates to the enhancement of critical capacities (e.g., the ability to apply the HIV lens to different situations) at the levels being addressed by the initiatives.
Operational research
Operational research—which is critical for maximizing the effectiveness of interventions—should be directly linked to the monitoring and evaluation system in a dynamic manner. Project budgets should include a nonearmarked portion that may be mobilized to sup-port such essential work.
There are certain general priorities that need fur-ther research, including the continual development, refinement, and application of the HIV/AIDS lens, the appropriateness of different indicators for targeting or monitoring, the nutritional composition of rations, and home-based care modalities. We have highlighted many other key operational research issues throughout the paper.
Conclusions
HIV/AIDS demands a multipronged response, grounded in an understanding of the susceptibility and vulnerability of people’s livelihoods. Given the strong linkages between food insecurity, malnutrition, and HIV/AIDS, this paper has highlighted particular opportunities that food assistance may present—not only for care and mitigation, but also for prevention in a broad sense. Food assistance is relevant for the nutritional well-being of vulnerable groups and for strengthening human capital, as well as for preserving assets and livelihoods.
Food aid can enable the marginalized to take advan-tage of development opportunities. Those affected by HIV/AIDS are arguably among the most marginalized populations, both socially and economically. Not only does stigma foster exclusion, but progressive asset depletion may also render households destitute and unable to participate in the development process. There are opportunities for using food aid to enable these populations to avoid and escape such marginalization. In addition, it will be important to seek opportunities for linking such interventions to HIV-specific inter-ventions wherever possible, thus potentially further reducing susceptibility to HIV.
But many challenges exist, which will need to be dealt with dynamically through ongoing implementa-tion, good monitoring, and timely, focused operational research. Such challenges include how to target the
S. Kadiyala and S. Gillespie Rethinking food aid for AIDS

280 281
References
1. Loevinsohn M, Gillespie S. HIV/AIDS, food security and rural livelihoods: understanding and responding. Food Consumption and Nutrition Division Discussion Paper No. 157. Washington, DC: International Food Policy Research Institute, 2003.
2. World Food Program. Food is critical in the fight against HIV/AIDS. Rome: WFP, 2002.
3. World Food Program. Programming in the era of AIDS: WFP’s response to HIV/AIDS. Rome: WFP, 2003.
4. United Nations High Commission for Refugees. Repro-ductive health in refugee situations: an inter-agency field manual. Geneva: UNHCR, 1999.
5. Joint United Nations Program on HIV/AIDS. Key elements in HIV/AIDS care and support. Geneva: UNAIDS/WHO, 2000.
6. Smith A. HIV/AIDS and emergencies: analysis and recommendations for practice. Humanitarian Practice Network. London: Overseas Development Institute (ODI), 2002.
7. Inter-Agency Standing Committee. Guidelines for HIV/AIDS interventions in emergency settings. Rome: IASC, 2003.
8. Barnett T, Whiteside A, eds. AIDS in the twenty-first century. New York: Palgrave, 2002.
9. Haddad L, Gillespie S. Effective food and nutrition policy responses to HIV/AIDS: what we know and what we need to know. J Int Dev 2001;13:487–511.
10. Yamano T, Jayne TS. Measuring the impacts of prime-age adult death on rural households in Kenya. World Dev 2004;32:91–119.
11. Haan N, Farmer G, Wheeler R. Chronic vulnerability to food insecurity in Kenya: a WFP pilot for improving vulnerability analysis. Rome: WFP, 2001.
12. UNAIDS. Epidemiological fact sheet on HIV/AIDS ad sexually transmitted diseases: Kenya. Geneva: UNAIDS, 2002.
13. Mason J, Bailes A, Mason K. Drought, AIDS and child malnutrition in southern Africa: preliminary analysis of nutritional data on the humanitarian crisis. Paper prepared for UNICEF Regional Office for Eastern and Southern Africa. New Orleans, La, USA: Tulane Univer-sity, 2003.
14. World Food Program. Kenya country programme 1999–2003: assistance to preprimary and primary school feeding in arid and semi-arid lands, and assistance to
disadvantaged urban children. Rome: WFP, 1999.15. World Health Organization. Nutrient requirements
for people living with HIV/AIDS: report of a technical consultation. Geneva: WHO, 2003.
16. John GC, Nduati RW, Mbori-Ngacha DA, Richardson BA, Panteleeff D, Mwatha A, Overbaugh J, Bwayo J, Ndinya-Achola JO, Kreiss JK. Corrrelates of mother-to-child human immunodeficiency virus type 1 (HIV-1) transmission: association with maternal plasma HIV-1 RNA load, genital HIV-1 DNA shedding, and breast infections. J Infect Dis 2001;183:206–12.
17. Fawzi W, Msamanga G, Spegelman D, Renjifo B, Bang H, Kapiga S, Coley J, Hertzmark E, Essex M, Hunter D. Transmission of HIV-1 through breastfeeding among women in Dar es Salaam, Tanzania. J Acquir Immune Defic Syndr 2002;31:331–8.
18. Fawzi W. Nutritional factors and vertical transmission of HIV-1: epidemiology and potential mechanisms. Ann NY Acad Sci 2000;918:99–114.
19. Allard JP, Aghdassi E, Chau J, Tam C, Kovacs CM, Salit IE, Walmsley SL. Effects of vitamin E and C supplemen-tation on oxidative stress and viral load in HIV-infected subjects. AIDS 1998;12:1653–9.
20. Coutsoudis A, Moodley D, Pillay K, Harrigan R, Stone C, Moodley J, Coovadia HM. Effects of vitamin A sup-plementation on viral load in HIV-1-infected pregnant women. J Acquir Immune Defic Syndr Hum Retrovirol 1997;1:86–7.
21. Semba RD, Neville M. 1999. Breast-feeding, mastitis, and HIV transmission: nutritional implications. Nutr Rev 1999;5:146–53.
22. Mostad SB, Kreiss JK, Ryncarz AJ, Mandaliya K, Chohan B, Ndinya-Achola J, Bwayo JJ, Corey L. Cervical shed-ding of herpes simplex virus in human immunode-ficiency virus-infected women: effects of hormonal contraception, pregnancy, and vitamin A deficiency. J Infect Dis 2000;181:58–63.
23. Filteau SM, Lietz G, Mulokozi G, Bilotta S, Henry CJ, Tomkins AM. Milk cytokines and subclinical breast inflammation in Tanzanian women: effects of dietary red palm oil or sunflower oil supplementation. Immu-nology 1999;97:595–600.
24. Filteau SM, Rollins NC, Coutsoudis A, Sullivan KR, Wil-lumsen FJ, Tomkins AM. The effect of antenatal vitamin A and beta-carotene supplementation on gut integrity of
vulnerable in the HIV/AIDS context, how to use food aid to leverage longer-term livelihood options, how to ensure complementary resources through appropriate partnerships, and how to strengthen local capacity. Donor responses have been piecemeal to date, and the involvement of food aid organizations is fairly recent. Though there is little empirical evidence regarding the effectiveness of food aid in responding to HIV/AIDS currently, this should not forestall action. A well-documented learning-by-doing approach is required, of building up, evaluating, and disseminating experi-ences and lessons learned.
Acknowledgments
This paper has benefited immensely from the authors’ participation in the World Food Program Southern and Eastern Africa Bureau Regional HIV/AIDS tech-nical review mission to Rwanda, Malawi, and Kenya in February and March 2002. We gratefully acknowledge the contributions of the mission members: Azeb Asrat, Norah Gibson, Esther Acheng, David Mwesigwa, Tim Frankenberger, and Joseph Collins. We would also like to thank Lawrence Haddad, Patrick Webb, and Robin Jackson for comments received on an earlier draft.
S. Kadiyala and S. Gillespie Rethinking food aid for AIDS
282
infants of HIV-infected South African women. J Pediatr Gastroenterol Nutr 2001;32:464–70.
25. Brocklehurst P, French R. The association between maternal HIV infection and perinatal outcome: a sys-tematic review of the literature and meta-analysis. Br J Obstet Gynaecol 1998;105:836–48.
26. Kumwenda N, Miotti PG, Taha TE, Broadhead R, Biggar RJ, Jackson JB, Melikian G, Semba RD. Antena-tal vitamin A supplementation increases birth weight and decreases anemia among infants born to human immunodeficiency virus-infected women in Malawi. Clin Infect Dis 2002;35:618–24.
27. Coutsoudis A, Pillay K, Spooner E, Kuhn L, Coovadia HM. Randomized trial testing the effect of vitamin A supplementation on pregnancy outcomes and early mother-to-child HIV-1 transmission in Durban, South Africa. South African Vitamin A Study Group. AIDS 1999;13:1517–24.
28. Fawzi W, Msamanga G, Spielgelman D, Urassa NJ, McGrath N, Mwakagile D, Antelman G, Mbise R, Herrera G, Kapiga S, Willet W, Hunter D. Randomised trial of effects of vitamin supplements on pregnancy outcomes and T cell counts in HIV-1 infected women in Tanzania. Lancet 1998;351:1477–82.
29. Semba RD, Chiphangwi JD, Miotti PG, Dallabetta GA, Hoover D, Canner JK, Saah A. Maternal vitamin A deficiency and mother-to-child transmission of HIV-1. Lancet 1994;343:1593–7.
30. Dreyfuss ML, Fawzi W. Micronutrients and vertical transmission of HIV-1. Am J Clin Nutr 2002;75:959–70.
31. Fawzi W, Msamanga G, Hunter D, Renjifo B, Antelman G, Bang H, Manji K, Kapiga S, Mwakagile D, Essex M, Spielgelman D. Randomized trial of vitamin supple-ments in relation to transmission of HIV-1 through breastfeeding and early child mortality. AIDS 2002;16:1935–44.
32. UNAIDS/UNICEF/WHO. HIV and Infant Feeding: Guidelines for health care managers and supervisors. Geneva: WHO, 1998
33. World Health Organization. New data on prevention of mother-to-child transmission of HIV and their policy implications: conclusions and recommendations. Geneva: WHO, 2001.
34. Baylies C. The impact of AIDS on rural households in Africa: a shock like any other? Development and Change 2002:33:611–32.
35. Food and Nutrition Technical Assistance (FANTA). HIV/AIDS: a guide for nutrition, care and support. Washington, DC: Academy for Educational Develop-ment, 2001.
36. Piwoz E, Preble E. HIV/AIDS and nutrition: a review of literature and recommendations for nutritional care and support in sub-Saharan Africa. SARA Project. Washington, DC: Academy for Educational Develop-ment, 2000.
37. Fawzi W. Micronutrients and human immunodeficiency virus type 1 disease progression among adults and chil-dren. Clin Infect Dis 2003;37(suppl 2):S112–6.
39. Marum E, Chimwaza M, Kachiza C, Mwafulira J, Phiri C, Phiri L.K. Assessment of home based care services in Malawi. Blantyre: Umoyo Network 2000.
39. World Food Program. Food for education: WFP’s role in
improving access to education for orphans and vulner-able children in sub-Saharan Africa. Rome: WFP, 2002.
40. USAID/UNICEF/UNAIDS. Children on the brink 2002: a joint report on orphan estimates and program strate-gies. Washington, DC: USAID, 2002.
41. Deininger K, Garcia M, Subbarao K. AIDS-induced orphanhood as a systemic shock: magnitude, impact and program interventions in Africa. World Dev 2003;31:1201–20.
42. Crawley M. Rwanda’s reckoning: Teenagers learn parent-ing skills. Christian Science Monitor, February 12, 2001
43. Subbarao K, Mattimore A, Plangemann K. Social protec-tion of Africa’s orphans and other vulnerable children: issues and good practice program options. Human Development Working Paper Series, The World Bank-Africa Region. Washington, DC: World Bank, 2001.
44. World Food Program. Enabling development. Policy Issues No. WFP/EB.A/99/4-A. Rome: WFP, 1999.
45. Pillai N. Food aid for development? A review of evi-dence. In: Clay E, Stokke O, eds. Food aid and human security. London: Frank Cass, 2000:196–220.
46. Ahmed AU, del Ninno C. Food for education program in Bangladesh: an evaluation of its impact on educational attainment and food security. Discussion Paper No. 138, Food Consumption and Nutrition Division. Washington, DC: International Food Policy Research Institute, 2002.
47. World Food Program. Country programme—Malawi. No. WFP/EB.3/2001/8/7. Rome: WFP, 2001.
48. World Food Program. Country programme—Mozam-bique. No. WFP/EB.3/2001/8/2. Rome: WFP, 2001.
49. Gillespie S, Haddad L, Jackson R. HIV/AIDS, food and nutrition security: impacts and action. Nutrition Policy Paper No. 20. Geneva: World Health Organization Administrative Coordinating Committee/Subcommittee on Nutrition, 2001.
50. Barrett C, Holden H, Clay D. Can food for work pro-grams reduce vulnerability? In: Dercon S, ed. Insurance against poverty. Oxford University Press, forthcoming in Nov 2004
51. von Braun, J, Teklu T, Webb P. Famine in Africa: causes, responses, and prevention. Baltimore, Md, USA: Johns Hopkins University Press, 1999.
52. Cohen D. HIV epidemic and other crisis respone in sub-Saharan Africa. Focus Programme on Crisis Response and Reconstruction Working Paper No. 6. Geneva: International Labor Organization, 2002.
53. Parker J, Singh I, Hattel K. The role of microfinance in the fight against HIV/AIDS. UNAIDS Background Paper. Bethesda, Md, USA: Development Alternatives, 2000.
54. Webb P, Coates J, Houser R. Does microcredit meet the needs of all poor women? Constraints to participation among destitute women in Bangladesh. Tufts Nutrition Discussion Paper No. 3. Medford, Mass, USA: Tufts University, 2002.
55. Parker J. The MBP reader on microfinance and HIV/AIDS: first steps in speaking out. Microenterprise Best Practices. Bethesda, Md, USA: Development Alterna-tives, 2000.
56. Rahman IR. Poverty alleviation and empowerment through microfinance: two decades of experience in Bangladesh. Research Monograph No. 20. Dhaka: Bangladesh Institute of Development Studies, 2000.
S. Kadiyala and S. Gillespie

Food and Nutrition Bulletin, vol. 25, no. 3 © 2004, The United Nations University. 283
This Briefing Paper is drawn from Paul Harvey, HIV/AIDS and Humanitarian Action, HPG Report 16 (London: ODI, 2004). The full report, a resource guide on HIV/AIDS and emergencies, and background papers are available from the ODI website at www.odi.org.uk/hpg/hiv.html. © Overseas Development Institute, 2004. Download this paper at www.odi.org.uk/papers/hpgbrief14.pdf.
What are the implications of HIV/AIDS for our under-standing of crisis and humanitarian aid? HIV/AIDS is both a long-term crisis in its own right, and a contribu-tory factor in acute emergencies. The epidemic presents key challenges for both humanitarian and development assistance, and for the interface between them.
The crisis in southern Africa during 2002 and 2003 highlighted the complex connections between HIV/AIDS, food security, and famine. This briefing paper examines the implications of HIV/AIDS for our understanding of crisis and of the role of humanitarian aid therein. The disease is clearly a massive crisis in its own right: to the extent that humanitarian response is concerned with increased levels of mortality and morbidity, HIV/AIDS can clearly be described as an emergency. However, it is a long-term crisis, and its impacts will be felt for decades.
HIV/AIDS is one of many factors contributing to food insecurity. It is important to understand how the impact of HIV/AIDS relates to other factors, such as drought and conflict, to create acute humanitarian crises. HIV/AIDS acts at many different levels:» It undermines the ways in which people have tradi-
tionally coped with famine; » It may increase mortality in famines, as people with
AIDS will be less able to cope with reduced food intake and additional disease burdens;
» Issues associated with crisis may add to the risks of transmission of HIV/AIDS and contribute to the epidemic’s spread.HIV/AIDS has profound humanitarian conse-
quences, both by directly causing illness and death and
in terms of the wider impact it is having on societies. These consequences will develop over decades, mean-ing that existing models of humanitarian aid may not be appropriate. Equally, existing models of develop-ment assistance are likely to prove inadequate. The challenges raised by the pandemic are only beginning to be fully appreciated.
This summary and the report on which it is based have two main aims:» To investigate the relationship between HIV/AIDS
and humanitarian crisis;» To examine the role of humanitarian aid in the con-
text of the HIV/AIDS epidemic.Findings are based on fieldwork in southern Africa,
where HIV/AIDS prevalence rates are the highest in the world. As HIV/AIDS rates are still rising in other parts of Africa and the developing world, some of the lessons from southern Africa may be applicable else-where as well.
HIV/AIDS and livelihoods: What are the connections?
The literature on HIV/AIDS shows that it has clear negative impacts on food security at a household level, and that these are complex, wide-ranging, and gender-specific. The amount of original research is, however, limited; there has been a tendency to focus on agriculture and neglect other aspects of livelihoods; and there is little information about the scale of the impact of HIV/AIDS on food security at national and regional levels.
There is a two-way relationship between HIV/AIDS and food security. HIV has an impact on people’s live-lihoods, reducing food security through illness and death, and food insecurity and poverty fuel the HIV epidemic as people are driven to adopt risky strategies in order to survive. Ultimately, HIV/AIDS damages the livelihood outcomes of households. Households affected by HIV/AIDS usually have less income and reduced food security. They are also likely to be more
HIV/AIDS and humanitarian actionFebruary 2004
Paul Harvey, Research Fellow, Humanitarian Policy Group, Overseas Development Institute

284 285
vulnerable to other shocks, such as drought. If it is severe enough, the impact of HIV/AIDS could result in destitution and households becoming dependent on some form of external assistance.
HIV/AIDS, humanitarian action, and emergencies
Until recently, the slim literature on HIV/AIDS and emergencies largely focused on HIV/AIDS in con-flict and refugee situations, and to a lesser extent quick-onset natural disasters. The main theme was the increased risk of infection among affected popu-lations caused by the violence, displacement, and militarization resulting from emergencies. During 2002 and 2003, however, the issue of HIV/AIDS and emergencies leapt to the top of the humanitarian policy agenda, prompted by the southern Africa crisis, the publication of Inter-Agency Standing Committee (IASC) guidelines on HIV/AIDS and emergencies, and the revision of the Sphere Handbook, where HIV/AIDS was seen as a cross-cutting issue.
HIV/AIDS and famine
HIV/AIDS is only one of a host of factors contribut-ing to food insecurity. What is important, therefore, is to understand the ways in which HIV/AIDS interacts with these other factors, and how this might affect the possibility and trajectory of famines. This research sug-gests that HIV/AIDS needs to be understood as one of the underlying processes that predisposes poor people
to possible famine. However, HIV/AIDS is not just a contributory factor
to vulnerability: it also influences the outcomes of the emergency. It increases the risk of heightened mortal-ity in emergencies due to the ways in which it interacts with malnutrition, undermines coping strategies, and leaves people less able to cope with other illness. This is the process that Alex De Waal and Alan Whiteside have called “new variant famine.” This reinforces the need for adequate levels of humanitarian aid in times of crisis, as communities will be less able to rely on their own resources, and individuals less able to cope with poor nutrition. This is shown diagrammatically in figure 1.
HIV/AIDS and the southern Africa crisis
The argument that HIV/AIDS was a central compo-nent in the southern Africa crisis came about gradually. Initially defined as a food crisis caused by a combina-tion of bad weather, bad governance, and underlying poverty, AIDS moved to the forefront of the agenda following the visit of the UN Special Envoy to southern Africa, James Morris, in 2002.
There has been a backlash against both the new vari-ant famine hypothesis and the increased focus on HIV/AIDS. The extent to which HIV/AIDS has contributed to the current crisis has been questioned. It has been argued that its importance has been overemphasized and that other, equally or more important, factors risk being neglected. It has also been argued that the focus on HIV/AIDS as a causal factor could obscure political factors behind the crisis. There has been skepticism on the part of some donors and nongovernmental organi-zations about how HIV/AIDS is being used to justify a need for continued humanitarian aid in some coun-
BOX 1. Why is HIV/AIDS a humanitarian concern?
There are a number of reasons why HIV/AIDS must concern humanitarian actors:
» The mortality and suffering created by HIV/AIDS is clearly a humanitarian concern in its own right. The impact of the epidemic is growing, and will be felt for decades.
» HIV/AIDS is increasing the food insecurity of signifi-cant numbers of households, adding another burden to communities already vulnerable to other shocks, such as drought or conflict.
» HIV/AIDS has particular characteristics that may create new types of vulnerabilities or exacerbate existing ones. HIV/AIDS kills predominantly prime-age adults, clus-ters in households, has a gender-specific impact, and interacts with malnutrition. These are all factors that must be understood and taken into account in provid-ing humanitarian relief in the context of an HIV/AIDS epidemic.
» Emergency situations may increase people’s susceptibil-ity to HIV/AIDS, further fueling the epidemic.
FIG. 1. Contribution of HIV/AIDS to the trajectory of crisis
Chronic food insecurity
Shocks such as drought or conflict tip the
situation into acute crisis
Acute crisis develops with the risk of
heightened malnutrition, mortality,
and morbidity
Underlying vulnerability is higher due to HIV/AIDS, so
crises may be triggered more easily
HIV/AIDS as a contributory factor to
food insecurity
HIV/AIDS undermines coping strategies.
People sick with AIDS are less able to cope
with poor nutrition and illness, leading to greater mortality
P. Harvey HIV/AIDS and humanitarian action

284 285
tries, and about the underlying empirical evidence of the links between HIV/AIDS and food insecurity.
HIV/AIDS as an emergency
The state of the current data means that disentangling the relative importance of HIV/AIDS compared with bad governance or bad weather is, and will remain, dif-ficult. What is clear, though, is that huge numbers of people are dying from and suffering with HIV/AIDS in Sub-Saharan Africa. To the extent that the core of the humanitarian agenda is to save lives and alleviate suf-fering, HIV/AIDS is clearly a humanitarian problem. Labeling HIV/AIDS as an emergency may be useful in generating additional action. For national govern-ments, declaring HIV/AIDS an emergency may serve particular purposes, such as demonstrating political commitment or allowing the importing of generic drugs to treat HIV/AIDS. Calling something an emer-gency also has important practical implications for aid agencies and donors in terms of what funding is available, from which budget lines, and with what sort of timelines and conditions attached.
Whatever label is applied to the situation—and per-haps the best term is long-term crisis—it is clear that HIV/AIDS requires both a humanitarian response to suffering and a long-term perspective. This has obvi-ous implications for how both relief and development assistance are structured, and for the relationship between them.
HIV/AIDS and the challenge for relief and development assistance
In considering the challenge HIV/AIDS poses for both forms of aid, it is important to be clear that there are different aspects to the impact of HIV/AIDS on liveli-hoods. Hence, different responses will be appropriate. Three linked but to some extent distinct challenges present themselves: » The impact of HIV/AIDS as a health crisis in its
own right, in terms of massive and increasing levels of mortality, morbidity, and suffering over a period of decades. This is perhaps best seen as a long-term emergency. This will require a long-term response to HIV/AIDS, encompassing the need for prevention, care, treatment, and mitigation.
» HIV/AIDS as increasing underlying vulnerability, adding to the impact of other shocks and meaning that acute crises may be triggered more easily and be more difficult to recover from. HIV/AIDS will need to be taken into account as a cross-cutting issue in short-term humanitarian relief for acute suffering.
» HIV/AIDS as one of many contributory factors to
long-term and chronic food insecurity, poverty, and destitution. HIV/AIDS therefore adds to the existing need for safety nets and long-term welfare, as part of the overall response to poverty. Welfare may need to be a particular focus, due to the likelihood that HIV/AIDS will increase levels of destitution.Humanitarian aid is only part of a much larger inter-
national response to the impact of the HIV/AIDS pan-demic, and it is important to be clear about what the relief system can and cannot do. The overall response to HIV/AIDS needs to take place over decades, and across entire countries and regions. Humanitarian aid, based as it is on short-term time horizons and funding cycles, is obviously ill-suited to meet this extensive, long-term challenge.
HIV/AIDS also raises a series of humanitarian chal-lenges for development. The impact of HIV/AIDS on livelihoods reinforces the need for some form of social protection or welfare safety net for the poorest; by increasing underlying vulnerability, HIV/AIDS may also mean that crises are triggered more easily, which implies a need for greater investment in disas-ter preparedness and mitigation. Much of the current focus of HIV/AIDS response is on the need to expand access to treatment. In countries like Malawi, where a significant percentage of the population does not have access to basic primary health care, this implies a need to focus on basic health-care delivery. These are not new challenges. There is a danger in considering the broader impacts of HIV/AIDS on livelihoods as “AIDS exceptionalism”: for instance, privileging AIDS over other diseases in health systems or focusing unduly on the impact of AIDS in food-security programs.
HIV/AIDS and humanitarian programming: lessons from southern Africa
The southern Africa crisis in 2002 and 2003 raised a series of practical questions around the programming of humanitarian aid in the context of an HIV/AIDS epidemic. These range from whether and how food aid rations need to be adapted, to the question of whether AIDS-related stigma affects participation in relief pro-grams. This study found that HIV/AIDS issues need to be “mainstreamed” by aid agencies both internally, in terms of training and organizational policies, and externally, in terms of how humanitarian aid programs are structured and delivered. These programmatic find-ings are summarized below: » Early-warning systems and assessments need to
incorporate analysis of HIV/AIDS and its impact on livelihoods.
» The emergence of new types and areas of vulner-ability due to HIV/AIDS should be considered in assessment and targeting. Groups such as widows,
P. Harvey HIV/AIDS and humanitarian action
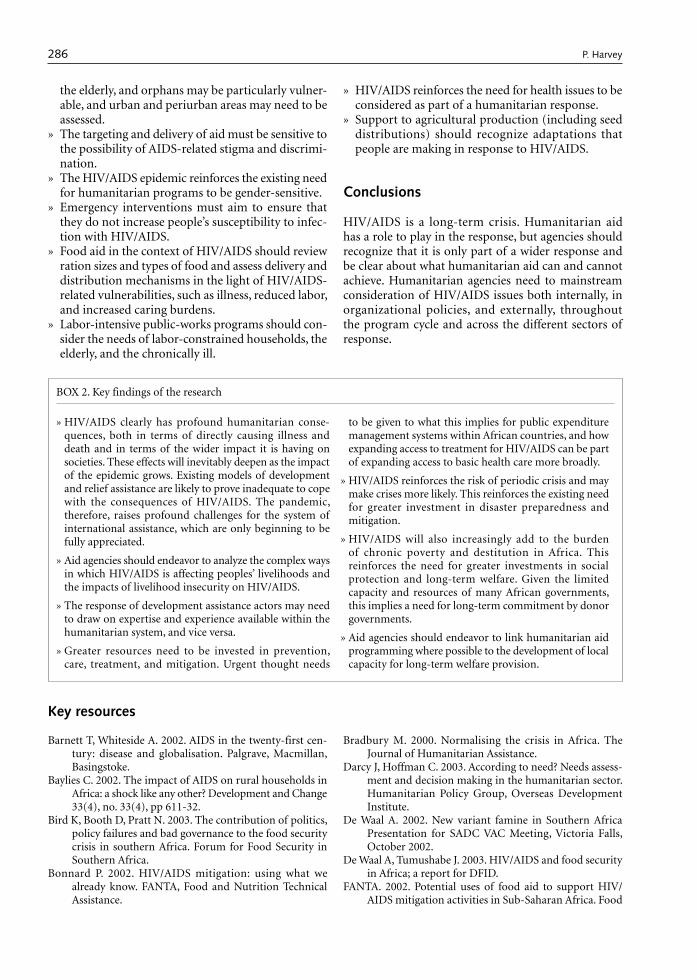
286 287
the elderly, and orphans may be particularly vulner-able, and urban and periurban areas may need to be assessed.
» The targeting and delivery of aid must be sensitive to the possibility of AIDS-related stigma and discrimi-nation.
» The HIV/AIDS epidemic reinforces the existing need for humanitarian programs to be gender-sensitive.
» Emergency interventions must aim to ensure that they do not increase people’s susceptibility to infec-tion with HIV/AIDS.
» Food aid in the context of HIV/AIDS should review ration sizes and types of food and assess delivery and distribution mechanisms in the light of HIV/AIDS-related vulnerabilities, such as illness, reduced labor, and increased caring burdens.
» Labor-intensive public-works programs should con-sider the needs of labor-constrained households, the elderly, and the chronically ill.
» HIV/AIDS reinforces the need for health issues to be considered as part of a humanitarian response.
» Support to agricultural production (including seed distributions) should recognize adaptations that people are making in response to HIV/AIDS.
Conclusions
HIV/AIDS is a long-term crisis. Humanitarian aid has a role to play in the response, but agencies should recognize that it is only part of a wider response and be clear about what humanitarian aid can and cannot achieve. Humanitarian agencies need to mainstream consideration of HIV/AIDS issues both internally, in organizational policies, and externally, throughout the program cycle and across the different sectors of response.
BOX 2. Key findings of the research
» HIV/AIDS clearly has profound humanitarian conse-quences, both in terms of directly causing illness and death and in terms of the wider impact it is having on societies. These effects will inevitably deepen as the impact of the epidemic grows. Existing models of development and relief assistance are likely to prove inadequate to cope with the consequences of HIV/AIDS. The pandemic, therefore, raises profound challenges for the system of international assistance, which are only beginning to be fully appreciated.
» Aid agencies should endeavor to analyze the complex ways in which HIV/AIDS is affecting peoples’ livelihoods and the impacts of livelihood insecurity on HIV/AIDS.
» The response of development assistance actors may need to draw on expertise and experience available within the humanitarian system, and vice versa.
» Greater resources need to be invested in prevention, care, treatment, and mitigation. Urgent thought needs
to be given to what this implies for public expenditure management systems within African countries, and how expanding access to treatment for HIV/AIDS can be part of expanding access to basic health care more broadly.
» HIV/AIDS reinforces the risk of periodic crisis and may make crises more likely. This reinforces the existing need for greater investment in disaster preparedness and mitigation.
» HIV/AIDS will also increasingly add to the burden of chronic poverty and destitution in Africa. This reinforces the need for greater investments in social protection and long-term welfare. Given the limited capacity and resources of many African governments, this implies a need for long-term commitment by donor governments.
» Aid agencies should endeavor to link humanitarian aid programming where possible to the development of local capacity for long-term welfare provision.
Key resources
Barnett T, Whiteside A. 2002. AIDS in the twenty-first cen-tury: disease and globalisation. Palgrave, Macmillan, Basingstoke.
Baylies C. 2002. The impact of AIDS on rural households in Africa: a shock like any other? Development and Change 33(4), no. 33(4), pp 611-32.
Bird K, Booth D, Pratt N. 2003. The contribution of politics, policy failures and bad governance to the food security crisis in southern Africa. Forum for Food Security in Southern Africa.
Bonnard P. 2002. HIV/AIDS mitigation: using what we already know. FANTA, Food and Nutrition Technical Assistance.
Bradbury M. 2000. Normalising the crisis in Africa. The Journal of Humanitarian Assistance.
Darcy J, Hoffman C. 2003. According to need? Needs assess-ment and decision making in the humanitarian sector. Humanitarian Policy Group, Overseas Development Institute.
De Waal A. 2002. New variant famine in Southern Africa Presentation for SADC VAC Meeting, Victoria Falls, October 2002.
De Waal A, Tumushabe J. 2003. HIV/AIDS and food security in Africa; a report for DFID.
FANTA. 2002. Potential uses of food aid to support HIV/AIDS mitigation activities in Sub-Saharan Africa. Food
P. Harvey HIV/AIDS and humanitarian action

286 287
and Nutrition Technical Assistance.Haddad L, Gillespie S. 2001. Effective food and nutrition
policy responses to HIV/AIDS: what we know and what we need to know. Food Consumption and Nutrition Division, International Food Policy Research Institute, Washington, DC, No. 112.
HelpAge International. 2003. HIV/AIDS and ageing: a brief-ing paper.
IFRC. 2003. Not business as usual. International Federation of the Red Cross.
Loevinsohn M, Gillespie S. 2003. HIV/AIDS, food security and rural livelihoods: understanding and respond-ing. RENEWAL. Working paper 2. http://www.isnar.cgiar.org/renewal/pdf/RENEWALWP2.pdf. Accessed 23 June 2004.
Mason J, Bailes A, Mason K. 2003. Drought, AIDS and child malnutrition in southern Africa: preliminary analysis of nutritional data on the humanitarian crisis.
Morris J. 2003. Next steps for action in southern Africa: a report of the special envoy of the Secretary General for humanitarian needs in southern Africa.
Morris J, Lewis S. 2003. Mission report: Lesotho, Malawi, Zambia and Zimbabwe 22–29 January 2003.
Mutangadura G, Mukurazita D, Jackson H. 1999. A review of household and community responses to the HIV/AIDS epidemic in the rural areas of sub-Saharan Africa. UNAIDS Best Practice Collection.
Oxfam. 2003. Guidelines on mainstreaming and integrating AIDS in emergencies. Oxfam, Oxford.
Piwoz E, Preble E. 2000. HIV/AIDS and nutrition: a review of the literature and recommendations for nutritional care and support in sub-Saharan Africa. Support for Analy-
sis and Research in Africa (SARA) Project. Bureau for Africa, Office of Sustainable Development, USAID.
Rugalema G. 2000. Coping or struggling? A journey into the impact of AIDS in southern Africa. Review of African Political Economy No. 86.
SADC FANR Vulnerability Assessment Committee. 2003. Towards identifying impacts of HIV/AIDS on food inse-curity in Southern Africa and implications for response: findings from Malawi, Zambia and Zimbabwe. Harare, Zimbabwe.
Scott G, Harland C. 2003. Food insecurity, HIV/AIDS and children. Submitted to Family Health International.
Shah M, Osborne N, Mbilizi T, Vilili G. 2002. Impact of HIV/AIDS on agricultural productivity and rural livelihoods in the central region of Malawi. CARE International in Malawi.
Smith A. 2002. HIV/AIDS and emergencies: analysis and rec-ommendations for practice. HPN Network Paper 38.
Tallis V. 2002. Gender and HIV/AIDS Overview Report. BRIDGE, Institute of Development Studies.
Topouzis D. 2000. Measuring the impact of HIV/AIDS on the agricultural sector in Africa. UNAIDS Best Practice Collection, Key Material.
UNAIDS, WHO. 2002. AIDS epidemic update.White J, Robinson E. 2000. HIV/AIDS and rural livelihoods
in southern Africa. Natural Resource Institute, Chatham UK, Policy Series 6.
World Bank. 1999. Confronting AIDS: public priorities in a global epidemic. Oxford University Press, Oxford.
World Food Programme. 2003. Programming in the era of AIDS: WFP’s response to HIV/AIDS. World Food Programme, Rome.
P. Harvey HIV/AIDS and humanitarian action

288 Food and Nutrition Bulletin, vol. 25, no. 3 © 2004, The United Nations University.
289
Abstract
Overweight and obesity are among the most prevalent nutritional problems in developed and developing countries. In this descriptive study, we attempted to determine the prevalence of overweight and obesity in Iranian adolescent girls attending high school in Tabriz. A sample of 1,650 (final study group, 1,518) high-school girls aged 14 to 20 years was selected by stepwise random sampling from five districts of Tabriz. Overweight and obesity were defined according to body mass index (BMI) percentiles from the First National Health and Nutrition Examination Survey (NHANES I) and the International Obesity Task Force (IOTF) BMI cutoffs. According to the NHANES I criteria, 14.6% of the study subjects were overweight or obese. Overweight and obesity was seen in 11.1% and 3.6% of the students, respectively. By the IOTF cutoffs, 14% of the subjects were overweight or obese. Overweight and obesity were seen in 10.1% and 3.9% of the students, respectively. Of the study subjects, 8% had a BMI below the 15th percentile of NHANES I, an indicator of underweight. The prevalence of overweight and obesity in Tabriz high-school girls is higher than in many, but not all, parts of Iran, but lower than in some neighboring countries such as Saudi Arabia. In this age group, in addition to overweight and obesity, underweight (BMI ≤ 15th percentile) is also present.
Key words: Adolescents, body mass index, obesity, overweight, underweight
Introduction
Overweight and obesity are among the major health problems in developed and developing countries [1–4]. They are also risk factors for other health problems such as cardiovascular disease, hypertension, diabetes, some cancers, gallbladder disease, osteoarthritis, and dyslipidemia [5–10]. Many studies show that over-weight and obesity in adolescence are powerful pre-dictors of adulthood weight and disease [11, 12]. The social and economic consequences of overweight and obesity during adolescence are perhaps greater than the physical consequences [6, 13, 14].
In Iran there are few data on the prevalence of over-weight and obesity, especially among adolescent girls. According to a review of the literature, the prevalence of these indices in adolescent girls was 13.3% and 4.4%, respectively [15, 16]. In other countries, differ-ent results for prevalence of overweight and obesity in adolescent girls have been shown [3, 17–23]. Some studies show prevalence of up to 40% overweight and 16% obesity in adolescent girls in parts of the United States [19, 20]. With attention to the scarcity of studies on the subject, we attempted to determine the preva-lence of overweight and obesity in Iranian adolescent girls attending high school in Tabriz.
Materials and methods
In this descriptive study, a sample of 1,650 girls was selected from among high-school students in Tabriz city in 2001.The sample size of 1,417 subjects was cal-culated according to the following formula:
N = Z 21 – α/2 × P (1 – P)/d2,
Prevalence of overweight and obesity among high-school girls in Tabriz, Iran, in 2001
Bahram Pourghassem Gargari, Mahdiyeh Hamed Behzad, Saeideh Ghassabpour, and Arezoo Ayat are affiliated with the Department of Nutrition and Biochemistry, Faculty of Health and Nutrition; Tabriz University of Medical Science and Health Services; Tabriz, Iran.
Please direct queries to the corresponding author: Bahram Pourghassem Gargari; Department of Nutrition and Bio-chemistry, Faculty of Health and Nutrition; Tabriz University of Medical Science and Health Services; Tabriz, Iran; e-mail: [email protected].
Mention of the names of firms and commercial products does not imply endorsement by the United Nations University.
Overweight and obesity in Iranian adolescents
Bahram Pourghassem Gargari, Mahdiyeh Hamed Behzad, Saeideh Ghassabpour, and Arezoo Ayat
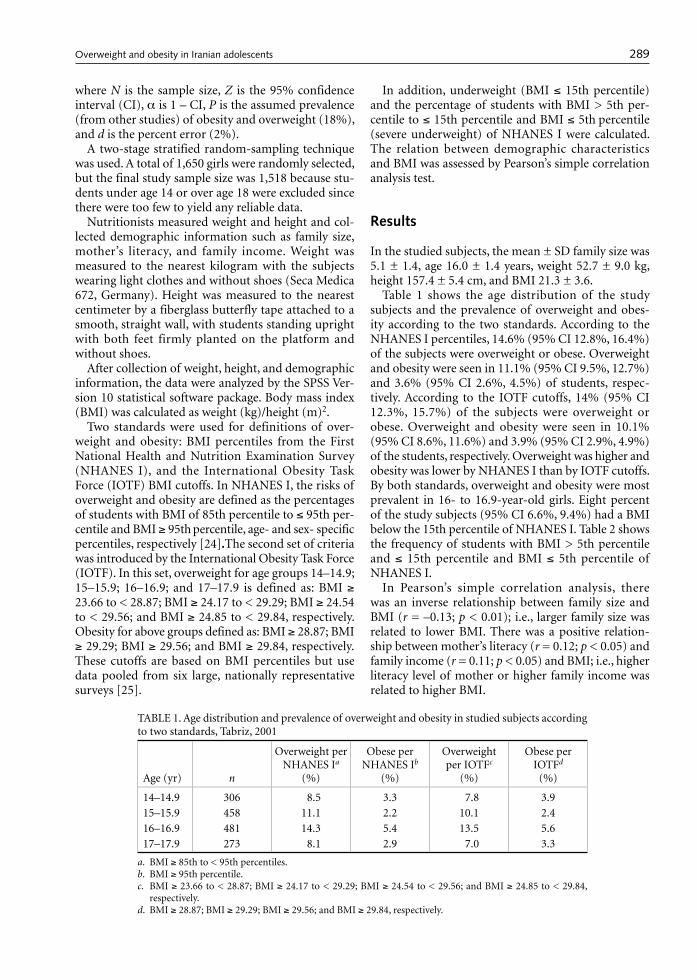
288 Food and Nutrition Bulletin, vol. 25, no. 3 © 2004, The United Nations University.
289
where N is the sample size, Z is the 95% confidence interval (CI), α is 1 – CI, P is the assumed prevalence (from other studies) of obesity and overweight (18%), and d is the percent error (2%).
A two-stage stratified random-sampling technique was used. A total of 1,650 girls were randomly selected, but the final study sample size was 1,518 because stu-dents under age 14 or over age 18 were excluded since there were too few to yield any reliable data.
Nutritionists measured weight and height and col-lected demographic information such as family size, mother’s literacy, and family income. Weight was measured to the nearest kilogram with the subjects wearing light clothes and without shoes (Seca Medica 672, Germany). Height was measured to the nearest centimeter by a fiberglass butterfly tape attached to a smooth, straight wall, with students standing upright with both feet firmly planted on the platform and without shoes.
After collection of weight, height, and demographic information, the data were analyzed by the SPSS Ver-sion 10 statistical software package. Body mass index (BMI) was calculated as weight (kg)/height (m)2.
Two standards were used for definitions of over-weight and obesity: BMI percentiles from the First National Health and Nutrition Examination Survey (NHANES I), and the International Obesity Task Force (IOTF) BMI cutoffs. In NHANES I, the risks of overweight and obesity are defined as the percentages of students with BMI of 85th percentile to ≤ 95th per-centile and BMI ≥ 95th percentile, age- and sex- specific percentiles, respectively [24].The second set of criteria was introduced by the International Obesity Task Force (IOTF). In this set, overweight for age groups 14–14.9; 15–15.9; 16–16.9; and 17–17.9 is defined as: BMI ≥ 23.66 to < 28.87; BMI ≥ 24.17 to < 29.29; BMI ≥ 24.54 to < 29.56; and BMI ≥ 24.85 to < 29.84, respectively. Obesity for above groups defined as: BMI ≥ 28.87; BMI ≥ 29.29; BMI ≥ 29.56; and BMI ≥ 29.84, respectively. These cutoffs are based on BMI percentiles but use data pooled from six large, nationally representative surveys [25].
In addition, underweight (BMI ≤ 15th percentile) and the percentage of students with BMI > 5th per-centile to ≤ 15th percentile and BMI ≤ 5th percentile (severe underweight) of NHANES I were calculated. The relation between demographic characteristics and BMI was assessed by Pearson’s simple correlation analysis test.
Results
In the studied subjects, the mean ± SD family size was 5.1 ± 1.4, age 16.0 ± 1.4 years, weight 52.7 ± 9.0 kg, height 157.4 ± 5.4 cm, and BMI 21.3 ± 3.6.
Table 1 shows the age distribution of the study subjects and the prevalence of overweight and obes-ity according to the two standards. According to the NHANES I percentiles, 14.6% (95% CI 12.8%, 16.4%) of the subjects were overweight or obese. Overweight and obesity were seen in 11.1% (95% CI 9.5%, 12.7%) and 3.6% (95% CI 2.6%, 4.5%) of students, respec-tively. According to the IOTF cutoffs, 14% (95% CI 12.3%, 15.7%) of the subjects were overweight or obese. Overweight and obesity were seen in 10.1% (95% CI 8.6%, 11.6%) and 3.9% (95% CI 2.9%, 4.9%) of the students, respectively. Overweight was higher and obesity was lower by NHANES I than by IOTF cutoffs. By both standards, overweight and obesity were most prevalent in 16- to 16.9-year-old girls. Eight percent of the study subjects (95% CI 6.6%, 9.4%) had a BMI below the 15th percentile of NHANES I. Table 2 shows the frequency of students with BMI > 5th percentile and ≤ 15th percentile and BMI ≤ 5th percentile of NHANES I.
In Pearson’s simple correlation analysis, there was an inverse relationship between family size and BMI (r = –0.13; p < 0.01); i.e., larger family size was related to lower BMI. There was a positive relation-ship between mother’s literacy (r = 0.12; p < 0.05) and family income (r = 0.11; p < 0.05) and BMI; i.e., higher literacy level of mother or higher family income was related to higher BMI.
TABLE 1. Age distribution and prevalence of overweight and obesity in studied subjects according to two standards, Tabriz, 2001
Age (yr) n
Overweight per NHANES Ia
(%)
Obese per NHANES Ib
(%)
Overweight per IOTFc
(%)
Obese per IOTFd
(%)
14–14.9 306 8.5 3.3 7.8 3.915–15.9 458 11.1 2.2 10.1 2.416–16.9 481 14.3 5.4 13.5 5.617–17.9 273 8.1 2.9 7.0 3.3
a. BMI ≥ 85th to < 95th percentiles.b. BMI ≥ 95th percentile.c. BMI ≥ 23.66 to < 28.87; BMI ≥ 24.17 to < 29.29; BMI ≥ 24.54 to < 29.56; and BMI ≥ 24.85 to < 29.84,
respectively.d. BMI ≥ 28.87; BMI ≥ 29.29; BMI ≥ 29.56; and BMI ≥ 29.84, respectively.
Overweight and obesity in Iranian adolescents
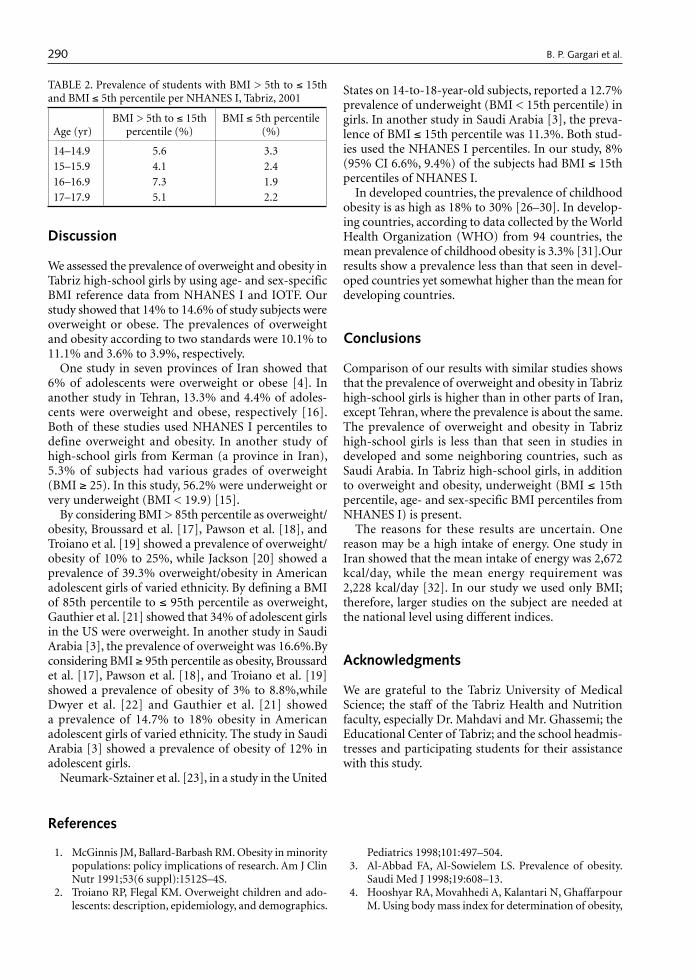
290 291
Discussion
We assessed the prevalence of overweight and obesity in Tabriz high-school girls by using age- and sex-specific BMI reference data from NHANES I and IOTF. Our study showed that 14% to 14.6% of study subjects were overweight or obese. The prevalences of overweight and obesity according to two standards were 10.1% to 11.1% and 3.6% to 3.9%, respectively.
One study in seven provinces of Iran showed that 6% of adolescents were overweight or obese [4]. In another study in Tehran, 13.3% and 4.4% of adoles-cents were overweight and obese, respectively [16]. Both of these studies used NHANES I percentiles to define overweight and obesity. In another study of high-school girls from Kerman (a province in Iran), 5.3% of subjects had various grades of overweight (BMI ≥ 25). In this study, 56.2% were underweight or very underweight (BMI < 19.9) [15].
By considering BMI > 85th percentile as overweight/obesity, Broussard et al. [17], Pawson et al. [18], and Troiano et al. [19] showed a prevalence of overweight/obesity of 10% to 25%, while Jackson [20] showed a prevalence of 39.3% overweight/obesity in American adolescent girls of varied ethnicity. By defining a BMI of 85th percentile to ≤ 95th percentile as overweight, Gauthier et al. [21] showed that 34% of adolescent girls in the US were overweight. In another study in Saudi Arabia [3], the prevalence of overweight was 16.6%.By considering BMI ≥ 95th percentile as obesity, Broussard et al. [17], Pawson et al. [18], and Troiano et al. [19] showed a prevalence of obesity of 3% to 8.8%,while Dwyer et al. [22] and Gauthier et al. [21] showed a prevalence of 14.7% to 18% obesity in American adolescent girls of varied ethnicity. The study in Saudi Arabia [3] showed a prevalence of obesity of 12% in adolescent girls.
Neumark-Sztainer et al. [23], in a study in the United
States on 14-to-18-year-old subjects, reported a 12.7% prevalence of underweight (BMI < 15th percentile) in girls. In another study in Saudi Arabia [3], the preva-lence of BMI ≤ 15th percentile was 11.3%. Both stud-ies used the NHANES I percentiles. In our study, 8% (95% CI 6.6%, 9.4%) of the subjects had BMI ≤ 15th percentiles of NHANES I.
In developed countries, the prevalence of childhood obesity is as high as 18% to 30% [26–30]. In develop-ing countries, according to data collected by the World Health Organization (WHO) from 94 countries, the mean prevalence of childhood obesity is 3.3% [31].Our results show a prevalence less than that seen in devel-oped countries yet somewhat higher than the mean for developing countries.
Conclusions
Comparison of our results with similar studies shows that the prevalence of overweight and obesity in Tabriz high-school girls is higher than in other parts of Iran, except Tehran, where the prevalence is about the same. The prevalence of overweight and obesity in Tabriz high-school girls is less than that seen in studies in developed and some neighboring countries, such as Saudi Arabia. In Tabriz high-school girls, in addition to overweight and obesity, underweight (BMI ≤ 15th percentile, age- and sex-specific BMI percentiles from NHANES I) is present.
The reasons for these results are uncertain. One reason may be a high intake of energy. One study in Iran showed that the mean intake of energy was 2,672 kcal/day, while the mean energy requirement was 2,228 kcal/day [32]. In our study we used only BMI; therefore, larger studies on the subject are needed at the national level using different indices.
Acknowledgments
We are grateful to the Tabriz University of Medical Science; the staff of the Tabriz Health and Nutrition faculty, especially Dr. Mahdavi and Mr. Ghassemi; the Educational Center of Tabriz; and the school headmis-tresses and participating students for their assistance with this study.
TABLE 2. Prevalence of students with BMI > 5th to ≤ 15th and BMI ≤ 5th percentile per NHANES I, Tabriz, 2001
Age (yr)BMI > 5th to ≤ 15th
percentile (%)BMI ≤ 5th percentile
(%)
14–14.9 5.6 3.315–15.9 4.1 2.416–16.9 7.3 1.917–17.9 5.1 2.2
References
1. McGinnis JM, Ballard-Barbash RM. Obesity in minority populations: policy implications of research. Am J Clin Nutr 1991;53(6 suppl):1512S–4S.
2. Troiano RP, Flegal KM. Overweight children and ado-lescents: description, epidemiology, and demographics.
Pediatrics 1998;101:497–504. 3. Al-Abbad FA, Al-Sowielem LS. Prevalence of obesity.
Saudi Med J 1998;19:608–13. 4. Hooshyar RA, Movahhedi A, Kalantari N, Ghaffarpour
M. Using body mass index for determination of obesity,
B. P. Gargari et al. Overweight and obesity in Iranian adolescents

290 291
overweight and underweight in Iranian groups. In: Ira-nian Sixth Nutritional Congress, Executive Committee, 1st ed. Ahwaz, Iran: Mehr Publication Co, 2001:62.
5. Pi-Sunyer FX. Obesity. In: Shils ME, Olson JA, Shike M, Ross AC. Modern nutrition in health and disease, 9th ed. Philadelphia, Pa, USA: Lippincott Williams & Wilkins, 1999:1395–418.
6. Laquatra I. Nutrition for weight management. In: Kathleen ML, Escott SS. Kraus’s food, nutrition and diet therapy, 10th ed. Philadelphia, Pa, USA: WB Saunders, 2000:485–515.
7. Pi-Sunyer FX. Health implications of obesity. Am J Clin Nutr 1991;53(6 suppl):1595S–603S.
8. Kraus RM, Winston M, Fletcher BJ, Grundy SM. Obes-ity: impact on cardiovascular disease. Circulation 1998;98:1472–6.
9. Gidding SS, Laibel RL, Daniels S, Rosenbaum M, Horn LV, Marx GR. Understanding obesity in youth: a state-ment for healthcare professionals from the Committee on Atherosclerosis and Hypertension in the Young of the Council on Cardiovascular Disease in the Young and the Nutrition Committee, American Heart Association. Circulation 1996;94:3383–7.
10. Sinaiko AR, Donahue RP, Jacobs DR, Prineas RJ. Rela-tion of weight and rate of increase in weight during childhood and adolescence to body size, blood pressure, fasting insulin, and lipids in young adults. The Min-neapolis Children’s Blood Pressure Study. Circulation 1999;99:1471–6.
11. Serdula MK, Ivery D, Coates RJ, Freedman DS, William-son DF, Byers T. Do obese children become obese adults? A review of the literature. Prev Med 1993;22:167–77.
12. Guo SS, Roche AF, Chumlea WC, Gardner JD, Siervogel RM. The predictive value of childhood body mass index values for overweight at age 35. Am J Clin Nutr 1994;59:810–9.
13. Dietz WH. Health consequences of obesity in youth: childhood predictors of adult disease. Pediatrics 1998;101:518–25.
14. Must A, Jacques PF, Dallal GE, Bajema CJ, Dietz WH. Long-term morbidity and mortality of overweight adolescents. A follow-up of the Harvard Growth Study of 1922 to 1935. N Engl J Med 1992;327:1350–5.
15. Janghorbani M, Parvin F. Prevalence of overweight and thinness in high-school girls in Kerman, Iran. Int J Obes Relat Metab Disord 1998;22:629–33.
16. Mirmiran P, Mohamadi F, Allahverdian S, Sarbazi N, Emami H, Azizi F. Prevalence of overweight and underweight in adolescents from east of Tehran and its relationship with food intakes. Tehran cohort study of lipid and carbohydrate. In: Iranian Sixth Nutritional Congress, Executive Committee, 1st ed. Ahwaz, Iran: Mehr Publication Co, 2001:37.
17. Broussard BA, Johnson A, Himes JH, Story M, Fichtner R, Hauck F, Bachman-Carter K, Hayes J, Frohlich K,
Gray N, Valway S, Gohdes D. Prevalence of obesity in American Indians and Alaska Natives. Am J Clin Nutr 1991;53(6 suppl):1535S–42S.
18. Pawson IG, Martorell R, Mendoza FE. Prevalence of overweight and obesity in US Hispanic populations. Am J Clin Nutr 1991;53(6 suppl):1522S–8S.
19. Troiano RP, Flegal KM, Kuczmarski RJ, Campbell SM, Johnson CL. Overweight prevalence and trends for chil-dren and adolescents. The National Health and Nutri-tion Examination Surveys, 1963 to 1991. Arch Pediatr Adolesc Med 1995;149:1085–91.
20. Jackson MY. Height, weight and body mass index of American Indian schoolchildren, 1990–1991. J Am Diet Assoc 1993;93:1136–40.
21. Gauthier BM, Hickner JM, Ornstein S. High prevalence of overweight children and adolescents in the Practice Partner Research Network. Arch Pediatr Adolesc 2000;154:625–8.
22. Dwyer JT, Stone EJ, Yang M, Webber LS, Must A, Feld-man HA, Nader PR, Perry CL, Parcel GS. Prevalence of marked overweight and obesity in a multiethnic pediat-ric population: findings from the Child and Adolescent Trial for Cardiovascular Health (CATCH) Study. J Am Diet Assoc 2000;100:1149–56.
23. Neumark-Sztainer D, Hannan PJ. Weight-related behav-iors among adolescent girls and boys: results from a national survey. Arch Pediatr Adolesc Med 2000;154:569–77.
24. Must A, Dallal GE, Dietz WH. Reference data for obes-ity: 85th and 95th percentiles of body mass index (wt/ht2)—a correction. Am J Clin Nutr 1991;54:773.
25. Cole TJ, Bellizzi MC, Flegal KM, Dietz WH. Establishing a standard definition for child overweight and obesity worldwide: international survey. Br Med J 2000;320:1240–3.
26. Bellizzi MC, Dietz WH. Workshop on childhood obes-ity: summary of the discussion. Am J Clin Nutr 1999;70(1 part 2):173S–5S.
27. James WP, Ralph A. New understanding in obesity research. Proc Nutr Soc 1999;58:385–93.
28. Livingstone B. Epidemiology of childhood obesity in Europe. Eur J Pediatr 2000;159:S14–34.
29. Seidell JC. Obesity: a growing problem. Acta Pediatr Suppl 1999;88:46–50.
30. Strauss R. Childhood obesity. Curr Probl Pediatr 1999;29:1–29.
31. de Onis M, Blossner M. Prevalence and trends of overweight among preschool children in developing countries. Am J Clin Nutr 2000;72:1032–9.
32. Ghaffarpour M, Hooshiar RA, Hormozdiari H. National assessment of food intake in Iranian urban and rural communities. In: Iranian Sixth Nutritional Congress, Executive Committee, 1st ed. Ahwaz, Iran: Mehr Publi-cation Co, 2001:23.
B. P. Gargari et al. Overweight and obesity in Iranian adolescents
292 Food and Nutrition Bulletin, vol. 25, no. 3 © 2004, The United Nations University.
293
Introduction
On May 22, 2004, the 57th World Health Assembly (WHA) adopted a Global Strategy on Diet, Physical Activity and Health [1]. The Director-General of the World Health Organization (WHO) described the adoption of the strategy as a landmark achievement in global public health [2]. The Global Strategy addresses two of the major risk factors responsible for the heavy and growing burden of noncommunicable diseases, namely, unhealthy diet and physical inactivity, which now account for some 60% of global deaths and almost half (47%) of the global burden of diseases [3]. The 2002 World Health Report revealed how only a few risk factors were responsible for the leading causes of death and disability worldwide. Dietary and activity risks scored high, and among the 10 leading causes of death are high blood pressure, elevated blood cholesterol, low intake of fruits and vegetables, high body mass index, undernutrition, and physical inactivity [4].
WHO developed the strategy over the past two years through an inclusive and wide-ranging consul-tation process that involved Member States, United Nations agencies, civil society organizations, and the private sector.
The adoption of the strategy comes at a critical time in which countries have a relatively short period to intervene and act before the disease burden and human and economic costs of diseases, such as cardiovascular diseases, will be out of control. This is particularly true for developing countries [5].
Key policy recommendations outlined by the strat-egy include the following:
Policies concerning the environment
1. Formulation of multisectoral and multistakeholder policies and strategies
2. Formulation of national dietary and physical activ-ity guidelines
3. Promotion of food products consistent with a healthy diet, including the provision of market incentives, to promote the development, produc-tion, and marketing of food products that contrib-ute to a healthy diet
4. Introduction of fiscal policies to influence food choices
5. Consideration of agriculture policies and their effect on national diets
6. Introduction of transport and environmental poli-cies that promote physical activity
7. School policies that improve health literacy, pro-mote healthy diet, and provide physical education and facilities
8. Address current marketing practices, especially to children, in particular with regard to the promo-tion of foods high in fat, salt, and sugar
9. Utilization of international tools, such as the Codex Alimentarius, to strengthen public health efforts
Policies aimed at individual change
1. Provision of accurate information through educa-tion and public awareness campaigns and adult literacy programs
2. Provision of accurate nutrition labeling and moni-toring nutrition and health claims on foods
3. Practical advice by health professionals to patients and families on the benefits of healthy diets and increased levels of physical activity, combined with support to help patients initiate and maintain healthy behaviors
4. Provision of clear, simplified messages with regard to healthy diet and physical activity (reduce salt, sugar, and fat; increase fruit and vegetables, etc.)
WHO Global Strategy on Diet, Physical Activity and Health*
* Endorsed by resolution WHA57.17 at the Fifty-seventh World Health Assembly, 22 May 2004.
WHO global strategy
292 Food and Nutrition Bulletin, vol. 25, no. 3 © 2004, The United Nations University.
293
Policies that address foods, drinks, and modes of transport
1. Modify foods to limit fat, especially saturated fat and trans-fatty acids, salt, and sugar
2. Introduction and provision of incentives for new products with better nutritional value
3. Modify marketing practices of foods that contrib-ute to an unhealthy diet
4. Encourage environmental planning that allows increased walking, cycling, and other physical activities
The policies in the box above require the involve-ment of sectors and stakeholders beyond the health domain. Proven effective interventions are those that cover the following three levels: the host (individual), the agent (the food and drink consumed, for example), and the environment (changes in national policies, leg-islation, and the creation of an enabling environment for healthy diet and physical activity) [6, 7]. Further,
several recommendations involve sectors such as finance, trade, agriculture, and transport. These recom-mendations offer countries a blueprint for action, and it is hoped that national governments, together with all relevant sectors, will develop national action plans and implement the recommendations as appropriate for their national reality. High-level advocacy by non-governmental organizations will continue to be key to ensuring public awareness and political commitment, without which such plans are unlikely to be effective in yielding positive public health outcomes.
The strategy is a powerful instrument, which, together with effective implementation of the Frame-work Convention on Tobacco Control, will allow coun-tries to develop integrated effective approaches to the prevention of noncommunicable diseases.
Amalia WaxmanProject Manager
Global Strategy on Diet, Physical Activity and HealthWorld Health Organization
References
1. World Health Assembly Resolution WHA57.17. Global strategy on diet, physical activity and health. World Health Organization, Geneva: May 22, 2004.
2. http://www.who.int/mediacentre/releases/2004/wha3/en
3. World health report 2003: shaping the future. Geneva: World Health Organization, 2003.
4. World health report 2002: reducing risks, promoting healthy life. Geneva: World Health Organization, 2002.
5. Leeder S, Raymond S, Greenberg H, Hui Liu. A race against time: the challenge of cardiovascular disease in
developing economies. New York: The Earth Institute at Columbia University, 2004 .
6. Swinburn B. Sustaining dietary changes for preventing obesity and diabetes: lessons learned from the successes of other epidemic control programs. Asia Pac J Clin Nutr 2002;11(suppl):S598-606.
7. Kumanyika S, Jeffery RW, Morabia A, Ritenbaugh C, Antipatis VJ; Public Health Approaches to the Pre-vention of Obesity (PHAPO) Working Group of the International Obesity Task Force (IOTF). Obesity prevention: the case for action. Int J Obes Relat Metab Disord 2002;26:425-36.
WHO global strategy
1. Recognizing the heavy and growing burden of non-communicable diseases, Member States requested the Director-General to develop a global strategy on diet, physical activity and health through a broad consultation process.* To establish the content of the draft global strategy, six regional consultations were held with Member States, and organizations of the United Nations system, other intergovern-mental bodies, and representatives of civil society and the private sector were consulted. A reference group of independent international experts on diet and physical activity from WHO’s six regions also provided advice.
2. The strategy addresses two of the main risk fac-tors for noncommunicable diseases, namely, diet and physical activity, while complementing the long-established and ongoing work carried out by WHO and nationally on other nutrition-related areas, including undernutrition, micronutrient deficiencies and infant- and young-child feeding.
The challenge
3. A profound shift in the balance of the major causes of death and disease has already occurred in developed countries and is under way in many developing countries. Globally, the burden of noncommunicable diseases has rapidly increased. In 2001 noncommunicable diseases accounted for * Resolution WHA55.23.
WHO global strategy

294 295
almost 60% of the 56 million deaths annually and 47% of the global burden of disease. In view of these figures and the predicted future growth in this disease burden, the prevention of noncom-municable diseases presents a major challenge to global public health.
4. The World Health Report 2002* describes in detail how, in most countries, a few major risk factors account for much of the morbidity and mortality. For noncommunicable diseases, the most impor-tant risks included high blood pressure, high con-centrations of cholesterol in the blood, inadequate intake of fruit and vegetables, overweight or obesity, physical inactivity and tobacco use. Five of these risk factors are closely related to diet and physical activity.
5. Unhealthy diets and physical inactivity are thus among the leading causes of the major noncom-municable diseases, including cardiovascular dis-ease, type 2 diabetes and certain types of cancer, and contribute substantially to the global burden of disease, death and disability. Other diseases related to diet and physical inactivity, such as dental caries and osteoporosis, are widespread causes of morbidity.
6. The burden of mortality, morbidity and disabil-ity attributable to noncommunicable diseases is currently greatest and continuing to grow in the developing countries, where those affected are on average younger than in developed countries, and where 66% of these deaths occur. Rapid changes in diets and patterns of physical activity are further causing rates to rise. Smoking also increases the risk for these diseases, although largely through independent mechanisms.
7. In some developed countries where noncommuni-cable diseases have dominated the national burden of disease, age-specific death and disease rates have been slowly declining. Progress is being made in reducing premature death rates from coronary artery disease, cerebrovascular disease and some tobacco-related cancers. However, the overall burden and number of patients remain high, and the numbers of overweight and obese adults and children, and of cases, closely linked, of type 2 dia-betes are growing in many developed countries.
8. Noncommunicable diseases and their risk factors are initially mostly limited to economically success-ful groups in low- and middle-income countries. However, recent evidence shows that, over time, patterns of unhealthy behaviour and the noncom-municable diseases associated with them cluster among poor communities and contribute to social and economic inequalities.
9. In the poorest countries, even though infectious diseases and undernutrition dominate their cur-rent disease burden, the major risk factors for chronic diseases are spreading. The prevalence of overweight and obesity is increasing in developing countries, and even in low-income groups in richer countries. An integrated approach to the causes of unhealthy diet and decreasing levels of physical activity would contribute to reducing the future burden of noncommunicable diseases.
10. For all countries for which data are available, the underlying determinants of noncommunicable dis-eases are largely the same. Factors that increase the risks of noncommunicable disease include elevated consumption of energy-dense, nutrient-poor foods that are high in fat, sugar and salt; reduced levels of physical activity at home, at school, at work and for recreation and transport; and use of tobacco. Variations in risk levels and related health outcomes among the population are attributed, in part, to the variability in timing and intensity of economic, demographic and social changes at national and global levels. Of particular concern are unhealthy diets, inadequate physical activity and energy imbalances in children and adolescents.
11. Maternal health and nutrition before and during pregnancy, and early infant nutrition may be important in the prevention of noncommunica-ble diseases throughout the life course. Exclusive breastfeeding for six months and appropriate com-plementary feeding contribute to optimal physical growth and mental development. Infants who suffer prenatal and possibly, postnatal growth restrictions appear to be at higher risk for noncommunicable diseases in adulthood.
12. Most elderly people live in developing countries, and the ageing of populations has a strong impact on morbidity and mortality patterns. Many devel-oping countries will therefore be faced with an increased burden of noncommunicable diseases at the same time as a persisting burden of infectious diseases. In addition to the human dimension, maintaining the health and functional capacity of the increasing elderly population will be a crucial factor in reducing the demand for, and cost of, health services.
13. Diet and physical activity influence health both together and separately. Although the effects of diet and physical activity on health often interact, particularly in relation to obesity, there are addi-tional health benefits to be gained from physical activity that are independent of nutrition and diet, and there are significant nutritional risks that are unrelated to obesity. Physical activity is a fundamental means of improving the physical and mental health of individuals.
14. Governments have a central role, in cooperation * The world health report 2002. Reducing risks, promoting
healthy life. Geneva, World Health Organization, 2002.
WHO global strategy WHO global strategy

294 295
with other stakeholders, to create an environment that empowers and encourages behaviour changes by individuals, families and communities, to make positive, life-enhancing decisions on healthy diets and patterns of physical activity.
15. Noncommunicable diseases impose a significant economic burden on already strained health sys-tems, and inflict great costs on society. Health is a key determinant of development and a precursor of economic growth. The WHO Commission on Macroeconomics and Health has demonstrated the disruptive effect of disease on development, and the importance for economic development of investments in health.* Programmes aimed at promoting healthy diets and physical activity for the prevention of diseases are key instruments in policies to achieve development goals.
The opportunity
16. A unique opportunity exists to formulate and implement an effective strategy for substantially reducing deaths and disease worldwide by improv-ing diet and promoting physical activity. Evidence for the links between these health behaviours and later disease and ill-health is strong. Effective interventions to enable people to live longer and healthier lives, reduce inequalities, and enhance development can be designed and implemented. By mobilizing the full potential of the major stake-holders, this vision could become a reality for all populations in all countries.
Goal and objectives
17. The overall goal of the global strategy on diet, phys-ical activity and health is to promote and protect health by guiding the development of an enabling environment for sustainable actions at individual, community, national and global levels that, when taken together, will lead to reduced disease and death rates related to unhealthy diet and physical inactivity. These actions support the United Nations Millennium Development Goals and have immense potential for public health gains worldwide.
18. The global strategy has four main objectives:(1) to reduce the risk factors for noncommunica-
ble diseases that stem from unhealthy diets and physical inactivity by means of essential public health action and health-promoting and dis-ease-preventive measures;
(2) to increase the overall awareness and under-
standing of the influences of diet and physical activity on health and of the positive impact of preventive interventions;
(3) to encourage the development, strengthen-ing and implementation of global, regional, national and community policies and action plans to improve diets and increase physical activity that are sustainable, comprehensive, and actively engage all sectors, including civil society, the private sector and the media;
(4) to monitor scientific data and key influences on diet and physical activity; to support research in a broad spectrum of relevant areas, including evaluation of interventions; and to strengthen the human resources needed in this domain to enhance and sustain health.
Evidence for action
19. Evidence shows that, when other threats to health are addressed, people can remain healthy into their seventh, eighth and ninth decades, through a range of health-promoting behaviours, including healthy diets, regular and adequate physical activ-ity, and avoidance of tobacco use. Recent research has contributed to understanding of the benefits of healthy diets, physical activity, individual action and population-based public health interventions. Although more research is needed, current knowl-edge warrants urgent public health action.
20. Risk factors for noncommunicable disease fre-quently coexist and interact. As the general level of risk factors rises, more people are put at risk. Preventive strategies should therefore aim at reducing risk throughout the population. Such risk reduction, even if modest, cumulatively yields sustainable benefits, which exceeds the impact of interventions restricted to high-risk individuals. Healthy diets and physical activity, together with tobacco control, constitute an effective strategy to contain the mounting threat of noncommunicable diseases.
21. Reports of international and national experts and reviews of the current scientific evidence recom-mend goals for nutrient intake and physical activity in order to prevent major noncommunicable dis-eases. These recommendations need to be consid-ered when preparing national policies and dietary guidelines, taking into account the local situation.
22. For diet, recommendations for populations and individuals should include the following: » achieve energy balance and a healthy weight» limit energy intake from total fats and shift fat
consumption away from saturated fats to unsatu-rated fats and towards the elimination of trans-fatty acids
* Macroeconomics and health: investing in health for eco-nomic development. Geneva, World Health Organization, 2001.
WHO global strategy WHO global strategy

296 297
» increase consumption of fruits and vegetables, and legumes, whole grains and nuts
» limit the intake of free sugars » limit salt (sodium) consumption from all sources
and ensure that salt is iodized.23. Physical activity is a key determinant of energy
expenditure, and thus is fundamental to energy bal-ance and weight control. Physical activity reduces risk for cardiovascular diseases and diabetes and has substantial benefits for many conditions, not only those associated with obesity. The beneficial effects of physical activity on the metabolic syndrome are mediated by mechanisms beyond controlling excess body weight. For example, physical activity reduces blood pressure, improves the level of high density lipoprotein cholesterol, improves control of blood glucose in overweight people, even without sig-nificant weight loss, and reduces the risk for colon cancer and breast cancer among women.
24. For physical activity, it is recommended that individuals engage in adequate levels throughout their lives. Different types and amounts of physical activity are required for different health outcomes: at least 30 minutes of regular, moderate-intensity physical activity on most days reduces the risk of cardiovascular disease and diabetes, colon cancer and breast cancer. Muscle strengthening and bal-ance training can reduce falls and increase func-tional status among older adults. More activity may be required for weight control.
25. The translation of these recommendations, together with effective measures to prevent and control tobacco use, into a global strategy that leads to regional and national action plans, will require sus-tained political commitment and the collaboration of many stakeholders. This strategy will contribute to the effective prevention of noncommunicable diseases.
Principles for action
26. The World Health Report 2002 highlights the poten-tial for improving public health through measures that reduce the prevalence of risk factors (most notably the combination of unhealthy diets and physical inactivity) of noncommunicable diseases. The principles set out below guided the drafting of WHO’s global strategy on diet, physical activity and health and are recommended for the devel-opment of national and regional strategies and action plans.
27. Strategies need to be based on the best available scientific research and evidence; comprehensive, incorporating both policies and action and addressing all major causes of noncommunicable diseases together; multisectoral, taking a long-term
perspective and involving all sectors of society; and multidisciplinary and participatory, consistent with the principles contained in the Ottawa Charter for Health Promotion and confirmed in subsequent conferences on health promotion,* and recognizing the complex interactions between personal choices, social norms and economic and environmental fac-tors.
28. A life-course perspective is essential for the preven-tion and control of noncommunicable diseases. This approach starts with maternal health and prenatal nutrition, pregnancy outcomes, exclusive breastfeeding for six months, and child and ado-lescent health; reaches children at schools, adults at worksites and other settings, and the elderly; and encourages a healthy diet and regular physical activity from youth into old age.
29. Strategies to reduce noncommunicable diseases should be part of broader, comprehensive and coordinated public health efforts. All partners, especially governments, need to address simulta-neously a number of issues. In relation to diet, these include all aspects of nutrition (for example, both overnutrition and undernutrition, micronutri-ent deficiency and excess consumption of certain nutrients); food security (accessibility, availability and affordability of healthy food); food safety; and support for and promotion of six months of exclusive breastfeeding. Regarding physical activ-ity, issues include requirements for physical activ-ity in working, home and school life, increasing urbanization, and various aspects of city planning, transportation, safety and access to physical activity during leisure.
30. Priority should be given to activities that have a positive impact on the poorest population groups and communities. Such activities will generally require community-based action with strong gov-ernment intervention and oversight.
31. All partners need to be accountable for framing policies and implementing programmes that will effectively reduce preventable risks to health. Evalu-ation, monitoring and surveillance are essential components of such actions.
32. The prevalence of noncommunicable diseases related to diet and physical activity may vary greatly between men and women. Patterns of physical activity and diets differ according to sex, culture and age. Decisions about food and nutri-tion are often made by women and are based on culture and traditional diets. National strategies and action plans should therefore be sensitive to such differences.
33. Dietary habits and patterns of physical activity are often rooted in local and regional traditions.
* See resolution WHA51.12 (1998).
WHO global strategy WHO global strategy
296 297
National strategies should therefore be culturally appropriate and able to challenge cultural influ-ences and to respond to changes over time.
Responsibilities for action
34. Bringing about changes in dietary habits and pat-terns of physical activity will require the combined efforts of many stakeholders, public and private, over several decades. A combination of sound and effective actions is needed at global, regional, national and local levels, with close monitoring and evaluation of their impact. The following paragraphs describe the responsibilities of those involved and provide recommendations deriving from the consultation process.
Member states
35. The global strategy should foster the formulation and promotion of national policies, strategies and action plans to improve diet and encourage physi-cal activity. National circumstances will determine priorities in the development of such instruments. Because of the great variations in and between different countries, regional bodies should col-laborate in formulating regional strategies, which can provide considerable support to countries in implementing their national plans. For maximum effectiveness, countries should adopt the most comprehensive action plans possible.
36. The role of government is crucial in achieving last-ing change in public health. Governments have a primary steering and stewardship role in initiat-ing and developing the strategy, ensuring that it is implemented and monitoring its impact in the long term.
37. Governments are encouraged to build on exist-ing structures and processes that already address aspects of diet, nutrition and physical activity. In many countries, existing national strategies and action plans can be used in implementing this strategy; in others they can form the basis for advancing control of noncommunicable dis-eases. Governments are encouraged to set up a national coordinating mechanism that addresses diet and physical activity within the context of a comprehensive plan for noncommunicable-disease prevention and health promotion. Local authori-ties should be closely involved. Multisectoral and multidisciplinary expert advisory boards should also be established. They should include technical experts and representatives of government agencies, and have an independent chair to ensure that sci-
entific evidence is interpreted without any conflict of interest.
38. Health ministries have an essential responsibility for coordinating and facilitating the contributions of other ministries and government agencies. Bodies whose contributions should be coordi-nated include ministries and government institu-tions responsible for policies on food, agriculture, youth, recreation, sports, education, commerce and industry, finance, transportation, media and com-munication, social affairs and environmental and urban planning.
39. National strategies, policies and action plans need broad support. Support should be provided by effective legislation, appropriate infrastructure, implementation programmes, adequate fund-ing, monitoring and evaluation, and continuing research. (1) National strategies on diet and physical activ-
ity. National strategies describe the measures to promote healthy diets and physical activity that are essential to prevent disease and promote health, including those that tackle all aspects of unbalanced diets, including undernutri-tion and overnutrition. National strategies should include specific goals, objectives, and actions, similar to those outlined in the global strategy. Of particular importance are the ele-ments needed to implement the plan of action, including identification of necessary resources and national focal points (key national insti-tutes); collaboration between the health sector and other key sectors such as agriculture, educa-tion, urban planning, transportation and com-munication; and monitoring and follow-up.
(2) National dietary guidelines. Governments are encouraged to draw up national dietary guide-lines, taking account of evidence from national and international sources. Such guidelines advise national nutrition policy, nutrition education, other public health interventions and intersectoral collaboration. They may be updated periodically in the light of changes in dietary and disease patterns and evolving scientific knowledge.
(3) National physical activity guidelines. National guidelines for health-enhancing physical activity should be prepared in accordance with the goals and objectives of the global strategy and expert recommendations.
40. Governments should provide accurate and bal-anced information. Governments need to consider actions that will result in provision of balanced information for consumers to enable them easily to make healthy choices, and to ensure the avail-ability of appropriate health promotion and edu-
WHO global strategy WHO global strategy

298 299
cation programmes. In particular, information for consumers should be sensitive to literacy levels, communication barriers and local culture, and understood by all segments of the population. In some countries, health-promoting programmes have been designed as a function of such con-siderations and should be used for disseminat-ing information about diet and physical activity. Some governments already have a legal obligation to ensure that factual information available to consumers enables them to make fully informed choices on matters that may affect their health. In other cases, actions may be specific to government policies. Governments should select the optimal mix of actions in accordance with their national capabilities and epidemiological profile, which will vary from one country to another.
41. National food and agricultural policies should be consistent with the protection and promotion of public health. Where needed, governments should consider policies that facilitate the adoption of healthy diet. Food and nutrition policy should also cover food safety and sustainable food security. Governments should be encouraged to examine food and agricultural policies for potential health effects on the food supply. (1) Promotion of food products consistent with a
healthy diet. As a result of consumers’ increas-ing interest in health and governments’ aware-ness of the benefits of healthy nutrition, some governments have taken measures, including market incentives, to promote the develop-ment, production and marketing of food prod-ucts that contribute to a healthy diet and are consistent with national or international dietary recommendations. Governments could consider additional measures to encourage the reduction of the salt content of processed foods, the use of hydrogenated oils, and the sugar content of beverages and snacks.
(2) Fiscal policies. Prices influence consumption choices. Public policies can influence prices through taxation, subsidies or direct pricing in ways that encourage healthy eating and lifelong physical activity. Several countries use fiscal measures, including taxes, to influence availability of, access to, and consumption of, various foods; and some use public funds and subsidies to promote access among poor com-munities to recreational and sporting facilities. Evaluation of such measures should include the risk of unintentional effects on vulnerable populations.
(3) Food programmes. Many countries have pro-grammes to provide food to population groups with special needs or cash transfers to families for them to improve their food purchases. Such
programmes often concern children, families with children, poor people, and people with HIV/AIDS and other diseases. Special atten-tion should be given to the quality of the food items and to nutrition education as a main component of these programmes, so that food distributed to, or purchased by, the families not only provides energy, but also contributes to a healthy diet. Food and cash distribution programmes should emphasize empowerment and development, local production and sustain-ability.
(4) Agricultural policies. Agricultural policy and production often have a great effect on national diets. Governments can influence agricultural production through many policy measures. As emphasis on health increases and consumption patterns change, Member States need to take healthy nutrition into account in their agricul-tural policies.
42. Multisectoral policies are needed to promote physi-cal activity. National policies to promote physical activity should be framed, targeting change in a number of sectors. Governments should review existing policies to ensure that they are consistent with best practice in population-wide approaches to increasing physical activity. (1) Framing and review of public policies. National
and local governments should frame policies and provide incentives to ensure that walking, cycling and other forms of physical activity are accessible and safe; transport policies include nonmotorized modes of transportation; labour and workplace policies encourage physical activ-ity; and sport and recreation facilities embody the concept of sports for all. Public policies and legislation have an impact on opportunities for physical activity, such as those concerning trans-port, urban planning, education, labour, social inclusion, and health-care funding related to physical activity.
(2) Community involvement and enabling envi-ronments. Strategies should be geared to changing social norms and improving com-munity understanding and acceptance of the need to integrate physical activity into every-day life. Environments should be promoted that facilitate physical activity, and supportive infrastructure should be set up to increase access to, and use of, suitable facilities.
(3) Partnerships. Ministries of health should take the lead in forming partnerships with key agencies, and public and private stakeholders in order to draw up jointly a common agenda and workplan aimed at promoting physical activity.
(4) Clear public messages. Simple, direct messages
WHO global strategy WHO global strategy

298 299
need to be communicated on the quantity and quality of physical activity sufficient to provide substantial health benefits.
43. School policies and programmes should support the adoption of healthy diets and physical activ-ity. Schools influence the lives of most children in all countries. They should protect their health by providing health information, improving health literacy, and promoting healthy diets, physical activity, and other healthy behaviours. Schools are encouraged to provide students with daily physical education and should be equipped with appropri-ate facilities and equipment. Governments are encouraged to adopt policies that support healthy diets at school and limit the availability of products high in salt, sugar and fats. Schools should consider, together with parents and responsible authorities, issuing contracts for school lunches to local food growers in order to ensure a local market for healthy foods.
44. Governments are encouraged to consult with stakeholders on policy. Broad public discussion and involvement in the framing of policy can facilitate its acceptance and effectiveness. Member States should establish mechanisms to promote participation of nongovernmental organizations, civil society, communities, the private sector and the media in activities related to diet, physical activity and health. Ministries of health should be responsible, in collaboration with other related ministries and agencies, for establishing these mechanisms, which should aim at strengthening intersectoral cooperation at the national, provincial and local levels. They should encourage community participation, and should be part of planning proc-esses at community level.
45. Prevention is a critical element of health services. Routine contacts with health-service staff should include practical advice to patients and families on the benefits of healthy diets and increased levels of physical activity, combined with support to help patients initiate and maintain healthy behav-iours. Governments should consider incentives to encourage such preventive services and identify opportunities for prevention within existing clini-cal services, including an improved financing struc-ture to encourage and enable health professionals to dedicate more time to prevention.
46. Governments should invest in surveillance, research and evaluation. Long-term and continu-ous monitoring of major risk factors is essential. Over time, such data also provide the basis for analyses of changes in risk factors, which could be attributable to changes in polices and strategies. Governments may be able to build on systems already in place, at either national or regional levels. Emphasis should initially be given to stand-
ard indicators recognized by the general scientific community as valid measures of physical activity, to selected dietary components, and to body weight in order to compile comparative data at global level. Data that provide insight into within-country pat-terns and variations are useful in guiding commu-nity action. Where possible, other sources of data should be used, for example, from the education, transport, agriculture, and other sectors. (1) Monitoring and surveillance. Monitoring and
surveillance are essential tools in the implemen-tation of national strategies for healthy diet and physical activity. Monitoring of dietary habits, patterns of physical activity and interactions between them; nutrition-related biological risk factors and contents of food products; and communication to the public of the informa-tion obtained, are important components of implementation. Of particular importance is the development of methods and procedures using standardized data-collection procedures and a common minimum set of valid, measur-able and usable indicators.
(2) Research and evaluation. Applied research, especially in community-based demonstration projects and in evaluating different policies and interventions, should be promoted. Such research (e.g., into the reasons for physical inac-tivity and poor diet, and on key determinants of effective intervention programmes), combined with the increased involvement of behavioural scientists, will lead to better informed policies and ensure that a cadre of expertise is created at national and local levels. Equally important is the need to put in place effective mechanisms for evaluating the efficacy and cost-effectiveness of national disease-prevention programmes, and the health impact of policies in other sectors. More information is needed, especially on the situation in developing countries, where pro-grammes to promote healthy diets and physical activity need to be evaluated and integrated into broader development and poverty-alleviation programmes.
47. Institutional capacity. Under the ministry of health, national institutions for public health, nutrition and physical activity play an important role in the implementation of national diet and physical activity programmes. They can provide the nec-essary expertise, monitor developments, help to coordinate activities, participate in collaboration at international level, and provide advice to deci-sion-makers.
48. Financing national programmes. Various sources of funding, in addition to the national budget, should be identified to assist in implementation of the strategy. The United Nations Millennium
WHO global strategy WHO global strategy

300 301
Declaration (September 2000) recognizes that eco-nomic growth is limited unless people are healthy. The most cost-effective interventions to contain the epidemic of noncommunicable diseases are preven-tion and a focus on the risk factors associated with these diseases. Programmes aimed at promoting healthy diets and physical activity should therefore be viewed as a developmental need and should draw policy and financial support from national development plans.
WHO
49. WHO, in cooperation with other organizations of the United Nations system, will provide the leadership, evidence-based recommendations and advocacy for international action to improve dietary practices and increase physical activity, in keeping with the guiding principles and specific recommendations contained in this strategy.
50. It will hold discussions with the transnational food industry and other parts of the private sector in support of the aims of this global strategy, and of implementing the recommendations in countries.
51. WHO will provide support for implementation of programmes as requested by Member States, and will focus on the following broad, interrelated areas:» facilitating the framing, strengthening and updat-
ing of regional and national policies on diet and physical activity for integrated noncommunicable disease prevention
» facilitating the drafting, updating and imple-mentation of national food-based dietary and physical activity guidelines, in collaboration with national agencies and drawing upon global knowledge and experience
» providing guidance to Member States on the formulation of guidelines, norms, standards and other policy-related measures that are consistent with the objectives of the global strategy
» identifying and disseminating information on evidence-based interventions, policies and struc-tures that are effective in promoting healthy diets and optimizing the level of physical activity in countries and communities
» providing appropriate technical support to build national capacity in planning and implementing a national strategy and in tailoring it to local cir-cumstances
» providing models and methods so that interven-tions on diet and physical activity constitute an integral component of health care
» promoting and providing support for training of health professionals in healthy diets and an active life, either within existing programmes or
in special workshops, as an essential part of their curricula
» providing advice and support to Member States, using standardized surveillance methods and rapid assessment tools (such as WHO’s STEP-wise approach to surveillance of risk factors for noncommunicable diseases), in order to measure changes in distribution of risk—including pat-terns in diet, nutrition and physical activity—and to assess the current situation, trends, and the impact of interventions. WHO, in collabora-tion with FAO, will provide support to Member States in establishing national nutrition surveil-lance systems, linked with data on the content of food items
» advising Member States on ways of engaging constructively with appropriate industries.
52. WHO, in close collaboration with organizations of the United Nations system and other inter-governmental bodies (FAO, UNESCO, UNICEF, United Nations University and others), research institutes and other partners, will promote and support research in priority areas to facilitate programme implementation and evaluation. This could include commissioning scientific papers, con-ducting analyses, and holding technical meetings on practical research topics that are essential for effective country action. The decision-making proc-ess should be informed by better use of evidence, including health-impact assessment, cost-benefit analysis, national burden-of-disease studies, evi-dence-based intervention models, scientific advice and dissemination of good practices.
53. It will work with FAO and other organizations of the United Nations system, the World Bank, and research institutes on their evaluation of implica-tions of the strategy for other sectors.
54. The Organization will continue to work with WHO collaborating centres to establish networks for building up capacity in research and training, mobilizing contributions from nongovernmental organizations and civil society, and facilitating coordinated, collaborative research as it pertains to the needs of developing countries in the imple-mentation of this strategy.
International partners
55. The role of international partners is of paramount importance in achieving the goals and objectives of the global strategy, particularly with regard to issues of a transnational nature, or where the actions of a single country are insufficient. Coordinated work is needed among the organizations of the United Nations system, intergovernmental bodies, nongovernmental organizations, professional asso-
WHO global strategy WHO global strategy
300 301
ciations, research institutions and private sector entities.
56. The process of preparing the strategy has led to closer interaction with other organizations of the United Nations system, such as FAO and UNICEF, and other partners, including the World Bank. WHO will build on its long-standing collabora-tion with FAO in implementing the strategy. The contribution of FAO in the framing of agricultural policies can play a crucial part in this regard. More research into appropriate agriculture policies, and the supply, availability, processing and consump-tion of food will be necessary.
57. Cooperation is also planned with bodies such as the United Nations Economic and Social Council, ILO, UNESCO, WTO, the regional development banks and the United Nations University. Consistent with the goal and objectives of the strategy, WHO will develop and strengthen partnerships, including through the establishment and coordination of global and regional networks, in order to dis-seminate information, exchange experiences, and provide support to regional and national initiatives. WHO proposes to set up an ad hoc committee of partners within the United Nations system in order to ensure continuing policy coherence and to draw upon each organization’s unique strengths. Partners can play an important role in a global network that targets such areas as advocacy, resource mobiliza-tion, capacity building and collaborative research.
58. International partners could be involved in imple-menting the global strategy by:» contributing to comprehensive intersectoral
strategies to improve diet and physical activity, including, for instance, the promotion of healthy diets in poverty-alleviation programmes
» drawing up guidelines for prevention of nutri-tional deficiencies in order to harmonize future dietary and policy recommendations designed to prevent and control noncommunicable diseases
» facilitating the drafting of national guidelines on diet and physical activity, in collaboration with national agencies
» cooperating in the development, testing and dis-semination of models for community involve-ment, including local food production, nutrition and physical activity education, and raising of consumer awareness
» promoting the inclusion of noncommunicable disease prevention and health promotion policies relating to diet and physical activity in develop-ment policies and programmes
» promoting incentive-based approaches to encour-age prevention and control of chronic diseases.
59. International standards. Public health efforts may be strengthened by the use of international norms
and standards, particularly those drawn up by the Codex Alimentarius Commission.* Areas for fur-ther development could include: labelling to allow consumers to be better informed about the benefits and content of foods; measures to minimize the impact of marketing on unhealthy dietary patterns; fuller information about healthy consumption pat-terns, including steps to increase the consumption of fruit and vegetables; and production and process-ing standards regarding the nutritional quality and safety of products. Involvement of governments and nongovernmental organizations as provided for in the Codex should be encouraged.
Civil society and nongovernmental organizations
60. Civil society and nongovernmental organizations have an important role to play in influencing individual behaviour and the organizations and institutions that are involved in healthy diet and physical activity. They can help to ensure that con-sumers ask governments to provide support for healthy lifestyles, and the food industry to provide healthy products. Nongovernmental organizations can support the strategy effectively if they collabo-rate with national and international partners. Civil society and nongovernmental organizations can particularly:» lead grass-roots mobilization and advocate that
healthy diets and physical activity should be placed on the public agenda
» support the wide dissemination of information on prevention of noncommunicable diseases through balanced, healthy diets and physical activity
» form networks and action groups to promote the availability of healthy foods and possibilities for physical activity, and advocate and support health-promoting programmes and health educa-tion campaigns
» organize campaigns and events that will stimulate action
» emphasize the role of governments in promoting public health, healthy diets and physical activity; monitor progress in achieving objectives; and monitor and work with other stakeholders such as private sector entities
» play an active role in fostering implementation of the global strategy
» contribute to putting knowledge and evidence into practice.
* See resolution WHA56.23
WHO global strategy WHO global strategy

302
Private sector
61. The private sector can be a significant player in promoting healthy diets and physical activity. The food industry, retailers, catering companies, sporting-goods manufacturers, advertising and recreation businesses, insurance and banking groups, pharmaceutical companies and the media all have important parts to play as responsible employers and as advocates for healthy lifestyles. All could become partners with governments and nongovernmental organizations in implementing measures aimed at sending positive and consistent messages to facilitate and enable integrated efforts to encourage healthy eating and physical activity. Because many companies operate globally, inter-national collaboration is crucial. Cooperative rela-tionships with industry have already led to many favourable outcomes related to diet and physical activity. Initiatives by the food industry to reduce the fat, sugar and salt content of processed foods and portion sizes, to increase introduction of inno-vative, healthy, and nutritious choices; and review of current marketing practices, could accelerate health gains worldwide. Specific recommendations to the food industry and sporting-goods manufacturers include the following:» promote healthy diets and physical activity in
accordance with national guidelines and inter-national standards and the overall aims of the global strategy
» limit the levels of saturated fats, trans-fatty acids, free sugars and salt in existing products
» continue to develop and provide affordable, healthy and nutritious choices to consumers
» consider introducing new products with better nutritional value
» provide consumers with adequate and under-standable product and nutrition information
» practise responsible marketing that supports the strategy, particularly with regard to the promo-tion and marketing of foods high in saturated fats, trans-fatty acids, free sugars, or salt, especially to children
» issue simple, clear and consistent food labels and evidence-based health claims that will help consumers to make informed and healthy choices with respect to the nutritional value of foods
» provide information on food composition to national authorities
» assist in developing and implementing physical activity programmes.
62. Workplaces are important settings for health pro-
motion and disease prevention. People need to be given the opportunity to make healthy choices in the workplace in order to reduce their exposure to risk. Further, the cost to employers of morbidity attributed to noncommunicable diseases is increas-ing rapidly. Workplaces should make possible healthy food choices and support and encourage physical activity.
Follow-up and future developments
63. WHO will report on progress made in imple-menting the global strategy and in implement-ing national strategies, including the following aspects:» patterns and trends of dietary habits and physical
activity and related risk factors for major non-communicable diseases
» evaluation of the effectiveness of policies and programmes to improve diet and increase physi-cal activity
» constraints or barriers encountered in implemen-tation of the strategy and the measures taken to overcome them
» legislative, executive, administrative, financial or other measures taken within the context of this strategy.
64. WHO will work at global and regional levels to set up a monitoring system and to design indicators for dietary habits and patterns of physical activity.
Conclusions
65. Actions, based on the best available scientific evi-dence and the cultural context, need to be designed, implemented and monitored with WHO’s support and leadership. Nonetheless, a truly multisectoral approach that mobilizes the combined energy, resources and expertise of all global stakeholders is essential for sustained progress.
66. Changes in patterns of diet and physical activity will be gradual, and national strategies will need a clear plan for long-term and sustained disease-preventive measures. However, changes in risk factors and in incidence of noncommunicable diseases can occur quite quickly when effective interventions are made. National plans should therefore also have achiev-able short-term and intermediate goals.
67. The implementation of this strategy by all those involved will contribute to major and sustained improvements in people’s health.
WHO global strategy
Food and Nutrition Bulletin, vol. 25, no. 3 © 2004, The United Nations University. 303
In response to Piwoz et al. “Promotion and advocacy for improved complementary feeding: Can we apply the lessons learned from breastfeeding?”
To the Editor:
Piwoz and colleagues [1] describe the lessons learned from breastfeeding promotion in relation to the need for improvement in complementary infant-feeding practices worldwide. They note that a major obstacle is the complexity of complementary feeding; not only are the messages regarding optimal complementary feeding difficult to articulate, but measurement of these feeding behaviors is also problematic.
The authors point out that indicators of breast-feeding developed by the World Health Organiza-tion (WHO) [2] have served to focus attention on optimal breastfeeding for both education and assess-ment purposes. They then describe several aspects of complementary feeding (dietary diversity, diet quality, and feeding frequency) that should be included in any comprehensive set of infant-feeding indicators.
We propose that the data which are now routinely collected for computation of breastfeeding indicators could also be used to obtain basic indicators of com-plementary feeding. Although they are no substitute for indicators that capture the complexity of comple-mentary feeding, these indicators are readily avail-able and simple to understand. As we have previously demonstrated for the 1989 Demographic and Health Survey (DHS) in Bolivia [3], current-status data on infant feeding can be presented in a grid that catego-rizes infants by age group and type of feeding, based on the same classifications and definitions as for the breastfeeding indicators. Infants’ ages (in months) are grouped as follows: <4, 4–5, 6–9, 10–11, 12–15, 16–19, and 20–23. Infant-feeding categories are breastmilk only, breastmilk plus nonmilk solids (no milk or
solids), breastmilk plus other milk (no solids), breast-milk plus solids, and no breastmilk.
From this distribution of the entire spectrum of infant feeding, the types of foods being given to infants who are not being fed according to the recom-mendations become readily apparent. For example, among infants less than 4 months of age in the Boliv-ian DHS analysis [3], 57.6% were breastfeeding only (the “exclusive breastfeeding rate”), and 14.8% were receiving breastmilk plus nonmilk solids, without any other milks or solids (the “predominant breastfeeding rate”); the remainder were receiving breastmilk plus other milk, without solids (17.6%); breastmilk plus solids (2.5%); or no breastmilk (7.5%). The message for a mother who is not exclusively breastfeeding, as recommended, would be very different depending on which of the other four categories her infant fell into.
This array of infant-feeding categories by age presents a snapshot of infant-feeding patterns, provid-ing very basic indicators of both complementary feed-ing and breastfeeding. It is not necessary to wait until more detailed indicators of complementary feeding are developed and data for these additional indicators can be collected. The simple descriptive data are available now. They should be used to inform health-care work-ers and policy makers throughout the world about the particular challenges of appropriate complementary infant feeding in their populations.
Margaret F. McCannMaternal and Child Epidemiology
Chapel Hill, NC, USAE-mail: [email protected]
Deborah E. BenderDepartment of Health Policy and Administration
School of Public HealthUniversity of North Carolina
Chapel Hill, NC, USA
Letter to the Editor

304 305
To the Editor:
McCann and Bender draw attention to the wealth of data that are collected and can be analyzed to provide information on complementary feeding practices. The authors provide concrete examples of indicators that can be calculated to distinguish feeding patterns in children 6 months of age and older, and hence to better understand the program actions needed to address problems. Demographic and health surveys in particular are an important source of data that have potential for further analysis. We point to work by Ruel and Arimond [1], who used demographic and health survey (DHS) data to propose new indicators for com-plementary feeding and to create a composite index of infant and child-feeding practices [2].
The availability of a small set of universal indica-tors to assess breastfeeding practices has contributed greatly to advancing programs to improve breastfeed-ing practices, in particular exclusive breastfeeding. The challenge now is to identify and agree on key indicators for complementary feeding. This will help not only in program assessment, monitoring, and evaluation, but also to facilitate global reporting and international comparisons. Because complementary feeding involves multiple caregiving practices that must be carried out carefully in order to ensure adequate nutrition for the young child, it is of particular importance to identify valid and reliable measures to assess the quality of complementary feeding.
At present, timely complementary feeding is the only indicator that is widely and consistently assessed and reported globally. As a composite measure of continued breastfeeding and complementary feeding in children 6 to 9 months of age, the indicator provides limited information on the quality of feeding practices, and hence provides only limited program guidance. To address this gap, WHO, in collaboration with the International Food Policy Research Institute (IFPRI) and other partners, has initiated a process to identify a small number of universal indicators for assessing complementary feeding, as well as supplementary indicators to guide programs. In the first phase, we are
analyzing existing data sets from various sites and geo-graphic areas to identify proxy indicators for assessing the adequacy of children’s diets to meet their energy and nutrient needs. Work has also been initiated with UNICEF to develop indicators for assessing responsive feeding. In the second phase, promising indicators will be validated in the field. It is hoped that in the course of 2005, sufficient new information will be available to allow for consensus building on a small set of universal indicators for assessing complementary feeding within the international public health community.
In the meantime, it will be important to gather and report data of the kind that Bender and McCann are referring to. Based on an extensive review and con-sultation process, Ruel and Arimond developed a set of simple indicators and a standard methodology to gather, analyze, and report data on breastfeeding and complementary feeding practices. These recommenda-tions have been accepted by the consortium of USAID-supported private voluntary organizations (PVOs) engaged in child survival and health interventions, and will be used in baseline and final project surveys [3]. While the analytical work is ongoing to identify the indicators that perform best as proxy measures of the quality of complementary feeding, it is hoped that this will already facilitate collection of consistent, compa-rable, and quality data. These and other initiatives are also very useful to provide the evidence for increased investment in infant and young child feeding, as a criti-cal area in public health toward achieving improved child-health outcomes.
For more information, consult the following web-sites: http://www.who.int/child-adolescent-health/NUTRITION/complementary.htm and http://www.ifpri.org/divs/fcnd/dp.htm
Bernadette DaelmansDepartment of Child and Adolescent Health and
DevelopmentWorld Health Organization
Geneva, SwitzerlandE-mail: [email protected]
References
1. Piwoz EG, Huffman SL, Quinn VJ. Promotion and advocacy for improved complementary feeding: Can we apply the lessons learned from breastfeeding? Food Nutr Bull 2003;24:29–44.
2. WHO. Indicators for assessing breastfeeding prac-tices. WHO/CDD/SER/91.14. Geneva: World Health
Organization, 1991. 3. McCann MF, Bender DE, Rangel-Sharpless MC. Infant
feeding in Bolivia: a critique of the World Health Organization indicators applied to demographic and health survey data. Int J Epidemiol 1994;23:129–37.
Authors’ response
Letter to the editor Letter to the editor

304 305
Ellen PiwozCentre for Nutrition, Academy for Education and
DevelopmentWashington DC, USA
E-mail: [email protected]
Marie RuelFood Consumption and Nutrition Division
International Food Policy Research Institute (IFPRI)Washington, DC, USA
E-mail: [email protected]
References
1. Ruel MT, Arimond M. Measuring childcare practices: approaches, indicators and implications for programs. Food Policy Review No. 6. Washington, DC: Interna-tional Food Policy Research Institute, 2003.
2. Arimond M, Ruel MT. Progress in developing an infant and child feeding index: an example using the Ethiopia Demographic and Health Survey 2000. Food Consump-tion and Nutrition Division Discussion Paper No. 143.
Washington, DC: International Food Policy Research Institute, 2002.
3. Arimond M, Ruel MT. Generating indicators of appro-priate feeding of children 6 to 23 months from the KPC 2000+. Washington, DC: Food and Nutrition Technical Assistance (FANTA) Project, Academy for Educational Development, 2003.
Letter to the editor Letter to the editor

306 Food and Nutrition Bulletin, vol. 25, no. 3 © 2004, The United Nations University.
307
Caring for severely malnourished children. Ann Ashworth and Ann Burgess. Macmillan Education, Oxford, UK, 2003. (ISBN 0-333-95945-0) 88 pages, paperback. US$5.50.
Many severely malnourished children still die unneces-sarily due to inadequate inpatient care. The Food and Nutrition Bulletin previously reviewed a WHO publi-cation for physicians, Management of the Child with a Serious Infection or Severe Malnutrition: Guidelines for Care at the First-Referral Level in Developing Countries (Food Nutr Bull 2001;22(3):344). This small paperback is intended for nurses and other health workers who care for severely malnourished children in developing countries. It describes in simple and clear terms the 10 treatment steps needed to manage these children successfully. It is based on the WHO/IDECG (Interna-tional Dietary Energy Consultancy Group) Manual and on training modules prepared for the trainers of nurses in Africa. It takes into account the limited resources in many hospitals and health centers, and the fact that many malnourished children are also HIV-positive. It will be useful not only for nurses but also for their trainers and supervisors in developing countries.
Diet, nutrition and the prevention of chronic dis-eases. Report of a joint WHO/FAO Expert Consulta-tion. WHO Technical Report Series 916. World Health Organization, Geneva, 2003. (ISBN 92-4-120916-X) 149 pages, paperback. US$20.70. Annual subscrip-tion, Technical Report Series, US$106.00 (ISSN 0512-3054).
This is the long-awaited publication of the report of an important Joint FAO/WHO Expert Consultation on Diet, Nutrition and Prevention of Chronic Diseases, convened in January 2002. Because of the report’s implications for the food industry and agriculture, as well as the health importance of the conclusions of the Consultation, the review process was lengthy. In view of the spread of an obesity epidemic from industrial-
ized countries to the more affluent population groups in developing countries, all countries and sectors have a stake in this report.
During the past two decades, there has been a rapid increase in population-based epidemiological evidence that has helped to clarify the role of diet in preventing and controlling morbidity and premature mortal-ity from noncommunicable diseases (NCDs). Rapid changes in diet and lifestyle have been occurring as the result of urbanization, globalization, economic and industrial development, and changes in the pro-duction and marketing of food and food products. Many of these changes have had an adverse impact on the nutritional appropriateness of diets. This has been compounded by undesirable lifestyle changes. Decreasing physical activity is already a global health hazard, and tobacco use is a major health problem in most countries.
For these reasons, chronic NCDs—including obes-ity, diabetes, cardiovascular disease, hypertension, stroke, and many types of cancer—are emerging as increasingly significant health burdens and straining the already inadequate health budgets of both indus-trialized and developing countries. For many of the latter, malnutrition and undernutrition also persist. While policy makers are becoming increasingly aware of these unfavorable developments, there is an urgent need to draw on the latest scientific evidence in order to update recommendations for action to governments, international agencies, and concerned public and pri-vate organizations working at the national level.
The discussions at the Consultation went beyond the dietary factors of causation to include the ecological, sociological, and behavioral aspects of the problem. The main book sections include diet, nutrition and chronic diseases in context, population nutrient intake goals for preventing diet-related chronic disease, and strategic directions and recommendations for policy and research. The distinguished participants in the Consultation and the sponsoring agencies are to be congratulated on the success of this difficult task. Each section is well referenced.
Book reviews Book reviews

306 Food and Nutrition Bulletin, vol. 25, no. 3 © 2004, The United Nations University.
307
The commercial and regulatory implications of the Consultation’s findings caused controversy and delays in finalizing the report, but the final conclusions and recommendations deserve to be generally accepted and incorporated into policy and implementation. This compact and inexpensive paperback should be available to, and consulted by, all nutrition and health workers.
Food composition data: Production, management and use. 2nd ed. Edited by H. Greenfield and D. A. T. Southgate. Food and Agriculture Organization, Rome, 2003. (ISBN 92-5-104949-1) 288 pages, paperback. US$32.
A knowledge of the chemical composition of foods is the first essential to understanding the nutritional value of human diets, determining nutrient require-ments, identifying relationships between diet and disease, nutritional labeling of foods, and consumer education. A conference in Bellagio, Italy, in 1983 recognized this and emphasized the lack of reliable current information on the composition of foods. The outcome of this conference was the establishment of International Food Data System (INFOODS), and one of its first tasks was to develop updated guidelines for the production, management, and use of food-com-position data. The response by two world authorities was the first edition of Food Composition Data, which has been widely praised and used in a series of United Nations University/INFOODS training courses for food-composition analysts and compilers.
Experience with use of that book in those courses has led to a second edition that updates the text and figures and makes the book more user-friendly for an international readership. In addition, in part due to the stimulus of INFOODS, there has been an explosion in analytical procedures that needed to be included. This new edition discusses the vast amount of food-composition data available electronically through the INFOODS global network and other sources, and how to evaluate and select data appropriate for a given pur-pose. Sections of the guidelines deal with the analysis of foods and the compilation, use, and dissemination of data. Overall, the text of these guidelines follows the stages in an idealized program for creating a compre-hensive food-composition database: selecting food and food components for analysis, sampling foods, analyti-cal methods, data compilation and documentation, data use, and maintenance of every aspect of quality.
FAO is printing this second edition as a paperback at a much more affordable price than the commercial first edition and is overseeing its translation into the
main languages of the United Nations. It is also being placed on the FAO website for worldwide access. This book is an essential reference for professionals in health and agriculture research, policy, and program imple-mentation in which knowledge of the nutritional value of foods is required.
Fundamental food microbiology. 3rd ed. Bibek Ray. CRC Press, Boca Raton Fla., USA, 2004. (ISBN 0-8493-1610-3) 624 pages, hardcover. US$89.95.
This is the third edition of a standard food microbiol-ogy text. Now retired from the University of Wyoming, the author has an impressive academic, research, and teaching record and has produced a very comprehen-sive and well-integrated treatise on the subject. It is rec-ommended not only for courses in food microbiology but as a reference for food scientists and technologists as well as nutritionists and regulators.
Household decisions, gender, and development: A synthesis of recent research. Edited by Agnes R. Quisumbing. International Food Policy Research Institute (IFPRI) and Johns Hopkins University Press, Washington, DC, 2003. (ISBN 0-89629-717-9) 274 pages, paperback. US$17.95.
This book arose from studies in the 1980s and early 1990s organized by the International Food Policy Research Institute (IFPRI) of how the commercializa-tion of agriculture has affected the nutritional status of individuals within households. This initiative was one of the first to quantify the effects of women in control of income on household food security and nutrition. This was followed in the 1990s by a more extensive program of research on gender and household decision-making affecting family food use. In its final phase, this research tested household models over a range of conditions and cultures. It offers an up-to-date and timely description of how household decision-making affects the welfare of individuals within the household. The book contains 33 chapters by various authors. The first six chapters deal with power and resources within the household; nine chapters with agriculture and natural resources; four with health and nutrition; five with social, capital, legal institutions, and property rights; and the last nine with policies and interventions. Ten of the chapters are written or cowritten by the editor, Agnes Quisumbing. The main use of the book will be as a reference text for undergraduate and graduate courses and for seminars that focus on the role of gender in national develop-ment, food supply, and family food security.
Book reviews

308
Nutrition and heart disease: Causation and preven-tion. Edited by Ronald R. Watson and Victor R. Preedy. CRC Press, Boca Raton, Fla., USA, 2004. (ISBN 0-8493-1674-X) 360 pages, hardcover. US$139.95.
Most of the 18 chapters in this book are directly con-cerned with various aspects of nutrition as a means of preventing heart disease or as factors in its causation. The book is “intended as a desk reference for physicians and dietitians.” Of the 35 authors, 10 are physicians. The first chapter, “The role of the dietitian in reducing cardiovascular risk,” is unusually well referenced, as are all other chapters. Although the content of this book varies in depth, it is appropriate to its purpose. This book can be useful as a reference for hospital dietitians and other health workers.
The trans fats dilemma and natural palm oil. Gene A. Spiller. Pascoe Publishing, Rocklin, Calif., USA, 2004. (ISBN 1-929862-40-7)143 pages, paperback. US$15.95.
It has only recently been acknowledged that trans-fatty acids, generated when cooking oils are hydrogenated to harden them for use in margarines and shortenings, can have adverse health consequences. For most of the past century, the use of trans-fatty acids steadily increased, and only of late have they been recognized to be at least as atherogenic as the saturated fats of animal origin. They are believed to have been one of the causative factors of the steady increase in the prevalence of cardiovascular diseases in the twentieth century. The US Food and Drug Administration is requiring that the trans-fatty acid content of foods be indicated on the Nutrition Facts label beginning in 2006. The food industry is gradually phasing out the hydrogenation that produces trans-fatty acids, and one of the most suitable replacements is African palm oil. This is because it has a higher melting point and does not require hydrogenation to be used in margarine. Extensive research in experimental animals, including nonhuman primates, and in clinical trials, confirms that its effect on cholesterol levels is not different from that of canola, soybean, and other unsaturated vegeta-ble oils. This story is simply and authoritatively told and has references “for the science-minded reader.” It is written for the educated lay person and for decision makers in the food industry as well as professional nutritionists and will serve this purpose admirably.
The UV advantage. Michael F. Holick and Mark Jenkins. New York: iBooks, 2003. (ISBN 0-743-48647-1) 224 pages, hardcover. US$19.95.
It has long been known that exposure to sunlight is important for the prevention of rickets in young chil-dren. In northern latitudes during the winter, where weaker sunlight and heavy clothing reduced child exposure to the ultraviolet rays of sunshine, a weekly dose of cod-liver oil was the preventative until it was replaced by concentrated drops of vitamins A and D and vitamin D-fortified complementary foods. Vitamin D-fortified dairy products and margarine have been assumed to provide sufficient vitamin D activity for older children and adults to supplement that derived from exposure to sunlight. However, quite independ-ently, a parallel movement has emerged to minimize exposure of skin to ultraviolet rays in order to reduce the risk of skin cancer. The author of this book, a leading expert in the field of vitamin D metabolism, concludes that avoidance of sunlight, the use of strong sunscreens, and other lifestyle changes are responsible for an epidemic of vitamin D deficiency in the United States and much of the Western world.
This is serious, because vitamin D is important for much more than bone development and ossification. It enhances mental health, prevents certain cancers, improves heart health, alleviates some skin disor-ders, and decreases the risk of autoimmune diseases, including diabetes and rheumatoid arthritis. This book strongly opposes frightening people out of sunlight and advocates common sense in the amount of sun expo-sure. It puts tanning and skin cancer in perspective and provides guidelines for obtaining sufficient exposure to the sun while minimizing the risks of skin cancer. Because it runs counter to powerful marketing forces for sunscreens and a strong conviction among derma-tologists that exposure to sunlight must be minimized, this book will be controversial. However, it provides a sound rationale for its recommendations. The author pleads for sensible exposure to sunlight and defines in detail what this means for persons of various skin types and occupations.
The text provides authoritative information on both vitamin D metabolism and the origins and types of skin cancer. The chapters are not specifically referenced, but there is a useful selective bibliography at the end of the book. The extensive glossary is required because the author does explain, in simple terms, the technical background for his conclusions and recommendations. This small and very readable book is written for the layperson and is deceptively easy to read. However, it is of equal interest and importance for health profes-sionals in all fields.
—Nevin S. Scrimshaw
Book reviews

Food and Nutrition Bulletin, vol. 25, no. 3 © 2004, The United Nations University. 309
From WHO: New HIV and infant-feeding tools
Breastfeeding is normally the best way to feed an infant. A woman infected with HIV, however, can transmit the virus to her child during pregnancy, labor, or deliv-ery, or through breastfeeding. It is a public health responsibility to prevent HIV infection in infants and young children—especially in countries with high rates of HIV infection among pregnant women. It is also a public health responsibility to support optimal breastfeeding to prevent mortality and illness due to diarrhea and respiratory infections. Given the need to reduce the risk of HIV transmission to infants while minimizing the risk of other causes of morbidity and mortality, United Nations guidance states that “when replacement feeding is acceptable, feasible, affordable, sustainable and safe, avoidance of all breastfeeding by HIV-infected mothers is recommended. Otherwise, exclusive breastfeeding is recommended during the first months of life.”
This guidance was issued at a technical consultation on new data on the prevention of MTCT (mother-to-child transmission) and their policy implications that was convened in October 2000. In order to put this guidance into practice in countries, WHO and UN partners have recently developed or revised the fol-lowing documents.
The HIV and infant-feeding framework for priority action. This document was developed within the context of the Global Strategy for Infant and Young Child Feeding and endorsed by nine UN agencies. The purpose is to recommend to governments key prior-ity actions related to infant and young child feeding that cover the special circumstances associated with HIV/AIDS. The aim should be to create and sustain an environment that encourages appropriate feeding practices for all infants, while scaling-up interventions to reduce HIV transmission. (This document is also available in French.)
HIV transmission through breastfeeding: Review of
available evidence presents a summary of the available scientific evidence on the transmission of HIV infection through breastfeeding. It briefly describes the benefits of breastfeeding for both mothers and infants; and sum-marizes evidence on the relative risk of mother-to-child transmission of HIV-1 infection during pregnancy, delivery, and breastfeeding. The review then focuses on HIV transmission through breastfeeding: rates, mechanisms, timing, risk factors, and approaches for its prevention. The publication provides the evidence base and rationale for other documents in the revised HIV and infant feeding series.
HIV and infant feeding: Guidelines for decision-makers. In order to assist in putting general guidance on HIV and infant feeding into practice in countries, in 2003 WHO and UN partners (with valuable inputs from nongovernmental organizations, researchers, and government officials) revised HIV and infant feeding: Guidelines for decision-makers. The purpose of this publication is to provide information on issues that need to be considered in relation to infant and young child feeding in the context of HIV, and to highlight areas of special concern on which policy decisions need to be made. The guidelines contain an overview of international policy, goals, and guidelines; background on HIV and infant feeding; current recommendations for HIV-positive women and considerations relating to different feeding options; an overview of the process of developing or revising a national policy on infant and young child feeding, incorporating HIV concerns; considerations for countries considering the provision of free or low-cost infant formula; suggestions for protecting, promoting, and supporting appropriate infant feeding in the general population; key issues in supporting HIV-positive women in their infant-feed-ing decisions; and considerations on monitoring and evaluation.
HIV and infant feeding: A guide for health-care managers and supervisors. This publication is aimed at helping mid-level managers understand issues and organize services to support all women, and especially HIV-
News and notes

310 311
infected women, in infant feeding. The document contains a list of key steps, background information, key resources and references, and extensive annexes.
What are the options? Using formative research to adapt global recommendations on HIV and infant feeding to the local context. The purpose of this manual is to provide program managers, researchers, and policy makers with basic guidance on how to conduct local assessments to establish the range of replacement feeding options and breast-milk feeding options that may be acceptable, feasible, affordable, sustainable, and safe (AFASS) in different contexts. Findings from local assessments may also be used to develop national policies, guidelines for health workers, materials for training of counselors, and behavior-change communications strategies to support safe infant feeding in programs to prevent HIV infection in infants and young children.
Another document will soon be released: HIV and infant-feeding counselling tools.
For further details, consult the WHO Child and Adolescent Health and Development Department website: http://www.who.int/child-adolescent-health/NUTRITION/infant.htm; write to the Department of Child and Adolescent Health and Development, 20 Avenue Appia, 1211 Geneva 27, Switzerland; or send e-mail inquiries to [email protected].
Standing Committee on Nutrition (SCN): The Ninth Dr. Abraham Horwitz Lecture
Announcement and call for proposals
The SCN Secretariat announces the Ninth Dr. Abraham Horwitz Lecture, scheduled to take place in Brasilia, Brazil, on Monday, March 14, 2005. Proposals are invited from young professionals studying or working in the field of international nutrition.
Dr. Abraham Horwitz served as the Chair of the SCN between 1986 and 1995. He died on July 10, 2000, at the age of 89. In an interview published in SCN News in late 1995, just after his retirement, Dr. Horwitz sent a message to those working in nutrition:
Keep the faith that you are committed to a most noble cause, the well-being of people whom you do not know but whose needs you feel intensely. Redouble your efforts in whatever you do in nutri-tion while being bold and imaginative.
The aim of the Horwitz Lecture Series, established by Sir Richard Jolly in 1996, is to continue Dr. Horwitz’s heartfelt, highly valued, and extremely generous tradi-tion of mentoring young people working in nutrition and nurturing their ideas for nutrition programs. Each year a young guest lecturer who possesses the knowl-edge and commitment to prepare an exceptional paper
is invited to make a presentation at the SCN Annual Session.
The Ninth Lecture will take place in the context of a one-day symposium with the theme of resolving hunger and malnutrition through national and regionally driven strategies, policies, and programs. A suggested lecture title is “National Anti-Hunger Strategies: What can we learn from country ownership of the fight against hunger and malnutrition?” The symposium will be opened by a high-level official of the Brazilian Gov-ernment, and will include a keynote address and other focused presentations.
The lecture is not meant to be merely a theoretical discussion, but should build on practical evaluation experience to the extent that it exists. It should con-sider the knowledge and information needs to meet this challenge; the human, institutional, and organizational requirements for its realization; and the political obli-gations and commitments necessary to enable effec-tive programs and political and policy-level agendas. It should reflect an analytical evaluation of options and experience, and avoid conclusions based on anecdotal experiences other than to illustrate specific challenges. The lecture will be published as part of the symposium proceedings in one of the SCN’s publications.
Young nutrition professionals are invited to submit a three-page (double-spaced) concept paper to the SCN Secretariat in Geneva by Friday, December 10, 2004. All proposals should relate directly to the symposium’s theme. Proposals will be evaluated against three crite-ria: clarity, innovation, and demonstrated knowledge of the field. All proposals meeting these criteria will be considered; however, preference will be given to those describing newer strategic, program, or policy approaches.
Proposals will be accepted by e-mail, regular mail, or fax. The proposal should contain the following:» A cover letter with the applicant’s full name and
contact details.» A one-page personal résumé. » A three-page concept paper (double-spaced) explain-
ing the scope of the proposed lecture and clearly detailing the key issues proposed for presentation.
» Two supporting letters from professionals from two of the three SCN member groups, i.e., UN agencies, bilateral partners, and civil society. The two support-ing letters must address the writer’s willingness and commitment to provide the applicant with guidance in preparing the proposed lecture and paper.The SCN Secretariat will select the best proposal. The
successful candidate will be notified by December 20, 2004. Travel to and from Brazil and hotel and living expenses while attending the meeting will be covered by the SCN. The lecturer will also receive an honorarium of $500.
Further information is available from the SCN Secretariat in Geneva: Phone: +41-22-791 04 56, fax:
News and notes News and notes

310 311
+41-22-798 88 91; e-mail: [email protected]; website : www.unsystem.org/scn.
Our mailing address is SCN Secretariat, c/o World Health Organization, 20 Avenue Appia, CH-1211 Geneva 27, Switzerland.
Standing Committee on Nutrition (SCN): Integrating nutrition in development strategies
The 32nd United Nations System Standing Committee on Nutrition (SCN) Session will be held in Brasilia, Brazil, March 14–18, 2005. The 32nd Session will focus on the advantages and challenges of integrating nutri-tion in development strategies, in the context of achiev-ing the millennium development goals and the right to food and nutrition. Registration details will be available on the SCN website (http://www.unsystem.org/scn/) beginning in December 2004. For more information, please send e-mail to the SCN Secretariat in Geneva at [email protected].
New SCN Secretary
Dr. Roger Shrimpton assumed the role of SCN Secre-tary in Geneva on July 1, 2004. Dr. Shrimpton brings to the SCN vast experience in international nutrition and development, with considerable time working in Brazil and Indonesia. He was most recently an independent consultant in nutrition and development. Prior to this he was Chief of the Nutrition Section at UNICEF Headquarters in New York. Dr. Shrimpton can be con-tacted at [email protected].
Call for information from former UNU Fellows
The United Nations University (UNU) is updating its information on former UNU fellows. If you are a
former UNU fellow, we urgently request you to forward your current postal and e-mail addresses, a descrip-tion of your current responsibilities, and any other relevant information, including publications, honors, and awards, to [email protected]. Also indicate whether you are currently receiving the Food and Nutrition Bulletin. The resulting database will serve as a resource for fellows to reestablish contact with former colleagues, for the UNU and training institu-tions to compile information on the long-term out-comes of their training efforts, and for both the UNU and the International Nutrition Foundation (INF) to obtain additional support for fellowships. Please also ask any other UNU fellows whom you know to send their information to the above address. This informa-tion will be placed on the INF website as it becomes available, and the Bulletin will publish periodic reports based on it. A similar INF database and website will be maintained for holders of the current Ellison Medical Foundation–International Nutrition Foundation Fel-lowships in Nutrition and Infection.
Former UNU Fellows and Trained Leaders from Latin American countries are invited to visit http://latinut.net for professional information and to facilitate regional contact. This website is in Spanish and offers professional profiles and e-mail addresses of former Latin American fellows. The website is still a work in progress, so if you are a former UNU Fellow and have not yet been contacted, or if you have any questions, please send e-mail to: [email protected].
Symposium for Vernon R. Young
A memorial symposium in honor of the late Dr. Vernon R. Young will be held at the Massachusetts Institute of Technology (MIT), in Cambridge, Mass., USA, on November 12, 2004. For details, send e-mail to [email protected].
Please see page 312 this issue for Dr. Young’s obit-uary.
News and notes News and notes
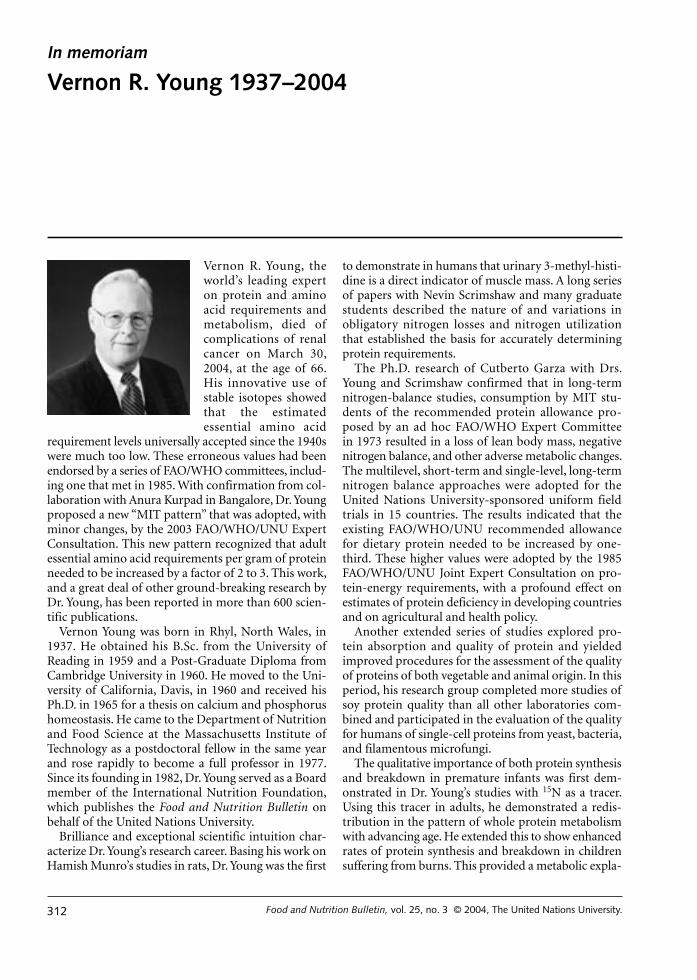
312 Food and Nutrition Bulletin, vol. 25, no. 3 © 2004, The United Nations University.
313
Vernon R. Young, the world’s leading expert on protein and amino acid requirements and metabolism, died of complications of renal cancer on March 30, 2004, at the age of 66. His innovative use of stable isotopes showed that the estimated essential amino acid
requirement levels universally accepted since the 1940s were much too low. These erroneous values had been endorsed by a series of FAO/WHO committees, includ-ing one that met in 1985. With confirmation from col-laboration with Anura Kurpad in Bangalore, Dr. Young proposed a new “MIT pattern” that was adopted, with minor changes, by the 2003 FAO/WHO/UNU Expert Consultation. This new pattern recognized that adult essential amino acid requirements per gram of protein needed to be increased by a factor of 2 to 3. This work, and a great deal of other ground-breaking research by Dr. Young, has been reported in more than 600 scien-tific publications.
Vernon Young was born in Rhyl, North Wales, in 1937. He obtained his B.Sc. from the University of Reading in 1959 and a Post-Graduate Diploma from Cambridge University in 1960. He moved to the Uni-versity of California, Davis, in 1960 and received his Ph.D. in 1965 for a thesis on calcium and phosphorus homeostasis. He came to the Department of Nutrition and Food Science at the Massachusetts Institute of Technology as a postdoctoral fellow in the same year and rose rapidly to become a full professor in 1977. Since its founding in 1982, Dr. Young served as a Board member of the International Nutrition Foundation, which publishes the Food and Nutrition Bulletin on behalf of the United Nations University.
Brilliance and exceptional scientific intuition char-acterize Dr. Young’s research career. Basing his work on Hamish Munro’s studies in rats, Dr. Young was the first
to demonstrate in humans that urinary 3-methyl-histi-dine is a direct indicator of muscle mass. A long series of papers with Nevin Scrimshaw and many graduate students described the nature of and variations in obligatory nitrogen losses and nitrogen utilization that established the basis for accurately determining protein requirements.
The Ph.D. research of Cutberto Garza with Drs. Young and Scrimshaw confirmed that in long-term nitrogen-balance studies, consumption by MIT stu-dents of the recommended protein allowance pro-posed by an ad hoc FAO/WHO Expert Committee in 1973 resulted in a loss of lean body mass, negative nitrogen balance, and other adverse metabolic changes. The multilevel, short-term and single-level, long-term nitrogen balance approaches were adopted for the United Nations University-sponsored uniform field trials in 15 countries. The results indicated that the existing FAO/WHO/UNU recommended allowance for dietary protein needed to be increased by one-third. These higher values were adopted by the 1985 FAO/WHO/UNU Joint Expert Consultation on pro-tein-energy requirements, with a profound effect on estimates of protein deficiency in developing countries and on agricultural and health policy.
Another extended series of studies explored pro-tein absorption and quality of protein and yielded improved procedures for the assessment of the quality of proteins of both vegetable and animal origin. In this period, his research group completed more studies of soy protein quality than all other laboratories com-bined and participated in the evaluation of the quality for humans of single-cell proteins from yeast, bacteria, and filamentous microfungi.
The qualitative importance of both protein synthesis and breakdown in premature infants was first dem-onstrated in Dr. Young’s studies with 15N as a tracer. Using this tracer in adults, he demonstrated a redis-tribution in the pattern of whole protein metabolism with advancing age. He extended this to show enhanced rates of protein synthesis and breakdown in children suffering from burns. This provided a metabolic expla-
In memoriam
Vernon R. Young 1937–2004
PHOTO TO COME
In memoriam

312 Food and Nutrition Bulletin, vol. 25, no. 3 © 2004, The United Nations University.
313
nation for the greatly increased protein requirement of a burn patient.
In a very productive collaboration with Denis Bier, Dr. Young showed that whole-body amino acid flux, protein synthesis, breakdown, and amino acid oxida-tion in humans respond to the content of meals and that these responses are modulated by the protein, amino acid, and energy component of the diet. These studies led to new approaches, based on amino acid kinetics using stable isotope probes for determining the quantitative need for the specific indispensable amino acids. Using stable isotopes, he also explored the metabolism of dispensable amino acids, such as glycine, and developed an approach for quantifying the whole-body synthesis rate of dispensable amino acids, particularly alanine, glycine, proline, and arginine. The novel method involved a simultaneous administration of two amino acid tracers labeled with stable isotopes, using a nutritionally indispensable amino acid. This was the first time this approach had been used, and it enabled him to demonstrate the sensitivity of whole-body alanine synthesis to changes in carbon, hydrogen, and nitrogen moieties.
More recently, in a series of elegant multitracer stud-ies with arginine, ornithine, and citrulline as probes, Dr. Young suggested that arginine homeostasis is achieved by a balance between intake and breakdown, with synthesis playing only a minor role. Using a novel approach, Dr. Young also developed a stable isotope method using 15N glycine tracers to explore changes in albumin synthesis with advancing age. His findings indicated that albumin synthesis was regulated by amino acid intake at a lower set-point in the elderly than in young adults. He also played a major role in developing and applying new stable isotope techniques for studying the metabolism of calcium and trace min-
erals, such as zinc, copper, iron, and selenium in human subjects. This involved their analyses in blood, urine, and feces during metabolic studies.
Dr. Young was elected to the National Academy of Sciences in 1990 and to the Institute of Medicine in 1993. Among the more important of his many honors are the Rank Prize in Nutrition (United Kingdom), the Bristol-Myers Squibb Award (United States), the Danone International Prize for Nutrition (France), the W.O. Atwater Award (United States), the Gopalan Gold Medal (India), the International Award for Modern Nutrition (Switzerland), and degree of Doctor of Medi-cine honoris causa from Uppsala University, Sweden. He served as president of the American Institute of Nutrition from 1991 to 1992. From 1996 to 1998 he served as the first chairman of the Food and Nutrition Board Committee responsible for the new and greatly expanded recommended dietary allowances (RDAs) and guided the group to a consensus.
Words can capture his scientific achievements and his international reputation, but not his ebullient per-sonality, humor, and unusual charisma. He would tease outrageously anyone at any level of society, and they loved it. He met his wife, Janice, at MIT soon after his arrival there. They were married in the same year and settled in Wellesley, Massachusetts. Vernon Young’s life was dedicated to his research at MIT and with many collaborators in other institutions and countries, but he was devoted to his wife, his four sons Christopher, Andrew, Richard, and Michael, and his daughter Patri-cia. A twin sister, Sylvia Young Price, lives in Council Bluffs, Iowa. There are few persons who have been so universally liked throughout the world or who have contributed as much to the science of nutrition.
—Nevin S. Scrimshaw
In memoriam

Food and Nutrition BulletinSupport for Subscriptions to Developing Countries
International agencies
The United Nations University (UNU)The International Atomic Energy Agency (IAEA)The United Nations Children’s Fund (UNICEF)
Bilateral agencies
International Life Sciences Institute (ILSI)Micronutrient Initiative (MI)
United States Agency for International Development (USAID)
Corporations
AK NobelKraft Foods
Procter & GambleRoche
Unilever Bestfoods
Useful web sites and free materials
Access to Global Online Research in Agriculture (AGORA) http://www.aginternetwork.org/en/about.phpFood and Agriculture Organization (FAO) http://www.fao.orgInternational Atomic Energy Agency (IAEA) http://www.iaea.orgInternational Life Sciences Institute (ILSI) http://www.ilsi.orgInternational Nutritional Anemia Consultative Group (INACG) http://inacg.ilsi.orgInternational Vitamin A Consultative Group (IVACG) http://ivacg.ilsi.orgInternational Union of Nutritional Sciences (IUNS) http://www.iuns.orgMicronutrient Initiative (MI) http://www.micronutrient.orgPan American Health Organization (PAHO) http://www.paho.orgSave the Children http://www.savethechildren.orgUnited Nation Children’s Fund (UNICEF) http://www.unicef.orgUnited Nations University (UNU) http://www.unu.eduUN Standing Committee on Nutrition (SCN) http://www.unsystem.org/scnWorld Bank http://www.worldbank.orgWorld Food Programme (WFP) http://www.wfp.orgWorld Health Organization (WHO) http://www.who.int/en

Note for contributors to the Food and Nutrition Bulletin
The editors of the Food and Nutrition Bulletin welcome contributions of relevance to its concerns (see the state-ment of editorial policy). Submission of an article does not guarantee publication; acceptance depends on the judgment of the editors and reviewers as to its relevance and quality. All potentially acceptable manuscripts are peer-reviewed. Contributors should examine recent issues of the Bulletin for content and style. Language. Contributions should be submitted in English. Format. Manuscripts should be prepared on a computer, double-spaced, and with ample margins. Authors are encour-aged to submit manuscripts electronically. Abstract. An abstract of not more than 250 words should be included at the beginning of the manuscript, stating the purposes of the study or investigation, basic procedures (study subjects or experimental animals and observational and analytical methods), main findings (give specific data and their statistical significance, if possible), and the principal conclusions. Emphasize new and important aspects of the study or observations. Do not include any information that is not given in the body of the article. Do not cite references or use abbreviations or acronyms in the abstract. Key words. Authors should provide a minimum of four key words for the article. Tables and figures. Tables and figures should be placed on separate pages. Tables should be typed with data clearly organized. Footnotes should be keyed to the relevant data points by letters or symbols. For mailed manuscripts, submit only original figures or glossy photographs. Labels on the figures should be typed or professionally lettered or printed, not handwritten. Please double-check your data for accuracy and consistency with the text. Photographs. Ideally, photographic materials should be submitted in the form of black and white negatives or white glossy prints. Photographs will not be returned unless specifi-cally requested. Units of measure. All measurements should be expressed in metric units. If other units are used, their metric equivalent should be indicated. Abbreviations. Please spell out all abbreviations used on the first reference. References. References should be listed at the end of the article, also double-spaced. Unpublished papers should not be listed as references, nor should papers submitted for publica-tion but not yet accepted. Please double-check that reference numbers correspond to the correct numbers in the text. Number references consecutively in the order in which they are first mentioned in the text. Identify references in the text and tables and figure legends by arabic numerals enclosed in square brackets. References cited only in tables or figure legends should be numbered in accordance with the first mention of the relevant table or figure in the text. Be sure references are complete and current. Reference citations should follow the format below.Journal reference
—standard journal article (list all authors):1. Alvarez MI, Mikasic D, Ottenberger A, Salazar ME. Carac-
teristicas de familias urbanas con lactante desnutrido: un análisis critico. Arch Latinoam Nutr 1979;29:220–30.
—corporate author:2. Committee on Enzymes of the Scandinavian Society
for Clinical Chemistry and Clinical Physiology. Rec-ommended method for the determination of gam-maglutamyltransferase in blood. Scand J Clin Lab Invest 1976;36:119–25.
Book or other monograph reference—personal author(s):3. Brozek J. Malnutrition and human behavior: experi-
mental, clinical and community studies. New York: Van Nostrand Reinhold, 1985.
—corporate author:4. American Medical Association, Department of Drugs.
AMA drug evaluations, 3rd ed. Littleton, Mass, USA: Publishing Sciences Group, 1977.
—editor, compiler, chairman as author:5. Medioni J, Boesinger E, eds. Mécanismes éthologiques
de l’évolution. Paris: Masson, 1977.—chapter in book:6. Barnett HG. Compatibility and compartmentalization
in cultural change. In: Desai AR, ed. Essays on moderni-zation of underdeveloped societies. Bombay: Thacker, 1971:20–35.
Identification. Please give the full name and highest degree of each author, the name of departments and institutions to which the work should be attributed, the name, address, fax number, and e-mail address of the author responsible for cor-respondence about the manuscript, and sources of support for the work. If the material in the article has been previously presented or is planned to be published elsewhere—in the same or modified form—a note should be included giving the details. Page charges. Most peer-reviewed and indexed journals either have page charges for the publication of articles based on sponsored research or have very high subscription costs that limit their distribution. The Food and Nutrition Bulletin places major emphasis on reaching developing countries and has been fortunate to receive support from the United Nations University (UNU) (http://www.unu.edu) for most editorial costs and the equivalent of free subscriptions to more than 800 institutions and individuals in developing countries. However, after 23 years, the UNU is decreasing its support and the Bulletin must find other funds to maintain its present policies. To continue selected free subscriptions to developing countries, we are obtaining sponsorship for blocks of subscriptions from a variety of organizations. To help meet editorial costs, the Bulletin has instituted page charges for all papers with major sponsors and the cost of publication should be incorporated into the cost of sponsoring the research project. We are therefore asking all authors to include page charges in their sponsored research project budget. One printed page in the Bulletin is equivalent to approximately 3 double-spaced manuscript pages. The Bulletin will waive these charges for authors in developing countries who do not have support that will cover page charges, but will require a formal letter requesting a waiver. Articles acknowledging major financial support, or from authors in industrialized countries, will not be eligible for waivers. This policy does not apply to solicited articles. Authors contributing to special issues and supplements, which are already sponsored, are not responsible for page charges. Manuscript copies. The contributor should keep a duplicate copy of the manuscript. Manuscripts will not be returned unless specifically requested. Proofs will be sent to the authors only in exceptional circumstances. Contributions should be addressed to: Food and Nutrition Bulletin Susan Karcz, Managing Editor 150 Harrison Ave. Boston, MA 02111 USA [email protected]

Food and Nutrition Bulletin Subscription Form
Please enter my subscription to the Food and Nutrition Bulletin, vol. 25, 2004 (four issues).
Regular rates: 1 year, US$56 2 years, US$106 3 years, US$150All rates include delivery by surface mail.
Total payment enclosed:
Individuals are requested to enclose payment with their orders. Prices are quoted subject to change without notice. Payment must be made in US dollars only. Checks should be made payable to: International Nutrition Foundation, Inc.
Send to: Subscriptions International Nutrition Foundation, Inc. 150 Harrison Ave. Boston, MA 02111 USA
Name:
Address:
Annual Subscriptions
The annual subscription cost of the Bulletin is US$56.00, which includes both the quarterly issues and supplements. To sub-scribe, write or email:
International Nutrition Foundation 150 Harrison Ave.Boston, MA, 02111, USATel: 617-636-3771Fax: 617-636-3781E-mail: [email protected]
Subsidized Subscriptions Available
The International Nutrition Foundation (INF) is raising funds to increase the subsidized distribution of the Food and Nutri-tion Bulletin to nutrition scientists and institutions in devel-oping countries. This effort has support by United Nations University (UNU) (http://www.unu.edu), the United Nations International Children’s Emergency Fund (UNICEF) (http://www.unicef.org), the International Atomic Energy Agency (IAEA) (http://www.iaea.org), the United States Agency for International Development (USAID) (http://www.usaid.gov), the Micronutrient Initiative (MI) (http://www.micronutrient.org), and the International Life Sciences Insti-tute (ILSI) (http://www.ilsi.org). Contributions have also been received by AK Nobel, Kraft Foods, Procter & Gamble, Roche, and Unilever Bestfoods.
If you (or your organization) are working in the field of nutrition, and are from a developing country, you may be eligible for a donated or subsidized subscription. The extent to which requests for free subscriptions can be met depends on available funds. The Bulletin’s goal of promoting a wide geo-graphic and institutional distribution will be taken into con-sideration. Individuals and institutions working in developing countries and countries in transition may apply biannually for a subsidized subscription. Preference for subsidized subscriptions will be given to libraries. If you are affiliated with a university in a developing country, we encourage you to make this information available to the library of your institution. Normally, individuals holding international posts working with international and bilateral agencies, international non-governmental organizations (NGOs), and private corporations are not eligible for free subscriptions. Subscription exchanges with journals of similar purposes and interests are welcome. To apply for a subsidized subscription, write or email:
Food and Nutrition Bulletin Susan Karcz, Managing Editor 150 Harrison Ave. Boston, MA, 02111, USA Tel: 617-636-3778 Fax: 617-636-3781 E-mail: [email protected]
Subscribe to the Food and Nutrition Bulletin