food & beverage / food manufacturing · food and beverage sector background information: for...
TRANSCRIPT
Canmore Business & Tourism www.canmorebusiness.com
P a g e 1 | 14
ECONOMIC SECTOR PROFILE:
FOOD & BEVERAGE /
FOOD MANUFACTURING
Prepared for the Town of Canmore
Canmore Business & Tourism www.canmorebusiness.com
P a g e 2 | 14
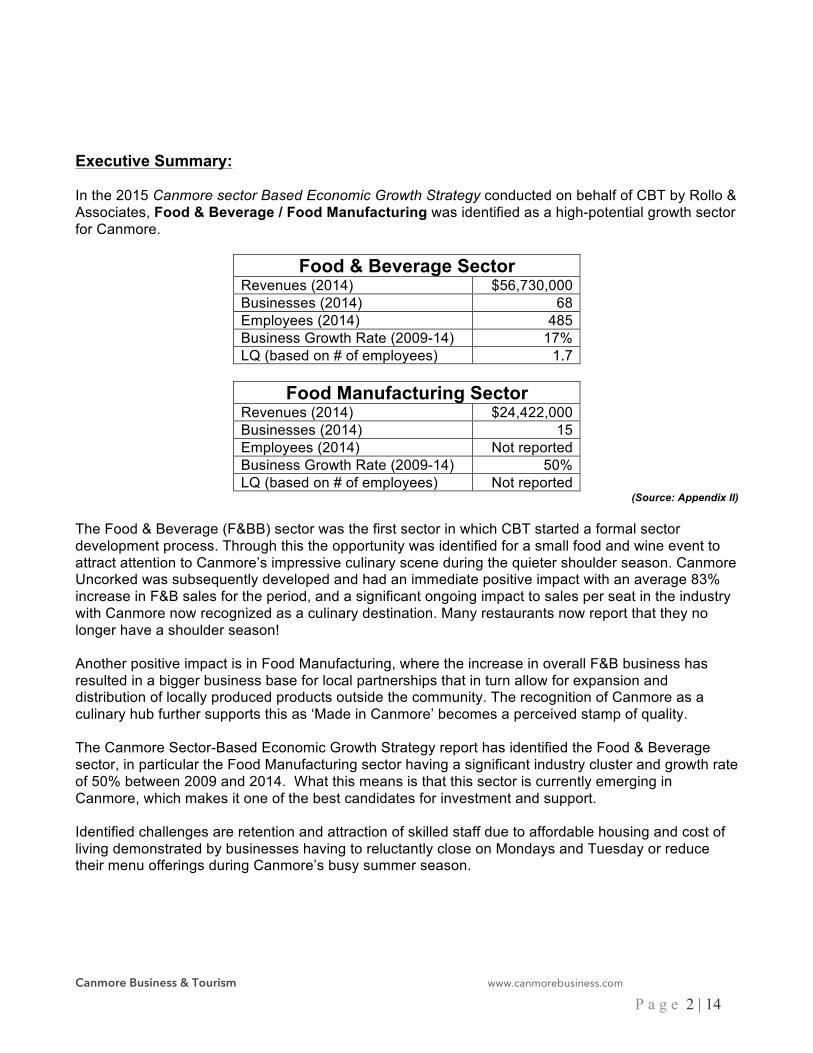
Executive Summary: In the 2015 Canmore sector Based Economic Growth Strategy conducted on behalf of CBT by Rollo & Associates, Food & Beverage / Food Manufacturing was identified as a high-potential growth sector for Canmore.
Food & Beverage Sector Revenues (2014) $56,730,000 Businesses (2014) 68 Employees (2014) 485 Business Growth Rate (2009-14) 17% LQ (based on # of employees) 1.7
Food Manufacturing Sector
Revenues (2014) $24,422,000 Businesses (2014) 15 Employees (2014) Not reported Business Growth Rate (2009-14) 50% LQ (based on # of employees) Not reported
(Source: Appendix II) The Food & Beverage (F&BB) sector was the first sector in which CBT started a formal sector development process. Through this the opportunity was identified for a small food and wine event to attract attention to Canmore’s impressive culinary scene during the quieter shoulder season. Canmore Uncorked was subsequently developed and had an immediate positive impact with an average 83% increase in F&B sales for the period, and a significant ongoing impact to sales per seat in the industry with Canmore now recognized as a culinary destination. Many restaurants now report that they no longer have a shoulder season! Another positive impact is in Food Manufacturing, where the increase in overall F&B business has resulted in a bigger business base for local partnerships that in turn allow for expansion and distribution of locally produced products outside the community. The recognition of Canmore as a culinary hub further supports this as ‘Made in Canmore’ becomes a perceived stamp of quality. The Canmore Sector-Based Economic Growth Strategy report has identified the Food & Beverage sector, in particular the Food Manufacturing sector having a significant industry cluster and growth rate of 50% between 2009 and 2014. What this means is that this sector is currently emerging in Canmore, which makes it one of the best candidates for investment and support. Identified challenges are retention and attraction of skilled staff due to affordable housing and cost of living demonstrated by businesses having to reluctantly close on Mondays and Tuesday or reduce their menu offerings during Canmore’s busy summer season.
Canmore Business & Tourism www.canmorebusiness.com
P a g e 3 | 14
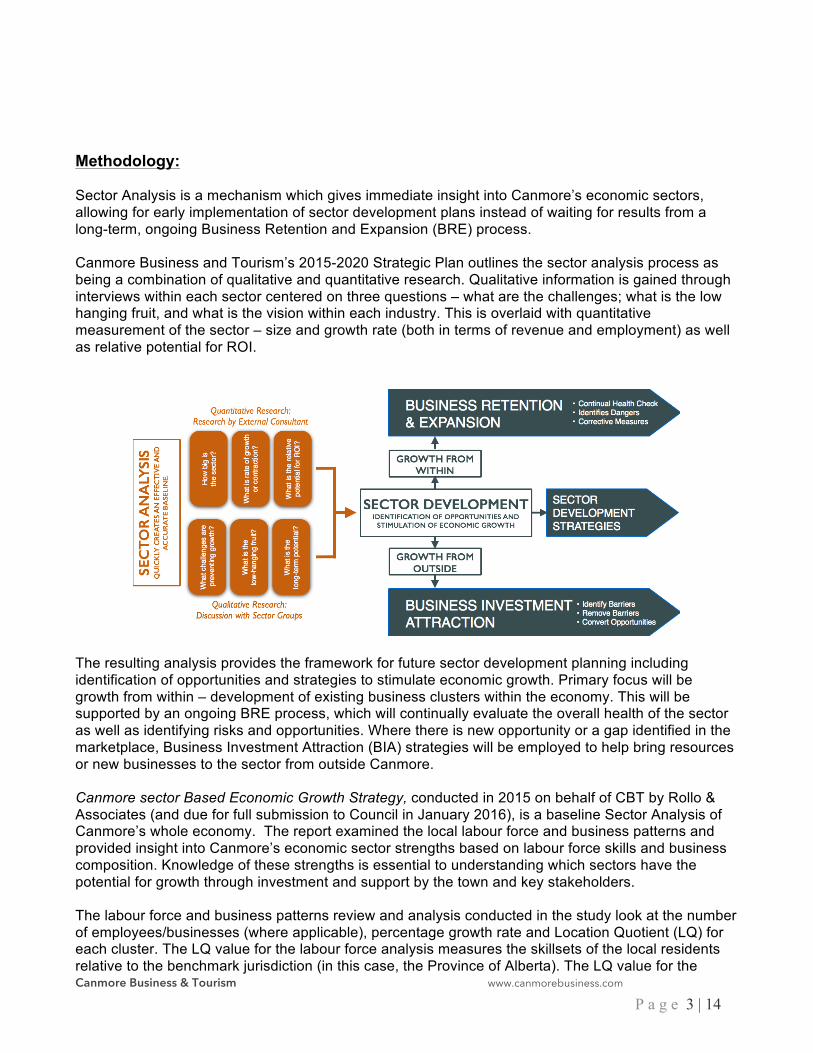
Methodology: Sector Analysis is a mechanism which gives immediate insight into Canmore’s economic sectors, allowing for early implementation of sector development plans instead of waiting for results from a long-term, ongoing Business Retention and Expansion (BRE) process. Canmore Business and Tourism’s 2015-2020 Strategic Plan outlines the sector analysis process as being a combination of qualitative and quantitative research. Qualitative information is gained through interviews within each sector centered on three questions – what are the challenges; what is the low hanging fruit, and what is the vision within each industry. This is overlaid with quantitative measurement of the sector – size and growth rate (both in terms of revenue and employment) as well as relative potential for ROI.
The resulting analysis provides the framework for future sector development planning including identification of opportunities and strategies to stimulate economic growth. Primary focus will be growth from within – development of existing business clusters within the economy. This will be supported by an ongoing BRE process, which will continually evaluate the overall health of the sector as well as identifying risks and opportunities. Where there is new opportunity or a gap identified in the marketplace, Business Investment Attraction (BIA) strategies will be employed to help bring resources or new businesses to the sector from outside Canmore. Canmore sector Based Economic Growth Strategy, conducted in 2015 on behalf of CBT by Rollo & Associates (and due for full submission to Council in January 2016), is a baseline Sector Analysis of Canmore’s whole economy. The report examined the local labour force and business patterns and provided insight into Canmore’s economic sector strengths based on labour force skills and business composition. Knowledge of these strengths is essential to understanding which sectors have the potential for growth through investment and support by the town and key stakeholders. The labour force and business patterns review and analysis conducted in the study look at the number of employees/businesses (where applicable), percentage growth rate and Location Quotient (LQ) for each cluster. The LQ value for the labour force analysis measures the skillsets of the local residents relative to the benchmark jurisdiction (in this case, the Province of Alberta). The LQ value for the
Canmore Business & Tourism www.canmorebusiness.com
P a g e 4 | 14
business patterns analysis measures the composition of businesses in Canmore, again relative to the Alberta benchmark. Clusters with high LQs are those where Canmore is deemed to have a relative advantage compared to other municipalities.
• LQ>1.25 suggests a relatively high concentration of people or businesses in Canmore compared to the province
• LQ >0.75 and 1.25 suggests a relatively average concentration • LA<0.75 suggests a relatively low concentration
While high LQs may not necessarily be a sign that a particular industry or sector is poised for future growth, (past success does not guarantee future performance), use of the LQ methodology has proven effective in many jurisdictions as part of their economic sector review in identifying sectors where a competitive advantage does exist. Targeted efforts aimed at those sectors can help to compound that advantage and achieve robust sector growth.
Food and Beverage Sector Background information: For many years Canmore has had a strong Food and Beverage (F&B) scene, with a disproportionally high number of restaurants relative to the size of the population, and an ability to attract a very high standard of talent due to Canmore’s desirability as a community. There was however a lack of effective partnership and collaboration within the industry resulting in missed opportunities. The F&B sector was the first sector in which CBT started a formal sector development process. Through this the opportunity was identified for a small food and wine event to attract attention to Canmore’s impressive culinary scene during the quieter shoulder season. Canmore Uncorked was subsequently developed and had an immediate positive impact with an average 83% increase in F&B sales for the period, and a significant ongoing impact to sales per seat in the industry with Canmore now recognized as a culinary destination.
Canmore Business & Tourism www.canmorebusiness.com
P a g e 5 | 14
ECONOMIC SECTOR ANALYSIS: FOOD & BEVERAGE /
FOOD MANUFACTURING Qualitative Research: Question 1: What challenges are preventing growth?
• Affordable housing
• Size of community o Small town that isn’t busy year round (Monday-Thursday October, November)
• Staffing o Restaurants having to close during the summer due to not having enough staff o Lack of capacity for mid-level management and management staff
• Competition – Banff will always be a threat, although Canmore is widely recognized as having
a superior F&B scene
• Not enough international cuisine
• Not enough higher end bars (wine bar, cocktail bar)
Question 2: What is the low-hanging fruit?
The 1st annual Canmore Uncorked festival was held in April 2014. The festival was successful due to the strong collaboration of the F&B, Accommodation, Retail and Transportation sectors and complete buy-in from the community. Both core experiences and signature events were developed, all tickets sold out, resulting in not just an impact on F&B sales but also an increased spend on retail and the arts at a time of year that is historically quiet. F&B sales increased 83% from the previous year. Working collaboratively with the various sectors, CBT met the event’s goals to: align Canmore’s F&B industry; improve sales in the F&B industry during the off-season; create signature events to build a platform for future F&B festivals; generate significant media exposure and awareness; and position Canmore as a year round culinary destination for regional worldwide visitors.
Canmore Business & Tourism www.canmorebusiness.com
P a g e 6 | 14
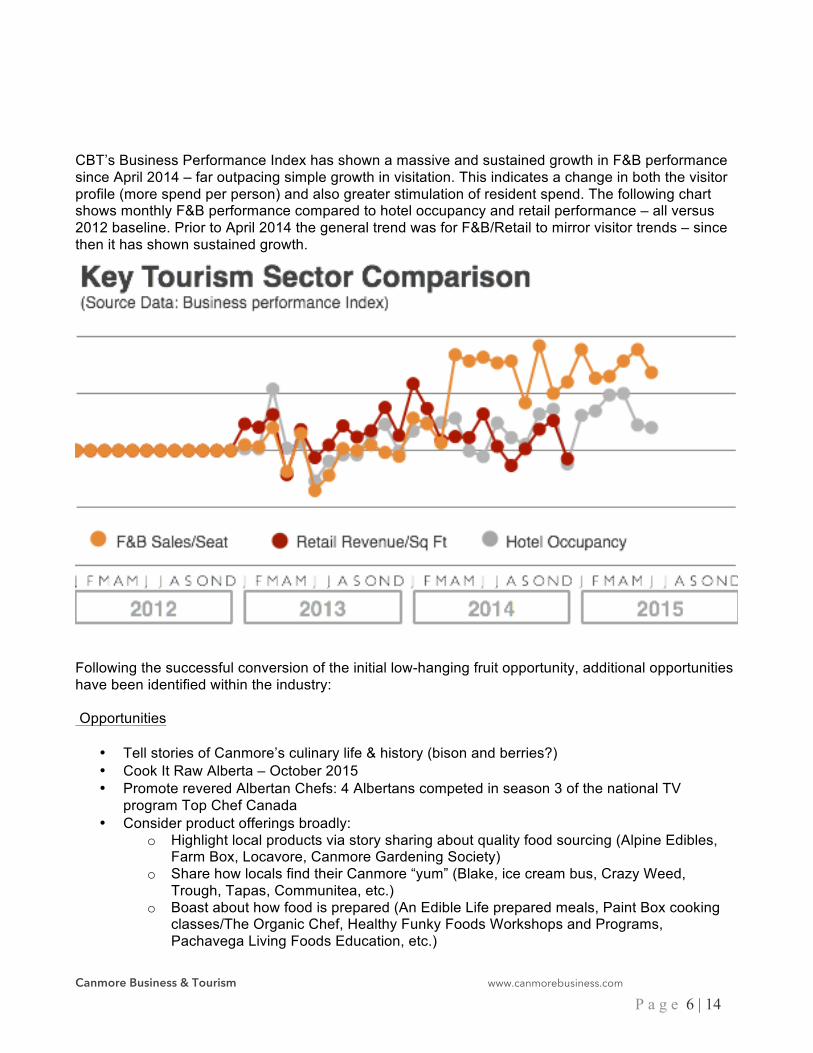
CBT’s Business Performance Index has shown a massive and sustained growth in F&B performance since April 2014 – far outpacing simple growth in visitation. This indicates a change in both the visitor profile (more spend per person) and also greater stimulation of resident spend. The following chart shows monthly F&B performance compared to hotel occupancy and retail performance – all versus 2012 baseline. Prior to April 2014 the general trend was for F&B/Retail to mirror visitor trends – since then it has shown sustained growth.
Following the successful conversion of the initial low-hanging fruit opportunity, additional opportunities have been identified within the industry: Opportunities
• Tell stories of Canmore’s culinary life & history (bison and berries?) • Cook It Raw Alberta – October 2015 • Promote revered Albertan Chefs: 4 Albertans competed in season 3 of the national TV
program Top Chef Canada • Consider product offerings broadly:
o Highlight local products via story sharing about quality food sourcing (Alpine Edibles, Farm Box, Locavore, Canmore Gardening Society)
o Share how locals find their Canmore “yum” (Blake, ice cream bus, Crazy Weed, Trough, Tapas, Communitea, etc.)
o Boast about how food is prepared (An Edible Life prepared meals, Paint Box cooking classes/The Organic Chef, Healthy Funky Foods Workshops and Programs, Pachavega Living Foods Education, etc.)
Canmore Business & Tourism www.canmorebusiness.com
P a g e 7 | 14
• Benchmark the WhiteWater Cooks’ concept and create an Uncorked Cookbook w/ suggested bevy pairings to represent the culinary festival
• Provide input into the inventory of existing or emerging culinary tourism products and opportunities, their locations and their levels of market readiness
• Participate in strategic outreach with industry members having these “near-market-ready” products, and work with the members to make their culinary tourism products market ready
• Meet other industry members to explore culinary partnerships • Better leverage current industry trends
• Food apps • The sharable nature of the food experience on social media; eating and tweeting,
Instagram, Pinterest, Facebook • Rewards programs: hotels, credit cards
Question 3: What is the long-term potential? The resulting Business Performance Index (see attached) shows that Canmore Uncorked had an immediate 83% positive impact, and an ongoing impact as Canmore is now seen as a culinary destination. Restaurants are now reporting that they no longer have a shoulder season! Due to the overall success of Canmore Uncorked, CBT (and the province) are now able to promote Canmore as a true year-round culinary destination, as CBT has taken products from the festival (i.e. Progressive Dinner Tours) and made them market ready. Canmore Uncorked 2015 saw 48 participating businesses, 1418 tickets sold with many of the events sold out and included Progressive Dinners, Whiskey Festival, Craft Beer Festival, Culinary Symphony, Long Table Dinner, Canmore Wine Festival and the BIG Brunch. In addition, five new food related business opened up in Canmore since the success of Canmore Uncorked 2014. The F & B sector was able to sustain the momentum from Canmore Uncorked throughout the balance of 2014 as shown by increased ranging from 25 – 85% compared to 2013. Total sales in 2014 of $60.7M were 39.4% higher than $43.5 million in 2013. Canmore Uncorked received an extremely strong buy-in from the local community. To date we are still receiving “kudos” from the community and the Calgary region on the success of the festival and putting Canmore on the culinary map, as well as national recognition as a two-year finalist for TIAC Event of the Year. There is definite opportunity for Canmore Kananaskis with regards to product development and marketing efforts on the food tourist:
• CBT’s existing tourism assets fit the interests of target markets
• There is growth in this segment and it overlaps with other key CBT markets
• There is opportunity to leverage this market in off-seasons
• Attracting and retaining suitable food and beverage employees may need to be considered due to the transient nature of employees in this sector
Canmore Business & Tourism www.canmorebusiness.com
P a g e 8 | 14
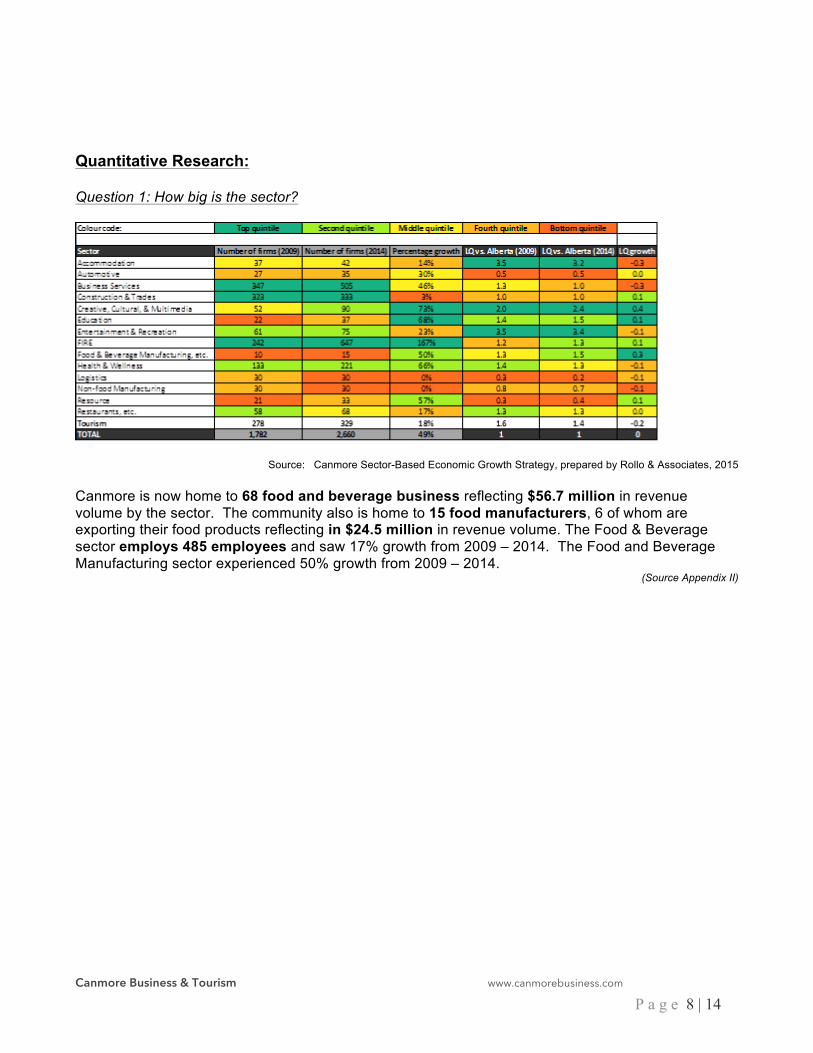
Quantitative Research: Question 1: How big is the sector?
Source: Canmore Sector-Based Economic Growth Strategy, prepared by Rollo & Associates, 2015 Canmore is now home to 68 food and beverage business reflecting $56.7 million in revenue volume by the sector. The community also is home to 15 food manufacturers, 6 of whom are exporting their food products reflecting in $24.5 million in revenue volume. The Food & Beverage sector employs 485 employees and saw 17% growth from 2009 – 2014. The Food and Beverage Manufacturing sector experienced 50% growth from 2009 – 2014.
(Source Appendix II)
Canmore Business & Tourism www.canmorebusiness.com
P a g e 9 | 14
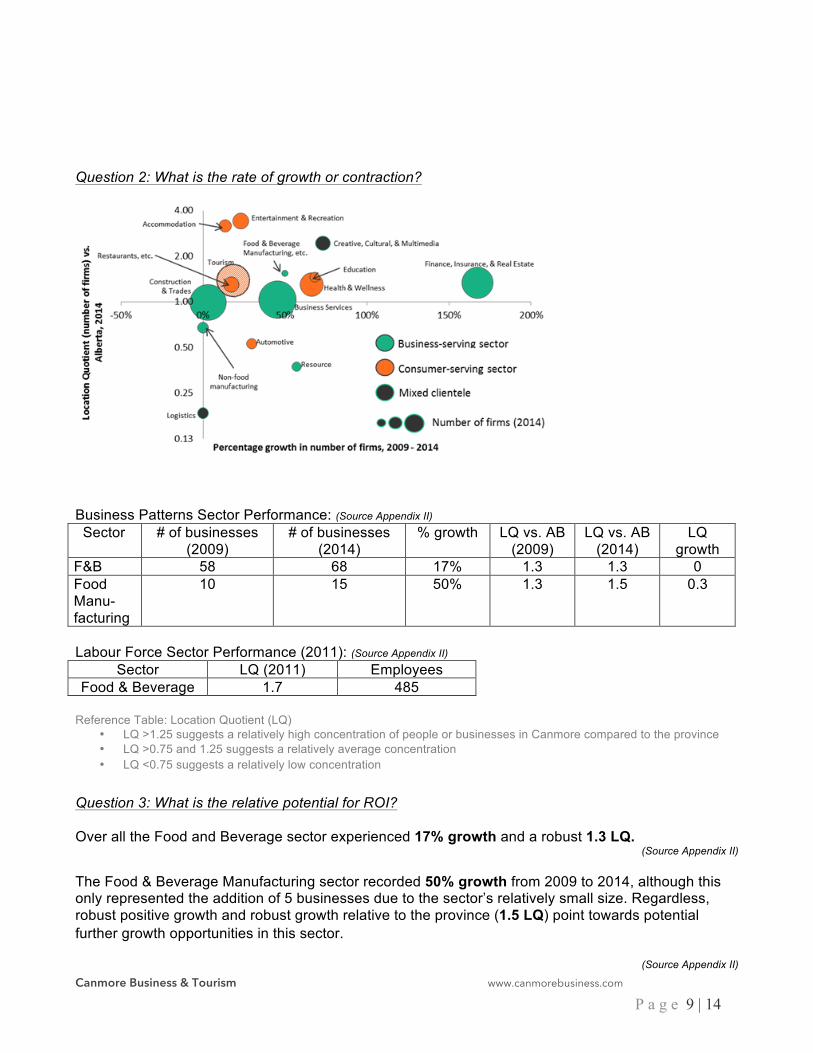
Question 2: What is the rate of growth or contraction?
Business Patterns Sector Performance: (Source Appendix II) Sector # of businesses
(2009) # of businesses
(2014) % growth LQ vs. AB
(2009) LQ vs. AB
(2014) LQ
growth F&B 58 68 17% 1.3 1.3 0 Food Manu-facturing
10 15 50% 1.3 1.5 0.3
Labour Force Sector Performance (2011): (Source Appendix II)
Sector LQ (2011) Employees Food & Beverage 1.7 485
Reference Table: Location Quotient (LQ)
• LQ >1.25 suggests a relatively high concentration of people or businesses in Canmore compared to the province • LQ >0.75 and 1.25 suggests a relatively average concentration • LQ <0.75 suggests a relatively low concentration
Question 3: What is the relative potential for ROI? Over all the Food and Beverage sector experienced 17% growth and a robust 1.3 LQ.
(Source Appendix II)
The Food & Beverage Manufacturing sector recorded 50% growth from 2009 to 2014, although this only represented the addition of 5 businesses due to the sector’s relatively small size. Regardless, robust positive growth and robust growth relative to the province (1.5 LQ) point towards potential further growth opportunities in this sector.
(Source Appendix II)
Canmore Business & Tourism www.canmorebusiness.com
P a g e 10 | 14
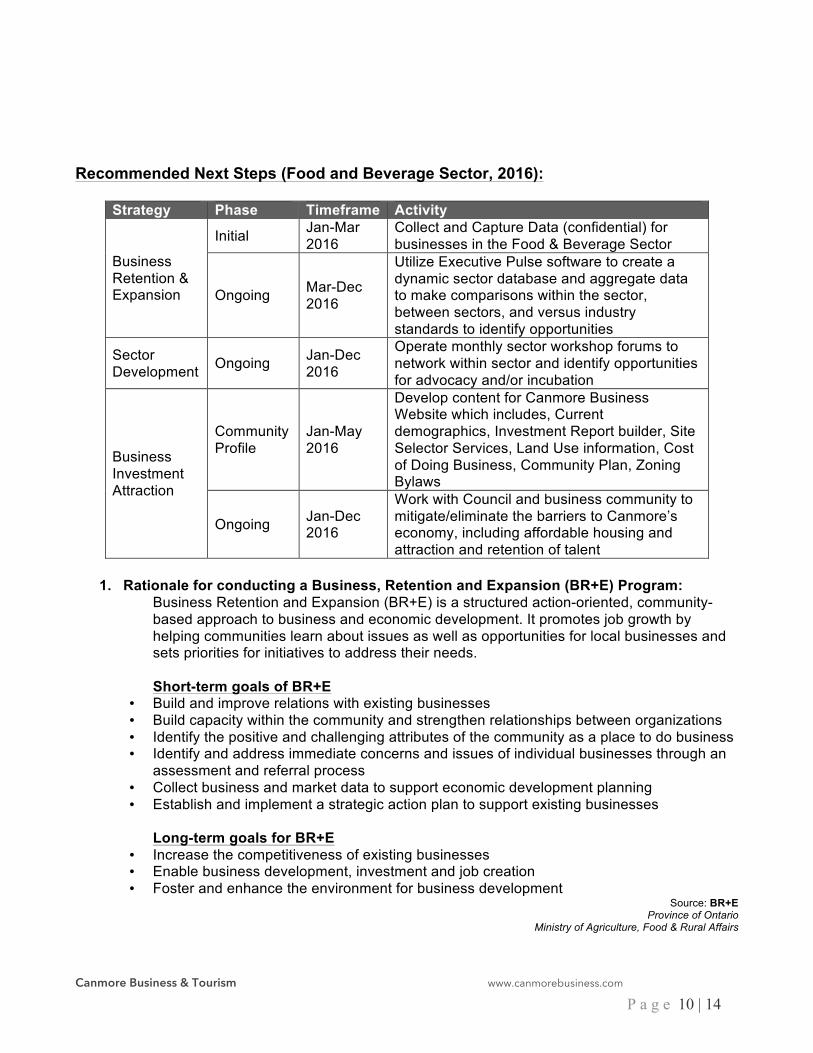
Recommended Next Steps (Food and Beverage Sector, 2016):
Strategy Phase Timeframe Activity
Business Retention & Expansion
Initial Jan-Mar 2016
Collect and Capture Data (confidential) for businesses in the Food & Beverage Sector
Ongoing Mar-Dec 2016
Utilize Executive Pulse software to create a dynamic sector database and aggregate data to make comparisons within the sector, between sectors, and versus industry standards to identify opportunities
Sector Development Ongoing Jan-Dec
2016
Operate monthly sector workshop forums to network within sector and identify opportunities for advocacy and/or incubation
Business Investment Attraction
Community Profile
Jan-May 2016
Develop content for Canmore Business Website which includes, Current demographics, Investment Report builder, Site Selector Services, Land Use information, Cost of Doing Business, Community Plan, Zoning Bylaws
Ongoing Jan-Dec 2016
Work with Council and business community to mitigate/eliminate the barriers to Canmore’s economy, including affordable housing and attraction and retention of talent
1. Rationale for conducting a Business, Retention and Expansion (BR+E) Program:
Business Retention and Expansion (BR+E) is a structured action-oriented, community-based approach to business and economic development. It promotes job growth by helping communities learn about issues as well as opportunities for local businesses and sets priorities for initiatives to address their needs. Short-term goals of BR+E
• Build and improve relations with existing businesses • Build capacity within the community and strengthen relationships between organizations • Identify the positive and challenging attributes of the community as a place to do business • Identify and address immediate concerns and issues of individual businesses through an
assessment and referral process • Collect business and market data to support economic development planning • Establish and implement a strategic action plan to support existing businesses
Long-term goals for BR+E
• Increase the competitiveness of existing businesses • Enable business development, investment and job creation • Foster and enhance the environment for business development
Source: BR+E Province of Ontario
Ministry of Agriculture, Food & Rural Affairs
Canmore Business & Tourism www.canmorebusiness.com
P a g e 11 | 14
2. Rationale for preparing a Community Profile
A community profile is usually the first piece of information that an industrial firm (prospect) or a site-location consultant will obtain regarding a community's potential suitability as a location for an industrial facility. The community profile is used to accomplish the following steps in the site-selection process. 1) The firm or their consultant requests community and site profiles for each viable community within the geographic area of the site search. 2) Information provided through the community profiles will then be reviewed to determine which communities the industrial firm wishes to include in the initial pool of potential project locations. The information in the community profile is used by the prospect to assess the impact of doing business in a particular community, based on various factors important to the firm. Those local officials who have prepared an informative, concise, and clear community profile can only increase their vicinity's potential of being selected by the prospect for additional review. The following suggestions are made in an effort to assist community leaders in thinking through the creation of their community profile.
Source: Developing a Community Profile: Myra Moss Bill Grunkemeyer
3. Rationale for conducting a Business Investment Attraction Program (BIA) An investment attraction strategy is typically a component of an economic development strategy. Much of the work done in preparing the economic development strategy, such as the economic base analysis and assessment of community assets, is also helpful in preparing your investment attraction strategy. The purpose of undertaking the investment attraction strategy is to develop a well-conceived strategic plan for attracting business and investment, based on a clear set of goals and objectives that can be achieved by implementing carefully thought out strategies and tactics.
Source: Preparing an Investment Attraction Strategy, Province of British Columbia, Ministry of Jobs, Tourism & Skilled Training
Businesses and Site Selectors top two qualifying requirements when looking to relocate to a new community are:
1. access to housing; and 2. Access to talent.
Source: IEDC: Live from Anchorage: Trends in Site Selection
It must be noted that barriers to the economy, such as affordable housing, need to be assessed for risk when developing a BIA strategy for Canmore.
Canmore Business & Tourism www.canmorebusiness.com
P a g e 12 | 14
APPENDIX I:
Additional opportunities through connection with existing economic drivers
While this document looks at the F&B sector as stand-alone, it is important to understand that Canmore’s holistic economy presents additional opportunities when multiple sectors integrate to support each other. Various reports and studies indicate that the F&B sector can easily integrate by using its current customer spend through the development of culinary tourism. CBT recently commissioned a Tourism study to understand the opportunities, one of which was identified as Culinary Tourism. (Source: Summary of Tourism Market Segmentation Research, Aspire Strategic – November, 2015). The market isn’t particularly dependent on tourists with high wages. There are a number of opportunities available through the ACTA. “Over a third of tourist spending is devoted to food. The cuisine of the destination is an aspect of the utmost importance of the holiday experience.”
Source: United Nations World Tourism Organization
“The largest market (89.7%) of Canadians who took a pleasure trip to Alberta participated in shopping and dining.”
Source: Travel Activities and Motivations Survey
Drivers, attributes & demographics: • Alberta restaurants had the highest average unit volume, at $798,371 per unit in 2012. This is
28 percent more than the national average. Alberta restaurants also experienced a 7.5 percent annual increase in sales, the highest in the country.
Source: Alberta Culinary Tourism Alliance 2013-2016 Strategic Plan • Culinary tourist traits:
o Are concerned about origin of products – Canmore-specific alignment o Means of socializing and exchanging experiences with others o Higher-than average expenditure o Demanding and appreciative o High level of loyalty - Canmore-specific alignment o Will revisit destinations due to gastronomy
Source: UNWTO Global Report on Food Tourism “85% of culinary travelers enjoy learning about the local culture and cuisines; 66% want to try regional cuisines, culinary specialties and local wines and spirits; and
Canmore Business & Tourism www.canmorebusiness.com
P a g e 13 | 14
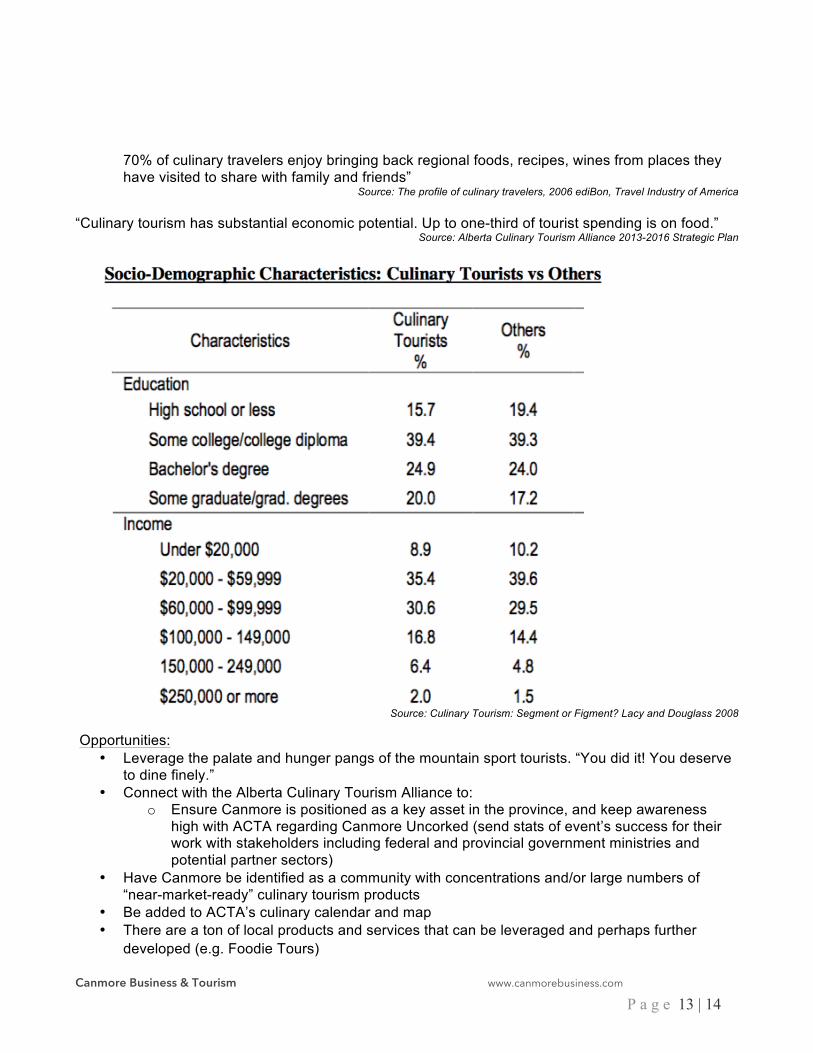
70% of culinary travelers enjoy bringing back regional foods, recipes, wines from places they have visited to share with family and friends”
Source: The profile of culinary travelers, 2006 ediBon, Travel Industry of America
“Culinary tourism has substantial economic potential. Up to one-third of tourist spending is on food.” Source: Alberta Culinary Tourism Alliance 2013-2016 Strategic Plan
Source: Culinary Tourism: Segment or Figment? Lacy and Douglass 2008
Opportunities:
• Leverage the palate and hunger pangs of the mountain sport tourists. “You did it! You deserve to dine finely.”
• Connect with the Alberta Culinary Tourism Alliance to: o Ensure Canmore is positioned as a key asset in the province, and keep awareness
high with ACTA regarding Canmore Uncorked (send stats of event’s success for their work with stakeholders including federal and provincial government ministries and potential partner sectors)
• Have Canmore be identified as a community with concentrations and/or large numbers of “near-market-ready” culinary tourism products
• Be added to ACTA’s culinary calendar and map • There are a ton of local products and services that can be leveraged and perhaps further
developed (e.g. Foodie Tours)
Canmore Business & Tourism www.canmorebusiness.com
P a g e 14 | 14
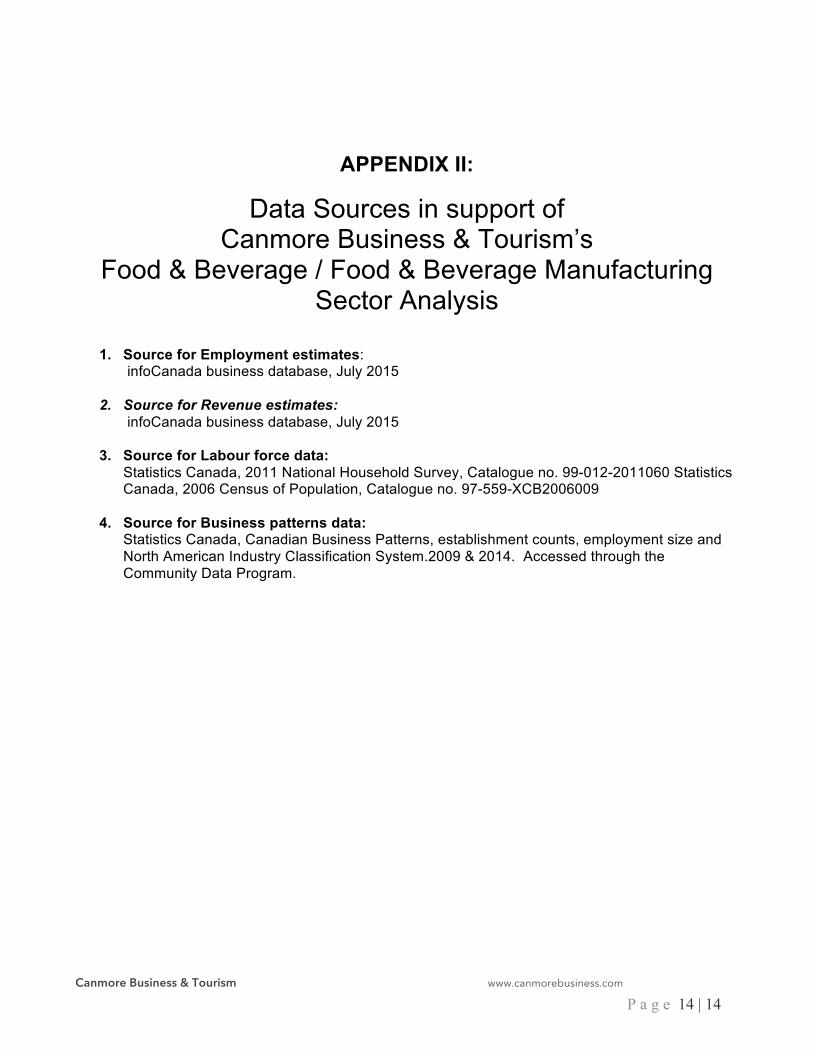
APPENDIX II:
Data Sources in support of Canmore Business & Tourism’s
Food & Beverage / Food & Beverage Manufacturing Sector Analysis
1. Source for Employment estimates:
infoCanada business database, July 2015
2. Source for Revenue estimates: infoCanada business database, July 2015
3. Source for Labour force data:
Statistics Canada, 2011 National Household Survey, Catalogue no. 99-012-2011060 Statistics Canada, 2006 Census of Population, Catalogue no. 97-559-XCB2006009
4. Source for Business patterns data:
Statistics Canada, Canadian Business Patterns, establishment counts, employment size and North American Industry Classification System.2009 & 2014. Accessed through the Community Data Program.