food industry - deloitte report
DESCRIPTION
Food Industry - Deloitte reportTRANSCRIPT

DECEMBER 2009
REPUBLIC OF TURKEY PRIME MINISTRY Investment Support and Promotion Agency of Turkey
TURKISH FOOD & BEVERAGE
INDUSTRY REPORT
JULY 2010

2
CONTENTS
1. Executive Summary 3
2. Sector Overview 4
2.1 Global Sector 4
2.2 Domestic Sector 5
2.2.1 Overview 5
2.2.2 Food and Beverage Production 7
2.2.3 Food Consumption 8
2.2.4 Beverage Consumption 9
2.2.5 Mass Grocery Retail Market 11
2.2.6 Food and Beverage International Trade 12
2.3 Main Players in Turkey 13
2.4 Industry Developments in Turkey 14
2.5 Positioning Map 15
2.6 Investment Opportunities 16
2.7 SWOT Analysis 18
2.8 Sector Establishments and Institutions 19
LIST OF FIGURES 20
ABBREVIATIONS 21
3
1. Executive Summary
The global food and beverage market is expected to reach USD 3,840 billion in 2010, growing around 3
percent annually, thanks to the increasing demand for healthy products and rising disposable incomes in
emerging economies such as China, India and Brazil.1
Consumers have curbed their spending on non-essentials such as home furnishings in response to the global
economic downturn. However, spending on essentials such as food and beverage has remained fairly robust.
Although the economic downturn has had an impact on spending habits and priorities, concerns for quality,
health and sustainability still play an important role in consumption. Such food safety concerns are expected to
grow in future.2
The food and beverage industry is highly fragmented, with the top ten companies in 2007 accounting for only
12.9 percent of the global market. The EU is the key player in the global trade, being the world’s largest
exporter and importer of food and beverage products worldwide. However, due to the increased shares of
Brazil and China in recent years, the share of the EU declined from 24.6 percent in 1998 to 19.8 percent in
2007. The US ranks second in the world trade, followed by Brazil and China.3
Turkey is an attractive market for potential investors: it was ranked 5th in a rating analysis by Business Monitor
International (BMI) regarding the Food and Drink industry, Q3 2010 CEE Business Environment Ratings
thanks to its large size of population (nearly 73 million), lack of market maturity or saturation, its favorable long-
term economic structure and GDP per capita. Additionally, as a major agricultural producer with an
increasingly positive food and beverage trade balance, Turkey offers easy access to raw materials. The food
and beverage sector, which is largely dependent on the agricultural sector in Turkey, has an important share in
the country’s production i.e. a share ranging between 18-20 percent.
Production in the Turkish food and beverage sector registered an increase of c.4.1 percent from 2007 to 2008;
however it then declined by c.1.3 percent from 2008 to 2009. This contraction was less severe than in various
other sectors which were temporarily hit harder by the global economic downturn.4
The Turkish food sector is becoming more advanced as retailers require higher standards from food
manufacturers and investments accompanied by improvements in the sector take place. Through the
widespread presence of modern Mass Grocery Retail outlets and rising disposable incomes, the consumption
patterns of Turkish consumers have shifted to packaged and processed foods, such as ready-to-eat meals and
frozen foods. Additionally, increases in the number of females in full-time employment have supported the
trend towards packaged, frozen and ready food. Food consumption, as a percentage of GDP, is expected to
fall from an estimated 8.4 percent in 2009 to 7.2 percent in 2014, reflecting the country's growing wealth.
Consumption of beverages in value is expected to grow by 16.4 percent in CAGR terms from 2009 to 2014,
mainly due to the expansion of soft drink sales.5
Turkey's food, beverage and tobacco trade balance is expected to grow positively over the forecast period,
due to the sheer size of the country's agriculture sector. As consumers demand a wider variety of food and
beverage products, the annual trade balance is expected to increase from USD 4.4 billion4 in 2005 to USD 6.2
billion by 2014.5 Meanwhile, exports are projected to register a 46 percent growth in this period, while total
volume is expected to reach USD 9.1 billion.5
1 The Top Ten Food and Drinks Companies, Business Insights, February 2009
2 Top of Mind survey of CIES (The Consumer Goods Forum), 2008
3 The Competitiveness of the EU Food and Drink Industry, Facts and Figures 2009, CIAA
4 TUIK, Turkish Statistical Institute
5 BMI

4
Since 2000, reforms have been ongoing in organic agriculture to keep pace with the growing international
interest in this sub-sector. Currently, Turkey exports almost all of its certified organic food produce, with the
vast majority (approximately 85 percent) of this going to Europe. Additionally, the production of “halal food”
offers opportunities in Turkey as a predominantly Muslim country.
2. Sector Overview
2.1 Global Sector
The global food and beverage market is expected to reach USD 3,840 billion in 2010.6 It was USD 3,500 billion
in 2007, and thus has grown by approximately three percent per annum despite the recession. Emerging
markets such as China, India and Brazil are seen as drivers of growth as the recession contracted consumer
spending in developed markets. On the other hand, the rising price of raw materials such as animal feed,
energy, and other commodities such as packaging materials are concerns for the producers.
In response to the global economic downturn, it is observed that consumers have curbed their spending on
non-essentials such as home furnishings. However, spending on essentials such as food and beverage has
remained fairly robust. Although the economic downturn has had an impact on spending habits and priorities,
concerns for quality, health and sustainability still play an important role. For instance, sales of organic foods
have remained broadly stable in the US.7
Food safety concerns are expected to grow as stated in the Top of Mind survey of the CIES (The Consumer
Goods Forum). It is expected that in 2010 and onwards, there will be even more focus on food safety
initiatives, as food and beverage companies focus on growth in emerging markets, which tend to lack the
infrastructure and pervasive standards.
The food and beverage industry is highly fragmented, with the top ten companies in 2007 accounting for only
12.9 percent of the global market. In terms of the operators in the food chain, there is a highly concentrated
retail sector where in most EU countries the three largest food retailers represent more than 40 percent market
share, and in the Nordic countries even more than 75 percent.6
Figure 1 – Global Top Ten Food, Beverage and Tobacco Companies
The aggregate level of global exports (and imports) in 2007 was USD 375 billion. The EU plays a key role in
world trade as the world’s largest exporter and importer of food and beverage products worldwide (excluding
intra-EU trade).
6 The Top Ten Food and Drinks Companies, Business Insights, February 2009
7 Organic Food Sales Remain Strong, Time Magazine, 21 July 2009
Top 10 Food, Beverage & Tobacco companies 2008
Company name Country Region
FY08 net sales
US$ million
Nestle Switzerland Europe 101,823
Japan Tobacco Japan Asia/Pacific 68,323
Philip Morris Intl. United States North America 63,640
PepsiCo United States North America 43,251
Kraft United States North America 42,201
Imperial Tobacco United Kingdom Europe 40,504
Coca-Cola United States North America 31,944
Mars United States North America 30,000
Tyson United States North America 26,862
AB InBev Belgium Europe 23,692
Source: Published company data, Deloitte Global Powers of the Consumer Products Industry 2010

5
However, the share of the EU in the global export market for food and beverage products declined from 1998
to 2007 (from 24.6 percent to 19.8 percent) mainly due to the increasingly strong pressure from Brazil and
China whose respective shares as of 2007 stand at 7.4 percent and 6.5 percent.8
Value-added growth in the EU food and beverage industry has begun to stabilize at +2 percent over the past
few years, whereas the rates for China and Brazil reached 22 percent and 14 percent respectively between
2006 and 2007.9
Figure 2 – Market Shares of World Food and Beverage Exports and Imports, 2007
The EU is both the main exporter (20 percent of global food and beverage industry exports) and importer (19
percent of global imports), followed by the US and Japan. Approximately 21 percent of EU exports is to the
US, whereas exports to China have been steadily rising. The EU imports mainly from Brazil and Argentina,
together forming 20 percent of total EU imports.10
2.2 Domestic Sector
2.2.1 Overview
Production in the food and beverage sector reached TRY 8,852 million in 2009, which constitutes 18-20
percent of the country’s production as a whole.11
It is largely dependent on the agricultural sector in Turkey. A
wide range of crops grow in Turkey helped by the generally benign climate.
Significant sub-sectors within the Turkish food and beverage industry include meat and meat products, baked
products, dairy products, fruits and vegetables, oils, confectionery, alcoholic and non-alcoholic drinks, soft
drinks, ready-made food and baby food.
8 Confederation of the Food and Drink Industries of the EU (CIAA), 2008 Annual Report
9 The Competitiveness of the EU Food and Drink Industry, Facts and Figures 2009, CIAA
10 Confederation of the Food and Drink Industries of the EU
11 DPT, Prime Ministry State Planning Organization & Deloitte calculation based on DPT and TUIK data
19.8%
11.5%
7.4%
6.5%
4.6% 3.6% 3.3%
45.0%
Global Food & Drink Exports - 2007
EU
USA
Brazil
China
Canada
Australia
New Zealand
Others
Source: CIAA, European Food and Drink Industry 2008
18.8%
16.8%
9.6%
5.1% 4.6% 4.4% 2.9%
2.8%
2.1%
32.9%
Global Food & Drink Imports - 2007
EU
USA
Japan
China
Russia
Canada
Mexico
South Korea
Hong Kong, China
Others
Source: CIAA, European Food and Drink Industry 2008

6
The proportion of Turkish household expenditure allocated to food, beverages and tobacco, which was around
26 percent and rose to about 27-27.5 percent in 2009-10, remains high compared with Western standards,
which range between 15-20 percent. The total consumer spending on food, beverages and tobacco, which is
estimated at around USD 130 billion in 2008, was around USD 120 billion in 2007.12
Figure 3 - Food and Beverage Consumption per Capita in Turkey
Per Capita Consumption Data - Turkey
2004e 2005e 2006e 2007e 2008e 2009e 2010f 2011f 2012f 2013f
Meat consumption (kg per head) 21.3 22.6 23.4 23.9 23.9 23.0 23.2 23.7 24.1 24.6
Fish consumption (kg per head) 7.0 6.9 7.0 7.2 7.2 7.0 7.1 7.2 7.3 7.4
Fruit consumption (kg per head) 105.2 105.3 107.2 109.4 109.5 108.5 109.4 111.1 112.5 114.0
Vegetable consumption (kg per head) 226.3 224.2 228.0 230.4 230.3 225.8 227.1 229.1 231.1 233.2
Milk consumption (litres per head) 126.6 129.9 132.0 134.5 134.8 134.0 135.2 137.2 138.9 140.8
Coffee consumption (kg per head) 0.5 0.6 0.6 0.7 0.7 0.6 0.7 0.7 0.7 0.7
Tea consumption (kg per head) 2.4 2.7 2.7 2.7 2.7 2.7 2.7 2.7 2.7 2.8
e: Estimate f : Forecast
Source: Economist Intelligence Unit
Market entry barriers for new businesses are also quite low, thanks to an open and increasingly liberal trade
and investment climate. According to the data issued by the Industry Database of Union of Chambers and
Commodity Exchanges of Turkey (TOBB), the number of active companies in the food and beverage industry
decreased from 23,276 in 2007 to 22,092 by the end of 2008. The majority of the Turkish food and beverage
sector is formed of SMEs, which are mostly privately held. The capacity utilization rate is around 70 percent for
the food and beverage sector.13
The share of baked goods is significant in the diets of the Turkish population. Hence, the bakery subsector
forms the majority (65 percent) of the total food and beverage companies by number in Turkey.
Figure 4 – Distribution of Companies by Sub-sector (2009)
Turkey ranks in 5th place according to the CEE Business Environment Ratings prepared by BMI. The analysis
emphasizes the food and beverage industry’s attractiveness to investors by taking into consideration the
market size, current consumption levels, future potential growth and the legislative and political environment.
12 EIU, Turkey: Consumer Goods and Retail Report, September 29
th, 2009
13 Central Bank of the Republic of Turkey, “Capacity Utilization Rate of Manufacturing Industry”, February 2010
65%
11%
12%
4% 3%
1% 5%
Baked products
Dairy products
Fruits & vegetables
Animal and vegetable oils
Confectionery cocoa&chocolate
Meat products
Drinks
Source: DPT
Distribution of Enterprises by Subsector (2009)

7
Figure 5 – Emerging Europe Food & Beverage Ratings
Especially in terms of the Country Structure indicator, Turkey has a high score mainly due its large population,
nearly 73 million, lack of market maturity or saturation, and favourable long-term economic structure and GDP
per capita. As a major agricultural producer with an increasingly positive food and beverage trade balance,
Turkey offers easy access to raw materials.
Additionally, distribution is in place in the form of the well-developed and growing Mass Grocery Retail (MGR)
sector. However, food consumption growth has been dampened by the recent recession i.e., real GDP growth
of -4.7 percent in 2009. According to the OECD forecasts, it is expected that the real GDP growth of Turkey
will recover to 6.8 percent in 2010 and become 4.5 percent in 2011.14
The growth forecasts of the BMI for
2012, 2013 and 2014 are 5.2%, 5.7% and 5.6% respectively.15
In terms of the Risks to Realisations of Returns, Turkey fares worse than some of its regional peers with its
country risk score. Nevertheless, the pro-business Turkish government has been proactively working to move
the country toward EU membership and undertaking a number of key institutional reforms. In February 2010,
international credit rating agency Standard & Poor's raised Turkey's sovereign ratings considering the
government’s success in reducing the debt burden and keeping the financial sector stable. The long-term
foreign currency and local currency sovereign credit ratings were raised to BB and BB+.
2.2.2 Food and Beverage Production
Production in the Turkish food and beverage sector increased c.4.1 percent from 2007 to 2008; however it
then declined by c.1.3 percent from 2008 to 2009. This contraction was less severe than in many other sectors
which were temporarily hit by the global economic downturn.16
14 OECD, Organisation For Economic Co-operation and Development, Economic Outlook No.87
15 BMI
16 TUIK, Turkish Statistical Institute
Food &
Drink
Market
Country
StructureLimits
Market
Risks
Country
RiskRisks
Food &
Drink BE
Rating
Regional
Ranking
Russia 85 65.2 75.1 45 57.6 52.6 68.4 1
Hungary 67 54.1 60.5 75 63.6 68.1 62.8 2
Poland 59 60.0 59.5 70 66.1 67.7 62.0 3
Czech Republic 61 52.3 56.6 75 68.6 71.1 61.0 4
Turkey 58 59.5 58.8 75 54.9 62.9 60.0 5
Slovakia 55 53.9 54.4 70 60.5 64.3 57.4 6
Slovenia 51 50.0 50.5 70 70.0 70.0 56.4 7
Lithuania 61 41.6 51.3 70 65.2 67.1 56.0 8
Romania 51 51.6 51.3 60 57.2 58.3 53.4 9
Estonia 53 44.1 48.5 65 62.6 63.5 53.0 10
Serbia 63 46.6 54.8 50 44.5 46.7 52.4 11
Bulgaria 45 47.7 46.4 55 60.7 58.4 50.0 12
Croatia 41 48.0 44.5 60 62.5 61.5 49.6 13
Latvia 40 44.1 42.0 70 62.4 65.4 49.1 14
Ukraine 53 46.4 49.7 35 50.9 44.6 48.1 15
Emerging Europe Food And Beverage Business Environment Ratings Q3 2010Risks to Realisation
of Returns
Source: BMI. Scores out of 100, with 100 highest. The Food & Drink BE Rating is the principal rating. It comprises two sub-ratings: 'Limits
of Potential Returns' and 'Risks to realisation of returns', which have a 70% and 30% weighting respectively.
Limits of Potential Returns

8
Figure 6 - Food and Beverage Sector Production Index
2.2.3 Food Consumption
Turkey has traditional eating habits that remain stable in the majority of the population. However, the Turkish
food sector is becoming more elaborated as retailers require higher standards from food manufacturers, and
investments accompanied by improvements in the sector take place. Through the widespread presence of
modern MGR outlets and rising disposable incomes, consumption patterns have been shifting to packaged
and processed foods, such as ready-to-eat meals and frozen foods. Additionally, the increases in the number
of females in full-time employment have supported the trend towards packaged, frozen and ready food.
Therefore, considering that Turkey still has the lowest per capita consumption of packaged food in Europe,
there is considerable potential in the aforementioned sub-sectors.
Globally, Turkey is one of the largest markets for baked goods, since such goods have a significant share in
the diets of the Turkish population. With rising incomes, packaged bread consumption presents an increase
and at the same time, demand for different bread varieties, such as high-fibre and speciality artisan breads
offer an opportunity for this higher profit market compared with traditional baked products.
Figure 7 – Turkey Food Consumption Indicators
Food consumption as a percentage of GDP is expected to fall from an estimated 8.4 percent in 2009 to 7.2
percent in 2014, reflecting the country's growing wealth (see Figure 7 above).
7686
102
137
8595
108
135
9298
113
131
95105
112
140
92 98105
151
0
20
40
60
80
100
120
140
160
Winter Spring Summer Fall
Food & Beverage Sector Production Index (monthly average)
2005 2006 2007 2008 2009Source: Turkish Statistical Institute, base year=2005
10.0% 9.5%
9.0% 8.3% 8.4% 8.1% 7.8% 7.6% 7.4% 7.2%
0%
2%
4%
6%
8%
10%
12%
-
20
40
60
80
100
120
2005 2006 2007 2008 2009e 2010f 2011f 2012f 2013f 2014f
Food Consumption
Food consumption (TRY billion) Total food consumption growth (y-o-y)
Food consumption as % GDP
Source: Turkish Statistical Institute, Trade press, BMI

9
Figure 8 - Turkey Per Capita Food Consumption
With an annual production capacity of 1.9 million tonnes, the confectionery industry also holds an important
position. The Turkish traditional sweet Lokum (“Turkish Delight”), caramel, chewing gum and toffees are some
of the confectionery products exported worldwide. The local brand Ülker is the market leader, with Kent (a
Cadbury subsidiary) and Intergum being other key confectionery manufacturers.17
According to BMI estimates, total food consumption in Turkey is expected to grow by 34 percent and food
consumption per capita by 21 percent between 2009 and 2014. Developments in the mass grocery retail
industry and processed food industry are the key driving factors of the estimated growth. 17
2.2.4 Beverage Consumption
The beverage sector in Turkey can be analyzed in terms of hot beverages, soft beverages and alcoholic
beverages.
Figure 9 – Beverage Sales in Turkey
17 BMI Industry View, Turkey Food & Drink Report - Q2 2010
(1)%
10% 10%
4%
(23)%
(5)%
11% 13% 10% 11%
-25%
-20%
-15%
-10%
-5%
0%
5%
10%
15%
-
200.0
400.0
600.0
800.0
1,000.0
1,200.0
2005 2006 2007 2008 2009e 2010f 2011f 2012f 2013f 2014f
Per capita Food Consumption
Per capita food consumption (US$) Per capita food consumption growth (y-o-y)
Source: Turkish Statistical Institute, BMI
5,924 6,947
7,695 8,556
7,269 8,519
10,589
12,665
14,241 15,604
-
2,000
4,000
6,000
8,000
10,000
12,000
14,000
16,000
18,000
2005 2006 2007 2008 2009e 2010f 2011f 2012f 2013f 2014f
Turkey Beverage Sales (US$mn)
Soft drinks sales Alcoholic drinks sales Tea sales
Source: Trade Press, Company Information, BMI

10
Hot Beverages
Turkey ranks 7th in the tea cultivation area within the world, 5
th in dry tea production, and 4
th in annual per
capita tea consumption.18
State-owned Çaykur is the traditional market leader in the tea sector with 6,600
ton/day production capacity, covering approximately 60-65 percent of the dry tea market in Turkey.19
Other
major players in the tea market include private companies such as Doğuş, Doğadan and Unilever (Lipton).20
Among other hot drinks, Turkish coffee is widely consumed in Turkey although the global coffee chains, such
as Starbucks and Café Nero, which provide various alternative products, have been entering the market.
Soft Beverages
According to the Federation of Food and Drink Industry Associations of Turkey, bottled water ranks in first
place with regards to the production capacities in the Turkish beverage industry, accounting for around 50
percent of the total beverage industry production capacity of 13,236 million liters.21
Bottled water revenue was
around TRY 3.1 billion in 2009, and is expected to reach TRY 3.2 billion in 2010. Turkish annual per capita
bottled water consumption was 126 litres in 2009, not far below the figures in developed countries such as
France (142 litres) and Italy (176 litres).22
DanoneSa is the market leader in mineral water with its brand,
Hayat. Other market leaders are Erikli, Nestle, Pınar, Niksar, Hamidiye and Saka.20
Other soft drinks mainly including soda and fruit juice constitute approximately 37 percent of the total beverage
industry production capacity in 2009.21
Coca-Cola İçecek is the dominant market leader in soft drinks,
excluding bottled water with being the distributor of brands such as Coca Cola, Fanta, Sprite, Nestea,
Powerade and Schweppes, followed by other brands such as Pepsi and Cola Turka.20
Alcoholic Beverages
The top four alcoholic beverages produced in Turkey are beer, raki, wine and vodka. Beer is the main alcoholic
drink, constituting c.90 percent of total alcoholic drinks production in 2009. Although beer is the main alcoholic
drink produced in Turkey, it is wine production that has been increasing fastest among the top four products:
by 22 percent in 2009, and a continued increase of 52 percent in Q1 2010, when compared to Q1 2009.23
According to the Tobacco and Alcohol Market Regulatory Authority, Anadolu Efes and Türk Tuborg are the two
beer producers with a production capacity exceeding 1 million litres per annum. Anadolu Efes, the owner of the
Efes brand, constitutes nearly 80 percent of the beer market in Turkey, followed by Tuborg holding the majority
of the remaining market share.20
Turkey’s alcoholic beverage exports amounted to 104 million litres in 2009, with beer accounting for a 95
percent share. Imports amounted to 7 million litres in 2009, of which whisky represented 35 percent.23
Raki, the Turkish traditional alcoholic drink constitutes 4.4 percent of the total production together with wine. In
addition to the large wine producers, there are almost 300 small-sized producers located in Central Anatolia,
Marmara Thrace and the Aegean region. Total capacity of the wine sector is approximately 120 million litres
per annum.24
18 Çaykur, Tea Industry Report, 2009
19 Çaykur website, www.caykur.gov.tr
20 BMI
21 Federation of Food and Drink Industry Associations of Turkey, 2009 Report
22 SUDER (Packaged Water Manufacturers Association)
23 TAPDK (Tobacco and Alcohol Market Regulatory Authority)
24 IGEME, Export Promotion Center of Turkey, Wine Sector Report, 2010

11
In 2009, Turkey exported approximately 3.6 million litres of wine with a total value of USD 7.75 million. Export
markets include Belgium, the Turkish Republic of Northern Cyprus and Germany with respective shares of 26
percent, 25 percent and 15 percent.25
2.2.5 Mass Grocery Retail Market
Although Turkish consumers have been shopping primarily from small markets and grocery stores, the market
share of those traditional retailers has been steadily eroding, as consumers move towards mass grocery
retailers (supermarkets and hypermarkets) offering a wider range of products and higher quality goods.
Figure 10 – Turkey Mass Grocery Retail Sales (2005-2014)
Thanks to increased urbanization, rising disposable incomes and the higher number of women in the
workforce, the retail sector has been slowly shifting towards these more Western-style operations, particularly
in the larger cities. Despite this trend, the small, traditional retailers still account at present for the majority of
food retail sales in the country at around 60 percent.26
Supermarkets started to operate in the early 1990s in the Turkish food and beverage industry and gained a 26
percent market share in the sector by year 2000. Performing an impressive growth, supermarkets currently
dominates nearly 40 percent of the sector. Modern retail stores are more profitable than their traditional
competitors with higher number of stores bringing bulk buying power.26
MGR Market Players
The Turkish mass grocery retail market is highly competitive. Migros currently has the largest share with 9
percent of the market, followed by Carrefour with 8 percent and BIM with 7 percent. Other international names
include Metro and Tesco Kipa. 26
25 Turkish Statistical Institute
26 BMI Industry View, Turkey Food and Drink Report - Q2 2010
11.8 14.1
16.7 19.7 20.6
22.3 24.8
27.7 30.9
34.6
0%
5%
10%
15%
20%
25%
0
5
10
15
20
25
30
35
40
2005 2006 2007 2008 2009e 2010f 2011f 2012f 2013f 2014f
Turkey Mass Grocery Retail Sales By Format (TRY billion)
Supermarkets Hypermarkets
Discount stores Total MGR growth (y-o-y)
Source: Turkish Statistical Institute, BMI

12
Figure 11 – Turkey MGR Market Share (%) By Retailer
MGR retail sales are largely formed by supermarkets whose sales reached TRY 10.7 billion in 2009, while
hypermarket sales accounted for an estimated TRY 5.6 billion. Between 2005 and 2008, supermarkets,
hypermarkets and discount stores achieved CAGRs of 16 percent, 19 percent and 30 percent, respectively.27
Figure 12 – Basic Financial Data of Public MGR Companies in Turkey
Company
Name
Company
Type
Total Enterprise
Value (*)
Market
Capitalization (*)
Total Revenue
[LTM]
Net Income
[LTM]
BIM Birlesik
Magazalar A.S.
Public
Company 3,324.0 3,432.5 3,184.5 117.0
Migros Ticaret
A.S.
Public
Company 2,375.0 2,374.8 4,219.4 131.3
LTM : Last Twelve M onths
Source: Capital IQ ; (*) Latest data as of M arch 10, 2010
$USDmm
2.2.6 Food and Beverage International Trade
According to the Turkish Statistical Institute, Turkey's food and beverage trade balance moved negatively
between 2007-2009. Turkey is a major exporter of dried fruit, tobacco (from the Aegean region) and hazelnuts,
of which it is the world's largest supplier, from the Black Sea coast. Turkey's main agricultural imports include
cotton, soya beans, vegetable oils, tobacco, maize and rice.28
27 Turkish Statistical Institute & BMI forecast
28 EIU, Turkey: Consumer Goods and Retail Report, September 29
th, 2009
Migros, 9% Carrefour, 8%
BIM, 7%
Metro, 5%
Tansas, 4%
Tesco Kipa, 3%
Other, 64%
Source: BMI, 2008 data

13
Figure 13 – Food and Beverage International Trade Statistics by Sub-Sector
2.3 Main Players in Turkey
Main players in the Turkish food and beverage sector are presented below.
Figure 14 – Main Players in Turkey’s Food and Beverage Sector
Food & Beverage Sector Exports by Sub-Sector Food & Beverage Sector Imports by Sub-Sector
US$ m 2004 2005 2006 2007 2008 2009 US$ m 2004 2005 2006 2007 2008 2009
Animal feeds 2 2 2 5 36 46 Animal feeds 55 61 73 88 113 90
Bakery products 216 231 264 347 424 417 Bakery products 13 15 19 24 37 39
Beer & Malt 31 42 42 48 64 62 Beer & Malt 4 3 4 2 4 2
Cocoa,chocolate and
confectionary391 424 468 611 665 628
Cocoa,chocolate and
confectionary70 67 93 104 144 150
Dairy products 41 62 89 112 136 142 Dairy products 60 67 80 115 133 120
Ethyl alcohol from fermented
products13 23 29 35 33 27
Ethyl alcohol from fermented
products27 35 47 56 66 92
Fish products 110 106 129 148 173 154 Fish products 82 77 105 134 141 138
Floury products (Pasta,
noodle, kouskous etc.)50 66 80 108 182 149
Floury products (Pasta,
noodle, kouskous etc.)2 2 3 3 4 5
Meat & meat products 55 67 60 83 112 177 Meat & meat products 461 368 414 426 375 214
Milled grain products 271 532 377 572 814 787 Milled grain products 68 91 83 136 184 151
Non-alcoholic beverage,
mineral & spring water62 76 67 85 92 82
Non-alcoholic beverage,
mineral & spring water18 12 21 32 38 31
Other food products 194 234 323 440 545 537 Other food products 266 326 393 443 431 362
Processed fruits & vegetables 1,548 1,850 1,789 2,082 2,318 2,146 Processed fruits & vegetables 41 63 75 105 179 143
Starch and products with
starch37 48 55 52 68 56
Starch and products with
starch129 161 161 189 250 167
Sugar 38 5 58 16 21 4 Sugar 17 25 20 33 46 25
Vegetable and animal origin
oils281 497 498 411 785 508
Vegetable and animal origin
oils589 737 858 767 1,611 1,172
Wine 8 8 9 9 8 8 Wine 2 3 4 4 5 4
Total 3,348 4,273 4,339 5,164 6,476 5,930 Total 1,904 2,113 2,453 2,661 3,761 2,905
Source: Federation of Food&Drink Industry Association of Turkey, 2009 Report & Turkstat Source: Federation of Food&Drink Industry Association of Turkey, 2009 Report & Turkstat
Key Players in Turkey's Food and Beverage Sector, 2009
ISO 500 -
2009
Ranking
Company Name Sector Location
Production
Based Sales in
2009 (TRY
million)
15 Türkiye Şeker Fabrikaları A.Ş. Sugar and molasses production Ankara 2,007
25 Coca-Cola İçecek A.Ş. Beverages İstanbul 1,308
31 Ak Gıda Sanayi ve Ticaret A.Ş. Food production and distribution İstanbul 974
32 Çay İşletmeleri Genel Müdürlüğü Tea production Rize 950
34 Anadolu Efes Biracılık ve Malt Sanayii A.Ş. Beer and beverages İstanbul 921
36 Konya Şeker Sanayi ve Ticaret A.Ş. Sugar production Konya 880
50 Ülker Çikolata Sanayi A.Ş. Chocolate production İstanbul 723
58 Kayseri Şeker Fabrikası A.Ş. Sugar production Kayseri 681
60 Oltan Gıda Mad. İhr. İth. ve Tic. Ltd. Şti. Hazelnut production Trabzon 652
62 C.P. Standart Gıda Sanayi ve Ticaret A.Ş. Chicken, egg and shrimp production İstanbul 629
66 SÜTAŞ Süt Ürünleri A.Ş. Milk and milk products production Bursa 621
69 Tat Konserve Sanayi A.Ş.Tomato paste, ketchup, canned food and vegetables
productionİstanbul 617
86 Eti Gıda Sanayi ve Ticaret A.Ş. Biscuit and chocolate production Eskişehir 514
94 Altınmarka Gıda Sanayi ve Ticaret A.Ş. Prepackaged food production İstanbul 491
104 Ülker Bisküvi Sanayi A.Ş. Biscuit production İstanbul 467
105 Pınar Süt Mamülleri Sanayi A.Ş. Milk and milk products and delicatessen goods production İzmir 465
117 Kent Gıda Maddeleri Sanayi ve Ticaret A.Ş. Candy production Kocaeli 427
120 Marsan Gıda San. ve Tic A.Ş. Margarine, pasta and beverages production Adana 421
149 Önem Gıda San. ve Tic. A.Ş. Food and beverages İstanbul 329
157 Biskot Bisküvi Gıda San. ve Tic. A.Ş. Biscuit Production Karaman 314
Source: Istanbul Chamber of Industry
14
2.4 Industry Developments in Turkey
As the global economic downturn comes to an end, consumer behavior will be shifting as well. According to
the Deloitte report entitled “Global Powers of the Consumer Products Industry 2010”, although the food and
beverage industry managed to perform well during the crisis, consumers were attracted to discounted products
with lower prices and avoided private labels, while the crisis environment made consumers more cautious and
more keen to seek quality in their purchases. Manufacturers are taking these changes into consideration.
Together with the recovery from the crisis, mergers and acquisitions are anticipated to increase globally in the
coming years. This also heightens attention to food safety, with the focus on growth in emerging markets.
According to BMI, the Turkish Government has announced the Ministry of Agriculture and Food will be re-
established taking into consideration food safety as one of its main concerns and enhancing the relationship
between the Turkish food and agriculture industries.

15
2.5 Positioning Map
The map below shows the production facilities of key players in the Turkish food & drink sector.
ÜLker Production capacity
chocolate 400 tons/day
Kent GıdaProduction capacity 40,000 tons/year
Yaşar HoldingProduction capacity
meat 48,000 tons/year
milk 350,000 tons/year
Drink companies
Food companies
Coca Cola CompanyProduction capacity
552 mn unit box/year
SütaşProduction capacity
2,500 tons/day
ÇaykurProduction capacity
29,800 kg/8 hours
EtiProduction capacity
80,300 tons/year
Anadolu EfesProduction capacity
881 mn litres/year
Türkiye Şeker Fab.Production capacity
sugar 2 million tons/year
Tat Konserve Sanayi Production capacity
Tomato Paste 100,000 tons/yearCanned vegetables 40,000 tons /year
Konya Şeker
Kayseri ŞekerProduction Capacity
sugar 12,000 tons/day
Oltan Gıda
Marsan Production Capacity
Margarine 200,000 tons/year
Pasta 80,000 tons/yearWater 180 million lt/year
CP StandartProduction capacity
Chicken 117,000 tons/year
AltınmarkaProduction capacity
63,000 tons/year

16
2.6 Investment Opportunities
The number of foreign companies operating in Turkey’s food and beverage sector increased from 376 in 2008
to 421 in 2009. Foreign direct investment reached a peak of USD 1.2 billion in 2008. Due to the effects of the
global financial crisis, FDI in the manufacturing sector registered a shrinkage of 58 percent in 2009 and of 83
percent in the food and beverage sector. 29
Figure 15 – Food and Beverage Sector Investment Data
Organic Food Industry
Organic agriculture started in 1985 with the production of İzmir grapes followed by figs and apricots. Organic
products are mainly produced in the Aegean region forming 39 percent of the total organic production followed
by the Black Sea region with 18 percent and Central Anatolia with 13 percent.30
Turkey exports almost all of its organic food production, with Europe occupying a dominant position as the
destination for 85 percent of the total organic food exports.31
With this strong demand from Europe and
ongoing reforms for promoting organic agriculture, Turkey has a potential to grow in the organic food industry.
Halal Food Industry
Being a Muslim country, Turkey also has potential to sustain growth from the “halal food” industry. According to
the World Halal Forum, the global halal food industry is expected to reach USD 650 billion in 2010.31
29 Undersecretariat of Treasury
30 ORGUDER (Organic Product Producers and Industrialists Association)
31 BMI
78 68
608
766
1,252
210
-
200
400
600
800
1,000
1,200
1,400
2004 2005 2006 2007 2008 2009
FDI in food & beverage sector (USD million)
Source: Undersecretariat of Treasury
39 43
38 38
45
257 300
338 376
421
-
50
100
150
200
250
300
350
400
450
2005 2006 2007 2008 2009
Number of companies with FDI in food & beverage sector
New Establishments
Total Number of Companies with Foreign CapitalSource: Undersecretariat of Treasury

17
Figure 16 – Selected M&A Transactions in the Turkish Food, Beverage & Tobacco Industry (2005-2010)
# Acquirer Origin Target Target subsector DateStake
(%)
Deal Value
(USD
million)FOOD
1 Altas Sirketler Grubu Turkey Ordu Yag Sanayi AS Agri processing/ cereals 30/01/2010 100.0% 33
2 Alliance Grain Traders Inc Canada Arbel Group Companies Agri processing/ cereals 16/07/2009 100.0% 134
3
Anadolu Efes Biracilik;
Sucocitrico Cutrale Ltd. Turkey;Brazil Etap Tarim ve Gida Urunleri Fresh produce,Soft beverages 07/01/2009 66.0% 25
4 FEM OGG Turkey Tekel Ayvalik Tuzlasi Food ingredients 23/09/2008 100.0% 6
5 Yildiz Holding AS Turkey Kerevitas Gida Sanayi ve Ticaret A.S.Frozen and chilled foods 17/09/2008 51.0% 17
6 Esas Holding AS Turkey Peyman Gida Food ingredients,Food-others 18/04/2008 30.0% 12
7 Fresh Cake Gida Turkey Doruk&Unmas Unlu Mamuller Baked goods,Baked goods 30/04/2008 50.0% 38
8 Afia International Saudi Arabia Yudum Food SA Food-others 14/01/2008 100.0% 71
9 Klueh Service Management Germany Emin Catering Food-others,Restaurants/Pubs 22/11/2007 51.0% 13
10 MGS Marmara Gida Turkey Gidasa SA Food ingredients,Soft beverages 15/08/2007 99.7% 174
11 Bulutoglu Gida ve Lojistik Turkey Yalova Soguk Hava Tesisleri Frozen and chilled foods 07/08/2007 100.0% 13
12 Cadbury Plc UK Intergum Gida Sanayi Ve Ticaret A/S Sugar and confectionery 28/09/2007 100.0% 450
13
Turkish Savings
Deposit Insurance Fund Turkey Sagra Dairy products,Food ingredients 07/06/2007 100.0% 104
14 Doruk Una Deger Katma GidaTurkey Unmas Unlu Mamuller Baked goods 18/08/2006 50.0% 18
15 Fromageries Bel SA France Karper Dairy products 28/02/2006 51.0% 16
16 Cadbury Plc UK Kent Gida Maddeleri Sugar and confectionery 10/04/2006 30.0% 94
17 Gidasa SA Turkey Marsa Food ingredients,Food-others 21/12/2005 49.0% 19
DRINKS & TOBACCO
18 Ihlas Holding AS Turkey Kristal Kola AS Soft beverages 19
19 Central Bottling Company Ltd Israel Turk Tuborg Bira ve Malt Sanayii AS Beer 15/09/2008 95.7% 167
20 British American Tobacco Plc UK TEKEL AS (Tobacco Business) Tobacco 24/06/2008 100.0% 1,720
21 Sarper Family Turkey Sarper Tutun Ticarper Ve Sanayi AS Wine/spirits 25/06/2007 50.0% 10
22 TPG Capital LP USA Mey Icki Sanayi ve Tic Wine/spirits 01/06/2006 90.0% 810
23 Coca Cola Icecek AS Turkey Efes Sinai Yatirim Holding AS Bottling/ canning,Soft beverages 02/12/2005 51.9% 305
Source: Mergermarket

18
2.7 SWOT Analysis
Strengths
With its young and growing population, both
consumption and production of food and beverage is
increasing in Turkey.
The Turkish food industry has important export
opportunities due to the diverse agricultural products
available in the country.
Being a developing country, the GDP per capita is
expected to increase in coming years which will also
have an increasing affect on consumer spending.
Opportunities
An interested young population is open to trying new
brands and products
Growth in the tourism sector also benefits consumption
in the food and beverage industry.
Since the market is still not mature, there are many
opportunities for new products to enter Turkey.
Weaknesses
The economically volatile environment affected by the
global economic crisis may hinder consumer spending
Low level of alcoholic drinks when compared with the
European countries due to Islamic traditions and the
high Special Consumption Tax on alcoholic drinks.
Threats
The unstable regulatory environment in agriculture also
affects the food industry.
High energy and raw material costs have a negative
affect on the food and beverage manufacturers’
performance.
Competition in the wine industry due to new wine
producers globally producing high quality and low priced
wines.
19
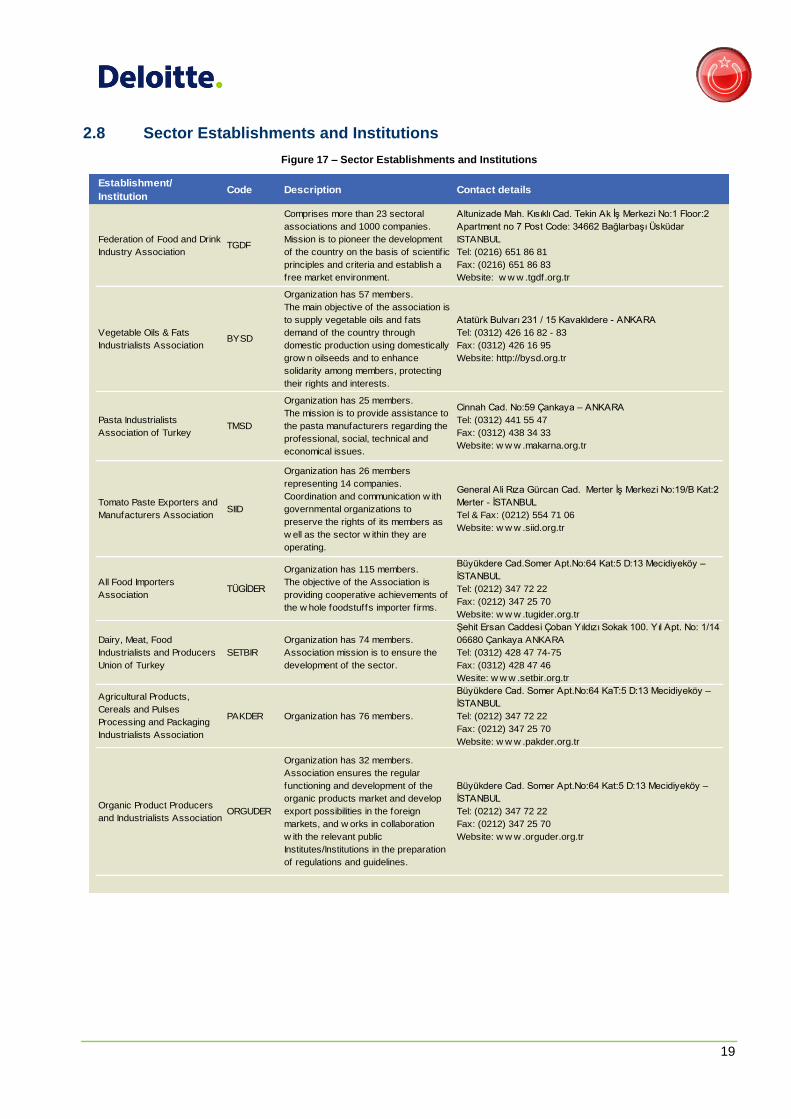
2.8 Sector Establishments and Institutions
Figure 17 – Sector Establishments and Institutions
Establishment/
InstitutionCode Description Contact details
Federation of Food and Drink
Industry AssociationTGDF
Comprises more than 23 sectoral
associations and 1000 companies.
Mission is to pioneer the development
of the country on the basis of scientif ic
principles and criteria and establish a
free market environment.
Altunizade Mah. Kısıklı Cad. Tekin Ak İş Merkezi No:1 Floor:2
Apartment no 7 Post Code: 34662 Bağlarbaşı Üsküdar
ISTANBUL
Tel: (0216) 651 86 81
Fax: (0216) 651 86 83
Website: w w w .tgdf.org.tr
Vegetable Oils & Fats
Industrialists AssociationBYSD
Organization has 57 members.
The main objective of the association is
to supply vegetable oils and fats
demand of the country through
domestic production using domestically
grow n oilseeds and to enhance
solidarity among members, protecting
their rights and interests.
Atatürk Bulvarı 231 / 15 Kavaklıdere - ANKARA
Tel: (0312) 426 16 82 - 83
Fax: (0312) 426 16 95
Website: http://bysd.org.tr
Pasta Industrialists
Association of TurkeyTMSD
Organization has 25 members.
The mission is to provide assistance to
the pasta manufacturers regarding the
professional, social, technical and
economical issues.
Cinnah Cad. No:59 Çankaya – ANKARA
Tel: (0312) 441 55 47
Fax: (0312) 438 34 33
Website: w w w .makarna.org.tr
Tomato Paste Exporters and
Manufacturers AssociationSIID
Organization has 26 members
representing 14 companies.
Coordination and communication w ith
governmental organizations to
preserve the rights of its members as
w ell as the sector w ithin they are
operating.
General Ali Rıza Gürcan Cad. Merter İş Merkezi No:19/B Kat:2
Merter - İSTANBUL
Tel & Fax: (0212) 554 71 06
Website: w w w .siid.org.tr
All Food Importers
AssociationTÜGİDER
Organization has 115 members.
The objective of the Association is
providing cooperative achievements of
the w hole foodstuffs importer f irms.
Büyükdere Cad.Somer Apt.No:64 Kat:5 D:13 Mecidiyeköy –
İSTANBUL
Tel: (0212) 347 72 22
Fax: (0212) 347 25 70
Website: w w w .tugider.org.tr
Dairy, Meat, Food
Industrialists and Producers
Union of Turkey
SETBIR
Organization has 74 members.
Association mission is to ensure the
development of the sector.
Şehit Ersan Caddesi Çoban Yıldızı Sokak 100. Yıl Apt. No: 1/14
06680 Çankaya ANKARA
Tel: (0312) 428 47 74-75
Fax: (0312) 428 47 46
Wesite: w w w .setbir.org.tr
Agricultural Products,
Cereals and Pulses
Processing and Packaging
Industrialists Association
PAKDER Organization has 76 members.
Büyükdere Cad. Somer Apt.No:64 KaT:5 D:13 Mecidiyeköy –
İSTANBUL
Tel: (0212) 347 72 22
Fax: (0212) 347 25 70
Website: w w w .pakder.org.tr
Organic Product Producers
and Industrialists AssociationORGUDER
Organization has 32 members.
Association ensures the regular
functioning and development of the
organic products market and develop
export possibilities in the foreign
markets, and w orks in collaboration
w ith the relevant public
Institutes/Institutions in the preparation
of regulations and guidelines.
Büyükdere Cad. Somer Apt.No:64 Kat:5 D:13 Mecidiyeköy –
İSTANBUL
Tel: (0212) 347 72 22
Fax: (0212) 347 25 70
Website: w w w .orguder.org.tr

20
LIST OF FIGURES
Figure 1 – Global Top Ten Food, Beverage and Tobacco Companies................................................................. 4
Figure 2 – Market Shares of World Food and Beverage Exports and Imports, 2007 ........................................... 5
Figure 3 - Food and Beverage Consumption per Capita in Turkey ....................................................................... 6
Figure 4 – Distribution of Companies by Sub-sector (2009) ................................................................................. 6
Figure 5 – Emerging Europe Food & Beverage Ratings ....................................................................................... 7
Figure 6 - Food and Beverage Sector Production Index ....................................................................................... 8
Figure 7 – Turkey Food Consumption Indicators .................................................................................................. 8
Figure 8 - Turkey Per Capita Food Consumption .................................................................................................. 9
Figure 9 – Beverage Sales in Turkey .................................................................................................................... 9
Figure 10 – Turkey Mass Grocery Retail Sales (2005-2014) .............................................................................. 11
Figure 11 – Turkey MGR Market Share (%) By Retailer ..................................................................................... 12
Figure 12 – Basic Financial Data of Public MGR Companies in Turkey ............................................................. 12
Figure 13 – Food and Beverage International Trade Statistics by Sub-Sector ................................................... 13
Figure 14 – Main Players in Turkey’s Food and Beverage Sector ...................................................................... 13
Figure 15 – Food and Beverage Sector Investment Data ................................................................................... 16
Figure 16 – Selected M&A Transactions in the Turkish Food, Beverage & Tobacco Industry (2005-2010) ...... 17
Figure 17 – Sector Establishments and Institutions ............................................................................................ 19

21
ABBREVIATIONS
BMI Business Monitor International
CAGR Compound Annual Growth Rate
EMEA Europe, Middle-East and Africa
ERP Enterprise Resource Planning
EU European Union
EUR Euro
GDP Gross Domestic Product
ISE Istanbul Stock Exchange
ISPAT Republic of Turkey Prime Ministry Investment Support and Promotion Agency
MGR Mass Grocery Retail
SME Small and Medium Enterprises
UK United Kingdom
US United States
USD US Dollars

22
Disclaimer
This Document is one of a series which has been assembled by the Republic of Turkey Prime Ministry Investment Support and Promotion
Agency (“ISPAT”) with the assistance of DRT Kurumsal Finans Danışmanlık Hizmetleri A.Ş. (“Deloitte”) for the sole purpose of giving
investors a sector synopsis of key priority growth sectors in Turkey.
This Document has been prepared for information purposes relating to this sector. This Document does not purport to be all-inclusive nor
to contain all the information that a prospective investor may require in deciding whether or not to invest in this sector. No representation
or warranty, express or implied, is or will be made in relation to the accuracy or completeness of this Document or any other written or oral
information made available to any prospective investor or its advisors in connection with any further investigation of the sector and no
responsibility or liability is or will be accepted by ISPAT or Deloitte or by any of their recipient or respective officers, employees or agents in
relation to it. Each of ISPAT and Deloitte and their respective subsidiaries and associated companies and their respective officers,
employees and agents expressly disclaims any and all liability which may be based on this Document or such information, and any errors
therein or omissions therefrom. The information contained herein was prepared based on publicly available information sources at the time
that this Document was prepared. In particular, no representation or warranty is given as to the achievement or reasonableness of future
projections, targets and estimates, if any. ISPAT and Deloitte have not verified any of the information in this Document. Recipients of this
Document are not to construe the contents of this Document as legal, business, tax or other advice. Any recipient or prospective investor
should not rely upon this Document in making any decision, investment or otherwise and is recommended to perform their own due
diligence and seek their own independent advice.
This Document does not constitute an offer or invitation for the sale or purchase of securities or any of the businesses or assets described
herein or to invest in the respective sector and does not constitute any form of commitment or recommendation on the part of ISPAT or
Deloitte or any of their respective subsidiaries or associated companies.
Neither ISPAT nor Deloitte accept any liability in relation to the distribution or possession of this Document in and from any jurisdiction and
neither ISPAT nor Deloitte shall be liable for any violation by the recipient of any such registration requirements or other legal restrictions.
Under no circumstances should this Document itself or any modified version be published or reproduced or sold by any third party in return
for a fee or membership. The intellectual property rights of this Document are owned by ISPAT.