food marketing to children and adolescents: what do parents think?
TRANSCRIPT

RuddReport
Food marketing to children and adolescents: What do parents think?
October, 2012
www.yaleruddcenter.org

2 Return to contents >
authors
Jennifer L. Harris, PhD, MBA
Frances Fleming Milici, PhD
Vishnudas Sarda, MBBS, MPH
Marlene B. Schwartz, PhD
acknowledgements
We would like to thank Barbara Hamill and Trisha Carr for their valuable assistance in creating and fielding the survey, and we are extremely grateful to Grant Olscamp for creating the data tables and Cathryn Dembek for helping prepare the report. We also thank Sarah DeLucia, Roberta Friedman, Carol Hazen, and Jennifer Pomeranz for their very helpful comments on earlier drafts.
Support for this project was provided by grants from the Robert Wood Johnson Foundation and the Rudd Foundation.

3 Return to contents >
TABLE OF CONTENTS
executive summary
introduction
results
Awareness of food marketing to children
Perceived impact of food marketing to children
Perceived environmental influences
Support for policies regarding food marketing to children
conclusions
Implications for policy makers and public health advocates
references
appendix a. methods
appendix B. taBles of results
5
7
11
12
14
16
18
21
24
27
30
34

4 Return to contents >
list of taBles
9 Table 1. Survey questions
10 Table 2. Comparison groups
11 Table 3. Sample characteristics
12 Table 4. Top places where children see/hear food marketing (after TV)
12 Table 5. Top foods and beverages in advertising that children see/hear
14 Table 6. Concerns about media’s effects on children
19 Table 7. Support for actions to promote healthy eating habits by political orientation
taBles of results
35 Table B1. Perceptions about the foods and beverages marketed most often
36 Table B2. Perceptions about the foods and beverages marketed least often
37 Table B3. Beliefs about the impact of food and beverage marketing
38 Table B4. Perceptions about the impact of different types of food and beverage marketing on children’s eating habits
39 Table B5. Changes in perceptions about the impact of food marketing (2009 to 2011)
40 Table B6. Perceived obstacles to ensuring healthy eating habits for children
41 Table B7. Perceptions about the negative influence of different institutions and individuals in promoting healthy eating habits
42 Table B8. Changes in perceived environmental influences (2009 to 2011)
43 Table B9. Support for actions to promote healthy eating habits to children
44 Table B10. Support for regulations to limit specific types of unhealthy food marketing to children under 12
45 Table B11. Changes in support for regulations (2009 – 2011)
list of figures
13 Figure 1. Categories of foods and beverages that children see advertised most often
15 Figure 2. Impact of food marketing on children by race/ethnicity
15 Figure 3. Impact of different types of food marketing on children by age of oldest child
16 Figure 4. Obstacles to ensuring healthy eating habits in children
17 Figure 5. Negative influence of different institutions on healthy eating
18 Figure 6. Support for actions to promote healthy eating habits
20 Figure 7. Increase in support for regulations to limit marketing of unhealthy foods to children under 12

5 Return to contents >
Parents have the consumer power
to insist that food and media
companies improve their youth-
targeted marketing practices and
the political power to demand
government action. This research
is the first to examine what
parents really think about food
marketing to their children.
Food marketing contributes to poor diet and obesity among youth, and public health experts believe that the obesity crisis cannot be resolved without dramatic changes in food marketing to children and adolescents. The food industry has responded to these concerns with self-regulatory pledges that have produced some small changes, but questionable improvement. Further, the federal government’s efforts to propose voluntary principles to guide companies have stalled due to industry opposition.
The Rudd Center for Food Policy & Obesity at Yale University conducted a survey of 2,454 parents with children ages 2-17 living at home in June-July of 2009, 2010, and 2011. An online panel of adults was used. The purpose was to assess parents’ attitudes about food marketing, including its reach and influence on children and adolescents. The survey also examined parents’ perceptions of possible environmental influences on their children’s eating habits and their support for policies to
Executive Summary
promote healthy eating habits in children. As a non-probability based panel was used for this survey, the findings are not representative of the entire U.S. population of parents of children 2-17 years old.
parents’ attitudes aBout environmental influences on children’s eating haBits
The surveyed parents ranked the food and beverage categories marketed most often to their children fairly accurately. Fast food restaurants, cereal, and soda/pop were at the top of their lists, while milk and fruits and vegetables were at the bottom. However, parents tended to underestimate the frequency of their children’s exposure to some highly advertised categories, such as other (i.e., not fast food) restaurants. They also overestimated the number of ads their children saw for the healthiest categories.
Parents were as concerned about junk food marketing to children as they were about alcohol and tobacco use in the media. The surveyed parents were highly aware of the “pester power” of food marketing and its effects on their children’s food preferences. They were less likely to agree that food marketing affects their children’s diet or the products they buy. Parents believed that TV commercials, in-store promotions, and cartoon characters on packages had the most impact on their children’s eating habits.
Surveyed parents perceived a number of environmental obstacles to ensuring healthy eating habits for their children, including the expense of healthy foods, easy access to unhealthy foods, unhealthy food advertising, and children’s media usage. In addition, 69% rated the media as a negative influence on their children’s eating habits, followed by the food industry (61%), and the government (55%). However, they attributed 60% of the cause of increased childhood obesity to personal responsibility and 40% to the unhealthy food environment.
Black and Hispanic parents were more likely to report that their children saw and heard advertising on a daily basis for most categories of food compared
Among parents surveyed, 69% rated the media as a negative influence on their children’s eating habits, followed by the food industry (61%), and the government (55%).

6 Return to contents >
Executive Summary
with non-Hispanic white parents. They also believed that food marketing has a greater impact on their children’s eating habits and perceived more obstacles to ensuring healthy eating habits for their children. Similarly, parents with at least one overweight child were more likely to report that their children saw advertising for most food categories, and to believe that it had an impact on their children’s eating habits, and to perceive a range of environmental obstacles to healthy eating by their children. There were fewer significant differences between parents based on other socio-demographic characteristics. Compared with parents of younger children, parents of adolescents tended to believe that their children saw daily marketing for more types of foods and felt that most specific types of food marketing affected their children more. They also perceived more environmental obstacles to ensuring healthy eating habits for their children.
Parents surveyed in 2011 were more likely to name internet marketing as one of the top-three places where their children see food marketing and more likely to name breakfast cereal as one of the most frequently advertised products. Parents’ perceptions of how much food marketing impacts their children’s eating habits increased for most types of marketing examined, as did their ratings of environmental obstacles to ensuring healthy eating habits. The percent of parents who indicated that the food industry, government, and local communities were a negative influence on their children’s eating habits was also higher in 2011 versus 2009.
support for policies to promote healthy eating
Among this sample of parents, there was broad support for nearly all proposed actions to promote healthy eating among children. Approval was highest for policies that would set nutrition standards for foods sold in schools (supported by 72-81% of parents) and policies that
would promote healthy eating in children’s media (70-73%). The majority of parents surveyed also endorsed policies to restrict food marketing to children, with highest support for prohibiting advertising on school buses (69%) and requiring companies to fund advertising for healthy and unhealthy foods equally (68%). Parents also approved of regulations to limit specific types of unhealthy food marketing to children under 12, including advertising/sponsorships in schools (65%), mobile marketing (65%), TV commercials (63%), viral marketing (62%), and internet advertising (61%).
Black and Hispanic parents were more supportive of the majority of actions to promote healthy eating habits and limit unhealthy food marketing to children than were white non-Hispanic parents. Parents of overweight children showed higher support than other parents for some, but not all, proposed policies. In many cases, parents were more supportive of policies to limit types of food marketing that were likely to disproportionately reach their own children. For example, middle- and higher-income parents and parents of adolescents expressed greater support for regulating marketing in digital media, and parents of preschoolers were more likely to support prohibiting all advertising on TV programs targeted to children under 8. Both conservative and liberal parents supported most of the policies examined, though liberal parents showed greater support for approximately half of the proposed actions.
From 2009 to 2011, support for one specific policy action increased: disallowing games or other child-oriented features on unhealthy food websites. Support also increased for regulations to limit more than half of specific types of unhealthy food marketing to children, including TV commercials and promotions in stores.
conclusions
In 2010, the White House called for key actors (food and beverage companies, restaurants, retailers, trade associations, media, government, and others) to create a “food marketing environment that supports, rather than undermines, the efforts of parents and other caregivers to encourage healthy eating among children and prevent obesity.”1 Parents in this survey perceived numerous environmental influences, including food marketing, that make it difficult for them to ensure healthy eating habits for their children. They also expressed broad support for limiting unhealthy food marketing and other policies to help them encourage their children to eat healthy. Policy makers, the public health community, and food and media companies have a significant opportunity to take action to improve the unhealthy food marketing environment that surrounds children and support parents in their efforts to raise healthy children.
Policy makers, the public health community, and food and media companies have a significant opportunity to take action and support parents’ efforts to raise healthy children.
Approval was highest for policies that would set nutrition standards for foods sold in schools (supported by 72-81% of parents) and policies that would promote healthy eating in children’s media (70-73%).

7 Return to contents >
Experts believe that public
health efforts to reduce obesity
rates cannot succeed without
substantial improvements in
the food marketing environment
that surrounds children and
adolescents,2-4 and that food
industry self-regulation is unlikely
to produce the meaningful change
required.5-6
Young people are surrounded by food marketing messages. In 2011, on TV alone, adolescents (12-17 years) viewed 16.2 food ads per day on average, and children (2-11 years) viewed 12.8 food ads per day.7 In 2006, food companies spent $1.6 billion on marketing to children and adolescents, with 46% of their youth-targeted marketing budgets dedicated to TV.8 In their zeal to create lifelong loyal customers, they have expanded youth-targeted marketing beyond TV advertising. Food companies also spent $195 million on youth-targeted marketing in stores, including product packaging (12% of the total); $186 million marketing in schools (11%); and $130 million on youth-targeted events and sports sponsorships (8%).9 In addition, they spent $77 million on youth-targeted digital marketing, including company-sponsored websites, advertising on third-party websites, and viral marketing.10 However, new forms of digital marketing have emerged since
Introduction
2006, including social media (e.g., Facebook, Twitter) and mobile marketing (e.g., branded smartphone apps, text messaging), and food companies have quickly adopted these techniques to target their messages to young people.11-14
The majority of food marketing that young people see or hear promotes calorie-dense nutrient-poor foods and beverages. On TV, 86% of food ads seen by children in 2009 were for products high in sugar, saturated fat, and/or sodium.15 Just four food categories (fast food restaurants, sugary cereals, other restaurants, and candy) made up 58% to 60% of TV food ads seen by children and adolescents. Other forms of food marketing, including branded advergames and promotions on product packages, promote primarily calorie-dense nutrient-poor foods.17-19 In contrast, food companies spent just $11 million marketing fruits and vegetables to youth in 2006 (<1% of the total).20 Substantial marketing of unhealthy food and beverages has helped to fuel poor diet and rising obesity rates among youth in the United States and around the world.21-22 Marketing increases young people’s preferences for advertised foods and their requests to parents (i.e., “pester power”). In addition, advertising increases their consumption of fast food, sugary drinks, and other frequently advertised food categories.23-25
To address concerns about the harmful effects of food advertising to children, the U.S. Council of Better Business Bureaus established the Children’s Food and Beverage Advertising Initiative (CFBAI) in 2006.26 As of mid-2012, 16 food companies have voluntarily pledged to market only healthier dietary choices in child-directed advertising. However, recent evaluations of food advertising to children on TV demonstrate little progress in reducing children’s exposure to advertising for unhealthy foods. From 2004 to 2011, children viewed just 8% fewer food, beverage and restaurant ads in total, while adolescents viewed 22% more ads.27 The nutritional quality of food advertising children see on TV improved slightly; in 2003, 94% of food ads seen by children promoted high-fat, sugar, or sodium products versus 86% in 2009.28 Similarly, 73% of food commercials during children’s programming in 2009 featured nutritionally-poor products, compared with 84% in 2005.29 From 2008 to 2011, cereal companies improved the overall nutritional quality of 13 out of 16 cereals advertised to children, but child-targeted cereals (such as Reese’s Puffs, Froot Loops and Cocoa Pebbles) still contain 57% more sugar, 52% less fiber and 50% more sodium than cereals advertised to adults.30

8 Return to contents >
In the United States, numerous limitations in the CFBAI substantially reduce its potential effectiveness, including insufficient nutrition standards to identify healthy foods that should be advertised to children; definitions of “child-directed advertising” that exclude advertising in media with large child audiences, as well as common forms of marketing to children (e.g., cartoon characters on product packaging, in-store promotions, and many in-school marketing programs); and defining children as 2- to 11-year-olds, with no limits on advertising to children 12 years and older. To address these limitations, experts from four U.S. government agencies (CDC, FTC, FDA and USDA) proposed principles for marketing foods to children that companies could voluntarily follow if they wished to help parents encourage their children to make healthier dietary choices.31 These principles received overwhelming support from the public health community, and the FTC received 28,000 positive write-in comments (vs. 1,000 comments in opposition).32 However, negative comments from food and beverage companies and industry groups, and the estimated $175 million these groups spent on federal lobbying from 2009, appeared to dampen the FTC’s desire to officially propose voluntary standards. In March 2012, the Commissioner of the FTC reported that the proposed standards were no longer an agency priority.33
But what do parents think about food marketing to their children? Parents purchase an estimated $58 billion in food and beverages annually.34 Parents also are important political constituents: 45% of families in the United States have children under 18 years old and 60 million U.S. adults live in households with their own children.35 If parents demand that food companies change their youth-targeted marketing practices or that government step in if companies do not improve voluntarily, food marketing to children would change.
puBlic attitudes aBout food marketing to youth
To begin to understand parents’ attitudes about food marketing, the Rudd Center conducted focus groups with parents in 2008.36 These groups indicated that parents generally are not aware of food marketing
and its negative impact on their children. However, when presented with examples of current food marketing practices (e.g., company-sponsored advergame websites, mobile game apps, Facebook pages) many concluded that food marketing to children must improve. Some parents supported government-imposed solutions and wanted to personally engage in actions to address the issue, but many parents also perceived potential barriers to the effective implementation of proposed solutions.
A few polls have assessed attitudes about food and beverage advertising as a contributor to childhood obesity. For example, in a study published in 2004, 41% of a nationally representative sample of adults believed that childhood obesity was a very serious problem, and the majority believed that junk food, fast food, TV viewing, and video games were significant contributors.37 In a 2004 ABC News/Time Magazine poll, 65% of adults agreed that marketing of sweets to children causes obesity.38 A 2007 Wall Street Journal/Harris Interactive poll found that 76% of parents agreed that food advertising directed towards children is a major contributor to rising rates of childhood obesity.39
Additional polls assessed public opinions about policies to reduce childhood obesity and found broad support for actions to reduce unhealthy food advertising to children. In 2004, 56% of adults supported a ban on advertising high-fat, high-sugar foods to kids.40 In 2007, 63% of parents agreed that popular characters from television and movies should not be used to market products to kids, and 45% agreed that all advertising to children under the age of 12 should be prohibited.41 In 2010, 66% of voters favored limiting how companies can advertise and market unhealthy foods and beverages to children, similar to what was done for smoking.42
Research also has examined factors that contribute to support for restrictions on marketing and other obesity-prevention policies. Among parents, greater awareness of the extent of food marketing to their children predicted perceptions that food marketing negatively impacted their children, which was highly correlated with support for restrictions on food marketing to children.43 Perceptions that social institutions (i.e., government, schools, and local communities) contribute to childhood obesity also predicted support for marketing restrictions. Similarly, beliefs that obesity is caused by too much advertising for unhealthy food and that manufacturers and marketers of unhealthy foods are responsible for addressing obesity were strongly correlated with support for price-related obesity-prevention policies.44 Beliefs about causes of the obesity crisis that place low blame on individuals (e.g., manipulation by the food industry, a toxic food environment) also predicted support for prohibiting high-fat, high-sugar food advertising on media watched primarily by children.45
Introduction

9 Return to contents >
Nonetheless, most adults continue to believe that individuals are responsible for solving the obesity problem. For example, 91% think that parents have a lot of responsibility for reducing childhood obesity, compared with 32% who think that food companies have a lot of responsibility.46 Most also agree that individuals in their choice of diet and lack of exercise are responsible for addressing the obesity problem (3.96 on a scale of 1 to 4), compared with much lower agreement that marketers and manufacturers of unhealthy foods are responsible (2.80 and 2.75).47
Although few empirical studies have directly examined what parents think about food marketing to their children, these previous findings indicate that parents are generally supportive of a variety of policies to restrict food marketing to children. 48-50 However, they also suggest that parents are not aware of the extent of unhealthy food marketing and its negative impact on their children and that many fail to recognize how environmental factors (including food marketing) contribute to the problem of childhood obesity.51-53
Survey of parents’ attitudes about
food marketing to their children
Since 2008, The Rudd Center for Food Policy & Obesity at Yale University has conducted an annual survey to assess attitudes about food marketing to children, beliefs about environmental factors affecting children’s eating habits, and support for policy actions to encourage healthy eating for young people and reduce unhealthy food marketing to children. In 2009, we published the results of our 2008 pilot survey.54 This report presents the findings from parents surveyed in 2009, 2010, and 2011.
taBle 1. survey questions
Questions Response options
Awareness of food marketing
Top 3 places where children see or hear marketing for food and beverages
Open-ended
Top 3 types of food and beverages children see being marketed
Open-ended
How often children see or hear marketing for different kinds of food and beverages
Daily, weekly, several times a month, once a month or less
Perceived impact of food marketing
Concern about potential effects of media on children Scale (1=not concerned at all, 10=extremely concerned)
Agreement with statements about the potential impact of food and beverage marketing to children
Scale (1=strongly disagree, 10=strongly agree)
Level of impact that different types of food and beverage marketing have on children’s eating habits
Scale (1=no impact at all, 10=very strong impact)
Perceived environmental influences
Proportion of increased obesity rates among children due to personal responsibility (individual parents or children) versus unhealthy food environment (school food, advertising, fast food restaurants, expense of healthy food, etc.)
Sliding scale (allocate 10 points in total)
Influence of different institutions and people on children’s eating habits
Scale (1=very bad influence, 10=very good influence)
Obstacles to ensuring that children have healthy eating habits
Scale (1=not at all an obstacle, 10= very much an obstacle)
Support for policy actions
Support for actions to promote healthy eating habits to children
Scale (1=definitely would oppose, 10=definitely would support)
Support for regulations to limit specific types of marketing of unhealthy foods to children under 12
Scale (1=definitely would oppose, 10=definitely would support)
Introduction

10 Return to contents >
taBle 2. comparison groups
Socio-demographic categories Definition
Race/ethnicity White Parent identified self as Caucasian only (non-Hispanic).
Black Parent identified self as African-American, including those who also identified as another race or ethnicity.
Hispanic Parent identified self as Latino/Hispanic, but not African-American, Asian, or other.
Overweight or obese child Parents of one or more children with a BMI-for-age in the 85th percentile or higher, according to the CDC growth charts. BMI-for-age was calculated for each child using parents’ reports of their children’s gender, age, height, and weight.
Age of oldest child Age of the oldest child between the ages of 2 and 17 living at home reported by the parent. Grouped by 2-5 years, 6-11 years, and 12-17 years.
Household income Annual household income reported by the parent. Grouped by lower- ($15,000-39,999), middle- ($40,000-74,999), and higher-income ($75,000+).
Political orientation Parent’s reported political orientation on a scale of 1 (strongly liberal) to 7 (strongly conservative). Grouped by liberal (1-3), middle-of-the-road (4), and conservative (5-7).
Parent’s gender Reported by parent.
The online survey was conducted during June-July of 2009, 2010, and 2011 using an online panel of adults. Respondents included parents with children 2-17 years old living at home and non-parents who have responsibility for decisions regarding food and beverage choices in their households. This report presents the results of the parent sample. The results also compare responses between individuals in different socio-demographic categories. Quotas were established for gender, income groups, and black and Hispanic parents to enable comparisons between groups. The sampling procedures, sample size, data collection period, and most measures remained consistent over the three years to assess changes over time. A non-probability based panel was used for this survey. Therefore, the findings are not representative of the entire U.S. population of parents of children 2-17 years old. The results were not weighted to adjust for oversampling of some demographic groups (e.g., female, Hispanic, and black parents). Appendix A provides detailed information about the sampling methods and survey instrument.
Table 1 summarizes the questions that respondents answered in four topic areas: awareness of food marketing, perceived impact of food marketing, perceived environmental influences on childhood obesity and healthy eating, and support for policy actions. Table 2 provides definitions of the socio-demographic characteristics used for between-group comparisons, including race/ethnicity of parents, characteristics of their children (overweight/obese and age), and other socio-demographic characteristics (household income, parents’ political orientation, and parents’ gender).
Introduction
11 Return to contents >
Since 2008, The Rudd Center for
Food Policy & Obesity at Yale
University has conducted an
annual survey to assess attitudes
about food marketing, beliefs
about environmental factors
affecting children’s eating habits,
and support for policy actions
to encourage healthy eating and
reduce unhealthy food marketing
to young people. This report
presents the findings from parents
surveyed in 2009, 2010, and 2011.
The total sample included 2,454 participants who had children between the ages of 2 and 17 living at home and were involved in decisions about food and beverage choices for their household (70% female), approximately 800 parents responded to the survey each year. On average, parents in the sample were 39 years old, and 66% reported being married. Parents averaged two children living at home: 40% had at least one child ages 2 to 5; 42% had at least one child ages 6 to 11; and 52% had at least one child ages 12 to 17. Their average household income was $59,000, and 76% had some college education.
Results
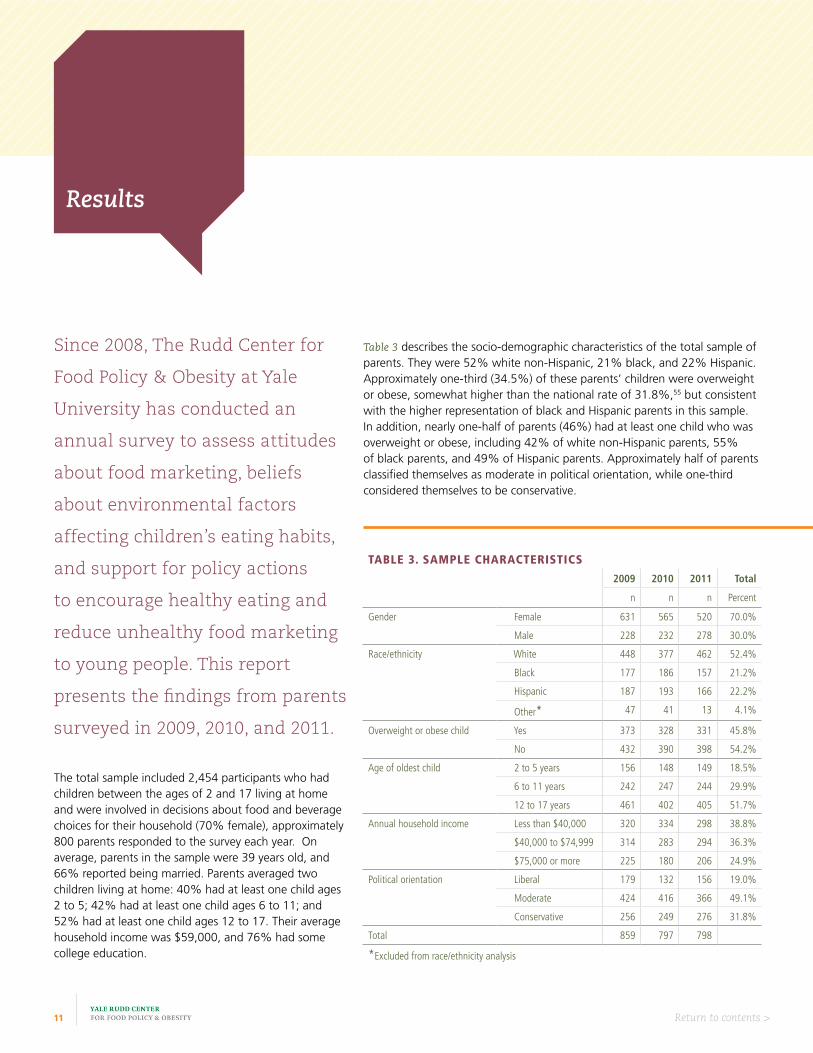
Table 3 describes the socio-demographic characteristics of the total sample of parents. They were 52% white non-Hispanic, 21% black, and 22% Hispanic. Approximately one-third (34.5%) of these parents’ children were overweight or obese, somewhat higher than the national rate of 31.8%,55 but consistent with the higher representation of black and Hispanic parents in this sample. In addition, nearly one-half of parents (46%) had at least one child who was overweight or obese, including 42% of white non-Hispanic parents, 55% of black parents, and 49% of Hispanic parents. Approximately half of parents classified themselves as moderate in political orientation, while one-third considered themselves to be conservative.
taBle 3. sample characteristics
2009 2010 2011 Total
n n n Percent
Gender Female 631 565 520 70.0%
Male 228 232 278 30.0%
Race/ethnicity White 448 377 462 52.4%
Black 177 186 157 21.2%
Hispanic 187 193 166 22.2%
Other* 47 41 13 4.1%
Overweight or obese child Yes 373 328 331 45.8%
No 432 390 398 54.2%
Age of oldest child 2 to 5 years 156 148 149 18.5%
6 to 11 years 242 247 244 29.9%
12 to 17 years 461 402 405 51.7%
Annual household income Less than $40,000 320 334 298 38.8%
$40,000 to $74,999 314 283 294 36.3%
$75,000 or more 225 180 206 24.9%
Political orientation Liberal 179 132 156 19.0%
Moderate 424 416 366 49.1%
Conservative 256 249 276 31.8%
Total 859 797 798
*Excluded from race/ethnicity analysis

12 Return to contents >
The following sections highlight our findings regarding, 1) parents’ awareness of food marketing that their children see and hear; 2) their concern about the impact of food marketing on their children; 3) perceived environmental influences on childhood obesity and their own children’s eating habits; 4) parents’ support for a range of public policies related to nutrition and food marketing; and 5) changes from 2009 to 2011. Results tables (see Appendix B) present responses to all survey measures for the total sample and for each of the socio-demographic groups examined, as well as significant differences between groups and over time.
Awareness of food
marketing to children
When asked to name the top three places (other than TV) where their children saw or heard food marketing in the past month, parents listed the internet, radio, stores, billboards and magazines most often (see Table 4). Radio topped the list in 2009, but the internet moved to the top in 2010 and 2011. Billboards, stores, and magazines were mentioned by 23% to 34% of parents. Parents also named the top three types of food and beverages in marketing that their children have seen in the past month (see Table 5). Juice/fruit drinks and fast food topped the list in 2009, but fast food was mentioned
taBle 4. top places where children see/hear food marketing (after tv)
(% of parents mentioning on a voluntary basis)
2009 2010 2011
Internet 30% 32% 37%
Radio 42% 30% 34%
Billboards 28% 27% 32%
In stores 34% 31% 33%
Magazines 23% 23% 23%
Significant change versus 2009 (p<.05)
taBle 5. top foods and Beverages in advertising that children see or hear
(% of parents mentioning on a voluntary basis)
2009 2010 2011
Fast food 42% 44% 41%
Soda/pop 35% 27% 35%
Juice/fruit drinks 42% 41% 37%
Cereal 27% 24% 29%*
Desserts 19% 21% 24%
Significant change versus 2009 (p<.05)
*versus 2010
most frequently in 2010 and 2011. Soda/pop also ranked in the top three all three years. In 2011 the percentage of parents mentioning juice/fruit drinks declined, while cereal mentions increased. Desserts were also among the most frequently mentioned categories all three years.
Table B1 (see Appendix B) presents the percent of parents who believed their children saw or heard marketing for specific foods and beverages at least once per day during the past month. Similar to the open-ended responses, fast food, cereal, and soda/pop were in the top tier with 50% or more of parents believing their children saw marketing for these products daily. Sports drinks, candy, cookies/crackers, potato chips/salty snacks, and fruit drinks comprised the second tier, with 35% or more of parents reporting daily exposure. Parents were least likely to report that their children saw marketing for milk and fruits and vegetables daily. Table B2 (see Appendix B) lists the food and beverage products that parents believed their children saw or heard marketed the least. More than half of the parents surveyed reported that their children saw advertising for fruits and vegetables less than once per week. In addition, 35% or more of parents reported that their children saw marketing for milk, bottled water, energy drinks, other (i.e., not fast food) restaurants, fruit snacks, and prepared foods/meals less than once per week.
differences By socio-demographic categories
Race/ethnicity. Differences were found between white non-Hispanic, black, and Hispanic parents in perceptions of food and beverage marketing their children saw or heard most often in the past month. Black parents as compared to white parents believed their children saw or heard significantly more marketing for all food and beverage categories (see Figure 1). In almost all cases, Hispanic parents also reported that their children saw significantly
Results

13 Return to contents >
FIGURE 1. CATEGORIES OF FOODS AND BEVERAGES THAT CHILDREN SEE ADVERTISED MOST OFTEN (% of parents reporting that their children see/hear ads for these foods at least once per day)
0%
10%
20%
30%
40%
50%
60%
70%
80%
Fast food Cereal Soda/pop Sports drinks Candy Cookies/crackers Potato chips/saltysnacks
Fruit drinks
% of parents
White
Black
Hispanic
* Significantly higher (p < .05)
% o
f par
ents
more marketing than white parents reported, but somewhat less than black parents. The order of most- to least-advertised food and beverages was similar across race and ethnicity with the exception of fruit drinks, which ranked fourth highest in daily advertising exposure for black and Hispanic parents, but tenth for white parents.
When asked about food and beverage categories that their children saw marketed infrequently, white parents were more likely than black and Hispanic parents to think that their children saw or heard marketing for fruits and vegetables, milk, and bottled water less than once per week. Approximately 60% of both black and white parents reported that their children saw energy drink ads less than once a week.
Parents of overweight children. Significantly more parents with at least one overweight or obese child, as compared to other parents, believed that their children saw advertising for most categories of food and beverages at least once a day. Although there were no differences according to their children’s weight status for the two most frequently advertised product categories (i.e., fast food restaurants and cereal), parents of
overweight children were less likely to report that their children infrequently saw marketing for healthier food categories.
Age of oldest child. Parents of older children were more likely to report that their children saw daily marketing for most food and beverage categories. As the age of the oldest child in the household increased, the percent of parents who reported daily exposure to advertising for fast food, soda/pop, energy drinks, and other restaurants increased. However, no significant differences were found by age of oldest child for some products, including fruit drinks, yogurt, 100% juice, and fruit snacks. Even parents of preschoolers believed their children saw daily marketing for some categories: 50% or more reported daily exposure to fast food and cereal marketing; 41% reported daily exposure to fruit drinks; and 36% reported daily exposure to soda/pop marketing.
Other socio-demographic characteristics. For most food categories, parents in lower-income households were more likely to report that their children saw marketing on a daily basis than parents at higher income levels. When examining political orientation, more moderate parents (vs. liberal and conservative parents) reported that their children saw or heard daily marketing for approximately one-half of food categories. There were few differences in perceptions of children’s exposure to marketing by parents’ gender. However, more fathers than mothers reported daily exposure to marketing for soda, candy, and energy drinks, while more mothers reported that their children received daily exposure to yogurt advertising.
Results

14 Return to contents >
changes over time
There were few changes in parents’ awareness of food marketing to their children from 2009 to 2011, with a few exceptions. Parents reporting daily exposure to marketing for energy drinks went down from 38% in 2009 to 31% in 2011, and daily exposure to prepared foods/meals marketing decreased from 34% to 29%. More parents reported that their children viewed marketing for ice cream/frozen desserts every day in 2011 (34%) versus 2009 (31%).
Perceived impact of food
marketing to children
The parents in this survey expressed moderate concern about most youth-oriented media issues evaluated (6.6 to 7.9 on a 10-point scale) (see Table 6). Parents were most concerned about sexual permissiveness, materialism, violence, and thin models in the media. However, marketing and food-related issues ranked in the middle of the list, including media’s influence on encouraging children to want/buy products (#5),
marketing junk food to children (#7), and encouraging bad eating habits (#8). Use of alcohol and tobacco ranked sixth and ninth.
Table B3 (see Appendix B) presents parents’ agreement with statements about how food marketing affects their children. Parents expressed moderate agreement with all statements provided (6.0 to 8.2 on a 10-point scale). They were most likely to agree that food marketing encourages children to ask parents for advertised foods and beverages, affects everyone, and increases preferences for the types of foods advertised. There was also fairly high agreement that food marketing promotes unhealthy foods, encourages snacking, leads to food cravings, and creates eating habits for life. Agreement that food marketing causes children to eat more, encourages large portions, and affects what you buy for your children were lowest. When asked to rate the impact of different types of beverage and marketing on their children’s eating habits, TV commercials were rated the highest (7.4 overall), followed by promotions in stores and cartoon characters on packages (6.2 to 6.4), while mobile marketing, viral marketing, social media, and internet/banner ads were considered to have low impact (3.3 to 4.4) (see Table B4, Appendix B).
differences By socio-demographic characteristics
Race/ethnicity. As evidenced by higher scores for most statements (see Figure 2), black and Hispanic parents perceived food marketing to have a greater impact on their children compared with white non-Hispanic parents. They also rated the impact of all specific types of marketing higher, with the exception of TV commercials.
Parents of overweight children. Parents with overweight children expressed higher agreement than other parents with approximately half of statements about how food marketing affects their children, including food marketing encourages snacking between meals, creates eating habits for life, makes parents’ jobs harder, causes children to eat more, encourages large portions, and affects what you buy for your children. Parents of overweight children also rated the impact of specific types of food marketing on their children’s eating habits higher than other parents. However, there were two exceptions: parents with overweight children perceived less impact from cartoon characters on packages and advergames.
Age of oldest child. No differences were found between parents of older and younger children in their agreement with statements about how food marketing impacts their children. However, parents of children and adolescents perceived that most types of food marketing had a greater impact on their children’s eating habits than did parents of preschoolers (see Figure 3). Some of the biggest differences were found for sponsorships, social media, viral marketing, and mobile marketing. There were two notable exceptions: parents of preschoolers and children believed that cartoon characters on
taBle 6. concerns aBout media's effects on children
(1=not concerned at all, 10=extremely concerned)
2009 2010 2011
Sexual permissiveness 7.9 7.7 7.8
Materialism 7.7 7.6 7.6
Violence 7.8 7.5 7.5
Too-thin models 7.5 7.3 7.5
Encourages children to want/buy products 7.3 7.3 7.4
Alcohol use 7.2 7.1 7.3
Marketing junk food to children 7.2 7.1 7.2
Encourages bad eating habits 7.1 7.1 7.2
Tobacco use 7.1 6.9 7.1
Gender stereotypes 6.8 6.7 6.8
Marketing in general 6.6 6.8 6.6
Racial/ethnic stereotypes 6.6 6.6 6.6
Results

15 Return to contents >
packages had a greater impact, and parents of 6- to 11-year-olds believed that toys/giveaways had a greater impact.
Political orientation. Liberal parents reported higher agreement than moderate or conservative parents with most statements about how food marketing affects their children. However, conservative parents were more concerned about the impact of food company websites,
sponsorships, and social media on their children’s eating habits than liberal parents, and both conservative and moderate parents were more concerned about the impact of viral and mobile marketing.
Other socio-demographic characteristics. There were no significant differences by household income in parents’ agreement with statements about the effects of food marketing on their children or the impact of specific types of food marketing. Mothers were more likely to agree that food marketing encourages children to ask parents for advertised foods,
FIGURE 2. IMPACT OF FOOD MARKETING ON CHILDREN BY RACE/ETHNICITY (1=strongly disagree, 10=strongly agree)
Mea
n ag
reem
ent
* Significantly higher (p < .05)
5
5.5
6
6.5
7
7.5
8
8.5
Encourages children to pester parents
Increases foodpreferences
Promotes unhealthy
foods
Encourages snacking
between meals
Creates eating habits for life
Makes parents job harder
Causes children to eat more
Affects yourpurchases
White
Black
Hispanic
Results
2
3
4
5
6
7
8
FIGURE 3. IMPACT OF DIFFERENT TYPES OF FOOD MARKETING ON CHILDREN BY AGE OF OLDEST CHILD(1=no impact, 10=strong impact)
Mea
n pe
rcei
ved
impa
ct
* Significantly higher (p < .05)
2-5 years
6-11 years
12-17 years
TV commercials
Promotionsin stores
Cartoon characters
Moviecommercials
Toys/giveaways
Sponsorships Internet ads Social media Viralmarketing
Mobilemarketing

16 Return to contents >
affects everyone, and leads to food cravings; but fathers were more concerned about the impact of specific types of marketing on their children, including product placements, food/beverage logos on other products, advertising in schools, and celebrity endorsements.
changes over time
From 2009 to 2011, parents’ ratings of the impact of most specific types of marketing increased. Perceived impact of the lowest rated type of marketing (mobile marketing) increased from 2.9 in 2009 to 3.7 in 2011, and perceived impact of promotions in stores (the highest rated type of marketing other than TV) increased from 6.2 to 6.8. The only types of marketing that parents did not rate significantly higher in impact in 2011 versus 2009 were TV commercials and cartoon characters on packages, which were among the types of marketing with the highest perceived impact all three years. Parents’ agreement that food marketing encourages large portions also was higher in 2011, but there were no other significant changes in parents’ agreement with statements about how food marketing affects their children.
Perceived environmental influences
When asked to attribute responsibility for the increase in obesity rates among children, parents assigned 60% of the blame to personal responsibility and 40% to the unhealthy food environment (such as school food, advertising, and too many fast food restaurants). This 60/40 attribution was consistent across race and ethnicity, age of oldest child, household income, political orientation, gender, and year. However, parents with overweight children attributed higher responsibility to the unhealthy food environment (43%).
Parents perceived many obstacles to ensuring healthy eating habits for their children (see Figure 4 and Table B6, Appendix B). The top perceived obstacles included expense (of healthy food and organic food), easy access (fast food restaurants, prevalence of snack/junk foods, unhealthy food in schools, vending machines), children’s media usage, and unhealthy food advertising. Parents in this sample rated these obstacles from 5.4 to 7.3 (on a 10-point scale). They also perceived themselves to be an obstacle by giving in to their children’s requests for healthy food and being poor role models with their own eating habits (rated 5.6 to 6.2). More than 60% of parents overall believed that the media and the food industry have a negative influence on their children’s eating habits, and more than 50% reported that their children’s peers and government have a negative influence (see Table B7, Appendix B). Just 32% reported that schools have a negative influence and local communities were rated negatively by 42%.
FIGURE 4. OBSTACLES TO ENSURING HEALTHY EATING HABITS IN CHILDREN(1=not at all an obstacle, 10=very much an obstacle)
Mea
n ra
ting
5
5.5
6
6.5
7
7.5
Expense ofhealthy foods
Fast foodrestaurants
Prevalence ofjunk food
Too muchTV/computer
Unhealthyfood ads
Unhealthyfood in schools
Giving in tochildren
Vendingmachines
Eating out
Mean rating
Results

17 Return to contents >
FIGURE 5. NEGATIVE INFLUENCE OF DIFFERENT INSTITUTIONS ON HEALTHY EATING BY RACE/ETHINITIY(% of parents rating institution as a negative influence)
* Significantly higher (p < .05)
0%
10%
20%
30%40%
50%
60%
70%
80%
Media
% o
f par
ents
Food industry Government Local communities Schools
% of parents
WhitesBlacksHispanics
differences By socio-demographic characteristics
Race/ethnicity. Black and Hispanic parents perceive more obstacles to ensuring healthy eating habits for their children. With the exception of expense and not enough time for family meals, black and Hispanic parents rated all potential obstacles higher than white non-Hispanic parents rated them. In addition, black and Hispanic parents rated 13 of 16 obstacles at 6.0 or higher (out of 10), while white parents only rated one-third of obstacles at 6.0 or higher. However, white parents were more likely to indicate that institutions had a negative influence on their children’s eating habits, including media, government, and local communities (see Figure 5). Although the percentage is small, significantly fewer Hispanic parents reported themselves to be a negative influence on their children’s eating habits.
Child characteristics. Parents of overweight children rated the majority of potential obstacles to healthy eating higher than other parents rated them. Significantly more parents of overweight children also perceived the media to be a negative influence on their children’s healthy eating habits, although no other significant differences versus other parents were found in their negative ratings of institutions or individuals. The age of their oldest child was also related to parents’ perception of obstacles to healthy eating. Parents of adolescents were more likely
to perceive obstacles related to unhealthy food access (i.e., prevalence of junk food, school foods, eating out of house, vending machines), media usage, and peer pressure as compared to parents of younger children. Parents with younger children were more likely to perceive themselves to be a negative influence on their children’s eating habits.
Household income. The expense of organic and healthy foods was rated significantly higher as an obstacle to healthy eating by lower- and middle-income parents. Lower-income parents also rated their own behavior, such as giving in to their children’s requests and being a poor role model, as more of an obstacle, and saw themselves and their families as more of a negative influence on their children’s healthy eating habits. Lower-income parents also perceived the prevalence of vending machines and the lack of community programs as greater obstacles to their children’s healthy eating. No differences by income were found in perceived negative influence of the media or the food industry, but lower- and middle-income parents rated the negative influence of the government and their local community higher than did higher-income parents.
Other socio-demographic characteristics. There were few differences in perceived obstacles to ensuring healthy eating between parents of different political orientations, but a higher percentage of liberal parents perceived the media and food industry to be a negative influence on their children. Moderate parents also perceived the government to be more of a negative influence than did liberal parents. Mothers were more likely to perceive the expense of healthy and organic food to be an obstacle, while fathers perceived eating out of the house and peer pressure to be greater obstacles. Mothers and fathers did not differ in their ratings of different institutions as a negative influence.
Results

18 Return to contents >
FIGURE 6. SUPPORT FOR ACTIONS TO PROMOTE HEALTHY EATING HABITS
% of parents
19%
19%
20%
19%
19%
19%
20%
15%
19%
17%
19%
15%
17%
37%
38%
39%
40%
41%
45%
48%
54%
51%
55%
54%
62%
64%
0% 10% 20% 30% 40% 50% 60% 70% 80% 90% 100%
No games/child-oriented features on unhealthy food websites
No ads on TV programs for children under 8
Cartoon characters only on packages for healthy foods
Toys with kids' meals only when meals meet healthy criteria
Only healthy food ads on TV programs for youth under 18
Only healthy food ads on TV programs for children under 12
Companies must fund equal amounts of healthy and unhealthy ads
Do not allow ads on school buses
Children's media companies must fund PSAs for fruits and vegetables
Only healthy foods in school vending machines
Require children's TV programs to show physical activity and healthy eating
Strengthen nutrition standards for all school foods
Strengthen nutrition standards for school lunches
Oppose (1-5)
Support (6-7)
Strongly support (8-10)
changes over time
Table B8 (see Appendix B) shows that parents’ ratings of more than half of obstacles increased from 2009 to 2011, including the expense of healthy foods, unhealthy food advertising, unhealthy food sold in schools, and not enough community programs. There was also an increase in the percent of parents who rated the food industry, government, and local communities as a negative influence in promoting healthy eating habits.
Support for policies regarding food
marketing to children
The majority of parents surveyed supported nearly all policy-related actions that are currently being taken or could be taken to promote healthy eating habits among children (see Appendix Table 9 and Figure 6). Three school-related food policies were supported by more than 72% of parents: stronger nutrition standards for school lunches, stronger nutrition standards for all foods and beverages sold at schools, and only allowing
healthy foods in school vending machines. There was also high support for policies promoting healthy habits to children in the media, including requiring children’s TV programs to show children being physically active and eating healthy food and requiring media companies to fund public service announcements that promote fruits and vegetables. Actions that required TV advertising to promote healthy foods were supported by 60% or more of parents surveyed, and 57% of parents supported no TV advertising at all to children under 8. Two-thirds of parents surveyed favored not allowing advertising on school buses, while support for regulating other types of marketing to children (games on unhealthy food websites, product packaging, and toy giveaways) was somewhat lower.
As shown in Table B10 (see Appendix B), more than 50% of parents surveyed also supported regulations to limit all specific types of marketing for unhealthy foods to children under 12. Support for limiting advertising/sponsorships in schools ranked at the top with 65% of parents supporting such regulations. Many newer forms of marketing were also in the top-five of parent support, with regulations to limit mobile, viral, and internet marketing at #2, #4, and #5, respectively. TV commercials came in third with 63% of parents supporting limiting unhealthy foods in TV advertising to children. In addition, 56% to 59% of parents surveyed supported regulations to limit unhealthy food marketing to children in commercials before movies, advergames, product placements, cartoon characters on packages, social media, and toys/giveaways.
Results

19 Return to contents >
differences By socio-demographic characteristics
Race/ethnicity. Black and Hispanic parents were more supportive than white non-Hispanic parents of all but one of the proposed actions to promote healthy eating among children. However, white parents were significantly more likely to favor prohibiting advertising on school buses. Black and Hispanic parents also were more supportive of most regulations limiting specific types of marketing. However, there were no differences by race or ethnicity in parents’ support for regulations to limit marketing to children in schools or several digital forms of marketing (i.e., mobile, viral, internet, and social marketing). Black and Hispanic parents had the highest support for limiting unhealthy foods in TV commercials, advertising in schools, and mobile marketing.
Parents of overweight children. Parents of overweight children expressed higher support for regulating non-television forms of marketing, including cartoon characters on food packaging, toy giveaways with kids’ meals, and child-oriented features on unhealthy food websites. They also were more likely to support requiring companies to fund equal amounts of healthy and unhealthy food advertising. Similarly, parents of overweight children showed stronger support for regulations to limit specific types of non-television marketing, including advergames, cartoon characters on packages, logos on other products, websites, and sponsorships.
Age of oldest child. There were some differences in support for policies by age of parents’ oldest child. Parents of children ages 6-11 were more supportive of regulating school vending machines, while parents of 2- to 5-year-olds expressed more support for only allowing healthy food advertising on children’s TV and not allowing any advertising on TV programs for children under 8. Parents of adolescents expressed greater support for regulations limiting digital marketing (i.e., mobile, viral, internet, and social media
taBle 7. support for actions to promote healthy eating haBits By political orientation
Political orientation
Liberals Moderates Conservatives
School food environment Percent Percent Percent
1 Strengthen nutrition standards for school lunches 87% 80% 79%
2 Strengthen nutrition standards for all school foods 84% 77% 76%
4 Allow only healthy foods in school vending machines 76% 73% 69%
15 Allow only non-food rewards in classrooms 58% 54% 54%
17 Do not allow flavored milk in schools 44% 41% 44%
Promote healthy eating in the media
3 Require children's TV programs to show physical activity and healthy eating 75% 74% 69%
6 Require children's media companies to fund PSAs for fruits and vegetables 71% 72% 65%
Require that TV advertising to children promotes healthy foods
8 Require companies to fund equal amounts of healthy and unhealthy advertising 72% 69% 63%
9 Allow only healthy food ads on TV programs targeting children under 12 68% 66% 62%
10 Allow only healthy fiid ads on TV programs targeting youth under 18 62% 60% 59%
13 Do not allow any advertising on TV programs targeting children under 8 60% 57% 56%
Restrictions on other types of marketing
7 Do not allow advertising on school buses 72% 70% 65%
11 Allow cartoon characters only on packages for healthy foods 60% 60% 57%
12 Allow toys with kids' meals only when meals meet healthy criteria 62% 63% 52%
14 Do not allow games/child-oriented features on unhealthy food websites 54% 58% 55%
Significantly higher (p < .05)
Results

20 Return to contents >
marketing), and parents of 6- to 11-year-olds were more supportive of regulating cartoon characters on packages.
Political orientation. As Table 7 shows, the majority of parents, regardless of political orientation, supported most proposed actions to promote healthy eating. However, liberal parents were more likely to support about half of these actions compared with conservative parents. Moderate parents also were more likely than conservative parents to support policies to promote healthy eating in the media, require companies to fund equal amounts of advertising for healthy and unhealthy foods, and require kids’ meals with toys to meet healthy criteria. On the other hand, there were few differences by political orientation in support for limiting specific types of marketing. Liberal parents were more likely than moderate parents but not conservative parents to support limits on mobile and viral marketing, but moderate and conservative parents were more likely to support limiting promotions in stores.
Other socio-demographic characteristics. Mothers showed more support for most policy actions to promote healthy eating habits for their children, but there were no significant differences between mothers’ and fathers’ support for regulations to limit specific types of marketing. There were few differences by household income in support for policy actions to promote healthy eating. However, higher-income parents were more likely to support regulating advertising/sponsorships in schools and digital marketing (60% to 70%). Higher-income parents also were more supportive of limiting viral marketing, internet advertising, and advergames, while lower-income parents were more supportive of limiting promotions in stores.
changes over time
Support was significantly higher in 2011 than 2009 for not allowing games or other child-oriented features on unhealthy food websites (see Table B11, Appendix B). Further, support increased for regulating more than half of the specific types of food marketing to children examined (see Figure 7), while support for all other policies remained stable. The greatest increases in support were for limiting food marketing to children on radio commercials (+7.7%), promotions in stores (+6.6%), TV commercials (+6.0%), and food logos on other products (+6.0%).
FIGURE 7. INCREASE IN SUPPORT FOR REGULATIONS TO LIMIT MARKETING OF UNHEALTHY FOODS TO CHILDREN UNDER 12(% of parents supporting)
* Significantly higher (p < .05)(Types of marketing with significantly higher support in 2011 versus 2009)
30%
35%
40%
45%
50%
55%
60%
65%
70%
TV commercials Moviecommercials
Cartooncharacters on
packages
Social media Toys/giveaways
Food logos on
other products
% support 200920102011
Celebrityendorsements
Promotions instores
Radiocommercials
Food companywebsites
Sponsorships
% s
uppo
rt
Results

21 Return to contents >
In 2010, the White House called
for key actors (food and beverage
companies, restaurants, retailers,
trade associations, media,
government, and others) to create
a “food marketing environment
that supports, rather than
undermines, the efforts of parents
and other caregivers to encourage
healthy eating among children
and prevent obesity.”56
Parents in this survey agreed that numerous environmental factors, including food marketing, make it difficult for them to ensure healthy eating habits for their children. The findings in this report demonstrate broad support among parents for regulations to limit food marketing to children and other policy-related actions to help them ensure that their children are able to eat healthy.
awareness of food marketing to their children
Parents understood what types of foods are marketed most often to their children, although they tended to underestimate the amount of marketing for some categories. Fast food, cereal, and soda/pop were at the top of parents’ lists, and these categories correspond
Conclusions
with the three categories with the highest youth-targeted marketing expenditures in 2006 (carbonated beverages, restaurant foods, and breakfast cereal).57 On the other hand, less than one-third of parents thought their children saw marketing for other (i.e., not fast food) restaurants, prepared meals, or energy drinks daily. Yet analyses of exposure to TV advertising demonstrate that, on average, children and adolescents see more than one ad per day for each of these categories on TV alone.58-59
Parents also recognized that healthier products are marketed less often to their children, but they tended to overestimate the amount of marketing for these categories. The two categories that parents reported their children see marketed the least (fruits/vegetables and milk) correspond with the two categories with the lowest youth-targeted marketing expenditures (fruits/vegetables and dairy).60 Although 20% of parents thought their children saw marketing for fruits and vegetables daily, and 30% thought they saw marketing for bottled water daily, in 2011, children and adolescents actually saw less than one TV ad per week for fruits and vegetables and bottled water.61
In 2011 the greatest changes in parents’ awareness of food marketing to their children were found in increased mentions of internet marketing and cereal marketing and a reduction in mentions of juice/fruit drink marketing. When prompted to answer how often their children saw marketing for specific foods and beverages, few changes were noted.
concerns aBout food marketing and other environmental factors
Parents expressed a number of concerns about the impact of food marketing on their children. When asked about different effects of media on their children, parents were as concerned about junk food marketing as they were about alcohol and tobacco use. Parents also were highly aware of the “pester power” of food marketing in encouraging their children to ask them for advertised products and the effects of food marketing on their children’s food preferences. However, they were less likely to agree that food marketing affects their children’s diet or what they buy for their children. When rating the impact of specific types of food marketing on their children’s eating habits, parents believed that more traditional forms of child-targeted marketing (i.e., TV commercials, in-store promotions, cartoon characters on packages) had the most impact, while newer forms of marketing, including

22 Return to contents >
most forms of digital marketing (i.e., social media, viral marketing, mobile marketing, advergames, company-sponsored websites) had much less impact. These findings suggest that parents may be less familiar with forms of marketing that did not exist when they were young (e.g., advergames, social media) or marketing that children encounter on their own when using a computer or mobile phone.
Parents attributed 60% of the rise in childhood obesity to personal responsibility and 40% to an unhealthy food environment. Although they believe that the responsibility lies more with parents and individuals than the environment, they perceived a wide variety of obstacles to ensuring healthy eating habits for their own children. For example, the expense of healthy food, easy access to unhealthy foods, unhealthy food advertising, and children’s media usage were all considered to be obstacles. Two-thirds rated the media as a negative influence on their children’s eating habits and 61% rated the food industry as a negative influence. However, the majority of parents also recognized the part they play by giving in to children’s requests and being a poor role model.
Parents’ concerns about food marketing and other negative influences on their children’s eating habits appear to be increasing. Parents rated the impact of nearly all specific types of food marketing higher in 2011 versus 2009, which indicates that they may be becoming more aware of food marketing issues. Parents’ ratings of most obstacles to healthy eating also increased from 2009 to 2011, as did the percent of parents who indicated that the food industry, government, and local communities were a negative influence in promoting healthy eating for their children. These changes may indicate a future increase in support of policy-related actions to reduce children’s exposure to unhealthy food marketing and create a healthier food environment for children.
differences By socio-demographic categories
Awareness and concerns about food marketing to their children were quite similar between socio-demographic groups, including parents of differing incomes, political orientations, and genders. The most significant differences were found between black and Hispanic parents and white parents, as well as for parents with and without an overweight child. Of note, 46% of the parents in this sample had at least one overweight child.
Black and Hispanic parents and parents of overweight children were more likely to report that their children saw and heard advertising on a daily basis for most categories of food. These differences could be due to actual higher rates of advertising and media exposure to these youth.62-63 However, they also could indicate that these parents are more aware and concerned about the food marketing their children see. This hypothesis is supported by the finding that black and Hispanic parents and parents with overweight children also believed that food marketing has a greater impact on their children’s eating habits than other parents believed. These parents also perceived greater obstacles to ensuring healthy eating habits for their children, perhaps because they were more likely to have tried to improve their children’s eating habits and to personally experience more external barriers to healthy eating.
However, black and Hispanic parents were less likely than white parents to indicate that institutions, including the media, government, or local communities, negatively affect their children. Across all groups, greater perceived environmental obstacles (e.g., unhealthy food advertising, unhealthy food in schools) did not necessarily coincide with perceptions that the institutions placing those obstacles (e.g., the media and food industries, schools) were a negative influence on their children’s eating habits. Liberal parents were more likely than moderate or conservative parents to agree with most statements about how food marketing affects their children, and they were more likely to view the media, food industry, and government as negative influences on their children’s eating habits. However, conservative parents expressed more concern about the impact of sponsorships and newer forms of digital marketing on their children’s eating habits.
Conclusions
Parents’ concerns about food marketing and other negative influences on their children’s eating habits increased from 2009 to 2011.

23 Return to contents >
Parents of older children and adolescents also were more aware of marketing to their children for many food categories that are frequently targeted to adolescents, including fast food, soda/pop, and energy drinks.64-65 However, one-third or more of parents of younger children also reported that their children saw daily marketing for fast food and soda/pop daily. Similarly, parents of younger children were also aware that their children saw marketing for many products that are targeted to children (e.g., fruit drinks, yogurt, fruit snacks).66 Parents of older children and adolescents also perceived that specific types of food marketing had a greater impact on their children, especially sponsorships and digital media. In addition, parents of adolescents also perceived unhealthy food access (e.g., prevalence of junk food, unhealthy food in schools) and media usage to be greater obstacles to healthy eating for their children. These findings underscore a potentially greater need to improve the unhealthy food environment for older children and adolescents, as parents are less able to affect their behavior.
policy support
In this sample of parents, there was broad support for nearly all actions to promote healthy eating habits among children. Actions supported by two-thirds or more of parents surveyed include, setting nutrition standards for foods sold in schools, requiring children’s media and TV advertising to promote healthy foods, and not allowing advertising on school buses. In addition, 60% or more of parents surveyed supported limiting advertising/sponsorships in schools, mobile marketing, TV commercials, viral marketing, and internet advertising. More than half of parents also supported limiting advergames and social media. Although parents were less likely to indicate that these newer forms of marketing were having an impact on their own children, their support for limiting these types of marketing may reflect a fundamental objection to food companies marketing to children in these ways.
Consistent with higher perceived impact of specific types of food and beverage marketing in 2011 versus 2009, support for regulations to limit more than half of specific types of food and beverage marketing was higher in 2011. Support also increased for not allowing games or other child-oriented features on unhealthy food websites. It is interesting to note that the internet was the one place where parents were more likely to indicate, without prompting, that their children saw food advertising in 2011 compared with 2009.
Nearly all proposed actions to promote healthy eating habits and regulate specific types of unhealthy food marketing to children were supported by the majority of parents in this sample, regardless of gender or political orientation. Although liberal parents indicated higher support for approximately half of actions to promote healthy eating for their children, the majority of conservative parents supported all but two. In addition, there were few differences by parents’ political orientation in support for regulations to limit specific types of food marketing. Mothers were generally more supportive of most proposed actions than fathers, but fathers were equally supportive of limiting most specific types of marketing.
Differences in policy support between parents in different socio-demographic groups reflected the unique challenges they face. Black and Hispanic parents and parents with at least one overweight child were more inclined to support the majority of actions to promote healthy eating habits, reflecting the greater obstacles they face to ensure healthy eating habits for their own children. Black and Hispanic parents also were more supportive of regulations to limit specific types of unhealthy food marketing to children. However, parents without overweight children were equally supportive of regulating many specific types of marketing as parents with overweight children. Middle- and higher-income parents and parents of adolescents showed higher support for regulating marketing in digital media. Similarly, parents of preschoolers were more likely to support prohibiting advertising on TV programs targeted to children under 8, and parents of 6- to 11-year-olds were most supportive of limiting cartoon characters on packages.
Conclusions
The majority of liberal and conservative parents supported nearly all proposed policies to promote healthy eating, including regulating most types of unhealthy food marketing to children.

24 Return to contents >
Implications for policy makers
and public health advocates
Parents who responded to this survey perceived numerous obstacles, including food marketing, that make it difficult for them to ensure healthy eating habits for their children. They also expressed broad support for policies to limit unhealthy food marketing to children and other actions to help them encourage their children to eat healthy. These findings suggest numerous opportunities for policy makers, the public health community, and food and media companies to take action to improve the unhealthy food environment that surrounds children and support parents in their efforts to raise healthy children. For legislative policymakers in particular, it should be noted that support for actions to promote healthy eating comes from both liberal and conservative parents.
school foods and food marketing in schools
At least two-thirds of parents across all demographic groups supported nearly all the policies we examined related to foods sold in schools and marketing in schools. In particular, strengthening nutrition standards for school lunches, all other foods sold in schools (i.e., competitive foods), and school vending machines received very high levels of support. As the USDA continues to implement the Healthy Hunger-Free Kids Act,67 proposes new standards for competitive foods sold in school, and considers revisions to nutrition standards for school meals, it will likely face substantial resistance. It will be important to emphasize that parents overwhelmingly support these changes.
Many states and municipalities view corporations as a source of funding for cash-strapped schools, and food marketers see schools as an opportunity to reach a captive audience of young consumers. However, policy makers must recognize that most parents do not support marketing to children in schools. For example, since 2011, 18 bills have been introduced to allow school districts and other jurisdictions to sell advertising space on school buses.68 Yet our research shows that the majority of parents, regardless of their income, race, or political orientation, do not want advertising on school buses. To support parents’ concerns, states and municipalities could instead implement laws to prohibit any school bus advertising or to ensure that school bus advertising does not undermine children’s health.69
States and school districts could also enact policies to limit advertising and sponsorships of unhealthy foods in schools and on school property that would likely be widely supported by parents and withstand legal challenges.70 One state (Maine) has implemented such a law, and two states (Massachusetts and Indiana) have proposed legislation to study or regulate commercialism in schools.71 Implementing legislation regarding food marketing in schools faces numerous political barriers,72 but individual school districts can also restrict food marketing in schools by establishing marketing standards within school wellness policies.73 For example, schools could prohibit corporate logos on school property and curricular materials, as well as fund-raising programs that encourage the sale or purchase of branded foods. Policies in early childcare and preschool facilities that prohibit branded foods and other forms of marketing (e.g., McDonald’s play sets, M&M counting books, restaurant certificates as rewards) should also be considered, as very young children are especially vulnerable to advertising influence.74-75
regulating tv advertising and digital media
There was also broad support among parents surveyed for policy actions to promote healthy eating to children in the media and to reduce unhealthy food marketing on TV and in digital media. The U.S. Congress and federal agencies (e.g., Federal Trade Commission, Federal Communications Commission) have purview over marketing that crosses state lines. Therefore, regulation of marketing in most media (including TV, radio, the Internet, and other digital media) must be instituted at the federal level.76 Regulating
Conclusions
Parents have become more supportive of regulations limiting specific types of food marketing to children, including TV commercials, cartoon characters on packages, and social media.
Two-thirds or more of parents supported strengthening nutrition standards for school foods and not allowing school bus advertising.

25 Return to contents >
these media also imposes legal challenges due to the First Amendment, which protects commercial speech. However, legal scholars argue that there are opportunities to legislate and regulate advertising primarily viewed by children that would likely withstand these challenges.77-79
This research also presents an opportunity for food and media companies to implement policies to help parents raise healthy children. The food industry’s self-regulatory program to promote healthier dietary choices among children (CFBAI) has been in place since 2009, yet 65% of parents surveyed viewed the food industry as a negative influence on their children’s eating habits, up from 59% in 2009. These findings suggest that parents have not seen improvements in food marketing to children and that food companies could do much more to reduce marketing of unhealthy foods in a variety of media. Furthermore, parents of children 12 years and older also support these changes, although the food industry has strongly resisted implementing standards for marketing to this age group.80 Media companies could also support parents by promoting healthy eating messages during children’s programming and restricting unhealthy food marketing in children’s media. Disney recently introduced nutrition standards for foods advertised during its TV programming and websites targeted to children.81 Efforts such as these could present a substantial public relations opportunity and begin to counteract the view of most parents that the media is a negative influence on their children’s eating habits.
community-level health promotion policies
This research also suggests ample opportunity for city councils and local and state health agencies and legislators to take action to address poor diet and obesity among youth. In our survey, 42% of parents viewed their local community as a negative influence on their children’s eating habits. However, policies enacted at the community level can be well-suited to address parents’ concerns about children’s easy access to unhealthy foods and the lack of community programs to support healthy eating. In addition to school-based policies, states and local communities have the authority to implement a wide variety of health-promoting policies, including regulating foods sold in retail and food service establishments, product location in retail establishments, location and density of billboards and retail signage, vending and food service contracts in recreation and other public facilities, and sponsorships of community programs.82-84 Our research suggests that many parents would welcome such policies in their communities to help encourage better eating habits for their children.
addressing health disparities
Higher rates of obesity among black and Hispanic youth compared with white non-Hispanic youth raise significant public health concerns.85 In this survey, black and Hispanic parents also believed that their children saw more food advertising and were more affected by that advertising compared with white parents. In addition, they perceived more obstacles to ensuring healthy eating habits for their children, and were more supportive of most policies to promote healthy eating habits and limit food marketing. Surprisingly, black and Hispanic parents did not view the influence of food companies on their children’s eating habits more negatively. This may be because food companies, including McDonald’s and Coca-Cola, invest significant amounts in targeted marketing to black and Hispanic youth and programs to support black and Hispanic communities.86-87 It appears that these programs may be successful in deflecting blame for obesity away from the food companies. This finding suggests an opportunity to raise awareness among black and Hispanic parents about the role of food companies in creating the unhealthy
Conclusions
City councils and local and state health agencies can implement a wide variety of policies to limit food marketing and promote healthy eating in local communities.
In 2011, 65% of parents surveyed rated the food industry as a negative influence on their children’s eating habits, up from 59% in 2009.

26 Return to contents >
food environment that surrounds their children. It also indicates an opportunity to inform Congressional, state and local legislators about this issue, as well as alert caucuses of black and Latino legislators about food marketing in their communities and parents’ support for policies to address the issue.
Lower-income parents also rated the expense of healthy foods and a lack of community programs to support healthy eating as greater obstacles than higher-income parents. This suggests that legislation and other initiatives to increase access to healthy foods and reduce their price, such as healthy corner stores and fresh food financing, may be welcomed in low-income neighborhoods. A sugary drink tax could provide revenue for healthy food financing.
puBlic health communication strategies
This research identified several opportunities to better inform parents about current food marketing practices and its influence on their children. Although parents understood that their children saw much more marketing for unhealthy foods than for healthy foods, they were not aware of how much food marketing to children is out-of-sync with a healthy diet. In particular, they overestimated the amount of marketing for healthy foods that their children see. Raising awareness of the specific techniques companies use to market unhealthy food to children, especially in schools and newer digital forms, may be another effective way to get parents’ attention. It is interesting to note that few parents thought their own children were affected by mobile marketing, viral marketing, social media, or banner ads on the internet, but the majority of parents supported regulating these forms of marketing to children.
Increasing awareness of how the unhealthy food environment limits parents’ ability to ensure healthy eating habits for their children is another important message for public health advocates. Although parents rated most environmental factors as greater obstacles to ensuring that their children eat healthy than their own behavior (e.g., giving in to children’s requests, being a poor role model), they believed that 60% of the childhood obesity crisis was due to lack of personal responsibility. The public health community must do more to counteract industry messages, such as “all foods are fine in moderation,” and “the solution is more physical activity,” that place the blame for the obesity crisis on individual behaviors and poor choices by parents. Legislators (often parents themselves) must also hear the message that effective legislative solutions should focus on environmental change, rather than personal responsibility. Advocates could look for ways to channel negative perceptions of the media and food industries into demands that companies change their practices, and public health campaigns could better communicate that reducing unhealthy food marketing will help improve children’s eating habits. Messages that focus on how the food and media industries undermine parents’ best efforts to raise healthy children would likely resonate with many parents.
Perceptions that food marketing and other environmental factors negatively affect their children’s eating habits appears to have increased among parents in just three years. Parents were also more likely to support regulations to limit specific types of unhealthy food marketing to children in 2011 compared with 2009. These changes likely reflect increased attention to the issue through policy attempts, research studies, and industry announcements and the resulting news coverage. It will be important for the public health community to ensure that unhealthy food marketing to young people remains a top-of-mind concern for parents and provide ways to empower parents to advocate for regulation and other policies that help them ensure healthy eating habits for their children.
Conclusions
Raising awareness of the specific techniques used to market unhealthy foods to children, especially in schools and newer digital forms, may be an effective way to get parents’ attention.

27 Return to contents >
References
1 White House Task Force on Childhood Obesity
(2010). Solving the problem of childhood obesity
within a generation. Retrieved from www.
letsmove.gov/tfco_fullreport_may2010.pdf.
2 Institute of Medicine [IOM] (2006). Food marketing to children and youth: Threat or opportunity? (J. M. McGinnis, J. Gootman,
& V. I. Kraak, Eds.). Washington, D.C.: The
National Academies Press.
3 Kraak, V. I., Story, M., Wartella, E. A., & Ginter,
J. (2011). Industry progress to market a healthful
diet to American children and adolescents.
American Journal of Preventive Medicine, 41(3), 322-333.
4 Interagency Working Group on Food
Marketed to Children [IWG] (2011). Preliminary
proposed nutrition principles to guide
industry self-regulatory efforts. Request for
Comments. Retrieved from www.ftc.gov/
os/2011/04/110428foodmarketproposedguide.
pdf.
5 Koplan, J.P., & Brownell, K.D. (2010). Response
of the food and beverage industry to the obesity
threat. JAMA, 304(13), 1487-1488.
6 Sharma, L.L., Teret, S.P., & Brownell, K.D.
(2010). The food industry and self-regulation:
Standards to promote success and to avoid
public health failures. American Journal of Public Health, 100(2), 240-6.
14 Harris, J.L., Schwartz, M.B., Brownell, K.D.,
Sarda, V., Dembek, C., et al. (2012). Cereal FACTS
2012: Limited progress in the nutrition quality
and marketing of children’s cereals. Retrieved
from www.cerealfacts.org.
15 Powell, L.M., Schermbeck, R.M., Szczpka, G.,
Chaloupka. F.J., & Braunschweig, C.L. (2011).
Trends in the nutritional content of television
food advertisements seen by children in the
United States. Archives of Pediatric and Adolescent Medicine,165(12), 1078-1086.
16 Ibid.
17 Kraak, V.I., Story, M., Wartella, E.A. & Ginter, J.
(2011). Industry progress to market a healthful
diet to American children and adolescents.
American Journal of Preventive Medicine, 41(3), 322–333.
18 Harris, J.L., Speers, S.E., Schwartz, M.B. &
Brownell, K.D. (2012). U.S. food company
branded advergames on the internet: Children’s
exposure and effects on snack consumption.
Journal of Children and Media, 6(1), 51-68.
19 Harris, J.L., Schwartz, M.B. & Brownell, K.D.
(2010). Marketing foods to children and youth:
Licensed characters and other promotions on
packaged foods in the supermarket. Public Health Nutrition, 13(3), 409-417.
20 FTC (2008).
21 IOM (2006).
7 Yale Rudd Center for Food Policy & Obesity
(2012). Trends in television food advertising
to young people: 2011 update. Retrieved from
yaleruddcenter.org/resources/upload/docs/what/
reports/RuddReport_TVFoodAdvertising_5.12.
pdf.
8 Federal Trade Commission [FTC] (2008, July).
Marketing food to children and adolescents:
A review of industry expenditures, activities,
and self-regulation. A report to Congress.
Retrieved from www.ftc.gov/os/2008/07/
P064504foodmktingreport.pdf.
9 Ibid.
10 Ibid.
11 Harris, J.L., Schwartz, M.B., Brownell, K.D.,
Sarda, V., Weinberg, M.E., et al. (2009). Cereal
FACTS: Evaluating the nutrition quality and
marketing of children’s cereals. Retrieved
from cerealfacts.org/media/Cereal_FACTS_
Report_2009.pdf.
12 Harris, J.L., Brownell, K.D., Schwartz, M.B.,
Sarda V., & Ustjanauskus, A., et al. (2010). Fast
Food FACTS: Evaluation of the nutritional quality
and marketing of fast food to youth. Retrieved
from www.fastfoodfacts.org.
13 Harris, J.L., Schwartz, M.B., Brownell, K.D.,
Javadizadeh, J.,Weinberg, M.E., et al. (2011).
Sugary Drink FACTS: Evaluating Sugary Drink
Nutrition and Marketing to Youth. Retrieved from
www.sugarydrinkfacts.org.

28 Return to contents >
22 World Health Organization [WHO] (2010).
Set of recommendations on the marketing
of foods and non-alcoholic beverages to
children. Retrieved from whqlibdoc.who.int/
publications/2010/9789241500210_eng.pdf.
23 Hastings, G., Stead, M., McDermott. L., et al.
(2003). Review of Research on the Effects of
Food Promotion to Children. Glasgow: University
of Strathclyde Centre for Social Medicine,
Retrieved from www.foodstandards.gov.uk/
healthiereating/promotion/readreview.
24 Andreyeva, T., Kelly, I. R., & Harris, J. L. (2011).
Exposure to food advertising on television:
Associations with children’s fast food and soft
drink consumption and obesity. Economics & Human Biology, 9 (3), 221-233.
25 Dhar, T., & Baylis, K. (2011). Fast-food
consumption and the ban on advertising
targeting children: The Quebec experience.
Journal of Marketing Research, 48(5),
799-813.
26 Kolish, E.D., Hernandez, M., & Blanchard,
K. (2011). The Children’s Food & Beverage
Advertising Initiative in action. Retrieved from
www.bbb.org/us/storage/16/documents/cfbai/
cfbai-2010-progress-report.pdf.
27 Yale Rudd Center (2012).
28 Powell et al. (2011).
29 Kunkel, D., McKinley, C. & Wright, P. (2009).
The impact of industry self-regulation on
the nutritional quality of foods advertised
on television to children. Retrieved from
www.childrennow.org/uploads/documents/
adstudy_2009.pdf.
30 Yale Rudd Center (2012).
31 IWG (2011).
40 Langer (2004).
41 Bright (2007).
42 Quinlan, A., Lieberman, D. & Ferguson, G. (2010)
American voters support investment in preventing
childhood obesity. Retrieved from gqrr.com/
articles/2472/5744_TFAH%20Memo.pdf.
43 Goren, A., Harris, J.L., Schwartz, M.B., & Brownell,
K.D.(2010). Predicting support for restricting food
marketing to youth. Health Affairs, 29(3), 419-
424.
44 Niederdeppe, J., Porticella, N., & Shapiro, M. A.
(2012). Using theory to identify beliefs associated
with support for policies to raise the price of
high-fat and high-sugar foods. Journal of Health Communication, 17(1), 90-104.
45 Barry, C.L., Brescoll, V.L, Brownell, K.D., &
Schlesinger, M. (2009).Obesity metaphors: How
beliefs about the causes of obesity affect support for
public policy. Milbank Quarterly, 87(1), 7-47.
46 Evans et al. (2005).
47 Niederdeppe et al. (2012).
48 Langer (2004).
49 Bright (2007).
50 Quinlan et al. (2010).
51 Goren et al. (2010).
52 Niederdeppe et al. (2012).
53 Barry et al. (2009).
References
32 Federal Trade Commission [FTC] (2012, Oct.
12). Prepared statement of the Federal Trade
Commission on the interagency working group
on food marketed to children. U.S House of
Representatives. Retrieved from www.ftc.gov/os/
testimony/111012foodmarketing.pdf.
33 Wilson, D. & Roberts, J. (2012, April 27).
Special report: How Washington went soft on
childhood obesity. Retrieved from www.reuters.
com/assets/print?aid=USBRE83Q0ED20120427.
34 Chief!Marketer (2006, May 15). Kids wield
$18 billion in spending power: Study. Retrieved
from chiefmarketer.com/research/kids-wield-18-
billion-spending-power-study.
35 The United States Census Bureau (2012). The
2012 Statistical Abstract. Retrieved from www.
census.gov/compendia/statab/cats/population/
households_families_group_quarters.html.
36 Ustjanauskas, A., Eckman, B., Harris, J.L.,
Goren, A., Schwartz, M.B., & Brownell, K.D.
(2010). Focus groups with parents: What
do they think about food marketing to their
kids? Retrieved from www.yaleruddcenter.
org/resources/upload/docs/what/reports/
RuddReport_FocusGroupsParents_5.10.pdf.
37 Evans, W.D., Finkelstein, E.A., Kamerow, D.B.,
& Renaud, J.M. (2005). Public perceptions of
childhood obesity. American Journal of Preventive Medicine. 28(1), 26-32.
38 Langer, G. (2004, May 30). Views on obesity in
the US: Report on a national poll conducted by
TNS. Time Magazine and ABC News. Retrieved
from abcnews.go.com/sections/us/Living/
Obesity_poll_040530.htm.
39 Bright, B. (2007, Aug 20). Poll shows growing
concern about role of advertising in child
obesity. Retrieved from online.wsj.com/article/
SB118730629508900233.html.

29 Return to contents >
54 Speers, S., Goren, A., Harris. J.L., Schwartz,
M.B. & Brownell, K.D. (2009). Public perceptions
of food marketing to youth: Results of
the Rudd Center Public Opinion Poll, May
2008. Retrieved from www.yaleruddcenter.
org/resources/upload/docs/what/reports/
RuddReportPublicPerceptionsFoodMarketing-
Youth2009.pdf.
55 Ogden, C. L., Carroll, M. D., Kit, B. K., &
Flegal, K. M. (2012). Prevalence of obesity and
trends in body mass index among US children
and adolescents, 1999-2010. JAMA, 307(5),
483-490.
56 White House (2010).
57 FTC (2008).
58 Yale Rudd Center (2012).
59 Harris et al. (2011).
60 FTC (2008).
61 Yale Rudd Center (2012).
62 Powell, L. M., Szczpka, G., & Chaloupka,
F.J.(2010). Trends in exposure to television food
advertisements among children and adolescents
in the United States. Archives of Pediatrics and. Adolescent Medicine,164(9), 794-802.
63 Yancey, A.K, Cole, B.L., Brown, R., Williams,
J.D., Hillier, A., Kline, R.S.& McCarthy, W.J. (2009).
A cross-sectional prevalence study of ethnically
targeted and general audience outdoor obesity-
related advertising. Milbank Quarterly, 87(1),
155-84.
64 Harris, Brownell, Schwartz, et al. (2010).
65 Harris et al. (2011).
66 Kolish et al. (2011).
77 Campbell, A. (2009). Recent federal regulatory
developments concerning food and beverage
marketing to children and adolescents. Paper
presented at the The Second NPLAN/BMSG
Meeting on Digital Media and Marketing to
Children, Berkeley, CA. Retrieved from digitalads.
org/documents/Campbell_NPLAN_BMSG_
memo.pdf
78 Pomeranz, J. L. (2010). Television food
marketing to children revisited: The Federal
Trade Commission has the constitutional and
statutory authority to regulate. Journal of Law, Medicine and Ethics, 38, 1, 98-116.
79 Harris, J.L. & Graff, S.K. (2012). Protecting
young people from junk food advertising:
Implications of psychological research for First
Amendment Law. American Journal of Public Health, 102(2), 214-222.
80 Wilson & Roberts (2012).
81 The Walt Disney Company (2012, June 4).
The Walt Disney Company sets new standards
for food advertising to kids. Retrieved from
thewaltdisneycompany.com/disney-news/press-
releases/2012/06/walt-disney-company-sets-
new-standards-food-advertising-kids.
82 Harris & Graff (2011).
83 Pomeranz, J.L. (2011). The unique authority of
state and local health departments to address
obesity. American Journal of Public Health, 101,7, 1192-7
84 Pomeranz, J.L. (2011). Advanced policy
options to regulate sugar-sweetened beverages
to support public health. Journal of Public Health Policy, 33, 75-88.
85 Ogden et al. (2012).
86 Harris, Brownell, Schwartz, et al. (2010).
87 Harris et al. (2011).
67 U.S. Department of Agriculture [USDA] (2010).
Healthy Hunger Free Kids Act. Retrieved from
www.fns.usda.gov/cnd/Governance/Legislation/
CNR_2010.htm.
68 Yale Rudd Center for Food Policy & Obesity.
Legislation database. Retrieved from www.
yaleruddcenter.org/legislation/
69 Pomeranz, J.L. (2012). The wheels on the bus
go “buy buy buy”: school bus advertising laws.
American Journal of Public Health, 102,
9, 1638-1643.
70 Graff, S. K. (2008). First amendment
implications of restricting food and beverage
marketing in schools. Annals of the American Academy of Political and Social Science, 615, 158-177.
71 Ibid.
72 Brescoll, V. L., Kersh, R., & Brownell, K. D.
(2008). Assessing the feasibility and impact of
federal childhood obesity policies. The Annals of the American Academy of Political and Social Science, 615, 178-194.
73 Center for Science in the Public Interest [CSPI].
School wellness policies. Retrieved from www.
schoolwellnesspolicies.org/WellnessPolicies.html.
74 Kunkel, D., Wilcox, B. L., Cantor, J., Palmer, E.,
Linn, S., & Dowrick, P. (2004). Report of the APA
task force on advertising and children. Retrieved
from www.apa.org/releases/childrenads.pdf.
75 John, D. R. (1999). Consumer socialization of
children: A retrospective look at twenty-five years
of research. Journal of Consumer Research, 26, 183-213.
76 Harris, J. L., & Graff, S. K. (2011). Protecting
children from harmful food marketing:
Options for local government to make a
difference. Preventing Chronic Disease, 8 (5)
A92.
References

30 Return to contents >
Appendix A
The survey was conducted three
times using an online non-
probability sample of adults
during June-July 2009, 2010,
and 2011. Sampling procedures,
sample size, data collection
period, and most measures
remained consistent over the
three years.
Sample
Participants ages 21-65 with an annual income of at least $15,000 who have primary or shared responsibility for household food and beverage choices were recruited via email through Survey Sampling International (SSI) (www.surveysampling.com). SSI provides consumer panels for survey research. It recruits panel members through thousands of websites to obtain a representative sample of the online population. Panelists are screened to provide high quality respondents and minimize fraud. They do not receive a direct reward for completing individual surveys to ensure more honest responses. Instead, participants are compensated for being active panelists with rewards that vary from charitable donations and information, to monetary and point rewards for overall participation. All participants accessed
the survey through an email link. Participation rates for the total sample were 81% in 2009, 78% in 2010, and 86% in 2011.
Quotas were established for parents with children between the ages of 2 and 17 living at home (n=600) versus other adults (n=300); ethnicity and race (11% African-American/black; 12% Latino/Hispanic); income level (37% $15,000 to <$40,000; 36% $40,000 to <$75,000; 27% $75,000+); and gender (60% female; 40% male). The sample of 600 parents per year was augmented with at least 100 additional black and Hispanic parents (with children ages 2-17) to ensure that sample sizes were large enough for comparison by race and ethnicity. The total results were not weighted to adjust for oversampling of some demographic groups (e.g., female, Hispanic, and black parents). In this report, we present only the responses of parents with children 2-17 years old living at home.
It must be noted that the use of a non-probability based panel for an online survey has limitations as these findings are not representative of the population. However, there are advantages in cost and the ability to evaluate differences between specific populations. This research was not intended to produce precise estimates of population attitudes, but rather to understand how attitudes differ between groups and examine changes over time.
socio-demographic categories
Respondents were assigned to socio-demographic categories according to the following criteria:
Race/ethnicity. Respondents were asked to identify their own racial and ethnic background (Caucasian, African-American, Latino/Hispanic, Asian, and other) and to select all that apply. A respondent was coded as non-Hispanic white (i.e., white) if he/she selected Caucasian and no other race or ethnicity. Persons selecting African-American, but not Caucasian, Asian, or other, were coded as black, even if Latino/Hispanic was also indicated. If a person selected Latino/Hispanic, but not African-American, Asian or other, the person was coded as Hispanic, even if he/she also selected Caucasian.
Child characteristics. Parents provided the age, gender, height and weight of all their children 2-17 years old living with them. Children’s weight status was calculated according to the U.S. Centers for Disease Control

31 Return to contents >
and Prevention (CDC) growth charts (www.cdc.gov/growthcharts/). Children with a BMI-for-age between the 85th and 95th percentile were classified as overweight and those with a BMI-for-age above the 95th percentile were classified as obese. Parents who had one or more overweight or obese child living at home were identified. Parents were also grouped according to the age of their oldest child: 2-5 years old, 6-11 years old, or 12-17 years old.
Other socio-demographic characteristics. Respondents indicated their household income in the previous year. Individuals with a household income less than $40,000 were categorized as lower-income; middle-income if their household income was $40,000 to less than $75,000; and higher-income if their household income was $75,000 or higher. Respondents also indicated their political orientation on a scale of 1 to 7 (1=strongly liberal, 4=middle-of-the-road, 7=strongly conservative). If 1 to 3 was chosen, the respondent was coded as liberal; respondents who chose 4 were coded as moderate; and respondents choosing 5 to 7 were coded as conservative. Respondents also indicated their gender.
Measures
The objective of this survey was to obtain an in-depth understanding of how parents view food and beverage marketing to their children. The study questions were designed to assess 1) awareness of food marketing their children see and hear; 2) concern with the impact of food marketing on their children; 3) perceived environmental influences on childhood obesity and their children’s eating habits; 4) support for a range of policies related to healthy eating and food marketing; and 5) changes from 2009 to 2011. Questions regarding parents’ attitudes about children’s media usage and eating behaviors and children’s diet also were asked, but are not reported here. A copy of the full survey is available at http://www.yaleruddcenter.org/surveyquestionnaire.
This questionnaire was designed to obtain respondents’ attitudes about a wide range of youth-related issues regarding the media, food marketing, and children’s diet. As a result, earlier questions may have affected individuals’ responses to questions that followed. All respondents answered questions in the same order to ensure valid differences between the socio-demographic groups examined. To ensure valid comparisons across the three years, only minor adjustments were made in possible responses from year-to-year and the order of questions did not change. Questions regarding awareness of food marketing were asked first to ensure that prior questions did not affect respondents’ awareness. Questions about policy support also were asked early in the questionnaire to reduce potential bias resulting from the in-depth questions about children’s diet and media issues that followed.
The following details the survey questions used to assess parents’ attitudes about each topic. Question numbers indicate the order in which questions were asked.
awareness of food marketing to children
Three questions assessed parents’ perceptions of the quantity and types of foods and beverages marketed to their children, as well as where they believe their children see or hear food marketing.
Q1a. Thinking about the way in which food and beverages are marketed to children, what are the top 3 types of food and beverages you think your children have seen being marketed in the past month? No prompts were provided. The five product categories mentioned most often are reported.
Q1b. And, what do you think are the top 3 places (besides on TV) where your children have seen or heard marketing for food and beverages in the past month? No prompts were provided. The five types of marketing indicated most often are reported.
Q2. How often do you think your children have seen or heard any marketing for the following different kinds of food and beverages in the past month? A list of 18 food and beverage product categories was provided. Response options were daily, weekly, several times a month, and once a month or less. Parents who responded “daily” then indicated how many times per day (10+, 4-9, 1-3). Parents who responded “weekly” indicated how many times per week (4-6, 2-3, once). The percent of parents who responded that their children see ads for a product category daily or more often and the percent of parents who responded that their children see ads for a product category several times a month or once a month or less are reported.
Appendix A
32 Return to contents >
perceived impact of food marketing to children
Three questions asked parents about their perceptions of the impact of food marketing on their children. One question gauged their concern about food marketing and unhealthy eating depictions in the media relative to other youth-related media issues, such as sexual permissiveness, tobacco use, alcohol use, and gender or racial stereotypes. Parents also indicated their agreement with statements regarding how food marketing affects their children and rated the impact of different types of marketing on their children’s eating habits.
Q7. Please indicate how concerned you are with the media in the areas listed below. A list of 12 different media issues was provided. Responses ranged from 1 (not concerned at all) to 10 (extremely concerned). Mean responses are reported.
Q6. Using the scale below, please indicate how much you agree with the following statements about food and beverage marketing and advertising to your children. A list of 13 possible effects of food marketing was provided. Responses ranged from 1 (strongly disagree) to 10 (strongly agree). Mean responses are reported.
Q3. Using the scale below, please indicate the level of impact you think these different types of food and beverage marketing have on your children’s eating habits. A list of 18 types of marketing was provided. Responses ranged from 1 (no impact at all) to 10 (very strong impact). Mean responses are reported.
perceived environmental influences
Three questions assessed parents’ perceptions of environmental factors that could influence childhood obesity and eating habits of their children. Parents allocated responsibility for childhood obesity to personal responsibility versus environmental factors. They also rated the negative or positive influence of individuals and institutions in promoting healthy eating habits and rated
a list of sixteen potential obstacles (including expense, access to unhealthy foods, media time, and eating out of the house) that make it difficult to ensure their children have healthy eating habits.
Q11c. Please allocate 10 points below based on how much increased obesity rates among children are due to each of the following: • Personal responsibility on the part of the individual parents or children • Unhealthy food environment, that is, outside influences, such as school
food, advertising, too many fast food restaurants, high price of fresh fruits and vegetables, etc.
Respondents answered each option on a sliding scale, totaling 10 points. The percent of points allocated to each option are reported.
Q9. Please indicate whether you think these institutions and people have a positive or negative influence on your children’s eating habits, using the scale below. A list of 8 institutions (e.g., media, schools) and individuals (e.g., your children’s peers, yourself) was provided. Responses ranged from 1 (very bad influence) to 10 (very good influence). The percent of respondents who answered that the institution or individual was a negative influence (1-5) are reported.
Q2. How much of an obstacle is each of the following things to ensuring that your children have healthy eating habits? A list of 16 potential obstacles was provided. Responses ranged from 1 (not at all an obstacle to healthy eating) to 10 (very much an obstacle to healthy eating). Mean responses are reported.
support for policy-related actions regarding food marketing to children
Two questions measured parents’ support for policy solutions to address unhealthy eating among children. One question asked about support for specific actions, including regulation of school foods, TV commercials, and other types of marketing. The other assessed support for limiting specific types of unhealthy food marketing to children under 12, including traditional advertising (on TV, radio, and billboards), as well as digital marketing, sponsorships, and product packaging.
Appendix A

33 Return to contents >
Q5. Below is a list of actions that are either currently being taken or could be taken to promote healthy eating habits and physical activity to your children. Using the scale below, please indicate how much you would support each of the following actions. A list of 17 policy options was provided. Responses ranged from 1 (definitely would oppose) to 10 (definitely would support). Percent of respondents who support each regulation (6-10) are reported.
Q4. Using the scale below, please indicate how much you would support regulations to limit each type of marketing of unhealthy foods to children under 12. A list of 18 types of marketing was provided. Responses ranged from 1 (definitely would oppose) to 10 (definitely would support). Percent of respondents who support each regulation (6-10) are reported.
Analyses
Differences between socio-demographic groups (race/ethnicity, child characteristics, and other demographics) and differences by year (2009, 2010, and 2011) were tested for statistical significance. Reported level differences are at least p < .05. One-way Analysis of Variance (ANOVA) was used to compare measures reported as means, and chi-square of significance tests were used to compare percentages. Significance of multiple comparisons was adjusted using Tukey’s post-hoc test for ANOVAs and Bonferroni corrections for chi-square tests. Data collected all three years were combined for the analyses. Significant differences from 2009 to 2011 are also reported.
Appendix A

34 Return to contents >
Appendix B
Note about tables of results
The tables in Appendix B use superscript letters to indicate significant differences between means and percentages for comparison groups. Within each row (within a comparison group), only means and percentages that do not share a common superscript differ significantly at p < .05. Means and percentages with a common superscript or without any superscript do not differ significantly from each other.

35 Return to contents >
taB
le B
1. p
erc
epti
on
s a
Bo
ut
the
foo
ds
an
d B
ever
ag
es
ma
rk
eted
mo
st
oft
en
Perc
enta
ge o
f pa
rent
s w
ho r
epor
t th
eir
child
ren
see
or h
ear
mar
keti
ng f
or t
hese
fo
ods
and
beve
rage
s at
leas
t on
ce p
er d
ay
Ra
ce/e
thni
city
Ove
rwei
ght
or
obes
e ch
ildA
ge o
f old
est
child
Hou
seho
ld in
com
ePo
litic
al o
rien
tati
onG
ende
r of
par
ent
Ove
rall
n= 2
454
Whi
te
n=12
87Bl
ack
n=52
0H
ispa
nic
n=54
6N
o n=
122
0Ye
s n=
103
22
to 5
n=
453
6 to
11
n=73
312
to
17
n=12
68<
$40k
n=
952
$40-
75k
n=89
1>
$75k
n=
611
Libe
ral
n=46
7M
oder
ate
n=12
06Co
nser
vati
ve
n=78
1Fe
mal
e n=
1716
Mal
e n=
738
Perc
ent
Perc
ent
Perc
ent
Perc
ent
Perc
ent
Perc
ent
Perc
ent
Perc
ent
Perc
ent
Perc
ent
Perc
ent
Perc
ent
Perc
ent
Perc
ent
Perc
ent
Perc
ent
Perc
ent
Fast
food
rest
aura
nts
60.8
%57
.4%
a68
.1%
b62
.8%
b60
.4%
61.1
%52
.3%
a58
.5%
b65
.2%
c61
.2%
61.6
%59
.1%
61.9
%62
.2%
58.1
%60
.1%
62.5
%
Cere
al
58.6
%54
.6%
a65
.4%
b62
.7%
b57
.1%
61.0
%50
.8%
a60
.2%
b60
.5%
b58
.8%
58.7
%58
.1%
57.8
%60
.9%
55.6
%58
.2%
59.5
%
Soda
/pop
50
.2%
46.6
%a
57.3
%b
53.5
%b
48.5
%a
53.4
%b
36.0
%a
46.8
%b
57.3
%c
53.1
%a
49.4
%ab
47.0
%b
48.6
%51
.2%
49.7
%47
.6%
a56
.2%
b
Spor
ts d
rinks
* 39
.6%
35.9
%a
48.4
%b
40.4
%ab
36.4
%a
45.3
%b
25.5
%a
40.6
%b
44.2
%b
38.6
%40
.1%
40.3
%37
.2%
41.0
%39
.1%
37.7
%43
.2%
Cand
y 39
.2%
34.8
%a
48.5
%b
41.4
%c
36.9
%a
41.8
%b
32.0
%a
38.9
%b
42.0
%b
42.3
%a
38.6
%ab
35.2
%b
37.9
%ab
41.7
9%a
36.0
%b
37.0
%a
44.4
%b
Cook
ies
and
crac
kers
38
.8%
35.3
%a
44.2
%b
42.9
%b
36.3
%a
40.7
%b
35.1
%a
37.9
%a
40.7
%b
40.3
%38
.6%
36.8
%37
.5%
39.8
%38
.2%
38.2
%40
.4%
Pota
to c
hips
, oth
er s
alty
sna
cks
37.3
%34
.4%
a41
.9%
b40
.3%
b34
.7%
a41
.0%
b29
.6%
a34
.1%
a42
.0%
b39
.7%
a36
.6%
ab34
.7%
b34
.9%
38.5
%37
.0%
36.2
%40
.0%
Frui
t drin
ks
37.2
%28
.8%
a49
.8%
b44
.7%
b33
.9%
a39
.6%
b40
.8%
37.4
%35
.8%
42.3
%a
33.9
%b
34.0
%b
34.7
%ab
39.6
%a
35.0
%b
37.5
%36
.6%
Yogu
rt 32
.7%
29.2
%a
33.1
%a
40.7
%b
31.2
%33
.0%
34.4
%34
.9%
30.8
%34
.8%
a33
.7%
a28
.2%
b28
.1%
a35
.9%
b30
.6%
a34
.2%
a29
.4%
b
100%
frui
t jui
ce
32.7
%24
.3%
a45
.0%
b40
.3%
b35
.4%
a28
.2%
b36
.4%
32.3
%31
.6%
37.2
%a
30.5
%b
28.8
%b
25.3
%a
35.5
%b
32.8
%b
33.1
%31
.7%
Ener
gy d
rinks
32
.0%
29.8
%a
37.9
%b
32.2
%ab
32.4
%33
.2%
18.1
%a
26.9
%b
39.9
%c
34.1
%30
.0%
31.6
%32
.8%
33.1
%29
.8%
30.4
%a
35.8
%b
Ice
crea
m, f
roze
n de
sser
ts31
.4%
27.6
%a
35.8
%b
35.5
%b
27.9
%a
34.5
%b
29.4
%32
.9%
31.2
%35
.9%
a30
.5%
b25
.5%
c28
.1%
a35
.3%
b27
.3%
a31
.9%
30.2
%
Prep
ared
food
s an
d m
eals
30
.5%
26.4
%a
37.5
%b
33.7
%b
27.3
%a
33.7
%b
26.3
%a
28.1
%a
33.4
%b
33.6
%a
30.4
%a
25.7
%b
27.0
%a
32.9
%b
28.8
%ab
31.2
%28
.7%
Bottl
ed w
ater
30
.2%
23.9
%a
40.4
%b
35.4
%b
26.4
%a
34.1
%b
24.3
%a
29.3
%ab
32.9
%b
35.0
%a
27.6
%b
26.7
%b
26.1
%31
.7%
30.5
%28
.7%
a33
.9%
b
Oth
er re
stau
rant
s28
.8%
23.5
%a
37.5
%b
33.5
%b
27.5
%30
.0%
20.8
%a
28.0
%b
32.2
%c
29.4
%28
.8%
27.8
%27
.6%
28.9
%29
.3%
28.2
%30
.4%
Frui
t sna
cks
28.6
%23
.9%
a37
.3%
b31
.7%
b24
.8%
a31
.6%
b30
.2%
29.1
%27
.7%
33.0
%a
25.4
%b
26.4
%b
26.3
%30
.0%
27.7
%27
.6%
30.8
%
Milk
26
.2%
20.3
%a
33.5
%b
32.2
%b
23.2
%a
27.4
%b
26.7
%26
.9%
25.6
%30
.9%
a24
.7%
b21
.0%
b20
.1%
a28
.5%
b26
.1%
b25
.4%
27.9
%
Frui
ts a
nd v
eget
able
s19
.9%
14.5
%a
29.8
%b
23.8
%c
16.0
%a
23.0
%b
21.2
%20
.9%
18.9
%24
.4%
a17
.1%
b17
.0%
b15
.2%
a21
.3%
b20
.5%
b19
.9%
19.8
%
Sign
ifica
ntly
high
er (p
< .0
5)
Num
bers
with
diff
eren
t let
ters
are
sig
nific
antly
diff
eren
t tha
n ea
ch o
ther
afte
r Bon
ferro
ni c
orre
ctio
ns
*Dat
a co
llect
ed in
201
1 on
ly (n
=72
9)
Appendix B

36 Return to contents >
taB
le B
2. p
erc
epti
on
s a
Bo
ut
the
foo
ds
an
d B
ever
ag
es
ma
rk
eted
lea
st
oft
en
Perc
enta
ge o
f pa
rent
s w
ho r
epor
t th
eir
child
ren
see
or h
ear
mar
keti
ng f
or t
hese
fo
ods
and
beve
rage
s le
ss t
han
once
per
wee
k
Race
/eth
nici
tyO
verw
eigh
t or
ob
ese
child
Age
of o
ldes
t ch
ildH
ouse
hold
inco
me
Polit
ical
ori
enta
tion
Gen
der
of p
aren
t
Ove
rall
n= 2
454
Whi
te
n=12
87Bl
ack
n=52
0H
ispa
nic
n=54
6N
o n=
122
0Ye
s n=
103
22
to 5
n=
453
6 to
11
n=73
312
to
17
n=12
68<
$40k
n=
952
$40-
75k
n=89
1>
$75k
n=
611
Libe
ral
n=46
7M
oder
ate
n=12
06Co
nser
vati
ve
n=78
1Fe
mal
e n=
1716
Mal
e n=
738
Perc
ent
Perc
ent
Perc
ent
Perc
ent
Perc
ent
Perc
ent
Perc
ent
Perc
ent
Perc
ent
Perc
ent
Perc
ent
Perc
ent
Perc
ent
Perc
ent
Perc
ent
Perc
ent
Perc
ent
Frui
ts a
nd v
eget
able
s55
.1%
62.8
%a
37.9
%b
52.6
%c
59.5
%a
51.8
%b
53.0
%53
.9%
56.5
%50
.3%
a57
.9%
b58
.3%
b59
.3%
53.1
%55
.6%
56.7
%a
51.2
%b
Milk
46
.2%
51.6
%a
34.0
%b
44.1
%c
50.7
%a
42.3
%b
50.8
%a
47.8
%ab
43.7
%b
41.4
%a
49.2
%b
49.4
%b
53.5
%a
44.9
%b
43.9
%b
48.7
%a
40.5
%b
Bottl
ed w
ater
43
.5%
48.7
%a
33.9
%b
38.8
%b
47.0
%a
40.2
%b
54.5
%a
44.3
%b
39.0
%c
39.6
%a
47.4
%b
43.9
%ab
48.0
%42
.3%
42.6
%45
.9%
a37
.9%
b
Ener
gy d
rinks
41
.9%
58.0
%ab
62.5
%a
45.1
%b
41.9
%39
.2%
64.5
%a
47.1
%b
30.8
%c
41.9
%43
.7%
39.3
%43
.5%
42.0
%40
.9%
44.9
%a
65.2
%b
Oth
er re
stau
rant
s 40
.4%
43.5
%a
35.2
%b
38.3
%b
41.2
%39
.9%
50.8
%a
43.4
%b
35.0
%c
42.2
%40
.2%
38.0
%40
.9%
41.1
%39
.1%
42.8
%a
34.8
%b
Frui
t sna
cks
37.0
%39
.9%
a30
.8%
b35
.0%
b38
.7%
35.7
%39
.1%
36.4
%36
.6%
35.1
%39
.1%
37.0
%63
.4%
62.9
%63
.0%
37.8
%35
.1%
Prep
ared
food
s an
d m
eals
36
.7%
40.4
%a
29.0
%b
35.9
%a
39.3
%a
33.5
%b
45.0
%a
37.7
%b
33.2
%c
36.0
%36
.4%
38.3
%36
.0%
36.2
%38
.0%
37.8
%34
.3%
Ice
crea
m, f
roze
n de
sser
ts
33.3
%36
.1%
a28
.9%
b29
.9%
b35
.1%
31.4
%37
.5%
a33
.7%
a31
.6%
b32
.3%
33.7
%34
.4%
32.3
%32
.6%
35.0
%34
.3%
31.0
%
Yogu
rt 33
.2%
35.2
%a
32.1
%ab
29.3
%b
35.1
%a
31.1
%b
35.5
%30
.3%
34.1
%34
.5%
32.0
%33
.1%
33.8
%33
.3%
32.8
%32
.8%
24.2
%
Spor
ts d
rinks
*31
.5%
34.4
%a
29.3
%ab
25.9
%b
30.9
%29
.6%
53.7
%a
34.0
%b
21.7
%c
34.9
%29
.9%
28.6
%29
.5%
31.2
%33
.0%
32.7
%29
.1%
100%
frui
t Jui
ce
31.4
%37
.1%
a23
.5%
b26
.0%
b33
.5%
29.9
%29
.6%
30.4
%32
.7%
30.7
%31
.9%
31.9
%31
.9%
31.8
%30
.5%
32.1
%30
.0%
Cand
y 29
.6%
30.9
%26
.4%
28.9
%27
.3%
31.1
%40
.8%
a28
.8%
b26
.1%
b28
.6%
28.6
%32
.7%
27.2
%29
.6%
31.1
%33
.0%
a21
.8%
b
Frui
t drin
ks
29.4
%36
.7%
a17
.1%
b24
.9%
c31
.6%
27.9
%27
.6%
27.8
%31
.0%
27.4
%a
31.8
%b
29.1
%ab
31.3
%28
.7%
29.5
%29
.4%
29.4
%
Pota
to c
hips
, ot
her s
alty
sna
cks
28.6
%30
.2%
a23
.5%
b28
.9%
a30
.9%
a25
.3%
b39
.1%
a30
.0%
b24
.0%
c28
.4%
28.1
%29
.6%
26.1
%29
.1%
29.2
%30
.2%
a24
.7%
b
Cook
ies
and
crac
kers
26
.7%
28.9
%a
22.7
%b
24.7
%ab
27.0
%26
.4%
32.0
%a
31.0
%a
22.4
%b
26.6
%26
.3%
27.7
%24
.8%
26.7
%27
.9%
28.4
%a
22.8
%b
Soda
/pop
23
.1%
24.2
%21
.2%
22.5
%23
.1%
21.9
%37
.5%
a24
.6%
b17
.1%
c22
.9%
21.6
%25
.7%
21.4
%23
.6%
23.4
%25
.5%
a17
.6%
b
Fast
food
rest
aura
nts
17.2
%18
.7%
a15
.2%
ab14
.7%
b17
.5%
16.0
%24
.3%
a18
.6%
b13
.8%
c18
.8%
a15
.3%
b17
.4%
ab14
.4%
17.9
%17
.7%
18.1
%15
.0%
Sign
ifica
ntly
high
er (p
< .0
5)
Num
bers
with
diff
eren
t let
ters
are
sig
nific
antly
diff
eren
t tha
n ea
ch o
ther
afte
r Bon
ferro
ni c
orre
ctio
ns
*Dat
a co
llect
ed in
201
1 on
ly (n
=72
9)
Appendix B

37 Return to contents >
taB
le B
3. B
elie
fs a
Bo
ut
the
impa
ct
of
foo
d a
nd
B
ever
ag
e m
ar
ket
ing
Agr
eem
ent
wit
h st
atem
ents
on
a sc
ale
of 1
to
10 (
1=st
rong
ly d
isag
ree,
10
=str
ongl
y ag
ree)
Race
/eth
nici
tyO
verw
eigh
t or
obe
se
child
Age
of o
ldes
t ch
ildH
ouse
hold
inco
me
Polit
ical
ori
enta
tion
Gen
der
of p
aren
t
Ove
rall
n= 2
454
Whi
te
n=12
87Bl
ack
n=52
0H
ispa
nic
n=
546
No
n= 1
220
Yes
n= 1
032
2 to
5
n=45
36
to 1
1 n=
733
12 t
o 17
n=
1268
<$4
0k
n=95
2$4
0-75
k n=
891
>$7
5k
n=61
1Li
bera
l n=
467
Mod
erat
e n=
1206
Cons
erva
tive
n=
781
Fem
ale
n=17
16M
ale
n=73
8
Mea
n(S
D)M
ean
(SD)
Mea
n(S
D)M
ean
(SD)
Mea
n(S
D)M
ean
(SD)
Mea
n(S
D)M
ean
(SD)
Mea
n(S
D)M
ean
(SD)
Mea
n(S
D)M
ean
(SD)
Mea
n(S
D)M
ean
(SD)
Mea
n(S
D)M
ean
(SD)
Mea
n(S
D)
Enco
urag
es c
hild
ren
to a
sk p
aren
ts fo
r adv
ertis
ed
food
s an
d be
vera
ges
7.7
(2.4
)7.
7 (2
.5)
7.7
(2.5
)7.
9 (2
.3)
7.7
(2.4
)7.
8 (2
.4)
7.8
(2.4
)7.
8 (2
.3)
7.7
2.5
7.7
(2.5
)7.
8 (2
.4)
7.7
(2.3
)8.
2a(2
.2)
7.7b
(2.4
)7.
5b(2
.6)
7.9a
(2.4
)7.
4b(2
.5)
Affe
cts
ever
yone
, not
just
chi
ldre
n7.
7 (2
.4)
7.6a
(2.4
)7.
9b(2
.4)
7.8ab
(2.4
)7.
7 (2
.5)
7.7
(2.4
)7.
7 (2
.5)
7.7
(2.4
)7.
8 2.
4 7.
7 (2
.5)
7.8
(2.4
)7.
6 (2
.4)
7.9a
(2.2
)7.
7ab(2
.4)
7.6b
(2.5
)7.
8a(2
.4)
7.5b
(2.4
)
Incr
ease
s pr
efer
ence
s fo
r the
type
s of
food
s ad
verti
sed
7.2
(2.4
)7.
1a(2
.5)
7.3ab
(2.4
)7.
4b(2
.4)
7.1
(2.5
)7.
2 (2
.4)
7.3
(2.4
)7.
2 (2
.4)
7.1
2.5
7.2
(2.5
)7.
2 (2
.4)
7.1
(2.4
)7.
5a(2
.3)
7.1b
(2.4
)7.
1b(2
.6)
7.2
(2.5
)7.
1 (2
.4)
Prom
otes
unh
ealth
y fo
ods
6.9
(2.7
)6.
9 (2
.6)
6.8
(2.8
)7.
0 (2
.7)
6.9
(2.7
)7.
0 (2
.7)
7.0
(2.7
)7.
0 (2
.7)
6.9
(2.7
)6.
8 (2
.8)
7.0
(2.7
)7.
0 (2
.6)
7.5a
(2.5
)6.
8b(2
.7)
6.7b
(2.8
)7.
0 (2
.7)
6.8
(2.6
)
Enco
urag
es s
nack
ing
betw
een
mea
ls 6.
9 (2
.6)
6.7a
(2.7
)7.
1b(2
.5)
7.1b
(2.5
)6.
7a(2
.6)
7.0b
(2.5
)6.
9 (2
.6)
6.8
(2.6
)6.
9 2.
6 6.
9 (2
.7)
6.8
(2.6
)6.
8 (2
.5)
7.2a
(2.4
)6.
8b(2
.6)
6.8b
(2.7
)6.
9 (2
.6)
6.8
(2.5
)
Enco
urag
es u
nhea
lthy
snac
king
6.9
(2.7
)6.
8 (2
.7)
6.9
(2.7
)7.
0 (2
.7)
6.8
(2.7
)7.
0 (2
.6)
7.0
(2.8
)7.
0 (2
.7)
6.8
2.7
6.8
(2.8
)7.
0 (2
.7)
6.9
(2.6
)7.
3a(2
.5)
6.8a
(2.7
)6.
8b(2
.8)
6.9
(2.7
)6.
8 (2
.6)
Lead
s to
food
cra
ving
s6.
9 (2
.7)
6.7a
(2.7
)7.
0ab(2
.6)
7.1b
(2.6
)6.
8 (2
.8)
7.0
(2.6
)6.
9 (2
.7)
6.9
(2.7
)6.
9 2.
7 6.
9 (2
.7)
7.0
(2.6
)6.
8 (2
.6)
7.2a
(2.5
)6.
9b(2
.7)
6.7b
(2.8
)7.
0a(2
.7)
6.7b
(2.7
)
Crea
tes
eatin
g ha
bits
that
stic
k w
ith y
ou fo
r life
6.8
(2.7
)6.
6a(2
.7)
7.1b
(2.5
)7.
0b(2
.6)
6.7a
(2.7
)6.
9b(2
.6)
6.7
(2.7
)6.
8 (2
.6)
6.9
2.6
6.9
(2.7
)6.
8 (2
.7)
6.8
(2.6
)7.
2a(2
.5)
6.7b
(2.6
)6.
7b(2
.8)
6.8
(2.7
)6.
8 (2
.5)
Affe
cts
child
ren
the
mos
t6.
8 (2
.6)
6.6a
(2.7
)7.
0b(2
.6)
7.2b
(2.5
)6.
7a(2
.7)
6.9b
(2.6
)6.
7 (2
.8)
7.0
(2.5
)6.
8 2.
7 6.
8 (2
.7)
6.8
(2.6
)6.
8 (2
.5)
7.3a
(2.4
)6.
8b2.
6 6.
6b(2
.8)
6.9
(2.7
)6.
8 (2
.6)
Mak
es p
aren
ts’ j
obs
hard
er6.
5 (2
.9)
6.5
(2.9
)6.
3 (3
.0)
6.6
(2.9
)6.
4a(2
.9)
6.6b
(2.9
)6.
6 (2
.8)
6.6
(2.9
)6.
4 2.
9 6.
5 (3
.0)
6.6
(2.9
)6.
4 (2
.9)
6.8a
(2.7
)6.
4b(2
.9)
6.5ab
(2.9
)6.
5 (2
.9)
6.6
(2.8
)
Caus
es c
hild
ren
to e
at m
ore
6.3
(2.8
)6.
2a(2
.8)
6.5ab
(2.8
)6.
6b(2
.8)
6.2a
(2.8
)6.
5b(2
.8)
6.2
(2.8
)6.
3 (2
.8)
6.4
2.8
6.4
(2.8
)6.
3 (2
.8)
6.3
(2.8
)6.
7a(2
.7)
6.3b
(2.8
)6.
3b(2
.9)
6.3
(2.9
)6.
4 (2
.7)
Enco
urag
es la
rge
porti
ons
6.2
(2.8
)6.
1 (2
.9)
6.3
(2.8
)6.
3 (2
.8)
6.0a
(2.9
)6.
4b(2
.8)
6.1
(2.8
)6.
2 (2
.8)
6.9
2.9
6.1
(2.9
)6.
2 (2
.9)
6.2
(2.8
)6.
5a(2
.8)
6.1b
(2.8
)6.
2ab(2
.9)
6.2
(2.9
)6.
2 (2
.7)
Affe
cts
wha
t you
buy
for y
our c
hild
ren
6.1
(2.8
)5.
8a(2
.9)
6.4b
(2.8
)6.
3b(2
.8)
5.9a
(2.9
)6.
2b(2
.8)
6.1
(2.8
)6.
1 (2
.8)
6.1
2.9
6.1
(2.9
)6.
1 (2
.8)
6.0
(2.7
)6.
2 (2
.8)
6.1
(2.8
)6.
0 (2
.9)
6.0
(2.9
)6.
2 (2
.7)
Sign
ifica
ntly
high
er (p
< .0
5)
Num
bers
with
diff
eren
t let
ters
are
sig
nific
antly
diff
eren
t tha
n ea
ch o
ther
afte
r Tuk
ey's
mul
tiple
com
paris
ion
at 0
.05
Appendix B

38 Return to contents >
Race
/eth
nici
tyO
verw
eigh
t or
obe
se c
hild
Age
of o
ldes
t ch
ildHo
useh
old
inco
me
Polit
ical
iden
tific
atio
nG
ende
r of
par
ent
Ove
rall
n= 2
454
Whi
te
n=12
87Bl
ack
n=52
0H
ispa
nic
n=54
6N
o n=
122
0Ye
s n=
103
22
to 5
n=
453
6 to
11
n=73
312
to
17
n=12
68<
$40k
n=
952
$40-
75k
n=89
1>
$75k
n=
611
Libe
ral
n=46
7M
oder
ate
n=12
06Co
nser
vati
ve
n=78
1Fe
mal
e n=
1716
Mal
e n=
738
Mea
n(S
D)M
ean
(SD)
Mea
n(S
D)M
ean
(SD)
Mea
n(S
D)M
ean
(SD)
Mea
n(S
D)M
ean
(SD)
Mea
n(S
D)M
ean
(SD)
Mea
n(S
D)M
ean
(SD)
Mea
n(S
D)M
ean
(SD)
Mea
n(S
D)M
ean
(SD)
Mea
n(S
D)
TV c
omm
ercia
ls7.
4 (2
.6)
7.3
(2.6
)7.
4 (2
.7)
7.6
(2.5
)7.
3a(2
.7)
7.6b
(2.5
)7.
0a(2
.8)
7.5b
(2.6
)7.
5b(2
.5)
7.4
(2.7
)7.
5 (2
.5)
7.3
(2.6
)7.
5 (2
.6)
7.4
(2.6
)7.
4 (2
.6)
7.4
(2.7
)7.
4 (2
.4)
Prom
otio
ns in
sto
res
6.4
(2.7
)6.
3a(2
.7)
6.6ab
(2.8
)6.
6b(2
.5)
6.2a
(2.7
)6.
6b(2
.6)
6.1a
(2.9
)6.
5b(2
.6)
6.5b
(2.6
)6.
4 (2
.7)
6.6
(2.6
)6.
3 (2
.6)
6.5
(2.7
)6.
4 (2
.7)
6.4
(2.5
)6.
4 (2
.7)
6.5
(2.6
)
Carto
on c
hara
cter
s on
pac
kage
s6.
2 (2
.9)
5.9a
(2.9
)6.
3b(3
.0)
6.6b
(2.8
)6.
4a(2
.8)
5.9b
(3.0
)6.
9a(2
.8)
6.7a
(2.7
)5.
7b(3
.0)
6.3
(3.0
)6.
2 (2
.9)
6.0
(2.9
)6.
0 (3
.0)
6.3
(2.9
)6.
1 (2
.9)
6.2
(3.0
)6.
2 (2
.7)
Com
mer
cials
befo
re m
ovie
s5.
8 (2
.8)
5.5a
(2.8
)6.
1b(2
.8)
6.3b
(2.7
)5.
6a(2
.8)
6.1b
(2.7
)5.
4a(3
.0)
5.8b
(2.8
)6.
0b(2
.7)
5.8
(2.8
)6.
0 (2
.8)
5.7
(2.8
)5.
6 (2
.8)
5.9
(2.8
)5.
9 (2
.8)
5.8
(2.8
)5.
9 (2
.7)
Toys
/giv
eaw
ays
5.6
(3.0
)5.
4a(3
.0)
5.7ab
(2.9
)5.
9b(2
.9)
5.4a
(3.0
)5.
9b(2
.9)
5.2a
(3.1
)5.
9b(2
.9)
5.6a
(2.9
)5.
5 (3
.0)
5.8
(2.9
)5.
5 (2
.9)
5.5
(3.0
)5.
6 (3
.0)
5.6
(3.0
)5.
5 (3
.0)
5.7
(2.8
)
Prod
uct p
lace
men
ts5.
5 (2
.8)
5.3a
(2.8
)5.
7b(2
.9)
5.8b
(2.8
)5.
3a(2
.8)
5.8b
(2.8
)5.
1a3.
0 5.
4ab(2
.8)
5.7b
(2.8
)5.
5 (2
.9)
5.6
(2.8
)5.
5 (2
.9)
5.3
(2.7
)5.
5 (2
.8)
5.6
(2.9
)5.
4a(2
.9)
5.8b
(2.7
)
Food
/bev
erag
e lo
gos
on o
ther
pro
duct
s5.
4 (2
.8)
5.2a
(2.8
)5.
7b(2
.9)
5.6b
(2.8
)5.
2a(2
.8)
5.7b
(2.7
)5.
4 (2
.9)
5.4
(2.8
)5.
4 (2
.8)
5.5
(2.8
)5.
5 (2
.8)
5.2
(2.8
)5.
2 (2
.7)
5.5
(2.8
)5.
5 (2
.8)
5.3a
(2.8
)5.
6b(2
.7)
Billb
oard
s/ou
tdoo
r sig
ns5.
2 (2
.7)
4.9a
(2.7
)5.
6b(2
.8)
5.5b
(2.7
)5.
0a(2
.7)
5.5b
(2.7
)4.
9a(2
.9)
5.2ab
(2.8
)5.
4b(2
.7)
5.2
(2.8
)5.
3 (2
.7)
5.2
(2.8
)5.
0 (2
.7)
5.2
(2.8
)5.
3 (2
.7)
5.2
(2.8
)5.
4 (2
.6)
Adve
rtisin
g/sp
onso
rshi
ps in
sch
ools
5.0
(2.9
)4.
6a(2
.9)
5.4b
(2.9
)5.
4b(2
.8)
4.8a
(2.9
)5.
3b(2
.8)
4.1a
(3.1
)5.
1b(2
.8)
5.2b
(2.8
)5.
0 (2
.9)
5.0
(2.9
)5.
0 (2
.9)
4.7a
(2.8
)5.
1b(2
.9)
5.1ab
(3.0
)4.
9a(2
.9)
5.3b
(2.8
)
Cele
brity
end
orse
men
ts
4.9
(3.0
)4.
6a(3
.0)
5.4b
(3.0
)5.
1b(3
.0)
4.6a
(2.9
)5.
3b(2
.9)
3.8a
(3.0
)4.
8b(3
.0)
5.4c
(2.9
)4.
8 (3
.0)
4.9
(3.0
)5.
0 (3
.0)
4.7
(2.9
)4.
9 (3
.0)
5.0
(3.0
)4.
7a(3
.0)
5.3b
(2.9
)
Radi
o co
mm
ercia
ls4.
8 (2
.8)
4.7a
(2.7
)5.
2b(2
.8)
4.9ab
(2.8
)4.
6a(2
.7)
5.1b
(2.8
)4.
2a(2
.8)
4.7b
(2.8
)5.
2c(2
.7)
4.7
(2.8
)5.
0 (2
.8)
4.9
(2.8
)4.
5a(2
.7)
4.9a
(2.7
)5.
0b(2
.9)
4.7a
(2.8
)5.
2b(2
.7)
Adve
rgam
es4.
6 (3
.0)
4.3a
(3.0
)5.
1b(3
.0)
4.8b
(3.1
)4.
8a(3
.0)
4.4b
(3.0
)3.
6a(3
.1)
4.5b
(3.0
)5.
0c(2
.9)
4.6
(3.0
)4.
7 (3
.1)
4.5
(3.0
)4.
3 (2
.9)
4.6
(3.0
)4.
6 (3
.1)
4.4a
(3.0
)4.
9b(3
.0)
Food
com
pany
-spo
nsor
ed w
ebsit
es4.
4 (2
.9)
4.2a
(2.9
)4.
8b(2
.9)
4.6b
(2.9
)4.
2a(2
.9)
4.7b
(2.9
)3.
5a(2
.9)
4.2b
(2.9
)4.
9c(2
.8)
4.4
(2.9
)4.
4 (3
.0)
4.5
(2.9
)4.
1a(2
.8)
4.5ab
(2.9
)4.
6b(3
.0)
4.3a
(2.9
)4.
9b(2
.9)
Spor
ting
even
t/con
cert
spon
sors
hips
4.4
(2.9
)4.
0a(2
.9)
4.8b
(3.0
)4.
7b(2
.9)
4.2a
(2.9
)4.
6b(2
.9)
3.5a
(2.9
)4.
0b2.
8 4.
9c(2
.9)
4.3
(2.9
)4.
4 (2
.9)
4.5
(2.9
)4.
1a(2
.8)
4.4ab
(2.9
)4.
5b(3
.0)
4.2a
(2.9
)4.
8b(2
.9)
Inte
rnet
/ban
ner a
ds4.
3 (2
.9)
4.1a
(2.9
)4.
7b(3
.0)
4.5b
(2.9
)4.
1a(2
.9)
4.6b
(3.0
)4.
5a(3
.0)
4.0b
(2.9
)4.
8c(2
.9)
4.3
(2.9
)4.
4 (3
.0)
4.4
(2.9
)4.
1 (2
.8)
4.3
(2.9
)4.
5 (3
.0)
4.2a
(3.0
)4.
7b(2
.9)
Socia
l med
ia4.
1 (3
.0)
3.8a
(3.0
)4.
5b(3
.1)
4.3b
(3.0
)3.
9a(2
.9)
4.4b
(3.1
)2.
9a(2
.8)
3.6b
(2.9
)4.
8c(3
.0)
4.1
(3.0
)4.
1 (3
.0)
4.2
(3.0
)3.
8a(2
.8)
4.1ab
(3.0
)4.
3b(3
.1)
3.9a
(3.0
)4.
5b(2
.9)
Vira
l mar
ketin
g3.
7 (2
.9)
3.5a
(2.8
)4.
2b(3
.0)
3.9b
(3.0
)3.
5a(2
.8)
4.0b
(3.0
)3.
0a(2
.9)
3.3a
(2.8
)4.
2b(2
.9)
3.6
(2.9
)3.
7 (2
.9)
3.9
(3.0
)3.
3a(2
.7)
3.7b
(2.9
)4.
0b(3
.1)
3.5a
(2.9
)4.
2b(2
.9)
Mob
ile m
arke
ting
3.3
(2.8
)3.
1a(2
.7)
3.7b
(3.0
)3.
5b(2
.9)
3.1a
(2.7
)3.
6b(2
.9)
2.8a
(2.7
)3.
0a(2
.7)
3.7b
(2.9
)3.
2 (2
.8)
3.2
(2.8
)3.
5 (2
.9)
2.8a
(2.6
)3.
3b(2
.8)
3.5b
(3.0
)3.
1a(2
.8)
3.7b
(2.9
)
Sign
ifica
ntly
high
er (p
< .0
5)
Num
bers
with
diff
eren
t let
ters
are
sig
nific
antly
diff
eren
t tha
n ea
ch o
ther
afte
r Tuk
ey’s
mul
tiple
com
paris
ion
at 0
.05
taB
le
B4.
per
cep
tio
ns
aB
ou
t th
e im
pac
t o
f d
iffe
ren
t ty
pes
of
foo
d a
nd
Bev
era
ge
ma
rk
etin
g o
n c
hil
dr
en’s
ea
tin
g h
aB
its
Rat
ings
of
impa
ct f
rom
1 t
o 10
(1=
no im
pact
, 10=
very
str
ong
impa
ct)
Appendix B

39 Return to contents >
Belie
fs a
bout
the
impa
ct o
f fo
od a
nd b
ever
age
mar
ketin
g
Agr
eem
ent
on a
sca
le o
f 1
to 1
0 (1
=str
ongl
y di
sagr
ee, 1
0=st
rong
ly a
gree
)
2009
n=
859
2010
n=
797
2011
n=
798
Mea
n(S
D)M
ean
(SD)
Mea
n(S
D)
Enco
urag
es la
rge
porti
ons
6.0a
(2.9
)6.
3ab(2
.9)
6.3b
(2.8
)
Appendix B
taB
le B
5. c
ha
ng
es i
n p
erc
epti
on
s a
Bo
ut
the
impa
ct
o
f fo
od
ma
rk
etin
g
(200
9 to
201
1)*
Perc
eptio
ns a
bout
the
impa
ct o
f di
ffer
ent
type
s of
foo
d an
d be
vera
ge
mar
ketin
g on
chi
ldre
n's
eatin
g ha
bits
Rat
ings
fro
m 1
to
10 (
1=no
impa
ct, 1
0=ve
ry s
tron
g im
pact
)
2009
n=85
9
2010
n=79
7
2011
n=79
8
Mea
n(S
D)M
ean
(SD)
Mea
n(S
D)
Prom
otio
ns in
sto
res
6.2a
(2.7
)6.
3a(2
.7)
6.8b
(2.6
)
Com
mer
cials
befo
re m
ovie
s5.
7a(2
.8)
5.8ab
(2.9
)6.
1b(2
.7)
Toys
and
giv
eaw
ays
5.4a
(3.0
)5.
6ab(3
.0)
5.8b
(2.9
)
Prod
uct p
lace
men
ts5.
3a(2
.9)
5.7ab
(2.8
)5.
7b(2
.8)
Food
/bev
erag
e lo
gos
on o
ther
pro
duct
s5.
2a(2
.8)
5.4ab
(2.8
)5.
6b(2
.8)
Billb
oard
s, ou
tdoo
r sig
ns5.
0a(2
.7)
5.1a
(2.8
)5.
6b(2
.7)
Adve
rtisin
g/sp
onso
rshi
ps in
sch
ools
4.7a
(2.9
)5.
1b(2
.9)
5.3b
(2.9
)
Cele
brity
end
orse
men
ts
4.7a
(2.9
)4.
9ab(3
.0)
5.1b
(3.0
)
Radi
o co
mm
erica
ls4.
6a(2
.7)
4.8ab
(2.8
)5.
1b(2
.8)
Adve
rgam
es4.
1a(3
.0)
4.7b
(3.0
)5.
0b(3
.0)
Food
com
pany
-spo
nsor
ed w
ebsit
es4.
0a(2
.8)
4.5b
(3.0
)4.
8b(2
.9)
Spor
ting
even
t or c
once
rt sp
onso
rshi
ps4.
0a(2
.8)
4.4b
(2.9
)4.
7b(3
.0)
Inte
rnet
, ban
ner a
ds3.
8a(2
.8)
4.5b
(2.9
)4.
7b(3
.0)
Socia
l med
ia3.
6a(2
.9)
4.2b
(3.0
)4.
5b(3
.1)
Vira
l mar
ketin
g3.
4a(2
.8)
3.8b
(3.0
)4.
0b(3
.0)
Mob
ile m
arke
ting
2.9a
(2.6
)3.
4b(2
.8)
3.7b
(3.0
)
Sign
ifica
ntly
high
er (p
< .0
5)
Num
bers
with
diff
eren
t let
ters
are
sig
nific
antly
diff
eren
t tha
n ea
ch o
ther
afte
r Tuk
ey’s
mul
tiple
com
paris
ion
at 0
.05
*Sig
nific
ant i
ncre
ases
from
200
9 to
201
1

40 Return to contents >
taB
le B
6. p
erc
eiv
ed o
Bs
tac
les
to
en
su
rin
g h
ealt
hy
ea
tin
g
ha
Bit
s f
or
ch
ild
ren
Rat
ing
on a
sca
le f
rom
1 t
o 10
(1
=not
at
all a
n ob
stac
le ,
10=v
ery
muc
h an
obs
tacl
e )
Race
/eth
nici
tyO
verw
eigh
t or
obe
se
child
Age
of o
ldes
t ch
ildH
ouse
hold
inco
me
Polit
ical
ori
enta
tion
Gen
der
of p
aren
t
Ove
rall
n= 2
454
Whi
te
n=12
87Bl
ack
n=
520
His
pani
c
n=54
6N
o n=
122
0Ye
s n=
103
22
to 5
n=
453
6 to
11
n=73
312
to
17
n=12
68<
$40k
n=
952
$40-
75k
n=89
1>
$75k
n=
611
Libe
ral
n=46
7M
oder
ate
n=12
06Co
nser
vati
ve
n=78
1Fe
mal
e n=
1716
Mal
e n=
738
Mea
n(S
D)M
ean
(SD)
Mea
n(S
D)M
ean
(SD)
Mea
n(S
D)M
ean
(SD)
Mea
n(S
D)M
ean
(SD)
Mea
n(S
D)M
ean
(SD)
Mea
n(S
D)M
ean
(SD)
Mea
n(S
D)M
ean
(SD)
Mea
n(S
D)M
ean
(SD)
Mea
n(S
D)
Expe
nsiv
e co
st o
f org
anic
food
7.2
(2.8
)7.
1 (2
.8)
7.2
(2.8
)7.
3 (2
.6)
7.0a
(2.9
)7.
3b(2
.9)
7.0
(2.8
)7.
1 (2
.9)
7.3
(2.7
)7.
3a(2
.8)
7.3a
(2.8
)6.
9b(2
.7)
7.3a
(2.8
)7.
3a(2
.7)
6.9b
(2.8
)7.
3a(2
.8)
6.8b
(2.7
)
Expe
nsiv
e co
st o
f hea
lthy
food
s7.
1 (2
.7)
7.1
(2.7
)7.
1 (2
.7)
7.3
(2.5
)7.
0a(2
.8)
7.4b
(2.8
)6.
9 (2
.7)
7.0
(2.8
)7.
2 (2
.6)
7.3a
(2.6
)7.
3a(2
.6)
6.6b
(2.8
)7.
3 (2
.6)
7.1
(2.7
)7.
0 (2
.7)
7.3a
(2.7
)6.
7b(2
.6)
Easy
acc
ess
to fa
st fo
od re
stau
rant
s6.
6 (2
.8)
6.4a
(2.8
)7.
0b(2
.8)
6.9b
(2.7
)6.
5a(2
.8)
6.8b
(2.8
)6.
5 (2
.9)
6.6
(2.8
)6.
7 (2
.8)
6.7
(2.9
)6.
7 (2
.8)
6.5
(2.8
)6.
9a(2
.7)
6.6ab
(2.8
)6.
5b(2
.8)
6.6
(2.9
)6.
7 (2
.6)
Prev
alen
ce o
f sna
ck fo
ods
and
junk
food
s6.
5 (2
.7)
6.4a
(2.7
)6.
7b(2
.7)
6.8b
(2.7
)6.
5 (2
.7)
6.6
(2.7
)6.
3a(2
.8)
6.5ab
(2.7
)6.
7b(2
.6)
6.7
(2.7
)6.
5 (2
.7)
6.5
(2.7
)6.
7 (2
.6)
6.6
(2.7
)6.
4 (2
.8)
6.5
(2.7
)6.
7 (2
.6)
Too
muc
h tim
e w
atch
ing
TV o
r spe
nt o
n th
e co
mpu
ter
6.5
(2.8
)6.
3a(2
.8)
6.5ab
(2.9
)6.
8b(2
.8)
6.3a
(2.9
)6.
7b(2
.9)
6.2a
(2.9
)6.
2a(2
.9)
6.8b
(2.7
)6.
4 (2
.9)
6.6
(2.8
)6.
4 (2
.8)
6.7
(2.7
)6.
4 (2
.9)
6.5
(2.8
)6.
4 (2
.9)
6.6
(2.7
)
Unhe
alth
y fo
od a
dver
tisin
g6.
1 (2
.8)
6.0a
(2.8
)6.
4b(2
.8)
6.3b
(2.7
)6.
0a(2
.8)
6.4b
(2.8
)5.
9 (2
.8)
6.2
(2.8
)6.
2 (2
.8)
6.2
(2.8
)6.
2 (2
.8)
5.9
(2.8
)6.
3 (2
.7)
6.2
(2.8
)6.
0 (2
.9)
6.1
(2.8
)6.
3 (2
.7)
Unhe
alth
y fo
od s
old
in s
choo
ls6.
1 (2
.9)
5.8a
(2.9
)6.
3b(2
.9)
6.5b
(2.8
)5.
9a(2
.9)
6.2b
(2.9
)5.
7a(3
.0)
6.0ab
(2.9
)6.
3b(2
.8)
6.2
(2.8
)6.
0 (3
.0)
6.0
(2.8
)6.
3 (2
.8)
6.1
(2.9
)6.
0 (2
.9)
6.1
(3.0
)6.
2 (2
.6)
Giv
ing
in to
chi
ldre
n's
requ
ests
for u
nhea
lthy
food
s6.
0 (2
.8)
5.7a
(2.8
)6.
3b(2
.9)
6.3b
(2.8
)5.
8a(2
.9)
6.2b
(2.9
)6.
0 (2
.8)
6.0
(2.9
)6.
1 (2
.8)
6.2a
(2.8
)6.
0ab(2
.8)
5.7b
(2.8
)6.
1 (2
.7)
6.1
(2.8
)5.
9 (2
.9)
6.0
(2.9
)6.
1 (2
.6)
Me
bein
g a
poor
role
mod
el w
ith m
y ow
n ea
ting
habi
ts5.
9 (2
.9)
5.7a
(2.9
)6.
2b(3
.0)
6.0ab
(2.9
)5.
6a(2
.9)
6.2b
(2.9
)5.
9 (2
.9)
5.8
(2.9
)5.
9 (2
.9)
6.1a
(2.9
)5.
8ab(2
.9)
5.7b
(2.8
)5.
9 (2
.9)
5.9
(2.9
)5.
8 (2
.9)
5.9
(3.0
)5.
9 (2
.7)
Eatin
g ou
t of t
he h
ouse
5.8
(2.9
)5.
7a(2
.9)
6.1b
(3.0
)6.
0ab(2
.9)
5.8
(3.0
)5.
9 (3
.0)
5.7ab
(2.9
)5.
7a(3
.0)
6.0b
(2.9
)5.
8 (3
.0)
5.8
(2.8
)5.
8 (2
.9)
5.9
(2.8
)5.
8 (2
.9)
5.8
(2.9
)5.
7a(3
.0)
6.1b
(2.7
)
Prev
alen
ce o
f ven
ding
mac
hine
s5.
8 (3
.0)
5.5a
(3.0
)6.
2b(3
.0)
6.2b
(2.9
)5.
6a(3
.0)
6.0b
(3.0
)5.
4a(3
.1)
5.6a
(3.1
)6.
1b(2
.9)
6.0a
(2.9
)5.
7b(3
.0)
5.6b
(3.0
)5.
8 (2
.9)
5.9
(2.9
)5.
6 3.
0 5.
7 (3
.1)
6.0
(2.8
)
Not
eno
ugh
time
to p
repa
re h
ealh
y m
eals
5.7
(2.9
)5.
6a(2
.8)
5.9b
(2.9
)5.
9ab(2
.9)
5.6
(2.9
)5.
8 (2
.9)
5.8
(2.8
)5.
6 (2
.9)
5.8
(2.9
)5.
8 (2
.9)
5.7
(2.8
)5.
6 (2
.9)
5.8
(2.9
)5.
8 (2
.8)
5.6
(2.9
)5.
7 (2
.9)
5.8
(2.7
)
Rela
tives
ser
ving
wha
t the
y lik
e5.
7 (2
.8)
5.3a
(2.8
)6.
1b(2
.9)
6.0b
(2.8
)5.
5a(2
.8)
5.8b
(2.8
)5.
6 (2
.8)
5.7
(2.9
)5.
6 (2
.8)
5.9a
(2.8
)5.
6ab(2
.8)
5.4b
(2.8
)5.
6ab(2
.8)
5.8a
(2.7
)5.
5b(2
.9)
5.6
(2.9
)5.
7 (2
.6)
Peer
pre
ssur
e to
eat
unh
ealth
y fo
ods
5.6
(2.8
)5.
5a(2
.8)
5.8b
(2.9
)5.
9b(2
.9)
5.5
(2.9
)5.
7 (2
.9)
5.3a
(2.8
)5.
7ab(2
.8)
5.7b
(2.8
)5.
8 (2
.9)
5.6
(2.8
)5.
5 (2
.8)
5.7
(2.7
)5.
7 (2
.8)
5.6
(2.9
)5.
5a(2
.9)
5.9b
(2.7
)
Not
eno
ugh
com
mun
ity p
rogr
ams
that
sup
port
heal
thy
eatin
g5.
6 (2
.9)
5.2a
(2.9
)6.
0b(2
.9)
6.2b
(2.8
)5.
5a(2
.9)
5.7b
(2.9
)5.
5 (3
.0)
5.6
(2.9
)5.
7 (2
.9)
6.0a
(2.9
)5.
5b(2
.9)
5.2b
(2.8
)5.
7a(2
.8)
5.8a
(2.8
)5.
3b(3
.0)
5.6
(2.9
)5.
6 (2
.8)
Not
eno
ugh
time
for f
amily
mea
ls5.
5 (3
.0)
5.5
(3.0
)5.
8 (3
.1)
5.5
(3.0
)5.
5 (3
.1)
5.6
(3.1
)5.
4ab(3
.0)
5.3a
(3.0
)5.
8b(3
.0)
5.6
(3.1
)5.
6 (3
.0)
5.4
(3.0
)5.
6 (3
.0)
5.5
(3.0
)5.
6 (3
.0)
5.5
(3.1
)5.
7 (2
.9)
Sign
ifica
ntly
high
er (p
< .0
5)
Num
bers
with
diff
eren
t let
ters
are
sig
nific
antly
diff
eren
t tha
n ea
ch o
ther
afte
r Tuk
ey's
mul
tiple
com
paris
ion
at 0
.05
Appendix B

41 Return to contents >
taB
le B
7. p
erc
epti
on
s a
Bo
ut
the
neg
ati
ve
infl
uen
ce
of
dif
fer
ent
ins
titu
tio
ns
an
d i
nd
ivid
ua
ls i
n p
ro
mo
tin
g
hea
lth
y e
ati
ng
ha
Bit
s
Perc
ent
of p
aren
ts r
espo
ndin
g 1
to 5
on
a 10
-poi
nt s
cale
(1
=bad
influ
ence
, 10=
good
influ
ence
)
Race
/eth
nici
tyO
verw
eigh
t or
ob
ese
child
Age
of o
ldes
t ch
ildH
ouse
hold
inco
me
Polit
ical
ori
enta
tion
Gen
der
of p
aren
t
Ove
rall
n= 2
454
Whi
te
n=12
87Bl
ack
n=
520
His
pani
c n=
546
No
n= 1
220
Yes
n= 1
032
2 to
5
n=45
36
to 1
1 n=
733
12 t
o 17
n=
1268
<$4
0k
n=95
2$4
0-75
k n=
891
>$7
5k
n=61
1Li
bera
l n=
467
Mod
erat
e n=
1206
Cons
erva
tive
n=
781
Fem
ale
n=17
16M
ale
n=73
8
Perc
ent
Perc
ent
Perc
ent
Perc
ent
Perc
ent
Perc
ent
Perc
ent
Perc
ent
Perc
ent
Perc
ent
Perc
ent
Perc
ent
Perc
ent
Perc
ent
Perc
ent
Perc
ent
Perc
ent
Med
ia68
.5%
71.3
%a
62.9
%b
67.4
%ab
66.9
%a
70.8
%b
70.6
%69
.2%
67.4
%67
.1%
70.7
%67
.6%
73.2
%a
67.4
%b
67.5
%b
69.3
%66
.8%
Food
indu
stry
61
.2%
62.1
%57
.7%
61.7
%60
.2%
63.0
%62
.0%
63.8
%59
.5%
62.4
%61
.4%
59.1
%68
.1%
a62
.1%
b55
.7%
c62
.1%
59.1
%
Gov
ernm
ent
54.9
%59
.1%
a50
.0%
b51
.3%
b54
.7%
55.2
%58
.1%
56.2
%53
.1%
57.9
%a
55.4
%a
49.6
%b
50.3
%a
56.6
%b
55.1
%ab
55.7
%53
.1%
Your
chi
ldre
n's
peer
s 50
.5%
52.5
%a
48.7
%ab
46.2
%b
50.4
%51
.1%
47.5
%50
.5%
51.5
%53
.3%
a50
.7%
ab45
.7%
b51
.6%
51.7
%47
.9%
49.5
%52
.6%
Loca
l com
mun
ities
41
.9%
43.7
%a
41.2
%ab
38.3
%b
40.6
%43
.0%
43.9
%43
.8%
40.1
%43
.8%
a42
.8%
a37
.6%
b40
.9%
43.5
%40
.0%
42.6
%40
.2%
Scho
ols
31.6
%33
.3%
28.7
%29
.7%
30.9
%32
.7%
33.1
%32
.3%
30.7
%32
.4%
ab33
.1%
a28
.3%
b32
.1%
32.3
%30
.4%
32.4
%29
.8%
Your
fam
ily15
.2%
14.7
%16
.7%
13.7
%15
.5%
14.9
%16
.8%
16.9
%13
.7%
17.7
%a
15.2
%ab
11.6
%b
15.2
%a
18.0
%a
11.0
%b
15.4
%14
.9%
Your
self
10.7
%10
.9%
a11
.7%
a7.
9%b
11.0
%10
.2%
12.1
%ab
12.7
%a
9.1%
b12
.4%
a10
.7%
ab8.
2%b
10.1
%ab
12.8
%a
7.9%
b10
.3%
11.7
%
Sign
ifica
ntly
high
er (p
< .0
5)
Num
bers
with
diff
eren
t let
ters
are
sig
nific
antly
diff
eren
t tha
n ea
ch o
ther
afte
r Bon
ferro
ni c
orre
ctio
ns
Appendix B

42 Return to contents >
Perc
eive
d ob
stac
les
to e
nsur
ing
heal
thy
eatin
g ha
bits
R
atin
g on
a s
cale
fro
m 1
to
10
(1=n
ot a
t al
l an
obst
acle
, 10
=ver
y m
uch
an o
bsta
cle
)
2009
n=
859
2010
n=
797
2011
n=
798
Mea
n(S
D)M
ean
(SD)
Mea
n(S
D)
Expe
nsiv
e co
st o
f hea
lthy
food
s7.
0a(2
.8)
7.0a
(2.6
)7.
4b(2
.5)
Unh
ealth
y fo
od a
dver
tisin
g6.
0a(2
.8)
6.0a
(2.8
)6.
4b(2
.7)
Unh
ealth
y fo
od s
old
in s
choo
ls5.
9a(2
.9)
6.1ab
(2.9
)6.
3b(2
.8)
Eatin
g ou
t of t
he h
ouse
5.6a
(3.0
)5.
7a(3
.0)
6.3b
(2.7
)
Not
eno
ugh
time
to p
repa
re h
ealth
y m
eals
5.5a
(2.9
)5.
6a(2
.9)
6.0b
(2.8
)
Rela
tives
ser
ving
wha
t the
y lik
e5.
2a(2
.8)
5.7b
(2.8
)6.
1c(2
.7)
Peer
pre
ssur
e to
eat
unh
ealth
y fo
ods
5.3a
(2.8
)5.
6a(2
.8)
6.1b
(2.7
)
Not
eno
ugh
com
mun
ity p
rogr
ams
that
sup
port
he
alth
y ea
ting
5.5a
(2.9
)5.
5ab(2
.9)
5.8b
(2.9
)
Not
eno
ugh
time
for f
amily
mea
ls5.
3a(3
.0)
5.5ab
3.1
5.8b
(2.9
)
Sign
ifica
ntly
hig
her (
p <
.05)
Num
bers
with
diff
eren
t let
ters
are
sig
nific
antly
diff
eren
t tha
n ea
ch o
ther
afte
r Tuk
ey's
mul
tiple
com
paris
ion
at 0
.05
*Sig
nific
ant i
ncre
ases
from
200
9 to
201
1
Perc
eptio
ns a
bout
the
neg
ativ
e in
fluen
ce o
f di
ffer
ent
inst
itutio
ns a
nd
indi
vidu
als
in p
rom
otin
g he
alth
y ea
ting
habi
ts
Perc
ent
of p
aren
ts r
espo
ndin
g 1
to 5
on
a 10
-poi
nt s
cale
(1
=bad
influ
ence
, 10=
good
influ
ence
)
2009
n=
859
2010
n=
797
2011
n=
798
Perc
ent
Perc
ent
Perc
ent
Food
indu
stry
59.1
%a
60.1
%ab
64.5
%b
Gov
ernm
ent
54.0
%ab
52.3
%a
58.3
%b
Loca
l com
mun
ities
39.9
%a
39.9
%a
46.0
%b
Appendix B
taB
le B
8. c
ha
ng
es i
n p
erc
eiv
ed e
nv
iro
nm
enta
l in
flu
enc
es (
2009
to
201
1)*

43 Return to contents >
taB
le B
9. s
up
po
rt
for
ac
tio
ns
to
pr
om
ote
hea
lth
y e
ati
ng
h
aB
its
to
ch
ild
ren
Perc
ent
of p
aren
ts r
espo
ndin
g 6
to 1
0 on
a s
cale
of
1 to
10
(1
=defi
nite
ly w
ould
opp
ose,
10=
defin
itel
y w
ould
sup
port
)
Race
/eth
nici
tyO
verw
eigh
t or
ob
ese
child
Age
of
olde
st c
hild
Hou
seho
ld in
com
ePo
litic
al o
rien
tati
onG
ende
r of
par
ent
Ove
rall
n= 2
454
Whi
te
n=12
87Bl
ack
n=
520
His
pani
c n=
546
No
n= 1
220
Yes
n= 1
032
2 to
5
n=45
36
to 1
1 n=
733
12 t
o 17
n=
1268
<$4
0k
n=95
2$4
0-75
k n=
891
>$7
5k
n=61
1Li
bera
l n=
467
Mod
erat
e n=
1206
Cons
erva
tive
n=
781
Fem
ale
n=17
16M
ale
n=73
8
Perc
ent
Perc
ent
Perc
ent
Perc
ent
Perc
ent
Perc
ent
Perc
ent
Perc
ent
Perc
ent
Perc
ent
Perc
ent
Perc
ent
Perc
ent
Perc
ent
Perc
ent
Perc
ent
Perc
ent
Stre
ngth
en n
utrit
ion
stan
dard
s fo
r fed
eral
ly fu
nded
sch
ool l
unch
es81
.1%
78.1
%a
82.7
%b
86.3
%b
80.5
%81
.3%
79.9
%80
.9%
81.6
%80
.3%
80.8
%82
.7%
87.2
%a
79.9
%b
79.3
%b
82.5
%a
77.8
%b
Stre
ngth
en n
utrit
ion
stan
dard
s fo
r ALL
food
s an
d be
vera
ges
sold
at s
choo
l 77
.7%
74.0
%a
80.8
%b
81.7
%b
77.1
%78
.5%
76.6
%77
.5%
78.2
%76
.6%
76.8
%80
.7%
83.9
%a
76.5
%b
75.8
%b
78.1
%76
.7%
Requ
ire c
hild
ren’
s TV
prog
ram
s to
sho
w c
hild
ren
bein
g ph
ysic
ally
ac
tive
and
eatin
g he
alth
y fo
od72
.7%
67.0
%a
79.2
%b
79.9
%b
71.0
%74
.1%
74.0
%72
.9%
72.1
%74
.8%
a72
.5%
ab69
.6%
b75
.4%
a73
.8%
a69
.3%
b74
.9%
a67
.3%
b
Allo
w o
nly
heal
thy
food
s an
d be
vera
ges
in s
choo
l ven
ding
mac
hine
s72
.1%
69.2
%a
73.7
%ab
77.3
%b
70.3
%73
.7%
71.1
%ab
75.0
%a
70.7
%b
70.4
%72
.2%
74.5
%76
.2%
a72
.6%
ab68
.8%
b73
.7%
a68
.2%
b
Requ
ire re
stau
rant
s to
list
cal
orie
info
rmat
ion
on m
enus
71
.0%
66.5
%a
78.1
%b
75.1
%b
69.3
%72
.1%
71.7
%68
.6%
72.2
%71
.1%
69.1
%73
.7%
73.7
%71
.6%
68.6
%73
.6%
a65
.0%
b
Requ
ire c
hild
ren’
s m
edia
com
pani
es to
fund
pub
lic s
ervi
ce a
nnou
ncem
ents
for f
ruits
an
d ve
geta
bles
on
TV69
.5%
64.2
%a
74.8
%b
76.0
%b
68.1
%71
.1%
70.6
%71
.1%
68.1
%69
.9%
68.6
%70
.2%
71.3
%a
71.5
%a
65.3
%b
71.5
%a
64.8
%b
Do n
ot a
llow
adv
ertis
ing
on s
choo
l bus
es*
68.7
%69
.3%
62.4
%72
.3%
68.3
%69
.8%
69.8
%70
.9%
66.9
%66
.1%
69.4
%71
.4%
72.4
%69
.7%
65.2
%69
.0%
68.0
%
Requ
ire c
ompa
nies
to fu
nd e
qual
am
ount
s of
adv
ertis
ing
for h
ealth
y an
d
unhe
alth
y fo
ods.
67.5
%61
.5%
a74
.6%
b75
.5%
b65
.4%
b70
.3%
a64
.9%
67.0
%68
.8%
69.4
%66
.7%
65.8
%72
.0%
a69
.1%
a62
.5%
b70
.1%
a61
.6%
b
Allo
w o
nly
heal
thy
food
adv
ertis
ing
on T
V pr
ogra
ms
targ
eted
to c
hild
ren
unde
r 12
64.7
%59
.8%
a69
.8%
b71
.4%
b62
.5%
66.1
%68
.0%
a66
.2%
ab62
.6%
b65
.1%
63.9
%65
.1%
67.5
%a
65.5
%ab
61.7
%b
66.3
%a
61.0
%b
Allo
w o
nly
heal
thy
food
adv
ertis
ing
on T
V pr
ogra
ms
targ
eted
to y
outh
und
er 1
8 59
.9%
54.8
%a
66.2
%b
65.2
%b
58.0
%61
.1%
60.7
%61
.5%
58.7
%61
.1%
59.6
%58
.4%
62.1
%60
.0%
58.5
%61
.7%
a55
.8%
b
Allo
w c
arto
on c
hara
cter
s on
ly o
n pa
ckag
es fo
r hea
lthy
food
s 59
.2%
53.2
%a
63.9
%b
68.3
%b
55.7
%b
62.4
%a
61.6
%60
.7%
57.4
%61
.9%
57.5
%57
.5%
59.5
%60
.2%
57.4
%60
.5%
a56
.1%
b
Allo
w to
ys w
ith k
id’s
mea
ls o
nly
whe
n m
eals
mee
t hea
lthy
regu
latio
ns*
58.9
%52
.8%
a68
.2%
b66
.9%
b53
.8%
b64
.1%
a56
.4%
62.3
%57
.8%
61.1
%58
.8%
55.8
%62
.2%
a62
.8%
a51
.8%
b60
.6%
55.8
%
Do n
ot a
llow
any
adv
ertis
ing
on T
V pr
ogra
ms
targ
eted
to c
hild
ren
unde
r 857
.1%
53.6
%a
58.9
%b
63.0
%b
55.6
%57
.6%
61.8
%a
56.6
%ab
55.8
%b
56.7
%57
.8%
56.8
%60
.4%
56.7
%55
.8%
58.6
%a
53.8
%b
Do n
ot a
llow
gam
es o
r oth
er c
hild
-orie
nted
feat
ures
on
unhe
alth
y fo
od w
ebsi
tes
56.3
%52
.3%
a60
.8%
b60
.3%
b53
.0%
b59
.2%
a57
.6%
55.9
%56
.0%
56.6
%55
.7%
56.6
%54
.4%
57.9
%54
.9%
57.0
%54
.6%
Allo
w o
nly
non-
food
rew
ards
in th
e cl
assr
oom
54.7
%49
.5%
a62
.1%
b58
.8%
b51
.2%
b58
.2%
a55
.4%
55.0
%54
.3%
54.2
%54
.9%
55.2
%57
.6%
54.2
%53
.8%
55.1
%53
.7%
Tax
all s
ugar
-sw
eete
ned
soft
drin
ks a
nd u
se th
e m
oney
to p
rovi
de h
ealth
y
food
s to
chi
ldre
n48
.6%
41.1
%a
58.1
%b
56.2
%b
46.3
%50
.1%
48.8
%48
.7%
48.4
%49
.3%
47.9
%48
.5%
53.8
%a
48.1
%b
46.2
%b
48.7
%48
.2%
Do n
ot a
llow
cho
cola
te o
r oth
er fl
avor
ed m
ilk to
be
serv
ed in
sch
ools
42.5
%37
.4%
a49
.0%
b46
.8%
b38
.6%
b45
.8%
a45
.5%
41.8
%41
.9%
43.7
%ab
38.8
%a
46.1
%b
43.8
%41
.3%
43.6
%41
.5%
44.7
%
Sign
ifica
ntly
hig
her (
p <
.05)
Num
bers
with
diff
eren
t let
ters
are
sig
nific
antly
diff
eren
t tha
n ea
ch o
ther
afte
r Bon
ferr
oni c
orre
ctio
ns
*Que
stio
n as
ked
in 2
011
only
Appendix B

44 Return to contents >
taB
le B
10.
su
pp
or
t fo
r r
egu
lati
on
s t
o l
imit
sp
ecif
ic
typ
es o
f u
nh
ealt
hy
fo
od
ma
rk
etin
g t
o c
hil
dr
en u
nd
er 1
2
Perc
ent
of p
aren
ts r
espo
ndin
g 6
to 1
0 on
a s
cale
of
1 to
10
(1
=defi
nite
ly w
ould
opp
ose,
10=
defin
itel
y w
ould
sup
port
)
Race
/eth
nici
tyO
verw
eigh
t or
ob
ese
child
Age
of o
ldes
t ch
ildH
ouse
hold
inco
me
Polit
ical
ori
enta
tion
Gen
der
of p
aren
t
Ove
rall
n= 2
454
Whi
te
n=12
87Bl
ack
n=52
0H
ispa
nic
n=54
6N
o n=
122
0Ye
s n=
103
22
to 5
n=
453
6 to
11
n=73
312
to
17
n=12
68<
$40k
n=
952
$40-
75k
n=89
1>
$75k
n=
611
Libe
ral
n=46
7M
oder
ate
n=12
06Co
nser
vati
ve
n=78
1Fe
mal
e n=
1716
Mal
e n=
738
Perc
ent
Perc
ent
Perc
ent
Perc
ent
Perc
ent
Perc
ent
Perc
ent
Perc
ent
Perc
ent
Perc
ent
Perc
ent
Perc
ent
Perc
ent
Perc
ent
Perc
ent
Perc
ent
Perc
ent
Adve
rtisin
g/sp
onso
rshi
ps in
sch
ools
64.8
%64
.0%
65.8
%65
.2%
65.1
%65
.7%
64.2
%66
.0%
64.4
%63
.6%
a63
.4%
ab69
.1%
b67
.5%
64.2
%64
.4%
65.3
%63
.8%
Mob
ile m
arke
ting
64.5
%65
.4%
63.5
%63
.4%
63.6
%67
.0%
58.7
%a
62.1
%a
67.9
%b
59.6
%a
65.7
%b
70.4
%b
69.8
%a
61.7
%b
65.6
%ab
64.5
%64
.4%
TV c
omm
ercia
ls62
.8%
60.1
%a
65.8
%b
65.8
%b
61.4
%63
.0%
64.5
%64
.7%
61.0
%63
.2%
62.4
%62
.5%
64.0
%63
.8%
60.4
%63
.7%
60.6
%
Vira
l mar
ketin
g61
.6%
62.2
%60
.6%
60.8
%60
.0%
63.9
%56
.7%
a59
.1%
a64
.8%
b56
.6%
a62
.7%
b67
.6%
b65
.3%
a59
.4%
b62
.7%
ab61
.5%
61.8
%
Inte
rnet
/ban
ner a
ds61
.2%
60.8
%62
.1%
60.6
%60
.8%
61.8
%57
.6%
a59
.1%
a63
.6%
b57
.9%
a61
.6%
ab65
.6%
b63
.0%
59.9
%62
.1%
61.4
%60
.6%
Com
mer
cials
befo
re m
ovie
s59
.2%
55.9
%a
64.8
%b
61.4
%b
57.4
%60
.4%
57.8
%61
.1%
58.5
%59
.0%
59.0
%59
.6%
60.2
%59
.5%
58.1
%59
.0%
59.5
%
Adve
rgam
es59
.1%
57.0
%a
63.1
%b
59.5
%ab
57.1
%a
61.3
%b
55.9
%58
.7%
60.5
%58
.7%
ab57
.0%
a62
.7%
b60
.8%
58.5
%59
.0%
59.4
%58
.3%
Prod
uct p
lace
men
ts57
.6%
55.6
%a
61.9
%b
59.0
%ab
59.2
%55
.7%
56.1
%58
.8%
57.5
%56
.2%
57.6
%59
.9%
60.4
%56
.3%
58.0
%58
.4%
55.8
%
Carto
on c
hara
cter
s on
pac
kage
s57
.1%
53.4
%a
62.9
%b
59.7
%b
53.6
%a
60.3
%b
57.8
%ab
60.0
%a
55.1
%b
57.6
%56
.1%
57.8
%58
.0%
57.4
%56
.1%
57.8
%55
.6%
Socia
l med
ia56
.1%
55.1
%58
.7%
56.0
%54
.4%
58.0
%49
.2%
a55
.1%
b59
.1%
b53
.5%
57.6
%57
.9%
55.9
%55
.6%
57.0
%56
.6%
54.9
%
Toys
/giv
eaw
ays
56.0
%53
.0%
a61
.4%
b57
.5%
ab54
.1%
57.8
%57
.0%
56.9
%55
.1%
57.0
%54
.0%
57.3
%54
.6%
56.6
%55
.8%
56.5
%54
.9%
Food
/bev
erag
e lo
gos
on o
ther
pro
duct
s55
.6%
52.1
%a
61.7
%b
58.8
%b
52.2
%a
58.5
%b
55.0
%56
.6%
55.2
%56
.3%
54.7
%55
.8%
52.7
%57
.0%
55.2
%56
.4%
53.8
%
Cele
brity
end
orse
men
ts
55.4
%52
.5%
a60
.4%
b57
.0%
ab53
.8%
57.2
%52
.3%
56.2
%56
.1%
56.7
%53
.8%
55.8
%53
.3%
55.6
%56
.3%
56.2
%53
.5%
Prom
otio
ns in
sto
res
53.3
%48
.4%
a60
.8%
b58
.1%
b50
.6%
54.6
%54
.5%
55.1
%52
.7%
56.2
%a
50.8
%b
52.2
%ab
48.8
%a
54.3
%b
54.3
%b
53.9
%51
.8%
Radi
o co
mm
ercia
ls52
.9%
49.4
%a
59.8
%b
54.2
%ab
51.2
%54
.2%
52.1
%52
.8%
52.8
%52
.2%
52.1
%55
.2%
51.8
%53
.8%
52.1
%53
.9%
50.7
%
Food
com
pany
-spo
nsor
ed w
ebsit
es52
.5%
50.0
%a
57.3
%b
54.2
%ab
50.4
%a
54.8
%b
49.9
%52
.1%
53.7
%53
.2%
51.6
%52
.9%
51.6
%53
.8%
51.1
%53
.3%
50.7
%
Billb
oard
s/ou
tdoo
r sig
ns52
.3%
47.3
%a
59.6
%b
57.9
%b
50.1
%53
.9%
53.6
%53
.1%
51.9
%52
.8%
51.3
%54
.0%
51.0
%53
.2%
52.6
%53
.0%
51.6
%
Spor
ting
even
t/con
cert
spon
sors
hips
51.4
%48
.1%
a56
.0%
b55
.3%
b49
.0%
a53
.9%
b48
.6%
50.9
%52
.8%
51.0
%50
.7%
53.2
%50
.5%
51.4
%52
.0%
51.6
%51
.1%
Sign
ifica
ntly
high
er (p
< .0
5)
Num
bers
with
diff
eren
t let
ters
are
sig
nific
antly
diff
eren
t tha
n ea
ch o
ther
afte
r Bon
ferro
ni c
orre
ctio
ns
Appendix B

45 Return to contents >
2009
n=
859
2010
n=
797
2011
n=
798
Perc
ent
Perc
ent
Perc
ent
Do n
ot a
llow
gam
es o
r oth
er c
hild
-orie
nted
feat
ures
on
unhe
alth
y fo
od w
ebsit
es
53.8
%a
55.6
%ab
59.7
%b
Supp
ort
for
limit
ing
spec
ific
type
s of
food
mar
keti
ng
TV c
omm
ercia
ls60
.5%
a61
.3%
a66
.5%
b
Com
mer
cials
befo
re m
ovie
s56
.1%
a60
.5%
ab61
.2%
b
Carto
on c
hara
cter
s on
pac
kage
s54
.0%
a58
.3%
ab59
.2%
b
Socia
l med
ia53
.3%
a56
.3%
ab58
.8%
b
Toys
/giv
eaw
ays
52.4
%a
58.1
%b
57.8
%b
Food
/bev
erag
e lo
gos
on o
ther
pro
duct
s51
.6%
a57
.8%
b57
.6%
b
Cele
brity
end
orse
men
ts
52.5
%a
56.3
%ab
57.6
%b
Prom
otio
ns in
sto
res
48.8
%a
56.0
%b
55.4
%b
Radi
o co
mm
erica
ls48
.9%
a53
.5%
ab56
.6%
b
Food
com
pany
-spo
nsor
ed w
ebsit
es49
.6%
a53
.3%
ab54
.9%
b
Spor
ting
even
t/con
cert
spon
sors
hips
48.4
%a
51.9
%ab
54.1
%b
Sign
ifica
ntly
high
er (p
< .0
5)
Num
bers
with
diff
eren
t let
ters
are
sig
nific
antly
diff
eren
t tha
n ea
ch o
ther
afte
r Tuk
ey’s
mul
tiple
com
paris
ion
at 0
.05
*Sig
nific
ant i
ncre
ases
from
200
9 to
201
1
Appendix B
taB
le B
11.
ch
an
ges
in
su
pp
or
t fo
r r
egu
lati
on
s (
2009
–201
1)*
Perc
ent
answ
erin
g 6
to 1
0 on
a s
cale
of
1 to
10
(1=d
efini
tely
wou
ld o
ppos
e, 1
0=de
finit
ely
wou
ld s
uppo
rt)