food research international - washington state university
TRANSCRIPT
Contents lists available at ScienceDirect
Food Research International
journal homepage: www.elsevier.com/locate/foodres
A new method to determine the water activity and the net isosteric heats ofsorption for low moisture foods at elevated temperatures
Ravi Kiran Tadapanenia, Ren Yanga, Brady Carterb, Juming Tanga,⁎
a Department of Biological Systems Engineering, Washington State University, P.O. Box 646120, Pullman, WA 99164-6120, USAb METER Group, Inc., 2365 NE Hopkins Court, Pullman, WA 99164-6120, USA
A R T I C L E I N F O
Keywords:Low-moisture foodsWater activityClausius Clapeyron equationNet isosteric heat of sorptionMoisture contentSorption isotherm
A B S T R A C T
In recent years, research studies have shown that the thermal resistance of foodborne pathogens in the lowmoisture foods is greatly influenced by the water activity (aw) at temperatures relevant to thermal treatments forpathogen control. Yet, there has been a lack of an effective method for accurate measurement of aw at thosetemperatures. Thus, the main aim of this study was to evaluate a new method for measuring aw of food samplesat elevated temperatures. An improved thermal cell with a relative humidity and temperature sensor was used tomeasure the aw of the three different food samples, namely, organic wheat flour, almond flour, and non-fat milkpowder, over the temperature range between 20 and 80 °C. For a constant moisture content, the aw data wasused to estimate the net isosteric heat of sorption (qst). The qst values were then used in the Clausius Clapeyronequation (CCE) equation to estimate the moisture sorption isotherm for all test food samples at different tem-peratures. For all the tested samples of any fixed moisture content, aw value generally increased with thetemperature. The energy for sorption decreased with increasing moisture content. With the experimentallydetermined qst value, CCE describes well about the changes in aw of the food samples between 20 and 80 °C. Thisstudy presents a method to obtain aw of a food sample for a specific moisture content at different temperatureswhich could be extended to obtain qst values for different moisture contents and hence, the moisture sorptionisotherm of a food sample at different temperatures.
1. Introduction
The food industry and research communities are facing immensechallenges in addressing emerging food safety concerns associated withthe low moisture foods. Three factors have contributed to the compli-cations in this endeavor when considering thermal treatments: 1) ve-getative bacterial pathogens become highly resistant to heat in lowmoisture environments (Villa-Rojas et al., 2013); 2) low moisture foodshave historically been considered microbiologically safe until recenthighly publicized outbreaks of pathogens in, e.g., almonds, and peanutbutters, thus there had been little reported systematic research on suchtopics (Syamaladevi, Tadapaneni, et al., 2016); and 3) there is an ur-gent need for food companies to be in compliance with rules under theFood Safety Modernization Act (FSMA), yet there is little literature forthe food industry to rely upon in developing validation protocols fordifferent legacy unit operations in production of low moisture foods ornovel thermal control methods (Syamaladevi, Tang, et al., 2016). Ourrecent research suggests that the water activity (aw) of food at treat-ment temperatures is a critical factor influencing thermal resistance of
vegetative bacterial pathogens (Syamaladevi, Tadapaneni, et al., 2016;Syamaladevi, Tang, et al., 2016; Syamaladevi, Tang, & Zhong, 2016;Tadapaneni, Syamaladevi, Villa-Rojas, & Tang, 2017). Thus, reliabledata on the aw of different foods at high temperatures are needed indeveloping effective thermal processes for low moisture foods. Yet,there has been a lack of a reported method to determine water activitiesin food matrices at high temperatures. This research was designed to fillsuch a gap.
Water activity (aw) of the food product represents the energy statusof water molecules in the food. This thermodynamic property of food isrelated to fugacity of water from food products which influences var-ious biochemical reaction rates and microbial growth in those foodcommodities (Labuza, 1975). The change in aw of food samples at aconstant moisture content (MC) over different temperatures can beestimated by determining the moisture sorption isotherms (MSI). MSIshows the relationship between aw and the equilibrium MC of foodsamples, and are determined at different temperatures. There are var-ious methods to generate MSI for a food product. The most frequentlyused method for getting a MSI is the static gravimetric technique where
http://dx.doi.org/10.1016/j.foodres.2017.09.070Received 15 July 2017; Received in revised form 20 September 2017; Accepted 25 September 2017
⁎ Corresponding author at: Biological Systems Engineering, Washington State University, P.O. Box 646120, Pullman, WA 99164-6120, USA.E-mail address: [email protected] (J. Tang).
Food Research International 102 (2017) 203–212
Available online 28 September 20170963-9969/ © 2017 Elsevier Ltd. All rights reserved.
MARK

the food samples are conditioned in closed containers with differentsaturated salt solutions and the change in weight of the food samples istracked till they reach equilibrium (Bell & Labuza, 2000). However, thetime required for food samples to be in thermodynamic equilibriumwith the humidity condition provided by saturated salt solutions maytake several days (Levoguer &Williams, 2006). Thus, the determinationof MSI for food samples at different temperatures may even take weeksto months. Another way to reduce the equilibration time for the sam-ples is by using humidity generating chambers where a system con-sisting of a computer program, air flow controllers, and a relative hu-midity sensor maintains the constant humidity level (Mermelstein,2009). Many commercial humidity generating devices employ the dy-namic dew point isotherm (DDI) or dynamic vapor sorption (DVS)methods to generate the MSI of a sample. However, these devices havelimited operating temperature ranges (4 to 60 °C). An alternativemethod to obtain MSI for food products at elevated temperatures hasbeen reported by Syamaladevi, Tadapaneni, et al. (2016) where the MCof the food sample was controlled, and the aw of the food sample wasmeasured using a thermal cell a relative humidity and temperaturesensor.
The Clausius-Clapeyron equation (CCE), named after Rudolf J.Clausius and Benoît P.É. Clapeyron, has been reported to describe thechanges in aw of food samples at a constant MC over a wide range oftemperatures (Hossain, Bala, Hossain, &Mondol, 2001; Jamali et al.,2006; Labuza, Kaanane, & Chen, 1985). The CCE was originally pro-posed to estimate the temperature influence on the aw of a pure systemin different conditions by using the net isosteric heat of sorption (qst inJ mol−1) (Labuza, 1968; Labuza et al., 1985; Tsami, Maroulis, Marinos-Kouris, & Saravacos, 1990). In applying this equation to a pure system,two assumptions are considered: 1) the MC remains constant during theaw measurement across different temperatures and 2) qst is constantover the applied temperature range. However, in complex systems likefood products, due to various interactions between food componentsand water molecules, irreversible changes can occur. Thus, it wassuggested to determine aw of food samples with at least 10 °C interval(Labuza et al., 1985).
Most of the studies have reported the application of the CCE in es-timating the isosteric heat of sorption and prediction of the aw of foodsamples up to 65 °C (Kim, Kim, Kim, Shin, & Chang, 1999; Labuza et al.,1985; Štencl, Janstova, & Drackova, 2010; Tsami, 1991). However,there have been no studies reporting the use of CCE in obtaining theMSI of food samples at higher temperatures. Thus, the objectives of thisstudy were to (1) evaluate a new aw measuring test cell for low moisturefoods covering temperatures up to 80 °C; 2) obtain aw values of threelow moisture food products between 20 and 80 °C; 3) to develop adescriptive model based on CCE for the obtained aw values.
2. Material and methods
2.1. Food materials
In this study, three food systems were used: 1) soft white organicwheat flour (OWF) (Eden Foods, Clinton, MI), 2) blanched almond flour(AF) (Nuts.com, Cranford, NJ) and 3) non-fat milk powder (NFMP)(Grade A Non-fat dry milk – low heat, Michigan Milk ProducersAssociation, Novi, MI). The proximate compositions of food samples induplicates were determined according to the standard analyticalmethods (AOAC, 2012). All the proximate data of samples are reportedas a percentage in Table 1. The proximate data indicates that the OWFsamples represented a carbohydrate-rich food product (with approxi-mately 79% w/w carbohydrates). The AF samples represented a high-fat product; they consisted of approximately 49% (w/w) fat, 21% (w/w) protein and 23% (w/w) carbohydrate content. The NFMP samplesrepresented a relatively high sugar and high protein product; theyconsisted of approximately 51% (w/w) milk sugars –mainly lactose and37% (w/w) protein content.
2.2. Conditioning of food samples
Before the measurement of aw at different temperatures, the foodsamples were conditioned to obtain different MC (in % db). The sam-ples were first vacuum dried at 50 °C with the pressure of 10 kPa forapproximately two days. Dried food samples were then placed in thejars containing saturated salt solutions to control relative humidity(RH) at room temperature (~21 °C) for approximately three weeks. Thesupersaturated salts used in this study were LiCl (11.3% RH), CH3COOK(22.5% RH), MgCl2 (32.8% RH), K2CO3 (43.2% RH), MgNO3 (52.9%RH), NaNO2 (65.8% RH), NaCl (75.3% RH) and KCl (84.3% RH)(Greenspan, 1977). The toluene solution was placed in jars with highhumidities (75 and 86% RH) to prevent any fungal/mold growth in thesamples. After the conditioning period, the MC of all samples weredetermined using a halogen moisture analyzer (Mettler-Toledo, LLC,Columbus, OH). All conditioned samples were analyzed for MC in du-plicates.
Nomenclature
AF almond flouraw water activityCCE Clausius-Clapeyron equationdb dry basisE mean relative percentage deviationG Gibb's free energy (J K−1 mol−1)ΔH total enthalpy change for the sorption process (J mol−1)HTC high-temperature cellL specific latent heat of vaporization (J mol−1)MC moisture content (% db)ms molality of salt (mol kg−1 H2O)MSI moisture sorption isothermMw molar mass of water (kg mol−1)
NFMP non-fat milk powderΦ osmotic coefficientOWF organic wheat flourP vapor pressure (Pa)qst net isosteric heat of sorption (J mol−1)R universal gas constant (8.314 J mol−1 K−1)R2 coefficient of determinationRH relative humidityRMSE root-mean-square errorS entropy of the system (J K−1 mol−1)SEP standard error of predictionT temperature (°C or K)V molar volume (m3 mol−1)ν stoichiometric number of dissociated solute ionsVSA vapor sorption analyzer
Table 1Proximate composition of food samples (average values ± SD).
OWFa AF NFMP
Moisture (% w/w) 8.3 ± 0.2 3.7 ± 0.3 4.1 ± 0.2Ash (% w/w) 1.6 ± 0.04 3.2 ± 0.1 7.9 ± 0.1Fat (% w/w) 3.3 ± 0.1 48.8 ± 0.3 0.5 ± 0.04Protein (% w/w) 7.9 ± 0.5 21.1 ± 0.3 36.8 ± 0.5Carbohydrate (by difference – % w/w) 78.9 ± 0.6 23.3 ± 0.9 50.7 ± 0.8
a Tadapaneni et al. (2017).
R.K. Tadapaneni et al. Food Research International 102 (2017) 203–212
204

2.3. New high-temperature cell (HTC)
With modifications to the thermal cell with RH sensor as reportedby Syamaladevi, Tadapaneni, et al. (2016), an improved version of thethermal cell, i.e. high-temperature cell (HTC), was developed byMETER Group, Inc. (Pullman, WA) to measure aw of food samples atdifferent temperatures (Fig. 1). The newer version of HTC consists of ananodized aluminum alloy cell with a capacitance based RH and tem-perature sensor (Honeywell HumidIcon™, Morristown, NJ). The sensorwith a working accuracy of± 2% RH was embedded in the lid. Thebottom base supported an aluminum cup to hold the samples. For themeasurement of RH, the HTC assembly was sealed using screws and anO-ring. The sensor in HTC monitored the RH and temperature of the airin the headspace above the aluminum cup and the corresponding awvalues were recorded on the computer.
The HTC was calibrated using at least four standards (unsaturatedsalt solutions) provided by AquaLab (METER Group, Inc.). Based on thetemperature and molality dependent osmotic coefficients of the saltsolutions reported in the literature (Gibbard & Scatchard, 1973;Gibbard, Scatchard, Rousseau, & Creek, 1974), the theoretical aw valuesof these standards were computed using the following equation as re-ported by Tadapaneni et al. (2017):
= −a Φ M v mexp( )w w s (1)
where, Φ is the osmotic coefficients, Mw is the molar mass of water(kg mol−1), ν is the stoichiometric number of dissociated solute ions,ms is the molality of salt (mol kg−1 H2O).
The predicted aw values from Eq. (1) were plotted against the ex-perimental aw data from HTC to obtain the linear regression basedcalibration equation for each HTC device. An extended calibration ofHTC requires the aw measurements at multiple temperatures of eachstandard solution. The single-temperature calibration involves themeasurement of aw of the standards at a single reference temperaturewhich is an expedited method. The calibration process using bothmethods improved the accuracy of the aw data from the HTC which wasindicated by the lower values of root mean squared error (RMSE). TheRMSE values for the pre-calibration (Fig. 2), extended and single-tem-perature calibration (Fig. 2) aw data were determined to be 0.027,0.009 and 0.012, respectively. In this study, the single-temperature
calibration method was applied to all the experimental aw data ob-tained from HTC.
2.4. Determination of aw at different temperatures
Each conditioned food sample of approximately 2 g was placed inthe aluminum cup inside the HTC and was sealed properly to preventany leakage. In the study of Syamaladevi, Tadapaneni, et al. (2016), ahot-air oven was used to increase the temperature of the sample in thefirst generation thermal cell which took a long time for the sample toreach the target temperatures and attain the equilibrium state at thosetemperatures. To reduce the come-up time for HTC, i.e. time needed forfood samples to reach the target temperature, and the equilibrium state,the HTC was sealed and heated in an oil bath instead of using the hot-air oven method. The HTC was thermally treated at every 10 °C tem-perature interval from 20 to 80 °C. The RH and temperature were re-corded for every 1 min. When there was no change in the RH value for asignificant time (approximately 30 min), the sample was considered tobe in an equilibrium state at the respective temperature, and the cor-responding RH of headspace (or aw of the sample) was recorded. Fig. 3shows the typical time-temperature-RH profiles of the headspace inHTC when food samples were treated at different temperatures.
To evaluate the aw data from HTC, the aw of the equilibrated foodsamples were also measured by the Vapor Sorption Analyzer (VSA)(METER Group Inc., Pullman, WA). Due to the limited operating tem-perature range in VSA, the aw of each sample was measured by VSA at10 °C temperature intervals from 20 to 50 °C without opening the lid.The aw values of OWF, AF, and NFMP were measured using the chilled-mirror dew point sensor in VSA.
Samples in duplicates were measured in both HTC and VSAmethods. The samples were weighed before and after each experiment.
2.5. Clausius-Clapeyron equation (CCE)
The derivation of Clapeyron equation is based on the two phases ofa pure substance – gaseous (g) and liquid (l) reaching the equilibriumstate (Staudt et al., 2013) and the corresponding Gibb's free energy forgaseous form (dGg in J mol−1) would be equal to the Gibb's free energyfor liquid form (dGl n J mol−1). Thus, the relation can be written as:
Fig. 1. The high-temperature cell (HTC) developed tomeasure the aw of the food samples at elevated tempera-tures.
R.K. Tadapaneni et al. Food Research International 102 (2017) 203–212
205

=dG dGg l (2)
The thermodynamic relationship of Gibb's free energy (Rizvi, 2014)is:
= −dG VdP SdT (3)
where V is the molar volume (m3 mol−1), P is the vapor pressure (Pa), Sis the entropy of the system (J K−1 mol−1), and T is the temperature(K). For equilibrium condition, Eq. (3) for gaseous and liquid phase canbe equated:
− = −V dP S dT V dP S dTg g l l (4)
Rearranging the Eq. (4),
− = −V V dP S S dT( ) ( )g l g l (5)
And further rewriting the Eq. (5),
=−−
dPdT
S SV V
( )( )
g l
g l (6)
where Vg and Vl are the molar volumes (m3 mol−1) of gaseous and li-quid phases, respectively. Using the differential entropy of sorption(ΔS) Sg − Sl = L / T, where L is the specific latent heat of vaporization(J mol−1), Eq. (6) becomes:
=−
dPdT
LV V T( )g l (7)
Taking assumption that the molar volume of the liquid phase (Vl) isnegligible in comparison to the molar volume of gaseous phase (Vg) andthe vapor phase behaves ideal gas law (Vg = RT / P), the Clapeyron Eq.(7) can be stated as
Fig. 2. Comparison of measured (A) vs. calibrated (B) aw data; different symbols represent data from different HTC systems.
Fig. 3. The time-temperature-RH profile of the headspace inthe HTC when heated to different temperatures.
R.K. Tadapaneni et al. Food Research International 102 (2017) 203–212
206

=dPdT
PLTR 2 (8)
where R is the universal gas constant (8.314 J mol−1 K−1). Furtherexpanding the Eq. (8), we get the general form of Clausius Clapeyronrelation:
=d PdT
LT
lnR 2 (9)
Considering that only moisture is exchanged between the twophases in addition to the previous assumptions of Clausius Clapeyronequation, P and L can be substituted with Pw (partial water vaporpressure in Pa) and ΔH (total enthalpy change for the sorption processin J mol−1), respectively:
= ∆d PdT
HT
lnR
w2 (10)
It is known that aw is a function of partial pressures i.e. aw = Pw / Pand with the Eqs. (9) and (10), the following relation is obtained:
= −d H LT
dTln a ΔRw 2 (11)
Integrating the Eq. (11) at fixed MC, the general form of ClausiusClapeyron equation (CCE) can be obtained as:
⎜ ⎟ ⎜ ⎟⎛⎝
⎞⎠
= − ⎛⎝
− ⎞⎠
H LT T
ln aa
ΔR
1 1w2
w1 1 2 (12)
or:
⎜ ⎟⎜ ⎟= ⎛⎝
− ⎛⎝
− ⎞⎠
⎞⎠
H LT T
a a exp ΔR
1 1w2 w1
1 2 (13)
where aw1 and aw2 are water activity values of a sample with a fixed MCat temperatures T1 and T2, respectively. Thus, by knowing the aw of thefood sample at one temperature and corresponding (ΔH−L) values, theaw of the same sample at target temperature can be estimated using thederived Eq. (13).
The fit qualities of CCE (Eq. (13)) for the experimental aw data byHTC and VSA were analyzed by determining the coefficient of de-termination (R2), standard error of prediction (SEP) and mean relativepercentage deviation (E). Microsoft Excel (Redmond, WA) was used tocalculate R2, SEP, and E.
The net isosteric heat of sorption (qst in J mol−1) is the differencebetween total enthalpy change for the sorption process (ΔH) and thelatent heat of water vaporization (L). It provides the key informationabout the energy requirement for different processes like drying of foodsamples and state of water molecules in the food products. In the pre-sent study, the measured aw data for different food samples at differenttemperatures obtained by HTC for the adsorption process was used toplot ln aw vs. 1/T, according to Eq. (13). The qst values were estimatedfrom the slope of the plot. These qst values were related to the MC of thefood samples following an empirical relation (Zuo, Rhim& Lee, 2015):
= −q a exp b MC( )st (14)
where a and b are the constants and MC is the moisture content (% db).The R2 was used to assess the goodness of fit for Eq. (14).
2.6. Moisture sorption isotherms (MSI)
From the Eq. (13), at a constant MC, the aw of a food sample atdifferent temperatures was estimated. With the assumption that the MCof a sample is constant at different temperatures and the known cor-responding estimated aw values, it is possible to obtain the moisturesorption isotherms (MSI) for a food sample at different temperatures.Similarly, in this study, the predicted aw for OWF, AF and NFMPsamples at a constant MC value, was used to estimate the MSI at 20, 60and 80 °C.
The predicted MSI from CCE was assessed against the MSI de-termined by the dynamic vapor sorption method in VSA as described bySyamaladevi, Tadapaneni, et al. (2016) for OWF, AF and NFMP samplesat 20 and 60 °C.
Fig. 4. The estimated and experimental aw values of organic wheat flour (OWF) at different moisture contents (MC); MC values (in % db) for OWF samples are shown at left with therespective aw values as indicated by symbols and continuous curves. Scattered data symbols represent means (± SD) of duplicate measurements.
R.K. Tadapaneni et al. Food Research International 102 (2017) 203–212
207

3. Results and discussion
3.1. aw measured by HTC and VSA
The aw values for OWF, AF and NFMP samples at eight different MCas measured by HTC at 20 to 80 °C and by VSA 20 to 50 °C are shown inFigs. 4, 5 and 6, respectively. The CCE provided a good fit of the ex-perimental aw data of OWF, AF and NFMP samples as measured by HTCand VSA based on the high R2 (> 0.95), low SEP (< 0.02) and E(< 10%) values.
At any fixed MC, the aw of OWF samples increased with the sampletemperature in a closed system (Fig. 4). For example, at the MC of11.6% db, the aw of the sample at 20 °C was observed to be 0.44 asrecorded by the HTC. When the same sample in HTC was heated to80 °C, the aw of the sample was measured as 0.69. The aw values fromVSA agreed with the data of OWF sample from HTC for 20 to 50 °C.
Likewise, the aw of AF samples of fixed MC increased as the tem-perature of the sample was increased from 20 to 80 °C when the MC ofthe samples was at 2.2 to 4.6% db (Fig. 5). Above 5.7% db, the aw of theAF sample was relatively stable. The difference between the aw at 20and 80 °C was< 0.02. In the NFMP samples, aw of the sample alsoincreased with the temperature for the samples with MC of 2.8 to 11.9%db. But, for MC above 13.1% db, the difference between the aw valuesat 20 and 80°C was< 0.03 (Fig. 6).
In general, the aw of food powders with hydrophilic macromoleculesof a specific MC increases with the temperature (Labuza, 1968). Theincrease in aw in such food products is due to temperature inducedbreakage of molecular bonds between water molecules and eOH groupsin foods (Foster, Bronlund, & Paterson, 2005). The degree of increase inthe aw is dependent on the amount of hydrophilic groups (eOH) presentin the food product. Similarly, in the present study, the temperaturedependence was observed on the aw of food samples with low MC.
3.2. Net Isosteric heat of sorption (qst)
The relationship of qst and the MC of the test food samples are
summarized in Fig. 7. In general, the qst values were inversely related tosample MC. For example, with the OWF samples at 7.8% db, the qst wasobserved to be 14.9 kJ mol−1. As the MC in OWF samples was in-creased to 20.1% db, the qst was determined to be 0.8 kJ mol−1. For theAF samples, the qst value was computed to be 15.2 kJ mol−1 at 2.2%db. With an increase in MC to 10% db, the qst was observed to reachzero. The qst was estimated to be approximately 11 kJ mol−1 for theNFMP samples of 2.8% db. As the MC was increased to 15.9% db, the qstdecreased to 0.3 kJ mol−1. The exponential relationship for each foodsample using Eq. (14) is shown in Table 2. The obtained equation wasfound to fit the respective experimental qst data as indicated by high R2
values.Table 3 lists previously published qst values for the food products
with different MC similar to the products used in the present study. Theresults for the relationship of qst to the MC in the OWF samples foradsorption process are similar to those reported by other studies forwheat flour (Martín-Santos, Vioque, & Gómez, 2012; Moreira, Chenlo,Torres, & Prieto, 2010).
A study by Pahlevanzadeh and Yazdani (2005) for almond powderreported a steep slope for qst at low MC, similar to what we observed forthe AF samples in this study. However, the maximum qst value observedby Pahlevanzadeh and Yazdani (2005) was approximately 4.5 timeshigher than the maximum qst value determined in this study for a si-milar range of MC. Moreover, at higher MC, the qst for AF samples inour study approaches zero whereas Pahlevanzadeh and Yazdani (2005)reported qst to be approximately 20 kJ mol−1 for MC of 10% db.
In a similar study, it was reported that for adsorption process inskim milk powder, the qst value increased as the MC was decreased(Rückold, Grobecker, & Isengard, 2000). This finding supports ob-servation from our study about the relationship between qst and MC forNFMP samples.
The high qst values obtained at the low MC for all food samplesindicate that the water molecules are strongly bonded to the monolayermolecules in the food products, and the amount of energy required tobreak those bonds is very high compared to samples with higher MC(Abdenouri, Idlimam, & Kouhila, 2010; Lim, Tang, & He, 1995). Several
Fig. 5. The estimated and experimental aw values of almond flour (AF) at different moisture contents (MC); MC values (in % db) for AF samples are shown at left with the respective awvalues as indicated by symbols and continuous curves. Scattered data symbols represent means (± SD) of duplicate measurements.
R.K. Tadapaneni et al. Food Research International 102 (2017) 203–212
208

physiochemical and processing factors associated with the food pro-ducts would influence the binding of water molecules, including three-dimensional structure of food macromolecules and food compositions.Thus, the magnitude of qst value would vary for different food products,as observed in the present study.
The information on qst offers an understanding regarding the statusof sorbed moisture in the food product and hence, provides an esti-mation about the stability kinetics of physiochemical and micro-biological aspects in the food products under specified storage settings.
3.3. Moisture sorption isotherms (MSI)
The MSI for OWF, AF and NFMP samples at 20, 60 and 80 °C foradsorption process as estimated by the CCE (lines) and observed by VSA(symbols) are shown in Figs. 8, 9 and 10, respectively.
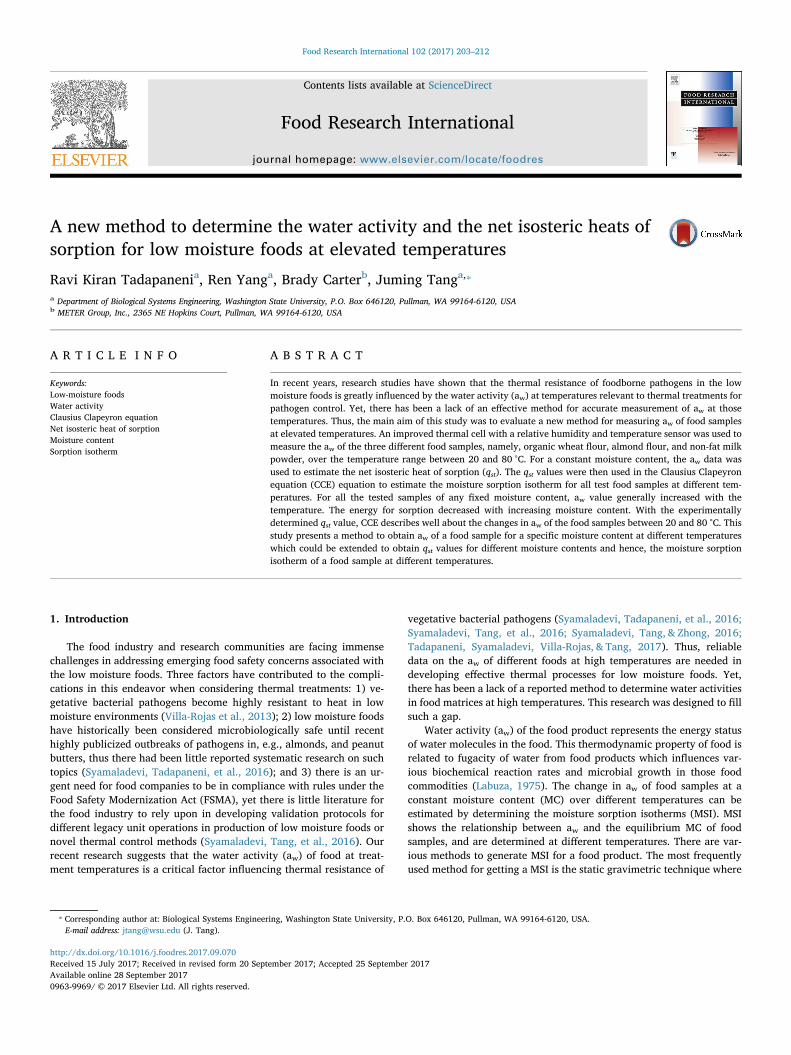
The MSI for the OWF samples from CCE (Fig. 8) shows that at aspecific MC, the aw of the sample increases when heated from 20 to80 °C. The shift in aw for OWF when heated in a closed cell as indicated
Fig. 6. The estimated and experimental aw values of non-fat milk powder (NFMP) at different moisture contents (MC); MC values (in % db) for NFMP samples are shown at left with therespective aw values as indicated by symbols and continuous curves. Scattered data symbols represent means (± SD) of duplicate measurements.
Fig. 7. Net isosteric heat of sorption (qst in kJ mol−1) data for OWF, AF and NFMPsamples; Average experimental data of qst for different samples is indicated by respectiveclosed symbols (± SD) and the fit of this experimental values is shown as the respectivedotted lines.
Table 2The fitting equations for the obtained qst values for different MC.
Food sample Fitting equation R2
OWF qst = 87.8 exp(−0.26 MC) 0.99AF qst = 39.5 exp(−0.69 MC) 0.96NFMP qst = 26.7 exp(−0.30 MC) 0.98
Table 3Reported range of qst values for food products as a function of MC similar to the foodsamples analyzed in the present study.
Type of foodsample
MC (%db)
qst (kJ mol−1) Reported by
Wheat flour ≤3 to≤28
11 to 0 (adsorption) Martín-Santos et al. (2012)
0 to 20 23 to 1.5(adsorption)
Moreira et al. (2010)
36 to 1.5(desorption)
Almond powder ≤3 to≤10
65 to 20 Pahlevanzadeh andYazdani (2005)
Skim milkpowder
< 5 to≤25
90 to ≤45(adsorption)
Rückold et al. (2000)
< 5 to≤21
42 to ≤0.5(desorption)
Rückold et al. (2003)
R.K. Tadapaneni et al. Food Research International 102 (2017) 203–212
209
by the CCE is also observed for the MSI obtained from VSA. To explain,at a MC of 11.6%, the aw of OWF sample at 20 °C was 0.44 and whenthe same sample was heated to 60 and 80 °C, the CCE estimated the awof the sample to be 0.61 and 0.70, respectively. Similarly, the experi-mental MSI from VSA also showed that the aw of the sample for a fixedMC increased when the temperature of the sample was increased from20 to 60 °C. For instance, at the constant MC of 11%, the aw at 20 °C was0.4 and when the temperature was increased to 60 °C, the aw of thesample was 0.5.
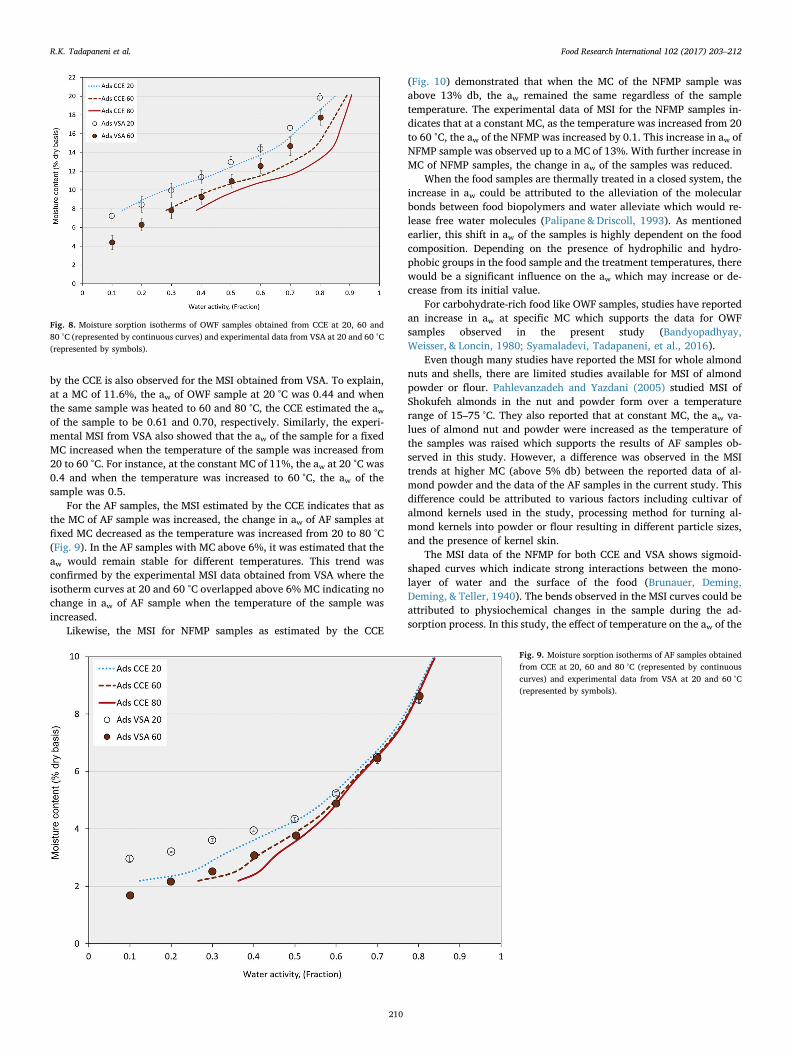
For the AF samples, the MSI estimated by the CCE indicates that asthe MC of AF sample was increased, the change in aw of AF samples atfixed MC decreased as the temperature was increased from 20 to 80 °C(Fig. 9). In the AF samples with MC above 6%, it was estimated that theaw would remain stable for different temperatures. This trend wasconfirmed by the experimental MSI data obtained from VSA where theisotherm curves at 20 and 60 °C overlapped above 6% MC indicating nochange in aw of AF sample when the temperature of the sample wasincreased.
Likewise, the MSI for NFMP samples as estimated by the CCE
(Fig. 10) demonstrated that when the MC of the NFMP sample wasabove 13% db, the aw remained the same regardless of the sampletemperature. The experimental data of MSI for the NFMP samples in-dicates that at a constant MC, as the temperature was increased from 20to 60 °C, the aw of the NFMP was increased by 0.1. This increase in aw ofNFMP sample was observed up to a MC of 13%. With further increase inMC of NFMP samples, the change in aw of the samples was reduced.
When the food samples are thermally treated in a closed system, theincrease in aw could be attributed to the alleviation of the molecularbonds between food biopolymers and water alleviate which would re-lease free water molecules (Palipane & Driscoll, 1993). As mentionedearlier, this shift in aw of the samples is highly dependent on the foodcomposition. Depending on the presence of hydrophilic and hydro-phobic groups in the food sample and the treatment temperatures, therewould be a significant influence on the aw which may increase or de-crease from its initial value.
For carbohydrate-rich food like OWF samples, studies have reportedan increase in aw at specific MC which supports the data for OWFsamples observed in the present study (Bandyopadhyay,Weisser, & Loncin, 1980; Syamaladevi, Tadapaneni, et al., 2016).
Even though many studies have reported the MSI for whole almondnuts and shells, there are limited studies available for MSI of almondpowder or flour. Pahlevanzadeh and Yazdani (2005) studied MSI ofShokufeh almonds in the nut and powder form over a temperaturerange of 15–75 °C. They also reported that at constant MC, the aw va-lues of almond nut and powder were increased as the temperature ofthe samples was raised which supports the results of AF samples ob-served in this study. However, a difference was observed in the MSItrends at higher MC (above 5% db) between the reported data of al-mond powder and the data of the AF samples in the current study. Thisdifference could be attributed to various factors including cultivar ofalmond kernels used in the study, processing method for turning al-mond kernels into powder or flour resulting in different particle sizes,and the presence of kernel skin.
The MSI data of the NFMP for both CCE and VSA shows sigmoid-shaped curves which indicate strong interactions between the mono-layer of water and the surface of the food (Brunauer, Deming,Deming, & Teller, 1940). The bends observed in the MSI curves could beattributed to physiochemical changes in the sample during the ad-sorption process. In this study, the effect of temperature on the aw of the
Fig. 8. Moisture sorption isotherms of OWF samples obtained from CCE at 20, 60 and80 °C (represented by continuous curves) and experimental data from VSA at 20 and 60 °C(represented by symbols).
Fig. 9. Moisture sorption isotherms of AF samples obtainedfrom CCE at 20, 60 and 80 °C (represented by continuouscurves) and experimental data from VSA at 20 and 60 °C(represented by symbols).
R.K. Tadapaneni et al. Food Research International 102 (2017) 203–212
210

NFMP samples was similar to that of the OWF and AF samples. Thisobserved trend was also reported by Štencl (1999) for MSI of skim milkpowder where an increase in temperature of skim milk powder led to anincrease in the aw. This behavior implies that the hygroscopicity in thematerial was greatly reduced when the temperature was increased(Štencl, 1999).
Overall, the CCE appropriately estimates the shift in aw with anincrease in the temperature for the OWF, AF, and NFMP samples. Thetrends were consistent with the experimental MSI data from VSA. It isimportant to point out that with the CCE method, the qst of a sample at aspecific MC can be readily obtained and be used to obtain MSI of asample at different temperatures. This process to get the MSI of a foodproduct for a wide range of temperatures would be faster when com-pared to the conventional MSI generating techniques.
However, studies have reported that the food products which arerich in fat content like peanut butter or peanut oil have demonstrateddifferent behavior for MSI as generally observed in this study. The aw ofvery high oil content decreased as the temperature was increased(Loncin, Bimbenet, & Lenges, 1968; Syamaladevi, Tadapaneni, et al.,2016). Thus, further studies are needed to evaluate the effectiveness ofCCE in estimating MSI for fat-rich food products.
4. Conclusions
In this study, an improved version of HTC was used to measure theaw of three different food samples at different temperatures (20 to80 °C). The experimental aw data for the food samples obtained fromHTC was used to estimate qst. There was a strong influence of MC on theqst which was indicated by the high energy values for sorption at lowMC. Using the qst values in the CCE, MSI for all food samples weredetermined at 20, 60 and 80 °C. For all the tested OWF samples, anincrease in sample temperature raised the aw. However, for AF andNFMP samples, above specific MC, the aw remained relatively stable asthe temperature of the sample was increased.
This study presents an expedited method of determining the aw atdifferent temperatures. Further studies regarding the application of thisapproach to estimate the aw of other food products with differentcompositions at different temperatures are needed. Knowledge of var-iations in aw at the elevated temperatures would offer a better under-standing to the food safety personnel in correlating the aw data to the
thermal resistance of pathogens like Salmonella, Listeria spp. and sub-sequently, aid in developing the efficient processing techniques.
Acknowledgements
We thank METER Group, Inc. for providing access to the necessaryresources in conducting this study. We also acknowledge USDAAgricultural and Food Research Initiative (AFRI) CAP Grant (2015-68023-23415) in supporting Ravi Kiran Tadapaneni for his Ph.D. study.The assistances from Jaza M. Alshammari and Marco E. Perez-Reyes inthe experimental studies are greatly appreciated.
References
Abdenouri, N., Idlimam, A., & Kouhila, M. (2010). Sorption isotherms and thermo-dynamic properties of powdered milk. Chemical Engineering Communications, 197(8),1109–1125.
AOAC (2012). Official methods of analysis of AOAC international (19 ed.). (Gaithersburg,MD, USA).
Bandyopadhyay, S., Weisser, H., & Loncin, M. (1980). Water adsorption isotherms offoods at high temperatures. Lebensmittel-Wissenschaft und -Technologie, 13(4),182–185.
Bell, L., & Labuza, T. (2000). Determination of moisture sorption isotherms. Moisturesorption: Practical aspects of isotherm measurement and use (pp. 33–56). St. Paul, MN,USA: The American Association of Cereal Chemists, Inc.
Brunauer, S., Deming, L. S., Deming, W. E., & Teller, E. (1940). On a theory of the van derWaals adsorption of gases. Journal of the American Chemical Society, 62(7),1723–1732.
Foster, K. D., Bronlund, J. E., & Paterson, A. T. (2005). The prediction of moisturesorption isotherms for dairy powders. International Dairy Journal, 15(4), 411–418.
Gibbard, H. F., Jr., & Scatchard, G. (1973). Liquid-vapor equilibrium of aqueous lithiumchloride, from 25 to 100 deg. and from 1.0 to 18.5 molal, and related properties.Journal of Chemical and Engineering Data, 18(3), 293–298.
Gibbard, H. F., Jr., Scatchard, G., Rousseau, R. A., & Creek, J. L. (1974). Liquid-vaporequilibrium of aqueous sodium chloride, from 298 to 373 deg. K and from 1 to6 mol kg−1, and related properties. Journal of Chemical and Engineering Data, 19(3),281–288.
Greenspan, L. (1977). Humidity fixed points of binary saturated aqueous solutions.Journal of Research of the National Bureau of Standards - A Physics and Chemistry, 81(1),89–96.
Hossain, M. D., Bala, B. K., Hossain, M. A., & Mondol, M. R. A. (2001). Sorption isothermsand heat of sorption of pineapple. Journal of Food Engineering, 48(2), 103–107.
Jamali, A., Kouhila, M., Ait Mohamed, L., Jaouhari, J. T., Idlimam, A., & Abdenouri, N.(2006). Sorption isotherms of Chenopodium ambrosioides leaves at three temperatures.Journal of Food Engineering, 72(1), 77–84.
Kim, S., Kim, S., Kim, D., Shin, S., & Chang, K. (1999). Moisture sorption characteristics ofcomposite foods filled with chocolate. Journal of Food Science, 64(2), 300–302.
Labuza, T. P. (1968). Sorption phenomena in foods. Food Technology, 22(3), 15–24.
Fig. 10. Moisture sorption isotherms of NFMP samplesobtained from CCE at 20, 60 and 80 °C (represented bycontinuous curves) and experimental data from VSA at 20and 60 °C (represented by symbols).
R.K. Tadapaneni et al. Food Research International 102 (2017) 203–212
211

Labuza, T. P. (1975). Sorption phenomena in foods: Theoretical and practical aspects. InC. Rha (Ed.). Theory, determination and control of physical properties of food materials(pp. 197–219). Dordrecht: Springer Netherlands.
Labuza, T. P., Kaanane, A., & Chen, J. Y. (1985). Effect of temperature on the moisturesorption isotherms and water activity shift of two dehydrated foods. Journal of FoodScience, 50(2), 385–392.
Levoguer, C. L., & Williams, D. R. (2006). The characterisation of pharmaceutical mate-rials by dynamic vapour sorption. Application note 101. Retrieved from http://www.micromeritics.com/repository/files/Dynamic_vapor_sorption.pdf.
Lim, L. T., Tang, J., & He, J. (1995). Moisture sorption characteristics of freeze driedblueberries. Journal of Food Science, 60(4), 810–814. http://dx.doi.org/10.1111/j.1365-2621.1995.tb06235.x.
Loncin, M., Bimbenet, J. J., & Lenges, J. (1968). Influence of the activity of water on thespoilage of foodstuffs. International Journal of Food Science and Technology, 3(2),131–142.
Martín-Santos, J., Vioque, M., & Gómez, R. (2012). Thermodynamic properties ofmoisture adsorption of whole wheat flour. Calculation of net isosteric heat.International Journal of Food Science and Technology, 47(7), 1487–1495.
Mermelstein, N. H. (2009). Measuring moisture content &water activity. Food Technology,63(11).
Moreira, R., Chenlo, F., Torres, M., & Prieto, D. (2010). Water adsorption and desorptionisotherms of chestnut and wheat flours. Industrial Crops and Products, 32(3), 252–257.
Pahlevanzadeh, H., & Yazdani, M. (2005). Moisture adsorption isotherms and isostericenergy for almond. Journal of Food Process Engineering, 28(4), 331–345.
Palipane, K. B., & Driscoll, R. H. (1993). Moisture sorption characteristics of in-shellmacadamia nuts. Journal of Food Engineering, 18(1), 63–76.
Rizvi, S. S. (2014). Thermodynamic properties of foods in dehydration (4 ed.). CRC Press.Rückold, S., Grobecker, K. H., & Isengard, H. D. (2000). Determination of the contents of
water and moisture in milk powder. Fresenius' Journal of Analytical Chemistry, 368(5),522–527.
Rückold, S., Isengard, H. D., Hanss, J., & Grobecker, K. H. (2003). The energy of inter-action between water and surfaces of biological reference materials. Food Chemistry,82(1), 51–59.
Staudt, P. B., Kechinski, C. P., Tessaro, I. C., Marczak, L. D. F., de P Soares, R., & Cardozo,N. S. M. (2013). A new method for predicting sorption isotherms at different tem-peratures using the BET model. Journal of Food Engineering, 114(1), 139–145.
Štencl, J. (1999). Water activity of skimmed milk powder in the temperature range of20–45 °C. Acta Veterinaria Brno, 68(3), 209–215.
Štencl, J., Janstova, B., & Drackova, M. (2010). Effects of temperature and water activityon the sorption heat of whey and yogurt powder spray within the temperature range20–40C. Journal of Food Process Engineering, 33(5), 946–961.
Syamaladevi, R. M., Tadapaneni, R. K., Xu, J., Villa-Rojas, R., Tang, J., Carter, B., ...Marks, B. (2016). Water activity change at elevated temperatures and thermal re-sistance of salmonella in all purpose flour and peanut butter. Food ResearchInternational, 81, 163–170.
Syamaladevi, R. M., Tang, J., Villa-Rojas, R., Sablani, S., Carter, B., & Campbell, G.(2016). Influence of water activity on thermal resistance of microorganisms in low-moisture foods: A review. Comprehensive Reviews in Food Science and Food Safety,15(2), 353–370.
Syamaladevi, R. M., Tang, J., & Zhong, Q. (2016). Water diffusion from a bacterial cell inlow-moisture foods. Journal of Food Science, 81(9), R2129–R2134.
Tadapaneni, R. K., Syamaladevi, R. M., Villa-Rojas, R., & Tang, J. (2017). Design of anovel test cell to study the influence of water activity on the thermal resistance ofSalmonella in low-moisture foods. Journal of Food Engineering, 208, 48–56.
Tsami, E. (1991). Net isosteric heat of sorption in dried fruits. Journal of Food Engineering,14(4), 327–335.
Tsami, E., Maroulis, Z. B., Marinos-Kouris, D., & Saravacos, G. D. (1990). Heat of sorptionof water in dried fruits. International Journal of Food Science and Technology, 25(3),350–359.
Villa-Rojas, R., Tang, J., Wang, S., Gao, M., Kang, D.-H., Mah, J.-H., ... Lopez-Malo, A.(2013). Thermal inactivation of Salmonella enteritidis PT 30 in almond kernels asinfluenced by water activity. Journal of Food Protection, 76(1), 26–32.
Zuo, L., Rhim, J.-W., & Lee, J. H. (2015). Moisture sorption and thermodynamic prop-erties of vacuum-dried capsosiphon fulvescens powder. Preventive Nutrition and FoodScience, 20(3), 215–220.
R.K. Tadapaneni et al. Food Research International 102 (2017) 203–212
212