food stability jfe
TRANSCRIPT
Journal of Food Engineering 99 (2010) 402–416
Contents lists available at ScienceDirect
Journal of Food Engineering
journal homepage: www.elsevier .com/locate / j foodeng
Food stability determination by macro–micro region concept in the statediagram and by defining a critical temperature
Mohammad Shafiur Rahman *
Department of Food Science and Nutrition, Sultan Qaboos University, P.O. Box 34, Al Khod 123, Oman
a r t i c l e i n f o a b s t r a c t
Article history:Received 24 February 2009Received in revised form 15 July 2009Accepted 16 July 2009Available online 21 July 2009
Keywords:Water activityGlass transitionIsothermFood stabilityFreezingDryingBakingMolecular mobility
0260-8774/$ - see front matter � 2009 Elsevier Ltd. Adoi:10.1016/j.jfoodeng.2009.07.011
* Tel.: +968 2414 1273; fax: +968 2441 3418.E-mail address: [email protected]
In the 1950s the concept of water activity was proposed for determining food stability. This concept isnow being used although it has some limitations. Indeed, these limitations mean that the concept isnot universally applicable and in fact is invalid under certain conditions. In order to address the limita-tions of the water activity concept, the glass transition concept was proposed in the 1960s, although sig-nificant application of the concept only started in the 1980s. Recently, it has become evident that theglass transition concept is also not universally valid for stability determination in all types of foods whenstored under different conditions. Currently in the literature the need is emphasized to combine thewater activity and glass transition concepts since both concepts could complement each other. The glasstransition concept was used to develop the state diagram by drawing another stability map using freezingcurve and glass transition line. In this paper an attempt is made to review the published methods used tocombine both concepts. These approaches are graphical plot of glass transition conditions and water con-tent as a function of water activity, and macro–micro region concept in the state diagram. In addition, anew approach is proposed in this paper by defining a critical temperature for stability and then relating itwith water content, and other hurdles affecting food stability. The water mobility concept is alsoreviewed to provide another dimension of food stability in order to determine a more complete picture.
� 2009 Elsevier Ltd. All rights reserved.
1. Introduction
Food preservation involves the action taken to maintain the de-sired properties or nature of foods, within a time frame, so that itremains safe and pleasant to consume. A stable food product canbe developed by applying different processing techniques and bykeeping it in appropriate conditions. Food stability determinationfrom a scientific basis rather than empiricism is a challenge to foodscientists and engineers. A relatively complete coverage of foodpreservation is available in the Handbook of Food Preservationand other references (Rahman, 2007a; Kalichevsky-Dong, 2000).Microbial death/growth and deteriorative physical, chemical andbiochemical changes during processing and storage depend onmany factors, such as water content, food composition, preserva-tives, pH, and environmental or processing factors (temperature,pressure, electricity, gases or vapors). A list of hurdles for increas-ing food stability is included in Table 1. A significant proportion ofthe food products on the supermarket shelf are preserved based onthe main hurdle being pH, water activity, low temperature (freez-ing and refrigeration) or heat treatment (pasteurization and steril-
ll rights reserved.
ization). In addition other hurdles are imposed in combinations,such as including spices and packaging.
In the 1950s the concept of water activity was proposed todetermine the stability of foods and in the 1980s significant dataon food stability as a function of water activity was published. Toavoid the limitations of the water activity concept, the glass tran-sition concept was extensively applied in the 1980s although theconcept had initially appeared in the literature much earlier inthe 1960s. The stability of foods is of the up most importance toboth food scientists and engineers; and a better understanding ofthe factors controlling stability or reactions rates is clearly needed(Le Meste et al., 1997; Kalichevsky-Dong, 2000; Rahman, 2006). Inthis paper the concepts of water activity and glass transition aresummarized and their applications and limitations identified. Amacro–micro region concept combining water activity and glasstransition concepts in the state diagram was first presented inthe 18th International Congress of Chemical and Process Engineer-ing (CHISA 2008), 24–28 August 2008, Prague, Czech Republic, andwas subsequently published in the International Journal of FoodProperties (Rahman, 2009). In this current paper an attempt ismade to further explain the macro–micro region concept and topresent its applications in food processing as well as in determin-ing food stability during storage. In addition, a new approach isproposed by defining a critical temperature for stability, which

Nomenclature
G modulus (Pa)k rate constant (day�1)m fragility parameterNMR Nuclear Magnetic ResonanceT temperature (�C or K) or NMR signalX mass fraction (g/g sample)
Greek symbola high-density regionb low-density region
Subscriptb BET-monolayer waterc critical (where change in slope)g glass transitiongs glass transition solidsgw glass transition waterm melting point of ice (i.e. freezing point)
ms melting point of solidss solidsu eutectic pointw water2 rate constant for decay of peroxide value in k
Superscript0 maximal-freeze concentration condition in X, and T or
storage in G0 intersection point of freezing curve and glass line or loss
in G0 0 0 initiation of glass transition at maximal-freeze concen-
tration measured by DSCiv non-ideal plasticization above maximal-freeze concen-
tration condition
M.S. Rahman / Journal of Food Engineering 99 (2010) 402–416 403
could be further related with water content and other hurdles infood stability.
2. Water activity concept
In the 1950s scientists began to discover the existence of a rela-tionship between the water contained in a food and its relative ten-dency to spoil (Scott, 1953). It was observed that the active watercould be much more important to the stability of a food than thetotal amount of water present. Thus, it is possible to develop gen-eralized rules or limits for the stability of foods using water activ-ity. For example, there is a critical water activity level below whichno microorganisms can grow. Pathogenic bacteria cannot grow be-low a water activity of 0.85, whereas yeasts and molds are moretolerant to reduced water activity, but usually no growth occursbelow a water activity of about 0.6. It has been widely recognizedthat the concept of water activity has been accepted as a valuabletool for determining microbial stability (Chirife and Buera, 1996). Acomplete discussion on the microbial response to low water activ-ity was presented by Rahman (2009).
A food product is the most stable at its ‘‘monolayer moisture”content, which varies with the chemical composition, structureand environmental conditions, such as temperature. The BET-monolayer value can be determined from the well known BET-
Table 1List of various hurdles in food stability.
Inhibition Inactivation Avoid recontamination
Acidification Blanching Aseptic packagingAdding antioxidants Cooking Hygienic processingAdding preservatives Electrifying Hygienic storageChange in phase transitions Extrusion PackagingChange in state transitions FryingChemical modifications IrradiationControl of pH LightDecrease of oxygen Magnetic fieldFermentation PasteurizationGas removal Pressure treatmentIncrease of carbon dioxide SanitationLow temperature storage SoundReduction of water activity SterilizationStructural modificationsSurface coating
Adapted from Rahman (2007a).
equation. The BET-monolayer estimation is an effective methodfor estimating the amount of water molecules bound to specific po-lar sites in a food matrix and it does not simply apply to the prod-uct surface. A more detailed explanation of the BET-monolayer,including their estimation and validity was recently provided byRahman and Al-Belushi (2006). In general the rule of water activityconcept is: Food products are most stable at their ‘‘BET-monolayermoisture” content or ‘‘BET-monolayer water activity” and unstableabove or below BET-monolayer. However, experimental evidenceshowed that optimal moisture for stability was in the multilayeradsorption region (Caurie, 1971a, b). In many other instances ithas been shown that optimal water content for stability is not ex-actly the BET-monolayer. The reason for this variation is due to thefact that the BET theory of adsorption was developed based onmany simplified assumptions, which are not realistic when foodis considered.
One of the earlier food stability maps based on the water activ-ity concepts contained growth of micro-organisms and differenttypes of bio-chemical reactions (Labuza et al., 1972). The updatedfood stability map based on the water activity is presented in Fig. 1(Rahman, 2009). In this present map, the trends of microbialgrowth, bio-chemical reactions and mechanical characteristicsare presented in the three zones of water activity. This stabilitymap indicates that different types of dynamics in reaction ratescan happen as a function of water activity. An example is shownin Fig. 2 using the process of non-enzymatic browning. This figureillustrates the non-enzymatic browning rate at 70 �C in a gelati-nized starch medium as a function of water activity and moisturecontent (Acevedo et al., 2008). The figure shows that the reactionrate increased with increasing water activity up to the BET-mono-layer (i.e. reached a peak) followed by a decrease in the reactionrate with further increases in water activity. In this example, thematrix is most stable below the BET-monolayer as expected; andabove BET-monolayer, reaction rate decreased instead of showingan increasing trend (i.e. stability increased at least for non-enzy-matic browning). However, this could be explained due to the dilu-tion effect of solvent water at higher moisture. However, thepurpose of this example is not to overemphasize the BET-mono-layer or to draw conclusions concerning non-enzymatic browning,but rather to present an example of a food stability map includingthe BET-monolayer.
The limitations of the water activity concept are identified as(Rahman and Labuza, 2007; Rahman, 2005, 2006; Chirife, 1994;

10Water Activity
Rat
e or
Gro
wth
or A
ttrib
ute
Zone I Zone II Zone III
a
b
c d
e
f
g
hi
j
k l
m
Mic
robi
al G
row
th
Mechanical Properties
Chemica
l Rea
ction
Bel
ow M
onol
ayer
Solv
ent W
ater
Adsorbed Water
n
o
p q
Fig. 1. Stability diagram based on the water activity concepts. gh: Microbial growthtrend; oa, ab, nb: chemical reaction trends below BET-monolayer; bc, bp: chemicalreaction trends in the adsorbed water; ce, cd, cf, pq: chemical reaction trends in thesolvent water region; ij, mj: mechanical properties trends below BET-monolayer;jk: mechanical properties trend in the adsorbed water region; ki: mechanicalproperties trend in the solvent water region (Rahman, 2009).
Fig. 2. Enzymatic browning rate at 70 �C in gelatinized starch medium. " indicatewater activity at BET-monolayer (Data source: Acevedo et al., 2008).
404 M.S. Rahman / Journal of Food Engineering 99 (2010) 402–416
Chirife and Buera, 1996; Van den Berg, 1986; Franks, 1991; Scott,1953; Hardman, 1986): (i) water activity is defined at equilibrium,whereas foods may not be in a state of equilibrium, for examplelow and intermediate moisture foods can be in amorphous, glass,crystallized and semi-crystallized states, (ii) the critical limits ofwater activity may also be shifted to higher or lower levels byother factors, such as pH, salt, anti-microbial agents, heat treat-ment, electromagnetic radiation, and temperature, (iii) the natureof the solute used to reduce water activity also plays an importantrole, for example some solutes are more inhibiting or antimicrobialthan others even at the same water activity (so-called specific sol-ute effect), (iv) water activity concept does not indicate exactlywhen the molecular mobility starts although NMR signals couldbe related to the water activity. It only provides information onthe amount of strongly bound and free water and an indicationof their reactivity, (v) the shift of water activity with temperatureis relatively very low, whereas in most cases reaction rates are sig-nificantly affected by temperature, and (vi) many physical changes,such as crystallization, caking, stickiness, gelatinization, and diffu-sivity could not be explained based on water activity alone. Theselimitations would not invalidate the concept completely but rathermake it difficult to apply universally. However, a stability map
could be developed by individually considering different factorsthat influence stability as shown in Fig. 1. In order to find otheralternative models, the glass transition concept was put forwardin the literature.
The shift of the critical limit and specific solute effect could befound in the case of other hurdles used in food stability. In the foodindustry, practical control of microbial growth seldom is achievedby water activity alone. In order to achieve microbial stability,parameters other than water activity need to be utilized and con-trolled. The parameters, such as pH, antimicrobials, mild heattreatment, and oxygen partial pressure, are frequently includedas hurdles that microorganism must overcome or in some way, cir-cumvent in order to cause deterioration of a food (Leistner et al.,1981). It is well documented in the literature that the microbial re-sponse to lowered pH is determined by both the pH of the systemand the acids used in acidification. For example, acetic acid is rec-ognized as a better inhibitor (at similar pH) of bacterial growththan other acids used in food preservation. The minimum pH re-quired to inhibit growth and toxin production by Clostridium botu-linum depends on the acid used (Minor and Marth, 1972; Smeltet al., 1982). Similarly Sorrels et al. (1989) reported that overallantimicrobial action (i.e. growth inhibition) (when based on equalpH) on Listeria monocytogens was acetic acid > lactic acid > citricacid > malic acid. A pH of 5.0 was sufficient to inhibit growth whenacetic acid was used, whilst a lower pH was needed for other acids.Nevertheless, usual literature tabulations include a pH lower than4.6 to inhibit the growth of this pathogen in accordance with a safepractice (Brown and Booth, 1991). It is generally accepted that thelimiting pH of 4.6 provides a good margin of safety against the haz-ards of botulism in acidified foods, and such products are givenonly a mild heat treatment (Post et al., 1985). Similarly a wateractivity of 0.6 is a safe margin for any microbial growth. Thewell-documented existence of a solute effect on pH did not pre-clude its widespread use in food preservation and this is simply be-cause any specified safe pH limit usually does not correspond tothe most inhibitory acid, but to less inhibitory ones. The same hap-pens with the specific solute effect for water activity limits formicrobial growth (Chirife and Buera, 1996).
3. Glass transition concept
In crystalline solids the molecules pack themselves in regularthree dimensional arrays and they have long-range molecular or-der within the matrix. A single molecule in the amorphous solid,compared to that in the crystalline solid, has a similar number ofneighboring molecules and a similar distance to the nearest adjoin-ing molecule. However, this similar short range molecular order isonly consistent over a few molecular dimensions. Amorphous sol-ids totally lacking long-range order and semi-crystalline solidscontain both crystalline and amorphous regions in the matrix. InFig. 3 it is shown that an amorphous solid may have distinct re-gions and, therefore, micro-heterogeneity, such as high-intensitya regions and low-density b regions, which are positioned betweenhigh-density a regions (Liu et al., 2006). The development of anamorphous food structure could result from melting, denaturation,glass transition, gelatinization, mechanical shear, rapid removal ofdispersing solvent, and depolymerization of large structure. Glasstransition is a second-order time–temperature dependent transi-tion, which is characterized by a discontinuity or change in theslope of physical, mechanical, electrical, thermal, and other proper-ties of a material when plotted as a function of temperature (Rah-man, 1995). The transition process is considered to be a second-order thermodynamic in which the material undergoes a changein state but not in phase. It is more meaningful to define glass tran-sition as the nature second-order change since each measurement

10Solute Mass Fraction
Tem
pera
ture
F
G
Xs′
ATgs
Tgw
Tg′c
Rubber
Glass
Ice
12
3
4
Glass Line
Freezing Curve
Fig. 4. State diagram proposed by Levine and Slade showing two macro-regions.Region one: marked as 1; region two: marked as 2, 3, 4.
α
α
α
α
β
β
β
β
β
β
Amorphous Solid
Fig. 3. Structure of an amorphous solid showing micro-hetrogeneity as high-intensity a regions and low-density b regions (Liu et al., 2006).
M.S. Rahman / Journal of Food Engineering 99 (2010) 402–416 405
technique is based on monitoring change in a specific property,and since change or break in properties used to measure transitionare achieved within a certain temperature range rather than at aspecific temperature (Rahman, 2006). A perfect second-order tran-sition occurs at a specific temperature. During heating, glass tran-sition of food materials does not occur at a fixed point with thechange of specific heat. Instead networks soften or become trans-formed over quite a large range of temperatures (Kasapis, 2005).Glass transition is also called a state transition, rather than a phasechange due to the non-equilibrium nature of glass transition(Schmidt, 2004). Due to the other features of glass transition, suchas its occurrence over a temperature range and the dependence ofits determination on the experimental conditions, it is also called akinetic and relaxation transition, rather than a second-order tran-sition (Schmidt, 2004; Liu et al., 2006).
Glassy materials have been known for centuries but it was onlyin the1980s that the technology started to be purposefully appliedto foods and a scientific understanding of these systems started toevolve (Ferry, 1991). A low glass transition means that at room ormouth temperature, the food is soft and relatively plastic, and athigher temperatures it may even flow. In contrast, a food with ahigh glass transition temperature is hard and brittle at ambienttemperature. Early attempts to describe glassy phenomena con-cluded that glass is a liquid that has lost its ability to flow in a shorttime frame, thus instead of taking the shape of its container, glassitself can serve as the container for liquids. Food materials are in anamorphous or non-crystalline state below the glass transition tem-perature and are rigid and brittle. Glasses are not crystalline with aregular structure, but retain the disorder of the liquid state. Phys-ically it is a solid but it more closely resembles a thermodynamicliquid. Molecular mobility increases 100-fold above glass transi-tion. In kinetic terms, Angell (1988) described a glass as any liquidor super-cooled liquid whose viscosity is between 1012 and1013 Pa s, thus effectively behaving like a solid, which is able tosupport its own weight against flow due to gravity. To put this vis-cosity into context, a supercooled liquid with a viscosity of1014 Pa s would flow 10�14 m/s in the glassy state compared tothe flow rate of a typical liquid which is in the order of 10 m/s.In other words, a glass is a liquid that flows about 30 lm in a cen-tury (Buitink and Leprince, 2004). This is evidenced by the fact that
ancient stained glass windows are thicker at their base due to flowunder gravity (Kasapis, 2005).
The early papers concerning glass transition in food and biolog-ical systems appeared in the literature in the 1960s (White andCakebread, 1966; Luyet and Rasmussen, 1968). White and Cake-bread (1966) first highlighted the importance of the glassy stateof foods in determining its stability. They were perhaps the firstfood scientists to discuss the importance of the glassy and rubberystates in relationship to the collapse of a number of high solids sys-tems. The significant applications of the glass transition concept inthe 1980s emerged in food processing when Levine and Slade(1986) and Slade and Levine (1988a) identified its major meritsand wide ranging applications. In the 1990s Roos, Karel, and othergroups generated significant data on the glass transition and othercomponents of the state diagrams for a number of food ingredients.Also, in the 1990s Chirife, Buera, Bell, Karel, Roos, Labuza and oth-ers started to present data on food stability based on glass transi-tion and water activity concepts.
It has been mentioned in the literature that foods can be consid-ered very stable at the glassy state, since below glass transitiontemperatures compounds involved in the deterioration reactionstake many months or even years to diffuse over molecular dis-tances and approach each other to react (Slade and Levine,1991). The hypothesis has recently been stated that this transitiongreatly influences food stability, as the water in the concentratedphase becomes kinetically immobilized and therefore does notsupport or participate in reactions. Formation of a glassy state re-sults in a significant arrest of translational molecular motion, andchemical reactions become very slow (Rahman, 2007b). The rulesof the glass transition concept are: (i) the food is most stable atand below its glass transition (i.e. Tg or T 0g), and (ii) the higherthe T � Tg or T/Tg (i.e. above glass transition), the higher the deteri-oration or reaction rates. These conditions identify two macro re-gions (i.e. above and below) in the state diagram (Fig. 4). In Fig. 4it is shown that macro region one is below glass line (marked as1), and macro region two includes above glass line (marked as 2,3, 4). Similarly mechanical and transport properties could also berelated with glass transition. It is very interesting to see that thisconcept has been so widely tested in foods. In many instances,the glass transition concept does not work alone, thus it is now
406 M.S. Rahman / Journal of Food Engineering 99 (2010) 402–416
being recommended to use both the water activity and glass tran-sition concepts in assessing process-ability, deterioration, food sta-bility, and shelf-life predictions (Roos, 1995). Chirife and Buera(1996) concluded after analyzing data from the literature that cer-tainly the glass transition concept could not presently offer a betteralternative to the concept of water activity as a predictor of micro-bial growth in foods.
Tem
pera
ture
(oC
)
Glass Transition Line
Water Activity
a Moi
stur
e C
onte
nt
IsothermBET-Monolayer
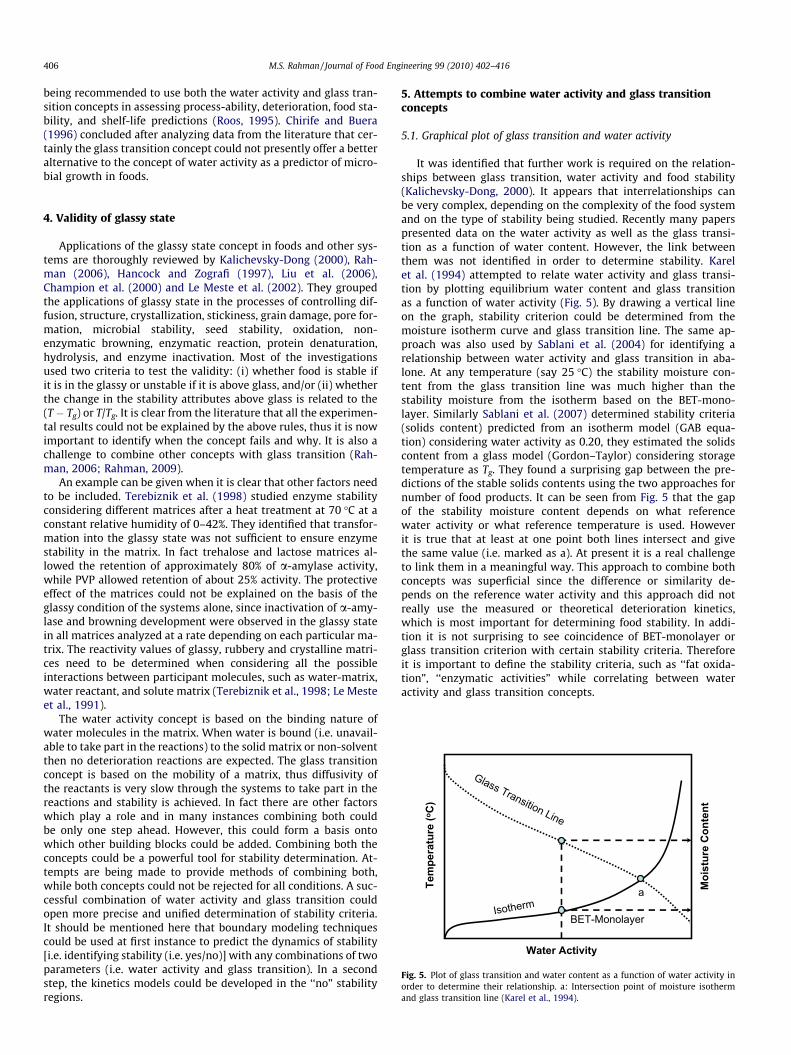
Fig. 5. Plot of glass transition and water content as a function of water activity inorder to determine their relationship. a: Intersection point of moisture isothermand glass transition line (Karel et al., 1994).
4. Validity of glassy state
Applications of the glassy state concept in foods and other sys-tems are thoroughly reviewed by Kalichevsky-Dong (2000), Rah-man (2006), Hancock and Zografi (1997), Liu et al. (2006),Champion et al. (2000) and Le Meste et al. (2002). They groupedthe applications of glassy state in the processes of controlling dif-fusion, structure, crystallization, stickiness, grain damage, pore for-mation, microbial stability, seed stability, oxidation, non-enzymatic browning, enzymatic reaction, protein denaturation,hydrolysis, and enzyme inactivation. Most of the investigationsused two criteria to test the validity: (i) whether food is stable ifit is in the glassy or unstable if it is above glass, and/or (ii) whetherthe change in the stability attributes above glass is related to the(T � Tg) or T/Tg. It is clear from the literature that all the experimen-tal results could not be explained by the above rules, thus it is nowimportant to identify when the concept fails and why. It is also achallenge to combine other concepts with glass transition (Rah-man, 2006; Rahman, 2009).
An example can be given when it is clear that other factors needto be included. Terebiznik et al. (1998) studied enzyme stabilityconsidering different matrices after a heat treatment at 70 �C at aconstant relative humidity of 0–42%. They identified that transfor-mation into the glassy state was not sufficient to ensure enzymestability in the matrix. In fact trehalose and lactose matrices al-lowed the retention of approximately 80% of a-amylase activity,while PVP allowed retention of about 25% activity. The protectiveeffect of the matrices could not be explained on the basis of theglassy condition of the systems alone, since inactivation of a-amy-lase and browning development were observed in the glassy statein all matrices analyzed at a rate depending on each particular ma-trix. The reactivity values of glassy, rubbery and crystalline matri-ces need to be determined when considering all the possibleinteractions between participant molecules, such as water-matrix,water reactant, and solute matrix (Terebiznik et al., 1998; Le Mesteet al., 1991).
The water activity concept is based on the binding nature ofwater molecules in the matrix. When water is bound (i.e. unavail-able to take part in the reactions) to the solid matrix or non-solventthen no deterioration reactions are expected. The glass transitionconcept is based on the mobility of a matrix, thus diffusivity ofthe reactants is very slow through the systems to take part in thereactions and stability is achieved. In fact there are other factorswhich play a role and in many instances combining both couldbe only one step ahead. However, this could form a basis ontowhich other building blocks could be added. Combining both theconcepts could be a powerful tool for stability determination. At-tempts are being made to provide methods of combining both,while both concepts could not be rejected for all conditions. A suc-cessful combination of water activity and glass transition couldopen more precise and unified determination of stability criteria.It should be mentioned here that boundary modeling techniquescould be used at first instance to predict the dynamics of stability[i.e. identifying stability (i.e. yes/no)] with any combinations of twoparameters (i.e. water activity and glass transition). In a secondstep, the kinetics models could be developed in the ‘‘no” stabilityregions.
5. Attempts to combine water activity and glass transitionconcepts
5.1. Graphical plot of glass transition and water activity
It was identified that further work is required on the relation-ships between glass transition, water activity and food stability(Kalichevsky-Dong, 2000). It appears that interrelationships canbe very complex, depending on the complexity of the food systemand on the type of stability being studied. Recently many paperspresented data on the water activity as well as the glass transi-tion as a function of water content. However, the link betweenthem was not identified in order to determine stability. Karelet al. (1994) attempted to relate water activity and glass transi-tion by plotting equilibrium water content and glass transitionas a function of water activity (Fig. 5). By drawing a vertical lineon the graph, stability criterion could be determined from themoisture isotherm curve and glass transition line. The same ap-proach was also used by Sablani et al. (2004) for identifying arelationship between water activity and glass transition in aba-lone. At any temperature (say 25 �C) the stability moisture con-tent from the glass transition line was much higher than thestability moisture from the isotherm based on the BET-mono-layer. Similarly Sablani et al. (2007) determined stability criteria(solids content) predicted from an isotherm model (GAB equa-tion) considering water activity as 0.20, they estimated the solidscontent from a glass model (Gordon–Taylor) considering storagetemperature as Tg. They found a surprising gap between the pre-dictions of the stable solids contents using the two approaches fornumber of food products. It can be seen from Fig. 5 that the gapof the stability moisture content depends on what referencewater activity or what reference temperature is used. Howeverit is true that at least at one point both lines intersect and givethe same value (i.e. marked as a). At present it is a real challengeto link them in a meaningful way. This approach to combine bothconcepts was superficial since the difference or similarity de-pends on the reference water activity and this approach did notreally use the measured or theoretical deterioration kinetics,which is most important for determining food stability. In addi-tion it is not surprising to see coincidence of BET-monolayer orglass transition criterion with certain stability criteria. Thereforeit is important to define the stability criteria, such as ‘‘fat oxida-tion”, ‘‘enzymatic activities” while correlating between wateractivity and glass transition concepts.

M.S. Rahman / Journal of Food Engineering 99 (2010) 402–416 407
5.2. Critical temperature concept
The concept of glass transition is usually tested considering aspecific reaction in a matrix containing different solutes makingdifferent glass transition transformations of the matrix. The alter-native approach was to change the matrix moisture content (thusvarying glass transition) and measure the reaction kinetics by stor-ing the matrix at a specific storage temperature. In both cases, thereaction kinetics were measured and the stability was determinedabove or below glass transition. Selected data from the literatureon sucrose hydrolysis were considered in different matrices as afunction of varied water contents (i.e. changing glass transitionof the matrix) and storage at a specific temperature. An attemptwas made to analyze selected data as a function of T/Tg and X/Xb
in order to explain the ‘‘critical temperature concept”. In this ap-proach critical point (Tc or Xc) could be observed in relation tothe glass transition and BET-monolayer water.
Fig. 6A and B show the data for sucrose hydrolysis in PVP med-ium at 30 �C (Chen et al., 1999). Fig. 6A shows that a significant in-crease in the reaction rate started when Xc/Xb > 2.62 and Fig. 6Bshows Tc/Tg > 1.08, this justifies the validity of the two conceptsto some extent although the critical limit is not exactly at 1 as bothconcepts suggest. Similarly data of Kouassi and Roos (2001) instarch medium provides the critical limits as Xc/Xb > 2.30 and Tc/Tg > 1.18 at 24 �C (Fig. 6C and D). In both references, the authorstested the hydrolysis at a constant storage temperature of 30 �Cwith varied moisture contents. The data of Schebor et al. (1995)shows the effect of temperature when samples are stored at 70
Fig. 6. (A) Rate of hydrolysis at 30 �C as a function of Xw/Xb for PVP medium (Data source:(Data source: Chen et al., 1999), (C) rate of hydrolysis at 24 �C as a function of Xw/Xb forand Roos, 2001), and (D) rate of hydrolysis at 24 �C as a function of T/Tg for non-crysta2001).
and 80 �C in starch medium (Fig. 7A and B). The critical limits forXc/Xb are 0.7 and 1.0 when the storage temperatures were main-tained at 80 and 70 �C, respectively (Fig. 7B). Similarly the criticallimits for Tc/Tg are 0.74 and 0.80, respectively, for 80 and 70 �C(Fig. 7A). Their data indicated that storage temperature indepen-dently affected the hydrolysis by shifting the critical limits, andthe slope of the reaction rate was steeper at higher water contentabove the critical temperature. Other interesting results for a widerange of temperatures and moisture contents could be seen fromthe data of Buera et al. (1995) for the medium PVP. The critical lim-it for Xc/Xb is 6.4 and for Tc/Tg is 1.5, respectively (Fig. 7C and D). An-other interesting point that could be seen from these figures is thedilution effect at very high moisture contents. These data only forsugar hydrolysis in different media indicated that the critical limitsfor moisture and storage temperature were affected by the natureof the matrix as well as reactants’ concentrations. All these dataindicate that it is not only temperature and moisture that controlthe critical limits in fact, above glass transition the reaction couldbe significantly reduced due to dilution factors (Fig. 7C and D). Inthe literature most of the stability experiments were designed sim-ilarly by storing sample at different relative humidity (i.e. varyingwater activity) in order to vary glass transition and moisture con-tents, while storage experiments were conducted at a specific tem-perature. In reality the effects of moisture and temperature in thestate diagram can not be assessed unless samples with differentmoisture contents are stored at different temperatures.
Rahman et al. (2009) studied fat oxidation in freeze-driedgrouper by measuring its peroxide value (PV) considering two
Chen et al., 1999), (B) rate of hydrolysis at 30 �C as a function of T/Tg for PVP mediumnon-crystalline carbohydrate (maltodextrin/lactose) medium (Data source: Kouassilline carbohydrate (maltodextrin/lactose) medium (Data source: Kouassi and Roos,

Fig. 7. (A) Rate of hydrolysis at 70 and 80 �C as a function of Xw/Xb for amorphous starch (Data source: Schebor et al., 1995), (B) rate of hydrolysis at 70 and 80 �C as a function of T/Tg
for amorphous starch (Data source: Schebor et al., 1995), (C) rate of hydrolysis at 45–90 �C as a function of Xw/Xb for PVP medium (Data source: Buera et al., 1995), and (D) rate ofhydrolysis at 45–90 �C as a function of T/Tg for PVP medium (Data source: Buera et al., 1995), series1: 45 �C, series2: 57 �C, series3: 70 �C series4: 80 �C, series5: 90 �C.
408 M.S. Rahman / Journal of Food Engineering 99 (2010) 402–416
moisture levels (5 and 20 g/100 g sample) and five storage temper-atures (�40, �20, 5, 25, and 40 �C), respectively. This experimentalprotocol allowed the effects of moisture content and temperatureto be identified separately. The rate constants were plotted as afunction of T/Tg and X/Xb (Figs. 8 and 9). Fig. 8 shows a break inthe slope at Tc/Tg = 0.78 for the sample with a moisture contentof 5 g/100 g sample, whereas the break occurred at 0.96 whenthe moisture content was 20 g/100 g sample. This indicated thevalidity of the glass transition concept to some extent; although
Fig. 8. Rate constant for PV values during fat oxidation as a function of T/Tg forfreeze-dried grouper muscle containing water 5 and 20 g/100 g (Rahman et al.,2009).
the break in slope was not observed exactly at 1.0 and the moisturecontent affected the critical limit of Tc/Tg. The shift of the criticallimit to a higher level indicated that water may have a protectiveeffect to reduce the initiation of reaction significantly.
The rate constant is plotted as a function of X/Xb for differenttemperatures in Fig. 9. This plot shows that there are no breaksin the slopes for temperatures �40, �20, 5, 25 �C and moisturedid not show any effect until Xc/Xb = 3.5, which was the maximummoisture content tested. At 40 �C the rate constant increased. Rah-
Fig. 9. Rate constant for PV values during fat oxidation as a function of Xw/Xb forfreeze-dried grouper muscle stored at different storage temperature (Rahman et al.,2009).

M.S. Rahman / Journal of Food Engineering 99 (2010) 402–416 409
man et al. (2009) concluded that the glass transition concept couldbe used to explain the process more adequately than the wateractivity concept since glass transition indicates a break in the slopeof line for rate constant versus Tc/Tg plot. Two points could be con-cluded from all the above analysis; (i) there is a critical limit oftemperature, which could vary with the moisture content, (ii)above the critical limit an increase in the water content signifi-cantly increased the reaction rate whilst below the critical limitthe rate was relatively less affected by temperature. The relation-ship of the critical limit Tc/Tg could be developed as a function ofXw, pH, and other factors when more data are available. Moreover,the deviations of Tc/Tg from 1.0 explain why in many instances inthe literature both stability and un-stability was observed aboveand below glass transition. These instances are clearly discussedlater in the section on molecular mobility.
5.3. State diagram and its components
Rahman (2006) combined both the water activity and glass tran-sition concepts in the state diagram. He plotted the BET-monolayervalue in the state diagram, thus combining both concepts in thestate diagram. A detailed discussion on this approach is providedas follows. The state diagram is another stability map of differentstates and phases of a food as a function of water or solids contentand temperature (Rahman, 2004). Levine and Slade (1986) pre-sented a state diagram of polyvinyl pyrrolidone (PVP) containingthe glass line, freezing curve, and the intersection of these lines asT 0g (in this paper it is defined as T 00g). This is most probably the firststate diagram in the food science literature. Many of their publica-tions later presented the state diagram of starch by quoting the ref-erence of Van den Berg (1986) (Slade and Levine, 1988a). Later theypresented another state diagram including glass line, freezing curve,melting line, eutectic point, T 0g and vapor line (Levine and Slade,1993). Starting in the 1990s Roos, Karel, Kokini and others pre-sented state diagrams for a number of food components and foodproducts. The main advantages of drawing a map are to help inunderstanding the complex changes that occur when the water con-tent and temperature of a food are changed (Slade and Levine,
0Solute Ma
Tem
pera
ture
J
A
ice+glass at Tg″′
Solution
Tgw
Tg′
Tm′ice+rubber (solid matrix+un-freezable
G
Tu
H
I
ice+solution (solute+free water)
MTbw
Water vapor
ice+glass Tg″K
Tg″′
4
5
6
7
8
9
12
Tg″
glass
ice+solution (solute crystal+free water
ice+glass Tg′
3
S
Highest Molecular Mobility
Fig. 10. State diagram showing different regions an
1988b, 1994, 1995; Roos, 1995; Roos et al., 1996; Slade et al.,1993; Kokini et al., 1994, 1995). It also assists in identifying food’sstability during storage as well as selecting a suitable condition oftemperature and moisture content for processing (Rahman, 2005;Roos and Karel, 1991a; Cuq et al., 2003; Rahman, 2006, 2009). Theregions of drying and freezing processes can be easily visualizedin the diagram, and product stability could be assessed based onmoisture content and temperature. Fig. 10 shows a state diagramindicating different states and phases as a function of temperatureand solids mass fraction (updated from Rahman, 2004, 2006).
5.4. Macro–micro region concept
The state diagram shown in Fig. 10 is updated from Rahman(2004, 2006). In Fig. 10 the freezing line (ABC) and solubility line(BD) are shown in relation to the glass transition line (EQFS). Thepoint F (X0s and T 0g) lower than T 0m (point C) is a characteristic tran-sition (maximal-freeze-concentration condition) in the state dia-gram defined as the intersection of the vertical line from T 0m tothe glass line EQFS (Rahman, 2006). The water content at point For C is considered as the un-freezable water ð1� X0sÞ. The un-freez-able water mass fraction is the amount of water remaining unfro-zen even at very low temperature. It includes both un-crystallizedfree water and bound water attached to the solids matrix. Thepoint Q is denoted as T 00g and X00s and defined as the intersection ofthe freezing curve to the glass line by maintaining a similar curva-ture of the freezing curve ABC.
Point R is defined as T 000g the glass transition of the solids matrixin the frozen sample, which is determined by DSC below T 0m. This isdue to the formation of similar solid matrix associated with un-freezable water and transformation of all free water into icealthough the sample contains different levels of total water beforethe start of DSC scanning (Rahman et al., 2005). The values of T 000gdecreased as the solids content increased falling to a minimum va-lue. In the AGB, the phases present are ice and solution. Belowpoint B, first crystallization of solute occurs, and transformingGBCH region to three states: ice, solution and solute crystal. Nofree water (i.e. able to form ice) exists to the right side of point C
1ss Fraction
F
E (Tgs)
Xs ′
B
Glass
CrystalCollapseStickinessRubberSoftening zoneReaction zoneEntangle flow
C water)
LiquidL (Tms)
Solid
D
N
O
BE
T-M
onol
ayerQ
R1
2
1110
13
Xs ″
)P
Tgiv
U (Tds)
Xs′′′
d state of foods (updated from Rahman, 2006).

410 M.S. Rahman / Journal of Food Engineering 99 (2010) 402–416
(T 0m, end point of freezing with maximal-freeze-concentration-con-dition) and then the very concentrated solution is transformed to arubber state. The maximal-freeze-concentration condition could beachieved using optimum conditions by slow cooling and/or anneal-ing of the samples. The region HCRI contains ice, rubber, and solutecrystal. The point F is the T 0g , below this point a portion of the rub-ber state is transformed to the glass state, thus region KFS containsglass, ice, and solute crystal. The rate of cooling can shift the pointsB, C, R, Q and F. More detailed effects of cooling on the shift are dis-cussed by Rahman (2004). The glass line should follow the lineEQFS if maximum, ideal plasticization occurs in the solid matrixwith the addition of water. The line EQF could be shifted upwardif water causes different degrees of plasticization (as shown incurve EP). The vertical line from F will intersect at point P andthe temperature is defined as Tiv
g as defined by Rahman (2009).This behavior could be explained from the classification proposedby Angell (1995) into strong/fragile materials according to the vari-ations in their dynamic properties through glass transition. The fra-gility parameter was introduced to differentiate fragile systemsfrom strong ones. According to Hancock and Zografi (1997), themolecular mobility of a strong liquid (16 < m < 100, m: fragilityparameter) typically exhibits weak temperature dependence, incontrast, the molecular mobility of a fragile liquid (100 <m < 200) has a much stronger temperature dependence near glasstransition. In addition, a strong liquid shows a relatively smallchange in heat capacity at glass transition, whereas a weak liquidshows a relatively large change. In other words, compared tostrong liquids, the molecular mobility in fragile liquids changesmore rapidly with temperature near glass transition, therefore itsmolecular arrangement or its structural configuration is brokendown more rapidly as well (Liu et al., 2006). More theoretical dis-cussion on the strong/fragile glassy materials is also provided bySokolov (1997). Principal component analysis was also used toclassify glassy materials using strong-fragile related parameters(Nascimento and Aparicio, 2007).
The region BQEL is important in food processing and preserva-tion, many characteristics such as crystallization, stickiness, col-lapsed phenomenon are observed in this region (Roos and Karel,1991b; Roos, 1995). In the case of cereal proteins, Kokini et al.(1994) identified an entangled polymer flow region and a reactionzone based on the mechanical characteristics. Madeka and Kokini(1994, 1996) studied micro-region 11 of the proteins gliadin andzein by measuring their rheological characteristics. Above glasstransition they identified three regions: entangled polymer, reac-tion and softening. Madeka and Kokini (1996) measured G0 andG00 of zein using pressure rheometry for samples containing mois-ture at levels of 15, 20, 25, 30 and 35 g/100 g sample. The glasstransition at moisture level 15 g/100 g was 10 �C as measured byDSC. The regions were identified from a typical temperaturesweep. The characteristic temperatures are discussed for moisturecontent 15 g/100 g sample as follows. The magnitudes of G0 and G00
were relatively identical within the temperature range 50–120 �C.This region was characterized as the region of entangled polymerflow. This flow region ended at 110 �C (i.e. above glass transitiontemperature), thus rubbery flow was expected within 110–120 �C. As the temperature exceeded 120 �C, zein experienced asharp decrease in G0 and a simultaneous increase in G00. This wasdue to cross-linking reactions occurring once the mobility of thezein molecule was high enough. It is interesting to note that upto a temperature of 110 �C (i.e. above glass) no significant reactionwas observed. Once the temperature was high enough, individualzein molecules gain enough mobility to come together and cross-link. The aggregation observed in zein was similar to that observedin gliadin. This cross-linking could make zein a thermosettingmaterial causing a decreased solubility, which is relevant to extru-sion processes (Chan, 1991). At 160 �C the polymer appeared to
reach a maximum cross-link density where G0 reached a maximumand G00 a minimum. The maximum in G0 suggested melting of thecross-linked structure allowing increased mobility which is neces-sary for temperature softening. When the temperature was furtherincreased, the G0 started to decline once the temperature exceeded160 �C. The G00 also started to increase from its minimum point alsoindicating a softening process. Finally, the characteristic tempera-ture was plotted in the state diagram as a function of moisture con-tent showing three regions. Typical regions are identified in Fig. 10.Kokini et al. (1995) provided a complete review on the different re-gions in the BQEL in the Fig. 10.
The line BDL is the melting line which is important when prod-ucts are exposed to high temperatures during processing, such asfrying, baking, roasting, and extrusion cooking. In the case of amulti-component mixture, such as food a clear melting point is dif-ficult to observe at high temperature due the reactions or interac-tions between the components. In this case, Rahman (2004) andothers defined melting as the decomposition temperature. LineMDL is the boiling/evaporation line for water evaporation fromthe liquid phase (line MD) and solid matrix with a degree of satu-ration with water (line DL).
As a first attempt, Rahman (2006) plotted the BET-monolayervalue as the LNO line in the state diagram shown in Fig. 10. It inter-sects at point N with the glass line EQFS, which shows that at leastin one location (point N), glass and water activity concepts providethe same stability criterion. This approach forms more micro-re-gions, which could give different degrees of stability in the statediagram. More studies regarding the stability need to be done onthe left (above and below glass) and right sides (above and belowglass) of the line LNO. It should be mentioned here that the BET-monolayer could be achieved by mainly removing water from asystem (since isotherm is relatively less affected by temperature),but glassy state could be achieved by removing water through dry-ing as well as by decreasing the temperature of the system. A suc-cessful combination of water activity and glass transition couldopen more in depth knowledge on stability criteria. In additionhow other factors, such as pH, preservatives etc. could be linkedwith these concepts. Are we still far away from developing a uni-fied theoretical basis?
It is evident from the literature that stability below or aboveglass transition varied based on the specific cases indicating thatdeveloping the stability rule based on only the glass transitiontemperature could be inadequate. Samples having freezable waterare more complex and four temperatures are defined asTiv
g > T 0m > T 000g > T 00g > T 0g (Rahman et al., 2005; Rahman, 2009). Inaddition the stability below or above Tiv
g > T 0m > T 000g > T 00g > T 0gshould also be explored. There are only a few references availableincluding all four characteristic temperatures with their moisturecontent. It is important to know how these temperatures affectthe stability of foods. It would be interesting to explore the differ-ences in stability of various products within these different ranges(Rahman, 2006; Rahman, 2009).
The BET-monolayer line shown as LNO intersecting glass line inthe state diagram (Fig. 10) makes four regions: below BET-mono-layer, one above and one below; and above BET-monolayer, oneabove and another below (Rahman, 2006). This approach formsmore micro-regions, which could give different stability in thestate diagram and could explain the limitations of each concept.The present hypothesis proposed 13 micro-regions having thehighest to the lowest stability based on the location from the glassand BET-monolayer lines. For example, region-1 (relatively non-reacting zone, below the BET-monolayer line and glass line) isthe most stable and region-13 (highly reacting zone, far fromBET-monolayer line and glass line) is the least stable. Scheboret al. (1995) studied sucrose hydrolysis in the micro-regions 1and 2 by moving to the left side as well as in a vertical direction.
M.S. Rahman / Journal of Food Engineering 99 (2010) 402–416 411
They observed more stability in region 1 compared to in region 2.In addition stability decreased towards the left side as well as to-ward the vertical direction with higher temperature. The stabilitydecreased as the zone number increased. Each micro-region couldbe studied for specific attributes separately considering the differ-ent characteristics of a medium.
It is clear that stability estimates based on macro-regions in thestate diagram considering below and above BET-monolayer orglass transition could be deficient. The literature has recorded thatmany systems were stable above glass transition and unstable be-low glass transition. One of the arguments proposed that mobilityof water could also occur below glass transition. Based on the var-iability in the stability, micro-regions were identified within themacro-regions. In the state diagram, 3 factors are clearly identifiedor mapped: (i) how far it is from the BET-monolayer line, (ii) howfar it is from the glass transition line, and (iii) how low is the sam-ple temperature. In addition to the binding nature of water (wateractivity) and structural mobility (glass transition), sample temper-ature could be identified as a separate factor in the state diagramconsidering temperature dependent reaction rates. The reactivitydoes not increase only based on a function of (T � Tg) or T/Tg andvariations in increasing or decreasing behavior could be observed,for example micro-region 10 is below BET-monolayer and aboveglass transition and could be very reactive. Micro-region 1 is con-sidered most stable since it is below glass transition and BET-monolayer, and low storage temperature. The most unstable mi-cro-region is region 13 since it is the most reactive region. In thiscase there is no point in applying the concepts of glass transitionor water activity alone and other preservation hurdles should beused. The micro-regions could also be sub-divided further to ex-plain the variability of stability, for example regions between 3and 8 based on Tiv
g ; T0m; T
000g ; T
00g or T 0g . Another important aspect is
to study the types and characteristics of glass formed in differentfoods. This could open another dimension to explain variation offood stability.
6. Further applications of macro–micro region concept in thestate diagram
6.1. Drying process in the state diagram
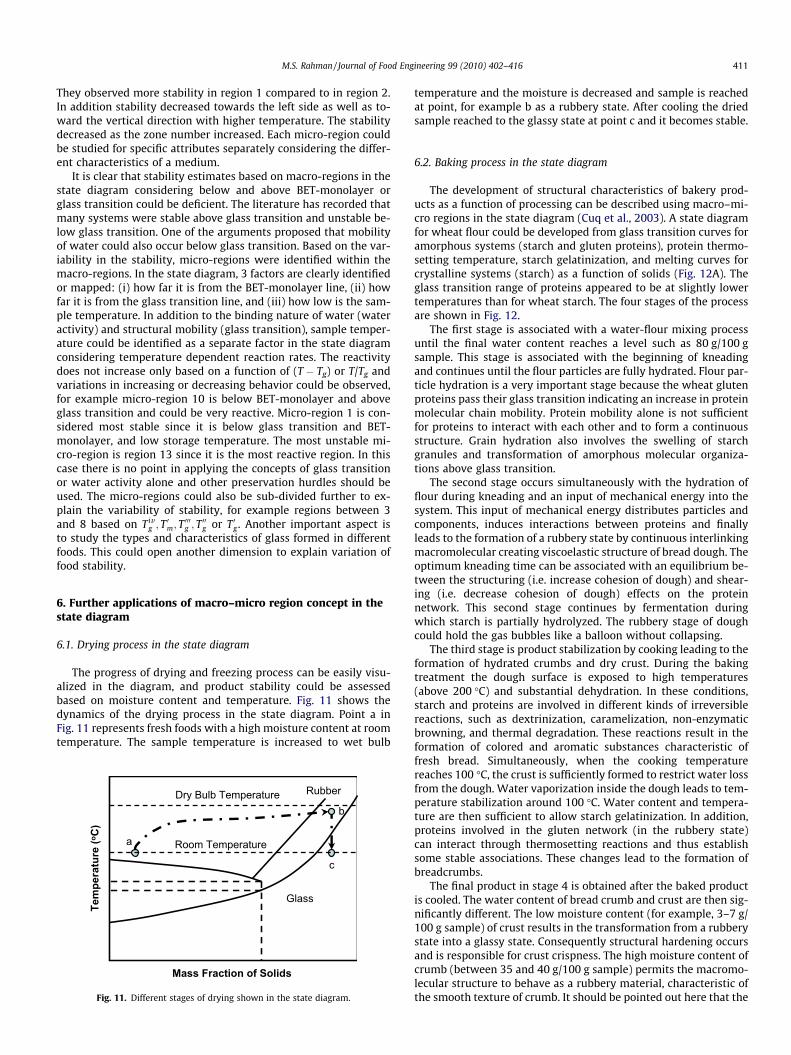
The progress of drying and freezing process can be easily visu-alized in the diagram, and product stability could be assessedbased on moisture content and temperature. Fig. 11 shows thedynamics of the drying process in the state diagram. Point a inFig. 11 represents fresh foods with a high moisture content at roomtemperature. The sample temperature is increased to wet bulb
Tem
pera
ture
(oC
)
Glass
Mass Fraction of Solids
Rubber
a Room Temperature
Dry Bulb Temperatureb
c
Fig. 11. Different stages of drying shown in the state diagram.
temperature and the moisture is decreased and sample is reachedat point, for example b as a rubbery state. After cooling the driedsample reached to the glassy state at point c and it becomes stable.
6.2. Baking process in the state diagram
The development of structural characteristics of bakery prod-ucts as a function of processing can be described using macro–mi-cro regions in the state diagram (Cuq et al., 2003). A state diagramfor wheat flour could be developed from glass transition curves foramorphous systems (starch and gluten proteins), protein thermo-setting temperature, starch gelatinization, and melting curves forcrystalline systems (starch) as a function of solids (Fig. 12A). Theglass transition range of proteins appeared to be at slightly lowertemperatures than for wheat starch. The four stages of the processare shown in Fig. 12.
The first stage is associated with a water-flour mixing processuntil the final water content reaches a level such as 80 g/100 gsample. This stage is associated with the beginning of kneadingand continues until the flour particles are fully hydrated. Flour par-ticle hydration is a very important stage because the wheat glutenproteins pass their glass transition indicating an increase in proteinmolecular chain mobility. Protein mobility alone is not sufficientfor proteins to interact with each other and to form a continuousstructure. Grain hydration also involves the swelling of starchgranules and transformation of amorphous molecular organiza-tions above glass transition.
The second stage occurs simultaneously with the hydration offlour during kneading and an input of mechanical energy into thesystem. This input of mechanical energy distributes particles andcomponents, induces interactions between proteins and finallyleads to the formation of a rubbery state by continuous interlinkingmacromolecular creating viscoelastic structure of bread dough. Theoptimum kneading time can be associated with an equilibrium be-tween the structuring (i.e. increase cohesion of dough) and shear-ing (i.e. decrease cohesion of dough) effects on the proteinnetwork. This second stage continues by fermentation duringwhich starch is partially hydrolyzed. The rubbery stage of doughcould hold the gas bubbles like a balloon without collapsing.
The third stage is product stabilization by cooking leading to theformation of hydrated crumbs and dry crust. During the bakingtreatment the dough surface is exposed to high temperatures(above 200 �C) and substantial dehydration. In these conditions,starch and proteins are involved in different kinds of irreversiblereactions, such as dextrinization, caramelization, non-enzymaticbrowning, and thermal degradation. These reactions result in theformation of colored and aromatic substances characteristic offresh bread. Simultaneously, when the cooking temperaturereaches 100 �C, the crust is sufficiently formed to restrict water lossfrom the dough. Water vaporization inside the dough leads to tem-perature stabilization around 100 �C. Water content and tempera-ture are then sufficient to allow starch gelatinization. In addition,proteins involved in the gluten network (in the rubbery state)can interact through thermosetting reactions and thus establishsome stable associations. These changes lead to the formation ofbreadcrumbs.
The final product in stage 4 is obtained after the baked productis cooled. The water content of bread crumb and crust are then sig-nificantly different. The low moisture content (for example, 3–7 g/100 g sample) of crust results in the transformation from a rubberystate into a glassy state. Consequently structural hardening occursand is responsible for crust crispness. The high moisture content ofcrumb (between 35 and 40 g/100 g sample) permits the macromo-lecular structure to behave as a rubbery material, characteristic ofthe smooth texture of crumb. It should be pointed out here that the

Fig. 12. Different stages bread making in the state diagram (Cuq et al., 2003).
412 M.S. Rahman / Journal of Food Engineering 99 (2010) 402–416
rubbery state of the crumb causes rapid changes during storage atroom temperature.
6.3. Stability of enzymes in the state diagram
Mazzobre et al. (2008) studied the thermal stability of severalenzymes from different sources (malt extract, soy extract and hon-ey) enzymes were analyzed in a frozen matrix (marked as A inFig. 13) and a dehydrated matrix (marked as B in Fig. 13) in relationto the sugar (dried systems) or water (frozen systems) crystalliza-tion. They used honey (T 0g: �46 �C) and trehalose (T 0g: �44 �C) assolids and stored the frozen systems at �26 �C, while the dehy-drated systems were stored at 55 �C. The stability decreased withthe increase of initial concentration of solids before freezing, indi-
B
Tem
pera
ture
(oC
)
Glass
Mass Fraction of Solids
Rubbe
r
A
Fig. 13. Stability of enzymes in frozen system (marked as the shaded region A) anddehydrated system (marked as the shaded region B) (Mazzobre et al., 2008).
cating the amount of ice formed also affects the stability in addi-tion to T 0g . They also studied the effects of salts in determiningstability and found that salts could have positive or negative effectsboth in frozen (region A) and dried systems (region B). In additionsalts also lowered the Tg or T 0g values. When sugars crystallized theprotective effect of the sugar was lost and the enzymes quickly be-came inactivated in almost all types of salt containing systems.Crystallization of sugar concentrates the salts in the amorphousphase, negatively affecting enzyme stability, possibly by changingpH and/or ionic strength. Mazzobre et al. (2008) pointed out thatin order to optimize the efficiency of cryo- and dehydro-protectingagents of biomolecules, the construction of state diagrams was agood starting point for the analysis of the dynamic of qualitychanges, but they must be complemented by knowledge of theintermolecular interactions that may take place.
7. Combining other factors with glass transition and wateractivity concepts
The graphical plot of glass transition and water content as afunction of water activity as discussed earlier is just a relationwithout any real indication of stability. In addition determinationof the stability could not be solved even by identifying macro-re-gion or micro-region, but it could help in developing an organizedapproach towards determining stability. Further research needs tobe targeted towards the stability in each macro–micro region andto explore more generic rules for stability. A knowledge-based ap-proach could be used to explore further, for example by identifyinghow other factors, such as pH, preservatives, types of solutes affectthe stability in each micro-region. Other alternative approaches asproposed in this paper are to define a critical temperature for sta-bility and then to identify the relationship of Tc/Tg as a function of
M.S. Rahman / Journal of Food Engineering 99 (2010) 402–416 413
Xw, pH and other factors. This approach could also have high poten-tial in combining multi-concepts. However, a knowledge-base thrudata mining is also required to progress all the ideas further. Thedatabase if developed could be the foundation for new theoreticalprogress.
8. Water mobility concept
The water activity or glass transition concept may define thesimplified nature of the real complexity. It would be interestingto incorporate the concept of water mobility in order to providea more complete picture of food stability. Irrespective of wateractivity or glass transition the key factor is the mobility of watermolecules within the food matrix. At a given water activity, somemolecules can be mobile, whilst others are not. Similarly moleculescould be mobile both below and above glass transition. In foods,mobility can be expressed by Fickian, non-Fickian and fractal diffu-sion. In addition, molecules can move as a whole, or localized mo-tion can be observed. Therefore, the ability of reactants to movedecides whether a given reaction can proceed. In the following sec-tion, molecular mobility and their relevance to the physico-chem-ical changes in foods are discussed. An attempt is also made torelate or differentiate molecular mobility in relation to thermalor mechanical glass transition (i.e. structural mobility).
Molecular mobility of water has been addressed often as a foodstability indicator, but limited experimental data is available (Vit-tadini et al., 2001). In order to have a complete understanding ofthe molecular motions in and above the glassy state, other relaxa-tion techniques that may explain many complexities should beconsidered. Nuclear Magnetic Resonance (NMR) is being used tocharacterize molecular mobility in foods (Richardson and Stein-berg, 1987). Thermal and mechanical relaxation measures mobility(glass transition) in a 20–300 nm range, while NMR measuresmolecular relaxation in a 1–2 nm range. Mobility is defined bythe analytical parameters measured according to time frames orthe frequencies of the methods used. For example, NMR can detectmolecular motions in the picosecond–millisecond range, while dif-ferential scanning calorimetry (DSC) and dynamic mechanicalanalysis (DMA) detect relaxations over milliseconds–secondranges (McBrierty and Packer, 1993). Therefore, data on bulk prop-erties, such as viscosity, modulus, and DSC-glass transition alonecannot be used in some cases to describe directly the molecularchanges (Vittadini et al., 2001). Roudaut et al. (2004) reviewed dif-ferent levels of mobility which existed below and above the glasstransition temperature and selected examples of their conse-quences on the physical properties of food products.
The existence of complex structural features in foods withlengths ranging from nanometers to centimeters and the recogni-tion of complex vibration motions which are activated in the glassystate emphasizes the need to go beyond macroscopic measure-ments of glass transition. It is now important to determine howmolecular structure and mobility as well as microscopic organiza-tion modulate the macroscopic properties (Ludescher et al., 2001).Ludescher et al. (2001) indicated that luminescence spectroscopyprovides a powerful arsenal of biophysical tools to investigatethe structure and molecular mobility of amorphous solids. It canmeasure emission intensity, energy (wavelength), and polarizationwhich could provide direct information about molecular structure,mobility, and local vibrational and rotational motions, which maybe different from global translational mobility.
Water, for example, was found to be very highly mobile even ina glassy state of waxy corn starch (9.3% moisture content) (Li et al.,1998) and water–maltose solutions (Hills and Pardoe, 1995). In thecase of starch, although changes in the backbone mobility of starchcan be observed during a glass transition, this does not necessarilymean that smaller components such as water are also in a glassy,
vitrified state. In fact, un-freezable water has been reported to bevery mobile (liquid like) even at temperature �100 �C below thesystem glass transition (Li et al., 1998). NMR mobile signals werealso observed in gluten (Cherian and Chinachoti, 1996), and waxymaize starch at its glassy state (Tanner et al., 1991).
Spin probe electron spin resonance (ESR) spectroscopy is beingapplied (Hemminga et al., 1993). Le Meste and Duckworth (1988)studied mobility with ESR spectroscopy in concentrated caseinatesolutions at room temperature. They observed an increase of rota-tional mobility when the water content was above 0.25 g/g dryprotein, which was ascribed to a glass–rubber transition. In thecase of different sugar–water mixtures it was clear that the criticaltransition (as determined from changes in the rotational correla-tion time of ESR spin probe) agreed very well with those obtainedfrom glass transition from DSC (Hemminga et al., 1993). In addi-tion, ESR spectroscopy was shown to be a powerful technique toobtain information about hydrogen bonds and the presence of cav-ities in glassy and liquid systems. Buitink and Leprince (2004) ex-plained the stability of plant seeds as the molecular mobility,packing density of glass, and density of hydrogen bonding withinthe glassy seeds as measured by ESR and FTIR analysis.
Natural cellulose is a structurally heterogeneous polymer, con-sisting of paracrystalline and amorphous domains. The glass tran-sition temperature of dry cellulose has been reported to beextremely high (220–250 �C). For cellulose, Vittadini et al. (2001)did not observe any glass–rubber transition by DSC. They men-tioned that the reported values in the literature were well aboveits decomposition temperature. DSC method was not sensitive en-ough to trace the transitions when there were small changes inheat capacity (Cauley et al., 1991; Quinn et al., 1988). However,the 1H signal showed high immobility in region 1 (moisture: 0–3 g/100 g dry solids) and even the mobility of the liquid like com-ponent was retarded. Water was strongly associated with the cel-lulose fibers, i.e. by H-bonding to the OH groups. In region 2(moisture content: 3–9 g/100 g dry solids), 1H NMR showed signif-icant rigidity, but the mobility of the mobile component increasedbased on LW measurements and 2H NMR T2 signal. In this region, aliquid deuterium signal showed that the deuterated water mole-cules gave a split resonance at a moisture level of 8.9 g/100 g drysolids corresponding to the point where the wide proton compo-nent disappeared, the water sorption isotherm showed an upwardconcavity, line narrowing was significant, and the 2H T2 and 2Harea increased.
In region 3 (moisture content > 9 g/100 g dry solids), the systemwas in fast exchange conditions, water molecules were highly mo-bile, but their T2 was 300 times shorter than the T2 of bulk water.Water in this region was potentially available for chemical reac-tions and microbial activity, depending on the system. Even in re-gion 3, water molecules were still un-freezable (up to a moisturecontent 19 g/100 g dry solids), suggesting that they were not phaseseparate and did not form large ice crystals detectable by DSC. Thiswater, in a molecular level, was highly mobile and therefore notvitrified in a viscous-glassy state. In regions 2 and 3, a significantstructural (glass) transition in the amorphous domains of cellulosewould be expected, but was not observed experimentally by DSC.On the other hand, significant molecular mobility changes wereobserved by NMR (short range). The experimental evidence re-ported in this example strongly supports the need to differentiatebetween structural and molecular mobility.
Hodzic et al. (1995) also identified three types of water (crystal-line, hydrated, and free water) in freeze-dried bacterial cells froman NMR signal. The free water showed no constraint of mobility ex-cept the relatively high viscosity of the bacterial cytoplasm. In thecase of potato starch, Yakubu et al. (1991) detected tightly bound,weakly sorbed, anisotropically bound, and free or bulk water usingNMR. The anisotropically bound water showed highly restricted

414 M.S. Rahman / Journal of Food Engineering 99 (2010) 402–416
motions within the starch granule structure and re-oriented muchslower than free water, but was far from being ice-like. Thus potatostarch exhibited unique hydration properties compared to cerealstarches. NMR T2 distribution revealed two distinct water popula-tions in the un-gelatinized starch–water mixture corresponding tointra (less mobile) and extra (more mobile) granular water, whichrapidly exchanged during gelatinization (Tananuwong and Reid,2004). Capillary and bound water was observed in the case ofsoy proteins (Tanteeratarm et al., 1990). Chen et al. (1997) identi-fied three types of water using NMR spin–lattice relaxation, spin–spin relaxation time and proton intensity and these NMR parame-ters correlated with the firming process in the bread crumb andcould be related to macroscopic and microscopic migration ofwater during staling. Noel et al. (2000) studied the molecularstructure of low molecular weight carbohydrate using the dielec-tric relaxation technique. They observed a primary a-relaxation(activation energy 250–405 kJ/mol) at temperatures above theDSC-glass transition temperature, and in most cases a secondaryb-relaxation (activation energy 42–55 kJ/mol) at temperatureslower than glass transition. The b-relaxation varied from weak tostrong depending on the hydroxymethyl group. Addition of watershifted the a-relaxation to lower temperatures and increased thestrength of the b-relaxation. In glucitol this resulted in a mergingof the a- and b-relaxations. In other cases b-relaxation increasedin strength and decreased in temperature.
Vittadini et al. (2002) studied the NMR water mobility, struc-tural transition by DSC and DMA analysis, and microbial death inxanthan and locust bean gum mixtures. A closer correlation be-tween cell growth and higher water mobility could be observed.However, cell survival decreased as the moisture content increasedfrom 6 to 25 g/100 g dry solids corresponding with increasing mo-bile proton and deuterium signals (i.e. increased mobility),whereas no death was observed when the moisture was below6 g/100 g solids. In addition, the presence of mannitol protectedthe cells from death at increasing moisture contents and a relation-ship with a lower mobile 1H signal observed. These processes couldbe explained by water mobility, while no evidence of a glassy–rub-ber transition was observed from DSC and DMA analyses suggest-ing structural relaxation did not play a significant role in NMRmolecular mobility and explaining microbial survival. Similarly inthe case of dried chicken muscle (Acevedo et al., 2006), and date-pits (Rahman et al., 2007), it was difficult to trace a shift in theDSC thermogram line due to low differences in specific heat atglass transition.
Lin et al. (2006) plotted NMR T2 signal (spin–spin relaxationtime constant) as a function of temperature for different food pow-ders and observed four types or patterns of curvature. Type 1showed a change in slope after the critical temperature, type 2showed a shift in the line with a change in slope, type 3 showeda linear increase, and type 4 showed no change in slope. Theyfound that some of the curve features were correlated highly tothe physiochemical states and changes of food polymers, for exam-ple, caking, stickiness, and firming. Chung et al. (2003) and Lin et al.(2006) developed a model by multiple regression for the predictionof time until caking of the mixed powder systems at different tem-peratures based on DT (difference between storage and criticaltemperature for onset of caking), and two other parameters (slopesbefore and after critical temperature) defined from the NMR signal.
Bertram et al. (2006) investigated the relationship betweenthermal denaturation of meat proteins and heat-induced changesin water characteristics by DSC (denaturation temperatures) andNMR (water mobility). The major changes in water characteristicsduring heating occurred between 40 and 50 �C. This was probablyinitiated by denaturation of myosin heads, which could not be de-tected in the DSC thermograms. Modeling revealed a correlationbetween denaturation of myosin rods and light chains at �53–
58 �C and heat-induced changes in myofibrillar water as well asbetween actin denaturation at �80–82 �C and expulsion of waterfrom meat.
Bell et al. (2002) studied the chemical stability for four chemicalreactions in systems with different levels of water mobility asdetermined by NMR. They emphasized that water mobility wasnot affected by glass–rubber transition since NMR signals varieddifferently in different glassy matrices. Their study did not supporta link between water mobility and reaction kinetic data alone. Theeffect of water on food chemical stability in solids is multidimen-sional, being dependent upon the type of reaction and the charac-teristics of the system. No single explanation for how water affectschemical reactions in reduced moisture solids currently exists (Bellet al. 2002). Using 1H NMR, Partanen et al. (2004) studied the plas-ticization of amylose films by glycerol and water. Spin–spin relax-ation (T2) showed a change in slope close to the glass transition,while spin–lattice relaxation (T1) showed minimum values whichmay not necessarily be close to glass transition. The spin–latticerelaxation also showed that in the glassy state, glycerol may de-crease amylose mobility and act as an anti-plasticizer.
Kalichevsky et al. (1992) measured the transition of an amylo-pectin–water system by DSC (thermal), DMTA (mechanical) andNMR (molecular mobility) and observed variations in the transi-tion temperature related to DSC glass–rubber phenomena. It wasrelated to the frequency and nature of the measurement technique.However, Ruan et al. (1998) found similar transitions measured byDSC and NMR in the case of food polymers (maltodextrin, bread,cake and crackers). In many instances thermal and mechanicalrelaxation coincided with the molecular mobility measured byNMR and other techniques.
Le Meste et al. (1999) demonstrated that the critical tempera-ture may or may not be at the glass transition but depends onthe type of reactions and the matrix. They pointed that the criticaltemperature may be the onset of some motions not directly relatedto the main relaxation process associated from collective motionsat the glass transition. They have illustrated two examples: enzy-matic reaction in frozen sucrose solution and crispness in cereal-based foods. The rate of enzymatic reaction in frozen sucrose solu-tion was related to the diffusion of reactants to the substrate, andto the viscosity of the matrix. Different critical temperatures ex-isted for different solid concentrations of the frozen sugar matrix,which was not the T 0g .
The loss of crispiness in cereal foods was related to the molec-ular mobility determined by NMR. The hydration induced loss ofcrispness in cereal based foods was observed at a critical moisturecontent between 9% and 10%. The onset of the glass transition wasat 25 �C when the moisture content was around 15% indicating thatthe loss of crispness occurred when the products were still in theglassy state. In addition, NMR signals indicated some water pro-tons in glassy bread below 10% moisture showed much highermobility compared to the protons of the matrix. Dielectric andmechanical spectroscopy demonstrated that sub glass relaxationprocesses occurred in cereal glasses.
The above discussion presented the issues of molecular mobilityin relation to structural glass transition. It is another challenge torelate molecular mobility with structural glass transition. In thefirst instance available data in the literature could be compiled toexplore when and how molecular mobility is related with struc-tural glass. The author’s group is working in this direction but itis beyond the scope of this paper.
9. Conclusion
A graphical plot of glass transition and water content as a func-tion of water activity could be used to see the relationship betweenwater activity and glass transition. State diagrams could also be

M.S. Rahman / Journal of Food Engineering 99 (2010) 402–416 415
used to combine water activity and glass transition concepts byincluding BET-monolayer and glass lines. In the state diagram, 13macro–micro regions could also be drawn to identify the variabil-ity in stability at different regions. A knowledge base needs to bedeveloped in each macro- and micro-region for developing furthergeneric rules and limitations in each region. In addition a new ap-proach is proposed by defining a critical temperature for stabilityand then relating it with water content or water activity, and otherfactors. Mobility of reactants decides whether a given reaction canproceed or not. Water mobility measured by Nuclear MagneticResonance (NMR), luminescence spectroscopy, and spin probeelectron spin resonance (ESR) spectroscopy indicated interestinglythat the water activity or glass transition concept may only be thesimplified nature of the real complexity. A number of differentparameters measured by other spectroscopic methods indicateda wide variety or types of water molecular mobility above or belowmatrix glass transition temperature. In many instances, this mobil-ity approach could be used to explain clearly the complexity offood stability, especially when the water activity or glass transitionconcept can not help to explain the process. However, until now itis a challenge to link mobility concept with water activity or glasstransition beyond the empirical approach.
Acknowledgements
The author would like to acknowledge the support of Sultan Qa-boos University towards his research in the area of food structureand stability. He is grateful to all members in his research group fortheir continued support and encouragement. Special thanks to Dr.Ann Mothershaw for checking the clarity of the paper.
References
Acevedo, N.C., Schebor, C., Buera, M.D.P., 2008. Sorption properties of dehydratedmodel systems and their relationship to the rate of non-enzymatic browning.In: Gutierrez-Lopez, G.F., Barbosa-Canovas, G.V., Welti-Chanes, J., Parada-Arias,E. (Eds.), Food Engineering: Integrated Approaches. New York, Springer Science.
Acevedo, N., Schebor, C., Buera, M.P., 2006. Water–solids interactions, matrixstructural properties and the rate of non-enzymatic browning. Journal of FoodEngineering 77, 1108–1115.
Angell, C.A., 1988. Perspective on the glass transition. Journal of Physics andChemistry of Solids 49, 863–871.
Angell, C.A., 1995. Formation of glasses from liquid and biopolymers. Science 267,1924–1935.
Bell, L.N., Bell, H.M., Glass, T.E., 2002. Water mobility in glassy and rubbery solids asdetermined by oxygen-17 nuclear magnetic resonance: impact on chemicalstability. Food Science and Technology 35, 108–113.
Bertram, H.C., Wu, Z., van den Berg, F., Andersen, H.J., 2006. NMR relaxometry anddifferential scanning calorimetry during meat cooking. Meat Science 74 (4),684–689.
Brown, M.H., Booth, I.R., 1991. Acidulants and low pH. In: Russell, N.J., Gould, G.W.(Eds.), Food Preservatives. Glasgow, pp. 22–43.
Buera, M.D.P., Chirife, J., Karel, M., 1995. A study of acid-catalyzed sucrosehydrolysis in an amorphous polymeric matrix at reduced moisture contents.Food Research International 28 (4), 359–365.
Buitink, J., Leprince, O., 2004. Glass formation in plant anhydrobiotes: survival inthe dry state. Cryobiology 48, 215–228.
Cauley, B.J., Cipriani, C., Ellis, K., Roy, A.K., Jones, A.A., Inglefield, P.T., 1991. Glasstransition and dynamics of phosphate esters dissolved in two glassy polymermatrices. Macromolecules 24, 403–409.
Caurie, M., 1971a. A practical approach to water sorption isotherms and the basisfor the determination of optimum moisture levels of dehydrated foods. Journalof Food Technology 6 (1), 85–93.
Caurie, M., 1971b. A single layer moisture absorption theory as a basis for thestability and availability of moisture in dehydrated foods. Journal of FoodTechnology 6 (2), 193–201.
Champion, D., Le Meste, M., Simatos, D., 2000. Towards an improved understandingof glass transition and relaxations in foods: molecular mobility in the glasstransition range. Trends in Food Science and Technology 11, 41–55.
Chan, K.Y.E. (1991). A solid state assay for free thiol groups and disulfide bonds innative and extruded corn meal. M.Sc. Thesis. Rutgers University, NewBrunswick, NJ.
Chen, P.L., Long, Z., Ruan, R., Labuza, T.P., 1997. Nuclear magnetic resonance studiesof water mobility in bread during storage. Food Science and Technology 30,178–183.
Chen, Y., Aull, J.L., Bell, L.N., 1999. Invertase storage stability and sucrose hydrolysisin solids as affected by water activity and glass transition. Journal ofAgricultural and Food Chemistry 47, 504–509.
Cherian, G., Chinachoti, P., 1996. 2H and 17O nuclear magnetic resonance study ofwater in gluten in the glassy and rubbery state. Cereal Chemists 73, 618–624.
Chirife, J., 1994. Specific solute effects with special reference to Staphylococcusaureus. Journal of Food Engineering 22, 409–419.
Chirife, J., Buera, M.D.P., 1996. Water activity, water glass dynamics, and the controlof microbiological growth in foods. Critical Reviews in Food Science andNutrition 36 (5), 465–513.
Chung, M., Ruan, R., Chen, P., Kim, J., Ahn, T., Baik, C., 2003. Predicting cakingbehaviors in powdered foods using a low-field nuclear magnetic resonance(NMR) technique. Food Science and Technology 36, 751–761.
Cuq, B., Abecassis, J., Guilbert, S., 2003. State diagrams to help describe wheat breadprocessing. International Journal of Food Science and Technology 38, 759–766.
Ferry, J.D., 1991. Some reflections on the early development of polymer dynamics:viscoelasticity, dielectric dispersion, and self-diffusion. Macromolecules 24,5237–5245.
Franks, F., 1991. Water activity: a credible measured of food safety and quality?Trends in Food Science and Technology 2 (3), 68–72.
Hancock, B.C., Zografi, G., 1997. Characteristics and significance of the amorphousstate in pharmaceutical systems. Journal of Pharmaceutical Sciences 86 (1), 1–12.
Hardman, T.M., 1986. Interaction of water with food component. In: Birch, G.G.,Lindley, M.G. (Eds.), Interaction of Food Components. Elsevier Applied SciencePublishers, London, UK, pp. 19–30.
Hemminga, M.A., Roozen, M.J.G.W., Walstra, P., 1993. Molecular motions and theglassy state. In: Blanshard, J.M.V., Lillford, P.J. (Eds.), The Glassy State in Foods.Nottingham University Press, Leicestershire, pp. 157–171.
Hills, B.P., Pardoe, K., 1995. Proton and deuterium NMR studies of the glassytransition in a 10% water–meltose solution. Journal of Molecular Liquids 63,229–237.
Hodzic, D., llabres, G., Zgoulli, S., Gilsoul, J.J., Thonart, P., 1995. Study of residualwater types in freeze-dried Lactobacillus acidophilus by Nuclear MagneticResonance. Food Science and Technology 28, 21–24.
Kalichevsky, M.T., Jaroszkiewicz, E.M., Ablett, S., Blanshard, J.M.V., Lillford, P.J., 1992.The glass transition of amylopectin measured by DSC, DMTA and NMR.Carbohydrate Polymers 18, 77–88.
Kalichevsky-Dong, M.T., 2000. The glass transition and microbial stability. In:Kilcast, D., Subramaniam, P. (Eds.), The Stability and Shelf Life of Food.Woodhead Publishing, Cambridge, England and CRC Press, Boca Raton, FL,USA, pp. 25–53.
Karel, M., Anglea, S., Buera, P., Karmas, R., Levi, G., Roos, Y., 1994. Stability-relatedtransitions of amorphous foods. Thermochimica Acta 246, 249–269.
Kasapis, S., 2005. Glass transition phenomena in dehydrated model systems andfoods: a review. Drying Technology 23 (4), 731–758.
Kokini, J.L., Cocero, A.M., Madeka, H., 1995. State diagrams help predict theology ofcereal proteins. Food Technology 49 (10), 74–82.
Kokini, J.L., Cocero, A.M., Madeka, H., De Graaf, E., 1994. The development of statediagrams for cereal proteins. Trends in Food Science and Technology 5, 281–288.
Kouassi, K., Roos, Y.H., 2001. Glass transition and water effects on sucrose inversionin noncrystalline carbohydrate food systems. Food Research International 34,895–901.
Labuza, T.P., McNally, L., Gallagher, D., Hawkes, J., Hurtado, F., 1972. Stability ofintermediate moisture foods. I. Lipid oxidation. Journal of Food Science 37, 154–159.
Le Meste, M., Champion, D., Roudaut, G., Blond, G., Simatos, D., 2002. Glasstransition and food technology: a critical appraisal. Journal of Food Science 67(7), 2444–2458.
Le Meste, M., Roudaut, G., Rolee, A., 1997. The physical state and quality of cereal-based foods. In: Fito, P., Ortega-Rodriguez, E., Barbosa-Canovas, G.V. (Eds.), FoodEngineering 2000. Chapman & Hall, New York, USA, pp. 97–113.
Le Meste, M., Voilley, A., Colas, B. 1991. Influence of water on the mobility of smallmolecules dispersed in a polymeric system. In: Levine, H., Slade, L. (Eds.), WaterRelationships in Foods. Plenum Press, NY, pp. 123–138.
Le Meste, M., Duckworth, R.B., 1988. Effect of water content on the mobility ofsolute molecules and of protein side chains in caseinate preparations.International Journal of Food Science and Technology 23, 457–466.
Le Meste, M., Champion, D., Roudaut, G., Contreras-Lopez, E., Blond, G., Simatos, D.,1999. Mobility and reactivity in low moisture and frozen foods. In: Roos, Y.H.,Leslie, R.B., Lillford, P.J. (Eds.), Water Management in the Design andDistribution of Quality Foods. Technomic Publishing, Lancaster, pp. 267–284.
Leistner, L., Rodel, W., Krispien,K., 1981. Microbiology ofmeat and meat products inhighand intermediate moisture ranges. In: Rockland, L.B., Stewart, G.F. (Eds.), WaterActivity: Influences on Food Quality. Academic Press, New York, pp. 855–916.
Levine, H., Slade, L., 1986. A polymer physico-chemical approach to the study ofcommercial starch hydrolysis products (SHPs). Carbohydrate Polymer 6, 213–244.
Levine, H., Slade, L., 1993. The glassy state in applications for the food industry, withan emphasis on cookie and cracker production. In: Blanshard, J.M.V., Lillford, P.J.(Eds.), The Science and Technology of the Glassy State in Foods. University ofNottingham Press, Nottingham.
Li, S., Dickinson, L.C., Chinachoti, P., 1998. Mobility of ‘‘unfreezable” and ‘‘freezable”water in waxy corn starch by 2H and 1H NMR. Journal of Agricultural FoodChemistry 46, 62–71.
416 M.S. Rahman / Journal of Food Engineering 99 (2010) 402–416
Lin, X., Ruan, R., Chen, P., Chung, M., Ye, X., Yang, T., Doona, C., Wagner, T., 2006.NMR state diagram concept. Journal of Food Science 71 (9), R136–R145.
Liu, Y., Bhandari, B., Zhou, W., 2006. Glass transition and enthalpy relaxation ofamorphous food saccharides: a review. Journal of Agricultural Food Chemistry54, 5701–5717.
Ludescher, R.D., Shah, N.K., McCaul, C.P., Simon, K.V., 2001. Beyond Tg: opticalluminescence measurements of molecular mobility in amorphous solid foods.Food Hydrocolloids 15, 331–339.
Luyet, B., Rasmussen, D., 1968. Study by differential thermal analysis of thetemperatures of instability of rapidly cooled solutions of glycerol, ethyleneglycol, sucrose and glucose. Biodynamica 10, 167–191.
Madeka, H., Kokini, J.L., 1994. Changes in rheological properties of gliadin as afunction of temperature and moisture: development of a state diagram. Journalof Food Engineering 22, 241–252.
Madeka, H., Kokini, J.L., 1996. Effect of glass transition and cross-linking onrheological properties of zein: development of a preliminary state diagram.Cereal Chemistry 73 (4), 433–438.
Mazzobre, M.F., Santagapita, P.R., Gutierrez, N., Buera, M.D.P., 2008. Consequencesof matrix structural chnages on functional stability of enzymes as affected byelectrolytes. In: Gutierrez-Lopez, G.F., Barbosa-Canovas, G.V., Welti-Chanes, J.,Parada-Arias, E. (Eds.), Food Engineering: Integrated Approaches. SpringerScience, New York, pp. 73-87
McBrierty, V.J., Packer, K.J., 1993. Nuclear Magnetic Resonance in Solid Polymers.Cambridge University press, Cambridge, UK.
Minor, T.E., Marth, E.H., 1972. Growth of Staphylococcus in acidified pasteurizedmilk. Journal of Milk Food Technology 33, 516–520.
Nascimento, M.L.F., Aparicio, C., 2007. Viscosity of strong and fragile glass-formingliquids investigated by means of principal component analysis. Journal ofPhysics and Chemistry of Solids 68, 104–110.
Noel, T.R., Parker, R., Ring, S.G., 2000. Effect of molecular structure and watercontent on the dielectric relaxation behaviour of amorphous low molecularweight carbohydrates above and below their glass transition. CarbohydrateResearch 329, 839–845.
Partanen, R., Marie, V., MacNaughtan, W., Forssell, P., Farhat, I., 2004. 1H NMR studyof amylose films plasticised by glycerol and water. Carbohydrate Polymers 56,147–155.
Post, L.S., Amoroso, T.L., Solberg, M., 1985. Inhibition of Clostridium botulinum type Ein model acidified food systems. Journal of Food Science 56 (4), 966–968.
Quinn, F.X., Kampff, E., Smyth, G., McBrierty, V.J., 1988. Water in hydrogels. I. Astudy of water in poly(N-vinyl-2-pyrrolidone/methyl methacrylate) copolymer.Macromolecules 21, 3191–3198.
Rahman, M.S., 1995. In: Food Properties Handbook. CRC Press, Boca Raton, FL, USA.Rahman, M.S., 2004. State diagram of date flesh using differential scanning
calorimetry (DSC). International Journal of Food Properties 7 (3), 407–428.Rahman, M.S., 2005. Dried food properties: challenges ahead. Drying Technology 23
(4), 695–715.Rahman, M.S., 2006. State diagram of foods: its potential use in food processing and
product stability. Trends in Food Science and Technology 17, 129–141.Rahman, M.S., Al-Belushi, R.H., 2006. Dynamic isopiestic method (DIM): measuring
moisture sorption isotherm of freeze-dried garlic powder and other potentialuses of DIM. International Journal of Food Properties 9, 421–437.
Rahman, M.S., 2007a. Food preservation: overview. In: Rahman, M.S. (Ed.),Handbook of Food Preservation, second ed. CRC Press, Boca Raton, FL, USA,pp. 3–18.
Rahman, M.S., 2007b. Glass transition and other structural changes in foods. In:Rahman, M.S. (Ed.), Handbook of Food Preservation, second ed. CRC Press, NewYork, USA, pp. 75–93.
Rahman, M.S., Kasapis, S., Al-Kharusi, N.S.Z., Al-Marhubi, I.M., Khan, A.J., 2007.Composition characterization and thermal transition of date pits powders.Journal of Food Engineering 80 (1), 1–10.
Rahman, M.S., 2009. Food stability beyond water activity and glass transition:macro–micro region concept in the state diagram. International Journal of FoodProperties 12(4), 726–740.
Rahman, M.S., Al-Belushi, R., Guizani, N., Al-Saidi, G.S., Soussi, B., 2009. Fat oxidationin freeze-dried grouper during storage at different temperatures and moisturecontent. Food Chemistry 114, 1257–1264.
Rahman, M.S., Sablani, S.S., Al-Habsi, N., Al-Maskri, S., Al-Belushi, R., 2005. Statediagram of freeze-dried garlic powder by differential Scanning Calorimetry andcooling curve methods. Journal of Food Science 70 (2), E135–E141.
Rahman, M.S., Labuza, T.P., 2007. Water activity and food preservation. In: Rahman,M.S. (Ed.), Handbook of Food Preservation, second ed. CRC Press, Boca Raton, FL,pp. 447–476.
Richardson, S.J., Steinberg, M.P., 1987. Applications of nuclear magnetic resonance.In: Rockland, L.B., Beuchat, L.R. (Eds.), Water Activity: Theory and Applicationsto Food. Marcel Dekker, New York.
Roos, Y., 1995. Characterization of food polymers using state diagrams. Journal ofFood Engineering 24, 339–360.
Roos, Y.H., Karel, M., Kokini, J.L., 1996. Glass transitions in low moisture and frozenfoods: Effects on shelf life and quality. Food Technology 50 (11), 95–108.
Roos, Y., Karel, M., 1991a. Applying state diagrams to food processing anddevelopment. Food Technology 44 (12), 66–71.
Roos, Y., Karel, M., 1991b. Plasticizing effect of water on thermal behavior andcrystallization of amorphous food models. Journal of Food Science 56, 38–43.
Roudaut, G., Simatos, D., Champion, D., Contreras-Lopez, E., Le Meste, M., 2004.Molecular mobility around the glass transition temperature: a mini review.Innovative Food Science and Emerging Technologies 5, 127–134.
Ruan, R.R., Long, Z., Song, A., Chen, P.L., 1998. Determination of the glass transitiontemperature of food polymers using low field NMR. Food Science andTechnology 31, 516–521.
Sablani, S.S., Kasapis, S., Rahman, M.S., 2007. Evaluating water activity and glasstransition concepts for food stability. Journal of Food Engineering 78,266–271.
Sablani, S.S., Kasapis, S., Rahman, M.S., Al-Jabri, A., Al-Habsi, N., 2004. Sorptionisotherms and the state diagram for evaluating stability criteria of abalone.Food Research International 37, 915–924.
Schebor, C., Buera, M.D.P., Chirife, J., Karel, M., 1995. Sucrose hydrolysis in a glassystarch matrix. Food Science and Technology 28, 245–248.
Schmidt, S.J., 2004. Water and solids mobility in foods. Advances in Food andNutrition Research 48, 1–101.
Scott, W.J., 1953. Water relations of Staphylococcus aureus at 30 �C. AustralianJournal of Biological Science 6, 549–564.
Slade, L., Levine, H., 1988a. Non-equilibrium behavior of small carbohydrate-watersystems. Pure Applied Chemistry 60, 1841–1864.
Slade, L., Levine, H., 1988b. Structure stability of intermediate moisture foods – anew understanding? In: Blanshard, J.M.V., Mitchell, J.R. (Eds.), Food Structure –Its Creation and Evaluation. Butterworths, London, pp. 115–147.
Slade, L., Levine, H., 1994. Water and the glass transition-dependence of the glasstransition on composition and chemical structure: special implications for flourfunctionality in cookie baking. Journal of Food Engineering 22, 143–188.
Slade, L., Levine, H., 1995. Glass transitions and water–food structure interactions.Advances in Food and Nutrition Research 38, 103–179.
Slade, L., Levine, H., Ievolella, J., Wang, M., 1993. The glassy state phenomenon inapplications for the food industry: application of the food polymer scienceapproach to structure–function relationships of sucrose in cookie and crackersystems. Journal of the Science and Food Agriculture 63 (2), 133–176.
Slade, L., Levine, L., 1991. A food polymer science approach to structure propertyrelationships in aqueous food systems: non-equilibrium behavior ofcarbohydrate–water systems. In: Levine, H., Slade, L. (Eds.), WaterRelationships in Food, Plenum Press, New York, USA, pp. 29–101.
Smelt, J.P.P.M., Raatjes, G.J.M., Crother, J.S., Verrips, C.T., 1982. Growth and toxinformation by Clostridium botulinum at low pH values. Journal of AppliedBacteriology 52, 75–82.
Sokolov, A.P., 1997. The glass transition: new ideas in an age-old field. Endeavour 21(3), 109–113.
Sorrels, K.M., Enigel, D.C., Hatfield, J.R., 1989. Effect of pH, acidulant, time andtemperature on the growth and survival of Listeria monocytogenes. Journal ofFood Protection 52, 571–578.
Tananuwong, K., Reid, D.S., 2004. DSC and NMR relaxation studies of starch-waterinteractions during gelatinization. Carbohydrate polymers 58, 345–358.
Tanner, S.F., Hills, B.P., Packer, R., 1991. Interactions of sorbed water with starchstudied using proton nuclear magnetic resonance spectroscopy. Journal of theChemical Society Faraday Transactions 87, 2613–2621.
Tanteeratarm, K., Wei, L.S., Steinberg, M.P., Yamashita, N., 1990. Bound waterassociated with 7S and 11S soy proteins determined by vapor sorptionisotherms and pulsed NMR. Journal of Food Science 55 (1), 130–132.
Terebiznik, M.R., Buera, M.P., Pilosof, A.M.R., 1998. Thermostability and browningdevelopment of fungal a-amylase freeze-dried in carbohydrate and PVPmatrices. Food Science and Technology 31, 143–149.
Van den Berg, C. (1986). Water activity. In: MacCarthy, D. (Ed.), Concentration andDrying of Foods, Elsevier Applied Science, London, p. 11–36.
Vittadini, E., Dickinson, L.C., Chinachoti, P., 2001. 1H and 2H NMR mobility incellulose. Carbohydrate Polymers 46, 49–57.
Vittadini, E., Dickinson, L.C., Chinachoti, P., 2002. NMR water mobility in xanthanand locust bean gum mixtures: possible explanation of microbial response.Carbohydrate Polymers 49, 261–269.
White, G.W., Cakebread, S.H., 1966. The glassy state in certain sugar-containing foodproducts. Journal of Food Technology 1, 73–82.
Yakubu, P.I., Baianu, I.C., Orr, P.H., 1991. Deuterium nuclear magnetic resonancestudies of potato starch hydration. In: Levine, H., Slade, L. (Eds.), WaterRelationships in Food. Plenum Press, New York, pp. 585–595.