for distribution functions commonly used in inferential...
TRANSCRIPT
Ricco RakotomalalaTutoriels Tanagra - http://tutoriels-data-mining.blogspot.fr/ 1
For distribution functions commonly used in inferential statistics (confidence
intervals, tests) : Normal, Student, Chi-Squared, Fisher-Snedecor.
Ricco Rakotomalala
Ricco RakotomalalaTutoriels Tanagra - http://tutoriels-data-mining.blogspot.fr/ 2
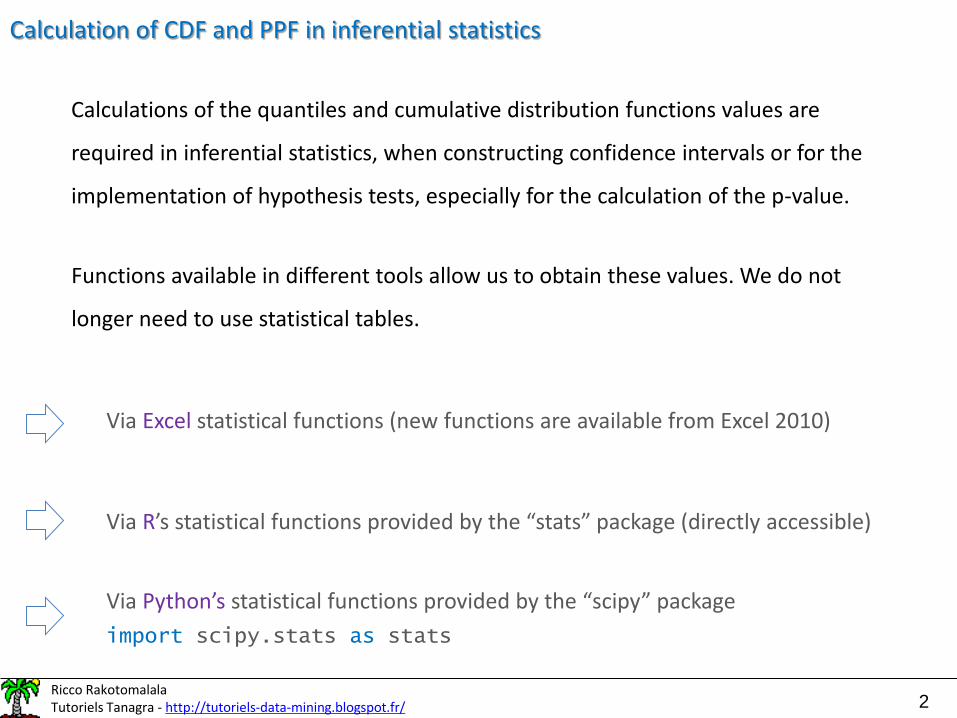
Calculation of CDF and PPF in inferential statistics
Calculations of the quantiles and cumulative distribution functions values are
required in inferential statistics, when constructing confidence intervals or for the
implementation of hypothesis tests, especially for the calculation of the p-value.
Functions available in different tools allow us to obtain these values. We do not
longer need to use statistical tables.
Via Excel statistical functions (new functions are available from Excel 2010)
Via R’s statistical functions provided by the “stats” package (directly accessible)
Via Python’s statistical functions provided by the “scipy” package
import scipy.stats as stats
Ricco RakotomalalaTutoriels Tanagra - http://tutoriels-data-mining.blogspot.fr/ 3
NORMAL DISTRIBUTION
Ricco RakotomalalaTutoriels Tanagra - http://tutoriels-data-mining.blogspot.fr/ 4
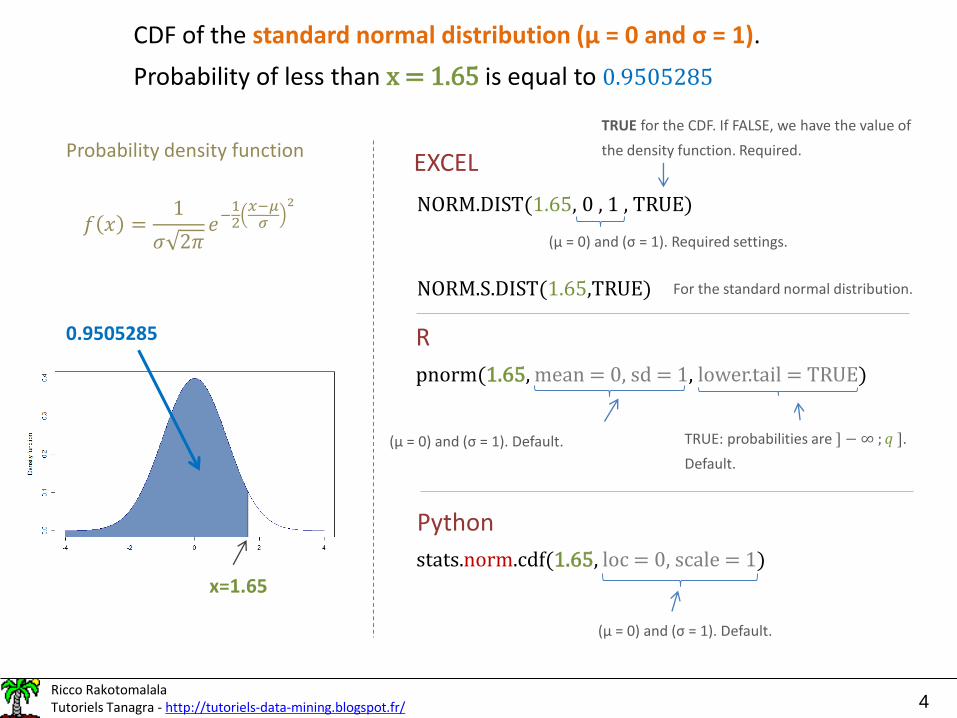
CDF of the standard normal distribution (μ = 0 and σ = 1).
Probability of less than x = 1.65 is equal to 0.9505285
EXCEL
x=1.65
0.9505285
NORM.S.DIST(1.65,TRUE)
TRUE for the CDF. If FALSE, we have the value of
the density function. Required.
R
pnorm(1.65, mean = 0, sd = 1, lower.tail = TRUE)
(μ = 0) and (σ = 1). Default. TRUE: probabilities are ] − ∞ ; 𝑞 ].
Default.
Python
stats.norm.cdf(1.65, loc = 0, scale = 1)
Probability density function
NORM.DIST(1.65, 0 , 1 , TRUE)
(μ = 0) and (σ = 1). Required settings.
For the standard normal distribution.
𝑓 𝑥 =1
𝜎 2𝜋𝑒
−12
𝑥−𝜇𝜎
2
(μ = 0) and (σ = 1). Default.
Ricco RakotomalalaTutoriels Tanagra - http://tutoriels-data-mining.blogspot.fr/ 5
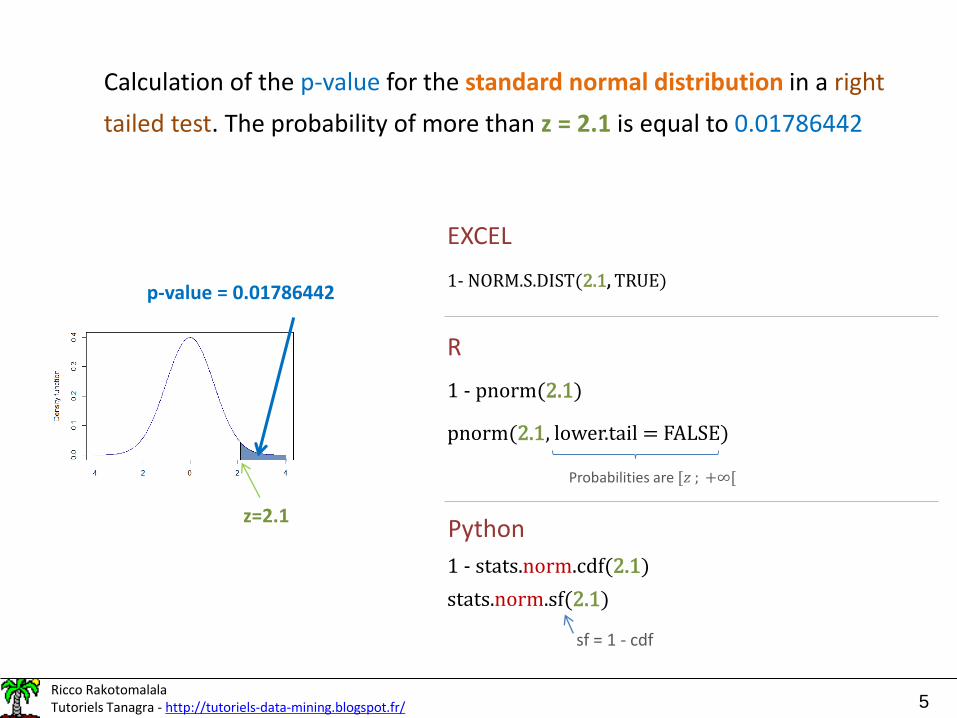
Calculation of the p-value for the standard normal distribution in a right
tailed test. The probability of more than z = 2.1 is equal to 0.01786442
z=2.1
p-value = 0.01786442
EXCEL
1- NORM.S.DIST(2.1, TRUE)
R
1 - pnorm(2.1)
pnorm(2.1, lower.tail = FALSE)
Probabilities are [𝑧 ; +∞[
Python
1 - stats.norm.cdf(2.1)
stats.norm.sf(2.1)
sf = 1 - cdf

Ricco RakotomalalaTutoriels Tanagra - http://tutoriels-data-mining.blogspot.fr/ 6
Calculation of the p-value for the standard normal distribution in a two-
tailed test. The probability of more than z = 2.1 in absolute value is equal
to 0.03572884
+|z|-|z|
p-value = 2 * 0.01786442 = 0.03572884
EXCEL
2*(1- NORM.S.DIST(2.1, TRUE))
R
2 * pnorm(2.1, lower.tail = FALSE)
Python
2 * (1 - stats.norm.cdf(2.1))

Ricco RakotomalalaTutoriels Tanagra - http://tutoriels-data-mining.blogspot.fr/ 7
PPF (q) of the standard normal distribution for
the probability (1 – α) = 0.95
1-αα =0.05
q = 1.644854
EXCELNORM.INV(0.95, 0, 1)
NORM.S.INV(0.95)
R
qnorm(0.95,mean=0,sd = 1,lower.tail=TRUE)
qnorm(0.05,mean=0,sd=1,lower.tail=FALSE)
Python
stats.norm.ppf(0.95, loc =0, scale = 1)

Ricco RakotomalalaTutoriels Tanagra - http://tutoriels-data-mining.blogspot.fr/ 8
Generating random numbers from standard normal distribution
N(μ=0,σ=1)
EXCELNORM.S.INV(RAND())
R
rnorm(n=1,mean=0,sd = 1)
Python
stats.norm.rvs(loc=0,scale=1, size=1, random_state = none)
RAND() returns an evenly distributed random real
number greater than or equal to 0 and less than 1.
Number of values to return. If (n > 1), we obtain a vector of values.
Required.
Number of values to return. If (size > 1), we obtain a vector of
values. Optional.
Initialization of the generator. If random_state = integer, the values
obtained are reproductible. Optional.

Ricco RakotomalalaTutoriels Tanagra - http://tutoriels-data-mining.blogspot.fr/ 9
Approximations of the standard normal cumulative distribution
function. Some “basic” formulas for (x > 0)
Φ1 𝑥 = 1 −𝑒−
𝑥²2
2𝜋
0.4361836
1 + 0.33267𝑥+
−0.1201676
1 + 0.33267𝑥 2+
0.9772980
1 + 0.33267𝑥 3
(https://fr.wikipedia.org/wiki/Loi_normale)
Φ2 𝑥 = 0.5 +1
21 −
1
307𝑒−
𝑥2
2 + 16𝑒−𝑥2 2− 2 + 7 +1
4𝜋𝑥2 𝑒−𝑥2
12
(http://mathworld.wolfram.com/NormalDistributionFunction.html)
Φ1 1.65 = 0.9494966
Φ2 1.65 = 0.9505364(Excel, R and Python 0.9505285)

Ricco RakotomalalaTutoriels Tanagra - http://tutoriels-data-mining.blogspot.fr/ 10
STUDENT’S T-DISTRIBUTION
Ricco RakotomalalaTutoriels Tanagra - http://tutoriels-data-mining.blogspot.fr/ 11
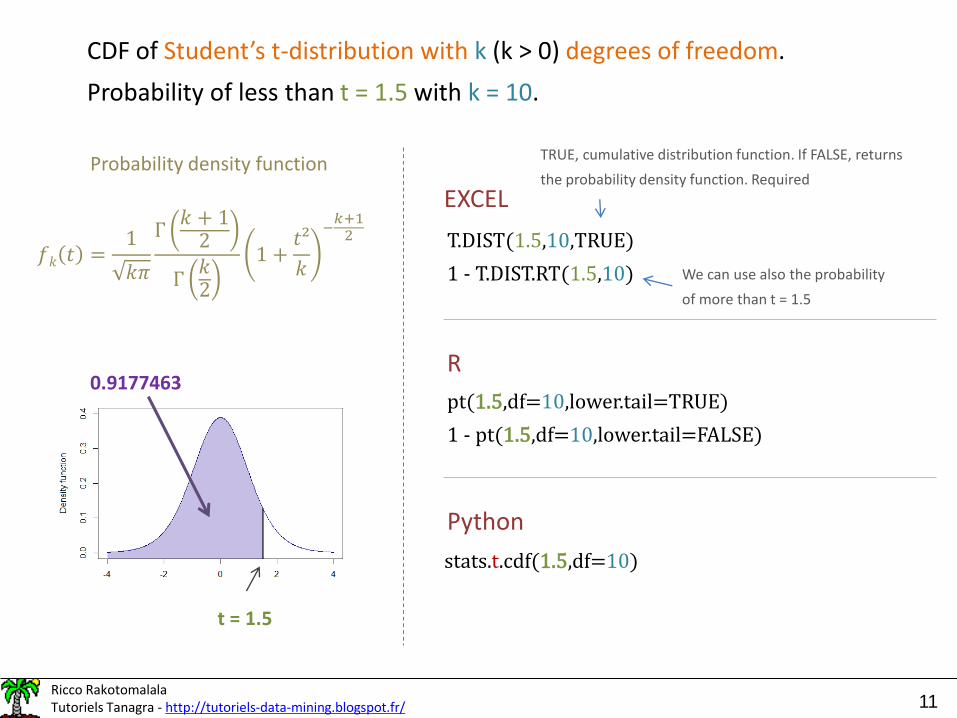
CDF of Student’s t-distribution with k (k > 0) degrees of freedom.
Probability of less than t = 1.5 with k = 10.
Probability density function
𝑓𝑘 𝑡 =1
𝑘𝜋
Γ𝑘 + 1
2
Γ𝑘2
1 +𝑡²
𝑘
−𝑘+1
2
t = 1.5
0.9177463
EXCEL
T.DIST(1.5,10,TRUE)
1 - T.DIST.RT(1.5,10)
TRUE, cumulative distribution function. If FALSE, returns
the probability density function. Required
We can use also the probability
of more than t = 1.5
R
pt(1.5,df=10,lower.tail=TRUE)
1 - pt(1.5,df=10,lower.tail=FALSE)
Python
stats.t.cdf(1.5,df=10)
Ricco RakotomalalaTutoriels Tanagra - http://tutoriels-data-mining.blogspot.fr/ 12
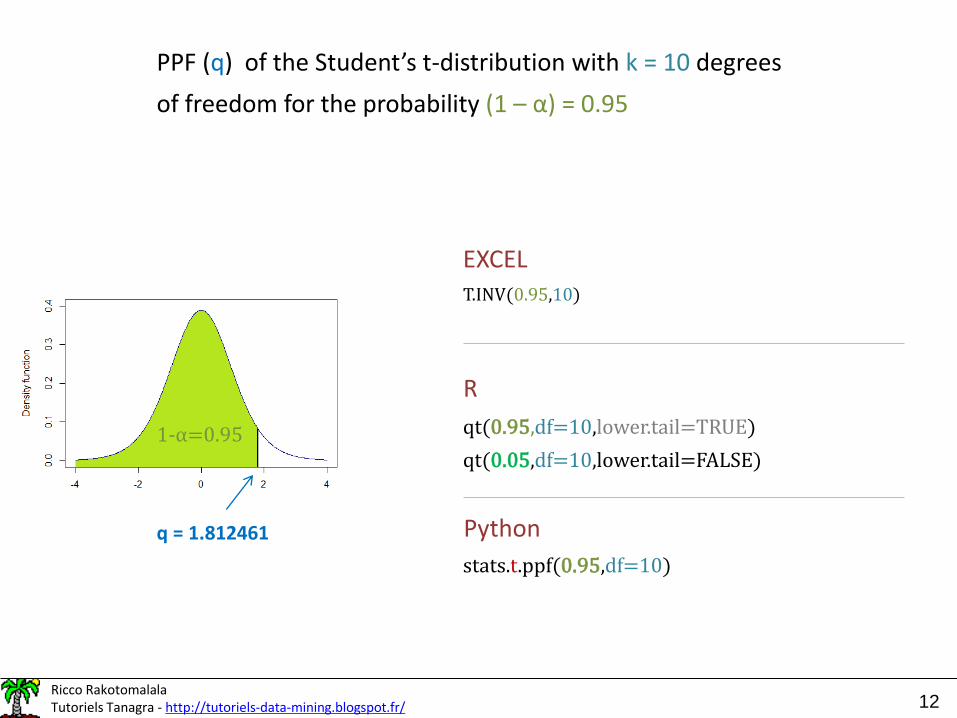
PPF (q) of the Student’s t-distribution with k = 10 degrees
of freedom for the probability (1 – α) = 0.95
1-α=0.95
q = 1.812461
EXCELT.INV(0.95,10)
R
qt(0.95,df=10,lower.tail=TRUE)
qt(0.05,df=10,lower.tail=FALSE)
Python
stats.t.ppf(0.95,df=10)
Ricco RakotomalalaTutoriels Tanagra - http://tutoriels-data-mining.blogspot.fr/ 13
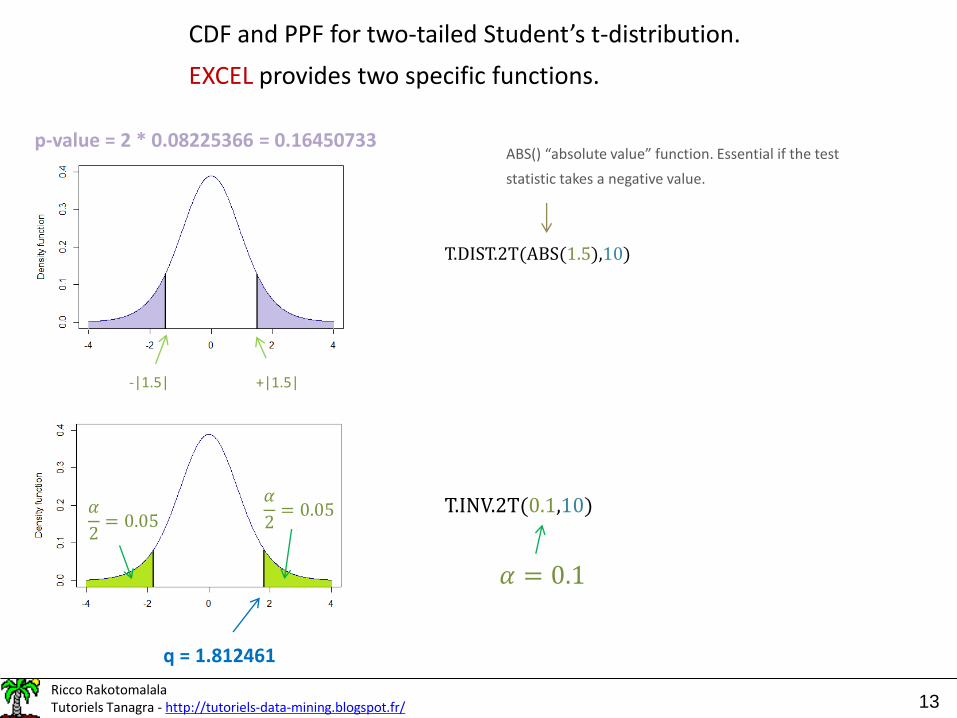
CDF and PPF for two-tailed Student’s t-distribution.
EXCEL provides two specific functions.
T.DIST.2T(ABS(1.5),10)
ABS() “absolute value” function. Essential if the test
statistic takes a negative value.
p-value = 2 * 0.08225366 = 0.16450733
𝛼
2= 0.05𝛼
2= 0.05
q = 1.812461
T.INV.2T(0.1,10)
𝛼 = 0.1
+|1.5|-|1.5|

Ricco RakotomalalaTutoriels Tanagra - http://tutoriels-data-mining.blogspot.fr/ 14
CHI-SQUARED DISTRIBUTION
Ricco RakotomalalaTutoriels Tanagra - http://tutoriels-data-mining.blogspot.fr/ 15
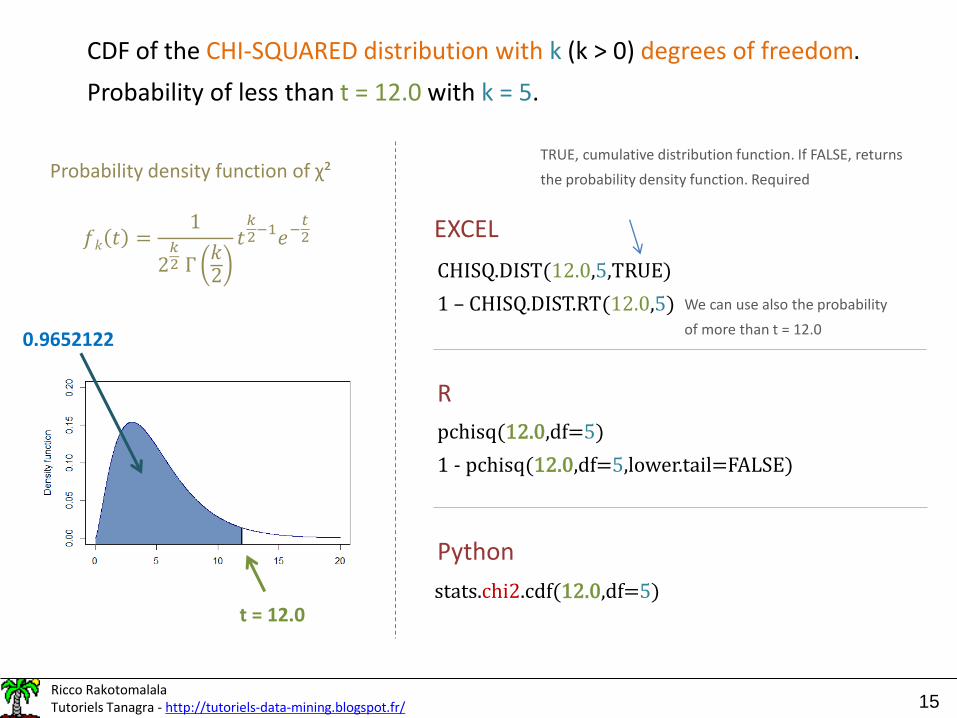
CDF of the CHI-SQUARED distribution with k (k > 0) degrees of freedom.
Probability of less than t = 12.0 with k = 5.
Probability density function of χ²
𝑓𝑘 𝑡 =1
2𝑘2 Γ
𝑘2
𝑡𝑘2
−1𝑒−𝑡2
0.9652122
t = 12.0
EXCEL
CHISQ.DIST(12.0,5,TRUE)
1 – CHISQ.DIST.RT(12.0,5)
R
pchisq(12.0,df=5)
1 - pchisq(12.0,df=5,lower.tail=FALSE)
Python
stats.chi2.cdf(12.0,df=5)
TRUE, cumulative distribution function. If FALSE, returns
the probability density function. Required
We can use also the probability
of more than t = 12.0

Ricco RakotomalalaTutoriels Tanagra - http://tutoriels-data-mining.blogspot.fr/ 16
PPF (q) of the chi-squared distribution with k = 7 degrees of
freedom for the probability (1 – α) = 0.95
EXCELCHISQ.INV (0.95,7)
CHISQ.INV.RT (0.05,7)
R
qchsiq(0.95,df=7)
qchisq(0.05,df=7,lower.tail=FALSE)
Python
stats.chi2.ppf(0.95, df=7)
1-α=0.95
q = 14.06714

Ricco RakotomalalaTutoriels Tanagra - http://tutoriels-data-mining.blogspot.fr/ 17
FISHER-SNEDECOR DISTRIBUTION
Ricco RakotomalalaTutoriels Tanagra - http://tutoriels-data-mining.blogspot.fr/ 18
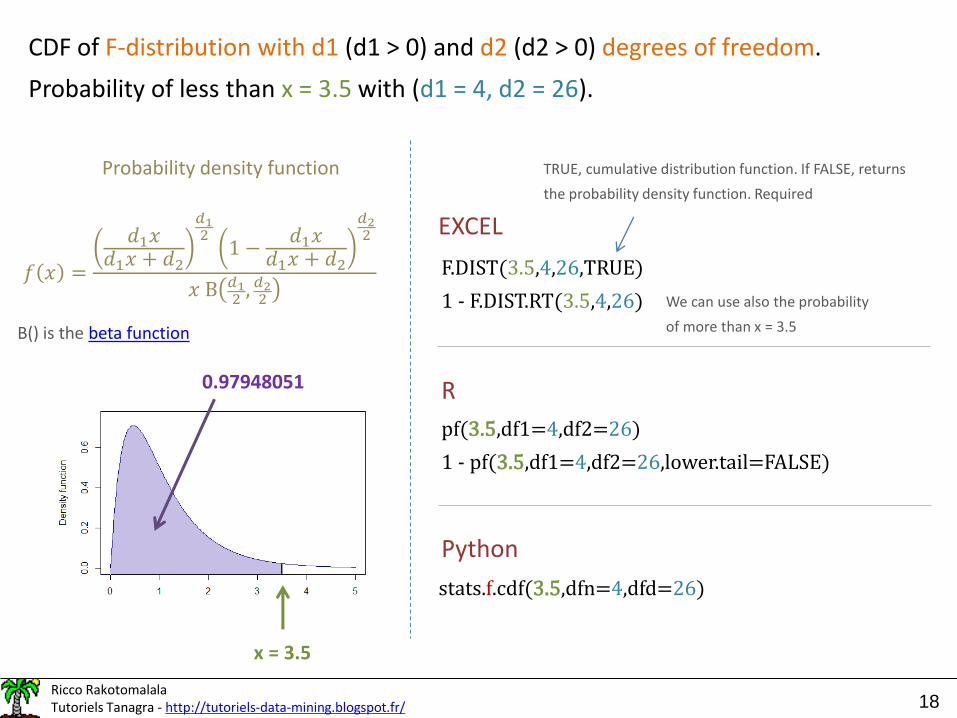
CDF of F-distribution with d1 (d1 > 0) and d2 (d2 > 0) degrees of freedom.
Probability of less than x = 3.5 with (d1 = 4, d2 = 26).
Probability density function
𝑓 𝑥 =
𝑑1𝑥𝑑1𝑥 + 𝑑2
𝑑12
1 −𝑑1𝑥
𝑑1𝑥 + 𝑑2
𝑑22
𝑥 B 𝑑12
, 𝑑22
B() is the beta function
x = 3.5
0.97948051
EXCEL
F.DIST(3.5,4,26,TRUE)
1 - F.DIST.RT(3.5,4,26)
R
pf(3.5,df1=4,df2=26)
1 - pf(3.5,df1=4,df2=26,lower.tail=FALSE)
Python
stats.f.cdf(3.5,dfn=4,dfd=26)
TRUE, cumulative distribution function. If FALSE, returns
the probability density function. Required
We can use also the probability
of more than x = 3.5

Ricco RakotomalalaTutoriels Tanagra - http://tutoriels-data-mining.blogspot.fr/ 19
PPF (q) of the F-Distribution with (d1 = 4, d2 = 26) degrees
of freedom for the probability (1 – α) = 0.95
1-α=0.95
q = 2.742594
EXCELF.INV(0.95,4,26)
F.INV.RT(0.05,4,26)
R
qf(0.95,df1=4,df2=26)
qf(0.05,df1=4,df2=26,lower.tail=FALSE)
Python
stats.f.ppf(0.95,dfn=4,dfd=26)

Ricco RakotomalalaTutoriels Tanagra - http://tutoriels-data-mining.blogspot.fr/ 20

Ricco RakotomalalaTutoriels Tanagra - http://tutoriels-data-mining.blogspot.fr/ 21
Scipy.org – Statistical functions (scipy.stats)
https://docs.scipy.org/doc/scipy/reference/stats.html
Microsoft – Excel Statistical Functions
https://support.office.com/en-us/article/Statistical-functions-reference-624DAC86-A375-4435-BC25-76D659719FFD
R Tutorial – Basic Probability Distributions
http://www.cyclismo.org/tutorial/R/probability.html
References