for ems rfid gateways and hubs using hf-0405 …usa.balluff.com/manuals/balluff_ems rfid(former...
TRANSCRIPT

Escort Memory Systems
RFID Dashboard For EMS RFID Gateways and Hubs using HF-0405 Controllers (Draft version 0.0A 10/4/05)
Brief Overview The EMS “Dashboard” utility is a tool that allows a user to make a TCP/IP connection to an EMS Gateway or Hub, to test, configure, diagnose, or download new software, to the Gateway or Hub, or any attached HF-0405 RFID controllers.
Supported devices: The Dashboard runs on Windows PC and can connect over TCP/IP with the following EMS Products: Gateways:
GWY-01-IND-01, GWY-01-TCP-02 Hubs:
HUB-04-IND-01, HUB-04-TCP-01 RFID Controllers:
HF-0405 Note: The Dashboard will not communicate with the original GWY-01-TCP-01 Gateway, as this uses an incompatible communication protocol.
Hardware Configuration/Physical Connections: There are two basic hardware configurations for the Hub/Gateway and the PC running the Dashboard tool: Direct Connection, or LAN. Direct Connection: In this configuration, the Gateway or Hub is connected directly to the PC running the Dashboard tool. In this configuration, an Ethernet “crossover” cable is required. In addition, the network settings of the PC must be set such that DHCP is turned OFF, and the PC is given a fixed IP address.
If the Gateway or Hub that is directly connected to the PC is at an IP address such as 192.168.253.110, then the PC’s network settings should be set to something similar to the following: DHCP: OFF: Turn DHCP OFF IP Address: 192.168.253.10 I.e. an IP address with the same first three
values, and something other than 1 for the last value
Subnet Mask: 255.255.255.0 Always this value Default Gateway: 192.168.253.1 I.e. an IP address with the same first three
values, and a 1 for the last value

LAN: In this configuration, the Gateway or Hub is connected to the same LAN as the PC running the Dashboard tool. In this case, the both the Gateway/Hub and the PC running the Dashboard tool must be connected to the LAN with regular ethernet “patch” cables. For the “Industrial” Gateway or Hub, the IP address must be “known” in advance. For the TCP/IP Gateway or Hub, the IP address may be discovered by running the “Finder” tool.
Connecting to the Hub or Gateway: The Connection Dialog Box: When the Dashboard is initially run, the first thing that appears is the Connection Dialog Box which looks like the following:
The user must select which of the supported Gateways or Hubs to connect to, and the correct IP address of the device. Industrial Gateway = GWY-01-IND-01 Industrial Hub = HUB-04-IND-01 TCP/IP Gateway = GWY-01-TCP-02 TCP/IP Hub = HUB-04-TCP-01 Note: The Dashboard will choose the appropriate “Port” for the connection; (50200 for the Industrial devices, and 2101 for the TCP/IP devices.)
Once the appropriate device is selected, and the correct IP address is entered, the user clicks “Connect” to make a connection to the specified Gateway or Hub.
The Dashboard GUI: The Dashboard GUI (Graphical User Interface) is divided into two main sections: The “Network Window”, and the “I/O Window.” The “Network Window” is further divided into two main sections: The “Status Window” and the “Device Tabs Window”

The Network Window: The “Network Window” is divided into two main sections. On the left, is a two-pane window called the “Status Window”
The upper pane of this window displays the attached Nodes, with their status, Node ID, and name. The lower pane of this window displays a log of the commands and responses sent and received from the Gateway, Hub or Nodes. Note: The splitter bar between the Status Window and the Device Tabs Window may be dragged, to change the size of the Status Window. When the Dashboard tool first connects to the Gateway or Hub, it queries the Gateway/Hub with a series of commands to collect information about all the attached Nodes. Those commands may be seen in the lower pane of the Status Window, during the initial
connection process. Information initially retrieved includes the name, software version,

dipswitch settings, notification settings, last error information, and subnet speed of the Gateway or Hub, as well as the current status, names, software versions, trigger information, and macro information of all attached Nodes. If the status of a Node changes, due to circumstances such as subnet noise corrupting a message or poll, or being physically removed from the subnet, and the Gateway/Hub receives notification of the status change, the colored icon next to that particular Node will change to reflect the change in status: Green indicates a healthy Node that is responding to polls
Yellow indicates a recent problem (recently stopped responding to polls)
Red indicates that the Node has stopped responding altogether.
After 20 seconds of not responding, the Node is “deactivated” and is removed from the Status Window. Note: The appropriate Gateway/Hub notifications must be enabled for the Status Window to accurate reflect the status of the attached Nodes. On the right of the Network Window is a single large pane that contains “tabs” or tabbed windows, each containing information or command options. This is called the “Device Tabs Window” To select a particular device, so that its device tabs are shown in the Device Tabs Window, the device must be selected/highlighted in the left “Status Window” pane. For example, if the user wanted the Gateway’s device tabs to be displayed, the user would select/highlight the Gateway line in the status window as shown below:
This would cause the Gateway’s tabs to be displayed, as shown below:
If the user wanted a particular Node’s tabs displayed, the user would select/highlight that particular Node’s line in the Status Window as shown below:
This would cause that particular Node’s tabs to be displayed, as shown below:

The I/O Window: The other main window of the Dashboard’s GUI is the I/O Window. This window records the last read or write preformed by any of the Nodes, as well as the cumulative number of reads and writes for each Node, and the time of the last read or write for each Node. When data is read or written to a Node, the I/O window is updated accordingly, and the updated data is highlighted in yellow.
Additionally, in the title-bar of the I/O window is a speed indicator, that displays the number of messages per second that the Gateway or Hub is receiving. This is useful for gauging throughput when Nodes are configured for ‘continuous read.’
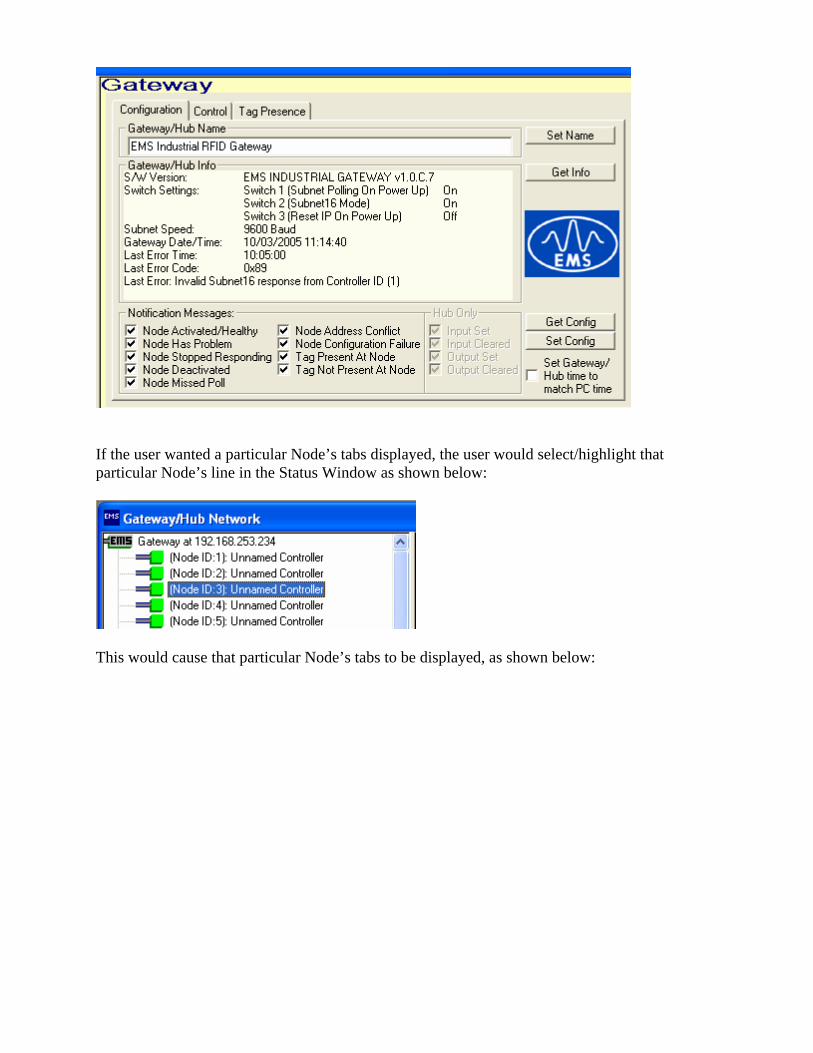
The Gateway/Hub Tabs: When the Gateway/Hub is selected in the Status Window, the tabs for the Gateway/Hub are displayed in the Device Tabs Window. The Gateway has three tabs: “Configuration”, “Control” and “Tag Presence” and the Hub also has three tabs: “Configuration”, “Control”, and “Input/Ouput” The Configuration Tab: The Gateway/Hub Configuration Ttab displays the collected information about the Gateway/Hub, including the Gateway/Hub’s Name, S/W Version, Dipswitch Settings, Subnet Speed, Date/Time of the Gateway/Hub’s internal clock, Last Error information, and Notification Message settings.
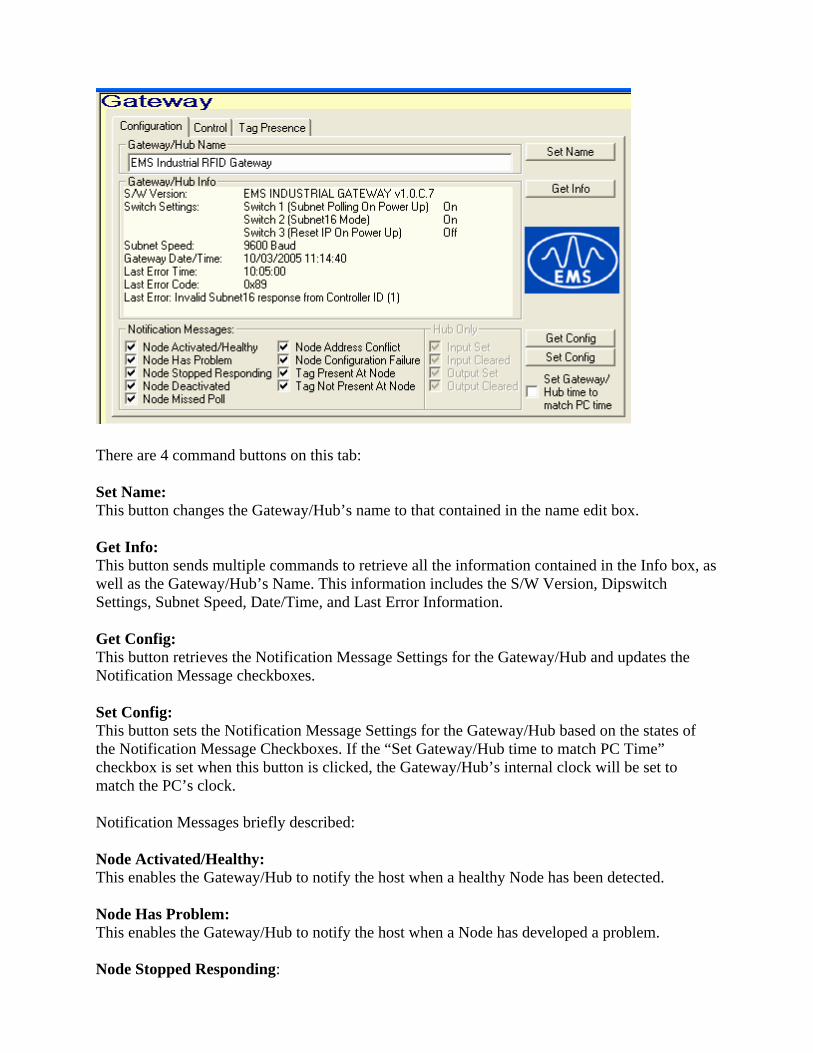
There are 4 command buttons on this tab: Set Name: This button changes the Gateway/Hub’s name to that contained in the name edit box. Get Info: This button sends multiple commands to retrieve all the information contained in the Info box, as well as the Gateway/Hub’s Name. This information includes the S/W Version, Dipswitch Settings, Subnet Speed, Date/Time, and Last Error Information. Get Config: This button retrieves the Notification Message Settings for the Gateway/Hub and updates the Notification Message checkboxes. Set Config: This button sets the Notification Message Settings for the Gateway/Hub based on the states of the Notification Message Checkboxes. If the “Set Gateway/Hub time to match PC Time” checkbox is set when this button is clicked, the Gateway/Hub’s internal clock will be set to match the PC’s clock. Notification Messages briefly described: Node Activated/Healthy: This enables the Gateway/Hub to notify the host when a healthy Node has been detected. Node Has Problem: This enables the Gateway/Hub to notify the host when a Node has developed a problem. Node Stopped Responding:

This enables the Gateway/Hub to notify the host when a Node has completely stopped responding. Node Deactivated: This enables the Gateway/Hub to notify the host when a Node has been deactivated due to not responding. Node Missed Poll: This enables the Gateway/Hub to notify the host when a Node has missed an individual poll. This is not a serious problem, and could be caused by transient noise. Node Address Conflict: This enables the Gateway/Hub to notify the host when multiple Nodes are responding at the same ID, and have been told to drop off the Subnet and flash their ID’s. This requires manual intervention by the user to correct the conflict. Node Configuration Failure: This enables the Gateway/Hub to notify the host when a Node did not accept its proper configuration, i.e. there was an error when the Gateway/Hub attempted to initially configure a Node. Tag Present at Node: This enables the Gateway/Hub to notify the host when a tag has entered the RF field of a Node. Note: the “Tag Presence” option must also be enabled in that particular Node’s configuration for this notification to be sent. Tag Not Present at Node: This enables the Gateway/Hub to notify the host when a tag has left the RF field of a Node. Note: the “Tag Presence” option must also be enabled in that particular Node’s configuration for this notification to be sent. Input Set: This enables the Hub to notify the host when an external Input has been set. Input Cleared: This enables the Hub to notify the host when an external Input has been cleared Output Set: This enables the Hub to notify the host when an Output has been set. Output Cleared: This enables the Hub to notify the host when an Output has been cleared.
The Control Tab: The Gateway/Hub Control tab contains buttons to issue commands to the Gateway/Hub to perform special functions.

Start Subnet Polling: This button tells the Gateway/Hub to start subnet polling. This is only necessary if dipswitch 1 is set to OFF. If dipswitch is set to ON, the Gateway/Hub begins subnet polling automatically when it starts up. No Nodes will be seen, and no commands can be sent to any Nodes if subnet polling is not started. Reinitialize Node Config: This button tells the Gateway/Hub to restore a default configuration for the specified Node. This will also erase any record the Gateway/Hub has of that particular Node. This is useful, for instance, if a Node has been removed, but the user does not want the Gateway to give that Node ID priority when dynamically assigning an ID to another Node. The default configuration for a Node is Name: “Unnamed Controller” Tag Type: “Philips SLI” Continuous Read On Boot: Start:0 Length:0 Delay:0 (i.e. disabled) Config Options Byte 1 0 (i.e. nothing selected) Config Options Byte 2 0 (i.e. nothing selected) Reinitialize: This button tells the Gateway/Hub to restore default configurations for all Node IDs, erase all record of seeing any Nodes, and restore a default configuration for the Gateway/Hub itself. The default configuration for a Gateway/Hub is Name: One of the following:
“EMS Industrial RFID Gateway” “EMS Industrial RFID Hub” “EMS TCP/IP RFID Gateway” “EMS TCP/IP RFID Hub”

Notification Messages: All Selected Subnet Baud 9600 Reset: This button resets the Gateway/Hub. Once the unit is reset, the TCP/IP connection is lost, and the Dashboard program should be exited, and re-run if needed. Update S/W: This button brings up the Gateway/Hub Software Update dialog, which allows the updating of the internal software for the Gateway/Hub:
To select the proper S/W Update file, the user clicks on “Browse” and locates the file on their local PC or LAN. Once the proper S/W Update file is selected, the user clicks on “Start Update.” This begins the software update process. As the software is downloaded to the Gateway/Hub, the progress bar will indicate the progress of the download, and the “Update Status” bar will describe the current stage of the process.
Once the upgrade process is complete, the Gateway/Hub should still be connected. The user can at this time click the “Get Info” button on the “Configuration” tab for the Gateway/Hub and see the new S/W version number. Advanced Options: Inactive ID Scanning: This button allows the user to enable or disable the periodic scanning of “inactive” Node IDs. Once all the attached Nodes are identified and reported as “healthy”, the user may disable “Inactive ID scanning” for a small performance boost.

Normally, the Gateway will try an “inactive” ID every 32 polls, to allow for the possibility that another device has appeared on the subnet (through hot-plugging, or through a problem device returning). Similarly, the Hub will, every 32 polls, try polling a different ID on any of its four ports that doesn’t currently have a device marked “healthy”, to search for a mis-configured device that has been connected with the wrong ID. Care should be taken with this ‘advanced’ feature. If “inactive ID” scanning is disabled, the Gateway/Hub will fail to see healthy Nodes that it doesn’t already “know about”, and if Nodes are deactivated due to a problem, they will never be “reactivated” Disabling “Inactive ID scanning” will however eliminate a small, 50ms delay/timeout every 32 polls that would normally occur when the Gateway/Hub polls an inactive ID. Subnet Baud Rate: This button allows the user to change the subnet baud rate of the Gateway/Hub. Care should be taken with this ‘advanced’ feature. When the Subnet Baud rate is changed, all attached Nodes are notified, with a message being sent out at every available baud rate. This allows the Gateway/Hub to synchronize several devices that for whatever reason have been added expecting different subnet baud rates. The new baud rate is stored in the Gateway/Hub’s internal configuration and will remain when the power is cycled. Some older HF-0405’s do not allow Subnet baud rates other than 9600, so this feature should only be used if it is known that all attached HF-0405’s support multiple baud rates.
The Tag Presence Tab: (Gateway Only) The Gateway Tag Presence tab contains an array of 16 virtual LEDs which indicate the “Tag Presence” state of the 16 possible Node IDs:

Note: The “Tag Present at Node” and “Tag Not Present at Node” Gateway/Hub notifications need to be enabled, and each Node needs to have the “Tag Presence” option enabled in its configuration, for these virtual LED’s to accurately reflect the “Tag Presence” state of each Node. If these conditions are met, the small virtual LED will “light up” to green, when a tag is in the field of a particular Node ID, and return to grey when the tag leaves the field.
The Input/Output Tab: (Hub Only) The Hub “Input/Output” tab contains 4 virtual LEDs which indicate the “Tag Presence” state of the 4 possible Node IDs, 4 virtual LEDs which indicate the state of the 4 Hub Inputs, and 4 virtual LEDs which indicate the state of the 4 Hub Outputs. In addition, this tab provides buttons that allow the user to explicitly retrieve the states of the Hub inputs or outputs, as well as buttons to set or clear the Hub outputs.

Note: The “Tag Present at Node” and “Tag Not Present at Node” Gateway/Hub notifications need to be enabled, and each Node needs to have the “Tag Presence” option enabled in its configuration, for these virtual LED’s to accurately reflect the “Tag Presence” state of each Node. If these conditions are met, the small virtual LED will “light up” to green, when a tag is in the field of a particular Node ID, and return to grey when the tag leaves the field. Likewise, the Hub Input and Hub Output notifications need to be enabled for those virtual LEDs to accurately reflect the status of the Hubs Inputs and Outputs.
The HF-0405 Tabs
When a Node is selected/highlighted in the Status Window, the tabs for that particular Node are displayed in the Device Tabs window. A Node has four tabs: “Configuration”, “Read/Write”, “Macros” and “Triggers”
The Configuration Tab: The Node “Configuration” tab displays the collected information about the selected Node, including the Nodes’s Name, S/W Versions, Firmware CRC, Current Status, Serial Number, and currently selected configuration options.
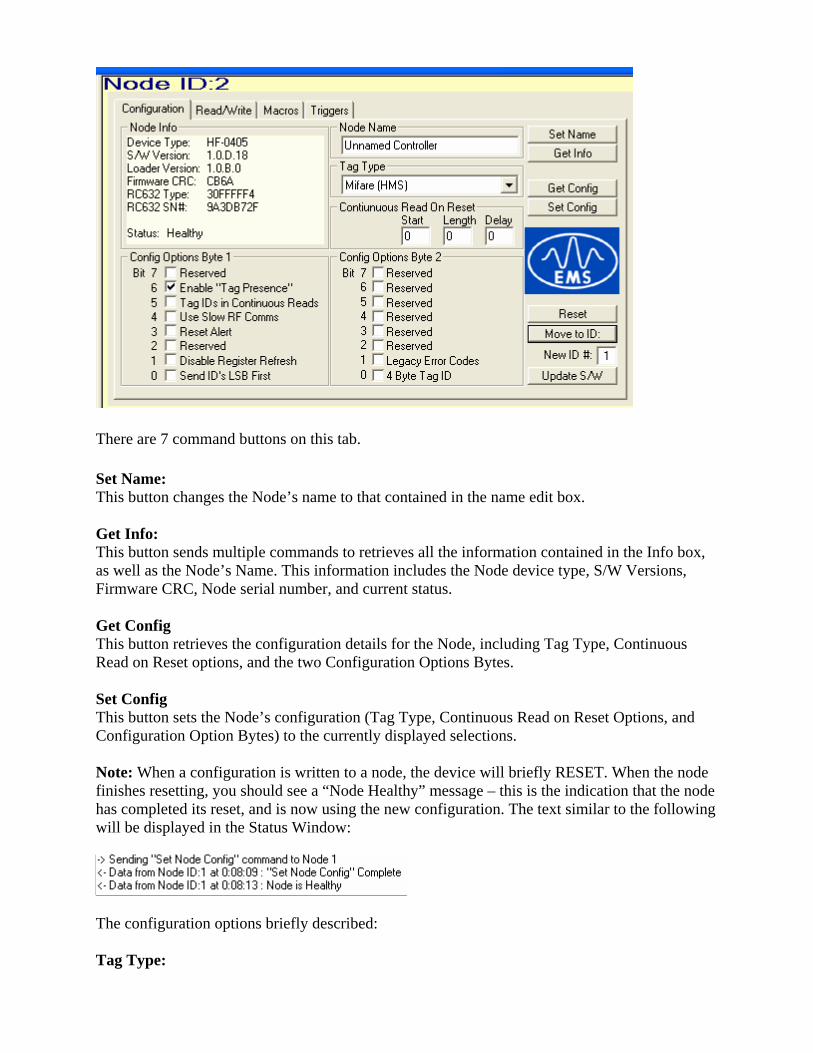
There are 7 command buttons on this tab. Set Name: This button changes the Node’s name to that contained in the name edit box. Get Info: This button sends multiple commands to retrieves all the information contained in the Info box, as well as the Node’s Name. This information includes the Node device type, S/W Versions, Firmware CRC, Node serial number, and current status. Get Config This button retrieves the configuration details for the Node, including Tag Type, Continuous Read on Reset options, and the two Configuration Options Bytes. Set Config This button sets the Node’s configuration (Tag Type, Continuous Read on Reset Options, and Configuration Option Bytes) to the currently displayed selections. Note: When a configuration is written to a node, the device will briefly RESET. When the node finishes resetting, you should see a “Node Healthy” message – this is the indication that the node has completed its reset, and is now using the new configuration. The text similar to the following will be displayed in the Status Window:
The configuration options briefly described: Tag Type:

This selects which of the several RFID Tag Types that the HF-0405 can currently detect, read from and write to. Currently the HF-0405 supports: Philips SLI, TI SLI, Infineon SLI, Philips I-Code 1 and Mifare Continuous Read on Reset: This specifies the “Continuous Read” mode that the HF-0405 will begin, when it resets or powers up. If the “Length” is anything other than zero, the HF-0405 will continuously attempt to read the number of bytes specified by “Length” from a tag, starting at the tag address specified by “Start” The “Delay” option indicates, in seconds, how long a tag that has been read must be out of the field before it is ‘re-read.’ If this is set to “0”, then a tag in the field will be read continuously, up to around 10 reads per second, depending on the specified length of the read. Config Options Bytes: These are individual bits that indicate special modes. “Enable Tag Presence” This option, when selected, turns the HF-0405’s RF field on permanently, and enables the HF-0405 to notify the Hub or Gateway when a tag enters or leaves the field. If the Hub or Gateway also has the “Tag Present at Node” and “Tag Not Present at Node” Notification messages enabled, then the host will receive a notification whenever a tag enters or leaves the RF field of the HF-0405. “Tag ID In Continuous Reads” This option, when selected, causes the HF-0405 to include the serial ID of any tag that is read, in front of any actual read data. This serial ID can be either 4 or 8 bytes long, depending on the “4 byte tag ID” option’s state. “Use Slow RF Comms” An R&D testing option. “Disable Register Refresh” An R&D testing option. “Legacy Error Codes” An R&D testing option. Basically, it changes the “Tag Not Found” error from an 0x08 to a 0x07, so the error code can be displayed on the HF-0405’s LEDs “4 Byte Tag ID” This option, when selected, causes the HF-0405 to send Tag ID’s as 4 bytes, instead of the default 8. Some Tag Types only have 4 Byte ID’s and are padded with 4 zeros, to fill up 8 bytes. This option causes the HF-0405 to not pad the ID this way.

Reset: This button causes the Node to reset. This may cause the Node to temporarily disappear from the status window. Move to ID: (For Gateway Only) This button causes two things to happen. First, the stored configuration for the selected Node ID, including triggers and macros, are copied to the internal memory slot for the new ID, in the Gateway’s memory. Then, the Node’s ID is changed to the new ID. The Node at its new ID will retain all of its configuration, macros, and triggers that it had at its old ID. The Node will briefly reset when its ID is changed. Update S/W: This button brings up the HF-0405 Software Update dialog, which allows the updating of the internal software for the selected HF-0405
: To select the proper S/W Update file, the user clicks on “Browse” and locates the file on their local PC or LAN. Once the proper S/W Update file is selected, the user clicks on “Start Update.” This begins the software update process. As the software is downloaded to the HF_0405, the progress bar will indicate the progress of the download, and the “Update Status” bar will describe the current stage of the process.
Once the upgrade process is complete, the HF-0405 will reset, and should reappear in the Status Window. The user can at this time click the “Get Info” button on the “Configuration” tab for the Node and see the new S/W version number.

Note: If early Alpha-release HF-0405’s containing firmware earlier than version 0.0.T.19, the user must select the checkbox appropriately labeled at the bottom of the dialog window, as these older units have a different download procedure. Note: If a S/W Upgrade to an HF-0405 connected to a Gateway fails after starting, it may reappear in the Status window as “Node 31” – this is a special circumstance that only occurs during such download failures. If this happens, simply select this Node 31, and try the upgrade procedure again. If a S/W Upgrade to an HF-0405 connected to a HUB fails after starting, it will not appear as Node 31, but will still appear in the status window as its regular ID 1 through 4. All of the HF-0405’s Address LED’s will be on however, signifying Node 31. In this case, as above, the user should simple select the Node and try the upgrade procedure again.
The Read/Write Tab: The Node “Read/Write” tab provides 6 command buttons to perform various Tag Read/Write commands.
There are 7 command buttons on this tab. Tag Search: This button sends a “Tag Search” command to the selected HF-0405. The HF-0405 will search for a tag (of the configured tag type) for the period of time specified by the “Timeout” field. If a tag is found a “Tag Found” message will be returned. The text similar to the following will be displayed in the Status Window:

If a tag is not found during that time, a “Tag Not Found” error will be returned. Text similar to the following will be displayed in the Status Window:
Tag Read ID This button sends a “Tag Read ID” command to the selected HF-0405. The HF-0405 will attempt to read a Tag ID (of the configured type) for the period of time specified by the “Timeout” field. If a tag is found and the Tag ID is successfully read, the Tag ID will be returned to the host, and the I/O window will be updated. Text similar to the following will be displayed in the Status Window:
The I/O window will be updated similarly:
If the tag is not found during that time, a “Tag Not Found” error will be returned. Text similar to the following will be displayed in the status window:
If another sort of error occurs, such as a partial read failure, the appropriate error will be returned. Tag Read Data This button sends a “Tag Read Data” command to the selected HF-0405. The HF-0405 will attempt to read from a tag the number of bytes specified by “Length”, starting at the tag address specified by “Start Address” for the period of time specified by the “Timeout” field. If a tag is found and the tag data is successfully read, the tag data will be returned to the host, and the I/O window will be updated. Text similar to the following will be displayed in the Status Window:
The I/O window will be updated similarly:
If the tag is not found during that time, a “Tag Not Found” error will be returned. Text similar to the following will be displayed in the status window:
If another sort of error occurs, such as a partial read failure, the appropriate error will be returned, such as the following:
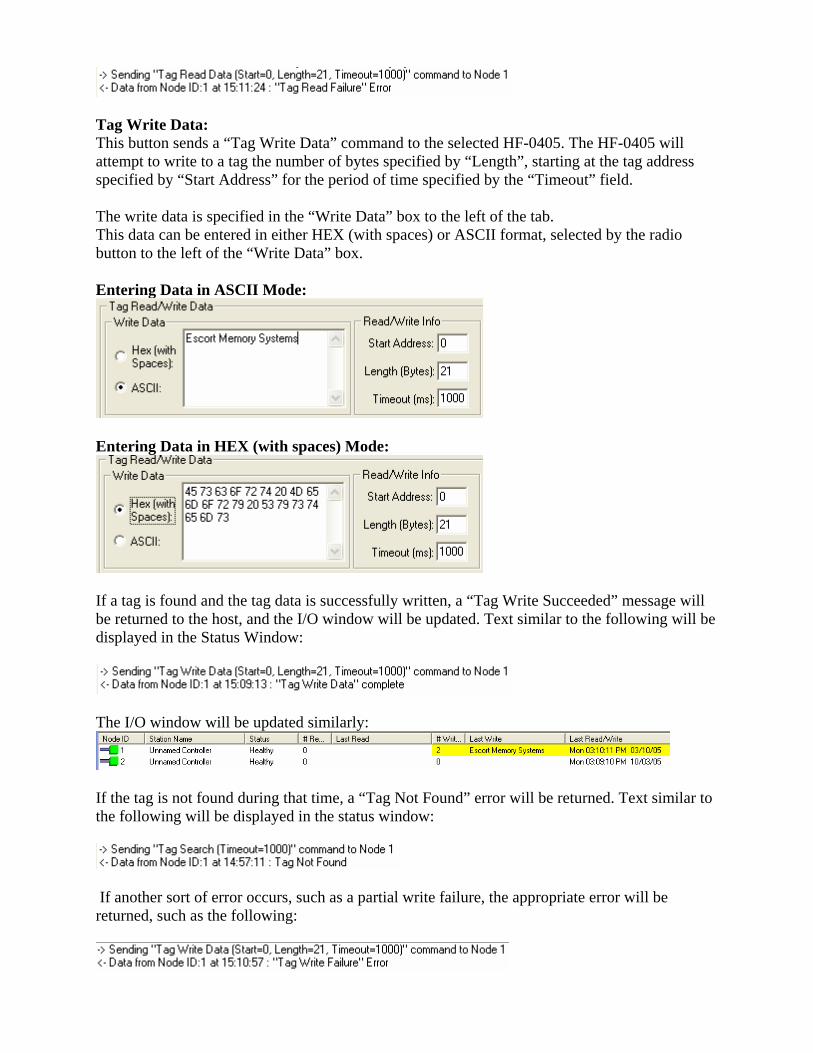
Tag Write Data: This button sends a “Tag Write Data” command to the selected HF-0405. The HF-0405 will attempt to write to a tag the number of bytes specified by “Length”, starting at the tag address specified by “Start Address” for the period of time specified by the “Timeout” field. The write data is specified in the “Write Data” box to the left of the tab. This data can be entered in either HEX (with spaces) or ASCII format, selected by the radio button to the left of the “Write Data” box. Entering Data in ASCII Mode:
Entering Data in HEX (with spaces) Mode:
If a tag is found and the tag data is successfully written, a “Tag Write Succeeded” message will be returned to the host, and the I/O window will be updated. Text similar to the following will be displayed in the Status Window:
The I/O window will be updated similarly:
If the tag is not found during that time, a “Tag Not Found” error will be returned. Text similar to the following will be displayed in the status window:
If another sort of error occurs, such as a partial write failure, the appropriate error will be returned, such as the following:

Start Continuous Read: This button sends a “Start Continuous Read” command to the selected HF-0405. The HF-0405 will begin a “Continuous Read” mode, attempting to read from a tag the number of bytes specified by “Length”, starting at the tag address specified by “Start Address”. The “Delay” option indicates, in seconds, how long a tag that has been read must be out of the field before it is ‘re-read.’ If this is set to “0”, then a tag in the field will be read continuously, up to around 10 reads per second, depending on the specified length of the read. From that point on, each time a tag appears in the RF field of that HF-0405 and the specified data is read, the data will be returned to the host. Text similar to the following will be displayed in the status window, when a tag is read:
Stop Continuous Read: This button sends a “Stop Continuous Read” (actually, “Start Continuous Read” with Length of 0) command to the selected HF-0405. The HF-0405 will stop its “Continuous Read” mode (even if it was started using the “Continuous Read on Reset” options, and not an explicit command).
If the HF-0405 has “Continuous Read on Reset” options set to start up in “continuous Read” mode, the HF-0405 will still power up in this “Continuous Read” mode, regardless of what “Start” and “Stop Continuous Read” commands are explicitly set. These commands do not affect the “Start Up Mode”, just the currently operating mode. Broadcast To All Nodes (Gateway Only):
If this checkbox is selected, any of the 6 command buttons will send a command that is “broadcast” to all Nodes connected to a Gateway, instead of just the selected Node. For example, if a “Tag Read ID” command is broadcast to a Gateway that has 16 attached HF-0405’s, 16 individual response messages will be returned from that one command. Another example would be telling all 16 Nodes to start or stop operating in contunious read mode, simultaneously. Another example would be writing the same data to 16 tags at the same time (provided all HF-0405’s had a tag in their field at the moment the command was issued)
The Macros Tab:

Macros are small programs that are created by the “Macro Builder” too. Each HF-0405 has slots for 8 macros, numbered 1 through 8. The Node “Macros” tab contains information about these eight macro slots for the selected Node, including a macro “length”, and macro “description” for each. In addition, this tab provides buttons that allow the user to explicitly load macros created by the “Macro Builder” tool into any of these eight macro slots; to specify a descriptive string for each loaded macro; to execute a loaded macro; to delete a loaded macro; or to retrieve or delete these macros.
There are 7 types of command buttons on this tab. Load: Each of the 8 “Load” buttons corresponds to one of the macro slots numbered 1 through 8. Clicking “Load” will pop up a file dialog window that allows the user to browse for a compiled Macro, that was created by the Macro Builder tool. When the desired macro file is found, and the user clicks “OK” from the File Dialog, the selected macro is loaded into the HF-0405’s Macro slot. As a default, the filename of the Macro is then stored as the “Description” of that macro slot. Text similar to the following will be displayed in the status window, when a macro is loaded:
Set: Each of the 8 “Set” buttons corresponds to one of the macro slots numbered 1 through 8.

Clicking “Set” changes the macro “description” for that macro slot. Macro Descriptions can be up to 32 bytes long. Text similar to the following will be displayed in the status window, when a macro is loaded:
Run: Each of the 8 “Run” buttons corresponds to one of the macro slots numbered 1 through 8. Clicking “Run” executes that particular macro. Depending on what that macro is supposed to do, any number of things can happen. What the macro is programmed to do will determine what events take place. An example macro SetAllOutputs.MACRO is loaded into Macro slot 6 in the above screen capture. If Macro 6 is then executed by clicking Run, text similar to the following might be displayed in the status window:
Delete: Each of the 8 “Delete” buttons corresponds to one of the macro slots numbered 1 through 8. Clicking “Delete” deletes that particular macro. Its “description” is also deleted, and its length becomes 0, or “empty” Text similar to the following will be displayed in the status window, when a macro is deleted:
Get All Macros: This button sends multiple commands to retrieve all the macro length and description information for a Node manually. Text similar to the following may be displayed in the status window, when this information is retrieved:

If the Node has no macros, then text similar to the following may be seen in the status window:
Delete All Macros: This button deletes all the macros and macro descriptions for the selected Node. Text similar to the following may be displayed in the status window, when all the macros are deleted:
Launch Macro Builder: This button launches the Macro Builder tool, that is used to create macros. If the Macro Builder tool has not been previously launched, and the Dashboard does not know where to find MacroBuilder.EXE, a file dialog window will appear prompting the user to manually locate the MacroBuilder.EXE file. Once located, the Dashboard will remember the location, and the user will nto need to repeat this process.
Note: When the Macro Builder tool is launched, the Dashboard is still operating, and can still be used for all regular functions. The user does not need to close the Macro Builder to continue using the Dashboard.
The Triggers Tab: Triggers are configured conditions that when met, cause the HF-0405 to do something, such as execute a macro, or modify the states of the Hub Outputs. Each HF-0405 has 8 configurable triggers, numbered 1 through 8. Each trigger has a “Type” with some related “Type

Parameters”, which define what sort of event causes the trigger to “trigger”; a “Mode” which indicates how often the trigger is to “trigger”; and a “Action” with related “Action Parameters” that define what is to happen when the trigger is triggered. The Node “Triggers” tab contains descriptions for each of these eight configurable triggers for the selected Node. In addition, this tab provides buttons that allow the user to explicitly retrieve, edit, or disable any of these eight triggers.
There are 7 types of command buttons on this tab. Edit: Each of the 8 “Edit” buttons corresponds to one of the trigger slots numbered 1 through 8. Clicking “Edit” will pop up a “Edit Trigger” dialog window that allows the user to edit a trigger’s conditions and actions. See the “Edit Trigger Dialog” below for detailed descriptions of editing triggers. Once a trigger is edited, text similar to the following will be seen in the status window:
A text description of the trigger will also appear in the “Trigger Description” box for that trigger:
Disable: Each of the 8 “Disable” buttons corresponds to one of the triggers numbered 1 through 8. Clicking “Disable” will cause that trigger to be disabled, and ignored.

Once a trigger is disabled, text similar to the following will be seen in the status window:
The corresponding “Trigger Description” will also change back to “Disabled.”
Get All Triggers: This button retrieves all the trigger information for the selected Node manually. When this information is retrieved, text similar to the following will be seen in the status window:
Disable All Triggers: This button disables all triggers for the selected Node. When this information is retrieved, text similar to the following will be seen in the status window:
The Edit Trigger Dialog:
Trigger Types: There are 5 valid Trigger Types: Disabled:
This trigger type is the default – it means that the trigger is disabled and does nothing.
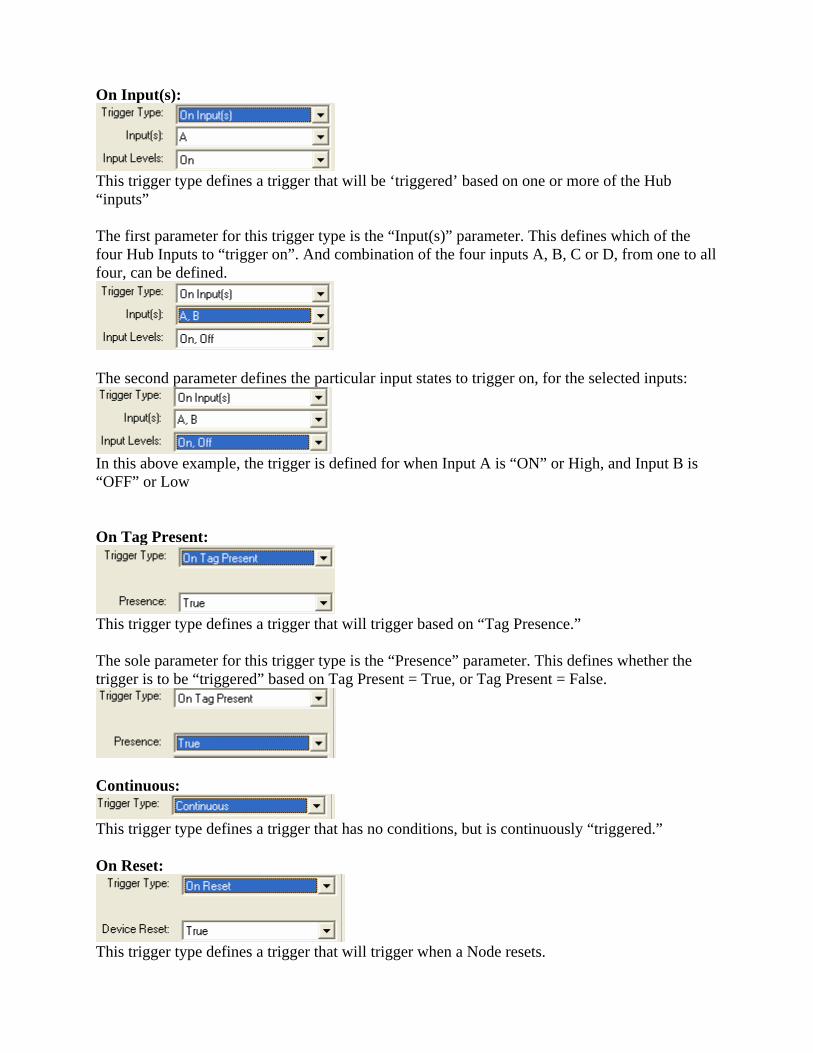
On Input(s):
This trigger type defines a trigger that will be ‘triggered’ based on one or more of the Hub “inputs” The first parameter for this trigger type is the “Input(s)” parameter. This defines which of the four Hub Inputs to “trigger on”. And combination of the four inputs A, B, C or D, from one to all four, can be defined.
The second parameter defines the particular input states to trigger on, for the selected inputs:
In this above example, the trigger is defined for when Input A is “ON” or High, and Input B is “OFF” or Low On Tag Present:
This trigger type defines a trigger that will trigger based on “Tag Presence.” The sole parameter for this trigger type is the “Presence” parameter. This defines whether the trigger is to be “triggered” based on Tag Present = True, or Tag Present = False.
Continuous:
This trigger type defines a trigger that has no conditions, but is continuously “triggered.” On Reset:
This trigger type defines a trigger that will trigger when a Node resets.

The sole parameter for this trigger type is the “Device Reset” parameter. This defines whether the trigger is to trigger based on Reset = True (If the device resets), or Reset = False (If the device has NOT reset) Trigger Modes: There are 3 valid Trigger Modes: Level:
In this mode, the associated action will be executed every time the trigger is evaluated as true. If, for example, the trigger is specified as being true when Input 1 is high, the action will be taken every time the trigger specifications are evaluated and Input 1 is high.
One Shot:
In this mode, the associated action will be executed once when the trigger is evaluated as True, but does not “re-arm” until the trigger changes state and evaluates to False at least once. Once re-armed, the transition of the trigger state to False again will cause the action to be executed. All triggers of this type are initialized to “armed” at startup.
Edge:
In this mode, the trigger requires a change of state from False to True before the associated action will be executed. All triggers of this type are initialized to “unarmed” at startup and only move to the “armed” state after evaluating as False. Once armed, the transition of the trigger state from False to True will cause the action to be executed.
Trigger Actions: Triggers can have one of two actions associated with them, although other actions will be available in the future. When the trigger Type evaluates as True, and the condition specified in the Mode field is met, the Action will be executed. Execute Macro:
This Trigger Action causes one of the Nodes macros to be executed. The sole parameter for this action is the “Macro #:” parameter, which specifies the macro #, from 1 to 8. Set Output(s):

This Trigger Action causes any or all of the outputs to change state: The first parameter for this trigger type is the “Output(s)” parameter. This defines which of the four Hub Outputs to modify. And combination of the four outputs A, B, C or D, from one to all four, can be defined.
The second parameter defines the selected outputs’ states to set:
In the above example, all four outputs would be set to “On” or high, if this trigger was triggered. Example Triggers: Once, when Input A = On (High), Set Output A
Once, when Input A = On, Input B = Off, and Input C = On, Execute Macro 1
When Tag Present = True, Set Output A (once)

Continuously While Tag Presence = False, Clear Outputs A and B
On Node Reset, Clear all Outputs
Misc Menu Options: Sound: Various events are accompanied by sound. Sound can be disabled or re-enabled from this toggle-able menu option. Get Node Status List: This menu command issues a several Gateway/Hub commands that will again retrieve all the Node status, info, macro, and trigger information of all the attached Nodes. Get Power-up Info: This menu command issues a Gateway/Hub command that returns the number of normal power-ups (and time of the last normal power-up) and the number of power-ups caused by “watchdog” resets (and time of the last “watchdog” power-up)

This is a special diagnostics function that can be used to help diagnose a problem Gateway/Hub. Update Gateway/Hub Software This menu command is identical to clicking on the “Update S/W” button from the Gateway/Hub “Control” tab Show Network Window: Show IO Window: These menu commands allow the “Network Window” or the “I/O” window to reappear if they have been closed. Troubleshooting: Troubleshooting info will go here