for hydrogen fuel cells
TRANSCRIPT
EnergyTechnologyAnalysis
PROSPECTSFOR
HYDROGENAND
FUEL CELLS
INTERNATIONAL ENERGY AGENCY
This pdf-fi le is for the personal use of the purchaser only. The information contained in it is subject to
copyright by the OECD/IEA. This material is for sale; therefore, the User may not copy, republish, lend,
post on any server (unless a multi-user licenceis purchased for use on the intranet, in which case
the multi-user license terms apply), use on Web sites, transmit or redistribute to any mailing lists any
part of the material for commercial purposes, for compensation of any kind or simple dissemination.
INTERNATIONAL ENERGY AGENCY
The International Energy Agency (IEA) is an autonomous body which was established inNovember 1974 within the framework of the Organisation for Economic Co-operation andDevelopment (OECD) to implement an international energy programme.
It carries out a comprehensive programme of energy co-operation among twenty-six of theOECD’s thirty member countries. The basic aims of the IEA are:
• to maintain and improve systems for coping with oil supply disruptions;• to promote rational energy policies in a global context through co-operative relations with
non-member countries, industry and international organisations;• to operate a permanent information system on the international oil market;• to improve the world’s energy supply and demand structure by developing alternative
energy sources and increasing the efficiency of energy use;• to assist in the integration of environmental and energy policies.
The IEA member countries are: Australia, Austria, Belgium, Canada, the Czech Republic,Denmark, Finland, France, Germany, Greece, Hungary, Ireland, Italy, Japan, the Republic ofKorea, Luxembourg, the Netherlands, New Zealand, Norway, Portugal, Spain, Sweden,Switzerland, Turkey, the United Kingdom, the United States. The European Commission takespart in the work of the IEA.
ORGANISATION FOR ECONOMIC CO-OPERATION AND DEVELOPMENT
The OECD is a unique forum where the governments of thirty democracies work together toaddress the economic, social and environmental challenges of globalisation. The OECD is alsoat the forefront of efforts to understand and to help governments respond to new developmentsand concerns, such as corporate governance, the information economy and the challenges ofan ageing population. The Organisation provides a setting where governments can comparepolicy experiences, seek answers to common problems, identify good practice and work to co-ordinate domestic and international policies.
The OECD member countries are: Australia, Austria, Belgium, Canada, the Czech Republic,Denmark, Finland, France, Germany, Greece, Hungary, Iceland, Ireland, Italy, Japan, Korea,Luxembourg, Mexico, the Netherlands, New Zealand, Norway, Poland, Portugal, the SlovakRepublic, Spain, Sweden, Switzerland, Turkey, the United Kingdom and the United States.The European Commission takes part in the work of the OECD.
© OECD/IEA, 2005
No reproduction, copy, transmission or translation of this publication may be madewithout written permission. Applications should be sent to:
International Energy Agency (IEA), Head of Publications Service,9 rue de la Fédération, 75739 Paris Cedex 15, France.
FOREWORD
Oil and gas supply security and climate change continue to represent prominent challenges for allcountries. They are particularly pressing in the transportation sector, which still relies almost exclusivelyon oil. Reducing the dependence on hydrocarbons and the emissions of carbon dioxide (CO2) isbecoming increasingly urgent. This will require significant changes in the global energy systemand the introduction of new technologies which are able to produce and use energy more efficientlyand cleanly than in the past.
Recently, IEA countries have invested considerable efforts in making commercially availabletechnologies to separate and store carbon dioxide from fossil fuels, produce hydrogen from fossil,nuclear and renewable energy sources, and develop fuel cells for clean and efficient use of hydrogenand other fuels. In addition to reducing emissions in power generation, CO2 capture and storagewould enable hydrogen to be produced from natural gas and from the world’s abundant coal reserveswithout incurring significant emissions to the atmosphere. Clean, CO2-free hydrogen producedfrom fossil fuels and – in the longer term – from nuclear and renewable sources could potentiallyreplace oil and reduce emissions in transport. In turn, fuel cells hold the promise to significantlyincrease the efficiency of the energy system in both stationary and transport applications withreduced or nearly zero emissions.
Hydrogen and fuel cells comprise a complex array of technologies and processes for hydrogenproduction, storage, transportation, distribution, fuel cell concepts and other end-use technologies.Some of these technologies are still under development and surrounded by considerable uncertainty.Realistic assessments and policy strategies for hydrogen and fuel cells must consider the complexityof the overall system, the uncertainties, the peculiarities of each single technology, the role of thecompeting options, and not least the impact that energy policies may have on new technologiesto gain market share.
Using hydrogen as an energy carrier requires key technology breakthroughs and decisive costreduction in all domains of the energy chain (production, distribution, storage, fuel cells). Concertedgovernment policies, international co-operation and public R&D investment are also indispensablefor catalysing larger private investment, achieving commercial maturity, building infrastructureand public awareness, and fostering the penetration of hydrogen and fuel cells in a competitivemarketplace.
“Prospects for Hydrogen and Fuel Cells” offers an authoritative and objective analysis of the hydrogenand fuel cell potential to meet the global challenges in the energy sector. Information regardinglatest RD&D achievements, policies and business opportunities are assessed from the perspective ofa rapidly changing global energy system in the next half century. The analysis provides a realisticassessment of technology prospects, an incisive evaluation of barriers to and scenarios for a transitionto hydrogen, and guidance for far-reaching decision making under uncertainty.
Claude MandilExecutive Director
FOREWORD 3


ACKNOWLEDGEMENTS
The main authors of this book are Dolf Gielen and Giorgio Simbolotti.
The work was carried out by the IEA Secretariat in the context of the activities of the IEA HydrogenCoordination Group (HCG) and was supported by several IEA Member countries, namely, Australia,Austria, Canada, France, Germany, Japan, the Netherlands, Spain, the United Kingdom and theUnited States.
Neil Hirst, Director of the IEA Energy Technology and R&D Office, supervised the work. MarianneHaug, former Director of the Office, provided leadership in conceiving the project. The study is theresult of a close cooperation between the IEA Energy Technology Collaboration Division, headedby Antonio Pflüger, and the IEA Energy Technology Policy Division, headed by Robert Dixon fromSeptember 2005, by Fridtjof Unander (acting head from October 2004 to August 2005) and byCarmen Difiglio until September 2004.
Special thanks go to Henk Barten (the Netherlands), Robert Dixon (United States) and Koji Nakui(Japan), who provided leadership and support as the Co-Chairs of the IEA Hydrogen Co-ordinationGroup, and to Graham Campbell (Canada), who provided guidance to the HCG in his capacity ofChairman of the IEA Committee on Energy Research and Technology.
The study benefited from input, contributions and comments provided by members and experts ofthe IEA Hydrogen Coordination Group, experts from the IEA Implementing Agreements, externalexperts (from industry and academia, other international projects and organizations) who attendedthe IEA Technical Workshop on 28-29 June 2005: François Moisan (France) Chairman of theWorkshop, Bob Pegler (Australia), Grietus Mulder (Belgium), Peter Reilly-Roe and Maja Veljkovic(Canada), William Borthwick (European Commission), Arnaud Mercier (France), George Menzen andHanns J. Neef (Germany), Nikos Lymberopoulos (Greece), Haruhiko Ando, Makoto Akai, Kenzo Fukudaand Yoshitaka Tamou, (Japan), Sang Jin Choi and Sung-Chul Shin (Korea), Walter Cariani,Paolo Garibaldi, Agostino Iacobazzi and Valentino Romeri (Italy), Harm Jeeninga (the Netherlands,EC-HyWays Project), Ibrahim Gulyurtlu (Portugal), Antonio Garcia Conde and Rafael Ben (Spain),Fehmi Akgun (Turkey), Ray Eaton and David Hart (United Kingdom), Fred Joseck andRobert Wright (United States), Emmanuelle Patay (AirLiquide), Jean F. Larive (CONCAWE),Manfred Schuckert (DaimlerChrysler, EC-CUTE Project), GianCarlo Tosato (IEA ETSAP), CatherineGregoire Padro, Paul Lucchese and Andreas Luzi (IEA HIA), Timur Guel (PSI, Switzerland),Markus Blesl and Uwe Remme (University of Stuttgart), George Eads (WBCSD). Valuable commentswere also provided by Leonardo Barreto (PSI, Switzerland), Carmen Difiglio (US-DOE), Lew Fulton (UNEP),Justin Adams and Nick Wilkinson and Steve Koonin (BP), Inigo Sabater, Angel Perez-Sainz (EC)and Gabriel Michaux (Belgium). Gary Goldstein (International Resources Group, US) and Ken Noble(Noble –Soft, Australia) provided modelling support.
All errors and omissions in this publication are solely the responsibility of the authors.
Assistance with preparation of the manuscript was provided by Muriel Custodio, Corinne Hayworth(graphic design) and Loretta Ravera (IEA Public Information Office), and by Michael Taylor.
ACKNOWLEDGEMENTS 5

TABLE OF CONTENTS
Foreword 3
Acknowledgements 5
Executive summary 15
Overview 19
1. Introduction 33
The role of hydrogen and fuel cells 33
Investment and targets in RD&D 35
The importance of technology learning 38
Background and scope of this study 39
2. Hydrogen technologies 41
Hydrogen production 43Hydrogen from electrolysis 44Hydrogen from fossil fuels 49Hydrogen from high-temperature water splitting by nuclear and solar heat 55Hydrogen from biomass 57Other hydrogen supply options 58Summary of hydrogen production cost 60
Hydrogen transportation and distribution 61Transportation of gaseous hydrogen by pipeline 61Transportation of liquid hydrogen by truck or ship 63
Hydrogen refuelling stations 64
Large scale hydrogen storage 70
On-board hydrogen storage 71Gaseous storage 72Liquid storage 74Solid storage 74Summary of the options for on-board storage 77
3. Fuel cells and other hydrogen end-use technologies 79
Overview of fuel cell types 81
The cost and performance of PEM fuel cells for vehicles 87PEM fuel cell cost 87PEM fuel cell performance 92
TABLE OF CONTENTS 7
8 PROSPECTS FOR HYDROGEN AND FUEL CELLS
PEM fuel cell applications: light duty vehicles 95The efficiency of the fuel cell vehicles 96Impact of FCVs on local air pollution 99Cost of FCVs 100
Niche markets for PEM fuel cells in the transport sector 104Buses 104Delivery vans 106Wheelchairs and carts 107Forklifts 107
Hydrogen-fuelled airplanes 108
Prospects and applications for stationary fuel cellsand other hydrogen uses 110
Molten carbonate fuel cells 111Solid oxide fuel cells 112Modelling stationary fuel cells 116Other stationary applications for hydrogen 117
4. Competing technology options 119
Competing options in the transportation sector 120Biofuels 120Plug-in hybrids and other electric vehicles 120Lessons from hybrid and electric vehicles 122Synfuels from gas and coal 122Non-conventional oil 124Compressed natural gas (CNG) 126Alternative fuels and energy policy targets 126The impact of taxes 127
Competing options for stationary applications 128Residential uses 128Power generation 129
5. Defining the energy context 131
The Energy Technology Perspectives (ETP) Model 132
Overview of the analysis 133
The ETP BASE scenario 134
The MAP scenario 136Results for the transport sector 139Results for stationary applications 141
6. Key drivers for hydrogen and fuel cells: sensitivity analysis 143
Governmental policies and socio-economic parameters 144CO2 incentives 144CO2 policy scope and timing 147
Energy-security policies 148Market structure 149Fuel tax regime 149Fuel prices 149Planning time horizon 150
Competing technologies and fuels 151
Renewables 151Nuclear power 152
Hydrogen and fuel cell technologies 153
Technology availability 153Technology performance 154Transition issues 155
Overview of the sensitivity analysis results 158
7. Scenario analysis and regional activities 161
Global scenario analysis 163
Results of the scenario analysis 167
Global hydrogen demand 167Hydrogen use in transport 171Hydrogen and fuel cell use in stationary applications 173Hydrogen production by technology 176Hydrogen impact on CO2 emissions 178The impact of hydrogen on energy-security 180
Regional differences 182
8. Conclusions and challenges ahead 189
Market prospects for hydrogen and fuel cells 190
Technology prospects 192
Hydrogen technologies 192Fuel cell technologies 194Competing options 196
Uncertainties regarding hydrogen and fuel cell prospects 197
RD&D challenges and opportunities 198
Annexes 201
Annex 1 ETP MODEL CHARACTERISTICS 201
Annex 2 REGIONAL INVESTMENT COSTS, DISCOUNT RATESAND FUEL TAXES 219
Annex 3 BENEFIT/COST RATIOS OF HYDROGEN TECHNOLOGIESAND FUEL CELLS 223
Annex 4 GREENHOUSE EFFECTS OF HYDROGEN AIRPLANES 227
TABLE OF CONTENTS 9
10 PROSPECTS FOR HYDROGEN AND FUEL CELLS
Annex 5 EXISTING HYDROGEN REFUELLING STATIONS 229
Annex 6 DEFINITIONS, ABBREVIATIONS, ACRONYMS AND UNITS 235
References 243
List of Figures
Figure 2.1 Hydrogen production cost vs. electrolyser capacity and production volume 47Figure 2.2 Hydrogen production cost breakdown, 2030 47Figure 2.3 The current and future levelised cost of hydrogen from electrolysis 48Figure 2.4 Investment costs for steam reforming units vs. capacity 50Figure 2.5 The investment cost breakdown of hydrogen production from coal
(35 PJ/yr of H2 with CCS) 53Figure 2.6 H2 production shares as a function of the investment cost
of a FutureGen plant, 2050 53Figure 2.7 The sulphur-iodine thermo-chemical hydrogen production process 56Figure 2.8 Overview of hydrogen production routes from biomass 58Figure 2.9 The principle of photo-biological hydrogen production 59Figure 2.10 Hydrogen production cost projection 61Figure 2.11 The cost of hydrogen and natural gas pipelines 63Figure 2.12 Hydrogen liquefaction costs 64Figure 2.13 Worldwide hydrogen refuelling stations 65Figure 2.14 Energy needs for hydrogen pressurisation 69Figure 2.15 Fuel tank volume by fuel type 72Figure 2.16 The metal hydride family tree 76
Figure 3.1 The fuel cell concept 81Figure 3.2 The proton exchange membrane fuel cell concept 82Figure 3.3 The alkaline fuel cell concept 84Figure 3.4 The molten carbonate fuel cell concept 85Figure 3.5 The solid oxide fuel cell concept 86Figure 3.6 Electrode cost by production technology and volume 90 Figure 3.7 The cost of injection-moulded bipolar plates by batch size 90Figure 3.8 The thermal efficiency of ICE and fuel cell vehicles by load factor 93Figure 3.9 The delivered power cost of FCVs 94Figure 3.10 Growth in the global FCV fleet 96 Figure 3.11 The on-road vehicle efficiency of ICEVs, HEVs and FCVs 97 Figure 3.12 Potential efficiency improvements for LDVs 98 Figure 3.13 Projections of transport demand and emissions with no new policies 99 Figure 3.14 The incremental energy consumption of H2-fuelled airplanes 108 Figure 3.15 Comparison of the fuel use and greenhouse emissions of kerosene
and H2 airplanes 109 Figure 3.16 Electric efficiency of residential SOFC systems 116
Figure 4.1 Well-to-wheel fuel chain efficiency of ICEs, FCVs and plug-in hybrids 121 Figure 4.2 Stranded gas resources, by region 123 Figure 4.3 Transportation fuel supply options and their contribution to energy policy goals 127

Figure 5.1 The structure of the hydrogen and fuel cells model analysis 134 Figure 5.2 Primary energy demand projections (BASE scenario) 135 Figure 5.3 Fuel use by mode in the transportation sector (BASE scenario) 135 Figure 5.4 Greenhouse gas incentives in the MAP scenario 137 Figure 5.5 Primary energy mix in the MAP scenario 138 Figure 5.6 Global CO2 emissions (BASE and MAP scenarios) 138 Figure 5.7 Transport sector fuel demand by scenario 139 Figure 5.8 Hydrogen use in the transport sector, 2050 (MAP scenario) 140 Figure 5.9 Stationary fuel cell capacity by sector (BASE and MAP scenarios) 141 Figure 5.10 Stationary fuel cell capacity by fuel input (BASE and MAP scenarios) 142
Figure 6.1 Hydrogen demand under different policy incentive levels 146 Figure 6.2 Energy-related CO2 emissions at various CO2 incentive levels
and the IPCC scenarios for 550 ppm and 450 ppm 146 Figure 6.3 The sensitivity of global hydrogen use to the incentive level and coverage 147 Figure 6.4 Fuel shares in the transport sector with and without the energy-security
policies, 2050 148 Figure 6.5 End-use of primary biomass under different biomass availability scenarios 152 Figure 6.6 The sensitivity of hydrogen to the availability of FutureGen Plant
and CCS, 2050 153 Figure 6.7 Alternative assumptions for PEM FCV cost reductions 154 Figure 6.8 Impact of FCV efficiency assumptions on their stock share 155 Figure 6.9 Hydrogen production mix (MAP and MAP CHE scenarios) 156 Figure 6.10 Difference between the average electricity price and nightly electricity prices 157
Figure 7.1 Global hydrogen demand in the ESTEC scenarios 168 Figure 7.2 Transport sector fuel demand in the ESTEC scenarios, 2050 168 Figure 7.3 Total primary energy demand in the ESTEC scenarios, 2050 169 Figure 7.4 Hydrogen demand by region in Scenario D (ESTEC +++++) 170 Figure 7.5 Hydrogen demand per capita in the ESTEC scenarios, 2050 170 Figure 7.6 The share of hydrogen demand by region in the ESTEC scenarios, 2050 171 Figure 7.7 Share of hydrogen-fuelled vehicles in the passenger car
and light/medium truck markets 172 Figure 7.8 Stock share of hydrogen-fuelled LDVs and delivery trucks in key regions
in Scenario D (ESTEC +++++), 2050 173 Figure 7.9 Global stationary fuel cell use in the ESTEC scenarios 174 Figure 7.10 Global stationary fuel cell capacity by sector in the ESTEC scenarios 175 Figure 7.11 Global stationary fuel cell capacity by fuel input in the ESTEC scenarios 175 Figure 7.12 Hydrogen production by technology in the ESTEC scenarios 176 Figure 7.13 Global CO2 emissions in the ESTEC scenarios, 2030 and 2050 178 Figure 7.14 Transport sector emissions in scenario D and without hydrogen
and fuel cells, 2002, 2030 and 2050 180 Figure 7.15 Oil trade and the oil production mix in the Base, ESTEC
and WEO RS scenarios, 2030 and 2050 181 Figure 7.16 Hydrogen demand in OECD North America in the ESTEC scenarios 182 Figure 7.17 Stationary fuel cell capacity in OECD North America in the ESTEC scenarios 183 Figure 7.18 Hydrogen demand in OECD Europe in the ESTEC scenarios 184 Figure 7.19 Stationary fuel cell capacity in OECD Europe in the ESTEC scenarios 184 Figure 7.20 Hydrogen demand in OECD Pacific in the ESTEC scenarios 185
TABLE OF CONTENTS 11
12 PROSPECTS FOR HYDROGEN AND FUEL CELLS
Figure 7.21 Stationary fuel cell capacity in OECD Pacific in the ESTEC scenarios 186 Figure 7.22 Hydrogen use in China in the ESTEC scenarios 187
Figure A1.1 The ETP Model Energy System 203 Figure A1.2 The ETP oil supply module 208 Figure A1.3 The ETP gas supply module 210 Figure A1.4 The coal supply module in the ETP model 211 Figure A1.5 The ETP hydrogen supply and demand module 212 Figure A1.6 Modelling of fuel cells in the ETP model 213 Figure A1.7 The bioenergy supply and demand module in the ETP model 216
Figure A4.1 Radiative forcing in 2050 with kerosene jet engines or a gradual transitionover 2000-2050 to hydrogen-fuelled airplanes 227
List of Tables
Table 1.1 Targets in the US RD&D programme 37
Table 2.1 The theoretical efficiency of electrolysis at various temperatures and pressures 44Table 2.2 Characteristics of existing and advanced electrolysers 46Table 2.3 Reactions for producing hydrogen from fossil fuels 49Table 2.4 Decentralised reforming technologies 50 Table 2.5 The current and future costs and efficiency of hydrogen production
from natural gas 51Table 2.6 Cost and efficiency of hydrogen production from coal 54Table 2.7 Projected investment cost of H2 production from nuclear heat 57Table 2.8 Investment and energy needs for photo-biological production 60Table 2.9 Investment costs for hydrogen refuelling stations by size 66 Table 2.10 Investment costs of hydrogen refuelling stations by station size
(per unit of energy) 66Table 2.11 Investment costs for H2 refuelling stations by station size for liquid hydrogen
delivered by truck 67 Table 2.12 Projected investment costs for refuelling stations with on-site hydrogen
production from steam reforming in 2030 67Table 2.13 Overview of investment cost estimates for refuelling stations 68Table 2.14 Number of gasoline stations and intensity of use for a number of countries 69Table 2.15 Different estimates of the investment required for the transition to hydrogen 70Table 2.16 Gaseous H2 storage: The merits of composite tanks and glass micro-spheres. 73Table 2.17 The merits of H2 storage in liquid form and in solutions 74Table 2.18 Solid storage materials under consideration 75Table 2.19 The key properties of selected alanates and borohydrides 76Table 2.20 The storage density of water-reactive chemical hydrides 77Table 2.21 The key characteristics of thermal-chemical hydrides 77Table 2.22 Targets and performance for on-board hydrogen storage 78
Table 3.1 Fuel requirements of the principal fuel cells 87Table 3.2 Current cost of a manually produced PEM fuel cell 88
Table 3.3 The estimated future cost of a PEM fuel cell stack 91Table 3.4 The estimated future cost of a PEM fuel cell stack 91Table 3.5 The estimated cost of a hydrogen fuel cell vehicle (80kW FCV) 101Table 3.6 Estimated fuel cell vehicle cost reduction scenarios 102Table 3.7 Estimated retail prices of ICEs, hybrids and FCVs 103Table 3.8 Hydrogen hybrids and FCV CO2 emissions reduction cost 104Table 3.9 The incremental cost of alternative bus engine systems 105Table 3.10 Average annual vehicle mileage 106Table 3.11 Annual operating costs for eight bus drive systems 106Table 3.12 Cost assessment for a very large hydrogen-fuelled airplane 109Table 3.13 The fuel efficiency and GHG emissions of new planes, 2000-2050 110Table 3.14 Cost comparison of MCFCs and SOFCs 111 Table 3.15 Efficiency balance of a 100 kW MCFC system 112Table 3.16 SOFC tests by Siemens-Westinghouse 113Table 3.17 Energy balance of a coal-fired SOFC power plant 114Table 3.18 Characteristics of residential fuel cell CHP systems 114Table 3.19 The cost of residential SOFC systems 115Table 3.20 Comparison of conventional and fuel cell CHP systems 115Table 3.21 The cost of adding 9% (in energy terms) hydrogen to natural gas systems 117
Table 4.1 Characteristics of Stirling engines and ICE CHP systems 129
Table 6.1 Overview of the ETP sensitivity analysis 145Table 6.2 Results of the sensitivity analysis 159
Table 7.1 Characteristics of the ESTEC scenarios 166Table 7.2 Benefit-cost ratios of hydrogen production processes across regions
in Scenario D (ESTEC +++++), 2050 177
Table A1.1 Example of the MARKAL Model Data Structure for a Power Plant 204Table A1.2 Demand categories in the ETP model 206Table A1.3 Coal and gas price projections, (2000-2030) 207Table A1.4 Primary biomass supply options in the ETP model 213Table A1.5 Global biomass supply potentials, 2050 214Table A1.6 Biomass supply potential by region, 2050 216
Table A2.1 Region-specific cost multipliers 219Table A2.2 Discount rates by region and sector in the ETP model 220Table A2.3 Transportation fuel taxes for non-commercial use, 2003 221
Table A3.1 The B/C ratios of hydrogen supply technologies for the USAin the MAP scenario 223
Table A3.2 The B/C ratios of hydrogen technologies in the transport sector for the USAin the MAP scenario 224
Table A3.3 The B/C ratios of stationary fuel cells for the USA in the MAP scenario 224
Table A5.1 Existing hydrogen refuelling stations 229
TABLE OF CONTENTS 13

EXECUTIVE SUMMARY
Hydrogen is an energy carrier with the potential to open the door to a wide range of new energytechnologies and policy options. Fuel cells powered by hydrogen or other fuels can achieve highefficiencies and have a variety of possible uses in mobile and stationary applications. In the rightcircumstances hydrogen and fuel cells technologies could make major contributions to the key policyobjectives of energy security and mitigation of carbon dioxide (CO2) emissions, especially in thetransportation sector. Recent advances in hydrogen and fuel cell research and development havetremendously increased the interest of the international community in these technologies whichhave the potential to create paradigm shifts in transport and distributed power generation. Thereare approximately 400 demonstration projects currently in progress world wide.
Of the many technology options, the possibility of hydrogen powered fuel cell vehicles is perhapsthe most far reaching. It has attracted widest interest and unprecedented research investment byGovernments and private firms in the automobile and energy sectors. Replacing petrol used invehicles could, obviously, have major advantages for energy security and climate change mitigation.And fuel cell powered vehicles could be a new, attractive market with benefits for the global economy.Hydrogen can also reduce CO2 emissions when it is produced from renewables and nuclear energy.If the source of the hydrogen is natural gas or coal then the capture and storage of CO2 is essentialto achieve emission savings. In all cases, hydrogen fuel cell vehicles reduce local environmentalpollution, as the only effluent is water vapour.
Governments, private companies, and experts have different views and expectations regarding theprospects for hydrogen and fuel cells. There is a complex array of technologies and processes forhydrogen production, storage, transportation, distribution, different types of fuel cells, and otherend use technologies. There is also a range of competing technologies with the potential to meet,at least in part, some of the same policy objectives. These include biofuels, and various forms ofelectric or hybrid vehicles. This study has tried to take a realistic view of the potential for hydrogentaking account, also, of the potential of these other technologies.
The study was conceived in the framework of the IEA Hydrogen Co-ordination Group, establishedin 2003, and utilises the IEA’s Energy Technology Perspectives model. The analysis draws on theIEA’s extensive international energy technology network and takes account of the results of workshopsinvolving national and private sector experts in the field, including key industry associations.
While recent technology advances have been impressive, most hydrogen technologies are currentlysubstantially more costly than their conventional counterparts. And a transition to hydrogenwould require infrastructure investment in the range of several hundred billion to a few trilliondollars, over several decades, depending on timing and assumptions as to the investment that wouldeventually have been needed in the alternative system.
Nevertheless, hydrogen and fuel cells may have a major role in the future energy market if currenttargets for reducing technology costs can be met and if governments give high priorities toreducing CO2 emissions, to improved energy security and to research and development efforts.In the next few decades, hydrogen production costs need to be reduced 3 to 10 fold, dependingon the technology used, and fuel cell costs by 10 to 50 fold. Substantial improvements are alsoneeded to overcome key technology issues concerning fuel cells and hydrogen on-board storagefor fuel cell vehicles. Governments would need to adopt policies that incentivise CO2 emissionsavings by giving a value to the emissions avoided. They would also need to adopt policies todiversify the energy supply. However, policies for enhanced security on their own would not be
EXECUTIVE SUMMARY 15
16 PROSPECTS FOR HYDROGEN AND FUEL CELLS
sufficient. In the absence of CO2 policies, there are other technologies and fuels (such as coal)that could diversify energy supply at less cost. In any case, new technologies are needed tosupport CO2 and energy security policies.
The analysis suggests that if these most favourable conditions are met then 30% of the globalstock of vehicles could be powered by hydrogen fuel cells by 2050 – about 700 million vehicles.The oil consumption of the same number of petrol engine vehicles would have been some 15 millionbarrels per day, equivalent to around 13% of global oil demand (or 5% of the global primary energydemand) in the reference scenario at the time. It is important to recognise, however, that, in theabsence of hydrogen, other low carbon technologies such as biofuels and synfuels from coal andgas might also have saved much of this oil in the policy environment assumed. Because the efficiencyof the hydrogen fuel cell vehicles (e.g. using Proton Exchange Membrane fuel cells) is more thantwice that of conventional engines the total energy content of hydrogen used would be much lessthan this – less than 3% of the global primary energy demand.
If hydrogen used for energy applications is added to hydrogen used in refinery and chemical industrythen, in this most favourable scenario, the total amount of hydrogen used in 2050 would be some180 million tonnes of hydrogen per year, equivalent to more than a 4-fold increase in comparisonwith today’s hydrogen use.
However, hydrogen and fuel cell vehicles will only play a significant role under these favourableassumptions. If less optimistic assumptions are considered for technology development and policymeasures, hydrogen and fuel cell vehicles are unlikely to reach the critical mass that is needed formass market uptake. Competing fuels with lower infrastructure costs, such as biofuels and syntheticfuels derived from coal and gas, would play a larger part.
Stationary fuel cells are a more robust technology option that is much less sensitive to energypolicies and competing technology options. Stationary solid oxide fuel cells (SOFC) and moltencarbonate fuel cells (MCFC) – mostly fuelled by natural gas – can contribute to meeting the demandfor distributed combined heat and power with some 200-300 Gigawatts, equal to 2-3% of globalgenerating capacity in 2050. Currently, private investment in stationary fuel cells and installedcapacity is continuously growing.
This analysis does not take account of the possibility of major breakthroughs in some high-risk/high-potential technologies that are presently in their infancy. These include new concepts and materialsfor fuel cells, and on-board solid hydrogen storage and production technologies, such as photo-electrolysis, biological production, and water splitting by nuclear and solar heat. These technologieshave the potential to make a tremendous impact on the future of hydrogen and fuel cells andthe whole energy system. Of course, breakthroughs are also possible in competing technologies,such as electric vehicle batteries.
Conclusions and recommendations
Uncertainty indeed remains as to the mix of technologies that will play the largest parts in meetingthe challenges of global warming, energy security and economic efficiency in the longer term. It isessential, therefore to continue to develop a broad portfolio. The technologies associated withhydrogen and with fuel cells are amongst those with the greatest potential, in particular, for thetransport sector. Consistent with this portfolio approach, governments should, therefore, continueto sustain research, development, and demonstration programmes for hydrogen and fuel cells,with a focus on:

● Cost effective production of hydrogen that meets environmental and quality standards.
● New materials and concepts to reduce the costs and increase the durability of fuel cells.
● Reliable and economic systems for hydrogen on-board storage in fuel cell vehicles.
● Concepts and technologies for reducing the cost and the energy consumption of hydrogentransportation and distribution.
● Basic science research in areas such as photo-electrolysis, high temperature water splitting,biological production of hydrogen, new materials for hydrogen storage and fuel cells, andnanotechnologies. For this purpose it is important to retain the links between the basic andapplied science communities.
Deployment of hydrogen infrastructure at this point would be premature, as some of the key technicalissues that are still being worked on – such as fuel cell operating conditions and hydrogenon-board storage – may have a considerable impact on the choice of technologies for hydrogenproduction, distribution, and refuelling. However, continued international co-operation on R&D,infrastructure concepts, and harmonisation of codes and standards remains vital in the light of theglobal nature of the transport industry.
As natural gas and coal are likely to remain the lowest-cost sources of hydrogen for many years tocome, large-scale CO2 capture and storage, already of the highest importance to mitigate emissionin the power sector, is also a vital step towards the wider use of hydrogen.
In the coming years, full use should be taken of niche opportunities to deploy fuel cell vehicles, forinstance in public service fleets (buses, delivery vans) where the economics are more attractivethan for private cars, and in situations where low-cost hydrogen is available. Such programmes canstart the process of cost reduction through larger scale manufacture, can broaden operatingexperience, and can begin to familiarise the public with these technologies.
EXECUTIVE SUMMARY 17

OVERVIEW
The role of hydrogen in the energy context
Security of energy supply, high oil prices and growing emissions of greenhouse gases continue topose unresolved challenges for the global economy and the climate of the planet. While oil pricesand supply security represent immediate or short-term issues for the global economy, the effectsof climate change are a longer term challenge. Consensus exists in the international communitythat urgent action is needed to both face short-term energy security problems and mitigate futureclimate change, and that technology and policy are part of the solution.
There is no energy technology “silver bullet”, however. No technology promises to hold the overallsolution, and all options need to be carefully explored. Technology advances or even breakthroughsare needed in a number of domains to achieve cost-effective renewables such as photovoltaic andbiomass, acceptable nuclear waste management, low-cost CO2 capture and storage for fossil fuelsand – not least – efficient energy end-uses. Hydrogen and fuel cell technologies promise considerablebenefits in terms of energy security and CO2 emissions, but also require significant technicalbreakthroughs, cost reduction and appropriate policies to enter the market.
Hydrogen is a gaseous, clean energy carrier. It does not occur in nature in any significant amountsbut can be produced from a wide range of primary energy sources, such as coal, natural gas, nuclearand renewable energy. It could be used in almost all stationary and mobile energy applications.Recent technology advances have increased attention for the use of hydrogen and fuel cells as asubstitute or complement for oil fuels and internal combustion engines in transport. Dependingon the characteristics of the well-to-wheel energy chain, a transportation system based on hydrogenfuel cell vehicles (FCVs) may result in very significant reductions of oil demand and primary energyuse. Of course, the largest benefit in terms of supply security is obtained if hydrogen is producedfrom coal, renewable or nuclear primary energy.
In principle, a hydrogen-based energy system would not generate any significant emissions ofgreenhouse gases. If hydrogen is used in fuel cells or burned with pure oxygen in combustionprocesses, it only produces water as a combustion product. Viewed as a whole, the emissions of ahydrogen-based energy system depend on the fuel chain characteristics, primarily the energy sourcethat is used to produce hydrogen and the production process. Hydrogen is a nearly CO2-free energycarrier if produced directly from renewable and nuclear energy, or from natural gas and coal withCO2 capture and storage. If hydrogen is produced by water electrolysis, the emissions will dependon the upstream process to produce electricity. As CO2 capture and storage technology is stillunder development and the availability of renewable or nuclear electricity is limited in most regions,the potential for producing CO2-free hydrogen is currently limited, and in the future will dependon the development of these technologies.
Using hydrogen in fuel cells maximizes the efficiency and emissions-reduction benefits in bothtransport and stationary applications. Therefore, most emphasis in this study focuses on hydrogenuse in fuel cells. However, hydrogen and fuel cells are not necessarily linked together. Certain fuelcells can use fuels other than hydrogen, and hydrogen can be burned in conventional combustionengines and turbines with limited technical changes. These applications, however, do not providesimilar substantial benefits for emissions mitigation or efficiency gains.
OVERVIEW 19
20 PROSPECTS FOR HYDROGEN AND FUEL CELLS
The infrastructure for hydrogen production, transportation, distribution and storage plays an importantrole for the potential of hydrogen as an energy carrier. Because of the low gas density and permeabilityinto materials, hydrogen transportation via pipeline is much more expensive in terms of investmentcost and energy consumption than the transportation of natural gas. In general, transportation ofgaseous or liquid hydrogen is a costly and energy-consuming process. Hydrogen storage also requiresenergy-intensive compression at very high pressure (350-700 bar) or liquefaction at very lowtemperature (–253°C) to minimize the storage space. On-board storage in solid materials for hydrogen-fuelled vehicles is a high-potential option that still is under development.
Hydrogen is widely used today for chemical and refinery processes. The amount of hydrogen that isproduced today, some 5 EJ per year mainly from natural gas, is equal to more than 1% of global primaryenergy use. This indicates that large-scale hydrogen production is an established technology. However,using hydrogen for fuel cell vehicles or for distributed power generation requires cheaper productiontechnologies (ideally with no CO2 emissions), cost-effective transportation and storage technologies,and low-cost, efficient fuel cells. Depending on the production technology, hydrogen production costshould be reduced by a factor of 3 to 10, while the cost of fuel cells needs to be reduced by at least afactor of 10 to 50, in comparison with current cost estimates. Technology learning is the key to achievingthese targets. Technology improvements should be associated with large-scale industrial production andeconomies of scale to achieve competitive costs. In the meantime, governments should foster infrastructureinvestment, work to establish codes and standards, and enact appropriate policies for the marketintroduction of hydrogen and fuel cells.
In recent years, hydrogen and fuel cells have received increasing attention and research, developmentand demonstration (RD&D) funds. The expectation is that a few decades from now, fuel cells andCO2-free hydrogen (from fossil, renewable and nuclear primary energy sources) could be gaining asignificant share in the transport, stationary applications and power generation markets. TheOECD member countries have recently intensified their efforts on hydrogen and fuel cells RD&D.Total public spending in the OECD in 2004 amounted to some USD 1 billion and representedsome 12% of all public energy RD&D spending. Even larger is the total investment of the privatesector, including major oil companies, auto and truck manufacturers and a number of potentiallynew players in a future hydrogen and fuel cell market.
Countries that are closely involved in hydrogen and fuel cells development have set specific RD&D anddeployment targets. The European Union envisages hydrogen representing 5% of the total transportationfuels by 2020 and a significant penetration of fuel cells for combined heat and power (CHP) applicationsin the residential and industrial sectors. With some 30 fuel cell buses running in several Europeancities, the European CUTE-ECTOS project is perhaps one of the most important demonstration projectsworld wide. In Japan, a joint public/private programme aims to commercialise 5 million fuel cell vehiclesand 10 GW of stationary fuel cells by 2020. Current demonstration projects include some 60 FCVs,10 hydrogen refuelling stations, and numerous stationary fuel cells installed in 33 different locations.In the United States, the Department of Energy (US-DOE) envisions a phased transition to hydrogenwith a commercialisation decision in 2015. This will be based on the achievement of specific R&D anddemonstration targets such as cost-effective hydrogen production and storage in comparison to gasoline,fuel cell engines for vehicles at less than USD 50/kW to compete with conventional vehicles, andstationary fuel cell power systems with appropriate durability at USD 400-700/kW. While the fullextent of hydrogen benefits will be available in the long term, achieving these targets by 2015 wouldenable industry to move towards the commercialisation of the hydrogen technologies.
The interest in hydrogen is not limited to OECD countries. Brazil, China, India, and Russia are alsocommitted to hydrogen and fuel cells development. China is aiming to trial hydrogen fuel cell
buses in a demonstration project at the Beijing Olympic Games in 2008 and to initiate massproduction of fuel cell vehicles from 2010 onward.
This study
Building on selected assumptions for the future developments and costs of relevant technologies, thisstudy offers a quantitative assessment of the possible role of hydrogen and fuel cells in the energyscenarios over the coming decades. It quantifies the costs, benefits, and policy needs associated withthe use of hydrogen and fuel cells. The study focuses on three principal objectives:
● Quantifying the prospects for technical improvement and cost reduction in hydrogen and fuelcell technologies.
● Exploring the technical, economic and policy issues important to a transition to a hydrogenenergy system.
● Analysing the long-term perspectives of a fully developed market for hydrogen and fuel cells,and their impact on emissions and energy security.
To assess the real prospects for hydrogen and fuel cells in a competitive market, a significant emphasisis put on the potential of competing technology options. Sensitivity and scenario analysis helps tomap key uncertainties that must be considered in decision making.
The study has been carried out using the IEA Energy Technology Perspectives (ETP) model, a MARKALmodel of the global energy system that is used to analyse technology policies and support decision-making in the energy sector. The model includes 15 world regions with energy trading between them.There is a detailed description of the energy system with energy demand, fuels and carriers, and adatabase of more than 1500 demand and supply technologies. For each technology, the model hasdata on performance, costs, emissions, and a proper characterisation of technology learning for emergingtechnologies. Given the current energy systems and technology mix, the model analyses their evolutionover a time horizon to 2050 and provides cost-optimal configurations under selected assumptions forenergy policies and technology development.
The present study was conceived within the context of the activities of the IEA Hydrogen Co-ordination Group (HCG) and is supported by ten HCG countries, namely Australia, Austria, Canada,France, Germany, Japan, the Netherlands, Spain, the United Kingdom, and the United States.
This report consists of two parts. The first part (Chapters 1, 2, 3 and 4) offers an insight into thecurrent status and potential development (performance and costs) of hydrogen and fuel cellstechnologies and competing options. The second part (Chapters 5, 6, 7 and 8) discusses howtechnology advances, energy policies, and other key drivers may foster the introduction of thesetechnologies in the energy market. Their impact on CO2 emissions and the security of energy supply,as well as R&D directions and infrastructure development, are also discussed.
Technology insights
Hydrogen
Some 40 million tonnes of gaseous hydrogen a year are currently produced via establishedtechnologies, primarily natural gas reforming but also coal gasification and water electrolysis.
OVERVIEW 21
22 PROSPECTS FOR HYDROGEN AND FUEL CELLS
However, to produce cost-effective hydrogen for energy use, these technologies need higherefficiencies, significant cost reduction and the development of cheap and safe techniques for CO2
capture and storage. Research and development efforts focus on high-efficiency natural gas reforming,coal gasification in integrated gasifier combined cycle (IGCC) plants for the co-production of electricityand hydrogen, and electrolysis at high temperature and pressure. A number of other emergingtechnologies such as water splitting using solar and nuclear heat, biomass gasification, and photo-biological processes are also being developed. With different level of development, these newtechnologies are still far away from being commercialised.
Most current RD&D focuses on small-scale, decentralised natural gas reforming (without CO2
capture) and electrolysis. Decentralised technologies do not require costly infrastructure forhydrogen transportation and distribution. They are therefore the best choice to produce hydrogenin the early market introduction phase. However, decentralised technologies are generally notvery efficient and need substantial cost reduction to become competitive. A fundamentaldisadvantage of small-scale natural gas reforming is that the capture of CO2 emissions in smallplants is difficult and expensive, and therefore likely to be impractical. As far as electrolysis isconcerned, current and projected costs are higher than those for natural gas reforming. It shouldalso be noted that surplus renewable electricity for hydrogen production will probably be limitedto a few regions.
The current cost of decentralized hydrogen production may exceed USD 50/GJ H2, but variousproduction options promise hydrogen at USD 10–15/GJ H2. While sensitive to natural gas andelectricity prices, the cost of natural gas reforming may be reduced to below USD 15/GJ H2 by2030 and that of electrolysis to below USD 20/GJ H2. Even lower – below USD 10/GJ H2 – couldbe the projected cost of hydrogen from centralised coal-gasification in IGCC plants with CO2 captureand storage. The long-term costs for high temperature water splitting could be USD 10/GJ H2 usingnuclear heat and USD 20/GJ H2 using solar heat. Higher costs are projected for other technologies.However, the lower the level of technology maturity, the higher is the uncertainty on projectedproduction costs.
Hydrogen can fuel combustion engines and turbines, but it offers its full benefits in terms of efficiency,lower CO2 and other pollutant emissions when used in fuel cells. Significantly, the use of hydrogenfuel cell vehicles could solve at one stroke the problems of oil-dependence and emissions in thetransport sector. The stationary use of hydrogen fuel cells for combined heat and power productionis also a potential application, but non-hydrogen fuel cells appear as a competitive option in thismarket segment.
Hydrogen on-board storage is a key issue for fuel cell vehicles, as on-board hydrogen productionvia reforming of fossil fuels has proved to be difficult, so far. While significant studies have focussedon hydrogen storage, existing on-board storage options do not meet the technical (compactness,drive-range) and economic requirements to make them competitive. Gaseous storage at 350-700 bar and liquid storage at –253°C are commercially available but costly options. The cost ofthe tank is around USD 600 to 800/kg H2 and the electrical energy required for compression andliquefaction is more than 12% and 35% of the hydrogen energy content, respectively. Solid storageoffers potentially decisive advantages but it is still under development, with a number of materialsbeing investigated. The promising storage characteristics of carbon nano-structures have not beenconfirmed by recent studies. Without further breakthroughs, gaseous storage at 700 bar seems, atpresent, to be the technology of choice for passenger cars. However, such a system would not meetthe required targets for drive-range and costs. The global character of the car industry requires thathydrogen quality and safety standards, as well as on-board storage technologies, be established
before a full-scale development of the hydrogen infrastructure begins. In particular, the on-boardstorage system may have a significant impact (e.g. hydrogen pressure) on the optimal choice forthe hydrogen infrastructure (production, distribution and refuelling). Therefore, the identificationof a suitable and cost-effective storage technology is an urgent issue if hydrogen is to be broughtto the market.
In the case of centralized hydrogen production, the transportation and distribution costs – and therefuelling cost for transport vehicles – add considerably to the total hydrogen supply cost. Thesecosts range from USD 5 to 10/GJ H2 for large-scale supply systems. They may be even higher duringthe initial development phase. Hydrogen transportation by pipeline seems to be the lowest-costoption to move hydrogen. However, because of the low gas density and highly permeable natureof hydrogen through materials, hydrogen pipelines are twice as expensive in terms of investmentcost and require five times more energy to operate, if compared to natural gas pipelines. Considerablymore expensive is the transportation and distribution of liquid hydrogen.
Estimating the global investment required to develop a hydrogen infrastructure is a difficult exercise.Whether current natural gas pipelines may be used to transport hydrogen is still matter of discussion.Certainly, some materials and components would need to be adapted or replaced. A hydrogensupply infrastructure for road transport would cost in the order of several hundred billion US dollars.If centralised production is adopted, the cost of a worldwide hydrogen pipeline system for thetransport sector could range from USD 0.1 trillion to USD 1 trillion. The incremental investmentcost for hydrogen refuelling stations would be somewhere between USD 0.2 trillion for centralisedproduction and USD 0.7 trillion for decentralised production. A full hydrogen economy with extensiveuse of hydrogen for both transport and stationary applications would require a global pipelineinvestment in the order of USD 2.5 trillion, the bulk of which would be for the connection ofcommercial and residential customers. Assuming the early retirement and partial replacement ofthe existing natural gas supply system, a significant part of this cost would be incremental.
These investment costs can be compared with the global investment of USD 16 trillion that isprojected to be required for the overall energy supply system until 2030 (IEA, 2004a). Evenconsidering the uncertainty affecting current estimates, it appears that a transition to hydrogenwould add substantially to the total investment cost for the energy system (from a few percent tosome tens of percent). In absolute terms, the hydrogen investment as well as the overall energyinvestment should be compared to the global (undiscounted) world GDP over the period to 2050(some 5 350 trillion USD) and the total investment (some 23% of GDP, based on annual average).When viewed in this light, the high investment cost for hydrogen infrastructure should not beconsidered as a deterrent to the transition to hydrogen. Who should bear this investment is, of course,a matter for discussion.
Fuel cells Fuel cells are the technology of choice to exploit the full benefits of hydrogen in terms of energy-security, emissions and efficiency.
Proton exchange membrane fuel cells (PEMFCs) can be used for both stationary and transportapplications. Because of their high sensitivity to carbon monoxide and sulphur pollutants, they needa rather pure hydrogen (e.g. produced by electrolysis). If hydrogen is produced from natural gasreforming or from residual industrial gases, purification processes may be needed before use in aPEMFC. At present, PEMFCs seem to be the best candidate for fuel cell vehicles. The current costof PEMFCs exceeds USD 2 000/kW, but stack cost reductions to USD 100/kW seem to be possible
OVERVIEW 23
24 PROSPECTS FOR HYDROGEN AND FUEL CELLS
with mass-production and technology learning. However, further reductions to below USD 50/kW areneeded to produce competitive FCVs. This will require fundamental advances in materials and higherfuel cell power densities. Research efforts are focusing on high-temperature membranes that are lessprone to poisoning and enable on-board reforming. Due to the ongoing developments in PEMFCtechnology, it would be premature to make choices about the hydrogen infrastructure at this stage, asthey will be affected by hydrogen purity requirements. Direct ethanol fuel cells (DEFCs) could alsobecome an interesting option for transport, but they are still at a very early stage of development.
The efficiency of hydrogen fuel cell vehicles (FCVs) is at least two times higher than the efficiencyof reference internal combustion engine (ICE) cars. However, FCVs are not yet ready forcommercialisation. In addition to cost reductions, they need improvements in their durability (lifetime)and reliability. In addition to the fuel cell stack cost, other components such as the balance of plant,the electric engine and the hydrogen storage system determine the FCV cost. All these items needsignificant cost reductions to make FCVs competitive. Depending on assumptions for technologydevelopment, the stack cost of a PEMFC could decline to USD 35/kW or to USD 75/kW by 2030.Accordingly, the FCV incremental cost in comparison with a conventional ICE vehicle could rangefrom USD 2 200 to USD 7 600 per vehicle. Under such assumptions, the incremental investmentcost to replace 30% of global vehicle fleet by 2050 with fuel cell vehicles (some 700 million fuelcell cars) would range from USD 1 to 2.3 trillion.
While drive systems for fuel cell passenger cars could be competitive at costs of USD 50-100/kW,buses and delivery vans are “niche” markets where fuel cell engines can be competitive (if comparedto gasoline/diesel ICEs) at costs of USD 200/kW and USD 135/kW, respectively. Buses could, inprinciple, be the largest and most promising market. Although current production volumes are verysmall (10 buses a year), market developments could drive increasing production volumes thatresult in significant declines in PEMFC stack costs. Following these cost reductions, PEM fuel cellscould be introduced in passenger cars as well.
Molten carbonate fuel cells and solid oxide fuel cells (MCFCs and SOFCs) are the best candidatesfor stationary applications. They are less sensitive to pollutants than PEMFCs. Current MCFCs arefuelled by natural gas, while SOFCs can be fuelled by both hydrocarbons and pure hydrogen. BothMCFCs and SOFCs operate at high temperatures and do not require external reformers. Their electricefficiency is higher than that of PEMFCs. However, they are not suitable for cars, because theirhigh operating temperatures result in long start-up times. Natural gas fuelled MCFCs and SOFCsmay co-exist in the coming decades. However, hydrogen-fuelled SOFCs could be favoured if CO2
emissions reductions are mandatory.
Stationary fuel cells could fill the market between large-scale combined heat and power (CHP) unitsand small-scale boilers, thus extending the economic feasibility of CHP to the scale of buildings.Decentralised power generation without heat production seems to be less attractive, as the efficiencyof fuel cells would be lower than that of other centralised or distributed generation technologies, evenif distribution losses are accounted for. While electric efficiencies higher than 60% are still a challengingtarget for stationary fuel cell systems, CHP applications may achieve much higher overall efficienciesthan centralised power plants. Stationary fuel cells can bear higher costs than mobile fuel cells due totheir higher load factor and the higher costs of competing options. Their cost is expected to decline bya factor of five to ten and to become competitive once mass-production is introduced. Both the fuelcell stack (50% of the cost) and the balance of plant need to have their costs reduced.
The lifetime of a fuel cell is critical to its overall operating cost. The life span of PEM fuel cells verymuch depends on the operating conditions, such as low temperature start-up, excessive or insufficienthumidification, fuel purity, etc. The average life span for PEMFCs is presently about 2 200 hours
(equivalent to a 100 000 km range), but current tests show a significant variability from 1 000 tomore than 10 000 hours. The average life span of small-scale residential SOFC systems is currentlyaround 4 500 hours, with some systems lasting more than 20 000 hours. Although, significantadvances have been achieved in recent years, increasing the life span and reliability of fuel cellswill be imperative to gain consumer acceptance. For mobile applications the target is3 000-5 000 hours for cars and up to 20 000 hours for buses. In stationary applications thetarget is 40 000-60 000 hours, which equals 5-8 years of operation.
Direct methanol fuel cells (DMFCs) use methanol as a fuel. They are the best candidates for portableapplications, but their low efficiency makes them impractical for possible mobile and stationaryuses. In contrast, PEMFCs are not practical for portable devices, because of hydrogen storageproblems. MCFCs and SOFCs are not practical either, because of their high operating temperatures.In terms of commercial maturity, portable DMFCs appear close to market introduction. They arelikely to be followed by stationary MCFCs and SOFCs systems for decentralised use. More time isneeded for the commercialisation of mobile PEMFCs, although they are urgently needed to meetenvironmental and energy-security objectives.
Competing technologies
Hydrogen and fuel cell technologies compete with many alternative fuels and technology optionsthat can be used to meet energy-security and environment goals. The analysis in this study suggeststhat an assessment of the potential of hydrogen and fuel cells that does not take into accountcompeting options would result in misleading conclusions and in an overly optimistic assessmentof hydrogen’s potential. Development risks and uncertainties must be taken into account in settingenergy policies and strategies, and picking “winners” at this stage is premature.
In the transport sector, competing options include biofuels, Fischer-Tropsch (FT) synfuels fromcoal and gas, compressed natural gas, hybrid ICE and plug-in hybrid vehicles. Biofuels are anaffordable alternative fuel in transport sector in the short-term, but biomass availability limitsbiofuel use. Current hybrid vehicles, as well as hydrogen-hybrid vehicles, could also represent aviable alternative to hydrogen FCVs. While the deployment of hydrogen FCVs faces a “chicken-or-egg” problem (no demand without infrastructure investment and no investment in expensiveinfrastructure without demand), other technologies and fuel options do not face similar introductionbarriers. Hydrogen hybrid vehicles face a tougher on-board storage issue (because of their lowerefficiency than FCVs) and a similar chicken-or-egg problem. However, they do not requirechallenging cost reductions like the FCVs.
For both stationary and mobile applications, competing options are energy efficiency and large-scale electrification based on coal with CO2 capture and storage, nuclear, or even renewables. Large-scale electrification in conjunction with plug-in hybrid vehicles and Li-ion batteries could also leadto re-consideration of the role of electricity in transport. Hydrogen and fuel cells also face significantcompetition in the stationary applications market, either for distributed electricity generation orcogeneration. Large, highly-efficient coal and gas-fired power plants with CO2 capture and storage (CCS),emerging renewable electricity supply technologies, and new nuclear power technologies are strongcompetitors that fuel cells and all distributed technologies must beat. At the same time, newtechnologies such as micro-turbines and Stirling engines are being introduced in combined heatand power applications. Enhanced building insulation and industrial energy efficiency may alsolimit future heat demand. This reduced heat demand limits the potential for stationary fuel cellsin CHP applications, but at the same time an increased power-to-heat ratio makes fuel cells moreattractive compared to other CHP technologies.
OVERVIEW 25
26 PROSPECTS FOR HYDROGEN AND FUEL CELLS
Market prospects for hydrogen and fuel cells
New technologies may quickly conquer the market if they offer immediate, individual benefitssuch as lower costs, superior performance, or even costly but attractive new services. If this is notthe case, if the new technologies offer “only” collective economic or social benefits in the mid tolong term, then they will need government policies and technology learning driven by public/privateinvestment to become economically competitive and enter the market.
At present, hydrogen and fuel cells appear as a rather costly option to mitigate CO2 emissions andenhance energy-security. Even the current prospects for cost reductions are unlikely to result in asignificant economic advantage over existing technologies. In business-as-usual scenarios, with nosubstantial new policies for environmental protection and energy diversification, hydrogen as wellas other new technologies do not have any significant roles in the future energy mix. Also, policiessolely aimed at enhancing energy-security would not necessarily result in a switch to hydrogen. Ina CO2-unconstrained world, other technologies and fuels (e.g. coal) would be more cost-effectivefor increasing energy diversification.
Hydrogen is likely to conquer a significant market share only if effective policies for CO2 mitigationand energy-security are in place and combined with considerable reductions of hydrogen and fuelcell cost. Policies for CO2 mitigation and energy-security act in concert in promoting a number ofnew energy sources and technologies such as renewable and nuclear energy, coal use with CO2
capture and storage, and hydrogen as well. For the sake of this study, these policies have beencollectively represented by an economic incentive to reduce CO2 emissions. The incentive – expressedin USD per tonne of CO2 avoided – represents a variety of regulatory measures, subsidies andother policy instruments that have the effect of promoting hydrogen and fuel cells, as well as othertechnologies with the potential for emission mitigation and energy diversification. All these policyinstruments have the net effect of giving new technologies a value in terms of emissions avoided,and help improve the diversity of the energy system. For example, under reasonable assumptionson technology advances, an incentive that increases gradually up to USD 50/t of CO2 would stabiliseemissions over the period 2000-2050, and halve the business-as-usual level of emissions in 2050.The resulting energy mix would also be significantly more diverse. While a technology-neutralapproach that provides a uniform incentive to curb emissions may be difficult to achieve in practice,for the purposes of this study the CO2 incentive is the best instrument to identify cost-effectivetechnology options. The actual specification of single policy measures would not provide any furtherinsights into the cost-effectiveness of these options on a global or regional scale.
The adoption of the CO2 incentive paves the way to tough competition among a number of newtechnologies with the potential to reduce emissions. None of them seems able to play a dominantrole in the future energy market (there is no energy technology “silver bullet”), in comparison tothe role played by oil in transport. However, their collective use stabilises emissions and improvesdiversity and supply-security in the energy system. In all scenarios with CO2 policies, the trade inoil is reduced by 30-50% compared with the base scenario without CO2 policies. This is a significantimprovement in the security of supply, but it cannot be attributed to hydrogen and fuel cells alone.However, hydrogen and fuel cells are part of this broader technology portfolio.
In the most favourable scenario (i.e. ESTEC D, Chapter 7), with the CO2 incentive and quicklydeclining hydrogen and fuel cell costs, hydrogen emerges as a player in the future transport sectorbeyond 2030. Some 12.5 EJ (0.3 Gtoe) of hydrogen would be used in 2050, mostly in the transportsector. While in absolute terms this appears to be a limited amount of energy in comparison with
the total primary energy supply of around 785 EJ (18.8 Gtoe), its impact on transportation is verysignificant. The efficiency of PEM fuel cell vehicles is such that some 30% of the global fleet ofpassenger cars (some 700 million cars) would be fuelled by this relatively small amount of hydrogenin 2050. Fuel cell vehicles (cars, delivery vans, etc.) would start gaining market share between2015 and 2025. If hydrogen for energy use is added to hydrogen for other applications (refineryand chemicals) more than 22 EJ of hydrogen would be used in 2050. This amount represents amore than a four-fold increase with respect to the current level of hydrogen production.
However, hydrogen plays a significant role only under favourable assumptions. Under less optimisticassumptions for technology development and policy measures, hydrogen and fuel cells are unlikelyto reach the critical mass that is needed for their successful market uptake. Market introductionbarriers and competing fuels and technology options such as biofuels and FT synfuels would playa more important role.
If the most favourable scenario is compared to a similar scenario where hydrogen and fuel cellsare not part of the technology portfolio, the net benefit of hydrogen and fuel cells is found to bea 5% reduction in CO2 emissions (1.4 Gt of CO2) and a 2% reduction in oil use in 2050. This mayappear to be a limited benefit. However, if vigorous CO2 policies are in place, the resultingfuel/technology mix is optimised for emissions mitigation. In these conditions, a number of newtechnologies such as hydrogen, biofuels, CNG and FT synfuels from coal and gas with CCS wouldbe playing a role in a competitive energy market. In such a diversified and optimised world, therole played by a single emerging technology is necessarily limited. Neither hydrogen nor otheremerging technologies seem to be crucial to mitigate emissions, but their collective use results inthe stabilisation of emissions. However, the lack of hydrogen would result in significant changesin the structure of the transportation system. The 30% of passenger cars and light and mediumtrucks fuelled by hydrogen fuel cells in 2050 would be replaced by ethanol vehicles (about 10%)and by advanced gasoline ICEVs, hybrids and natural gas fuelled vehicles (the remaining 20%).Along with the emissions coming from additional FT synfuel upstream processes, the increaseduse of gasoline and natural gas to fuel vehicles would account for the total emission increase of1.4 Gt of CO2 in 2050.
The diversification of the energy system is such that the lack of hydrogen in the energy mix wouldnot imply dramatic changes for energy-security either. The net impact would only be a 2% increasein total conventional and unconventional oil use by 2050. However, oil imports from Middle East by2050 would increase by 14% due to the earlier depletion of non Middle-East oil supply sources, anda much more rapid expansion of other oil substitutes would be needed in the transportation sector.
In all scenarios, stationary fuel cell capacity ranges from 200 GW to 300 GW by 2050, equivalentto 2-3% of total installed capacity. This result suggests that stationary fuel cells, namely SOFCsand MCFCs, represent a robust technology option that is not significantly affected by policy strategiesand other variables. Most such fuel cells would be fired by natural gas and up to 22% of themwould use oil products. As a consequence, stationary fuel cells would not result in nearly zero-emissions. Hydrogen PEM fuel cells for stationary applications do not show up in any scenario.This result can be explained by the high cost of a dedicated hydrogen supply system and by theflexibility of the SOFC and MCFC systems, which do not need a fuel reformer, are less sensitive topoisoning than PEM fuel cells and have superior conversion efficiencies. However, stationary hydrogenfuel cells could benefit from the development of a hydrogen distribution system for transport. Sucha synergy has not been considered in the analysis, but could lead to hydrogen fuel cells playing amore important role than suggested by the scenarios here. Stationary fuel cells would concentratein the residential, commercial and industrial sectors and fill the market between large-scale CHP
OVERVIEW 27
28 PROSPECTS FOR HYDROGEN AND FUEL CELLS
units and small-scale boilers. They would thus extend the economic feasibility of CHP to the scale ofbuildings. Fuel cells for centralised power production play a role in only one scenario, in combinationwith coal-fired IGCC plants (25 GW IGCC-SOFC plants installed worldwide by 2050).
In cost-optimal scenarios, hydrogen production in the early market uptake phase is primarily basedon decentralised natural gas reforming and electrolysis. Centralised production from coal and naturalgas with CO2 capture and storage would then play a major role in the long-term. Production fromnuclear and renewable energy does not play a significant role. However, the cost of hydrogenproduction from nuclear heat or from biomass might be only slightly higher than that from fossilfuels. So nuclear and renewable hydrogen could enter the production mix, especially if productioncost is not the only criterion for the selection of the production technology, or technologies for CO2
capture and storage do not become available or competitive.
Decentralised production in the early market introduction phase increases the cost of hydrogen,but not the cost of the overall system. The limited hydrogen demand in the initial market phasedoes not justify the construction of a large distribution infrastructure.
If ambitious climate and energy-security policies are adopted world wide, the regional potential forhydrogen and fuel cells seems to be high in the OECD, China and India. In all regions, transportapplications (hydrogen fuel cell vehicles) dominate the hydrogen market. The share of hydrogen FCVsvaries widely across regions. In the most optimistic scenario, the region with the highest hydrogen FCVshare in the vehicle stock by 2050 is actually China (60%) followed by India, which has up to 42%hydrogen FCV share in 2050. A leap-frogging effect may occur in these countries as they have limitedexisting infrastructure for transport fuels already in place. Their large indigenous coal reserves, potentiallyavailable for hydrogen production, may also facilitate a transition to hydrogen. This result however ishighly scenario-dependent. The share in OECD countries is somewhat more stable across scenarios. Inmost favourable scenario, it ranges from 10% in Australia to 22% in Japan, 35% in Canada, 36-48%in Europe and 42% in the United States. Hydrogen use in other regions is negligible.
Hydrogen use would start around 2015-2020 in Europe and North America, and around 2025 inthe other regions. This relatively narrow window in which uptake begins in various regions suggeststhat favourable conditions for hydrogen introduction exist in different economies and geo-politicalareas. Hydrogen is an option of interest for most OECD countries and large, rapidly growing developingcountries with limited indigenous oil resources. Differences in hydrogen penetration across regionsmay be explained by different economic conditions, discount rates, availability of infrastructure,citizen attitude to investment in capital-intensive technologies, energy and fuel taxes, and mobilityneeds. In absolute terms, hydrogen use in the OECD Pacific appears to be significantly lower thanin the other OECD regions. In terms of per capita use, the difference is much smaller. However, thedifference can be explained by the lower energy intensity in key countries of the OECD Pacific area(notably Japan) and the lower annual car-mileage, which does not favour investment in capital-intensive technologies such as FCVs. Current per capita oil product use in North American is a factorof 2.2 to 2.6 times higher than in the OECD Europe and OECD Pacific regions.
Uncertainties, challenges and opportunities
Hydrogen and fuel cells can play a role in the energy sector under a range of future conditionsthat are subject to significant uncertainties. There are three key areas of uncertainty: economicdevelopments, energy policies and market conditions; the future rate of development of hydrogentechnologies; and competing options to meet policy targets.
A limited number of factors have a positive effect on the future use of hydrogen, while most of themhave a negative effect. The sensitivity analysis indicates a maximum variation of ±80% in hydrogen ifindividual drivers are varied. Factors with a major impact are: climate change and energy-security policies;future FCV costs and performance; the severity of the chicken-or-egg transition problems; the timelydevelopment of centralised hydrogen production and distribution infrastructure; and consumers’ criteriafor buying cars. Changes in the future oil supply (quantities and prices) are also of primary importance.Competing technologies also play an important role, but their effect is less sensitive to their technicalcharacteristics. Also, specific measures aimed at enhancing the security of supply do not have a majorimpact if substantial CO2 policies (i.e. CO2 reduction incentives) are in place.
However, major uncertainties concern whether and how these factors will materialise, rather thantheir individual impact on the potential of hydrogen and fuel cells. For example, internationalagreements on concerted measures to curb emissions and enhance security are difficult to achieveand very time-consuming. Similarly, the future of coal-based hydrogen and electricity cogenerationmay be affected by the feasibility, cost and social acceptance of the CO2 capture and storagetechnology. Strong developments in nuclear and renewable energy may favour hydrogen and fuelcells. However, they could also result in strong competition for hydrogen by making large-scale,cheap and CO2-free electricity and biofuels available as alternative options to mitigate emissionsand enhance energy-security.
In the transport sector, uncertainties not only concern the choice of PEMFC materials, the on-boardstorage system, and the choice between hybrid ICEVs and FCVs, but also who will bear the investmentin hydrogen production, distribution and refuelling infrastructure. At present, it is unclear what theincentive would be for oil companies and electrical utilities to invest in hydrogen infrastructure,unless clear government policy goals are established.
How fast the production of hydrogen can expand is also an important issue for the transition tohydrogen and possible promotion policies. Current cumulative FCV production stands at about600 vehicles, compared to annual car production of 50 million vehicles a year. At the moment, nocar producer has plans to mass-produce hydrogen fuelled vehicles. Producers will probably initiallyoffer a single model in a single country to explore market acceptance, and then will graduallyexpand to other regions. Experience from other technologies and industrial sectors may be of interest.The introduction of hybrid vehicles took a decade to achieve a 0.5% share of the market. The semi-conductor industry (which faces no competition) has grown at a rate of 15% per annum over theperiod 1960-2000. At such a high growth rate, the fuel cell car market would increase from 0.5%to 30% in 30 years.
How fast the production volume will grow is important for technology learning and the rate ofcost reduction, which in turn affects the setting of promotion policies. Should hydrogen introductionbe supported by public incentives in the early market phases, the level of the required financialsupport will depend strongly on how rapidly costs can decline.
The analysis of uncertainties suggests that solving technical issues alone will not be enough to bringhydrogen and fuel cells to the market. In addition, the timely achievement of the most ambitious targetsfor technology development (performance and cost reduction) appears to be an essential condition fortheir success. Delays in technical progress could result in other technologies that are closer to commercialmaturity “locking-in” their market position at the expense of hydrogen and fuel cells.
Current public spending on hydrogen and fuel cells RD&D (USD 1 billion a year) is substantial whencompared to the total annual public budget for energy RD&D of around USD 8 billion. Nevertheless,present efforts are small in comparison with the investment that will be needed to support the
OVERVIEW 29
30 PROSPECTS FOR HYDROGEN AND FUEL CELLS
introduction of hydrogen technologies in the energy market. This would imply a landslide changein government energy policy priorities, with a dominant emphasis on technology innovation. In anideal world, governments should first establish credible and durable energy-security and environmentpolicies and targets, without which no reason exists to switch to hydrogen. They should then fosterthe establishment of international standards for hydrogen and fuel cells in close consultation withindustry, promote infrastructure investment and provide incentives for consumers to adopt newtechnologies. Government procurement programmes (e.g. for car fleets) to promote niche marketsand technology learning should also be an important part of government’s policy strategies. Thepast trends in energy RD&D budget run contrary to the need for increased efforts. Governmentenergy RD&D budgets have been falling in recent decades, with total energy RD&D expenditurein 2002 of just under USD 8 billion, just 50% of the 1980 value in real terms.
In the transportation sector, the current private RD&D investment exceeds public investment.However, industrial strategies differ considerably. DaimlerChrysler and Ford rely on Ballard fuel cellswhile General Motors, Honda and Toyota are developing their own fuel cells. GM is developing theskateboard chassis FCV concept. DaimlerChrysler is focusing on fuel cell vehicles and bus test fleets.Nissan is already leasing FCVs to private customers for demonstration purposes and Honda is aimingto do so by the end of 2005. Ford and Mazda Motor Co are simultaneously working on hydrogenICE vehicles. BMW is working on hydrogen ICEs with fuel cells used for the auxiliary power units.Toyota is following a phased approach, first commercialising its hybrid vehicles and subsequentlyaiming to integrate fuel cells into the hybrid concept. A number of other car companies focus notonly on hydrogen, but also on other solutions such as biofuels (e.g. Volkswagen and Peugeot-Citroën).Several new players are trying to enter the car market based on the revolutionary fuel cell enginetechnology. The initial target for market introduction in 2004 has subsequently been moved to2010. Some major car makers are now talking about introduction after 2012 and other companiesenvisage commercialisation after 2020. This suggests that achieving the target of replacingconventional vehicles and fuels to curb emission and improve energy-security is a more challenginggoal than originally expected, and that different visions exist on how to get there.
The discussion of hydrogen and fuel cell technologies shows a wide range of possible options, frommarket-ready solutions to theoretical concepts. While selecting winners is premature, identifyingtechnologies that may become important in the short-term, as well as those that are further away frommarket introduction, is an important component of the process for setting RD&D priorities and investment.
There are low-risk/low-reward options such as natural gas reforming and water electrolysis, coalgasification, high-pressure gaseous storage, improved fuel cell balance of plant costs andmanufacturing technologies, hydrogen burners for gas turbines, and hydrogen ICEs. What thesetechnologies may offer and their possible development is rather well documented. There are alsotechnologies with larger margins for improvement, such as new materials for PEM membranes andcatalysts. There are also technologies that will potentially have a broader impact, not just on hydrogenand fuel cells (e.g. CO2 capture and storage). A different category is the high-risk/high-rewardtechnology options, such as photo-electrolysis, biological production of hydrogen, water splittingusing nuclear heat and the S-I cycle, on-board solid storage options, and new fuel cell concepts. Ifsuccessful, some of these options may represent major breakthroughs in energy technology withtremendous impacts on future applications of hydrogen and fuel cells, and on the overall energysystem. At present, most of these options are in a very early stage of development and the dataavailable on their potential development and costs do not allow a quantitative analysis to beconducted. Therefore, they have not been included in this study. However, a balanced RD&Dinvestment strategy based on costs/benefit analyses should take into account these technologyoptions, despite their very early stage of development.

Taking a slightly broader view on the potential of RD&D investment in hydrogen and fuel cells, itshould be noted that the relevant RD&D work does not need large single investments such assome centralised energy technologies (e.g. nuclear). As a consequence, RD&D activities are currentlycarried out in a number of small and large, public/private laboratories and research organisations.In principle, with such a huge number of opportunities and economic attractiveness, some technologysolutions could already be in the infancy stage of their development, or even available in industriallabs, pending patent applications or in the expectation of a future market start-up. In addition,many aspects of hydrogen and fuel cell RD&D deal with developments in solid state physics andmaterials science. These booming disciplines promise tremendous advances with potentially broaderimpact on technology, including unexpected and pleasant breakthroughs in hydrogen and fuel cells.
OVERVIEW 31

Chapter 1.INTRODUCTION
The role of hydrogen and fuel cells
Security of energy supply, high oil prices and growing emissions of greenhouse gases continue topose unresolved challenges for the global economy and the climate of the planet. Oil and, to alesser extent, natural gas supplies will come increasingly from the OPEC countries. To meet projectedgrowth in oil demand, OPEC will have to increase its oil production from 28.2 million barrels perday in 2002 to 64.8 million barrels per day in 2030 (IEA, 2004a), resulting in OPECs share of oilsupply exceeding half of global demand in 2030. Over the same period OECD oil production willalmost halve. The increased dependence on imported oil will clearly reduce the supply security andcreate continued upward pressure on oil prices.
While oil prices and supply security represent immediate or short-term issues for the global economy,the impact of climate change is a possible mid- to long-term challenge with unprecedentedimplications for the environment and the economy. Emissions of greenhouse gases have beenconstantly growing over the past years, despite mitigation efforts, and are projected to continuouslyincrease over the next decades if current trends in energy policy, supply and use continue.
Consensus exists in the international community that urgent actions are needed to face short-termenergy security problems and pave the way to the mitigation of future climate change, and thatenergy technology and policy are part of the solution. Increased energy efficiency and conservation,and the development of new technologies will be central to reducing our dependence on hydrocarbonsand the resulting emissions. There is no energy technology “silver bullet”, however. No one technologypromises to hold the solution to all problems in itself, and all options will need to be carefullyexplored. Considerable technology advances and even breakthroughs are needed in a number ofdomains to achieve cost-effective renewables such as photovoltaic and biomass, acceptable nuclearwaste management, low-cost CO2 capture and storage for fossil fuels, and – not least – efficientenergy end-uses, particularly in transport and residential uses.
Hydrogen and fuel cell technologies promise considerable benefits in terms of reducing greenhousegas emissions and potentially improving the security of energy supply. However, before they canenter the market in any meaningful way, they will require significant technological breakthroughsand lower costs. Potential synergies exist among different research and development (R&D) domains.For example, cost–effective techniques for CO2 capture and storage are critical to the productionof nearly CO2-free hydrogen from fossil fuels. This would allow coal to become a large source ofcheap and clean hydrogen. Similarly, in the long-term, cheap renewable energy could open theway to low-cost hydrogen production. In recognition of these multiple targets, and the complexityof any potential solution, no single energy source or technology should be ruled out at this stage.If the challenges to the global economy and climate are to be met, public budgets for energytechnology R&D should be increased and the most promising areas of research given a boost.
Hydrogen is a clean gaseous energy carrier. Unlike hydrocarbons, it does not occur naturally in anysignificant quantities. Hydrogen can be produced from a wide range of energy sources such ascoal, natural gas, nuclear and renewable energy. It could be used in many stationary and mobileenergy applications. Recent technology advances have increased attention on the use of hydrogenand fuel cells as a substitute, or complement, to oil-based fuels and internal combustion engines
1. INTRODUCTION 33
34 PROSPECTS FOR HYDROGEN AND FUEL CELLS
in transport. Hydrogen can be used in highly efficient fuel-cell vehicles (FCVs). Critically, dependingon the characteristics and overall efficiency of the well-to-wheel energy chain, a transportationsystem based on hydrogen FCVs could result in dramatic reductions in oil demand and henceemissions. Reducing oil’s dominance in the transport sector and increasing the efficiency of transportvehicles could also significantly improve the security of energy supply. However, this benefit willdepend on the primary energy sources used for hydrogen production. The largest benefits wouldprobably accrue if hydrogen was produced from coal, renewable or nuclear energy sources.
In principle, a hydrogen-based energy system doesn’t result in any carbon dioxide (CO2) emissions atthe point of use. If hydrogen is used in fuel cells, or burned with pure oxygen in conventional combustionprocesses, it produces only water (H2O) as a combustion product. If burned with air, depending onthe combustion conditions, hydrogen produces nitrogen oxides. Using hydrogen in FCVs could inprinciple significantly reduce the emissions of CO2 and those of local air pollutants in the transportsector. However, the emissions of a hydrogen-based energy system depend on the primary energysource and the process used to produce hydrogen. If produced from fossil fuels via natural gas steamreforming or coal gasification, hydrogen is a nearly CO2–free energy carrier only if the carbon dioxideemerging from these processes is captured and stored. If produced by water electrolysis, the emissionsof the hydrogen production depend on the upstream process to produce electricity.
Given the limited availability of electricity generation from CO2-free sources in most regions andthat the feasibility of CO2 capture and storage technologies is currently being tested in demonstrationprojects, the potential for producing hydrogen without the emission of CO2 is currently limited.However, new technologies for producing hydrogen directly from renewable and nuclear primaryenergy sources are being actively researched and developed.
While strong synergies exist between hydrogen and fuel cells, they are not necessarily linked together.Hydrogen can fuel conventional combustion engines and turbines, while some fuel cells can use fuelsother than hydrogen. In this report, special attention is focused on the potential of fuel cells runningon hydrogen as they offer special efficiency advantages in the transport sector. They could also bean attractive option in the residential and industrial sectors, for distributed heat and power generation.
The infrastructure for hydrogen production, transportation and distribution is also a significantissue. Storing, moving and distributing hydrogen are energy intensive and expensive processesbecause of the low volumetric energy density of hydrogen compared to natural gas. To compensatefor the low energy density, hydrogen must be compressed to a high pressure, liquefied at very lowtemperature, or absorbed in solid materials. While compression and liquefaction are mature, albeitenergy-intensive and costly processes, hydrogen storage in solid materials is still a matter of activeR&D. Hydrogen transportation via pipeline is also much more expensive in terms of energy andinvestment costs in comparison to natural gas.
The large-scale production of hydrogen is an established technology. Hydrogen is currently widelyused in refinery and chemical processes. There are no established hydrogen statistics, but the totalamount of hydrogen used is thought to be around 5 EJ per year, or more than 1% of globalprimary energy demand. In addition, significant quantities of industrial gases are mixed with somehydrogen and then used in energy recovery processes. This includes coke oven gas, refinery gasand residual gas from steam crackers. However, if hydrogen is to be used for energy applicationsit will have to overcome a number of hurdles: production costs will have to fall in order to competewith other fuels; cost-effective technologies for transportation, storage, and distribution have to bedeveloped; and cheap and efficient fuel cells should be made available. Research and developmentis essential to make these technologies economically viable, while an analysis of the competingtechnology options is essential to assessing the real potential of hydrogen as an energy carrier.
Investment and targets in RD&D
In recent years fuel cells and hydrogen have received increasing attention and R&D funds. Theexpectation is that a few decades from now fuel cells and CO2-free hydrogen from fossil, renewableand nuclear primary energy sources could be entering the market and gaining a significant sharein the transport sector, as well as in the industrial, residential, and the power generation sectors.For this to occur, intense public and private research, development and demonstration (RD&D)efforts and corresponding technology breakthroughs are needed to make these technologiescommercially mature. Driven by recent technical advances and the need to mitigate greenhousegas emissions, OECD governments have intensified their RD&D efforts on hydrogen and fuel cells.
The IEA has recently published a review of the RD&D programmes for hydrogen and fuel cells inIEA countries (IEA, 2004b). A number of new initiatives are increasing the global public RD&Dinvestment for hydrogen and fuel cells. At the end of 2004 the public spending amounted to someUSD 1 billion a year and represented some 12% of all public energy RD&D1. The initiatives areequally distributed in the three OECD areas, Asia-Pacific, Europe and North America. More thanhalf of these funds are being spent on fuel cells, while the rest is going towards technologies toproduce, store, transport and use hydrogen (including technologies other than fuel cells, such asinternal combustion engines and turbines fuelled by hydrogen).
Government-funded research is indispensable as a catalyst for the development process. However,public research is not the dominant part of the global effort on hydrogen and fuel cells. Privatesector investment by major oil and gas companies, vehicle producers, electrical utilities, powerplant constructors, and a number of players in the current hydrogen and fuel cell market is thoughtto be considerably larger.
This global effort is expected to continue in the coming years, as many countries have plannedmulti-year investments. The United States has a USD 1.7 billion programme over five years, whilethe 6th Framework Programme of the European Commission over the period 2002-2006 plans upto EUR 2 billion for renewable energy RD&D, including hydrogen and fuel cells. Japan has pledgedmore than JPY 30 billion a year, and other multi-year programmes are in place in other majorOECD and developing countries. Government RD&D efforts and long-term commitments arecomplemented by international co-operation initiatives. Most of the 26 IEA countries are involvedin the IEA Hydrogen Co-ordination Group and the IEA Implementing Agreements. OECD and non-OECD countries such as Brazil, China, India, Iceland and Russia also co-operate within the contextof the International Partnership for Hydrogen Economy (IPHE). The European countries collaboratewithin the European Technology Platform for Hydrogen and Fuel Cells, a cluster of public/privateRD&D initiatives within the European Commission’s Framework Programme.
National activities range from large integrated government-funded programmes to smaller strategieswith multiple public and private initiatives. Many countries that are closely involved in hydrogenand fuel cell development have set specific RD&D and market deployment targets. For example:
● Canada’s programme is delineated in 3 phases. Phase 1 (R&D, Demonstration and early Deployment:5 years) aims to support industry’s pre-commercial efforts, reduce costs, begin infrastructuredevelopment, develop codes and standards, and educate staff and users. Phase 2 (Broader Deployment:
1. INTRODUCTION 35
1. This global public spending does not emerge from current statistics for energy RD&D, because efforts to produce hydrogen from fossil,nuclear and renewable sources are accounted for in the RD&D budgets for these energy sources . Similarly, fuel cell RD&D is included inthe relevant RD&D budget for the end-use technology.
36 PROSPECTS FOR HYDROGEN AND FUEL CELLS
5-10 years) aims to foster emerging technologies, expanding infrastructure and continuing RD&D.Phase 3 (Market Expansion: 10-20 years) aims for mass production and infrastructure developmenton a national level.
● Japan’s commercialisation programme also includes three phases. Phase 1 (2002-2005) willfocus on the demonstration of automotive and stationary fuel cells, development of codes andstandards, and soft infrastructure. Phase 2 (2005-2010) will focus on the Introduction Stage,with the development of a supply system and the accelerated introduction of fuel cell vehicles.Phase 3 (2011-2020 and beyond) will focus on the Diffusion Stage, with the private sectorpromoting “self-sustaining growth” in the fuel cell market and fuel supply system.
The ambitious commercialisation goals these programmes set provides an idea of the currentexpectations about hydrogen and fuel cell development and the urgent need for RD&D progressif these goals are to be met. Significant differences also emerge in regional policies and targets.
In Japan, the commercialisation target by the end of the Introduction Stage (2010) is 50 000 fuelcell vehicles and 2.2 GW of stationary fuel cells. By the end of the Diffusion Stage (2020) thetarget is 5 000 000 FCVs, 4 000 hydrogen stations and 10 GW of stationary fuel cells. Japaneseexpectations also include 15 million FCVs running in the country in 2030 and 12.5 GW of stationaryfuel cells. These targets require a considerable improvement in technology performance and costreductions. The goal is to make available by 2020 FCVs with a cruising range of 800 km (7 kg H2
storage) and a system cost of USD 35/kW. The target production cost for hydrogen (excludingtaxes) is USD 34/GJ by 2020, equivalent to the current gasoline price including taxes.
A demonstration project with about 60 FCVs and 10 hydrogen stations is ongoing in the Tokyo-Kanagawa area (METI, 2005a, 2005b). Japan is also aiming to develop a two-wagon fuel celltrain with a capacity of 140 passengers per wagon. With a power of 800 kW and a fuel cell durabilityof 40 000 hours, the train would operate at a maximum speed of 130 km/h. The challenge is toreduce the cost of such fuel cell drive system to the same level as that of diesel train engines, i.e.USD 90/kW. The focus for stationary fuel cells is on cogeneration systems for household use.Stationary, natural gas polymer electrolyte membrane (PEM) fuel cell systems have been installedat 33 locations in Japan. The best power efficiency was more than 32%. These systems also achieve40-50% heat recovery efficiency. The target price of such systems would be less than USD 4 500/kW,which implies a significant cost reduction from current manual manufacturing. Preliminaryassessments indicate a potential cost reduction of a factor of 10 based on mass production.A large-scale demonstration programme of more than 2 000 units is currently under way and thedevelopment of a mass production by 2008 is being considered.
The Republic of Korea has also announced plans for fuel cell commercialisation. Korea aims tohave 10 000 FCVs, 500 fuel cell buses, 50 hydrogen refuelling stations, 300 fuel cell units fordistributed power generation (250-1000 kW) and 2 000 units for residential use (10-50 kW) by2012.
The United States Department of Energy (US-DOE) envisions a phased transition to hydrogen, witha commercialisation decision in 2015. In the US programme (US-DOE, 2005), the success is broadlydefined as validation by 2015 of technologies for:
● Hydrogen production at competitive costs with gasoline and no adverse environmental impact.
● Hydrogen storage for more than 300-mile vehicle range with affordable cost.
● Fuel cell vehicle engines at less than USD 50/kW and stationary power systems at USD 400-700/kW,with appropriate durability.
While the full extent of hydrogen benefits will not be achieved for decades, meeting these requirementsin 2015 would enable industry to move towards the commercialisation of hydrogen fuel cell vehiclesand the development of the needed infrastructure, and would begin to yield benefits as early as 2025.
Specific targets have been identified in the US-DOE programme (Table 1.1) to measure the RD&Dprogress. These targets are continuously revised in accordance with the lessons being learnt from ongoingRD&D activities. For example, in 2004, the US-DOE decided to abandon its programme of on-boardreforming. Similarly, the targets for FCVs start-up time (less than 1 minute) and start-up energy (lessthan 2 MJ for a 50 kW system) could not be met and were abandoned (US-DOE, 2004).
1. INTRODUCTION 37
Table 1.1
Targets in the US RD&D programme
Hydrogen production
2010 • Distributed production from natural gas at USD 1.50/kg (USD 12.5/GJ) delivered at pump, excl. tax,no CO2 capture and storage.
• Grid-connected distributed electrolysis at USD 23.8/GJ delivered.2015 • Distributed production from biomass-derived liquids at USD 20.8/GJ delivered, excl. taxed.
• Centralised production from renewable sources at USD 22.9 /GJ delivered. • Production from biomass at USD 13.3/GJ at the plant gate and USD 21.7/GJ delivered.• Develop and verify the long-term economic feasibility of hydrogen production from photo-electro-chemical
and biological processes. • Develop solar-driven, high-temperature thermo-chemical production at USD 25/GJ and at USD 33.3/GJ
delivered.
Hydrogen delivery
2010 • Delivery from centralised production facilities to refuelling stations at less than USD 7.5/GJ and compression,storage and dispensing at refuelling stations/stationary facilities at less than USD 6.7/GJ.
2015 • Delivery from producer to end-users (mobile or stationary use) at less than USD 8.3/GJ.
Hydrogen storage
2010 • On-board hydrogen storage systems achieving 2 kWh/kg (6 wt %), 1.5 kWh/L and USD 4/kWh (USD 1110/GJ).2015 • On-board hydrogen storage systems achieving 3 kWh/kg (9 wt %), 2.7 kWh/L and USD 2/kWh (USD 555/GJ).
Fuel cells
2010 • Durable, direct hydrogen fuel cell system for transportation (60% peak-efficient) at USD 45/kW.• PEM fuel cell for distributed generation systems (natural-gas or LPG fuelled, 40% electrical efficiency
and 40 000-hours durability) at USD 400-750/kW.2015 • Durable, direct hydrogen fuel cell system for transportation (60% peak-efficient) at USD 30/kW.
Technology validation
2008 • Wind turbine-powered electrolysers (65% efficiency, incl. 5 000 psi compression) at USD 400/kWe(for 1,000 units).
2009 • Hydrogen vehicles with a range exceeding 250 miles and 2 000-hour fuel cell durability.• Hydrogen infrastructure with production cost of less than USD 25/GJ excl. tax.
2011 • Integrated biomass, wind and geothermal electrolyser hydrogen production systems at USD 21.5/GJat the plant gate excl. tax.
2015 • Hydrogen vehicles with 300+ km range and 5 000-hour fuel cell durability.• Hydrogen production cost of USD 12.5/GJ excl. tax.
Source: US-DOE, 2005.
38 PROSPECTS FOR HYDROGEN AND FUEL CELLS
The European Union development plans aim for hydrogen to represent 2% of the total transportationfuel by 2015 and 5% by 2020. Some 2 000 FCVs are expected to be running throughout Europeby 2012-2015, with commercialisation in the period 2015-2020 (EC, 2004). The goal also is toinstall 5 MW of stationary fuel cells by 2005-2006, 30 MW by 2006-2008 and 200 MW by 2009-2010. This is in addition to 200 MW micro-CHP residential fuel cell systems (<5 kW) and 400 MWof industrial CHP systems by 2015-2020. The industrial systems should be commercialised from2012-2015 and the micro-CHP systems from 2015-2020.
The European Commission is also implementing ambitious voluntary agreements with carmanufacturers to reduce CO2 emissions in the transport sector. These agreements could also helpaccelerate the development and commercialisation of hydrogen FCVs. To meet the target of theupcoming EU legislation, European, Japanese and Korean car manufacturers have committed toreduce CO2 emissions from new passenger cars to an average of 140 grams per kilometre (g/km)in 2008 (2009 for Asian cars). The deal was sealed by ACEA, the European automotive industryassociation, in a voluntary agreement signed with the Commission in 1999. The ultimate objectiveis to reduce emissions to 120 g/km in 2012. Hydrogen FCVs could play a significant role in meetingthese targets, as they have a considerably higher efficiency than internal combustion engines (ICEs)and zero tailpipe emissions.
In 2003 European car manufacturers sold the lowest emission cars, at just 163 grams of CO2
emitted on average per km. In comparison, Japanese cars sold in Europe emitted an averageof 172 g/km and Korean cars 179 g/km. On average, CO2 emissions from new passengercars sold in the EU-15 decreased by 11.8% between 1995 and 2003. This represents animportant improvement. However, the new targets set for 2008-2009 seem to be extremelychallenging.
The interest in hydrogen is not limited to the OECD countries. Brazil, China, India and Russia arealso committed to hydrogen and fuel cells development. China is aiming to introduce hydrogenfuel cell buses as a demonstration project at the Beijing Olympic Games in 2008, and to initiatea mass production of fuel cell vehicles from 2010 onward (Ouyang, 2004).
The importance of technology learning
The cost of new technologies generally decreases significantly when moving from the demonstrationphase to the market introduction phase. However, because of the low level of initial demand andhence production, this cost is in general still high in comparison with the costs of maturetechnologies. A further gradual but significant cost reduction usually occurs as the market expandsand demand grows. This process, known as “Technology Learning”, is a result of various mechanisms.Initially, RD&D-driven technology improvements play a key role, while the shift from labour-intensiveto capital-intensive (automated) production results in further cost reductions. Finally, economiesof scale due to mass production (learning by doing) continue to lower costs. This pattern hasbeen observed for many technologies (IEA, 2000) and will be of vital importance for hydrogenand fuel cells, as their costs are currently not competitive with existing technologies. For example,the cost of current demonstration fuel cell vehicles (FCV) is estimated to be in the order of a fewthousand USD per kW for a 75 kW system (complete drive system). Car manufacturers are fairlyconfident that technology learning should be able to bring the cost down quickly, by at least oneorder of magnitude. However, not even a fuel cell system cost of a few hundred USD per kW,including hydrogen storage, would be competitive with current internal combustion engine vehicles(USD 30-50/kW).
While cost reductions will occur, there is considerable debate as to the potential magnitude of thecost reduction and the pace at which this would be achieved. Previous IEA studies have shownthat learning rates vary considerably across different technologies and that they can vary overtime for individual technologies. A detailed assessment of cost reduction mechanisms and theconsequences of uncertainties for investment costs is needed to arrive at the most robust estimatesof the potential cost reductions for hydrogen and fuel cells.
Background and scope of this study
The previous discussion emphasises that successful research and development are critical to makinghydrogen and fuel cells available at a competitive cost within a reasonable time, and that significantuncertainties surround these developments. A consideration of the role of alternative technologyoptions and energy policies to mitigate emissions and ensure energy supply is essential to assessthe real potential of hydrogen as an energy carrier. This study offers a quantitative assessment ofthe possible role of hydrogen and fuel cells in energy scenarios for the next few decades, buildingon consensus stakeholder assumptions on future developments for energy technologies and policies.It includes quantitative estimates of the costs and benefits, and looks at the policy issues associatedwith the use of hydrogen and fuel cells in energy applications.
The study focuses on three principal objectives:
● Quantifying prospects for technical improvement and cost reduction for hydrogen and fuel cells.
● Exploring technical, economic and policy issues for a transition to a hydrogen energy system.
● Analysing the long-term perspectives of a fully developed market for hydrogen and fuel cells.
It aims to address topics and questions such as:
● What are the promising technologies for hydrogen production, storage and use?
● Is transport the most attractive market for hydrogen and fuel cells?
● The role of hydrogen in stationary applications.
● The policies and measures to speed up the commercialisation of hydrogen.
● What are the transition costs and infrastructure investment?
● What impact hydrogen and fuel cells might have on CO2 mitigation?
● What impact hydrogen and fuel cells might have on the security of energy supply.
● Policies and potential market penetration of hydrogen and fuel cells in various regions.
The study has been carried out using the IEA Energy Technology Perspectives (ETP) model. This is aMARKAL-type model (Loulou et al., 2004; Tosato, 2005) of the global energy system that wasdeveloped at the IEA (Gielen and Karbuz, 2003 and IEA, 2004c) to analyse technology policies andto support decision making in the energy sector. The model includes: 15 world regions with energytrading between regions, a detailed description of the energy system in each region, with energydemand and supply, fuels, carriers and technologies; a database with more than 1500 demand/supplytechnologies with performance, costs, emissions; and a proper characterisation of technology learningfor emerging technologies. Given the energy systems and technology mix in the base year, themodel analyses their evolution over a time horizon to 2050 and provides cost-optimal configurationsunder selected assumptions for energy policies and technology development.
This study was conceived within the framework of the activity of the IEA Hydrogen Co-ordinationGroup (HCG). The Group was established at the beginning of 2003 to co-ordinate hydrogen and
1. INTRODUCTION 39
40 PROSPECTS FOR HYDROGEN AND FUEL CELLS
fuel cell policy and R&D efforts across IEA Member countries. As part of this effort, the IEA published,after input from HCG members, a review of the R&D activities and policies in IEA member countries(Hydrogen & Fuel Cells - Review of the National R&D Programmes [IEA, 2004b]). Using the expertiseavailable in the IEA Implementing Agreements, namely the Hydrogen and the Advanced Fuel CellsImplementing Agreements, the HCG has also carried out a review of the priorities and gaps inhydrogen and fuel cells R&D.
In order to provide policy makers with an insight into the potential of hydrogen and fuel cells infuture energy scenarios, the HCG asked the IEA Secretariat to carry out this study using the IEAETP model. The work was financially supported by ten HCG countries: Australia, Austria, Canada,France, Germany, Japan, the Netherlands, Spain, the United Kingdom and the United States. Afirst draft of this report was extensively discussed by member country representatives and internationalexperts at the ad-hoc workshop organised by the IEA on 28-29 June 2005.
The goal of this study is to provide quantitative information to policy makers about the currentstate of hydrogen and fuel cell technologies, their current costs, their potential cost reductions andthe role these technologies could play in the future under a wide range of assumptions. The purposeof the study is not to forecast what is likely to happen in the future, but to help policy makers tomake informed decisions on energy and technology policies, and shape the future of hydrogenand fuel cells.
This report consists of two parts. The first part, comprising Chapter 2, 3 and 4, includes an assessmentof the cost and performance of hydrogen and fuel cell technologies, along with prospects for theirfuture development. These chapters offer a very detailed overview of the range of hydrogen andfuel cell technologies, the key RD&D areas, and potential areas of future development. Chapter 2deals with hydrogen production, transportation, distribution and storage technologies. Chapter 3focuses on fuel cells and hydrogen end-uses technologies, while Chapter 4 discusses competingtechnology options. The second part of the study, comprising Chapter 5, 6, 7 and 8, deals with theresults of the model analysis. Chapter 5 describes the structure of the analysis and includes adiscussion of two basic scenarios that define the energy context. They depict the reference, business-as-usual development of the energy system (BASE scenario), and map key technologies and parametersfor hydrogen and fuel cells (MAP Scenario). Chapter 6 discusses the results of a sensitivity analysisaimed at quantifying the effect of varying individual parameters and assumptions for technologyand policy. Chapter 7 presents the results of four different scenarios. These scenarios are based ondifferent combinations of key parameters and assumptions, and represent four cost-optimalconfigurations of future energy systems including hydrogen and fuel cells under different conditionsand assumptions. Chapter 8 is the final chapter and discusses the conclusions of the study.
Prospects for Hydrogen and Fuel Cells is the second publication of the IEA Energy Technology Analysisseries. The first, Prospects for CO2 Capture and Storage, was published in December 2004(IEA, 2004c).
2. HYDROGEN TECHNOLOGIES 41
Chapter 2.HYDROGEN TECHNOLOGIES
This chapter provides an assessment of the technical and economic characteristics of the technologiesfor hydrogen production, transportation, distribution and storage. Chapter 3 provides similar technicaland cost information for fuel cells and other hydrogen end-use technologies. These chapters areessential reading to understand the range of hydrogen technologies on offer, their performanceand costs, key RD&D areas and other potential developments. The data presented in Chapter 2and Chapter 3 have been used to quantitatively assess hydrogen potentials using the IEA ETP model.
H I G H L I G H T S
■ Hydrogen can contribute to the security of energy supply because in principle it can beproduced from any primary energy source, using a number of different processes. Hydrogencan also be a CO2-free energy carrier and offer benefits in terms of emission mitigationif it is produced from coal and gas with CO2 capture and storage, from renewable energy,or from nuclear energy.
■ Some 40 million tonnes of hydrogen a year are currently produced using establishedtechnologies, primarily natural gas reforming but also coal gasification and waterelectrolysis. However, to produce cost-effective hydrogen for energy use, these technologiesneed higher efficiencies, significant cost reductions and the development of cheap andsafe techniques for CO2 capture and storage.
■ Research efforts are focused on high-efficiency gas reforming, coal gasification in integratedgasification combined-cycle (IGCC) plants for the co-production of electricity and hydrogen,and electrolysis at high temperature and pressure. The large-scale centralised hydrogenproduction from natural gas and coal require further RD&D efforts, especially to make availablecheap and safe techniques for CO2 capture and storage. A number of emerging technologiessuch as water splitting using solar and nuclear heat, biomass gasification, photo-electrolysisand biological processes are also being developed, but are still far from being commercialised.
■ In the early market introduction phase, decentralised small-scale electrolysis and naturalgas reforming (without CO2 capture and storage) appear as the technologies of choiceto produce hydrogen as they do not require expensive distribution systems. However,decentralised plants have in general lower efficiency and higher costs than those ofcentralised plants. Also, capture of CO2 emissions in small-scale reformers is not likely tobe feasible. Electrolysis is even more expensive than natural gas reforming. In addition,the surplus of CO2-free electricity for hydrogen production will probably be limited to afew regions even in the long term.
■ Currently, the cost of decentralised hydrogen production may exceed USD 50/GJ H2. Whilesensitive to electricity prices and natural gas prices, the cost of decentralised hydrogenproduction from electrolysis may be reduced to below USD 20/GJ H2 by 2030 and thatof natural gas reforming to below USD 15/GJ H2. Various centralised production optionspromise hydrogen at less than USD 10-15/GJ H2. The projected cost of hydrogen from
42 PROSPECTS FOR HYDROGEN AND FUEL CELLS
coal gasification with CO2 capture and storage could be even lower, at below USD 10/GJ H2.In the long term, the costs for high-temperature water splitting could range from USD10/GJ H2 to USD 20/GJ H2 using nuclear and solar heat, respectively. Higher costs areprojected for other advanced technologies.
■ Hydrogen can fuel combustion engines and turbines, but it offers its full benefits interms of energy efficiency, CO2 and pollutants emissions when used in fuel cells. The useof hydrogen in fuel cell vehicles could solve both the problem of oil-dependence andemissions in the transport sector. Stationary uses for combined heat and power productionare also potential applications for hydrogen fuel cells, but non-hydrogen fuel cells appeara more competitive option in this market segment.
■ The global character of the car industry is such that standards for hydrogen production,distribution, storage, safety and quality need to be established before a full-scale hydrogeninfrastructure is developed. The identification of a suitable and cost-effective on-boardstorage system for fuel cell vehicles is an urgent issue, as it may have an impact on thechoice of hydrogen infrastructure.
■ No existing on-board storage option meets the technical and economic requirements forcommercialisation. Gaseous storage at 350-700 bar and liquid storage at -253°C arecommercially available, but costly options. The cost of the tank ranges from USD 600-800/kg H2 and the electrical energy required for compression and liquefaction is morethan 12% and 35% of the hydrogen energy content, respectively. Solid storage offerspotentially decisive advantages, but it is still under development, with a number of materialsbeing investigated. At present, without further breakthroughs, gaseous storage at 700 barseems the technology of choice for passenger cars.
■ Where the production of hydrogen is centralised, the transportation and distribution costs,and the refuelling cost for transport vehicles, add considerably to the total hydrogen supplycost. These costs are in the range of USD 5-10/GJ /GJ H2 for large-scale supply systems,but may be higher during the initial development phase. Hydrogen transportation bypipeline is also expensive. In comparison with natural gas, hydrogen pipelines are twiceas expensive in terms of investment cost and require five times more energy. Considerablymore expensive is the transportation and distribution of liquid hydrogen.
■ The global investment in the supply infrastructure to distribute hydrogen for road transportcould be in the order of several hundred billion US dollars. If centralised production isadopted, the cost of a hydrogen pipeline supply system for the transport sector might beUSD 0.1-1.0 trillion. The incremental investment cost for hydrogen refuelling stationsover conventional stations would be somewhere between USD 0.2-0.7 trillion (for centralisedand decentralised production respectively).
■ A full hydrogen economy for both transport and stationary applications would require pipelineinvestment in the order of USD 2.5 trillion, the bulk of which would be needed to reachcommercial and residential customers. Assuming early retirement and partial replacement ofthe existing gas supply system, a significant part of this cost would be an incremental cost.
■ Despite the considerable uncertainties surrounding these estimates, the hydrogeninvestment should be seen in the light of the global investment of USD 16 trillion thatwould be required for the overall energy supply system until 2030 (IEA, 2004a). Hydrogeninvestment would add substantially to the total investment cost for the energy system,but should not be considered as a deterrent for a transition to hydrogen.
All figures in this publication are in SI units and the energy content of hydrogen is expressed in termsof the lower heating value (LHV). This means that the energy contained in the gaseous water productof combustion (the energy that is needed to evaporate the water) is not taken into account. The differenceis significant: 120 GJ/t (LHV) vs. a higher heating value (HHV) of 140 GJ/t. Using the LHV value isconsistent with the conventions used in all IEA energy statistics. It does not affect the evaluation of theoverall hydrogen energy chain. However, other studies can be based on HHV, which results in differentefficiency figures throughout the energy chain to those presented here on the basis of LHV.
Hydrogen production
Hydrogen can be produced from fossil fuels, nuclear and renewable energy by a number of processes,such as water electrolysis, natural gas reforming, gasification of coal and biomass, water splittingby high-temperature heat, photo-electrolysis, and biological processes. Of the total hydrogenproduction of about 5 EJ per year, 40% is used in chemical processes, 40% in refineries and 20%for other uses. In 2003, 48% of the global demand for hydrogen was produced from natural gas,30% from oil and recovered from refinery/chemical industry off-gases, 18% from coal, and 4%from electrolysis. Most of this hydrogen is produced on-site in refinery and chemical plants forcaptive, non-energy uses. The currently established technologies for producing hydrogen requiresignificant improvements in their technical and economic performance (efficiency and costs) ifhydrogen is to be produced for energy use. At the beginning of 2003, the price of pipeline-delivered compressed hydrogen in the United States ranged from USD 7/GJ to USD 30/GJ. Forcompressed hydrogen delivered in “tube trailers” the price was in the range of USD 90-100/GJ.
Water electrolysis and natural gas reforming are proven technologies that could be used in the earlytransition phase to hydrogen as an energy carrier. Electrolysis is a costly process used to producehigh-purity hydrogen, while the cheaper and more efficient process of gas reforming is used forlarge-scale production where quality is not such an issue. Depending on the results of R&D currentlyunderway, in the medium to long term hydrogen may be produced by natural gas reforming orcoal gasification in centralised plants with carbon dioxide capture and storage (CCS). Other hydrogenproduction processes from renewable and nuclear sources are still a long way from being commerciallyviable. The production of hydrogen from biomass faces feed preparation and logistics challenges,and is likely to be competitive only on a large scale. To be economic, thermo-chemical water splittingusing high-temperature heat needs the development of new materials for the process equipment,cost reductions, and access to cheap supplies of high-temperature heat (e.g. from nuclear or solarenergy). The production of hydrogen from photo-electrolysis (photolysis) and from biologicalproduction processes are both at an early stage of development.
At present, the production of hydrogen at both a centralised and decentralised level is being considered.However, certain feedstock and technologies are more suited to centralised hydrogen production, whileothers are more suited to decentralised production. The optimal combination of feedstock andtechnologies for centralised and decentralised production needs to be analysed in detail.
The cost of current large-scale production of hydrogen from fossil fuels at centralised facilities istoo high for hydrogen to be viable as an energy carrier. Natural gas reforming requires further RD&Din order to lower costs, increase the efficiency and enhance the flexibility of the process. Improvedcatalysts, adsorption materials, separation membranes or purification systems are also needed toproduce hydrogen that is suitable for all types of fuel-cell uses. Hydrogen production based oncoal gasification and the water-gas shift reaction is also an established technology, the cost of whichis higher than production from natural gas. Cheaper gasifiers and new oxygen production technologies
2. HYDROGEN TECHNOLOGIES 43

44 PROSPECTS FOR HYDROGEN AND FUEL CELLS
may reduce the cost of hydrogen from coal in the future. The cogeneration of hydrogen and electricityfrom coal in centralised IGCC plants with CCS has the potential to produce cost-effective, CO2-freehydrogen from coal. Ongoing CCS demonstration projects at an industrial scale are producingpromising results, but considerably further RD&D is needed (IEA, 2004c) to prove and commercialisethis technology. In the future, centralised hydrogen production from high temperature processesbased on nuclear or renewable energy could avoid the need for CO2 capture and storage. However,for centralised production to prove the most economic means of hydrogen production, cost-effectivehydrogen transportation and distribution infrastructure will need to be developed.
Today’s decentralised production of hydrogen is based on water electrolysers and small natural gasreformers. Small-scale reformers are currently commercially available, with several demonstrationprojects testing units in industrial applications. In recent years, suppliers have considerably improvedreformers’ compactness (10×3×3 m) and capacity (500-700 Nm3/hour, equivalent to 5.5-7.5 GJ/hour),but further RD&D is needed to reduce costs and increase the efficiency of production. Distributedproduction minimises the need for expensive transportation infrastructure, but this is offset to someextent by the generally higher costs per unit of capacity and lower efficiency of smaller distributedproduction plants. In addition, CCS from small natural gas reformers is probably too difficult andcostly to be feasible. In the long term, photo-electrolysis, water splitting by solar heat and biologicalprocesses could be used for decentralised hydrogen production from renewable sources.
Hydrogen from electrolysis Electrolysis is a well-known process that converts water into hydrogen and oxygen using electricity.Electrolysis opens the door to hydrogen production from any primary energy source that can be usedfor electricity generation. Currently two types of electrolysers exist: the alkaline electrolysers that useKOH solutions and the less mature polymer electrolyte membrane2 (PEM) technology. PEM electrolysersare, in simple terms, fuel cells operated in reverse mode. Alkaline electrolysis based on a KOH watersolution as a liquid electrolyte is a mature industrial technology. It is well suited to producing hydrogenfor stationary applications with operating pressures up to 25 bar. The major R&D challenges facingalkaline electrolysers are to improve their efficiency, lifetime and costs. In PEM electrolysis, the electrolyteis a solid, acidic polymer membrane and no liquid electrolyte is required. Major advantages includethe absence of the corrosive KOH electrolyte, a compact design, high current densities and highoperation pressures (up to several hundred bar). The main drawback in the current PEM systems isthe limited membrane lifetime. It is expected that the PEM electrolyser performance (in terms of cost,capacity, efficiency and lifetime) can be improved by new materials and new cell stack design. Newtechnology variants are under development, such as high temperature and high pressure electrolysers.The theoretical characteristics of different electrolysis options are given in Table 2.1.
Table 2.1
The Theoretical Efficiency of Electrolysis at Various Temperatures and Pressures
P T Theoretical Theoretical Theoretical Theoreticalelectricity use heat use total energy use overall efficiency
(bar) (°C) (GJ/GJ H2) (GJ/GJ H2) (GJ/GJ H2) (%)
1 25 0.98 0.20 1.18 84.61 1000 0.74 0.63 1.37 73.1
400 25 1.07 0.20 1.27 78.6
Source: Prince-Richard, 2004.
2. Also known as Proton Exchange Membrane fuel cells.
The theoretical maximum efficiency of electrolysers is about 85%, but current electrolysers arein general less efficient. As electricity costs are the main operating cost of electrolysers, themain RD&D target is to increase their electrical efficiency. The current efficiency of decentralisedalkaline electrolysers including auxiliaries, but excluding hydrogen pressurisation, is about 40%,while large-scale centralised systems achieve about 50% (Schuckert, 2005). Hydrogenpressurisation requires substantial amounts of electricity and its consideration will reducethe electric efficiency substantially. Other sources suggest a somewhat higher efficiency valueof 63.5% (LHV) for current 20 kg/hr (120 cars a day) decentralised electrolysers operating at11 bar, including auxiliary loads other than compression (NRC, 2004, p. 220). This significantefficiency difference (40% vs. 63.5%) may be explained by differences between working andtest conditions. The efficiency of electrolysers also depends on the current density. PEM electrolysersoperating at low current density can approach the theoretical efficiency limit. However, therequired additional capital cost currently exceeds the electricity cost savings. Lower currentdensities may become economic in the future if electrolyser capital costs decrease.
High-temperature and high-pressure electrolysis may offer efficiency advantages. Although, the heatenergy consumption of the electrolysis process slightly increases when operating at a higher temperature,the electricity requirement decreases. Therefore, high-temperature electrolysis may offer a favourableenergy balance if high-temperature residual heat is available from other processes. Steam electrolysisat 800-1000 °C may achieve high efficiency values. High pressure electrolysis can save part of theenergy required to pressurise hydrogen. The German research centre Forschungszentrum Jülich hasproduced a 5 kW high-pressure electrolyser prototype, which is able to produce hydrogen at 120 barat an efficiency similar to that of the low-pressure model (Jansen et al., 2001). The Avalance Hydrofilleris a commercially available high-pressure unipolar alkaline electrolyser that is able to reach pressuresof up to 690 bar and requires an energy input of 5.1-5.4 kWh/Nm3H2, which is equivalent to55-58% electric efficiency (Ivy, 2004). A further option is the Solid Oxide Electrolyser Cell (SOEC),based on Solid Oxide Fuel Cells (SOFCs), which normally operate at 700-1000 °C. The main R&D issuesfacing SOECs are improvements in materials and thermal stress limits in the ceramic materials. Thecharacteristics of various electrolysers are compared in Table 2.2.
The current cost of an electrolyser system capable of fuelling 120 cars a day (roughly a 700 kWsystem providing 20 kg/hr) is about USD 1 000/kW, with appropriate scaling factors to be consideredfor smaller systems (NRC, 2004, p. 220). The cost of electrolysers based on fuel cells operated in reversemode are expected to decline dramatically to some USD 125/kW over the next 15 to 20 years, asthe cost of PEM automotive fuel cells drops to USD 50-100/kW (NRC, 2004).
In terms of hydrogen production cost (USD/GJ H2), economies of scale due to larger unit capacityand higher production volume should result in hydrogen cost falling to half, or one-fifth, of today’scost (Figure 2.1). Figure 2.1 suggests that the investment cost per unit of capacity for systems ofmore than 50 cars per day are virtually constant.
The levelised capital cost of a reference decentralised electrolyser system in 2010 would amountto some USD 10/GJ H2. This is based on assuming USD 1 000/kW, annual operation andmaintenance costs of 4% of the initial capital investment, a 15 year life span and a 10% discountrate. Assuming that capital costs fall in-line with expectations in the long term to some USD 125/kW,these capital costs would drop to USD 1.3/GJ H2. In comparison, the annualised capital cost ofhigh-pressure electrolysers would amount to USD 28/GJ H2 in 2010, while the potential for reductionsin their costs over time is not clear at this stage.
Assuming an average electricity cost of USD 0.035/kWh, the electricity cost in 2010 for a 63.5%efficient electrolyser would be USD 15.4/GJ H2. Assuming an efficiency of 80% in 2030 implies
2. HYDROGEN TECHNOLOGIES 45
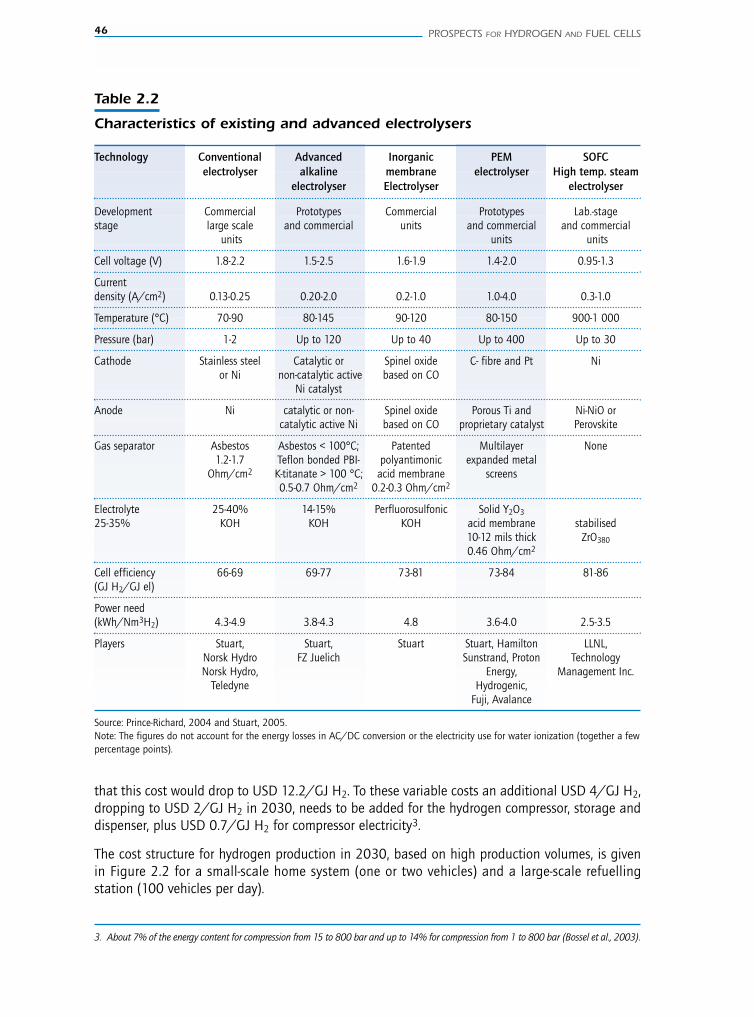
46 PROSPECTS FOR HYDROGEN AND FUEL CELLS
Table 2.2
Characteristics of existing and advanced electrolysers
that this cost would drop to USD 12.2/GJ H2. To these variable costs an additional USD 4/GJ H2,dropping to USD 2/GJ H2 in 2030, needs to be added for the hydrogen compressor, storage anddispenser, plus USD 0.7/GJ H2 for compressor electricity3.
The cost structure for hydrogen production in 2030, based on high production volumes, is givenin Figure 2.2 for a small-scale home system (one or two vehicles) and a large-scale refuellingstation (100 vehicles per day).
Technology Conventional Advanced Inorganic PEM SOFCelectrolyser alkaline membrane electrolyser High temp. steam
electrolyser Electrolyser electrolyser
Development Commercial Prototypes Commercial Prototypes Lab.-stagestage large scale and commercial units and commercial and commercial
units units units
Cell voltage (V) 1.8-2.2 1.5-2.5 1.6-1.9 1.4-2.0 0.95-1.3
Currentdensity (A/cm2) 0.13-0.25 0.20-2.0 0.2-1.0 1.0-4.0 0.3-1.0
Temperature (°C) 70-90 80-145 90-120 80-150 900-1 000
Pressure (bar) 1-2 Up to 120 Up to 40 Up to 400 Up to 30
Cathode Stainless steel Catalytic or Spinel oxide C- fibre and Pt Nior Ni non-catalytic active based on CO
Ni catalyst
Anode Ni catalytic or non- Spinel oxide Porous Ti and Ni-NiO orcatalytic active Ni based on CO proprietary catalyst Perovskite
Gas separator Asbestos Asbestos < 100°C; Patented Multilayer None1.2-1.7 Teflon bonded PBI- polyantimonic expanded metal
Ohm/cm2 K-titanate > 100 °C; acid membrane screens0.5-0.7 Ohm/cm2 0.2-0.3 Ohm/cm2
Electrolyte 25-40% 14-15% Perfluorosulfonic Solid Y2O3
25-35% KOH KOH KOH acid membrane stabilised10-12 mils thick ZrO380
0.46 Ohm/cm2
Cell efficiency 66-69 69-77 73-81 73-84 81-86(GJ H2/GJ el)
Power need(kWh/Nm3H2) 4.3-4.9 3.8-4.3 4.8 3.6-4.0 2.5-3.5
Players Stuart, Stuart, Stuart Stuart, Hamilton LLNL,Norsk Hydro FZ Juelich Sunstrand, Proton TechnologyNorsk Hydro, Energy, Management Inc.
Teledyne Hydrogenic,Fuji, Avalance
Source: Prince-Richard, 2004 and Stuart, 2005.Note: The figures do not account for the energy losses in AC/DC conversion or the electricity use for water ionization (together a fewpercentage points).
3. About 7% of the energy content for compression from 15 to 800 bar and up to 14% for compression from 1 to 800 bar (Bossel et al., 2003).
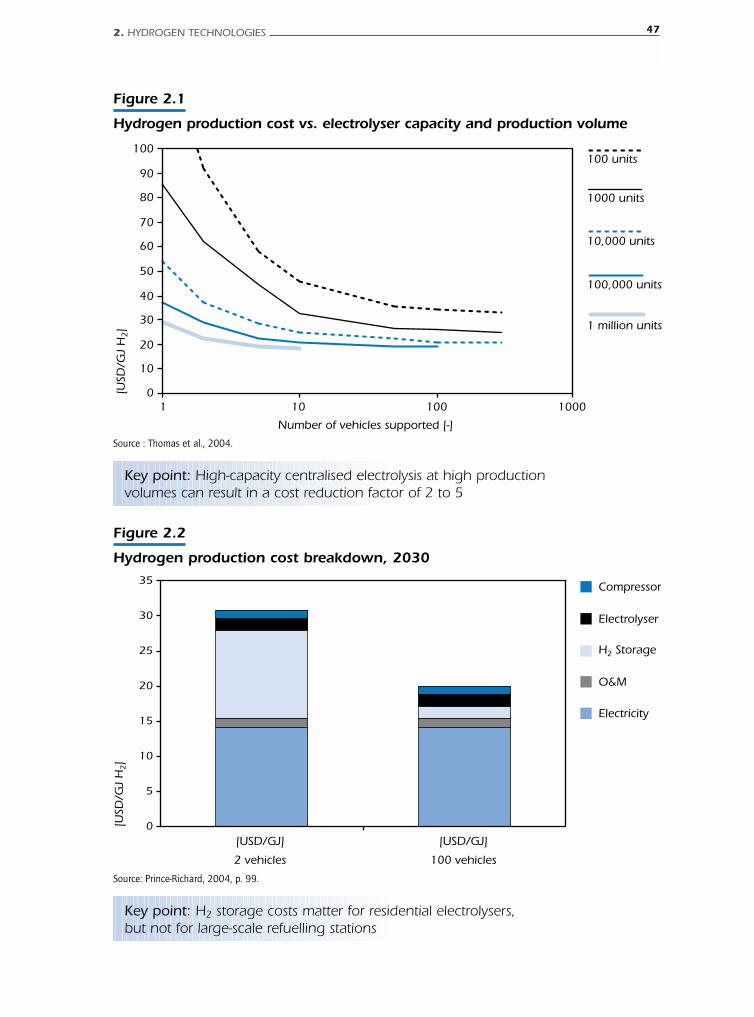
2. HYDROGEN TECHNOLOGIES 47
Figure 2.1
Hydrogen production cost vs. electrolyser capacity and production volume
0
10
20
30
40
50
60
70
80
90
100
1 10 100 1000
Number of vehicles supported [-]
[USD
/GJ
H2]
100 units
1000 units
10,000 units
100,000 units
1 million units
Key point: High-capacity centralised electrolysis at high productionvolumes can result in a cost reduction factor of 2 to 5
Source : Thomas et al., 2004.
Figure 2.2
Hydrogen production cost breakdown, 2030
[USD
/GJ
H2]
0
5
10
15
20
25
30
35
[USD/GJ][USD/GJ]
100 vehicles2 vehicles
O&M
H2 Storage
Electrolyser
Compressor
Electricity
Key point: H2 storage costs matter for residential electrolysers,but not for large-scale refuelling stations
Source: Prince-Richard, 2004, p. 99.
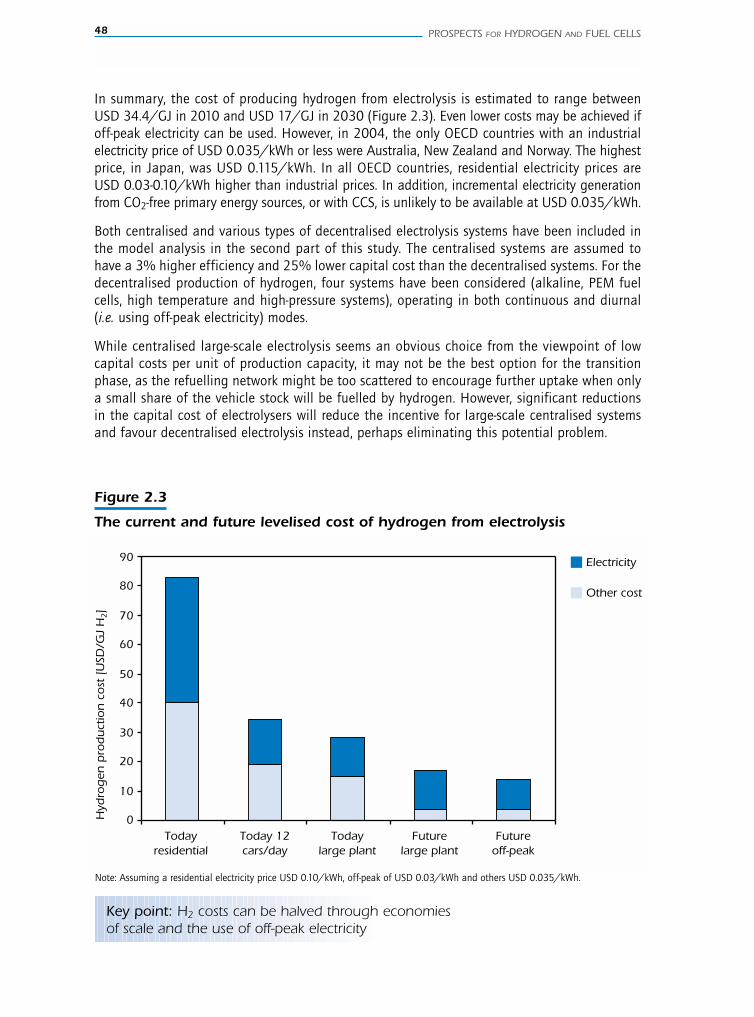
48 PROSPECTS FOR HYDROGEN AND FUEL CELLS
In summary, the cost of producing hydrogen from electrolysis is estimated to range betweenUSD 34.4/GJ in 2010 and USD 17/GJ in 2030 (Figure 2.3). Even lower costs may be achieved ifoff-peak electricity can be used. However, in 2004, the only OECD countries with an industrialelectricity price of USD 0.035/kWh or less were Australia, New Zealand and Norway. The highestprice, in Japan, was USD 0.115/kWh. In all OECD countries, residential electricity prices areUSD 0.03-0.10/kWh higher than industrial prices. In addition, incremental electricity generationfrom CO2-free primary energy sources, or with CCS, is unlikely to be available at USD 0.035/kWh.
Both centralised and various types of decentralised electrolysis systems have been included inthe model analysis in the second part of this study. The centralised systems are assumed tohave a 3% higher efficiency and 25% lower capital cost than the decentralised systems. For thedecentralised production of hydrogen, four systems have been considered (alkaline, PEM fuelcells, high temperature and high-pressure systems), operating in both continuous and diurnal(i.e. using off-peak electricity) modes.
While centralised large-scale electrolysis seems an obvious choice from the viewpoint of lowcapital costs per unit of production capacity, it may not be the best option for the transitionphase, as the refuelling network might be too scattered to encourage further uptake when onlya small share of the vehicle stock will be fuelled by hydrogen. However, significant reductionsin the capital cost of electrolysers will reduce the incentive for large-scale centralised systemsand favour decentralised electrolysis instead, perhaps eliminating this potential problem.
Figure 2.3
The current and future levelised cost of hydrogen from electrolysis
0
10
20
30
40
50
60
70
80
90
Today residential
Today 12 cars/day
Today large plant
Future large plant
Future off-peak
Hyd
rog
en p
rod
uct
ion
co
st [
USD
/GJ
H2]
Electricity
Other cost
Key point: H2 costs can be halved through economiesof scale and the use of off-peak electricity
Note: Assuming a residential electricity price USD 0.10/kWh, off-peak of USD 0.03/kWh and others USD 0.035/kWh.
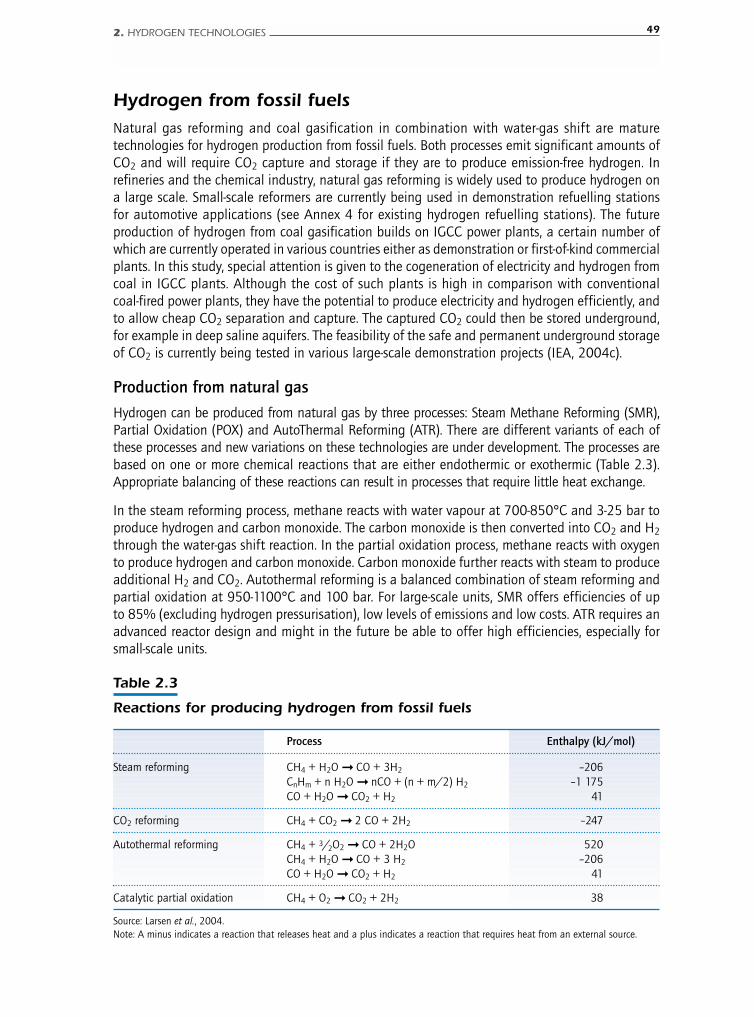
Hydrogen from fossil fuels Natural gas reforming and coal gasification in combination with water-gas shift are maturetechnologies for hydrogen production from fossil fuels. Both processes emit significant amounts ofCO2 and will require CO2 capture and storage if they are to produce emission-free hydrogen. Inrefineries and the chemical industry, natural gas reforming is widely used to produce hydrogen ona large scale. Small-scale reformers are currently being used in demonstration refuelling stationsfor automotive applications (see Annex 4 for existing hydrogen refuelling stations). The futureproduction of hydrogen from coal gasification builds on IGCC power plants, a certain number ofwhich are currently operated in various countries either as demonstration or first-of-kind commercialplants. In this study, special attention is given to the cogeneration of electricity and hydrogen fromcoal in IGCC plants. Although the cost of such plants is high in comparison with conventionalcoal-fired power plants, they have the potential to produce electricity and hydrogen efficiently, andto allow cheap CO2 separation and capture. The captured CO2 could then be stored underground,for example in deep saline aquifers. The feasibility of the safe and permanent underground storageof CO2 is currently being tested in various large-scale demonstration projects (IEA, 2004c).
Production from natural gas
Hydrogen can be produced from natural gas by three processes: Steam Methane Reforming (SMR),Partial Oxidation (POX) and AutoThermal Reforming (ATR). There are different variants of each ofthese processes and new variations on these technologies are under development. The processes arebased on one or more chemical reactions that are either endothermic or exothermic (Table 2.3).Appropriate balancing of these reactions can result in processes that require little heat exchange.
In the steam reforming process, methane reacts with water vapour at 700-850°C and 3-25 bar toproduce hydrogen and carbon monoxide. The carbon monoxide is then converted into CO2 and H2
through the water-gas shift reaction. In the partial oxidation process, methane reacts with oxygento produce hydrogen and carbon monoxide. Carbon monoxide further reacts with steam to produceadditional H2 and CO2. Autothermal reforming is a balanced combination of steam reforming andpartial oxidation at 950-1100°C and 100 bar. For large-scale units, SMR offers efficiencies of upto 85% (excluding hydrogen pressurisation), low levels of emissions and low costs. ATR requires anadvanced reactor design and might in the future be able to offer high efficiencies, especially forsmall-scale units.
2. HYDROGEN TECHNOLOGIES 49
Table 2.3
Reactions for producing hydrogen from fossil fuels
Process Enthalpy (kJ/mol)
Steam reforming CH4 + H2O ➞ CO + 3H2 –206CnHm + n H2O ➞ nCO + (n + m/2) H2 –1 175CO + H2O ➞ CO2 + H2 41
CO2 reforming CH4 + CO2 ➞ 2 CO + 2H2 –247
Autothermal reforming CH4 + 3/2O2 ➞ CO + 2H2O 520CH4 + H2O ➞ CO + 3 H2 –206CO + H2O ➞ CO2 + H2 41
Catalytic partial oxidation CH4 + O2 ➞ CO2 + 2H2 38
Source: Larsen et al., 2004.Note: A minus indicates a reaction that releases heat and a plus indicates a reaction that requires heat from an external source.
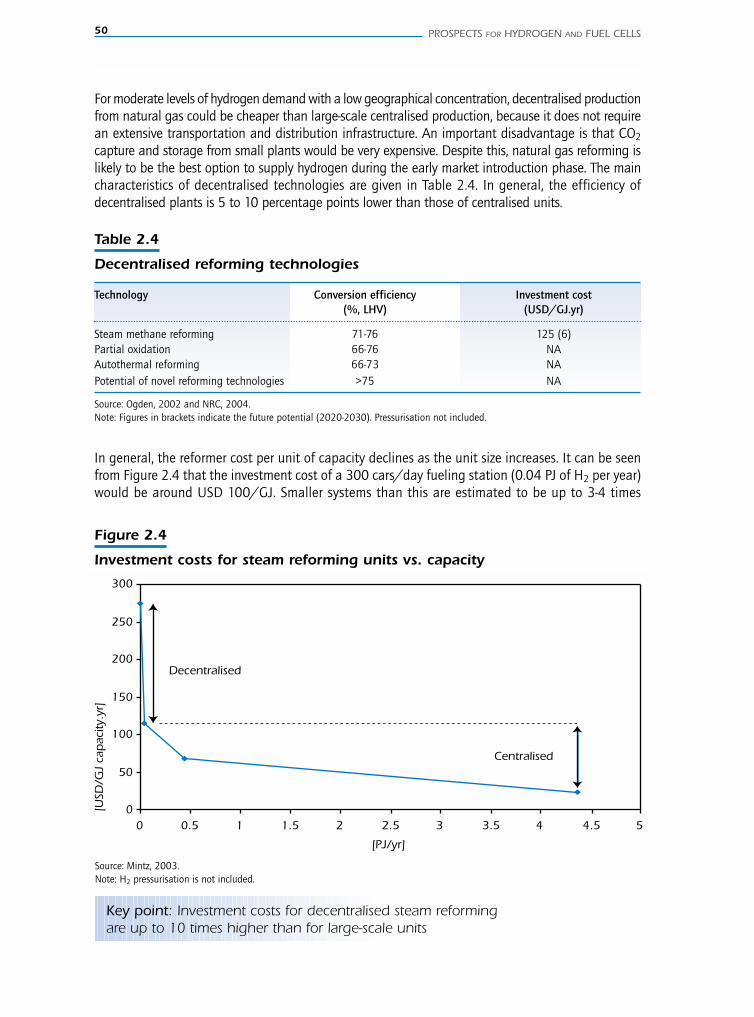
50 PROSPECTS FOR HYDROGEN AND FUEL CELLS
For moderate levels of hydrogen demand with a low geographical concentration, decentralised productionfrom natural gas could be cheaper than large-scale centralised production, because it does not requirean extensive transportation and distribution infrastructure. An important disadvantage is that CO2
capture and storage from small plants would be very expensive. Despite this, natural gas reforming islikely to be the best option to supply hydrogen during the early market introduction phase. The maincharacteristics of decentralised technologies are given in Table 2.4. In general, the efficiency ofdecentralised plants is 5 to 10 percentage points lower than those of centralised units.
Table 2.4
Decentralised reforming technologies
Technology Conversion efficiency Investment cost(%, LHV) (USD/GJ.yr)
Steam methane reforming 71-76 125 (6)Partial oxidation 66-76 NAAutothermal reforming 66-73 NAPotential of novel reforming technologies >75 NA
Source: Ogden, 2002 and NRC, 2004.Note: Figures in brackets indicate the future potential (2020-2030). Pressurisation not included.
In general, the reformer cost per unit of capacity declines as the unit size increases. It can be seenfrom Figure 2.4 that the investment cost of a 300 cars/day fueling station (0.04 PJ of H2 per year)would be around USD 100/GJ. Smaller systems than this are estimated to be up to 3-4 times
Figure 2.4
Investment costs for steam reforming units vs. capacity
0
50
100
150
200
250
300
0 0.5 1.5 2.5 3.5 4.51 2 3 4 5
[PJ/yr]
[USD
/GJ
cap
acity
.yr]
Decentralised
Centralised
Key point: Investment costs for decentralised steam reformingare up to 10 times higher than for large-scale units
Source: Mintz, 2003.Note: H2 pressurisation is not included.
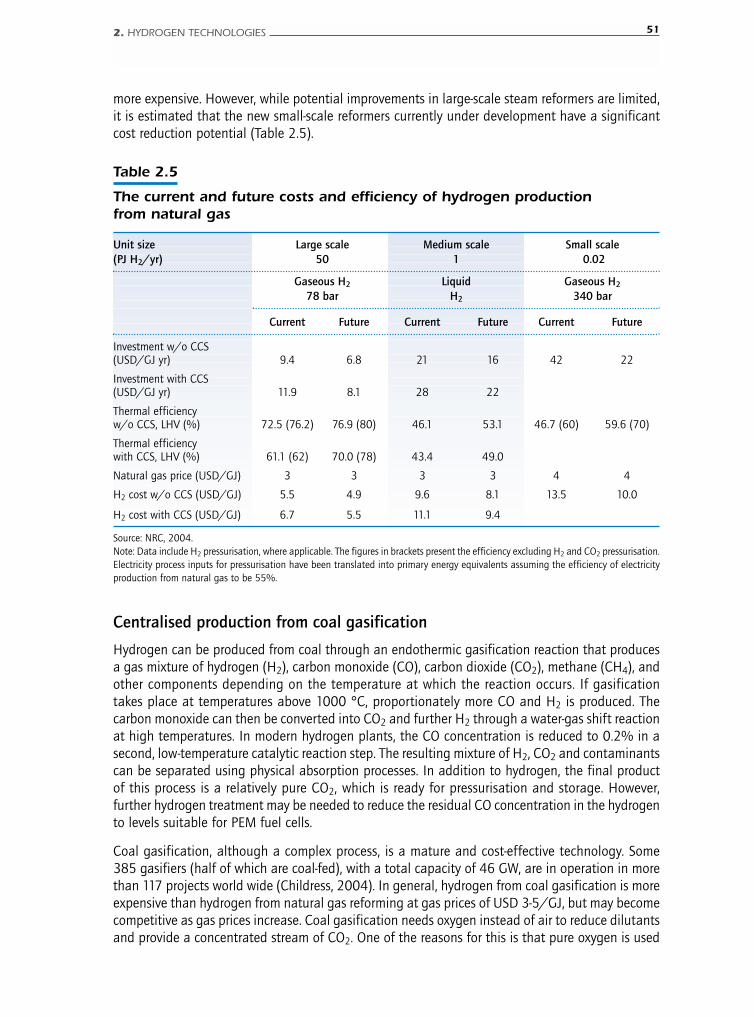
more expensive. However, while potential improvements in large-scale steam reformers are limited,it is estimated that the new small-scale reformers currently under development have a significantcost reduction potential (Table 2.5).
2. HYDROGEN TECHNOLOGIES 51
Table 2.5
The current and future costs and efficiency of hydrogen productionfrom natural gas
Unit size Large scale Medium scale Small scale(PJ H2/yr) 50 1 0.02
Gaseous H2 Liquid Gaseous H2
78 bar H2 340 bar
Current Future Current Future Current Future
Investment w/o CCS(USD/GJ yr) 9.4 6.8 21 16 42 22
Investment with CCS(USD/GJ yr) 11.9 8.1 28 22
Thermal efficiency w/o CCS, LHV (%) 72.5 (76.2) 76.9 (80) 46.1 53.1 46.7 (60) 59.6 (70)
Thermal efficiency with CCS, LHV (%) 61.1 (62) 70.0 (78) 43.4 49.0
Natural gas price (USD/GJ) 3 3 3 3 4 4
H2 cost w/o CCS (USD/GJ) 5.5 4.9 9.6 8.1 13.5 10.0
H2 cost with CCS (USD/GJ) 6.7 5.5 11.1 9.4
Source: NRC, 2004.Note: Data include H2 pressurisation, where applicable. The figures in brackets present the efficiency excluding H2 and CO2 pressurisation.Electricity process inputs for pressurisation have been translated into primary energy equivalents assuming the efficiency of electricityproduction from natural gas to be 55%.
Centralised production from coal gasification
Hydrogen can be produced from coal through an endothermic gasification reaction that producesa gas mixture of hydrogen (H2), carbon monoxide (CO), carbon dioxide (CO2), methane (CH4), andother components depending on the temperature at which the reaction occurs. If gasificationtakes place at temperatures above 1000 °C, proportionately more CO and H2 is produced. Thecarbon monoxide can then be converted into CO2 and further H2 through a water-gas shift reactionat high temperatures. In modern hydrogen plants, the CO concentration is reduced to 0.2% in asecond, low-temperature catalytic reaction step. The resulting mixture of H2, CO2 and contaminantscan be separated using physical absorption processes. In addition to hydrogen, the final productof this process is a relatively pure CO2, which is ready for pressurisation and storage. However,further hydrogen treatment may be needed to reduce the residual CO concentration in the hydrogento levels suitable for PEM fuel cells.
Coal gasification, although a complex process, is a mature and cost-effective technology. Some385 gasifiers (half of which are coal-fed), with a total capacity of 46 GW, are in operation in morethan 117 projects world wide (Childress, 2004). In general, hydrogen from coal gasification is moreexpensive than hydrogen from natural gas reforming at gas prices of USD 3-5/GJ, but may becomecompetitive as gas prices increase. Coal gasification needs oxygen instead of air to reduce dilutantsand provide a concentrated stream of CO2. One of the reasons for this is that pure oxygen is used
52 PROSPECTS FOR HYDROGEN AND FUEL CELLS
for the reaction. The production of oxygen is currently based on cryogenic separation which is acostly and energy intensive process. New methods under development may increase the productionefficiency and reduce the cost of oxygen production. This will, in turn, reduce the cost of hydrogenfrom coal gasification. Other developments may also reduce the cost of coal gasification, e.g. newhydrogen membrane reactors for the water-gas shift reaction may considerably reduce the energyneeds for gas separation and CO2 pressurisation (Mundschau et al., 2005), and would improveconversion of CO into CO2. However, these membranes are still in early development (Paul andWinslow, 2005).
The production of hydrogen by coal gasification is not suited to decentralised production, becauseit relies on economies of scale, and CO2 capture and storage in small-scale systems would beexpensive and difficult. However, the large-scale production of hydrogen from IGCC plants appearsto be a particularly attractive option for the centralised production of hydrogen. IGCC plants offerthe potential for the efficient and flexible cogeneration of electricity and hydrogen from coal, withcheap CO2 separation for CCS. In recent years, increasing attention has been paid to the co-productionof electricity and synfuels (methanol, Fischer-Tropsch diesel and hydrogen) from coal, as these capital-intensive plants offer significant economies of scale, high capacity factors and high levels ofoverall efficiency (Lange et al., 2001). A study by Sasol points out that co-producing liquid fuelsand electricity increases the overall efficiency of energy use by 40% to 50% compared to thesame coal-to-liquids plant without the cogeneration of electricity (Steynberg and Nel, 2004). Studiesin the United States have focused on the security of supply and emission mitigation benefits of theco-production of synthetic fuels and electricity at IGCC plants (Gray and Tomlinson, 2001).
Table 2.6 summarises the costs and efficiency of the production of hydrogen from coal gasificationfor current and future plants, with and without CO2 capture and storage, and with cogenerationin IGCC plants. The current production cost for hydrogen without CCS is more than USD 7 /GJ H2.With CCS, the current production cost would be in the range of USD 8-10/GJ H2, while in thefuture this could drop below USD 7/GJ H2. The breakdown of the hydrogen production investmentcost from coal, including CO2 capture, is given in Figure 2.5 for a plant with a production capacityof 35 PJ per year. As the CO2 has to be removed even if it is not captured, the additional investmentcost for CO2 capture is only the cost for CO2 drying and compression. This represents only 5% ofthe total investment cost.
A coal-based power plant technology for electricity and hydrogen cogeneration and CO2 captureand storage, in line with the US FutureGen concept (Williams and Larson, 2003), has been includedin the model. The assumption is that 0.6 EJ of H2 is produced together with 1 EJ of electricity.Previous analyses (Figure 2.6) show the hydrogen production mix as a function of the investmentcost of the plant. The IGCC hydrogen production share declines as the IGCC cost increases. AboveUSD 2 000/kWel these plants are no longer competitive and production from natural gas withCCS replaces the coal based cogeneration plants.
Other production processes from fossil fuels
Hydrogen is also produced from fossil fuels in refinery processes, the production of coke oven gasand in chlorine plants. Refineries both produce their own hydrogen and in some cases purchasehydrogen from third parties. At the refinery, hydrogen is produced in three main ways:
● As a by-product of the catalytic reforming process (which accounts for around half the totalrefinery production).
● As a by-product of activities at adjacent petrochemical facilities, typically from ethylene crackers.
● By on-site steam reforming units.
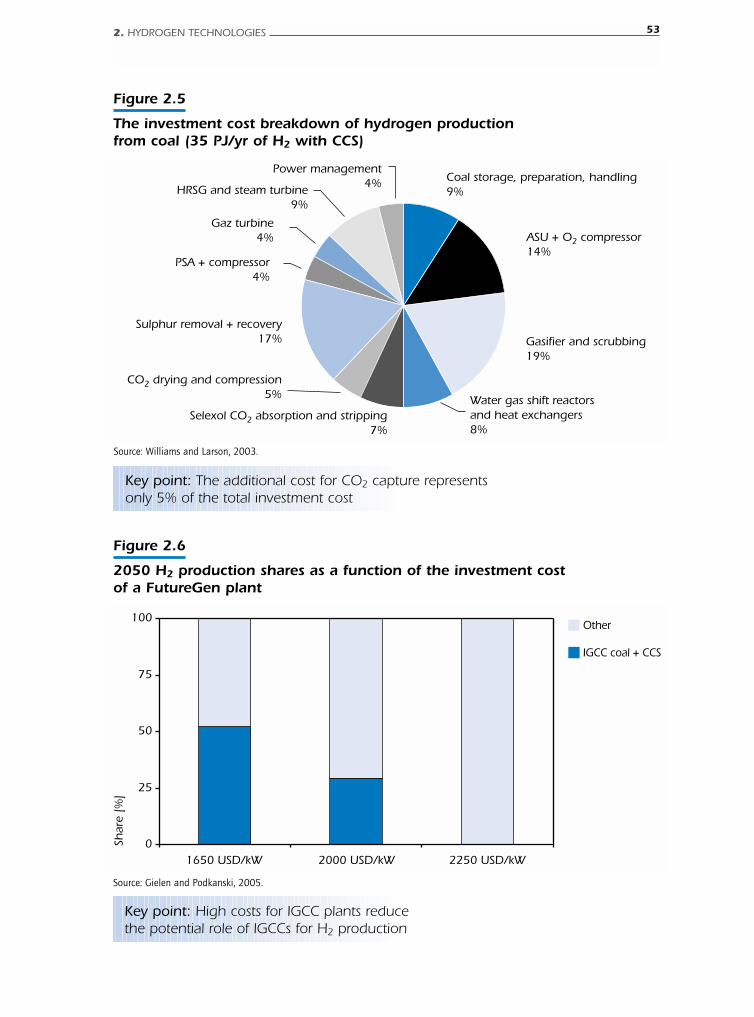
2. HYDROGEN TECHNOLOGIES 53
Figure 2.5
The investment cost breakdown of hydrogen productionfrom coal (35 PJ/yr of H2 with CCS)
Coal storage, preparation, handling 9%
ASU + O2 compressor 14%
Power management 4%HRSG and steam turbine
9%
Gasifier and scrubbing19%
Water gas shift reactors and heat exchangers 8%
Selexol CO2 absorption and stripping 7%
CO2 drying and compression 5%
Sulphur removal + recovery 17%
PSA + compressor 4%
Gaz turbine 4%
Key point: The additional cost for CO2 capture representsonly 5% of the total investment cost
Source: Williams and Larson, 2003.
Figure 2.6
2050 H2 production shares as a function of the investment costof a FutureGen plant
0
25
50
75
100
1650 USD/kW 2000 USD/kW 2250 USD/kW
Shar
e [%
]
Other
IGCC coal + CCS
Key point: High costs for IGCC plants reducethe potential role of IGCCs for H2 production
Source: Gielen and Podkanski, 2005.

54 PROSPECTS FOR HYDROGEN AND FUEL CELLS
Table
2.6
Cost
an
d e
ffic
ien
cy o
f h
ydro
gen
pro
duct
ion
fro
m c
oal
Coal
El
ectr
icit
yH
2H
2/El
Capi
tal
Capi
tal
Sour
ceO
vera
llH
2H
2co
stin
put
outp
utou
tput
rati
oco
stco
stef
ficie
ncy
effic
ienc
y(M
W)
(MW
)(M
W)
(–)
(MU
SD/
yr)
($/
kWe)
(%)
(%)
(USD
/G
J)
Texa
co O
2-blo
wn
gasi
fier,
w/
o CC
S1
863
781
070
13.7
765
9 76
3(W
illia
ms
and
61.7
66.8
6.55
high
-S h
ard
coal
Lars
on, 2
003)
Texa
co O
2-blo
wn
gasi
fier,
with
CCS
1 86
339
1 07
027
.580
720
733
(Will
iam
s an
d59
.562
.17.
29hi
gh-S
har
d co
alLa
rson
, 200
3)
Futu
reG
enw
ith C
CS55
027
557
12
076
(DO
E, 2
004b
)
Coal
cur
rent
w/
o CC
S2
470
-121
1 66
71
152
(NRC
, 200
4)62
.656
.67.
83
Coal
futu
rew
/o
CCS
2 26
4-9
81
667
868
(NRC
, 200
4)69
.364
.06.
19
Coal
cur
rent
w
ith C
CS2
470
-187
1 66
71
177
(NRC
, 200
4)59
.950
.78.
43
Coal
futu
rew
ith C
CS2
264
-88
1 66
789
0(N
RC, 2
004)
69.7
65.0
6.23
Texa
co q
uenc
h, P
SAw
/o
CCS
944
2045
722
.436
717
990
(Gra
y an
d50
.653
.27.
91To
mlin
son,
200
2)
Texa
co q
uenc
h, P
SAw
ith C
CS94
427
415
15.4
417
15 5
02(G
ray
and
46.8
50.3
9.48
Tom
linso
n, 2
002)
Adv
ance
d ga
sifie
r, ad
vanc
edw
ith C
CS94
425
551
22.1
425
17 0
00(G
ray
and
61.0
64.3
7.29
mem
bran
e se
para
tion
Tom
linso
n, 2
002)
Coge
nera
tion
w/
o CC
S1
889
475
520
1.1
910
1 91
6(G
ray
and
52.7
83.4
6.64
Tom
linso
n, 2
002)
Coge
nera
tion
with
CCS
1 88
935
853
41.
595
02
654
(Gra
y an
d47
.270
.49.
68To
mlin
son,
200
2)
Coge
nera
tion,
mem
bran
e CO
2w
ith C
CS1
889
416
534
1.3
950
2 28
4(G
ray
and
50.3
77.2
8.38
sepa
ratio
nTo
mlin
son,
200
2)
Ass
umpt
ions
: coa
l cos
t USD
1/
GJ,
an e
lect
ricity
pric
e of
USD
0.0
4/kW
h, a
n an
nuity
of 1
5%, a
n O
&M
cos
t of 4
% a
nd a
cap
acity
fact
or 8
5%. H
2pr
oduc
ed a
t 75
bar.
The
H2
effic
ienc
y is
cal
cula
ted
by a
ssum
ing
45%
eff
icie
ncy
for s
tand
-alo
ne e
lect
ricity
pro
duct
ion
from
coa
l. Co
al fu
ture
refe
rs t
o a
plan
t bu
ilt w
ith t
he b
est
avai
labl
e te
chno
logy
tw
o to
thr
ee d
ecad
es fr
om n
ow. T
he H
2/el
ectr
icity
pro
duct
ion
ratio
allo
ws
com
paris
on a
cros
s de
sign
s w
ith d
iffer
ent
capa
citie
s.
The global refinery industry’s production capacity of hydrogen amounted to around 2.1 EJ in2000. This hydrogen is needed to process the crude oil and to improve the characteristics oftransportation fuels. The refinery industry’s demand for hydrogen is increasing due to the increasedprocessing of heavier crude types and the continued shift of the product mix towards the morehydrogen-rich transportation fuels. In addition, recent legislation in Europe and other regions thatrequires lower sulphur levels in gasoline and diesel will boost hydrogen demand, as this will requiremore hydrogen treatment. As a consequence of these trends, refineries will be growing consumersof hydrogen and cannot be considered a source of hydrogen for other uses. However, hydrogenproduction units that feed refineries and their associated hydrogen transport and distribution systemmay create economies of scale in hydrogen production and lower hydrogen production costs.
The separation of hydrogen from coke oven gas is being considered, especially in Japan. Coke ovengas is a by-product of the production of coke, both of which are currently used by the steel processingindustry. Around 400 m3 of coke oven gas is produced per tonne of coke. This gas contains around55% hydrogen on a dry basis, or 29% on a wet basis. One tonne of coke therefore has thepotential to yield about 254 m3 of hydrogen, which is equivalent to around 2.7 GJ H2. With globalcoke production of about 350 Mt per year, the potential for hydrogen recovery is therefore about0.95 EJ per year. This potential could be almost doubled if the coke oven gas is subjected tofurther processing (Diemer et al., 2004). However, hydrogen would only be produced from cokeoven gas if it yielded a higher value to steel producers than its current use in steel processing.Moreover, increased recovery of hydrogen from coke oven gas would imply more natural gas orcoal use by the iron and steel industry to make up for the energy shortfall. This would reduce thenet CO2 benefits of hydrogen use substantially. For this reason, this option has not been analysedin more detail.
The electrolytic production of chlorine from salt produces hydrogen as a by-product (3.4 GJ H2 pertonne of chlorine). Global production capacity of around 50 Mt of chlorine per annum, at some650 chlorine plants, translates into a production potential 190 PJ H2. At present, this hydrogen isused on-site for energy recovery. However, as this hydrogen is pure and does not require extensivecleaning for use in FCVs, it could become more attractive to use this hydrogen in FCVs in the future.
Hydrogen from high-temperature water splittingusing solar and nuclear heat The direct use of high-temperature heat to split water and produce hydrogen has the advantageof avoiding the costly and energy-consuming generation of electricity as an intermediate step inthe production of hydrogen. The main problem is that direct water splitting occurs at very hightemperatures (above 2 500 °C). However, a number of technologies are currently being researchedwhich aim to reduce the temperature required for the process to below 1 000 °C. They include:thermo-chemical cycles, hybrid thermal/electrolytic decomposition processes, direct catalyticdecomposition using ceramic membranes and plasma/chemical decomposition with a CO2 cycle.In addition to reducing the temperature of the process, research efforts are trying to raise energyefficiency values above 50% in order to significantly reduce the hydrogen production cost. Theyare also seeking to overcome major technical issues, including corrosion and heat exchange, forthe materials and components working at high temperatures, such as separation membranes. Ifthese issues can be overcome, a source of cheap high-temperature heat (i.e. from nuclear or solarenergy) will be required to make these proposed forms of hydrogen production attractive.
For the purpose of this study, only thermo-chemical water splitting is considered, given that theother processes being proposed are at a very early stage of their development. A number of thermally
2. HYDROGEN TECHNOLOGIES 55
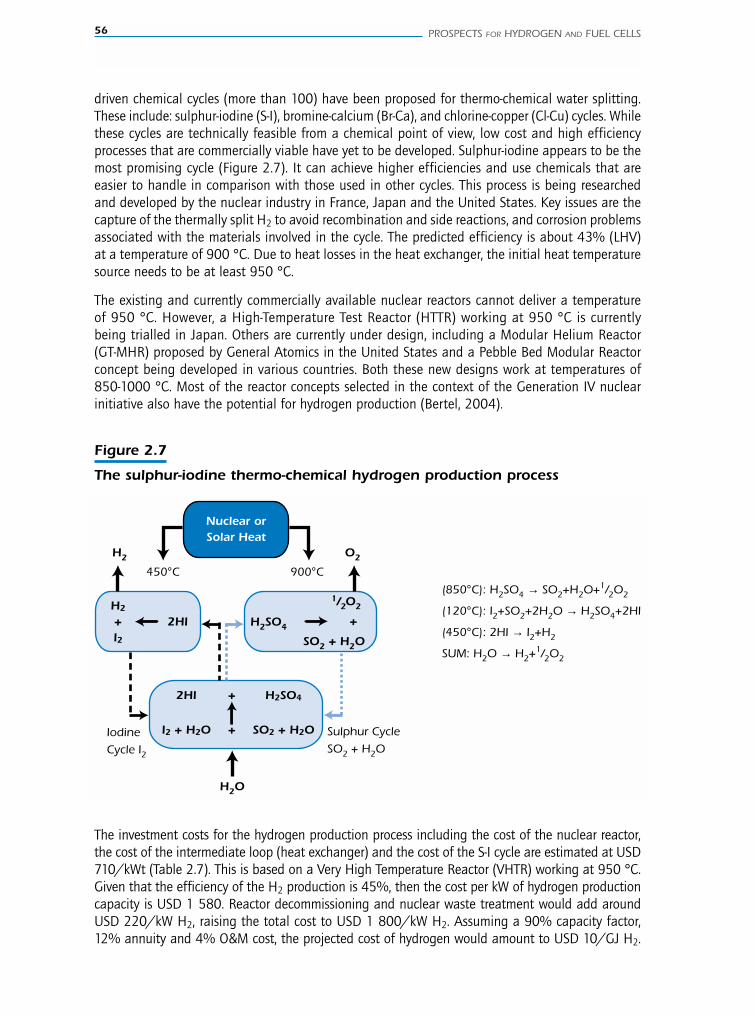
56 PROSPECTS FOR HYDROGEN AND FUEL CELLS
driven chemical cycles (more than 100) have been proposed for thermo-chemical water splitting.These include: sulphur-iodine (S-I), bromine-calcium (Br-Ca), and chlorine-copper (Cl-Cu) cycles. Whilethese cycles are technically feasible from a chemical point of view, low cost and high efficiencyprocesses that are commercially viable have yet to be developed. Sulphur-iodine appears to be themost promising cycle (Figure 2.7). It can achieve higher efficiencies and use chemicals that areeasier to handle in comparison with those used in other cycles. This process is being researchedand developed by the nuclear industry in France, Japan and the United States. Key issues are thecapture of the thermally split H2 to avoid recombination and side reactions, and corrosion problemsassociated with the materials involved in the cycle. The predicted efficiency is about 43% (LHV)at a temperature of 900 °C. Due to heat losses in the heat exchanger, the initial heat temperaturesource needs to be at least 950 °C.
The existing and currently commercially available nuclear reactors cannot deliver a temperatureof 950 °C. However, a High-Temperature Test Reactor (HTTR) working at 950 °C is currentlybeing trialled in Japan. Others are currently under design, including a Modular Helium Reactor(GT-MHR) proposed by General Atomics in the United States and a Pebble Bed Modular Reactorconcept being developed in various countries. Both these new designs work at temperatures of850-1000 °C. Most of the reactor concepts selected in the context of the Generation IV nuclearinitiative also have the potential for hydrogen production (Bertel, 2004).
Figure 2.7
The sulphur-iodine thermo-chemical hydrogen production process
(850°C): H2SO4 → SO2+H2O+1/2O2
(120°C): I2+SO2+2H2O → H2SO4+2HI
(450°C): 2HI → I2+H2
SUM: H2O → H2+1/2O2
Nuclear or Solar Heat
2HI
I2 + H2O
H2SO4
SO2 + H2O
+
+
H2
+I2
2HI H2SO4
1/2O2 +
SO2 + H2O
H2 O2
450°C 900°C
Sulphur Cycle
SO2 + H2OIodine
Cycle I2
H2O
The investment costs for the hydrogen production process including the cost of the nuclear reactor,the cost of the intermediate loop (heat exchanger) and the cost of the S-I cycle are estimated at USD710/kWt (Table 2.7). This is based on a Very High Temperature Reactor (VHTR) working at 950 °C.Given that the efficiency of the H2 production is 45%, then the cost per kW of hydrogen productioncapacity is USD 1 580. Reactor decommissioning and nuclear waste treatment would add aroundUSD 220/kW H2, raising the total cost to USD 1 800/kW H2. Assuming a 90% capacity factor,12% annuity and 4% O&M cost, the projected cost of hydrogen would amount to USD 10/GJ H2.
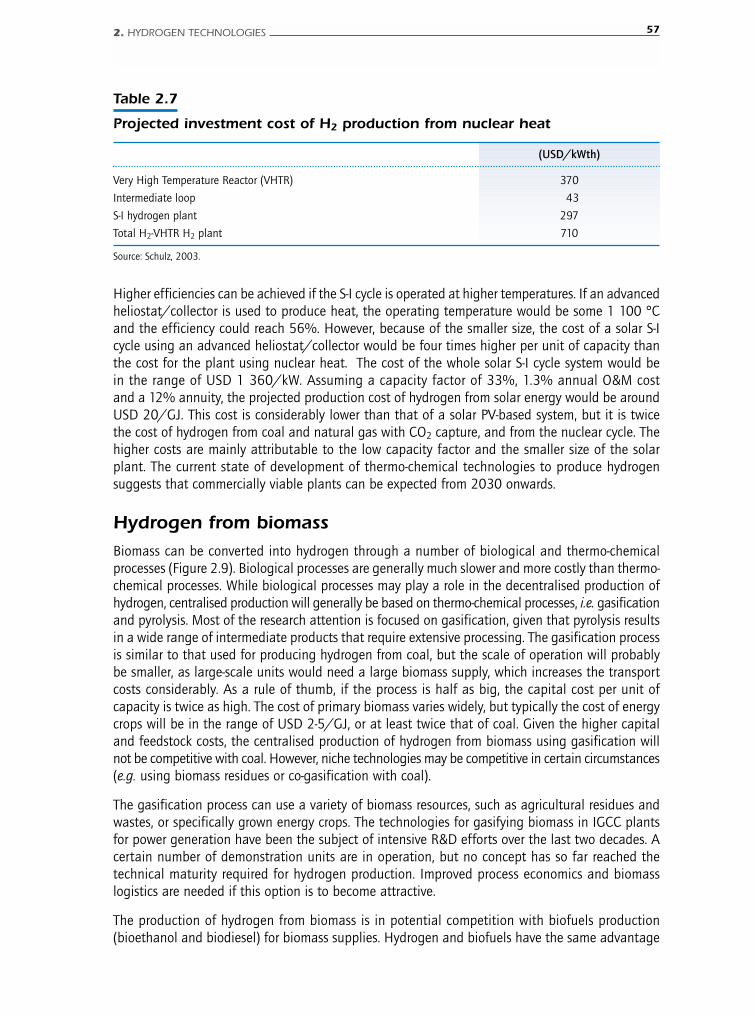
Higher efficiencies can be achieved if the S-I cycle is operated at higher temperatures. If an advancedheliostat/collector is used to produce heat, the operating temperature would be some 1 100 °Cand the efficiency could reach 56%. However, because of the smaller size, the cost of a solar S-Icycle using an advanced heliostat/collector would be four times higher per unit of capacity thanthe cost for the plant using nuclear heat. The cost of the whole solar S-I cycle system would bein the range of USD 1 360/kW. Assuming a capacity factor of 33%, 1.3% annual O&M costand a 12% annuity, the projected production cost of hydrogen from solar energy would be aroundUSD 20/GJ. This cost is considerably lower than that of a solar PV-based system, but it is twicethe cost of hydrogen from coal and natural gas with CO2 capture, and from the nuclear cycle. Thehigher costs are mainly attributable to the low capacity factor and the smaller size of the solarplant. The current state of development of thermo-chemical technologies to produce hydrogensuggests that commercially viable plants can be expected from 2030 onwards.
Hydrogen from biomass
Biomass can be converted into hydrogen through a number of biological and thermo-chemicalprocesses (Figure 2.9). Biological processes are generally much slower and more costly than thermo-chemical processes. While biological processes may play a role in the decentralised production ofhydrogen, centralised production will generally be based on thermo-chemical processes, i.e. gasificationand pyrolysis. Most of the research attention is focused on gasification, given that pyrolysis resultsin a wide range of intermediate products that require extensive processing. The gasification processis similar to that used for producing hydrogen from coal, but the scale of operation will probablybe smaller, as large-scale units would need a large biomass supply, which increases the transportcosts considerably. As a rule of thumb, if the process is half as big, the capital cost per unit ofcapacity is twice as high. The cost of primary biomass varies widely, but typically the cost of energycrops will be in the range of USD 2-5/GJ, or at least twice that of coal. Given the higher capitaland feedstock costs, the centralised production of hydrogen from biomass using gasification willnot be competitive with coal. However, niche technologies may be competitive in certain circumstances(e.g. using biomass residues or co-gasification with coal).
The gasification process can use a variety of biomass resources, such as agricultural residues andwastes, or specifically grown energy crops. The technologies for gasifying biomass in IGCC plantsfor power generation have been the subject of intensive R&D efforts over the last two decades. Acertain number of demonstration units are in operation, but no concept has so far reached thetechnical maturity required for hydrogen production. Improved process economics and biomasslogistics are needed if this option is to become attractive.
The production of hydrogen from biomass is in potential competition with biofuels production(bioethanol and biodiesel) for biomass supplies. Hydrogen and biofuels have the same advantage
2. HYDROGEN TECHNOLOGIES 57
Table 2.7
Projected investment cost of H2 production from nuclear heat
(USD/kWth)
Very High Temperature Reactor (VHTR) 370
Intermediate loop 43
S-I hydrogen plant 297
Total H2-VHTR H2 plant 710
Source: Schulz, 2003.
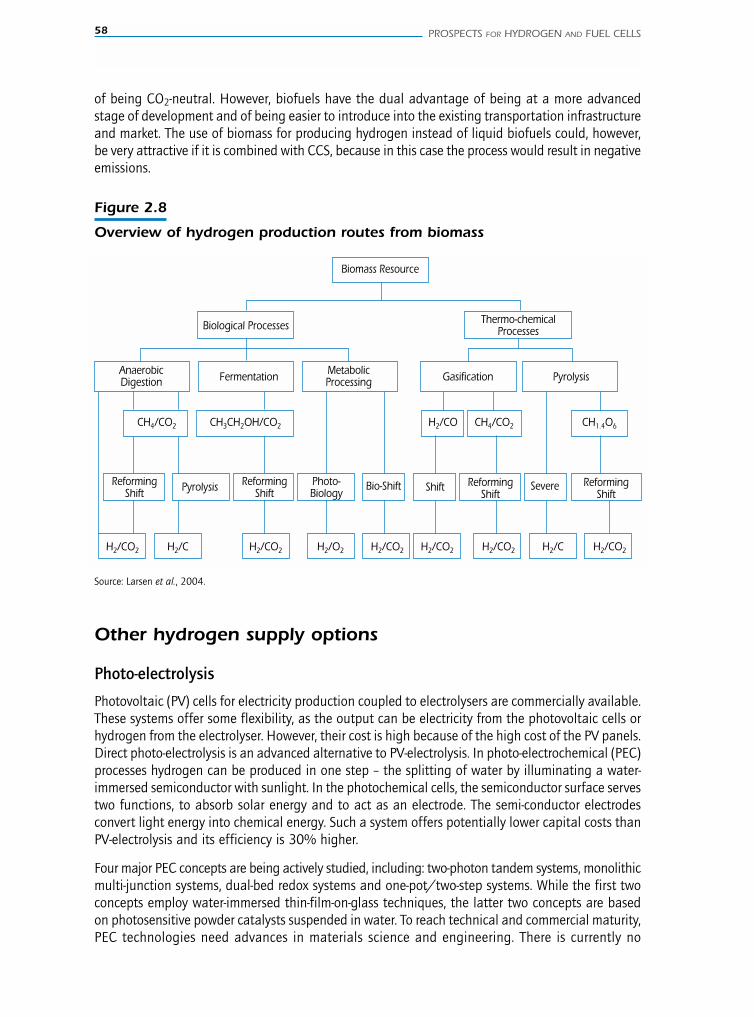
58 PROSPECTS FOR HYDROGEN AND FUEL CELLS
of being CO2-neutral. However, biofuels have the dual advantage of being at a more advancedstage of development and of being easier to introduce into the existing transportation infrastructureand market. The use of biomass for producing hydrogen instead of liquid biofuels could, however,be very attractive if it is combined with CCS, because in this case the process would result in negativeemissions.
Figure 2.8
Overview of hydrogen production routes from biomass
Photo- Biology
Biomass Resource
Thermo-chemical Processes
Fermentation MetabolicProcessing Gasification
Biological Processes
AnaerobicDigestion
CH4/CO2H2/COCH4/CO2 CH3CH2OH/CO2
Pyrolysis
Pyrolysis Reforming Shift
SevereShiftBio-Shift Reforming Shift
Reforming Shift
Reforming Shift
CH1.4O6
H2/CO2H2/CH2/CO2H2/CO2H2/CO2H2/O2H2/CO2H2/CO2 H2/C
Source: Larsen et al., 2004.
Other hydrogen supply options
Photo-electrolysis
Photovoltaic (PV) cells for electricity production coupled to electrolysers are commercially available.These systems offer some flexibility, as the output can be electricity from the photovoltaic cells orhydrogen from the electrolyser. However, their cost is high because of the high cost of the PV panels.Direct photo-electrolysis is an advanced alternative to PV-electrolysis. In photo-electrochemical (PEC)processes hydrogen can be produced in one step – the splitting of water by illuminating a water-immersed semiconductor with sunlight. In the photochemical cells, the semiconductor surface servestwo functions, to absorb solar energy and to act as an electrode. The semi-conductor electrodesconvert light energy into chemical energy. Such a system offers potentially lower capital costs thanPV-electrolysis and its efficiency is 30% higher.
Four major PEC concepts are being actively studied, including: two-photon tandem systems, monolithicmulti-junction systems, dual-bed redox systems and one-pot/two-step systems. While the first twoconcepts employ water-immersed thin-film-on-glass techniques, the latter two concepts are basedon photosensitive powder catalysts suspended in water. To reach technical and commercial maturity,PEC technologies need advances in materials science and engineering. There is currently no
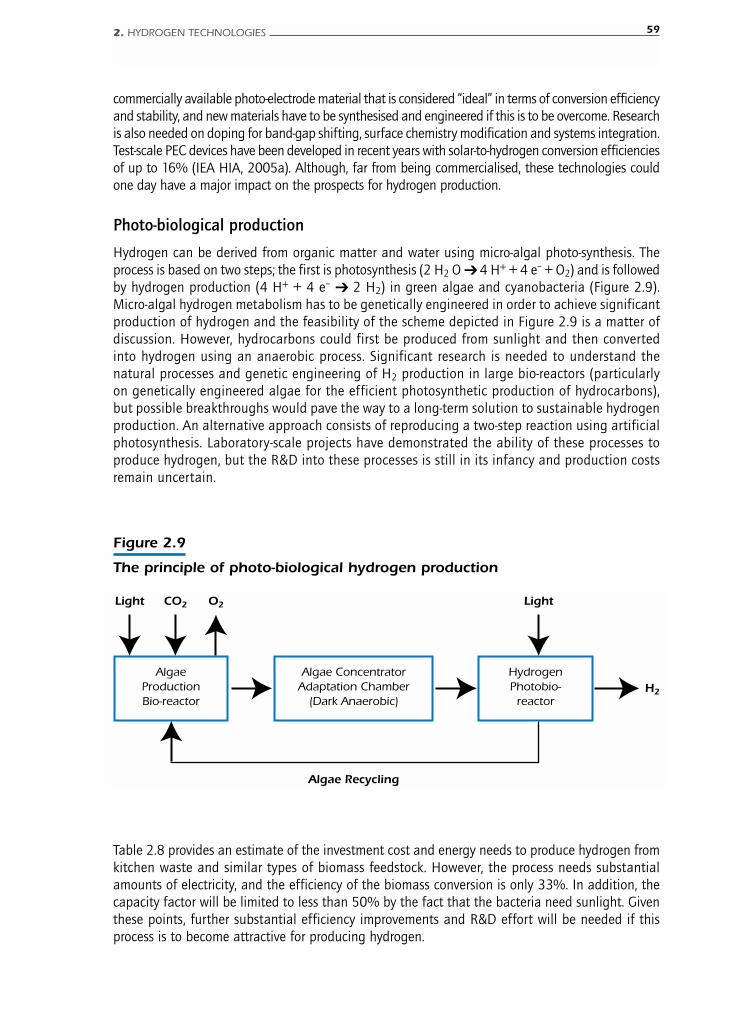
commercially available photo-electrode material that is considered “ideal” in terms of conversion efficiencyand stability, and new materials have to be synthesised and engineered if this is to be overcome. Researchis also needed on doping for band-gap shifting, surface chemistry modification and systems integration.Test-scale PEC devices have been developed in recent years with solar-to-hydrogen conversion efficienciesof up to 16% (IEA HIA, 2005a). Although, far from being commercialised, these technologies couldone day have a major impact on the prospects for hydrogen production.
Photo-biological production
Hydrogen can be derived from organic matter and water using micro-algal photo-synthesis. Theprocess is based on two steps; the first is photosynthesis (2 H2 O ➔ 4 H+ + 4 e– + O2) and is followedby hydrogen production (4 H+ + 4 e– ➔ 2 H2) in green algae and cyanobacteria (Figure 2.9).Micro-algal hydrogen metabolism has to be genetically engineered in order to achieve significantproduction of hydrogen and the feasibility of the scheme depicted in Figure 2.9 is a matter ofdiscussion. However, hydrocarbons could first be produced from sunlight and then convertedinto hydrogen using an anaerobic process. Significant research is needed to understand thenatural processes and genetic engineering of H2 production in large bio-reactors (particularlyon genetically engineered algae for the efficient photosynthetic production of hydrocarbons),but possible breakthroughs would pave the way to a long-term solution to sustainable hydrogenproduction. An alternative approach consists of reproducing a two-step reaction using artificialphotosynthesis. Laboratory-scale projects have demonstrated the ability of these processes toproduce hydrogen, but the R&D into these processes is still in its infancy and production costsremain uncertain.
2. HYDROGEN TECHNOLOGIES 59
Figure 2.9
The principle of photo-biological hydrogen production
Algae Production Bio-reactor
Algae Concentrator Adaptation Chamber
(Dark Anaerobic)
Hydrogen Photobio- reactor
H2
O2CO2Light Light
Algae Recycling
Table 2.8 provides an estimate of the investment cost and energy needs to produce hydrogen fromkitchen waste and similar types of biomass feedstock. However, the process needs substantialamounts of electricity, and the efficiency of the biomass conversion is only 33%. In addition, thecapacity factor will be limited to less than 50% by the fact that the bacteria need sunlight. Giventhese points, further substantial efficiency improvements and R&D effort will be needed if thisprocess is to become attractive for producing hydrogen.
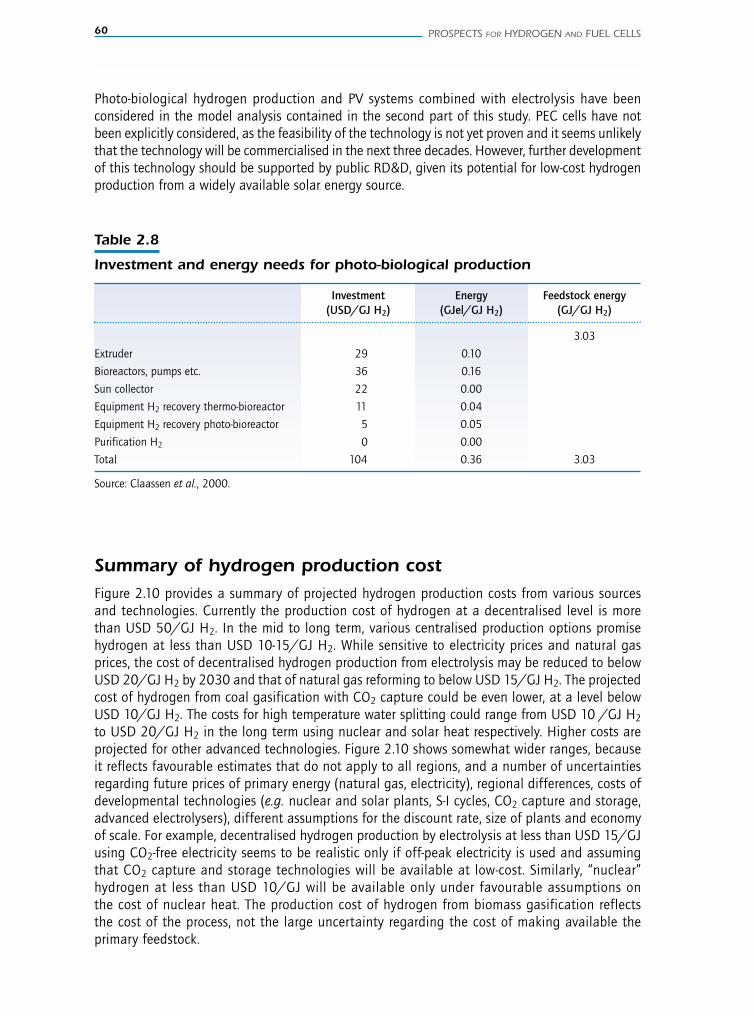
60 PROSPECTS FOR HYDROGEN AND FUEL CELLS
Photo-biological hydrogen production and PV systems combined with electrolysis have beenconsidered in the model analysis contained in the second part of this study. PEC cells have notbeen explicitly considered, as the feasibility of the technology is not yet proven and it seems unlikelythat the technology will be commercialised in the next three decades. However, further developmentof this technology should be supported by public RD&D, given its potential for low-cost hydrogenproduction from a widely available solar energy source.
Table 2.8
Investment and energy needs for photo-biological production
Investment Energy Feedstock energy(USD/GJ H2) (GJel/GJ H2) (GJ/GJ H2)
3.03
Extruder 29 0.10
Bioreactors, pumps etc. 36 0.16
Sun collector 22 0.00
Equipment H2 recovery thermo-bioreactor 11 0.04
Equipment H2 recovery photo-bioreactor 5 0.05
Purification H2 0 0.00
Total 104 0.36 3.03
Source: Claassen et al., 2000.
Summary of hydrogen production cost Figure 2.10 provides a summary of projected hydrogen production costs from various sourcesand technologies. Currently the production cost of hydrogen at a decentralised level is morethan USD 50/GJ H2. In the mid to long term, various centralised production options promisehydrogen at less than USD 10-15/GJ H2. While sensitive to electricity prices and natural gasprices, the cost of decentralised hydrogen production from electrolysis may be reduced to belowUSD 20/GJ H2 by 2030 and that of natural gas reforming to below USD 15/GJ H2. The projectedcost of hydrogen from coal gasification with CO2 capture could be even lower, at a level belowUSD 10/GJ H2. The costs for high temperature water splitting could range from USD 10 /GJ H2
to USD 20/GJ H2 in the long term using nuclear and solar heat respectively. Higher costs areprojected for other advanced technologies. Figure 2.10 shows somewhat wider ranges, becauseit reflects favourable estimates that do not apply to all regions, and a number of uncertaintiesregarding future prices of primary energy (natural gas, electricity), regional differences, costs ofdevelopmental technologies (e.g. nuclear and solar plants, S-I cycles, CO2 capture and storage,advanced electrolysers), different assumptions for the discount rate, size of plants and economyof scale. For example, decentralised hydrogen production by electrolysis at less than USD 15/GJusing CO2-free electricity seems to be realistic only if off-peak electricity is used and assumingthat CO2 capture and storage technologies will be available at low-cost. Similarly, “nuclear”hydrogen at less than USD 10/GJ will be available only under favourable assumptions onthe cost of nuclear heat. The production cost of hydrogen from biomass gasification reflectsthe cost of the process, not the large uncertainty regarding the cost of making available theprimary feedstock.
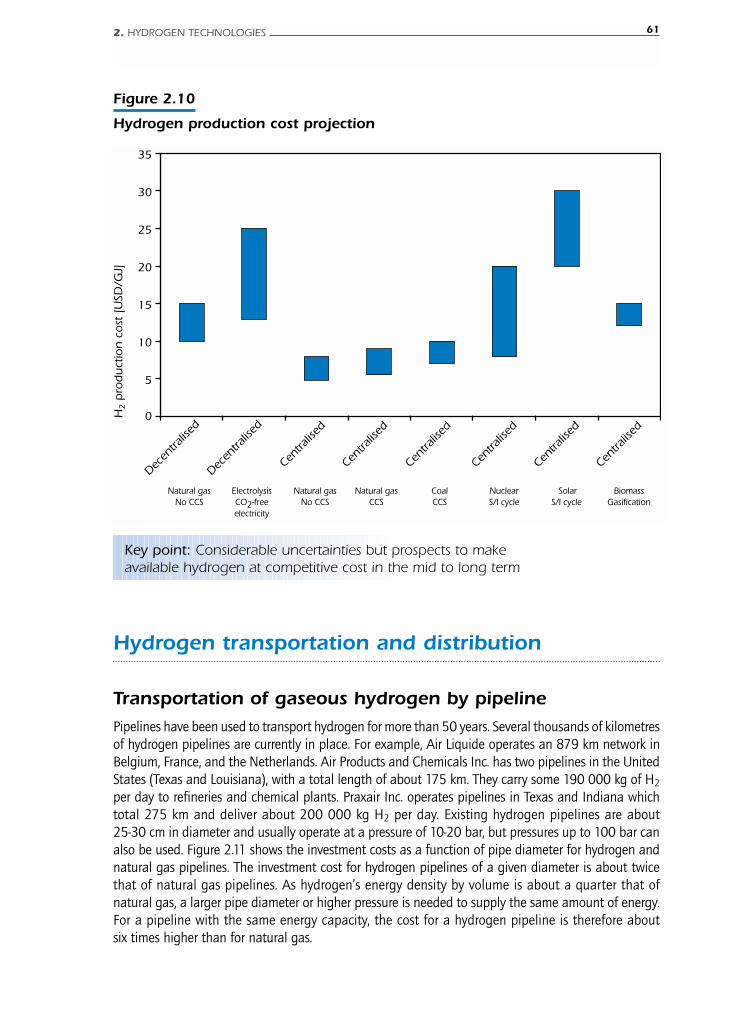
Hydrogen transportation and distribution
Transportation of gaseous hydrogen by pipeline
Pipelines have been used to transport hydrogen for more than 50 years. Several thousands of kilometresof hydrogen pipelines are currently in place. For example, Air Liquide operates an 879 km network inBelgium, France, and the Netherlands. Air Products and Chemicals Inc. has two pipelines in the UnitedStates (Texas and Louisiana), with a total length of about 175 km. They carry some 190 000 kg of H2
per day to refineries and chemical plants. Praxair Inc. operates pipelines in Texas and Indiana whichtotal 275 km and deliver about 200 000 kg H2 per day. Existing hydrogen pipelines are about25-30 cm in diameter and usually operate at a pressure of 10-20 bar, but pressures up to 100 bar canalso be used. Figure 2.11 shows the investment costs as a function of pipe diameter for hydrogen andnatural gas pipelines. The investment cost for hydrogen pipelines of a given diameter is about twicethat of natural gas pipelines. As hydrogen’s energy density by volume is about a quarter that ofnatural gas, a larger pipe diameter or higher pressure is needed to supply the same amount of energy.For a pipeline with the same energy capacity, the cost for a hydrogen pipeline is therefore aboutsix times higher than for natural gas.
2. HYDROGEN TECHNOLOGIES 61
Figure 2.10
Hydrogen production cost projection
0
5
10
15
20
25
30
35
Decen
tralis
ed
Decen
tralis
ed
Centra
lised
Centra
lised
Centra
lised
Centra
lised
Centra
lised
Centra
lised
Natural gas No CCS
Electrolysis CO2-free electricity
Natural gas No CCS
Natural gas CCS
Coal CCS
Nuclear S/I cycle
Solar S/I cycle
Biomass Gasification
H2 p
rod
uct
ion
co
st [
USD
/GJ]
Key point: Considerable uncertainties but prospects to makeavailable hydrogen at competitive cost in the mid to long term
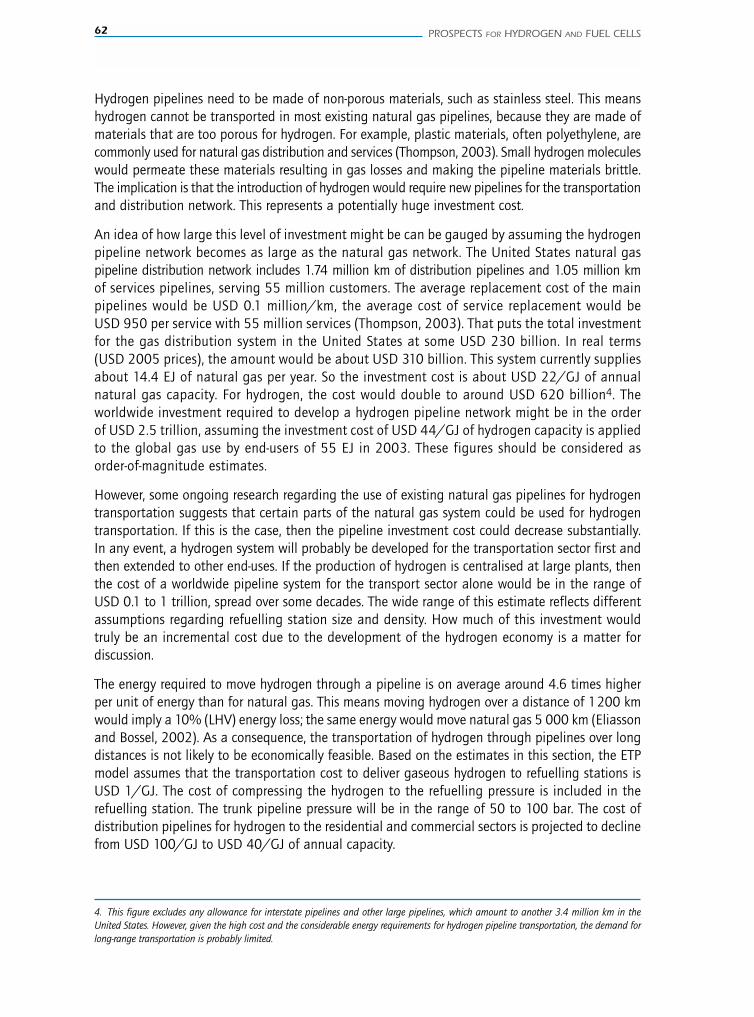
62 PROSPECTS FOR HYDROGEN AND FUEL CELLS
Hydrogen pipelines need to be made of non-porous materials, such as stainless steel. This meanshydrogen cannot be transported in most existing natural gas pipelines, because they are made ofmaterials that are too porous for hydrogen. For example, plastic materials, often polyethylene, arecommonly used for natural gas distribution and services (Thompson, 2003). Small hydrogen moleculeswould permeate these materials resulting in gas losses and making the pipeline materials brittle.The implication is that the introduction of hydrogen would require new pipelines for the transportationand distribution network. This represents a potentially huge investment cost.
An idea of how large this level of investment might be can be gauged by assuming the hydrogenpipeline network becomes as large as the natural gas network. The United States natural gaspipeline distribution network includes 1.74 million km of distribution pipelines and 1.05 million kmof services pipelines, serving 55 million customers. The average replacement cost of the mainpipelines would be USD 0.1 million/km, the average cost of service replacement would beUSD 950 per service with 55 million services (Thompson, 2003). That puts the total investmentfor the gas distribution system in the United States at some USD 230 billion. In real terms(USD 2005 prices), the amount would be about USD 310 billion. This system currently suppliesabout 14.4 EJ of natural gas per year. So the investment cost is about USD 22/GJ of annualnatural gas capacity. For hydrogen, the cost would double to around USD 620 billion4. Theworldwide investment required to develop a hydrogen pipeline network might be in the orderof USD 2.5 trillion, assuming the investment cost of USD 44/GJ of hydrogen capacity is appliedto the global gas use by end-users of 55 EJ in 2003. These figures should be considered asorder-of-magnitude estimates.
However, some ongoing research regarding the use of existing natural gas pipelines for hydrogentransportation suggests that certain parts of the natural gas system could be used for hydrogentransportation. If this is the case, then the pipeline investment cost could decrease substantially.In any event, a hydrogen system will probably be developed for the transportation sector first andthen extended to other end-uses. If the production of hydrogen is centralised at large plants, thenthe cost of a worldwide pipeline system for the transport sector alone would be in the range ofUSD 0.1 to 1 trillion, spread over some decades. The wide range of this estimate reflects differentassumptions regarding refuelling station size and density. How much of this investment wouldtruly be an incremental cost due to the development of the hydrogen economy is a matter fordiscussion.
The energy required to move hydrogen through a pipeline is on average around 4.6 times higherper unit of energy than for natural gas. This means moving hydrogen over a distance of 1200 kmwould imply a 10% (LHV) energy loss; the same energy would move natural gas 5 000 km (Eliassonand Bossel, 2002). As a consequence, the transportation of hydrogen through pipelines over longdistances is not likely to be economically feasible. Based on the estimates in this section, the ETPmodel assumes that the transportation cost to deliver gaseous hydrogen to refuelling stations isUSD 1/GJ. The cost of compressing the hydrogen to the refuelling pressure is included in therefuelling station. The trunk pipeline pressure will be in the range of 50 to 100 bar. The cost ofdistribution pipelines for hydrogen to the residential and commercial sectors is projected to declinefrom USD 100/GJ to USD 40/GJ of annual capacity.
4. This figure excludes any allowance for interstate pipelines and other large pipelines, which amount to another 3.4 million km in theUnited States. However, given the high cost and the considerable energy requirements for hydrogen pipeline transportation, the demand forlong-range transportation is probably limited.
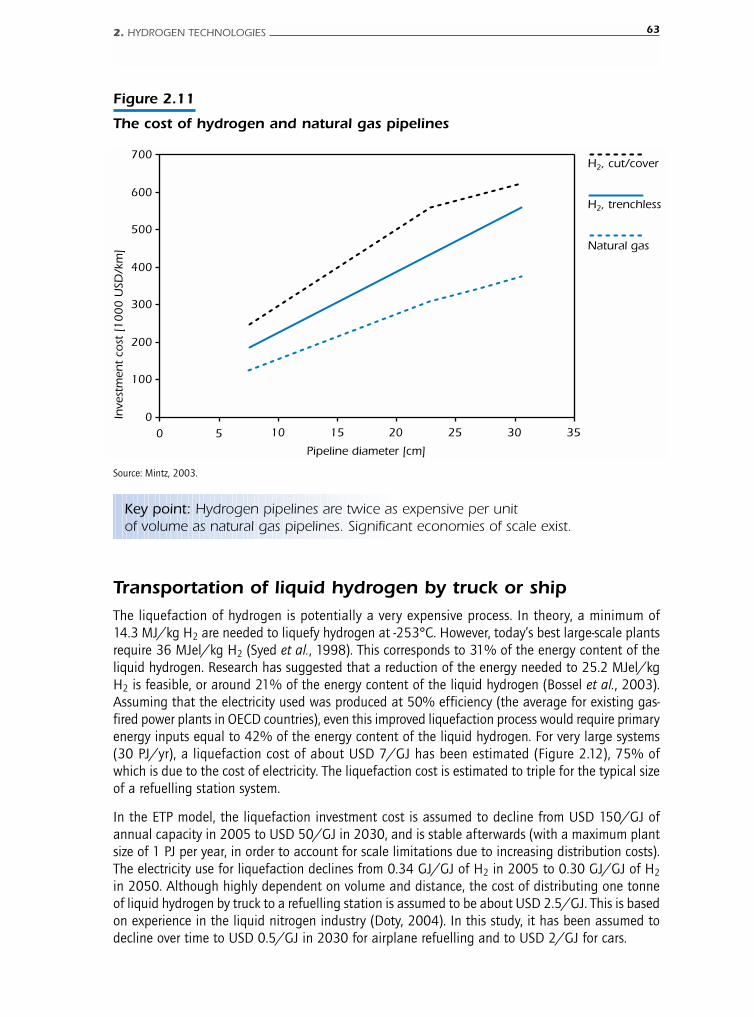
Transportation of liquid hydrogen by truck or shipThe liquefaction of hydrogen is potentially a very expensive process. In theory, a minimum of14.3 MJ/kg H2 are needed to liquefy hydrogen at -253°C. However, today’s best large-scale plantsrequire 36 MJel/kg H2 (Syed et al., 1998). This corresponds to 31% of the energy content of theliquid hydrogen. Research has suggested that a reduction of the energy needed to 25.2 MJel/kgH2 is feasible, or around 21% of the energy content of the liquid hydrogen (Bossel et al., 2003).Assuming that the electricity used was produced at 50% efficiency (the average for existing gas-fired power plants in OECD countries), even this improved liquefaction process would require primaryenergy inputs equal to 42% of the energy content of the liquid hydrogen. For very large systems(30 PJ/yr), a liquefaction cost of about USD 7/GJ has been estimated (Figure 2.12), 75% ofwhich is due to the cost of electricity. The liquefaction cost is estimated to triple for the typical sizeof a refuelling station system.
In the ETP model, the liquefaction investment cost is assumed to decline from USD 150/GJ ofannual capacity in 2005 to USD 50/GJ in 2030, and is stable afterwards (with a maximum plantsize of 1 PJ per year, in order to account for scale limitations due to increasing distribution costs).The electricity use for liquefaction declines from 0.34 GJ/GJ of H2 in 2005 to 0.30 GJ/GJ of H2
in 2050. Although highly dependent on volume and distance, the cost of distributing one tonneof liquid hydrogen by truck to a refuelling station is assumed to be about USD 2.5/GJ. This is basedon experience in the liquid nitrogen industry (Doty, 2004). In this study, it has been assumed todecline over time to USD 0.5/GJ in 2030 for airplane refuelling and to USD 2/GJ for cars.
2. HYDROGEN TECHNOLOGIES 63
Figure 2.11
The cost of hydrogen and natural gas pipelines
H2, cut/cover
H2, trenchless
Natural gas
0
100
200
300
400
500
600
700
0 5 10 15 20 25 30 35
Pipeline diameter [cm]
Inve
stm
ent
cost
[1
00
0 U
SD/k
m]
Key point: Hydrogen pipelines are twice as expensive per unitof volume as natural gas pipelines. Significant economies of scale exist.
Source: Mintz, 2003.
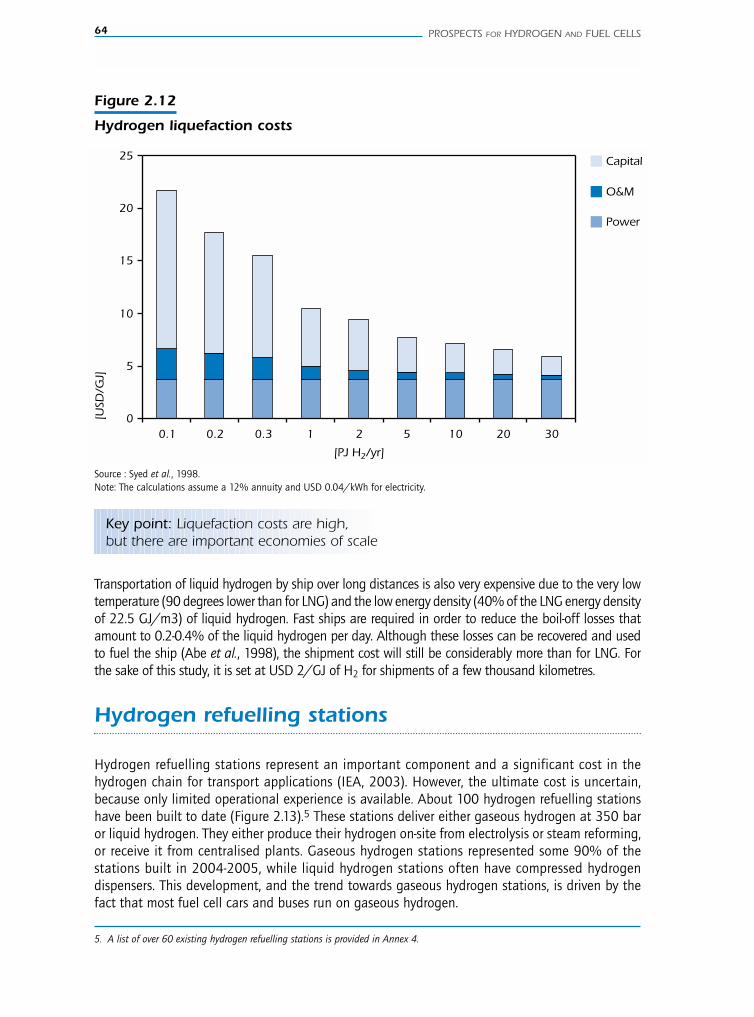
64 PROSPECTS FOR HYDROGEN AND FUEL CELLS
Transportation of liquid hydrogen by ship over long distances is also very expensive due to the very lowtemperature (90 degrees lower than for LNG) and the low energy density (40% of the LNG energy densityof 22.5 GJ/m3) of liquid hydrogen. Fast ships are required in order to reduce the boil-off losses thatamount to 0.2-0.4% of the liquid hydrogen per day. Although these losses can be recovered and usedto fuel the ship (Abe et al., 1998), the shipment cost will still be considerably more than for LNG. Forthe sake of this study, it is set at USD 2/GJ of H2 for shipments of a few thousand kilometres.
Hydrogen refuelling stations
Hydrogen refuelling stations represent an important component and a significant cost in thehydrogen chain for transport applications (IEA, 2003). However, the ultimate cost is uncertain,because only limited operational experience is available. About 100 hydrogen refuelling stationshave been built to date (Figure 2.13).5 These stations deliver either gaseous hydrogen at 350 baror liquid hydrogen. They either produce their hydrogen on-site from electrolysis or steam reforming,or receive it from centralised plants. Gaseous hydrogen stations represented some 90% of thestations built in 2004-2005, while liquid hydrogen stations often have compressed hydrogendispensers. This development, and the trend towards gaseous hydrogen stations, is driven by thefact that most fuel cell cars and buses run on gaseous hydrogen.
Figure 2.12
Hydrogen liquefaction costs
0
5
10
15
20
25
0.1 0.2 0.3 1 2 5 10 20 30
[PJ H2/yr]
[USD
/GJ]
O&M
Power
Capital
Key point: Liquefaction costs are high,but there are important economies of scale
Source : Syed et al., 1998.Note: The calculations assume a 12% annuity and USD 0.04/kWh for electricity.
5. A list of over 60 existing hydrogen refuelling stations is provided in Annex 4.
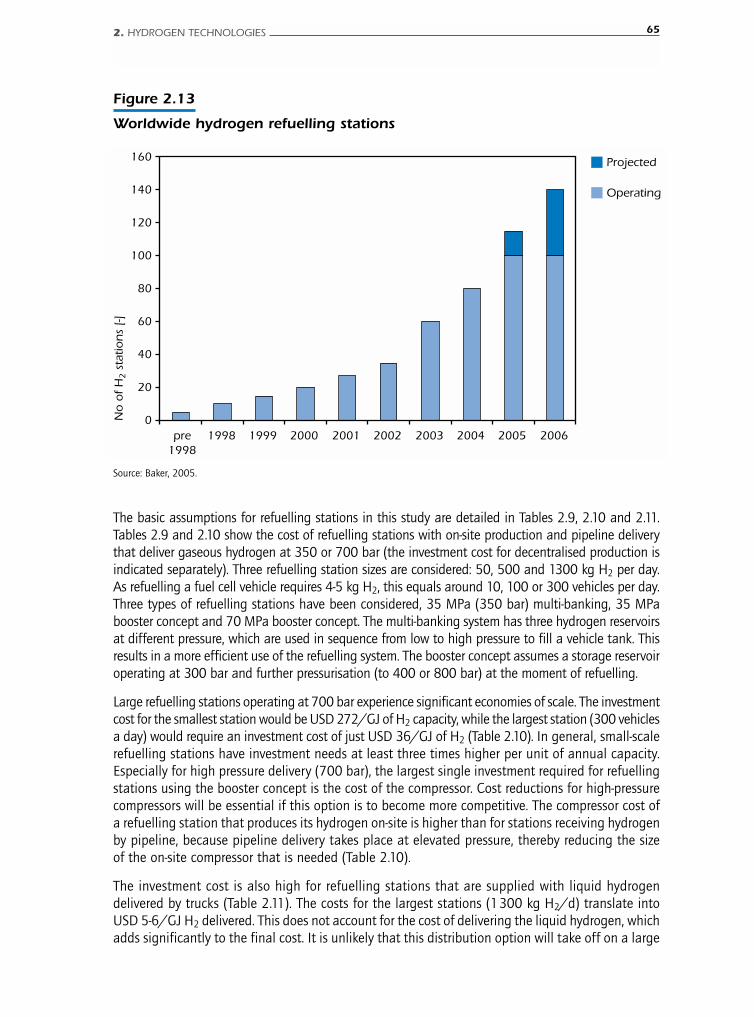
The basic assumptions for refuelling stations in this study are detailed in Tables 2.9, 2.10 and 2.11.Tables 2.9 and 2.10 show the cost of refuelling stations with on-site production and pipeline deliverythat deliver gaseous hydrogen at 350 or 700 bar (the investment cost for decentralised production isindicated separately). Three refuelling station sizes are considered: 50, 500 and 1300 kg H2 per day.As refuelling a fuel cell vehicle requires 4-5 kg H2, this equals around 10, 100 or 300 vehicles per day.Three types of refuelling stations have been considered, 35 MPa (350 bar) multi-banking, 35 MPabooster concept and 70 MPa booster concept. The multi-banking system has three hydrogen reservoirsat different pressure, which are used in sequence from low to high pressure to fill a vehicle tank. Thisresults in a more efficient use of the refuelling system. The booster concept assumes a storage reservoiroperating at 300 bar and further pressurisation (to 400 or 800 bar) at the moment of refuelling.
Large refuelling stations operating at 700 bar experience significant economies of scale. The investmentcost for the smallest station would be USD 272/GJ of H2 capacity, while the largest station (300 vehiclesa day) would require an investment cost of just USD 36/GJ of H2 (Table 2.10). In general, small-scalerefuelling stations have investment needs at least three times higher per unit of annual capacity.Especially for high pressure delivery (700 bar), the largest single investment required for refuellingstations using the booster concept is the cost of the compressor. Cost reductions for high-pressurecompressors will be essential if this option is to become more competitive. The compressor cost ofa refuelling station that produces its hydrogen on-site is higher than for stations receiving hydrogenby pipeline, because pipeline delivery takes place at elevated pressure, thereby reducing the sizeof the on-site compressor that is needed (Table 2.10).
The investment cost is also high for refuelling stations that are supplied with liquid hydrogendelivered by trucks (Table 2.11). The costs for the largest stations (1300 kg H2/d) translate intoUSD 5-6/GJ H2 delivered. This does not account for the cost of delivering the liquid hydrogen, whichadds significantly to the final cost. It is unlikely that this distribution option will take off on a large
2. HYDROGEN TECHNOLOGIES 65
Figure 2.13
Worldwide hydrogen refuelling stations
0
20
40
60
80
100
120
140
160
pre 1998
1998 1999 2000 2001 2002 2003 2004 2005 2006
No
of
H2 s
tatio
ns
[-]
Projected
Operating
Source: Baker, 2005.
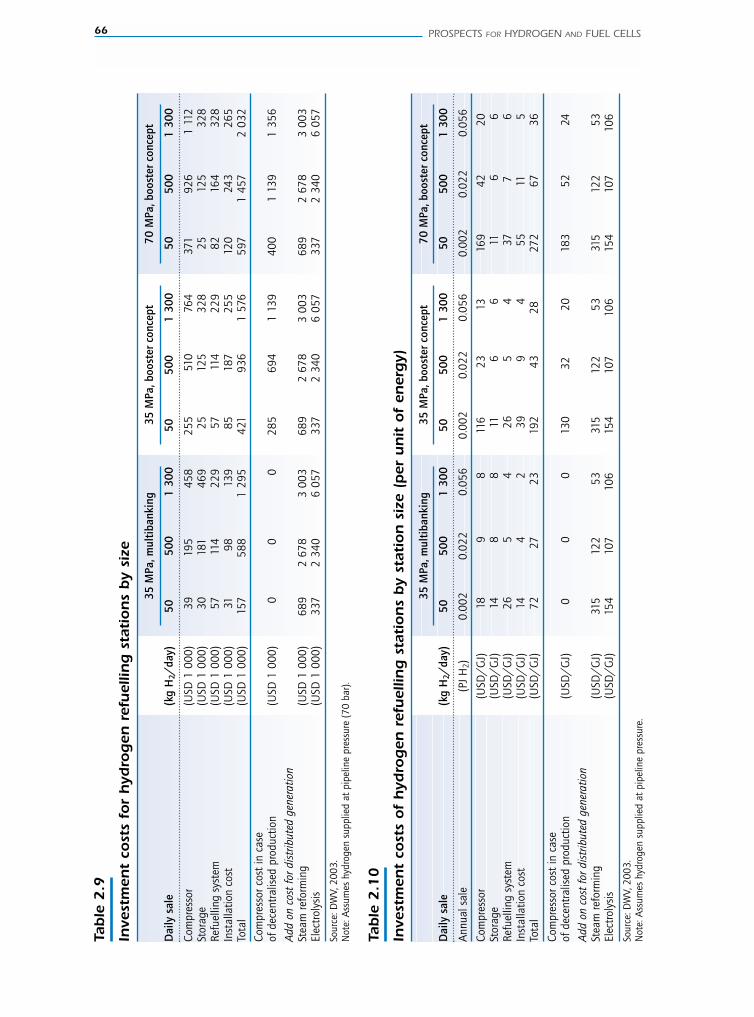
66 PROSPECTS FOR HYDROGEN AND FUEL CELLS
Table
2.9
Inve
stm
ent
cost
s fo
r h
ydro
gen
ref
uel
ling
sta
tion
s by
size
35 M
Pa, m
ulti
bank
ing
35 M
Pa, b
oost
er c
once
pt70
MPa
, boo
ster
con
cept
Dai
ly s
ale
(kg
H2/
day)
5050
01
300
5050
01
300
5050
01
300
Com
pres
sor
(USD
1 0
00)
3919
545
825
551
076
437
192
61
112
Stor
age
(USD
1 0
00)
3018
146
925
125
328
2512
532
8Re
fuel
ling
syst
em(U
SD 1
000
)57
114
229
5711
422
982
164
328
Inst
alla
tion
cost
(USD
1 0
00)
3198
139
8518
725
512
024
326
5To
tal
(USD
1 0
00)
157
588
1 29
542
193
61
576
597
1 45
72
032
Com
pres
sor c
ost
in c
ase
of d
ecen
tral
ised
pro
duct
ion
(USD
1 0
00)
00
028
569
41
139
400
1 13
91
356
Add
on
cost
for d
istr
ibut
ed g
ener
atio
nSt
eam
refo
rmin
g(U
SD 1
000
)68
92
678
3 00
368
92
678
3 00
368
92
678
3 00
3El
ectr
olys
is(U
SD 1
000
)33
72
340
6 05
733
72
340
6 05
733
72
340
6 05
7
Sour
ce: D
WV,
200
3.N
ote:
Ass
umes
hyd
roge
n su
pplie
d at
pip
elin
e pr
essu
re (7
0 ba
r).
Table
2.1
0
Inve
stm
ent
cost
s of
hyd
rog
en r
efuel
ling
sta
tion
s by
stat
ion
siz
e (p
er u
nit
of
ener
gy)
35 M
Pa, m
ulti
bank
ing
35 M
Pa, b
oost
er c
once
pt70
MPa
, boo
ster
con
cept
Dai
ly s
ale
(kg
H2/
day)
5050
01
300
5050
01
300
5050
01
300
Ann
ual s
ale
(PJ
H2)
0.00
20.
022
0.05
60.
002
0.02
20.
056
0.00
20.
022
0.05
6
Com
pres
sor
(USD
/G
J)18
98
116
2313
169
4220
Stor
age
(USD
/G
J)14
88
116
611
66
Refu
ellin
g sy
stem
(USD
/G
J)26
54
265
437
76
Inst
alla
tion
cost
(USD
/G
J)14
42
399
455
115
Tota
l(U
SD/
GJ)
7227
2319
243
2827
267
36
Com
pres
sor c
ost
in c
ase
of d
ecen
tral
ised
pro
duct
ion
(USD
/G
J)0
00
130
3220
183
5224
Add
on
cost
for d
istr
ibut
ed g
ener
atio
nSt
eam
refo
rmin
g(U
SD/
GJ)
315
122
5331
512
253
315
122
53El
ectr
olys
is(U
SD/
GJ)
154
107
106
154
107
106
154
107
106
Sour
ce: D
WV,
200
3.N
ote:
Ass
umes
hyd
roge
n su
pplie
d at
pip
elin
e pr
essu
re.
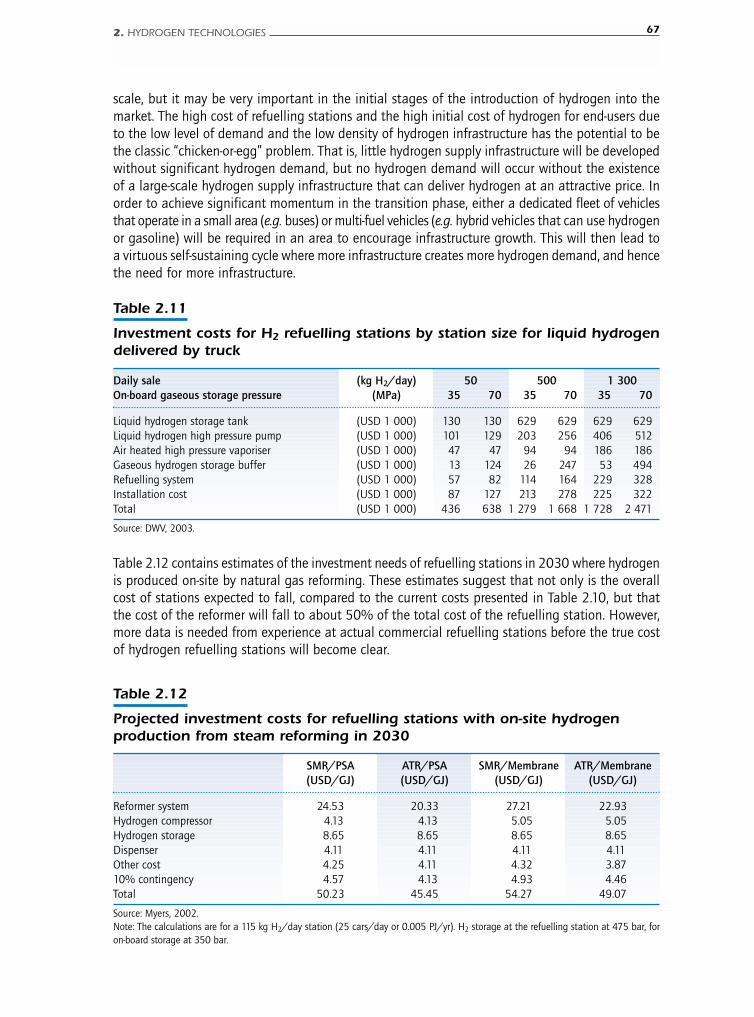
scale, but it may be very important in the initial stages of the introduction of hydrogen into themarket. The high cost of refuelling stations and the high initial cost of hydrogen for end-users dueto the low level of demand and the low density of hydrogen infrastructure has the potential to bethe classic “chicken-or-egg” problem. That is, little hydrogen supply infrastructure will be developedwithout significant hydrogen demand, but no hydrogen demand will occur without the existenceof a large-scale hydrogen supply infrastructure that can deliver hydrogen at an attractive price. Inorder to achieve significant momentum in the transition phase, either a dedicated fleet of vehiclesthat operate in a small area (e.g. buses) or multi-fuel vehicles (e.g. hybrid vehicles that can use hydrogenor gasoline) will be required in an area to encourage infrastructure growth. This will then lead toa virtuous self-sustaining cycle where more infrastructure creates more hydrogen demand, and hencethe need for more infrastructure.
2. HYDROGEN TECHNOLOGIES 67
Table 2.11
Investment costs for H2 refuelling stations by station size for liquid hydrogendelivered by truck
Daily sale (kg H2/day) 50 500 1 300On-board gaseous storage pressure (MPa) 35 70 35 70 35 70
Liquid hydrogen storage tank (USD 1 000) 130 130 629 629 629 629Liquid hydrogen high pressure pump (USD 1 000) 101 129 203 256 406 512Air heated high pressure vaporiser (USD 1 000) 47 47 94 94 186 186Gaseous hydrogen storage buffer (USD 1 000) 13 124 26 247 53 494Refuelling system (USD 1 000) 57 82 114 164 229 328Installation cost (USD 1 000) 87 127 213 278 225 322Total (USD 1 000) 436 638 1 279 1 668 1 728 2 471
Source: DWV, 2003.
Table 2.12
Projected investment costs for refuelling stations with on-site hydrogenproduction from steam reforming in 2030
SMR/PSA ATR/PSA SMR/Membrane ATR/Membrane(USD/GJ) (USD/GJ) (USD/GJ) (USD/GJ)
Reformer system 24.53 20.33 27.21 22.93Hydrogen compressor 4.13 4.13 5.05 5.05Hydrogen storage 8.65 8.65 8.65 8.65Dispenser 4.11 4.11 4.11 4.11Other cost 4.25 4.11 4.32 3.8710% contingency 4.57 4.13 4.93 4.46Total 50.23 45.45 54.27 49.07
Source: Myers, 2002.Note: The calculations are for a 115 kg H2/day station (25 cars/day or 0.005 PJ/yr). H2 storage at the refuelling station at 475 bar, foron-board storage at 350 bar.
Table 2.12 contains estimates of the investment needs of refuelling stations in 2030 where hydrogenis produced on-site by natural gas reforming. These estimates suggest that not only is the overallcost of stations expected to fall, compared to the current costs presented in Table 2.10, but thatthe cost of the reformer will fall to about 50% of the total cost of the refuelling station. However,more data is needed from experience at actual commercial refuelling stations before the true costof hydrogen refuelling stations will become clear.
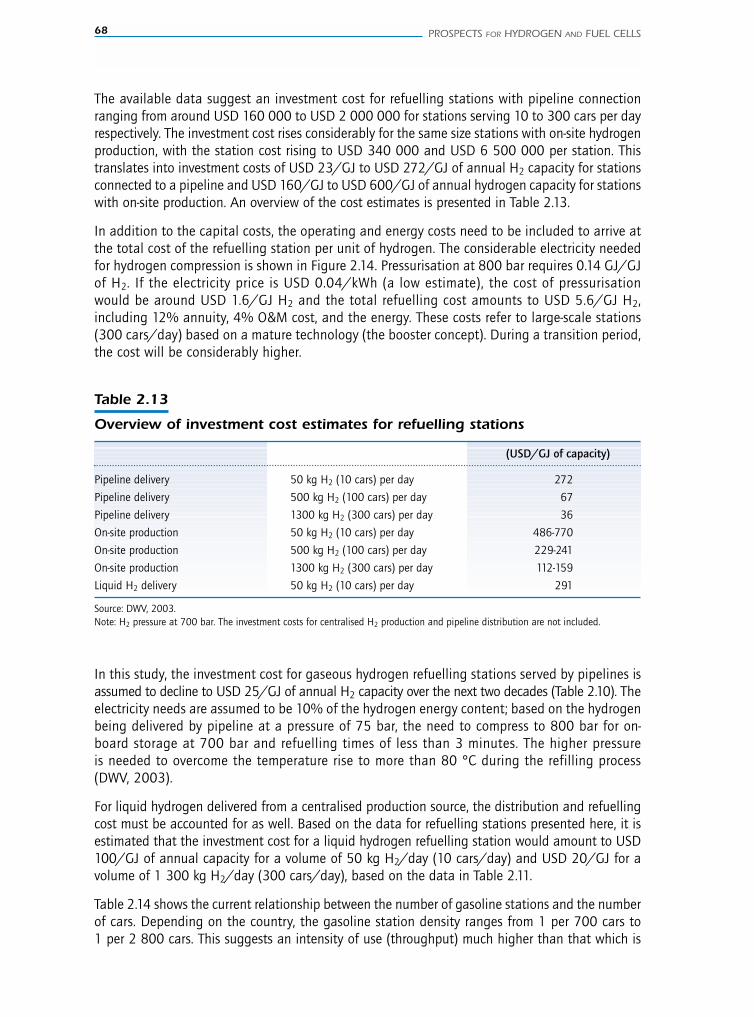
In this study, the investment cost for gaseous hydrogen refuelling stations served by pipelines isassumed to decline to USD 25/GJ of annual H2 capacity over the next two decades (Table 2.10). Theelectricity needs are assumed to be 10% of the hydrogen energy content; based on the hydrogenbeing delivered by pipeline at a pressure of 75 bar, the need to compress to 800 bar for on-board storage at 700 bar and refuelling times of less than 3 minutes. The higher pressureis needed to overcome the temperature rise to more than 80 °C during the refilling process(DWV, 2003).
For liquid hydrogen delivered from a centralised production source, the distribution and refuellingcost must be accounted for as well. Based on the data for refuelling stations presented here, it isestimated that the investment cost for a liquid hydrogen refuelling station would amount to USD100/GJ of annual capacity for a volume of 50 kg H2/day (10 cars/day) and USD 20/GJ for avolume of 1 300 kg H2/day (300 cars/day), based on the data in Table 2.11.
Table 2.14 shows the current relationship between the number of gasoline stations and the numberof cars. Depending on the country, the gasoline station density ranges from 1 per 700 cars to1 per 2 800 cars. This suggests an intensity of use (throughput) much higher than that which is
68 PROSPECTS FOR HYDROGEN AND FUEL CELLS
The available data suggest an investment cost for refuelling stations with pipeline connectionranging from around USD 160 000 to USD 2 000 000 for stations serving 10 to 300 cars per dayrespectively. The investment cost rises considerably for the same size stations with on-site hydrogenproduction, with the station cost rising to USD 340 000 and USD 6 500 000 per station. Thistranslates into investment costs of USD 23/GJ to USD 272/GJ of annual H2 capacity for stationsconnected to a pipeline and USD 160/GJ to USD 600/GJ of annual hydrogen capacity for stationswith on-site production. An overview of the cost estimates is presented in Table 2.13.
In addition to the capital costs, the operating and energy costs need to be included to arrive atthe total cost of the refuelling station per unit of hydrogen. The considerable electricity neededfor hydrogen compression is shown in Figure 2.14. Pressurisation at 800 bar requires 0.14 GJ/GJof H2. If the electricity price is USD 0.04/kWh (a low estimate), the cost of pressurisationwould be around USD 1.6/GJ H2 and the total refuelling cost amounts to USD 5.6/GJ H2,including 12% annuity, 4% O&M cost, and the energy. These costs refer to large-scale stations(300 cars/day) based on a mature technology (the booster concept). During a transition period,the cost will be considerably higher.
Table 2.13
Overview of investment cost estimates for refuelling stations
(USD/GJ of capacity)
Pipeline delivery 50 kg H2 (10 cars) per day 272
Pipeline delivery 500 kg H2 (100 cars) per day 67
Pipeline delivery 1300 kg H2 (300 cars) per day 36
On-site production 50 kg H2 (10 cars) per day 486-770
On-site production 500 kg H2 (100 cars) per day 229-241
On-site production 1300 kg H2 (300 cars) per day 112-159
Liquid H2 delivery 50 kg H2 (10 cars) per day 291
Source: DWV, 2003.Note: H2 pressure at 700 bar. The investment costs for centralised H2 production and pipeline distribution are not included.
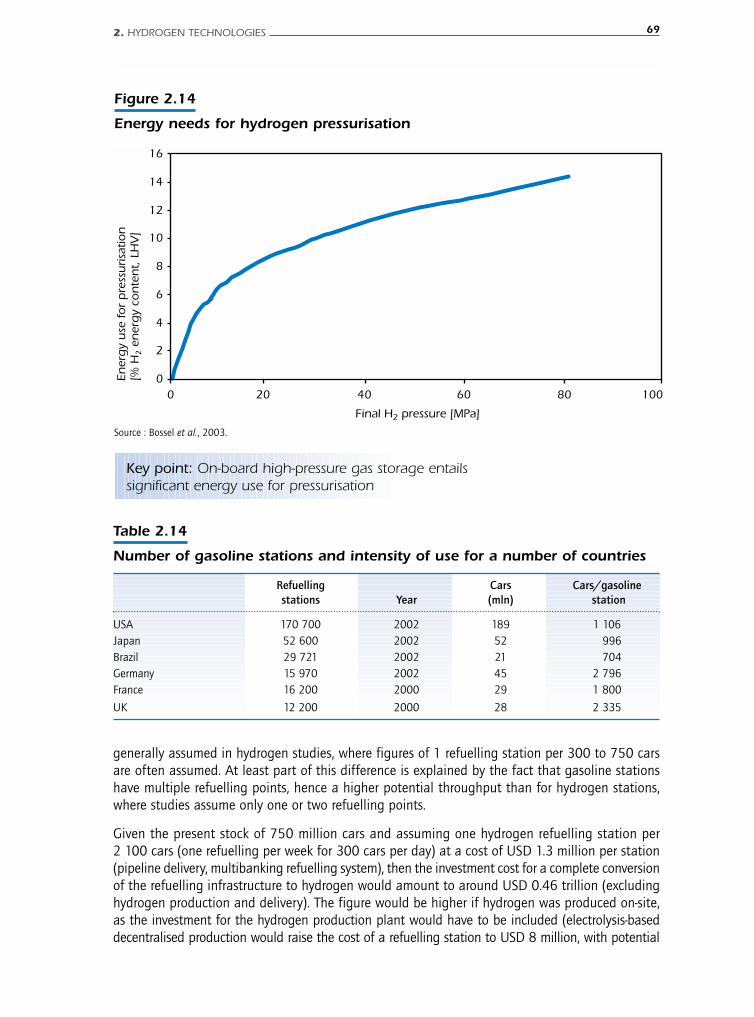
2. HYDROGEN TECHNOLOGIES 69
Figure 2.14
Energy needs for hydrogen pressurisation
0
2
4
6
8
10
12
14
16
0 20 40 60 80 100
Final H2 pressure [MPa]
Ener
gy
use
fo
r p
ress
urisa
tion
[% H
2 e
ner
gy
con
ten
t, L
HV
]
Key point: On-board high-pressure gas storage entailssignificant energy use for pressurisation
Source : Bossel et al., 2003.
generally assumed in hydrogen studies, where figures of 1 refuelling station per 300 to 750 carsare often assumed. At least part of this difference is explained by the fact that gasoline stationshave multiple refuelling points, hence a higher potential throughput than for hydrogen stations,where studies assume only one or two refuelling points.
Given the present stock of 750 million cars and assuming one hydrogen refuelling station per2 100 cars (one refuelling per week for 300 cars per day) at a cost of USD 1.3 million per station(pipeline delivery, multibanking refuelling system), then the investment cost for a complete conversionof the refuelling infrastructure to hydrogen would amount to around USD 0.46 trillion (excludinghydrogen production and delivery). The figure would be higher if hydrogen was produced on-site,as the investment for the hydrogen production plant would have to be included (electrolysis-baseddecentralised production would raise the cost of a refuelling station to USD 8 million, with potential
Table 2.14
Number of gasoline stations and intensity of use for a number of countries
Refuelling Cars Cars/gasolinestations Year (mln) station
USA 170 700 2002 189 1 106Japan 52 600 2002 52 996Brazil 29 721 2002 21 704Germany 15 970 2002 45 2 796France 16 200 2000 29 1 800
UK 12 200 2000 28 2 335

70 PROSPECTS FOR HYDROGEN AND FUEL CELLS
for reductions to USD 2.5 million). However, the actual cost could vary considerably depending on theextent of the success of hydrogen in displacing conventional fuels, the rate of growth in car ownership,etc. This potential investment is also not all incremental, because part of these costs would be incurredfor conventional stations in any event. For example, the cost of a gasoline refuelling station is aroundUSD 0.2-0.5 million (depending on location and throughput and excluding restaurant, grocery store, landcost, etc.). Therefore, the incremental investment cost for a hydrogen refuelling infrastructure might besomewhere between USD 0.3 trillion for centralised hydrogen production and USD 0.7 trillion if productionis decentralised. Previous studies (Table 2.15) have arrived at lower estimates of the investment requiredfor refuelling stations because they assume only part of the vehicle fleet will use hydrogen.
Table 2.15
Different estimates of the investment required for the transition to hydrogen
Region Refuelling Centralised Assumptions Sourcestations + distribution
EU EUR 6.3-23.6 bn n.a. 5% of transportation (Mulder andfuels in 2020 Girard, 2005)
EU EUR 120-180 bn EUR 60-120 bn 60 000 refuelling (Wurster,stations by 2020 2002)
EU USD 4.6 bn 2 800 refuelling Lindestations by 2020
EU EUR 7-11 bn EUR 0-3 bn 10 000 refuelling (H2 Steering Panel,stations by 2020 2004, based on HyNet)
USA USD 80-420 bn USD 0-390 bn 100 million FCVs (Mintz, 2002)
California USD 0.6-1.1 bn 2 500 stations, (Directed183-1464 cars/day Technologies)
Large-scale hydrogen storage
The cost of hydrogen storage depends on the technology used, storage capacity and the length oftime the hydrogen is stored. Underground gas storage, where hydrogen is compressed and injectedinto underground storage aquifers or caverns, is the best method for storing large quantities ofhydrogen over long periods of time. Three types of underground storage sites exist: depleted gasfields (and closed aquifers), salt mine caverns and hardrock mine caverns. The cost of these differentcaverns ranges from zero to more than USD 50/m3.
The investment required for an underground storage facility, excluding the compressor, is in therange of USD 3.0-6.8/GJ of hydrogen storage capacity. This comprises the underground cavern oraquifer cost and the wells required for injecting the hydrogen. The cavern cost is in the range ofzero to USD 3.8/GJ, assuming that the storage capacity at 200 bar and 100 °C is about 13.3 kg H2/m3.The cost of the wells for injecting the hydrogen is assumed to be USD 1 million per well for a storagecapacity of 0.3 PJ (22.6 Mm3) per well, or USD 3/GJ.
The energy needed to compress the hydrogen from 1 to 200 bar is around 7% of the H2 energycontent (Bossel et al., 2003). However, it is assumed that 70% of this energy can be recovered whenthe gas re-expands to 1 bar. The electricity needs for storage therefore amount to 2.1% of the energycontent, although Amos (1998) assumes a figure of 2.2 kWh/kg, which equals 6.6 MJel/GJ H2 or 0.66%of the energy content. This study makes the conservative assumption that there will be one storagecycle a year, i.e. one filling and one extraction per year. It is also assumed that the storage site is filled in

one month. The size of the compressor is determined by the filling time. Storing 0.3 PJ hydrogen in1 month requires an 8 MW compressor (i.e. capable of 3.5 t/hr), as well as an expander for energy recovery.
The total investment cost (including cavern, compressor, expander, and auxiliary equipment) isassumed to be USD 15/GJ of annual capacity if there is one storage cycle per annum. However,this figure declines - due to the higher utilisation of the storage system - if there is more than onestorage cycle per annum.
To calculate the total storage cost, O&M costs are set at 1.5% of the investment cost (USD 0.23/GJper annum), the annuity at 12% of the investment cost and the price of electricity is assumed tobe USD 0.04/kWh. Given these assumptions, the total storage cost equals some USD 2.7/GJ,84% of which is capital cost.6 More than one filling and extraction cycle per year would reducethe capital cost considerably.
2. HYDROGEN TECHNOLOGIES 71
6. The cost calculations do not include any allowance for hydrogen losses.
Hydrogen as an electricity storage mediumHydrogen has the potential to be a storage medium for electricity, as electricity can be usedto produce hydrogen through electrolysis, while that same hydrogen could then produceelectricity using the same device, i.e. PEM fuel cells/electrolysers. Using hydrogen to storeelectricity is an option that might be attractive for intermittent renewable electricity sources.Tiax (2002) has compared various short-term electricity storage options, including the useof fuel cells and hydrogen. Although lead-acid batteries were the least-cost option, with acapital cost of only USD 210/kW, Tiax estimates in the long-run that the cost of a PEMsystem could be similar (USD 220/kW). However, the overall energy efficiency would onlybe 45% for the fuel cell and hydrogen storage, compared to 85% for the lead-acid battery.The production of hydrogen from electricity at times of low demand, followed by use in fuelcells during peak demand periods is not a viable competitor to battery storage. Regardinglarge-scale electricity storage, pumped hydro and underground pressurised air storage showbetter characteristics (higher efficiency and lower cost) than the fuel cell and hydrogen option.
Hydrogen could also be produced from off-peak electricity and stored for later use, e.g. asa transportation fuel, resulting in better use of existing electrical capacity. Depending onthe choice of diurnal or seasonal production patterns, the hydrogen storage capacity requiredmight vary significantly. The problem with the production of hydrogen from off-peak electricityis that the electrolyser capacity factor would be low (in the order of 20-30%). This wouldsignificantly increase the cost of the hydrogen produced, even if electrolysers decline inprice substantially. For example, at USD 0.03/kWh, the electricity cost would amount toUSD 11/GJ H2 and the total production cost would be around USD 15-17/GJ H2.
On-board hydrogen storage
Although hydrogen storage is required for both stationary and automotive applications, the mainR&D focus is directed at the question of on-board storage in either fuel cell vehicles or ICE/electrichybrid vehicles. Storing hydrogen, with its low energy content density, is a challenging pre-conditionfor introducing hydrogen as a transportation fuel.
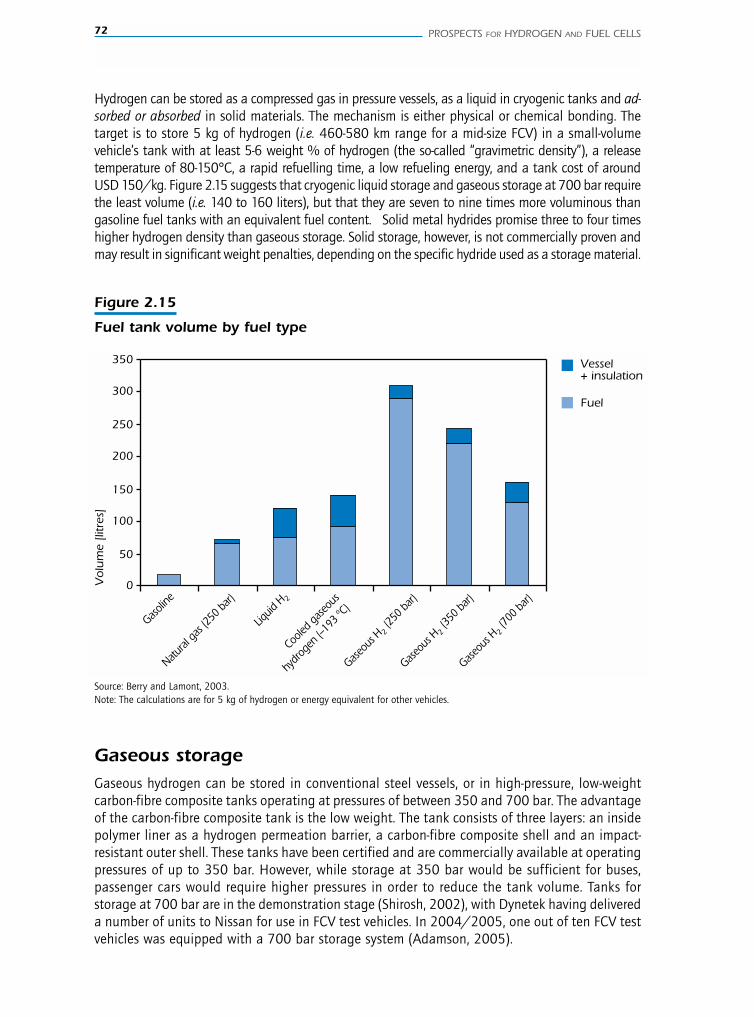
72 PROSPECTS FOR HYDROGEN AND FUEL CELLS
Hydrogen can be stored as a compressed gas in pressure vessels, as a liquid in cryogenic tanks and ad-sorbed or absorbed in solid materials. The mechanism is either physical or chemical bonding. Thetarget is to store 5 kg of hydrogen (i.e. 460-580 km range for a mid-size FCV) in a small-volumevehicle’s tank with at least 5-6 weight % of hydrogen (the so-called “gravimetric density”), a releasetemperature of 80-150°C, a rapid refuelling time, a low refueling energy, and a tank cost of aroundUSD 150/kg. Figure 2.15 suggests that cryogenic liquid storage and gaseous storage at 700 bar requirethe least volume (i.e. 140 to 160 liters), but that they are seven to nine times more voluminous thangasoline fuel tanks with an equivalent fuel content. Solid metal hydrides promise three to four timeshigher hydrogen density than gaseous storage. Solid storage, however, is not commercially proven andmay result in significant weight penalties, depending on the specific hydride used as a storage material.
Figure 2.15
Fuel tank volume by fuel type
0
50
100
150
200
250
300
350
Vo
lum
e [li
tres
]
Vessel + insulation
Fuel
Gasolin
e
Natural
gas (
250 b
ar)
Liquid
H 2
Cooled
gaseo
us
hydr
ogen
(–19
3 ºC)
Gaseou
s H2 (2
50 ba
r)
Gaseou
s H2 (3
50 ba
r)
Gaseou
s H2 (7
00 ba
r)
Source: Berry and Lamont, 2003.Note: The calculations are for 5 kg of hydrogen or energy equivalent for other vehicles.
Gaseous storageGaseous hydrogen can be stored in conventional steel vessels, or in high-pressure, low-weightcarbon-fibre composite tanks operating at pressures of between 350 and 700 bar. The advantageof the carbon-fibre composite tank is the low weight. The tank consists of three layers: an insidepolymer liner as a hydrogen permeation barrier, a carbon-fibre composite shell and an impact-resistant outer shell. These tanks have been certified and are commercially available at operatingpressures of up to 350 bar. However, while storage at 350 bar would be sufficient for buses,passenger cars would require higher pressures in order to reduce the tank volume. Tanks forstorage at 700 bar are in the demonstration stage (Shirosh, 2002), with Dynetek having delivereda number of units to Nissan for use in FCV test vehicles. In 2004/2005, one out of ten FCV testvehicles was equipped with a 700 bar storage system (Adamson, 2005).
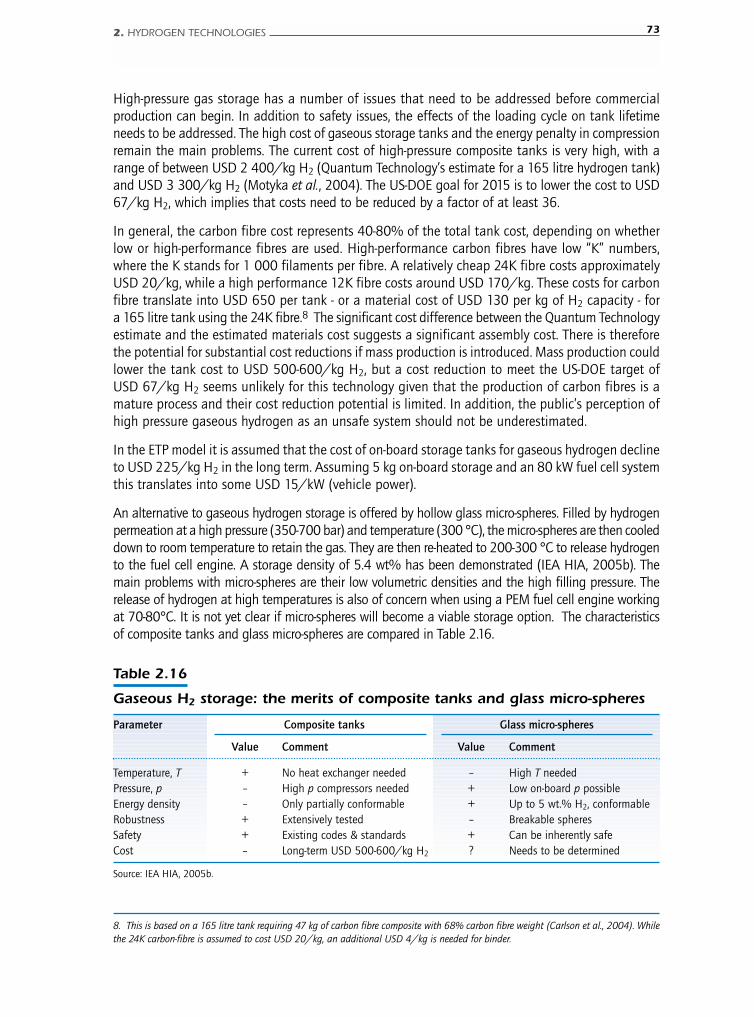
High-pressure gas storage has a number of issues that need to be addressed before commercialproduction can begin. In addition to safety issues, the effects of the loading cycle on tank lifetimeneeds to be addressed. The high cost of gaseous storage tanks and the energy penalty in compressionremain the main problems. The current cost of high-pressure composite tanks is very high, with arange of between USD 2 400/kg H2 (Quantum Technology’s estimate for a 165 litre hydrogen tank)and USD 3 300/kg H2 (Motyka et al., 2004). The US-DOE goal for 2015 is to lower the cost to USD67/kg H2, which implies that costs need to be reduced by a factor of at least 36.
In general, the carbon fibre cost represents 40-80% of the total tank cost, depending on whetherlow or high-performance fibres are used. High-performance carbon fibres have low “K” numbers,where the K stands for 1 000 filaments per fibre. A relatively cheap 24K fibre costs approximatelyUSD 20/kg, while a high performance 12K fibre costs around USD 170/kg. These costs for carbonfibre translate into USD 650 per tank - or a material cost of USD 130 per kg of H2 capacity - fora 165 litre tank using the 24K fibre.8 The significant cost difference between the Quantum Technologyestimate and the estimated materials cost suggests a significant assembly cost. There is thereforethe potential for substantial cost reductions if mass production is introduced. Mass production couldlower the tank cost to USD 500-600/kg H2, but a cost reduction to meet the US-DOE target ofUSD 67/kg H2 seems unlikely for this technology given that the production of carbon fibres is amature process and their cost reduction potential is limited. In addition, the public’s perception ofhigh pressure gaseous hydrogen as an unsafe system should not be underestimated.
In the ETP model it is assumed that the cost of on-board storage tanks for gaseous hydrogen declineto USD 225/kg H2 in the long term. Assuming 5 kg on-board storage and an 80 kW fuel cell systemthis translates into some USD 15/kW (vehicle power).
An alternative to gaseous hydrogen storage is offered by hollow glass micro-spheres. Filled by hydrogenpermeation at a high pressure (350-700 bar) and temperature (300 °C), the micro-spheres are then cooleddown to room temperature to retain the gas. They are then re-heated to 200-300 °C to release hydrogento the fuel cell engine. A storage density of 5.4 wt% has been demonstrated (IEA HIA, 2005b). Themain problems with micro-spheres are their low volumetric densities and the high filling pressure. Therelease of hydrogen at high temperatures is also of concern when using a PEM fuel cell engine workingat 70-80°C. It is not yet clear if micro-spheres will become a viable storage option. The characteristicsof composite tanks and glass micro-spheres are compared in Table 2.16.
2. HYDROGEN TECHNOLOGIES 73
8. This is based on a 165 litre tank requiring 47 kg of carbon fibre composite with 68% carbon fibre weight (Carlson et al., 2004). Whilethe 24K carbon-fibre is assumed to cost USD 20/kg, an additional USD 4/kg is needed for binder.
Table 2.16
Gaseous H2 storage: the merits of composite tanks and glass micro-spheres
Parameter Composite tanks Glass micro-spheres
Value Comment Value Comment
Temperature, T + No heat exchanger needed – High T neededPressure, p – High p compressors needed + Low on-board p possibleEnergy density – Only partially conformable + Up to 5 wt.% H2, conformableRobustness + Extensively tested – Breakable spheresSafety + Existing codes & standards + Can be inherently safeCost – Long-term USD 500-600/kg H2 ? Needs to be determined
Source: IEA HIA, 2005b.
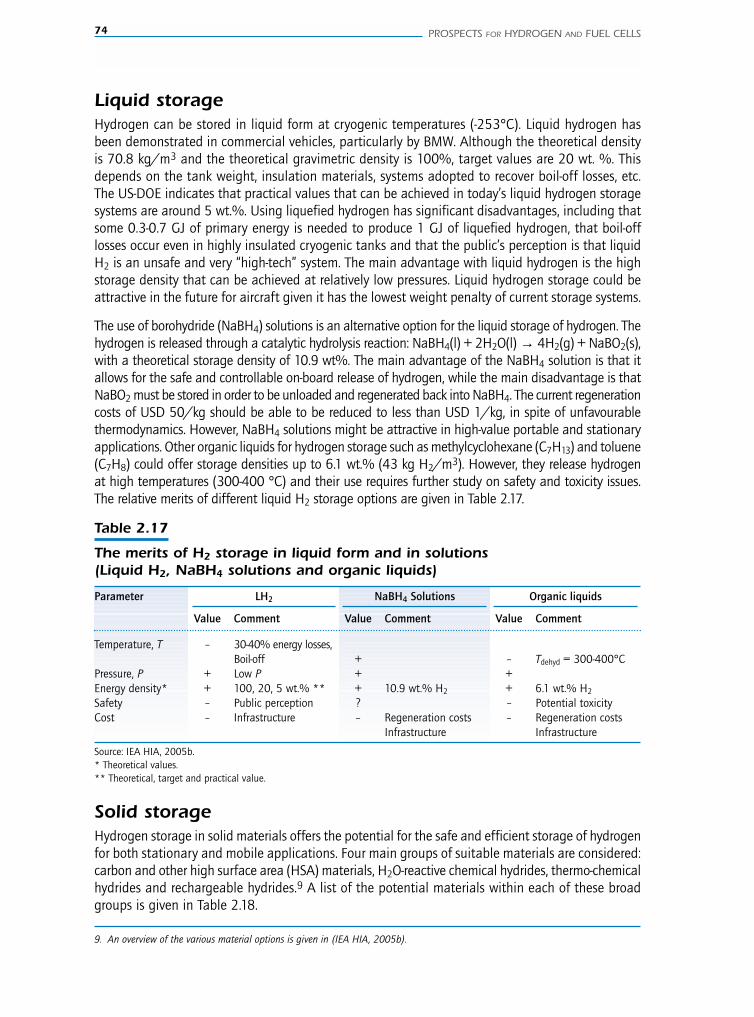
74 PROSPECTS FOR HYDROGEN AND FUEL CELLS
Liquid storageHydrogen can be stored in liquid form at cryogenic temperatures (-253°C). Liquid hydrogen hasbeen demonstrated in commercial vehicles, particularly by BMW. Although the theoretical densityis 70.8 kg/m3 and the theoretical gravimetric density is 100%, target values are 20 wt. %. Thisdepends on the tank weight, insulation materials, systems adopted to recover boil-off losses, etc.The US-DOE indicates that practical values that can be achieved in today’s liquid hydrogen storagesystems are around 5 wt.%. Using liquefied hydrogen has significant disadvantages, including thatsome 0.3-0.7 GJ of primary energy is needed to produce 1 GJ of liquefied hydrogen, that boil-offlosses occur even in highly insulated cryogenic tanks and that the public’s perception is that liquidH2 is an unsafe and very “high-tech” system. The main advantage with liquid hydrogen is the highstorage density that can be achieved at relatively low pressures. Liquid hydrogen storage could beattractive in the future for aircraft given it has the lowest weight penalty of current storage systems.
The use of borohydride (NaBH4) solutions is an alternative option for the liquid storage of hydrogen. Thehydrogen is released through a catalytic hydrolysis reaction: NaBH4(l) + 2H2O(l) → 4H2(g) + NaBO2(s),with a theoretical storage density of 10.9 wt%. The main advantage of the NaBH4 solution is that itallows for the safe and controllable on-board release of hydrogen, while the main disadvantage is thatNaBO2 must be stored in order to be unloaded and regenerated back into NaBH4. The current regenerationcosts of USD 50/kg should be able to be reduced to less than USD 1/kg, in spite of unfavourablethermodynamics. However, NaBH4 solutions might be attractive in high-value portable and stationaryapplications. Other organic liquids for hydrogen storage such as methylcyclohexane (C7H13) and toluene(C7H8) could offer storage densities up to 6.1 wt.% (43 kg H2/m3). However, they release hydrogenat high temperatures (300-400 °C) and their use requires further study on safety and toxicity issues.The relative merits of different liquid H2 storage options are given in Table 2.17.
Table 2.17
The merits of H2 storage in liquid form and in solutions(Liquid H2, NaBH4 solutions and organic liquids)
Parameter LH2 NaBH4 Solutions Organic liquids
Value Comment Value Comment Value Comment
Temperature, T – 30-40% energy losses,Boil-off + – Tdehyd = 300-400°C
Pressure, P + Low P + +Energy density* + 100, 20, 5 wt.% ** + 10.9 wt.% H2 + 6.1 wt.% H2
Safety – Public perception ? – Potential toxicityCost – Infrastructure – Regeneration costs – Regeneration costs
Infrastructure Infrastructure
Source: IEA HIA, 2005b.* Theoretical values.** Theoretical, target and practical value.
Solid storage Hydrogen storage in solid materials offers the potential for the safe and efficient storage of hydrogenfor both stationary and mobile applications. Four main groups of suitable materials are considered:carbon and other high surface area (HSA) materials, H2O-reactive chemical hydrides, thermo-chemicalhydrides and rechargeable hydrides.9 A list of the potential materials within each of these broadgroups is given in Table 2.18.
9. An overview of the various material options is given in (IEA HIA, 2005b).
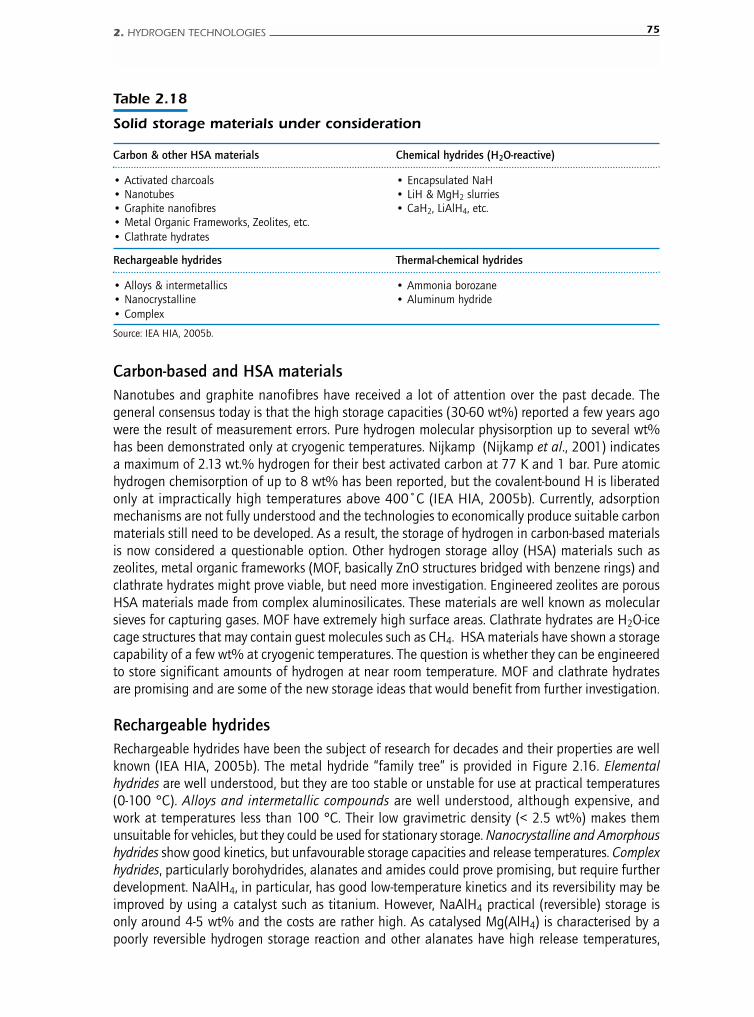
Carbon-based and HSA materialsNanotubes and graphite nanofibres have received a lot of attention over the past decade. Thegeneral consensus today is that the high storage capacities (30-60 wt%) reported a few years agowere the result of measurement errors. Pure hydrogen molecular physisorption up to several wt%has been demonstrated only at cryogenic temperatures. Nijkamp (Nijkamp et al., 2001) indicatesa maximum of 2.13 wt.% hydrogen for their best activated carbon at 77 K and 1 bar. Pure atomichydrogen chemisorption of up to 8 wt% has been reported, but the covalent-bound H is liberatedonly at impractically high temperatures above 400˚C (IEA HIA, 2005b). Currently, adsorptionmechanisms are not fully understood and the technologies to economically produce suitable carbonmaterials still need to be developed. As a result, the storage of hydrogen in carbon-based materialsis now considered a questionable option. Other hydrogen storage alloy (HSA) materials such aszeolites, metal organic frameworks (MOF, basically ZnO structures bridged with benzene rings) andclathrate hydrates might prove viable, but need more investigation. Engineered zeolites are porousHSA materials made from complex aluminosilicates. These materials are well known as molecularsieves for capturing gases. MOF have extremely high surface areas. Clathrate hydrates are H2O-icecage structures that may contain guest molecules such as CH4. HSA materials have shown a storagecapability of a few wt% at cryogenic temperatures. The question is whether they can be engineeredto store significant amounts of hydrogen at near room temperature. MOF and clathrate hydratesare promising and are some of the new storage ideas that would benefit from further investigation.
Rechargeable hydrides Rechargeable hydrides have been the subject of research for decades and their properties are wellknown (IEA HIA, 2005b). The metal hydride “family tree” is provided in Figure 2.16. Elementalhydrides are well understood, but they are too stable or unstable for use at practical temperatures(0-100 °C). Alloys and intermetallic compounds are well understood, although expensive, andwork at temperatures less than 100 °C. Their low gravimetric density (< 2.5 wt%) makes themunsuitable for vehicles, but they could be used for stationary storage. Nanocrystalline and Amorphoushydrides show good kinetics, but unfavourable storage capacities and release temperatures. Complexhydrides, particularly borohydrides, alanates and amides could prove promising, but require furtherdevelopment. NaAlH4, in particular, has good low-temperature kinetics and its reversibility may beimproved by using a catalyst such as titanium. However, NaAlH4 practical (reversible) storage isonly around 4-5 wt% and the costs are rather high. As catalysed Mg(AlH4) is characterised by apoorly reversible hydrogen storage reaction and other alanates have high release temperatures,
2. HYDROGEN TECHNOLOGIES 75
Table 2.18
Solid storage materials under consideration
Carbon & other HSA materials Chemical hydrides (H2O-reactive)
• Activated charcoals • Encapsulated NaH• Nanotubes • LiH & MgH2 slurries• Graphite nanofibres • CaH2, LiAlH4, etc.• Metal Organic Frameworks, Zeolites, etc.• Clathrate hydrates
Rechargeable hydrides Thermal-chemical hydrides
• Alloys & intermetallics • Ammonia borozane• Nanocrystalline • Aluminum hydride• Complex
Source: IEA HIA, 2005b.
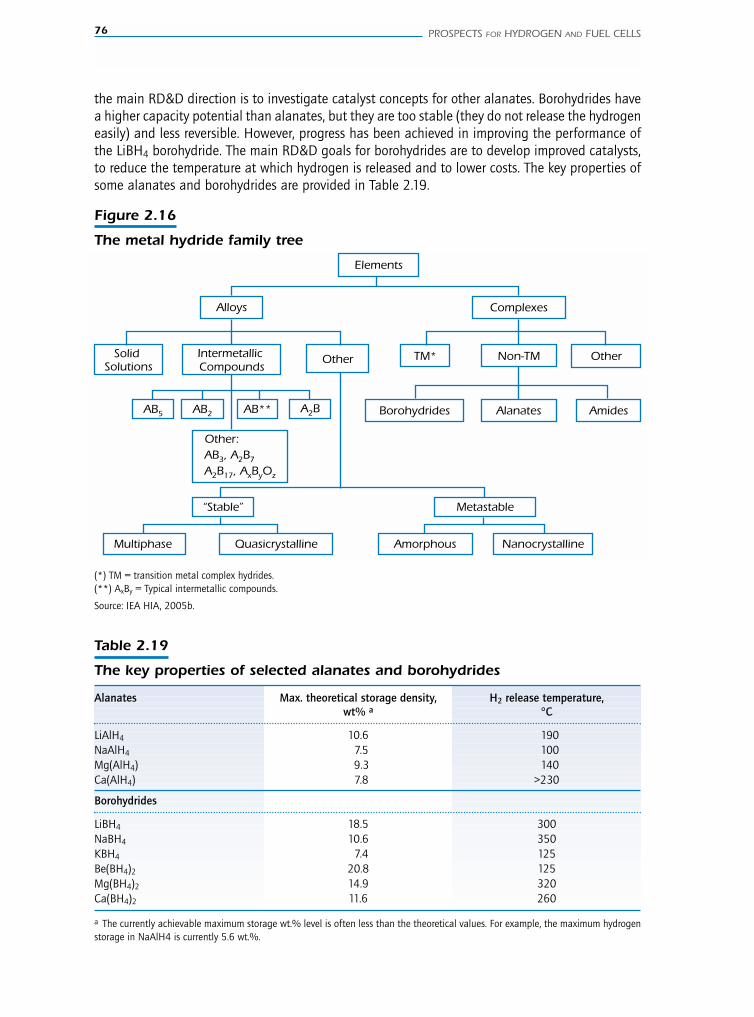
76 PROSPECTS FOR HYDROGEN AND FUEL CELLS
the main RD&D direction is to investigate catalyst concepts for other alanates. Borohydrides havea higher capacity potential than alanates, but they are too stable (they do not release the hydrogeneasily) and less reversible. However, progress has been achieved in improving the performance ofthe LiBH4 borohydride. The main RD&D goals for borohydrides are to develop improved catalysts,to reduce the temperature at which hydrogen is released and to lower costs. The key properties ofsome alanates and borohydrides are provided in Table 2.19.
Figure 2.16
The metal hydride family tree
Elements
Alloys
TM* Non-TM
AmidesBorohydrides
Complexes
Other
Alanates
Solid Solutions
Intermetallic Compounds
Other
AB5 AB2 AB** A2B
“Stable” Metastable
Multiphase Quasicrystalline
Other:AB3, A2B7
A2B17, AxByOz
Amorphous Nanocrystalline
(*) TM = transition metal complex hydrides.(**) AxBy = Typical intermetallic compounds.
Source: IEA HIA, 2005b.
Table 2.19
The key properties of selected alanates and borohydrides
Alanates Max. theoretical storage density, H2 release temperature,wt% a °C
LiAlH4 10.6 190NaAlH4 7.5 100Mg(AlH4) 9.3 140Ca(AlH4) 7.8 >230
Borohydrides
LiBH4 18.5 300NaBH4 10.6 350KBH4 7.4 125Be(BH4)2 20.8 125Mg(BH4)2 14.9 320Ca(BH4)2 11.6 260
a The currently achievable maximum storage wt.% level is often less than the theoretical values. For example, the maximum hydrogenstorage in NaAlH4 is currently 5.6 wt.%.
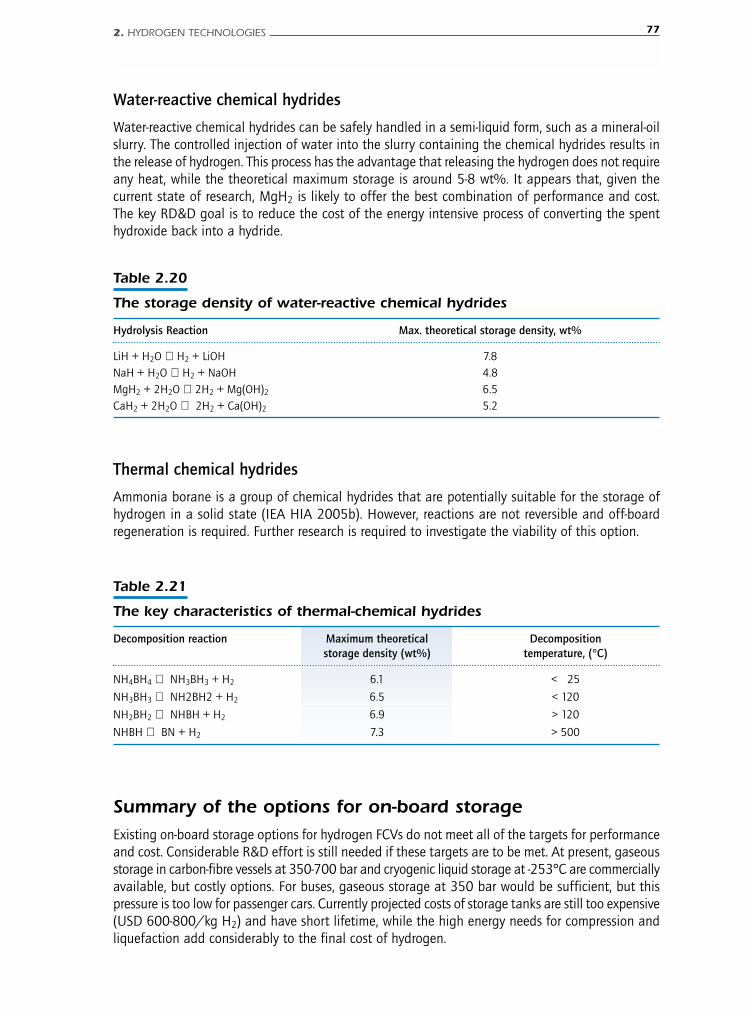
Water-reactive chemical hydrides
Water-reactive chemical hydrides can be safely handled in a semi-liquid form, such as a mineral-oilslurry. The controlled injection of water into the slurry containing the chemical hydrides results inthe release of hydrogen. This process has the advantage that releasing the hydrogen does not requireany heat, while the theoretical maximum storage is around 5-8 wt%. It appears that, given thecurrent state of research, MgH2 is likely to offer the best combination of performance and cost.The key RD&D goal is to reduce the cost of the energy intensive process of converting the spenthydroxide back into a hydride.
2. HYDROGEN TECHNOLOGIES 77
Table 2.20
The storage density of water-reactive chemical hydrides
Hydrolysis Reaction Max. theoretical storage density, wt%
LiH + H2O ⇒ H2 + LiOH 7.8NaH + H2O ⇒ H2 + NaOH 4.8MgH2 + 2H2O ⇒ 2H2 + Mg(OH)2 6.5CaH2 + 2H2O ⇒ 2H2 + Ca(OH)2 5.2
Thermal chemical hydrides
Ammonia borane is a group of chemical hydrides that are potentially suitable for the storage ofhydrogen in a solid state (IEA HIA 2005b). However, reactions are not reversible and off-boardregeneration is required. Further research is required to investigate the viability of this option.
Table 2.21
The key characteristics of thermal-chemical hydrides
Decomposition reaction Maximum theoretical Decompositionstorage density (wt%) temperature, (°C)
NH4BH4 ⇒ NH3BH3 + H2 6.1 < 25
NH3BH3 ⇒ NH2BH2 + H2 6.5 < 120
NH2BH2 ⇒ NHBH + H2 6.9 > 120
NHBH ⇒ BN + H2 7.3 > 500
Summary of the options for on-board storage Existing on-board storage options for hydrogen FCVs do not meet all of the targets for performanceand cost. Considerable R&D effort is still needed if these targets are to be met. At present, gaseousstorage in carbon-fibre vessels at 350-700 bar and cryogenic liquid storage at -253°C are commerciallyavailable, but costly options. For buses, gaseous storage at 350 bar would be sufficient, but thispressure is too low for passenger cars. Currently projected costs of storage tanks are still too expensive(USD 600-800/kg H2) and have short lifetime, while the high energy needs for compression andliquefaction add considerably to the final cost of hydrogen.
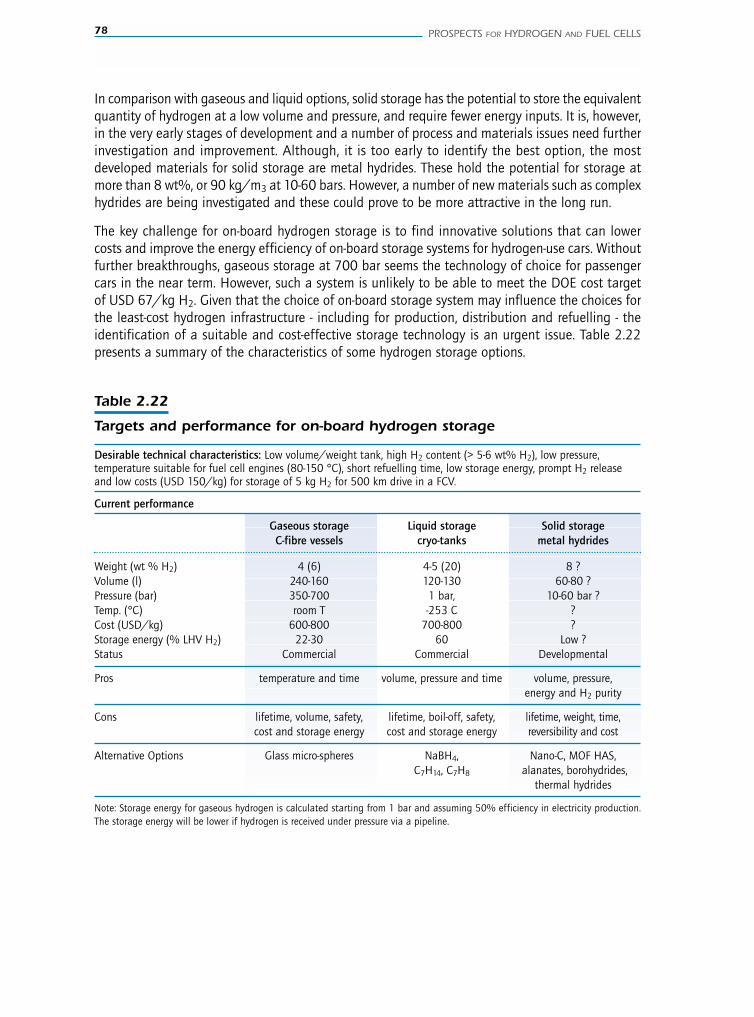
78 PROSPECTS FOR HYDROGEN AND FUEL CELLS
In comparison with gaseous and liquid options, solid storage has the potential to store the equivalentquantity of hydrogen at a low volume and pressure, and require fewer energy inputs. It is, however,in the very early stages of development and a number of process and materials issues need furtherinvestigation and improvement. Although, it is too early to identify the best option, the mostdeveloped materials for solid storage are metal hydrides. These hold the potential for storage atmore than 8 wt%, or 90 kg/m3 at 10-60 bars. However, a number of new materials such as complexhydrides are being investigated and these could prove to be more attractive in the long run.
The key challenge for on-board hydrogen storage is to find innovative solutions that can lowercosts and improve the energy efficiency of on-board storage systems for hydrogen-use cars. Withoutfurther breakthroughs, gaseous storage at 700 bar seems the technology of choice for passengercars in the near term. However, such a system is unlikely to be able to meet the DOE cost targetof USD 67/kg H2. Given that the choice of on-board storage system may influence the choices forthe least-cost hydrogen infrastructure - including for production, distribution and refuelling - theidentification of a suitable and cost-effective storage technology is an urgent issue. Table 2.22presents a summary of the characteristics of some hydrogen storage options.
Table 2.22
Targets and performance for on-board hydrogen storage
Desirable technical characteristics: Low volume/weight tank, high H2 content (> 5-6 wt% H2), low pressure,temperature suitable for fuel cell engines (80-150 °C), short refuelling time, low storage energy, prompt H2 releaseand low costs (USD 150/kg) for storage of 5 kg H2 for 500 km drive in a FCV.
Current performance
Gaseous storage Liquid storage Solid storageC-fibre vessels cryo-tanks metal hydrides
Weight (wt % H2) 4 (6) 4-5 (20) 8 ?Volume (l) 240-160 120-130 60-80 ?Pressure (bar) 350-700 1 bar, 10-60 bar ?Temp. (°C) room T -253 C ?Cost (USD/kg) 600-800 700-800 ? Storage energy (% LHV H2) 22-30 60 Low ?Status Commercial Commercial Developmental
Pros temperature and time volume, pressure and time volume, pressure,energy and H2 purity
Cons lifetime, volume, safety, lifetime, boil-off, safety, lifetime, weight, time,cost and storage energy cost and storage energy reversibility and cost
Alternative Options Glass micro-spheres NaBH4, Nano-C, MOF HAS,C7H14, C7H8 alanates, borohydrides,
thermal hydrides
Note: Storage energy for gaseous hydrogen is calculated starting from 1 bar and assuming 50% efficiency in electricity production.The storage energy will be lower if hydrogen is received under pressure via a pipeline.
3. FUEL CELLS AND OTHER HYDROGEN END-USE TECHNOLOGIES 79
Chapter 3.FUEL CELLS AND OTHER HYDROGENEND-USE TECHNOLOGIES
H I G H L I G H T S
■ Fuel cells are the technology of choice to maximise the potential benefits of hydrogen interms of energy efficiency, improved energy-security and lower emissions.
■ Proton exchange membrane fuel cells (PEMFCs) are suitable for both stationary and transportapplications. However, their sensitivity to carbon monoxide and sulphur pollutants requiresa pure hydrogen gas (e.g. hydrogen produced by electrolysis). Hydrogen from natural gasreforming or from residual industrial gases would need purification after production.
■ At present, PEMFCs seem to be the best fuel cell technology for fuel cell vehicles (FCVs).PEM technology could also be used in electrolysers to produce hydrogen, resulting inpotential synergies between FCVs and hydrogen production infrastructure. Direct EthanolFuel Cells (DEFCs) could also become an interesting option for transport, but they arestill at a very early stage of development.
■ The current stack cost of PEMFCs exceeds USD 2000/kW, but a reduction to less thanUSD 100/kW seems to be feasible. However, even this significant cost reduction wouldnot be enough to produce FCVs that are competitive with conventional vehicles. To becompetitive, PEMFCs need to reduce their costs to below USD 50/kW. This requiresfundamental advances in the materials used in PEMFCs and higher fuel cell power densities.
■ The RD&D for PEMFCs is focusing on high temperature membranes that are less proneto poisoning and enable on-board reforming. The uncertainty surrounding the hydrogenpurity that will be needed for PEM technologies means that it would be premature tomake choices for hydrogen infrastructure at this point.
■ The efficiency of hydrogen FCVs is twice that of current internal combustion engine (ICE)cars on the highway and three times as high in urban traffic. However, FCVs are notready for commercialisation. In addition to cost reductions in fuel cell stack, they need toimprove their durability and reliability. Other components, including the electric driveand hydrogen storage system, also contribute to the FCV cost. Assuming a cost of the PEMfuel cell stack of USD 35/kW and USD 75/kW in 2030, the incremental cost of FCVsover an ICE vehicle would be USD 2 200 to USD 7 600 per vehicle, respectively. The globalincremental cost for some 700 million FCVs that could be sold between now and 2050would then be in the range of USD 1-2.3 trillion.
■ Buses, delivery vans and forklifts are “niche” markets where fuel cell engines can becompetitive with traditional gasoline and diesel internal combustion engines (ICEs) at ahigher cost than for cars. It is estimated that to be competitive in buses, fuel cell stackcosts need to fall to USD 200/kW, while they need to fall to USD 135/kw for delivery
80 PROSPECTS FOR HYDROGEN AND FUEL CELLS
vans and to USD 100/kW for forklifts. Buses could in principle be the largest and mostpromising market. The early foothold FCVs could carve in these markets would contributeto cost reductions through “technology learning” that could then benefit the competitivenessof PEMFCs in the passenger car market.
■ Molten carbonate fuel cells (MCFCs) and solid oxide fuel cells (SOFCs) are the mostpromising candidates for use in stationary applications, but are not suitable for vehiclesbecause of their high operating temperatures that result in long start-up time. Theyare less sensitive to pollutants than PEMFCs and their electric efficiency is higher. Whilecurrent MCFCs are fuelled by natural gas, SOFCs can be fuelled by either hydrocarbonsor pure hydrogen. Both MCFCs and SOFCs do not require external reformers becauseof the high operating temperature.
■ Natural gas-based MCFCs and SOFCs appear to have similar prospects and share partof the market in the coming decades. However, hydrogen-fuelled SOFCs could be preferredfor reducing CO2 emissions because CO2 capture in small, decentralised fuel cell plantsis not likely to be feasible.
■ Stationary fuel cells could fill a market gap between large-scale combined heat andpower (CHP) units and small-scale boilers, thus extending the economic feasibility ofdistributed CHP to the level of buildings. However, it is not clear that they would beattractive for the decentralised generation of electricity alone, as their electrical efficiencyis still lower than that of competing technologies for centralised generation. If used forCHP applications, fuel cells could achieve overall efficiencies of around 90%. Stationaryfuel cells can bear higher costs than fuel cells for mobile applications due to their higherload factor and the higher cost of competing conventional technologies. Their cost isexpected to decline by a factor of five to ten and to become competitive once massproduction is introduced.
■ Direct methanol fuel cells (DMFCs) use methanol rather than hydrogen as a fuel andare the best candidates for portable applications, given that PEMFCs face hydrogenstorage problems and that the operating temperatures of MCFCs and SOFCs are toohigh for portable applications. However, their low efficiency makes them uneconomicfor mobile and stationary uses.
■ Portable DMFCs appear close to the point of commercialisation, while they are likelyto be followed by stationary MCFC and SOFC systems for decentralised use. More RD&Dis needed before mobile PEMFCs are ready for commercialisation, although they areurgently needed to meet environmental and energy-security objectives.
Hydrogen and fuel cells do not need to be used together. However, the use of hydrogen-fedfuel cells holds important synergies and maximises the potential benefits in terms of energyefficiency, energy-security and the emissions of CO2 and other pollutants. As a consequence,fuel cells represent the technology of choice for using hydrogen as an energy carrier. They mightbe an attractive option in the the transport, residential, commercial, industrial and powergenerations sectors. Using hydrogen fuel cells in automotive applications represents one of thefew options capable of replacing or complementing oil use, and reducing CO2 emissions in thetransport sector.
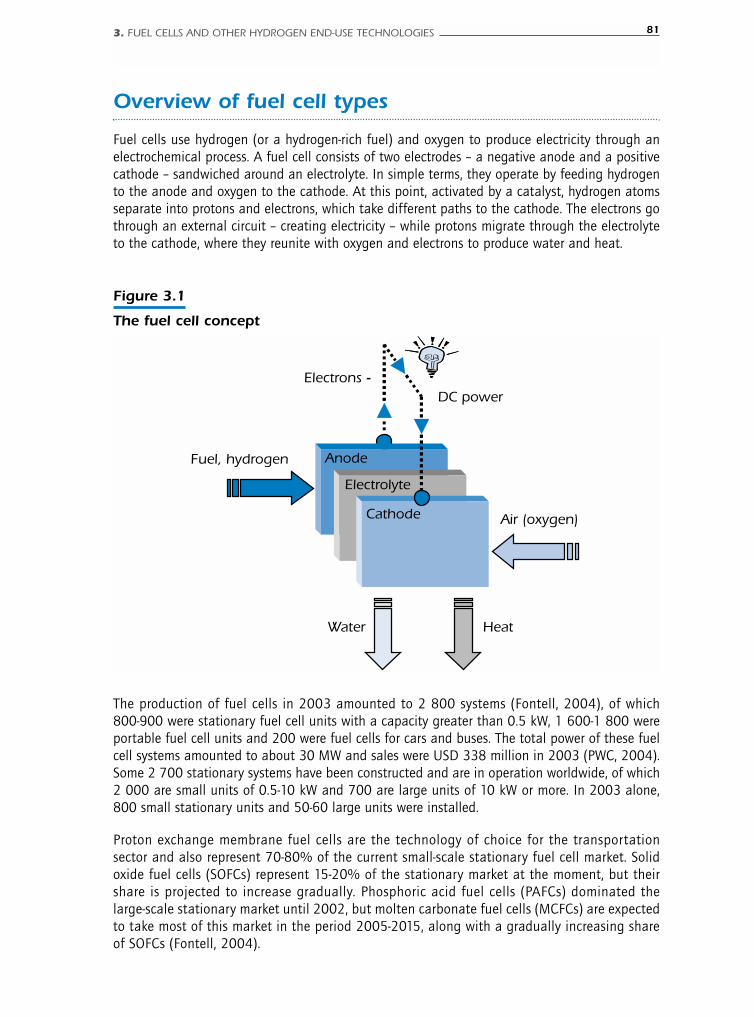
3. FUEL CELLS AND OTHER HYDROGEN END-USE TECHNOLOGIES 81
Figure 3.1
The fuel cell concept
Fuel, hydrogen
Air (oxygen)
Heat
Anode
Electrolyte
Cathode
Electrons DC power
Water
-
Overview of fuel cell types
Fuel cells use hydrogen (or a hydrogen-rich fuel) and oxygen to produce electricity through anelectrochemical process. A fuel cell consists of two electrodes – a negative anode and a positivecathode – sandwiched around an electrolyte. In simple terms, they operate by feeding hydrogento the anode and oxygen to the cathode. At this point, activated by a catalyst, hydrogen atomsseparate into protons and electrons, which take different paths to the cathode. The electrons gothrough an external circuit – creating electricity – while protons migrate through the electrolyteto the cathode, where they reunite with oxygen and electrons to produce water and heat.
The production of fuel cells in 2003 amounted to 2 800 systems (Fontell, 2004), of which800-900 were stationary fuel cell units with a capacity greater than 0.5 kW, 1 600-1 800 wereportable fuel cell units and 200 were fuel cells for cars and buses. The total power of these fuelcell systems amounted to about 30 MW and sales were USD 338 million in 2003 (PWC, 2004).Some 2 700 stationary systems have been constructed and are in operation worldwide, of which2 000 are small units of 0.5-10 kW and 700 are large units of 10 kW or more. In 2003 alone,800 small stationary units and 50-60 large units were installed.
Proton exchange membrane fuel cells are the technology of choice for the transportationsector and also represent 70-80% of the current small-scale stationary fuel cell market. Solidoxide fuel cells (SOFCs) represent 15-20% of the stationary market at the moment, but theirshare is projected to increase gradually. Phosphoric acid fuel cells (PAFCs) dominated thelarge-scale stationary market until 2002, but molten carbonate fuel cells (MCFCs) are expectedto take most of this market in the period 2005-2015, along with a gradually increasing shareof SOFCs (Fontell, 2004).
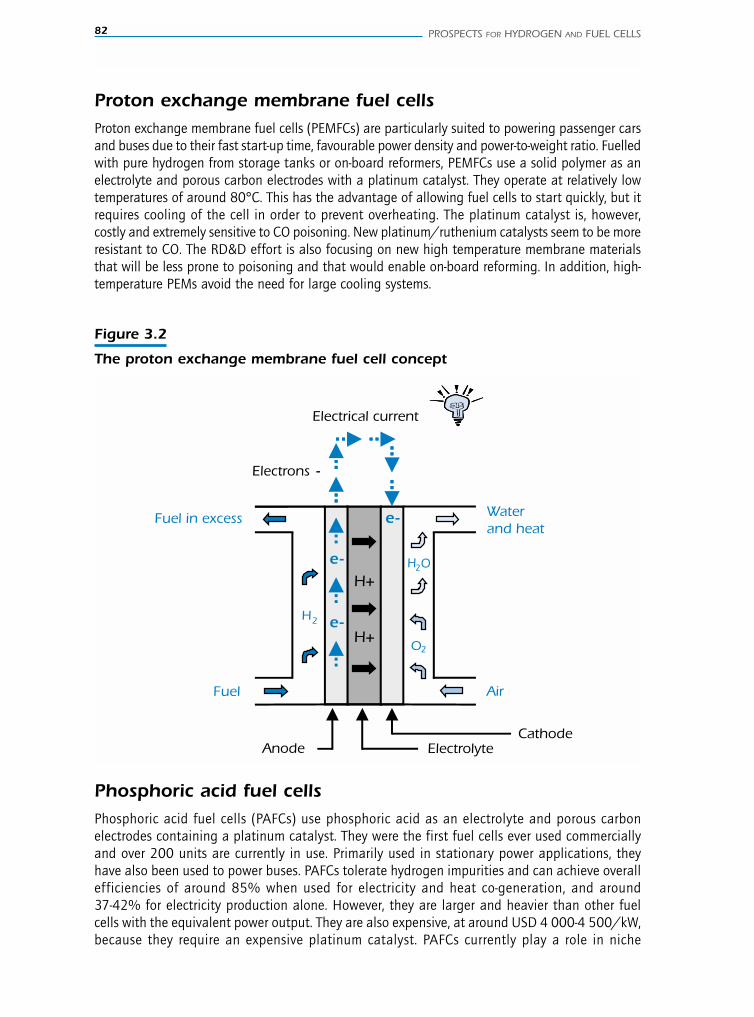
82 PROSPECTS FOR HYDROGEN AND FUEL CELLS
Figure 3.2
The proton exchange membrane fuel cell concept
Anode Electrolyte Cathode
e-
-
e-
Electrons -
Electrical current
Air Fuel
Water and heat
e-
e-
e-
H+
H2
H2
O
O
2H+
Fuel in excess
Phosphoric acid fuel cellsPhosphoric acid fuel cells (PAFCs) use phosphoric acid as an electrolyte and porous carbonelectrodes containing a platinum catalyst. They were the first fuel cells ever used commerciallyand over 200 units are currently in use. Primarily used in stationary power applications, theyhave also been used to power buses. PAFCs tolerate hydrogen impurities and can achieve overallefficiencies of around 85% when used for electricity and heat co-generation, and around37-42% for electricity production alone. However, they are larger and heavier than other fuelcells with the equivalent power output. They are also expensive, at around USD 4 000-4 500/kW,because they require an expensive platinum catalyst. PAFCs currently play a role in niche
Proton exchange membrane fuel cellsProton exchange membrane fuel cells (PEMFCs) are particularly suited to powering passenger carsand buses due to their fast start-up time, favourable power density and power-to-weight ratio. Fuelledwith pure hydrogen from storage tanks or on-board reformers, PEMFCs use a solid polymer as anelectrolyte and porous carbon electrodes with a platinum catalyst. They operate at relatively lowtemperatures of around 80°C. This has the advantage of allowing fuel cells to start quickly, but itrequires cooling of the cell in order to prevent overheating. The platinum catalyst is, however,costly and extremely sensitive to CO poisoning. New platinum/ruthenium catalysts seem to be moreresistant to CO. The RD&D effort is also focusing on new high temperature membrane materialsthat will be less prone to poisoning and that would enable on-board reforming. In addition, high-temperature PEMs avoid the need for large cooling systems.
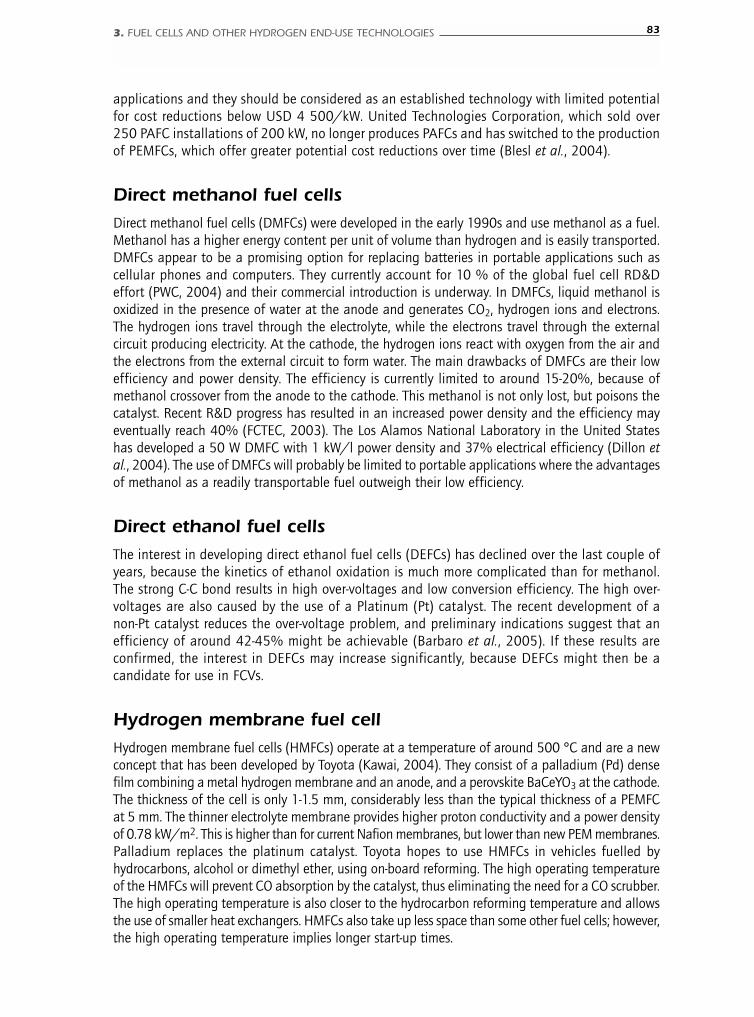
applications and they should be considered as an established technology with limited potentialfor cost reductions below USD 4 500/kW. United Technologies Corporation, which sold over250 PAFC installations of 200 kW, no longer produces PAFCs and has switched to the productionof PEMFCs, which offer greater potential cost reductions over time (Blesl et al., 2004).
Direct methanol fuel cellsDirect methanol fuel cells (DMFCs) were developed in the early 1990s and use methanol as a fuel.Methanol has a higher energy content per unit of volume than hydrogen and is easily transported.DMFCs appear to be a promising option for replacing batteries in portable applications such ascellular phones and computers. They currently account for 10 % of the global fuel cell RD&Deffort (PWC, 2004) and their commercial introduction is underway. In DMFCs, liquid methanol isoxidized in the presence of water at the anode and generates CO2, hydrogen ions and electrons.The hydrogen ions travel through the electrolyte, while the electrons travel through the externalcircuit producing electricity. At the cathode, the hydrogen ions react with oxygen from the air andthe electrons from the external circuit to form water. The main drawbacks of DMFCs are their lowefficiency and power density. The efficiency is currently limited to around 15-20%, because ofmethanol crossover from the anode to the cathode. This methanol is not only lost, but poisons thecatalyst. Recent R&D progress has resulted in an increased power density and the efficiency mayeventually reach 40% (FCTEC, 2003). The Los Alamos National Laboratory in the United Stateshas developed a 50 W DMFC with 1 kW/l power density and 37% electrical efficiency (Dillon etal., 2004). The use of DMFCs will probably be limited to portable applications where the advantagesof methanol as a readily transportable fuel outweigh their low efficiency.
Direct ethanol fuel cellsThe interest in developing direct ethanol fuel cells (DEFCs) has declined over the last couple ofyears, because the kinetics of ethanol oxidation is much more complicated than for methanol.The strong C-C bond results in high over-voltages and low conversion efficiency. The high over-voltages are also caused by the use of a Platinum (Pt) catalyst. The recent development of anon-Pt catalyst reduces the over-voltage problem, and preliminary indications suggest that anefficiency of around 42-45% might be achievable (Barbaro et al., 2005). If these results areconfirmed, the interest in DEFCs may increase significantly, because DEFCs might then be acandidate for use in FCVs.
Hydrogen membrane fuel cellHydrogen membrane fuel cells (HMFCs) operate at a temperature of around 500 °C and are a newconcept that has been developed by Toyota (Kawai, 2004). They consist of a palladium (Pd) densefilm combining a metal hydrogen membrane and an anode, and a perovskite BaCeYO3 at the cathode.The thickness of the cell is only 1-1.5 mm, considerably less than the typical thickness of a PEMFCat 5 mm. The thinner electrolyte membrane provides higher proton conductivity and a power densityof 0.78 kW/m2. This is higher than for current Nafion membranes, but lower than new PEM membranes.Palladium replaces the platinum catalyst. Toyota hopes to use HMFCs in vehicles fuelled byhydrocarbons, alcohol or dimethyl ether, using on-board reforming. The high operating temperatureof the HMFCs will prevent CO absorption by the catalyst, thus eliminating the need for a CO scrubber.The high operating temperature is also closer to the hydrocarbon reforming temperature and allowsthe use of smaller heat exchangers. HMFCs also take up less space than some other fuel cells; however,the high operating temperature implies longer start-up times.
3. FUEL CELLS AND OTHER HYDROGEN END-USE TECHNOLOGIES 83
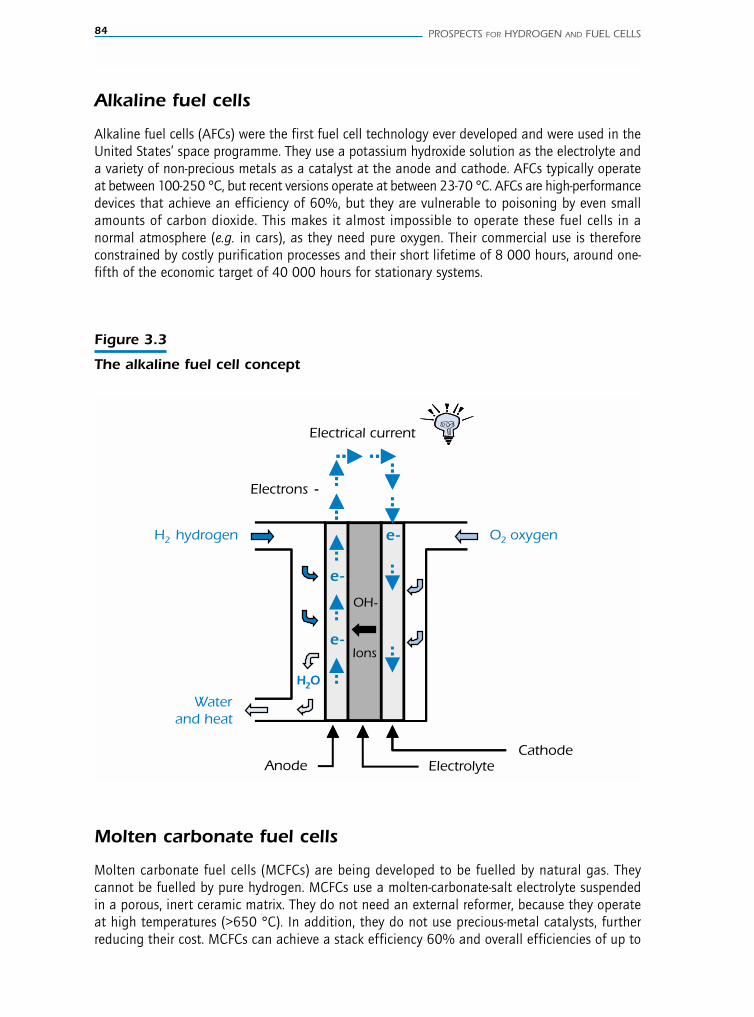
Alkaline fuel cells
Alkaline fuel cells (AFCs) were the first fuel cell technology ever developed and were used in theUnited States’ space programme. They use a potassium hydroxide solution as the electrolyte anda variety of non-precious metals as a catalyst at the anode and cathode. AFCs typically operateat between 100-250 °C, but recent versions operate at between 23-70 °C. AFCs are high-performancedevices that achieve an efficiency of 60%, but they are vulnerable to poisoning by even smallamounts of carbon dioxide. This makes it almost impossible to operate these fuel cells in anormal atmosphere (e.g. in cars), as they need pure oxygen. Their commercial use is thereforeconstrained by costly purification processes and their short lifetime of 8 000 hours, around one-fifth of the economic target of 40 000 hours for stationary systems.
84 PROSPECTS FOR HYDROGEN AND FUEL CELLS
Figure 3.3
The alkaline fuel cell concept
Electrons
Electrical current
Anode Electrolyte
O2 oxygen H2 hydrogen
Waterand heat
Cathode
e-
e-
e-
OH-
ions
-
e-
e-
e-
OH-
Ions
H2O
Molten carbonate fuel cells
Molten carbonate fuel cells (MCFCs) are being developed to be fuelled by natural gas. Theycannot be fuelled by pure hydrogen. MCFCs use a molten-carbonate-salt electrolyte suspendedin a porous, inert ceramic matrix. They do not need an external reformer, because they operateat high temperatures (>650 °C). In addition, they do not use precious-metal catalysts, furtherreducing their cost. MCFCs can achieve a stack efficiency 60% and overall efficiencies of up to

3. FUEL CELLS AND OTHER HYDROGEN END-USE TECHNOLOGIES 85
Figure 3.4
The molten carbonate fuel cell concept
Anode Electrolyte Cathode
H
Electrons -
Electrical current
Air
Water and heat
e-
e-
e-
CO3
H2 O2=
Hydrogen
CO2CO3
=
CO2
CO2
CO2
2O
CO2
(natural gas)
90% if used for cogeneration. Their resistance to poisoning is being improved. Efforts are alsounderway to extend their economic life, which is limited by their high operating temperature andelectrolyte-induced corrosion.
Solid oxide fuel cells
Solid oxide fuel cells (SOFCs) use a non-porous ceramic electrolyte and appear to be the mostpromising technology for electricity generation. When combined with a gas turbine, SOFCs areexpected to achieve an electrical efficiency of 70% and up to 80-85% efficiency in cogeneration.High operating temperatures of 800-1000 °C mean precious-metal catalysts and externalreformers are unnecessary, helping to reduce the cost of SOFCs. However, this is balanced bycell design problems and a slow start-up capability as a consequence of the high operatingtemperature. SOFCs can also use carbon monoxide as fuel. The RD&D goal for SOFCs is toenhance their sulphur tolerance so that they can be fuelled by gas derived from coal. Thedevelopment of low-cost materials with a high durability also represents critical technicalchallenges for this technology.
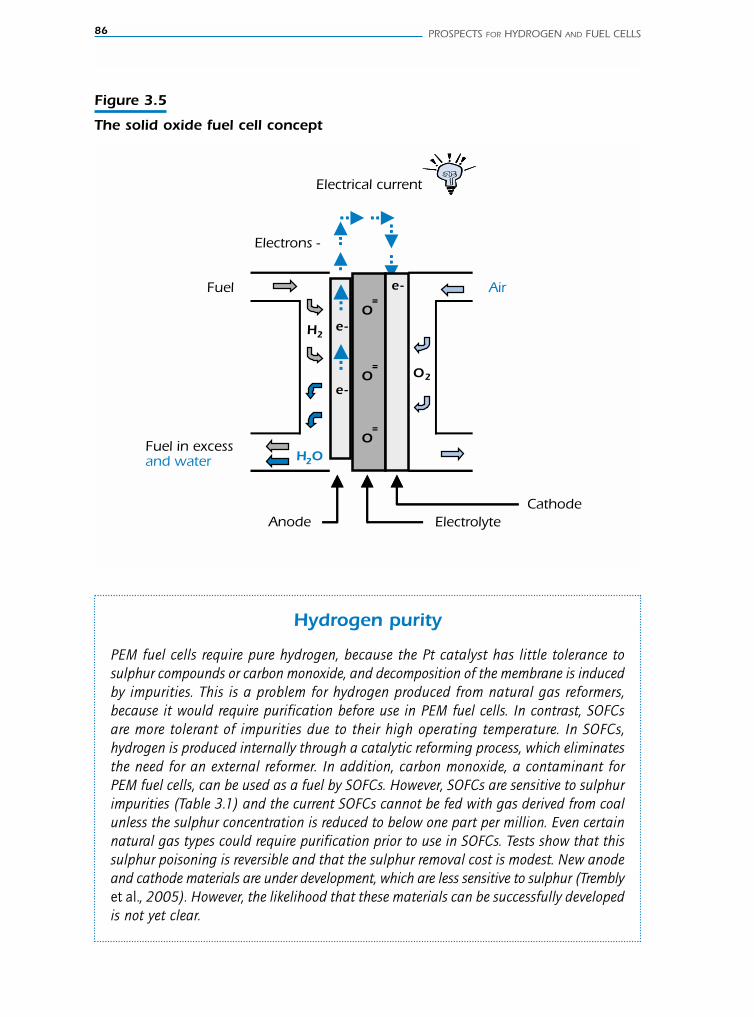
86 PROSPECTS FOR HYDROGEN AND FUEL CELLS
Hydrogen purity
PEM fuel cells require pure hydrogen, because the Pt catalyst has little tolerance tosulphur compounds or carbon monoxide, and decomposition of the membrane is inducedby impurities. This is a problem for hydrogen produced from natural gas reformers,because it would require purification before use in PEM fuel cells. In contrast, SOFCsare more tolerant of impurities due to their high operating temperature. In SOFCs,hydrogen is produced internally through a catalytic reforming process, which eliminatesthe need for an external reformer. In addition, carbon monoxide, a contaminant forPEM fuel cells, can be used as a fuel by SOFCs. However, SOFCs are sensitive to sulphurimpurities (Table 3.1) and the current SOFCs cannot be fed with gas derived from coalunless the sulphur concentration is reduced to below one part per million. Even certainnatural gas types could require purification prior to use in SOFCs. Tests show that thissulphur poisoning is reversible and that the sulphur removal cost is modest. New anodeand cathode materials are under development, which are less sensitive to sulphur (Tremblyet al., 2005). However, the likelihood that these materials can be successfully developedis not yet clear.
Figure 3.5
The solid oxide fuel cell concept
Anode
Fuel Air
Cathode
Fuel in excessand water
e-
e-
e-
O
H2
O2
OH2O
=
O=
=
Electrolyte
Electrical current
Electrons -
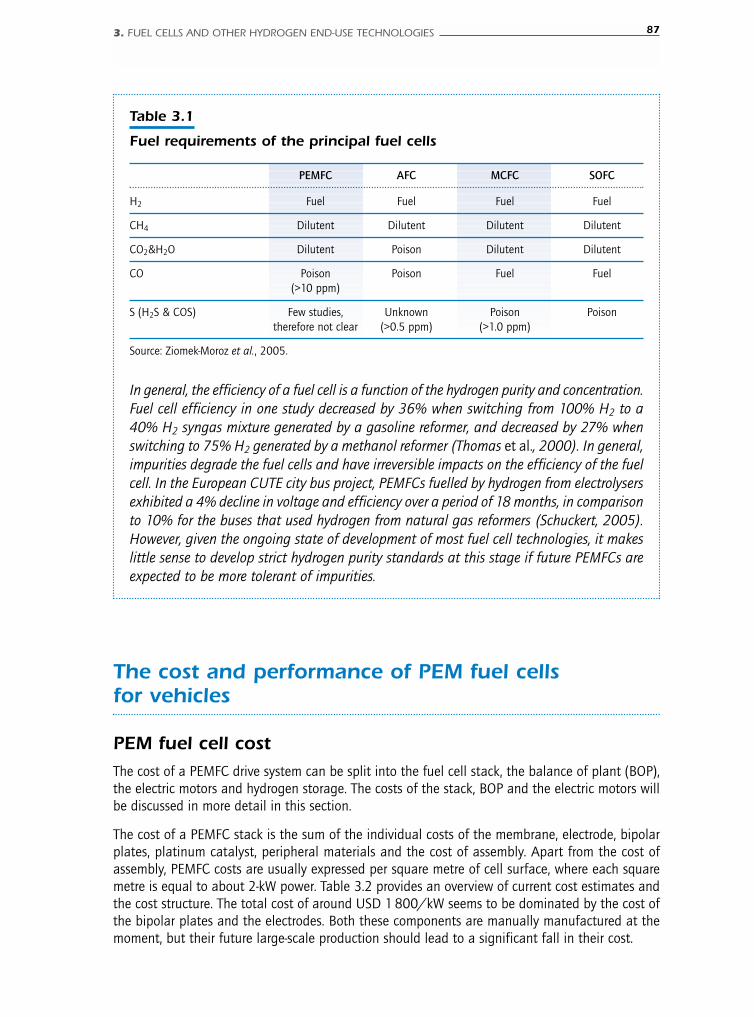
3. FUEL CELLS AND OTHER HYDROGEN END-USE TECHNOLOGIES 87
The cost and performance of PEM fuel cellsfor vehicles
PEM fuel cell cost The cost of a PEMFC drive system can be split into the fuel cell stack, the balance of plant (BOP),the electric motors and hydrogen storage. The costs of the stack, BOP and the electric motors willbe discussed in more detail in this section.
The cost of a PEMFC stack is the sum of the individual costs of the membrane, electrode, bipolarplates, platinum catalyst, peripheral materials and the cost of assembly. Apart from the cost ofassembly, PEMFC costs are usually expressed per square metre of cell surface, where each squaremetre is equal to about 2-kW power. Table 3.2 provides an overview of current cost estimates andthe cost structure. The total cost of around USD 1 800/kW seems to be dominated by the cost ofthe bipolar plates and the electrodes. Both these components are manually manufactured at themoment, but their future large-scale production should lead to a significant fall in their cost.
Table 3.1
Fuel requirements of the principal fuel cells
PEMFC AFC MCFC SOFC
H2 Fuel Fuel Fuel Fuel
CH4 Dilutent Dilutent Dilutent Dilutent
CO2&H2O Dilutent Poison Dilutent Dilutent
CO Poison Poison Fuel Fuel(>10 ppm)
S (H2S & COS) Few studies, Unknown Poison Poisontherefore not clear (>0.5 ppm) (>1.0 ppm)
Source: Ziomek-Moroz et al., 2005.
In general, the efficiency of a fuel cell is a function of the hydrogen purity and concentration.Fuel cell efficiency in one study decreased by 36% when switching from 100% H2 to a40% H2 syngas mixture generated by a gasoline reformer, and decreased by 27% whenswitching to 75% H2 generated by a methanol reformer (Thomas et al., 2000). In general,impurities degrade the fuel cells and have irreversible impacts on the efficiency of the fuelcell. In the European CUTE city bus project, PEMFCs fuelled by hydrogen from electrolysersexhibited a 4% decline in voltage and efficiency over a period of 18 months, in comparisonto 10% for the buses that used hydrogen from natural gas reformers (Schuckert, 2005).However, given the ongoing state of development of most fuel cell technologies, it makeslittle sense to develop strict hydrogen purity standards at this stage if future PEMFCs areexpected to be more tolerant of impurities.
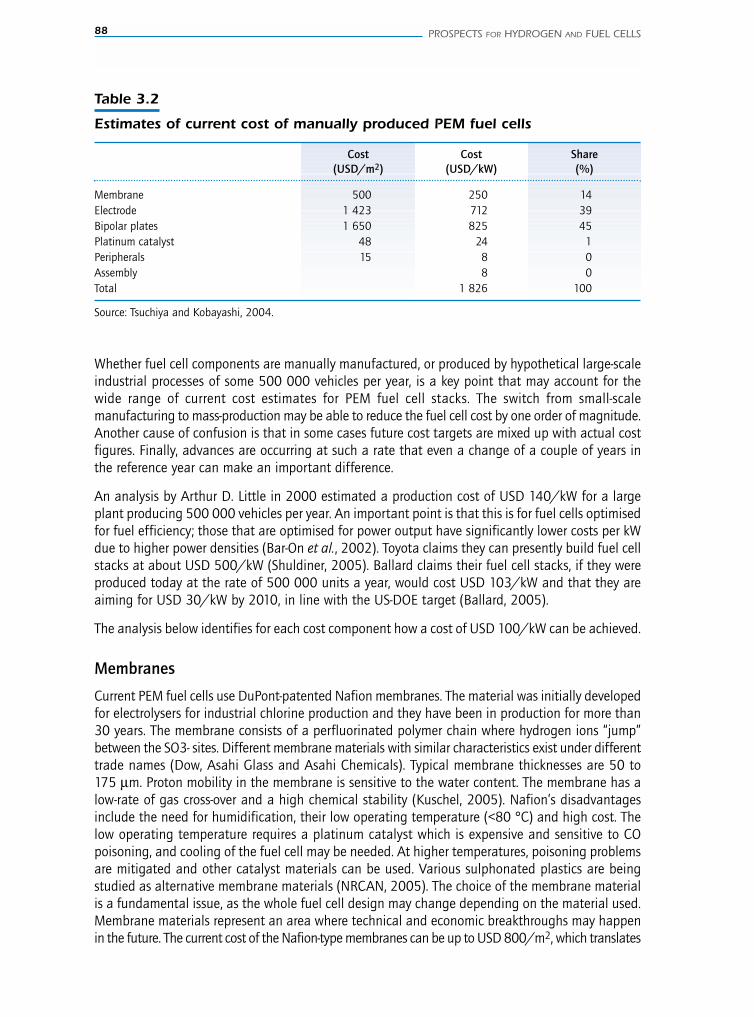
88 PROSPECTS FOR HYDROGEN AND FUEL CELLS
Table 3.2
Estimates of current cost of manually produced PEM fuel cells
Cost Cost Share(USD/m2) (USD/kW) (%)
Membrane 500 250 14Electrode 1 423 712 39Bipolar plates 1 650 825 45Platinum catalyst 48 24 1Peripherals 15 8 0Assembly 8 0Total 1 826 100
Source: Tsuchiya and Kobayashi, 2004.
Whether fuel cell components are manually manufactured, or produced by hypothetical large-scaleindustrial processes of some 500 000 vehicles per year, is a key point that may account for thewide range of current cost estimates for PEM fuel cell stacks. The switch from small-scalemanufacturing to mass-production may be able to reduce the fuel cell cost by one order of magnitude.Another cause of confusion is that in some cases future cost targets are mixed up with actual costfigures. Finally, advances are occurring at such a rate that even a change of a couple of years inthe reference year can make an important difference.
An analysis by Arthur D. Little in 2000 estimated a production cost of USD 140/kW for a largeplant producing 500 000 vehicles per year. An important point is that this is for fuel cells optimisedfor fuel efficiency; those that are optimised for power output have significantly lower costs per kWdue to higher power densities (Bar-On et al., 2002). Toyota claims they can presently build fuel cellstacks at about USD 500/kW (Shuldiner, 2005). Ballard claims their fuel cell stacks, if they wereproduced today at the rate of 500 000 units a year, would cost USD 103/kW and that they areaiming for USD 30/kW by 2010, in line with the US-DOE target (Ballard, 2005).
The analysis below identifies for each cost component how a cost of USD 100/kW can be achieved.
Membranes
Current PEM fuel cells use DuPont-patented Nafion membranes. The material was initially developedfor electrolysers for industrial chlorine production and they have been in production for more than30 years. The membrane consists of a perfluorinated polymer chain where hydrogen ions “jump”between the SO3- sites. Different membrane materials with similar characteristics exist under differenttrade names (Dow, Asahi Glass and Asahi Chemicals). Typical membrane thicknesses are 50 to175 µm. Proton mobility in the membrane is sensitive to the water content. The membrane has alow-rate of gas cross-over and a high chemical stability (Kuschel, 2005). Nafion’s disadvantagesinclude the need for humidification, their low operating temperature (<80 °C) and high cost. Thelow operating temperature requires a platinum catalyst which is expensive and sensitive to COpoisoning, and cooling of the fuel cell may be needed. At higher temperatures, poisoning problemsare mitigated and other catalyst materials can be used. Various sulphonated plastics are beingstudied as alternative membrane materials (NRCAN, 2005). The choice of the membrane materialis a fundamental issue, as the whole fuel cell design may change depending on the material used.Membrane materials represent an area where technical and economic breakthroughs may happenin the future. The current cost of the Nafion-type membranes can be up to USD 800/m2, which translates
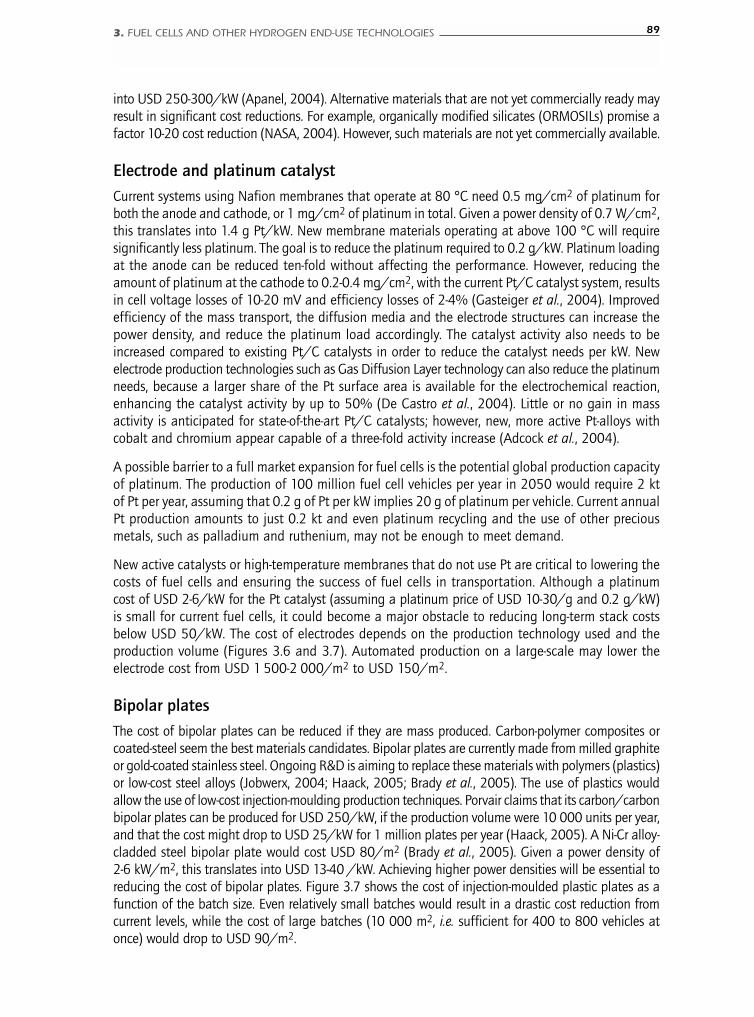
3. FUEL CELLS AND OTHER HYDROGEN END-USE TECHNOLOGIES 89
into USD 250-300/kW (Apanel, 2004). Alternative materials that are not yet commercially ready mayresult in significant cost reductions. For example, organically modified silicates (ORMOSILs) promise afactor 10-20 cost reduction (NASA, 2004). However, such materials are not yet commercially available.
Electrode and platinum catalyst
Current systems using Nafion membranes that operate at 80 °C need 0.5 mg/cm2 of platinum forboth the anode and cathode, or 1 mg/cm2 of platinum in total. Given a power density of 0.7 W/cm2,this translates into 1.4 g Pt/kW. New membrane materials operating at above 100 °C will requiresignificantly less platinum. The goal is to reduce the platinum required to 0.2 g/kW. Platinum loadingat the anode can be reduced ten-fold without affecting the performance. However, reducing theamount of platinum at the cathode to 0.2-0.4 mg/cm2, with the current Pt/C catalyst system, resultsin cell voltage losses of 10-20 mV and efficiency losses of 2-4% (Gasteiger et al., 2004). Improvedefficiency of the mass transport, the diffusion media and the electrode structures can increase thepower density, and reduce the platinum load accordingly. The catalyst activity also needs to beincreased compared to existing Pt/C catalysts in order to reduce the catalyst needs per kW. Newelectrode production technologies such as Gas Diffusion Layer technology can also reduce the platinumneeds, because a larger share of the Pt surface area is available for the electrochemical reaction,enhancing the catalyst activity by up to 50% (De Castro et al., 2004). Little or no gain in massactivity is anticipated for state-of-the-art Pt/C catalysts; however, new, more active Pt-alloys withcobalt and chromium appear capable of a three-fold activity increase (Adcock et al., 2004).
A possible barrier to a full market expansion for fuel cells is the potential global production capacityof platinum. The production of 100 million fuel cell vehicles per year in 2050 would require 2 ktof Pt per year, assuming that 0.2 g of Pt per kW implies 20 g of platinum per vehicle. Current annualPt production amounts to just 0.2 kt and even platinum recycling and the use of other preciousmetals, such as palladium and ruthenium, may not be enough to meet demand.
New active catalysts or high-temperature membranes that do not use Pt are critical to lowering thecosts of fuel cells and ensuring the success of fuel cells in transportation. Although a platinumcost of USD 2-6/kW for the Pt catalyst (assuming a platinum price of USD 10-30/g and 0.2 g/kW)is small for current fuel cells, it could become a major obstacle to reducing long-term stack costsbelow USD 50/kW. The cost of electrodes depends on the production technology used and theproduction volume (Figures 3.6 and 3.7). Automated production on a large-scale may lower theelectrode cost from USD 1 500-2 000/m2 to USD 150/m2.
Bipolar plates
The cost of bipolar plates can be reduced if they are mass produced. Carbon-polymer composites orcoated-steel seem the best materials candidates. Bipolar plates are currently made from milled graphiteor gold-coated stainless steel. Ongoing R&D is aiming to replace these materials with polymers (plastics)or low-cost steel alloys (Jobwerx, 2004; Haack, 2005; Brady et al., 2005). The use of plastics wouldallow the use of low-cost injection-moulding production techniques. Porvair claims that its carbon/carbonbipolar plates can be produced for USD 250/kW, if the production volume were 10 000 units per year,and that the cost might drop to USD 25/kW for 1 million plates per year (Haack, 2005). A Ni-Cr alloy-cladded steel bipolar plate would cost USD 80/m2 (Brady et al., 2005). Given a power density of2-6 kW/m2, this translates into USD 13-40 /kW. Achieving higher power densities will be essential toreducing the cost of bipolar plates. Figure 3.7 shows the cost of injection-moulded plastic plates as afunction of the batch size. Even relatively small batches would result in a drastic cost reduction fromcurrent levels, while the cost of large batches (10 000 m2, i.e. sufficient for 400 to 800 vehicles atonce) would drop to USD 90/m2.
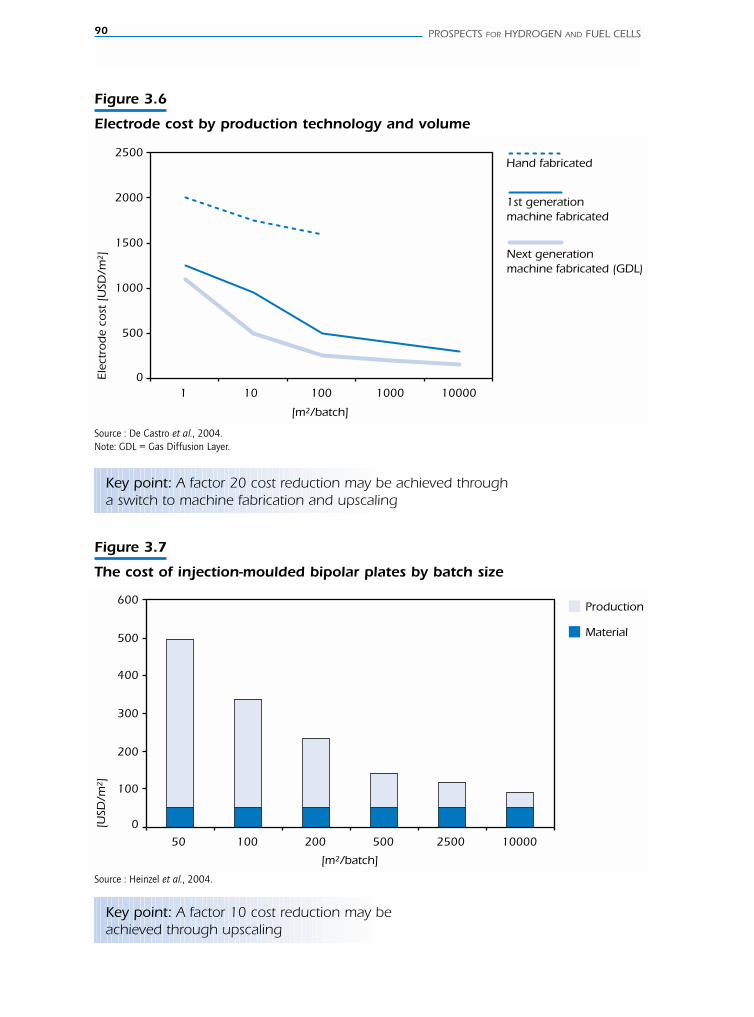
90 PROSPECTS FOR HYDROGEN AND FUEL CELLS
Figure 3.6
Electrode cost by production technology and volume
0
500
1000
1500
2000
2500
1 10 100 1000 10000
[m2/batch]
Elec
tro
de
cost
[U
SD/m
2]
Hand fabricated
1st generationmachine fabricated
Next generation machine fabricated (GDL)
Key point: A factor 20 cost reduction may be achieved througha switch to machine fabrication and upscaling
Source : De Castro et al., 2004.Note: GDL = Gas Diffusion Layer.
Figure 3.7
The cost of injection-moulded bipolar plates by batch size
0
100
200
300
400
500
600
50 100 200 500 2500 10000
[m2/batch]
[USD
/m2]
Production
Material
Key point: A factor 10 cost reduction may beachieved through upscaling
Source : Heinzel et al., 2004.
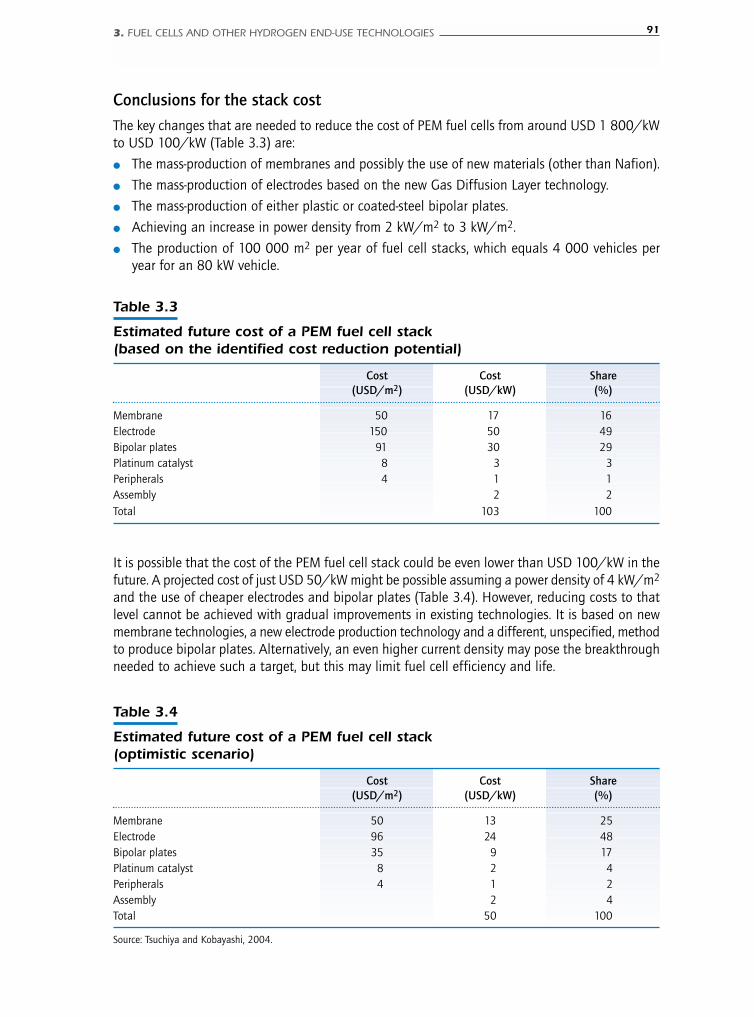
3. FUEL CELLS AND OTHER HYDROGEN END-USE TECHNOLOGIES 91
Conclusions for the stack cost
The key changes that are needed to reduce the cost of PEM fuel cells from around USD 1 800/kWto USD 100/kW (Table 3.3) are:
● The mass-production of membranes and possibly the use of new materials (other than Nafion).
● The mass-production of electrodes based on the new Gas Diffusion Layer technology.
● The mass-production of either plastic or coated-steel bipolar plates.
● Achieving an increase in power density from 2 kW/m2 to 3 kW/m2.
● The production of 100 000 m2 per year of fuel cell stacks, which equals 4 000 vehicles peryear for an 80 kW vehicle.
Table 3.3
Estimated future cost of a PEM fuel cell stack (based on the identified cost reduction potential)
Cost Cost Share(USD/m2) (USD/kW) (%)
Membrane 50 17 16Electrode 150 50 49Bipolar plates 91 30 29Platinum catalyst 8 3 3Peripherals 4 1 1Assembly 2 2Total 103 100
Table 3.4
Estimated future cost of a PEM fuel cell stack(optimistic scenario)
Cost Cost Share(USD/m2) (USD/kW) (%)
Membrane 50 13 25Electrode 96 24 48Bipolar plates 35 9 17Platinum catalyst 8 2 4Peripherals 4 1 2Assembly 2 4Total 50 100
Source: Tsuchiya and Kobayashi, 2004.
It is possible that the cost of the PEM fuel cell stack could be even lower than USD 100/kW in thefuture. A projected cost of just USD 50/kW might be possible assuming a power density of 4 kW/m2
and the use of cheaper electrodes and bipolar plates (Table 3.4). However, reducing costs to thatlevel cannot be achieved with gradual improvements in existing technologies. It is based on newmembrane technologies, a new electrode production technology and a different, unspecified, methodto produce bipolar plates. Alternatively, an even higher current density may pose the breakthroughneeded to achieve such a target, but this may limit fuel cell efficiency and life.
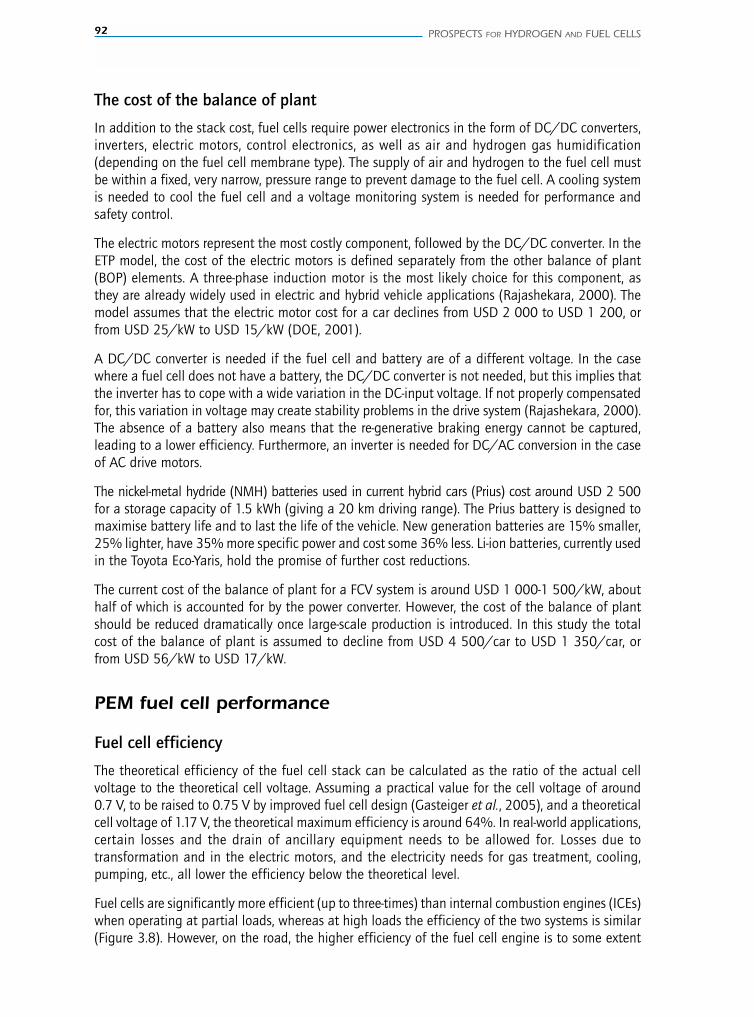
92 PROSPECTS FOR HYDROGEN AND FUEL CELLS
The cost of the balance of plant
In addition to the stack cost, fuel cells require power electronics in the form of DC/DC converters,inverters, electric motors, control electronics, as well as air and hydrogen gas humidification(depending on the fuel cell membrane type). The supply of air and hydrogen to the fuel cell mustbe within a fixed, very narrow, pressure range to prevent damage to the fuel cell. A cooling systemis needed to cool the fuel cell and a voltage monitoring system is needed for performance andsafety control.
The electric motors represent the most costly component, followed by the DC/DC converter. In theETP model, the cost of the electric motors is defined separately from the other balance of plant(BOP) elements. A three-phase induction motor is the most likely choice for this component, asthey are already widely used in electric and hybrid vehicle applications (Rajashekara, 2000). Themodel assumes that the electric motor cost for a car declines from USD 2 000 to USD 1 200, orfrom USD 25/kW to USD 15/kW (DOE, 2001).
A DC/DC converter is needed if the fuel cell and battery are of a different voltage. In the casewhere a fuel cell does not have a battery, the DC/DC converter is not needed, but this implies thatthe inverter has to cope with a wide variation in the DC-input voltage. If not properly compensatedfor, this variation in voltage may create stability problems in the drive system (Rajashekara, 2000).The absence of a battery also means that the re-generative braking energy cannot be captured,leading to a lower efficiency. Furthermore, an inverter is needed for DC/AC conversion in the caseof AC drive motors.
The nickel-metal hydride (NMH) batteries used in current hybrid cars (Prius) cost around USD 2 500for a storage capacity of 1.5 kWh (giving a 20 km driving range). The Prius battery is designed tomaximise battery life and to last the life of the vehicle. New generation batteries are 15% smaller,25% lighter, have 35% more specific power and cost some 36% less. Li-ion batteries, currently usedin the Toyota Eco-Yaris, hold the promise of further cost reductions.
The current cost of the balance of plant for a FCV system is around USD 1 000-1 500/kW, abouthalf of which is accounted for by the power converter. However, the cost of the balance of plantshould be reduced dramatically once large-scale production is introduced. In this study the totalcost of the balance of plant is assumed to decline from USD 4 500/car to USD 1 350/car, orfrom USD 56/kW to USD 17/kW.
PEM fuel cell performance
Fuel cell efficiency
The theoretical efficiency of the fuel cell stack can be calculated as the ratio of the actual cellvoltage to the theoretical cell voltage. Assuming a practical value for the cell voltage of around0.7 V, to be raised to 0.75 V by improved fuel cell design (Gasteiger et al., 2005), and a theoreticalcell voltage of 1.17 V, the theoretical maximum efficiency is around 64%. In real-world applications,certain losses and the drain of ancillary equipment needs to be allowed for. Losses due totransformation and in the electric motors, and the electricity needs for gas treatment, cooling,pumping, etc., all lower the efficiency below the theoretical level.
Fuel cells are significantly more efficient (up to three-times) than internal combustion engines (ICEs)when operating at partial loads, whereas at high loads the efficiency of the two systems is similar(Figure 3.8). However, on the road, the higher efficiency of the fuel cell engine is to some extent
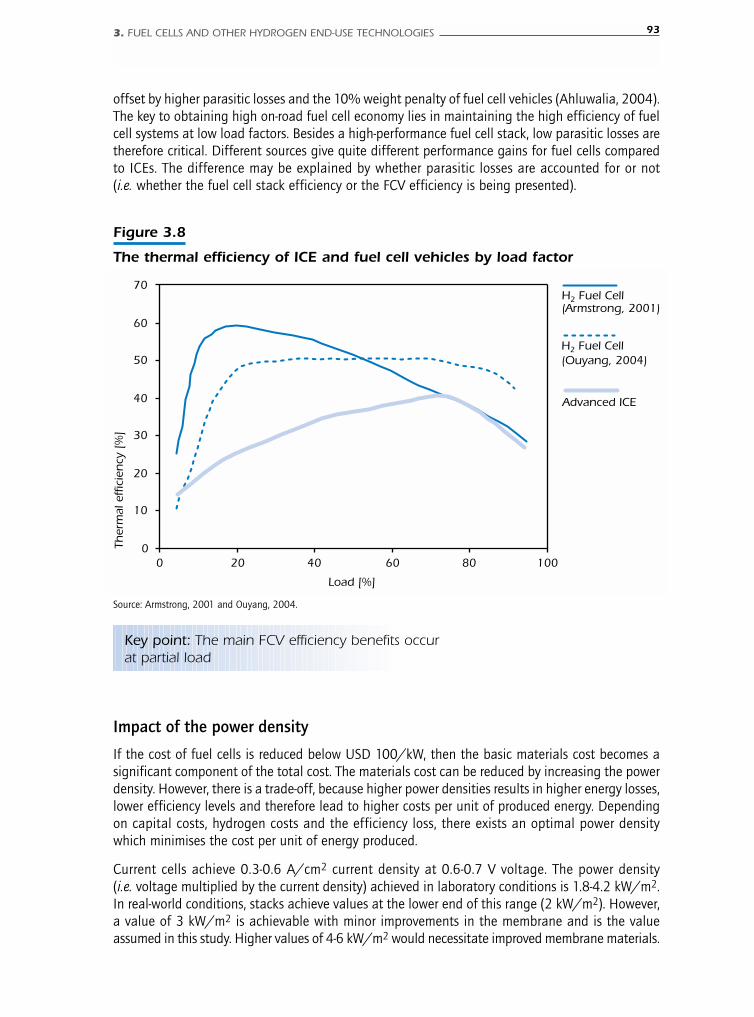
3. FUEL CELLS AND OTHER HYDROGEN END-USE TECHNOLOGIES 93
offset by higher parasitic losses and the 10% weight penalty of fuel cell vehicles (Ahluwalia, 2004).The key to obtaining high on-road fuel cell economy lies in maintaining the high efficiency of fuelcell systems at low load factors. Besides a high-performance fuel cell stack, low parasitic losses aretherefore critical. Different sources give quite different performance gains for fuel cells comparedto ICEs. The difference may be explained by whether parasitic losses are accounted for or not(i.e. whether the fuel cell stack efficiency or the FCV efficiency is being presented).
Figure 3.8
The thermal efficiency of ICE and fuel cell vehicles by load factor
10
0
20
30
40
50
60
70
0 20 40 60 80 100
Load [%]
Ther
mal
eff
icie
ncy
[%
]
H2 Fuel Cell (Ouyang, 2004)
H2 Fuel Cell(Armstrong, 2001)
Advanced ICE
Key point: The main FCV efficiency benefits occurat partial load
Source: Armstrong, 2001 and Ouyang, 2004.
Impact of the power density
If the cost of fuel cells is reduced below USD 100/kW, then the basic materials cost becomes asignificant component of the total cost. The materials cost can be reduced by increasing the powerdensity. However, there is a trade-off, because higher power densities results in higher energy losses,lower efficiency levels and therefore lead to higher costs per unit of produced energy. Dependingon capital costs, hydrogen costs and the efficiency loss, there exists an optimal power densitywhich minimises the cost per unit of energy produced.
Current cells achieve 0.3-0.6 A/cm2 current density at 0.6-0.7 V voltage. The power density(i.e. voltage multiplied by the current density) achieved in laboratory conditions is 1.8-4.2 kW/m2.In real-world conditions, stacks achieve values at the lower end of this range (2 kW/m2). However,a value of 3 kW/m2 is achievable with minor improvements in the membrane and is the valueassumed in this study. Higher values of 4-6 kW/m2 would necessitate improved membrane materials.
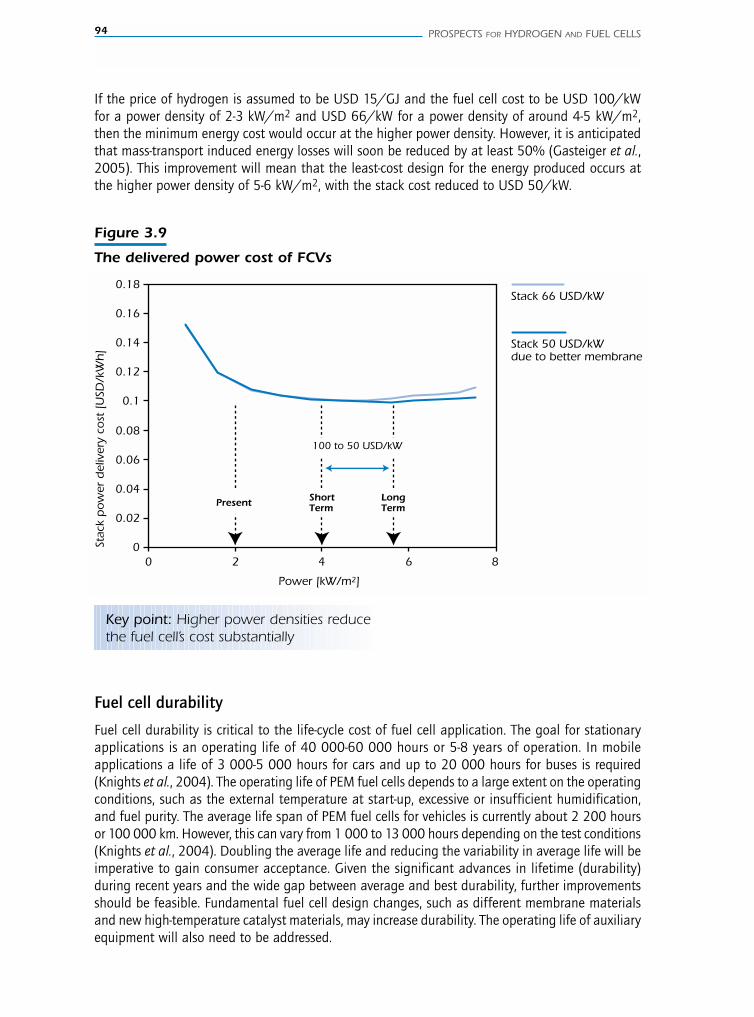
94 PROSPECTS FOR HYDROGEN AND FUEL CELLS
If the price of hydrogen is assumed to be USD 15/GJ and the fuel cell cost to be USD 100/kWfor a power density of 2-3 kW/m2 and USD 66/kW for a power density of around 4-5 kW/m2,then the minimum energy cost would occur at the higher power density. However, it is anticipatedthat mass-transport induced energy losses will soon be reduced by at least 50% (Gasteiger et al.,2005). This improvement will mean that the least-cost design for the energy produced occurs atthe higher power density of 5-6 kW/m2, with the stack cost reduced to USD 50/kW.
Figure 3.9
The delivered power cost of FCVs
0
0.02
0.04
0.06
0.08
0.1
0.12
0.14
0.16
0.18
0 2 4 6 8
Power [kW/m2]
Stac
k p
ow
er d
eliv
ery
cost
[U
SD/k
Wh
]
Stack 66 USD/kW
Stack 50 USD/kW due to better membrane
100 to 50 USD/kW
Present Short Term
Long Term
Key point: Higher power densities reducethe fuel cell’s cost substantially
Fuel cell durability
Fuel cell durability is critical to the life-cycle cost of fuel cell application. The goal for stationaryapplications is an operating life of 40 000-60 000 hours or 5-8 years of operation. In mobileapplications a life of 3 000-5 000 hours for cars and up to 20 000 hours for buses is required(Knights et al., 2004). The operating life of PEM fuel cells depends to a large extent on the operatingconditions, such as the external temperature at start-up, excessive or insufficient humidification,and fuel purity. The average life span of PEM fuel cells for vehicles is currently about 2 200 hoursor 100 000 km. However, this can vary from 1 000 to 13 000 hours depending on the test conditions(Knights et al., 2004). Doubling the average life and reducing the variability in average life will beimperative to gain consumer acceptance. Given the significant advances in lifetime (durability)during recent years and the wide gap between average and best durability, further improvementsshould be feasible. Fundamental fuel cell design changes, such as different membrane materialsand new high-temperature catalyst materials, may increase durability. The operating life of auxiliaryequipment will also need to be addressed.
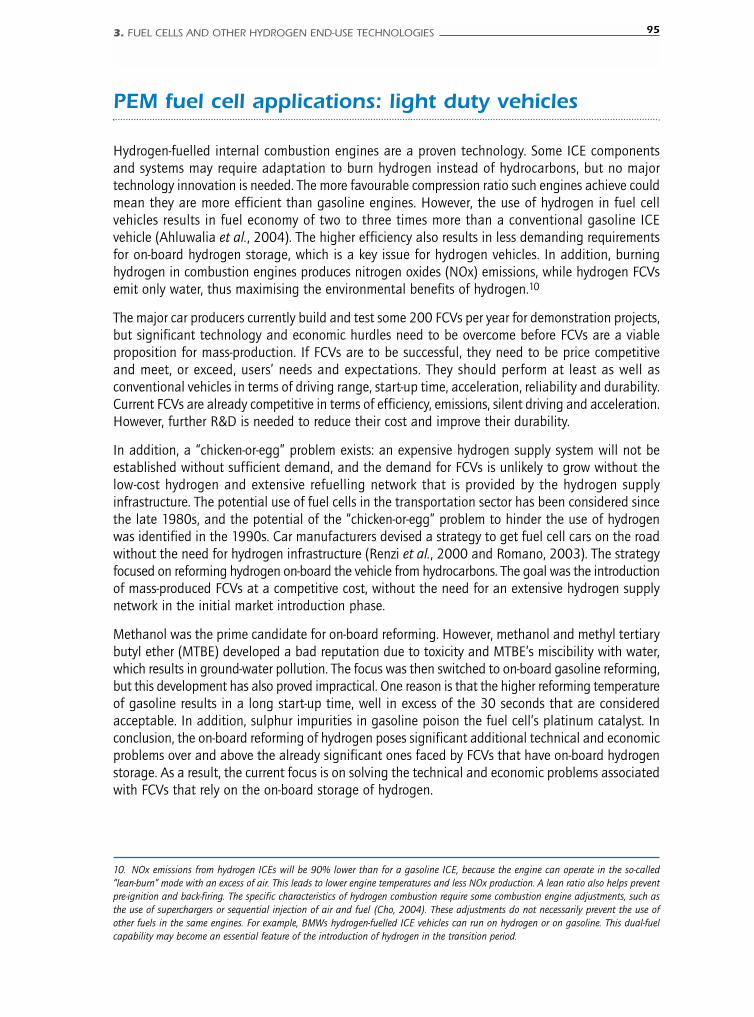
3. FUEL CELLS AND OTHER HYDROGEN END-USE TECHNOLOGIES 95
PEM fuel cell applications: light duty vehicles
Hydrogen-fuelled internal combustion engines are a proven technology. Some ICE componentsand systems may require adaptation to burn hydrogen instead of hydrocarbons, but no majortechnology innovation is needed. The more favourable compression ratio such engines achieve couldmean they are more efficient than gasoline engines. However, the use of hydrogen in fuel cellvehicles results in fuel economy of two to three times more than a conventional gasoline ICEvehicle (Ahluwalia et al., 2004). The higher efficiency also results in less demanding requirementsfor on-board hydrogen storage, which is a key issue for hydrogen vehicles. In addition, burninghydrogen in combustion engines produces nitrogen oxides (NOx) emissions, while hydrogen FCVsemit only water, thus maximising the environmental benefits of hydrogen.10
The major car producers currently build and test some 200 FCVs per year for demonstration projects,but significant technology and economic hurdles need to be overcome before FCVs are a viableproposition for mass-production. If FCVs are to be successful, they need to be price competitiveand meet, or exceed, users’ needs and expectations. They should perform at least as well asconventional vehicles in terms of driving range, start-up time, acceleration, reliability and durability.Current FCVs are already competitive in terms of efficiency, emissions, silent driving and acceleration.However, further R&D is needed to reduce their cost and improve their durability.
In addition, a “chicken-or-egg” problem exists: an expensive hydrogen supply system will not beestablished without sufficient demand, and the demand for FCVs is unlikely to grow without thelow-cost hydrogen and extensive refuelling network that is provided by the hydrogen supplyinfrastructure. The potential use of fuel cells in the transportation sector has been considered sincethe late 1980s, and the potential of the “chicken-or-egg” problem to hinder the use of hydrogenwas identified in the 1990s. Car manufacturers devised a strategy to get fuel cell cars on the roadwithout the need for hydrogen infrastructure (Renzi et al., 2000 and Romano, 2003). The strategyfocused on reforming hydrogen on-board the vehicle from hydrocarbons. The goal was the introductionof mass-produced FCVs at a competitive cost, without the need for an extensive hydrogen supplynetwork in the initial market introduction phase.
Methanol was the prime candidate for on-board reforming. However, methanol and methyl tertiarybutyl ether (MTBE) developed a bad reputation due to toxicity and MTBE’s miscibility with water,which results in ground-water pollution. The focus was then switched to on-board gasoline reforming,but this development has also proved impractical. One reason is that the higher reforming temperatureof gasoline results in a long start-up time, well in excess of the 30 seconds that are consideredacceptable. In addition, sulphur impurities in gasoline poison the fuel cell’s platinum catalyst. Inconclusion, the on-board reforming of hydrogen poses significant additional technical and economicproblems over and above the already significant ones faced by FCVs that have on-board hydrogenstorage. As a result, the current focus is on solving the technical and economic problems associatedwith FCVs that rely on the on-board storage of hydrogen.
10. NOx emissions from hydrogen ICEs will be 90% lower than for a gasoline ICE, because the engine can operate in the so-called“lean-burn” mode with an excess of air. This leads to lower engine temperatures and less NOx production. A lean ratio also helps preventpre-ignition and back-firing. The specific characteristics of hydrogen combustion require some combustion engine adjustments, such asthe use of superchargers or sequential injection of air and fuel (Cho, 2004). These adjustments do not necessarily prevent the use ofother fuels in the same engines. For example, BMWs hydrogen-fuelled ICE vehicles can run on hydrogen or on gasoline. This dual-fuelcapability may become an essential feature of the introduction of hydrogen in the transition period.
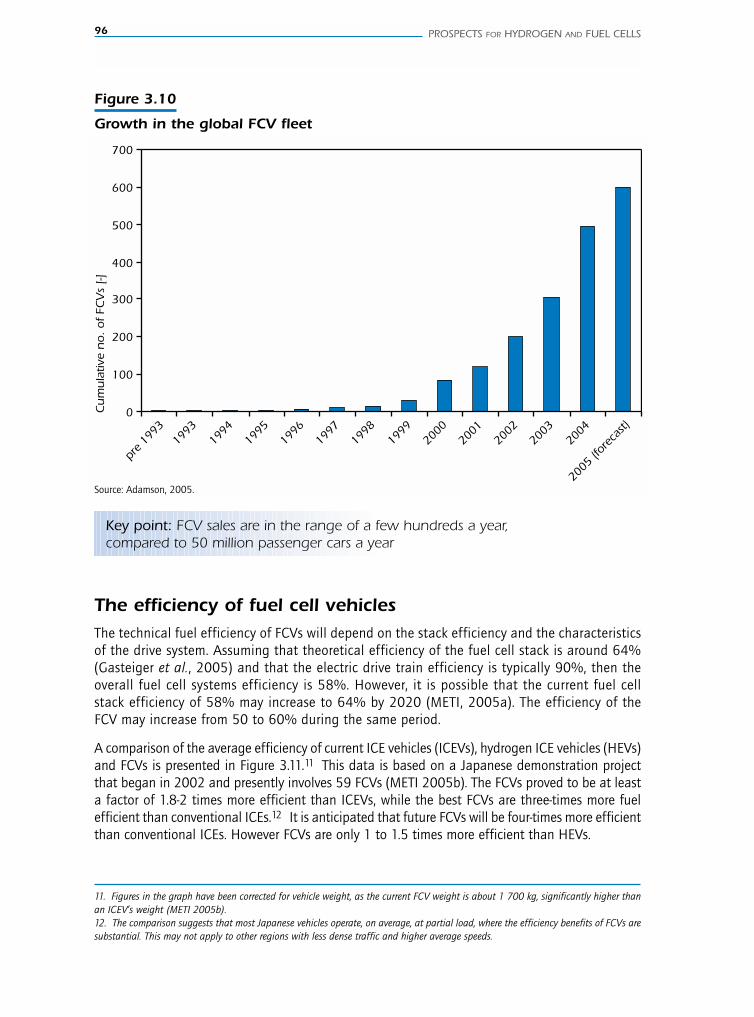
96 PROSPECTS FOR HYDROGEN AND FUEL CELLS
The efficiency of fuel cell vehicles The technical fuel efficiency of FCVs will depend on the stack efficiency and the characteristicsof the drive system. Assuming that theoretical efficiency of the fuel cell stack is around 64%(Gasteiger et al., 2005) and that the electric drive train efficiency is typically 90%, then theoverall fuel cell systems efficiency is 58%. However, it is possible that the current fuel cellstack efficiency of 58% may increase to 64% by 2020 (METI, 2005a). The efficiency of theFCV may increase from 50 to 60% during the same period.
A comparison of the average efficiency of current ICE vehicles (ICEVs), hydrogen ICE vehicles (HEVs)and FCVs is presented in Figure 3.11.11 This data is based on a Japanese demonstration projectthat began in 2002 and presently involves 59 FCVs (METI 2005b). The FCVs proved to be at leasta factor of 1.8-2 times more efficient than ICEVs, while the best FCVs are three-times more fuelefficient than conventional ICEs.12 It is anticipated that future FCVs will be four-times more efficientthan conventional ICEs. However FCVs are only 1 to 1.5 times more efficient than HEVs.
Figure 3.10
Growth in the global FCV fleet
0
100
200
300
400
500
600
700
pre 19
9319
9319
9419
9519
9619
9719
9819
9920
0020
0120
0220
0320
04
2005
(for
ecas
t)
Cu
mu
lativ
e n
o.
of
FCV
s [-]
Key point: FCV sales are in the range of a few hundreds a year,compared to 50 million passenger cars a year
Source: Adamson, 2005.
11. Figures in the graph have been corrected for vehicle weight, as the current FCV weight is about 1 700 kg, significantly higher thanan ICEV’s weight (METI 2005b).12. The comparison suggests that most Japanese vehicles operate, on average, at partial load, where the efficiency benefits of FCVs aresubstantial. This may not apply to other regions with less dense traffic and higher average speeds.
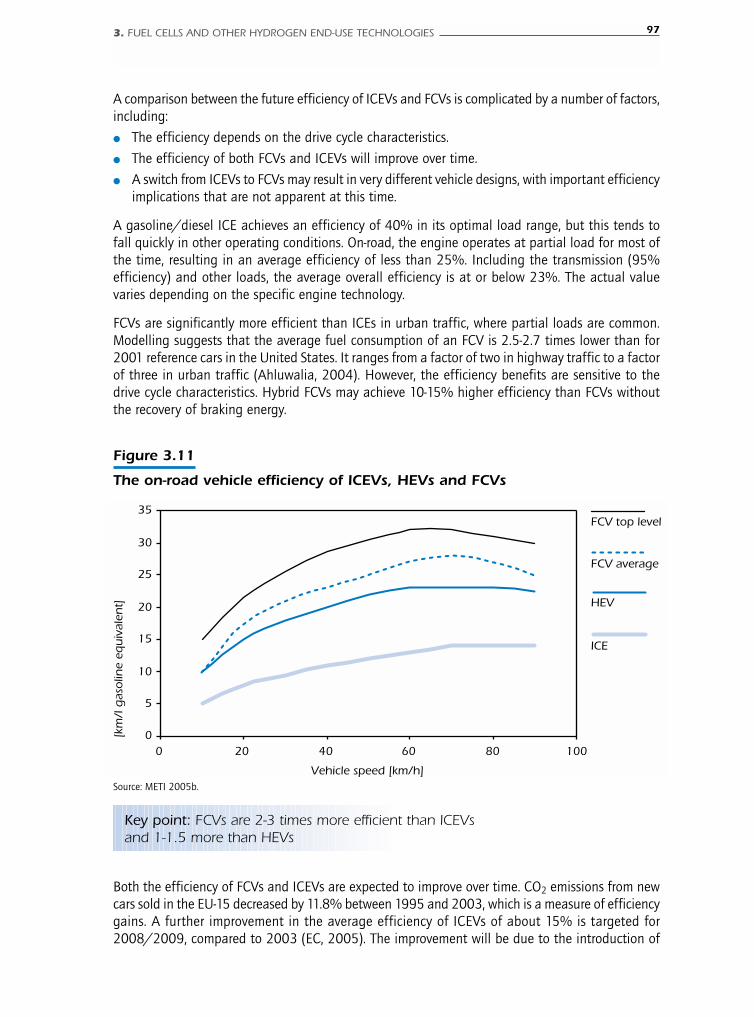
3. FUEL CELLS AND OTHER HYDROGEN END-USE TECHNOLOGIES 97
A comparison between the future efficiency of ICEVs and FCVs is complicated by a number of factors,including:
● The efficiency depends on the drive cycle characteristics.
● The efficiency of both FCVs and ICEVs will improve over time.
● A switch from ICEVs to FCVs may result in very different vehicle designs, with important efficiencyimplications that are not apparent at this time.
A gasoline/diesel ICE achieves an efficiency of 40% in its optimal load range, but this tends tofall quickly in other operating conditions. On-road, the engine operates at partial load for most ofthe time, resulting in an average efficiency of less than 25%. Including the transmission (95%efficiency) and other loads, the average overall efficiency is at or below 23%. The actual valuevaries depending on the specific engine technology.
FCVs are significantly more efficient than ICEs in urban traffic, where partial loads are common.Modelling suggests that the average fuel consumption of an FCV is 2.5-2.7 times lower than for2001 reference cars in the United States. It ranges from a factor of two in highway traffic to a factorof three in urban traffic (Ahluwalia, 2004). However, the efficiency benefits are sensitive to thedrive cycle characteristics. Hybrid FCVs may achieve 10-15% higher efficiency than FCVs withoutthe recovery of braking energy.
Figure 3.11
The on-road vehicle efficiency of ICEVs, HEVs and FCVs
0
5
10
15
20
25
30
35
0 20 40 60 80 100
Vehicle speed [km/h]
[km
/l g
aso
line
equ
ival
ent]
FCV top level
FCV average
HEV
ICE
Key point: FCVs are 2-3 times more efficient than ICEVsand 1-1.5 more than HEVs
Source: METI 2005b.
Both the efficiency of FCVs and ICEVs are expected to improve over time. CO2 emissions from newcars sold in the EU-15 decreased by 11.8% between 1995 and 2003, which is a measure of efficiencygains. A further improvement in the average efficiency of ICEVs of about 15% is targeted for2008/2009, compared to 2003 (EC, 2005). The improvement will be due to the introduction of
98 PROSPECTS FOR HYDROGEN AND FUEL CELLS
a range of new technologies, including: variable-valve timing and lift electronic control systems,dual and sequential ignition, gasoline direct injection, turbo and twin-turbo engines or variablecompressors, and advanced transmissions. Further technology improvements, such as intelligentdrive systems and continued weight reduction, could also be applied to FCV drive systems.
FCVs also offer the opportunity for specific energy-efficiency improvements not available to ICEVs.FCVs can recover the energy in braking if they are equipped with a battery, similar to the existing ICE-hybrid vehicles. This may yield a few percentage points up to 15% fuel savings, depending on the drivecycle characteristics. Fundamental re-design of the vehicle could make FCVs about 300 kg lighter thana comparable ICEV and result in a fuel saving of 15% (Watanabe, 2005). If both effects are accountedfor, FCVs might be 2.26 to 2.93 times more efficient than an advanced ICEV. The so-called “skateboarddesign”, where the fuel cell is integrated in the bottom-plate of the car and each wheel is equippedwith its own electric motor, could make the transmission system unnecessary. In this case steering,braking and other vehicle systems could be controlled electronically rather than mechanically.
The United States Department of Energy takes some of these factors into account in its projections,resulting in a relative efficiency factor of 2.27 (i.e. FCVs use 2.27 times less fuel than an ICEV) in2010 and 2.95 in 2050. This is a 66% gain compared to advanced ICEs in 2050 (Figure 3.12). Inthis study, the uncertainty about the efficiency gain of FCVs over advanced ICEs is explicitly takeninto account. The average fuel savings due to the higher efficiency of new ICE cars sold in 2050compared to the average stock efficiency in 2000 is set at 26%. This is based on a study carriedout by the IEA in co-operation with the World Business Council for Sustainable Development (WBCSD,2004 and Figure 3.12). The efficiency gain of the average vehicle stock in 2050 is 19% in theWBCSD study. The relative efficiency gain of FCVs compared to advanced new ICEVs ranges from46% to 66% (WBCSD, 2004).
Figure 3.12
Potential efficiency improvements for LDVs
0
25
50
75
100
Gas
olin
e IC
E
Gas
olin
e IC
E
Gas
olin
e hy
brid Die
sel
ICE
Die
sel
hybr
id
Hyd
roge
n hy
brid
H 2 F
CV
WBC
SD
H 2 F
CV
USD
OE
Present stock 2050 2050 2050 2050 2050 2050 2050
Fuel
eco
no
my
ind
ex [
-]
-26%
-30% -24% -36% -39% -46% -66%
Key point: 30% to 66% less fuel is needed by more efficientvehicles than the 2050 reference ICEV
Source: WBCSD, 2004.
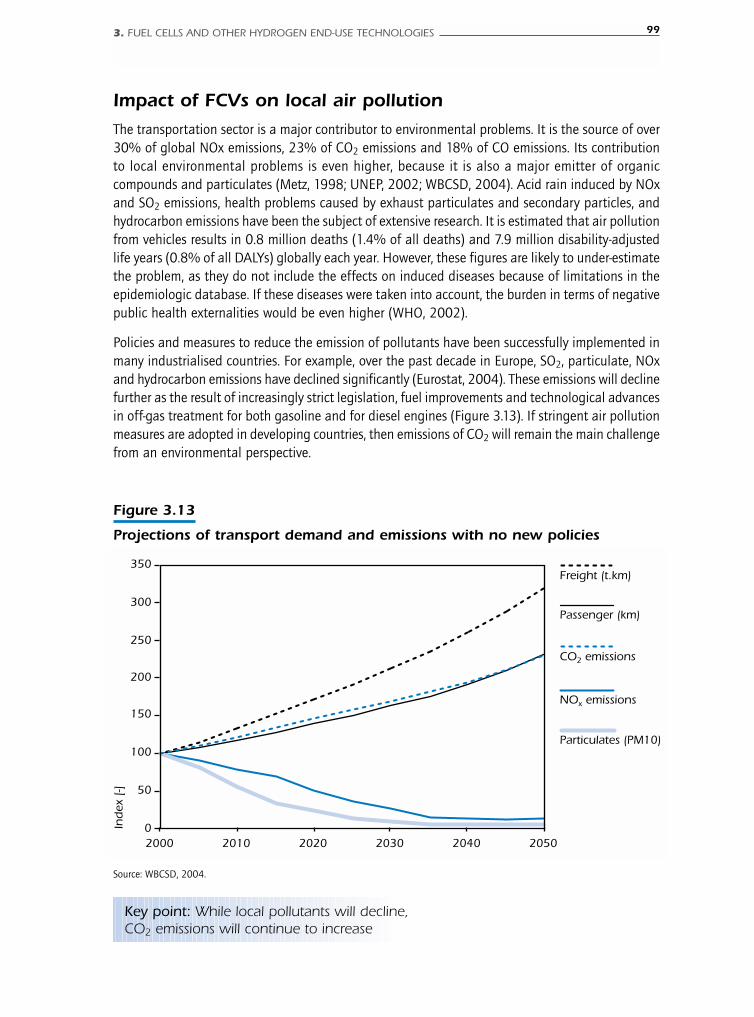
3. FUEL CELLS AND OTHER HYDROGEN END-USE TECHNOLOGIES 99
Impact of FCVs on local air pollution
The transportation sector is a major contributor to environmental problems. It is the source of over30% of global NOx emissions, 23% of CO2 emissions and 18% of CO emissions. Its contributionto local environmental problems is even higher, because it is also a major emitter of organiccompounds and particulates (Metz, 1998; UNEP, 2002; WBCSD, 2004). Acid rain induced by NOxand SO2 emissions, health problems caused by exhaust particulates and secondary particles, andhydrocarbon emissions have been the subject of extensive research. It is estimated that air pollutionfrom vehicles results in 0.8 million deaths (1.4% of all deaths) and 7.9 million disability-adjustedlife years (0.8% of all DALYs) globally each year. However, these figures are likely to under-estimatethe problem, as they do not include the effects on induced diseases because of limitations in theepidemiologic database. If these diseases were taken into account, the burden in terms of negativepublic health externalities would be even higher (WHO, 2002).
Policies and measures to reduce the emission of pollutants have been successfully implemented inmany industrialised countries. For example, over the past decade in Europe, SO2, particulate, NOxand hydrocarbon emissions have declined significantly (Eurostat, 2004). These emissions will declinefurther as the result of increasingly strict legislation, fuel improvements and technological advancesin off-gas treatment for both gasoline and for diesel engines (Figure 3.13). If stringent air pollutionmeasures are adopted in developing countries, then emissions of CO2 will remain the main challengefrom an environmental perspective.
Figure 3.13
Projections of transport demand and emissions with no new policies
0
50
100
150
200
250
300
350
2000 2010 2020 2030 2040 2050
Ind
ex [
-]
Freight (t.km)
Passenger (km)
CO2 emissions
NOx emissions
Particulates (PM10)
Key point: While local pollutants will decline,CO2 emissions will continue to increase
Source: WBCSD, 2004.
100 PROSPECTS FOR HYDROGEN AND FUEL CELLS
The current trend in vehicle ownership is towards larger and heavier cars that use more fuel. Also,the modal-switch trend is away from energy-efficient, slow transportation solutions (e.g. from busto car, and from car and train to airplane). The emphasis is on energy-intensive, high-speed modes.While traffic management systems and advanced ICEs may help to reduce fuel consumption in theshort term, additional energy efficiency measures and fuel switching will be the only way to reduceCO2 emissions in the long term. Hydrogen ICEVs and FCVs could significantly contribute to reducingCO2 and other emissions.
Cost of the fuel cell vehicles At present, hydrogen FCVs are more expensive than conventional ICE vehicles. In 2002, Toyotaoffered the first semi-commercial hydrogen FCVs for demonstration purposes at USD 10 000 permonth on a 30-month lease (Wards, 2003). If this leasing price fully covered the vehicle productioncosts, it would imply a fuel-cell system cost of around USD 4 000/kW for a 75kW system, or avehicle cost of USD 300 000. In addition, the life span of current fuel cell stacks is shorter thanthe vehicle life and might require replacing two or three times during the life of the vehicle. However,a number of studies suggest that in the coming decades the cost of fuel cells will decline quicklyas a consequence of mass-production and technology learning, and that their durability will alsoimprove. Furthermore, the required fuel cell power output (kW) may be considerably lower than forcurrent cars and light-trucks, as FCVs will be lighter and more efficient.
Recent literature suggests that manufacturers are fairly confident that current RD&D programmesshould be able to bring the cost of production down to a few hundred dollars per kW in a relativelyshort period. However, even at this price FCVs will not be competitive with conventional ICE vehicles,whose cost averages a mere USD 30/kW. Costs will therefore have to fall by even more than currentexpectations, which will necessitate large-scale production and “technology learning”.
However, FCVs could still be introduced while they still have a high incremental cost if governmentsubsidies were used to help initial sales. In this case, their success will depend on very quick costreductions to avoid the need for substantial government subsidies. Fortunately, rapid cost declinesare not an unreasonable assumption, as cost reductions due to technology and process improvements(mass-production, streamlining, de-bottlenecking, etc.) have been seen to occur in the past for awide variety of new technologies. However, learning rates vary considerably across differenttechnologies and relatively small differences in the learning rate can cause large differences in therate at which costs decline over time (IEA, 2000).
The cost of a fuel cell vehicle is the sum of the costs for the fuel cell stack (including power electronicsand other peripherals), the hydrogen storage system, the electric engine, the battery (if a hybridsystem is used) and the reformer (if fuels other than hydrogen are used). It is estimated that thecost of a FCV might decline to between USD 22 000 and USD 27 000 in 2030 (Table 3.5)13. Thekey assumptions in Table 3.5 are that PEM fuel cell costs would decline over time to between USD35/kW and USD 75/kW and that the optimistic USD 35/kW for the PEM fuel cell stack couldoccur between 2025 and 2040. The incremental cost of a fuel cell vehicle in 2030 over a conventionalvehicle would then range from USD 2 200 to USD 7 625 per car. These estimates suggest that inthe short-term the fuel cell stack and the peripherals represent the bulk of the incremental cost,but that the hydrogen storage system, the electric drive system, and the battery may becomeimportant in the long term.
13. The data in Table 3.5 is the basis for the FCV cost assumptions used in the ETP model.
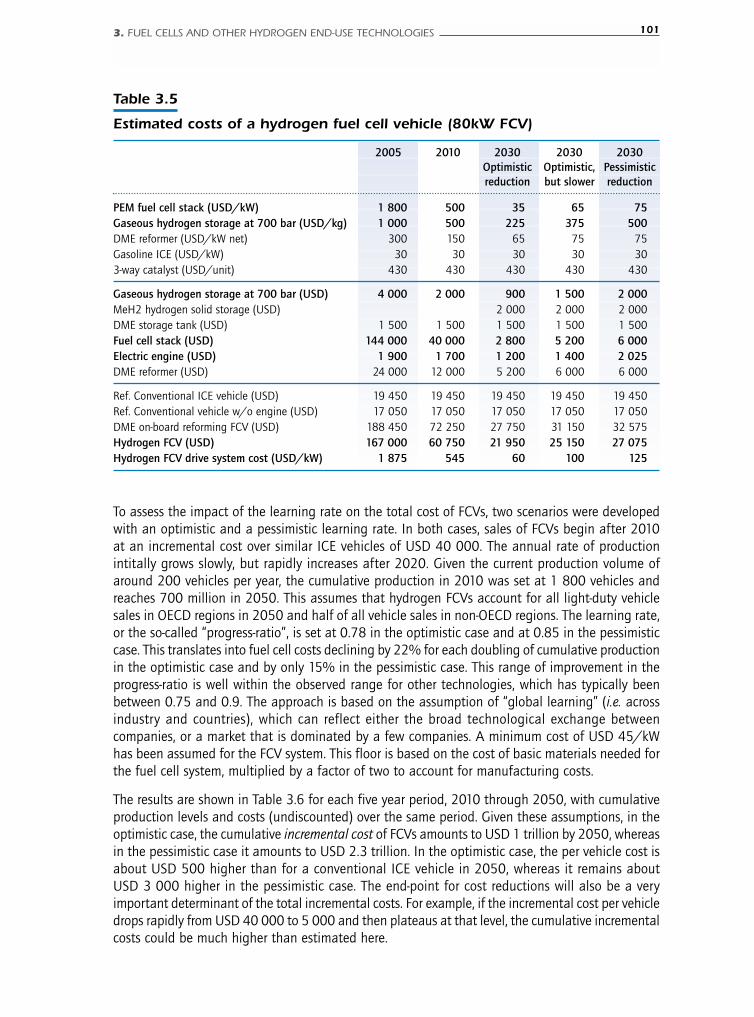
3. FUEL CELLS AND OTHER HYDROGEN END-USE TECHNOLOGIES 101
To assess the impact of the learning rate on the total cost of FCVs, two scenarios were developedwith an optimistic and a pessimistic learning rate. In both cases, sales of FCVs begin after 2010at an incremental cost over similar ICE vehicles of USD 40 000. The annual rate of productionintitally grows slowly, but rapidly increases after 2020. Given the current production volume ofaround 200 vehicles per year, the cumulative production in 2010 was set at 1 800 vehicles andreaches 700 million in 2050. This assumes that hydrogen FCVs account for all light-duty vehiclesales in OECD regions in 2050 and half of all vehicle sales in non-OECD regions. The learning rate,or the so-called “progress-ratio”, is set at 0.78 in the optimistic case and at 0.85 in the pessimisticcase. This translates into fuel cell costs declining by 22% for each doubling of cumulative productionin the optimistic case and by only 15% in the pessimistic case. This range of improvement in theprogress-ratio is well within the observed range for other technologies, which has typically beenbetween 0.75 and 0.9. The approach is based on the assumption of “global learning” (i.e. acrossindustry and countries), which can reflect either the broad technological exchange betweencompanies, or a market that is dominated by a few companies. A minimum cost of USD 45/kWhas been assumed for the FCV system. This floor is based on the cost of basic materials needed forthe fuel cell system, multiplied by a factor of two to account for manufacturing costs.
The results are shown in Table 3.6 for each five year period, 2010 through 2050, with cumulativeproduction levels and costs (undiscounted) over the same period. Given these assumptions, in theoptimistic case, the cumulative incremental cost of FCVs amounts to USD 1 trillion by 2050, whereasin the pessimistic case it amounts to USD 2.3 trillion. In the optimistic case, the per vehicle cost isabout USD 500 higher than for a conventional ICE vehicle in 2050, whereas it remains aboutUSD 3 000 higher in the pessimistic case. The end-point for cost reductions will also be a veryimportant determinant of the total incremental costs. For example, if the incremental cost per vehicledrops rapidly from USD 40 000 to 5 000 and then plateaus at that level, the cumulative incrementalcosts could be much higher than estimated here.
Table 3.5
Estimated costs of a hydrogen fuel cell vehicle (80kW FCV)
2005 2010 2030 2030 2030Optimistic Optimistic, Pessimisticreduction but slower reduction
PEM fuel cell stack (USD/kW) 1 800 500 35 65 75Gaseous hydrogen storage at 700 bar (USD/kg) 1 000 500 225 375 500DME reformer (USD/kW net) 300 150 65 75 75Gasoline ICE (USD/kW) 30 30 30 30 303-way catalyst (USD/unit) 430 430 430 430 430
Gaseous hydrogen storage at 700 bar (USD) 4 000 2 000 900 1 500 2 000MeH2 hydrogen solid storage (USD) 2 000 2 000 2 000DME storage tank (USD) 1 500 1 500 1 500 1 500 1 500Fuel cell stack (USD) 144 000 40 000 2 800 5 200 6 000Electric engine (USD) 1 900 1 700 1 200 1 400 2 025DME reformer (USD) 24 000 12 000 5 200 6 000 6 000
Ref. Conventional ICE vehicle (USD) 19 450 19 450 19 450 19 450 19 450Ref. Conventional vehicle w/o engine (USD) 17 050 17 050 17 050 17 050 17 050DME on-board reforming FCV (USD) 188 450 72 250 27 750 31 150 32 575Hydrogen FCV (USD) 167 000 60 750 21 950 25 150 27 075Hydrogen FCV drive system cost (USD/kW) 1 875 545 60 100 125
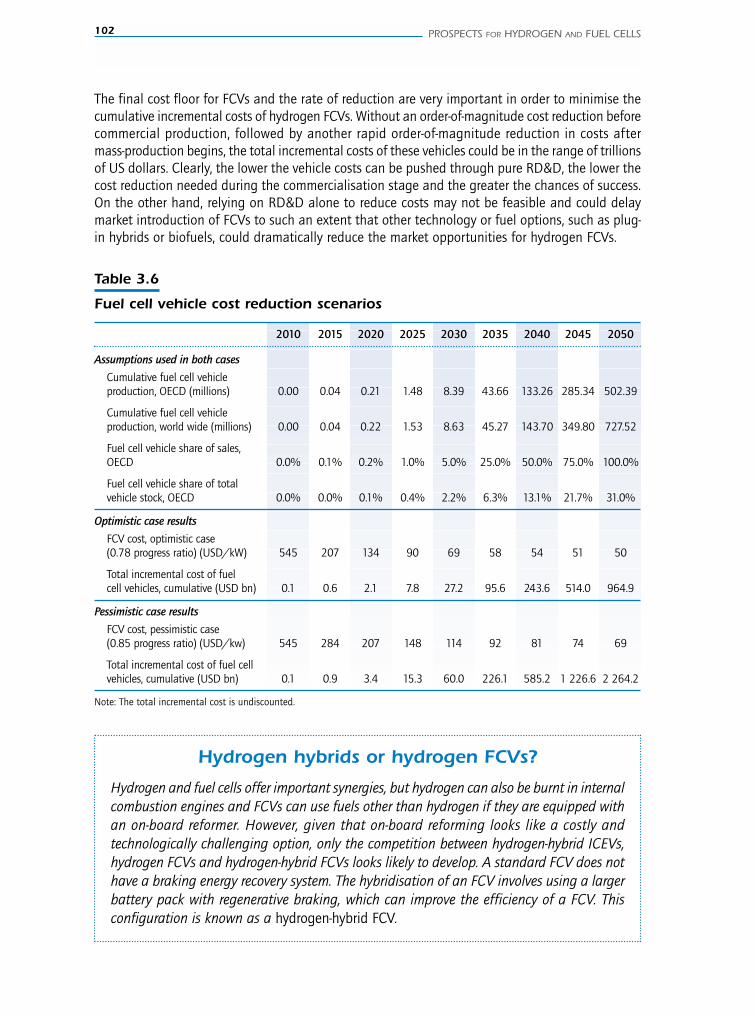
102 PROSPECTS FOR HYDROGEN AND FUEL CELLS
The final cost floor for FCVs and the rate of reduction are very important in order to minimise thecumulative incremental costs of hydrogen FCVs. Without an order-of-magnitude cost reduction beforecommercial production, followed by another rapid order-of-magnitude reduction in costs aftermass-production begins, the total incremental costs of these vehicles could be in the range of trillionsof US dollars. Clearly, the lower the vehicle costs can be pushed through pure RD&D, the lower thecost reduction needed during the commercialisation stage and the greater the chances of success.On the other hand, relying on RD&D alone to reduce costs may not be feasible and could delaymarket introduction of FCVs to such an extent that other technology or fuel options, such as plug-in hybrids or biofuels, could dramatically reduce the market opportunities for hydrogen FCVs.
Table 3.6
Fuel cell vehicle cost reduction scenarios
2010 2015 2020 2025 2030 2035 2040 2045 2050
Assumptions used in both cases
Cumulative fuel cell vehicleproduction, OECD (millions) 0.00 0.04 0.21 1.48 8.39 43.66 133.26 285.34 502.39
Cumulative fuel cell vehicleproduction, world wide (millions) 0.00 0.04 0.22 1.53 8.63 45.27 143.70 349.80 727.52
Fuel cell vehicle share of sales,OECD 0.0% 0.1% 0.2% 1.0% 5.0% 25.0% 50.0% 75.0% 100.0%
Fuel cell vehicle share of totalvehicle stock, OECD 0.0% 0.0% 0.1% 0.4% 2.2% 6.3% 13.1% 21.7% 31.0%
Optimistic case results
FCV cost, optimistic case(0.78 progress ratio) (USD/kW) 545 207 134 90 69 58 54 51 50
Total incremental cost of fuelcell vehicles, cumulative (USD bn) 0.1 0.6 2.1 7.8 27.2 95.6 243.6 514.0 964.9
Pessimistic case results
FCV cost, pessimistic case(0.85 progress ratio) (USD/kw) 545 284 207 148 114 92 81 74 69
Total incremental cost of fuel cellvehicles, cumulative (USD bn) 0.1 0.9 3.4 15.3 60.0 226.1 585.2 1 226.6 2 264.2
Note: The total incremental cost is undiscounted.
Hydrogen hybrids or hydrogen FCVs?
Hydrogen and fuel cells offer important synergies, but hydrogen can also be burnt in internalcombustion engines and FCVs can use fuels other than hydrogen if they are equipped withan on-board reformer. However, given that on-board reforming looks like a costly andtechnologically challenging option, only the competition between hydrogen-hybrid ICEVs,hydrogen FCVs and hydrogen-hybrid FCVs looks likely to develop. A standard FCV does nothave a braking energy recovery system. The hybridisation of an FCV involves using a largerbattery pack with regenerative braking, which can improve the efficiency of a FCV. Thisconfiguration is known as a hydrogen-hybrid FCV.
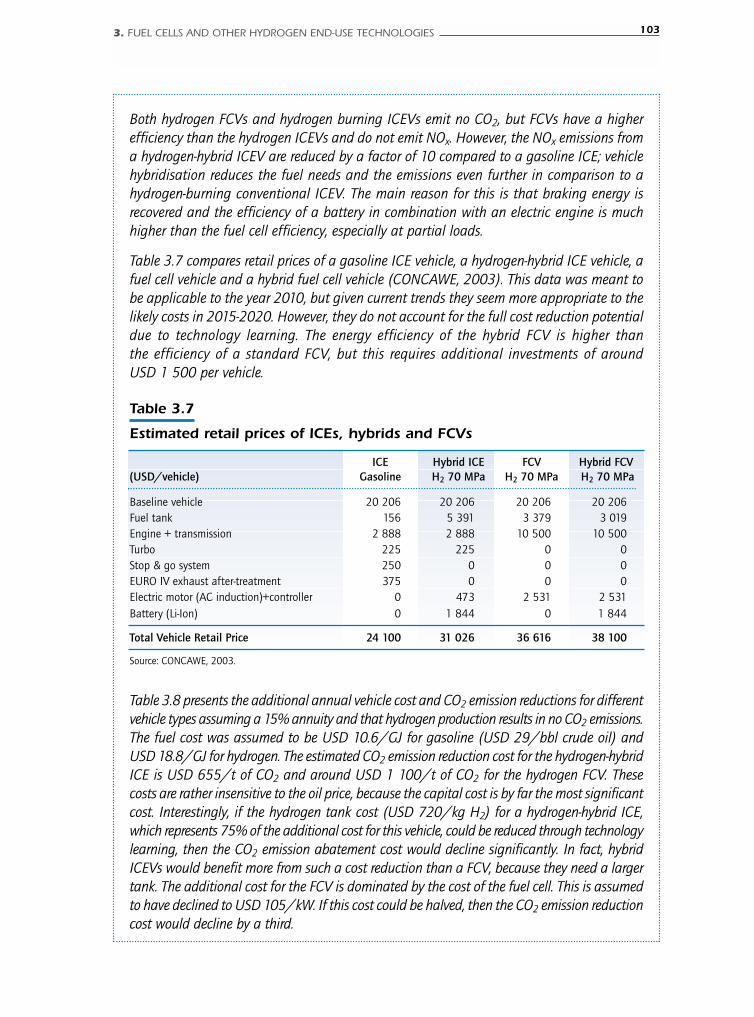
3. FUEL CELLS AND OTHER HYDROGEN END-USE TECHNOLOGIES 103
Both hydrogen FCVs and hydrogen burning ICEVs emit no CO2, but FCVs have a higherefficiency than the hydrogen ICEVs and do not emit NOx. However, the NOx emissions froma hydrogen-hybrid ICEV are reduced by a factor of 10 compared to a gasoline ICE; vehiclehybridisation reduces the fuel needs and the emissions even further in comparison to ahydrogen-burning conventional ICEV. The main reason for this is that braking energy isrecovered and the efficiency of a battery in combination with an electric engine is muchhigher than the fuel cell efficiency, especially at partial loads.
Table 3.7 compares retail prices of a gasoline ICE vehicle, a hydrogen-hybrid ICE vehicle, afuel cell vehicle and a hybrid fuel cell vehicle (CONCAWE, 2003). This data was meant tobe applicable to the year 2010, but given current trends they seem more appropriate to thelikely costs in 2015-2020. However, they do not account for the full cost reduction potentialdue to technology learning. The energy efficiency of the hybrid FCV is higher thanthe efficiency of a standard FCV, but this requires additional investments of aroundUSD 1 500 per vehicle.
Table 3.7
Estimated retail prices of ICEs, hybrids and FCVs
ICE Hybrid ICE FCV Hybrid FCV(USD/vehicle) Gasoline H2 70 MPa H2 70 MPa H2 70 MPa
Baseline vehicle 20 206 20 206 20 206 20 206Fuel tank 156 5 391 3 379 3 019Engine + transmission 2 888 2 888 10 500 10 500Turbo 225 225 0 0Stop & go system 250 0 0 0EURO IV exhaust after-treatment 375 0 0 0Electric motor (AC induction)+controller 0 473 2 531 2 531Battery (Li-Ion) 0 1 844 0 1 844
Total Vehicle Retail Price 24 100 31 026 36 616 38 100
Source: CONCAWE, 2003.
Table 3.8 presents the additional annual vehicle cost and CO2 emission reductions for differentvehicle types assuming a 15% annuity and that hydrogen production results in no CO2 emissions.The fuel cost was assumed to be USD 10.6/GJ for gasoline (USD 29/bbl crude oil) andUSD 18.8/GJ for hydrogen. The estimated CO2 emission reduction cost for the hydrogen-hybridICE is USD 655/t of CO2 and around USD 1 100/t of CO2 for the hydrogen FCV. Thesecosts are rather insensitive to the oil price, because the capital cost is by far the most significantcost. Interestingly, if the hydrogen tank cost (USD 720/kg H2) for a hydrogen-hybrid ICE,which represents 75% of the additional cost for this vehicle, could be reduced through technologylearning, then the CO2 emission abatement cost would decline significantly. In fact, hybridICEVs would benefit more from such a cost reduction than a FCV, because they need a largertank. The additional cost for the FCV is dominated by the cost of the fuel cell. This is assumedto have declined to USD 105/kW. If this cost could be halved, then the CO2 emission reductioncost would decline by a third.

104 PROSPECTS FOR HYDROGEN AND FUEL CELLS
Niche markets for PEM fuel cells in the transport sector
The introduction of FCVs is a challenge, because of the low cost of conventional ICEVs and the lowutilisation factor of private cars. Commercial buses have much higher utilisation rates and representa more attractive market for highly efficient but more expensive fuel cells vehicles. Larger vehiclesalso offer easier solutions to the large space requirements of hydrogen on-board storage. In addition,fuel cells could compete effectively with batteries (instead of low-cost ICEs) in niche transportationmarkets such as wheelchairs, carts and forklifts.
Buses Almost 80 fuel cell buses (FCBs) are in use world wide in several demonstration projects. The EuropeanCUTE and ECTOS projects account for 30 buses that are currently part of the public transport systemsin several European cities. Today’s FCBs are nearly all powered by PEM fuel cells that range in powerfrom around 70 kW (hybridised with a battery) to 200 kW. More than 75% of current FCBs havecompressed hydrogen gas storage systems. The DaimlerChrysler Citaro FCBs used in the CUTE projecthave a 200-300 km range, carry 60-70 passengers, are powered by a 250 kW PEM fuel cell(200 kW shaft power) and have up to 44 kg of compressed hydrogen gas stored at 350 bar. Inurban traffic with a lot of stops, a FCB has the potential to offer significant efficiency gains comparedto a conventional ICE powered bus. However, given their early stage of development, the Citarobuses use 40-50% more fuel than a comparable diesel ICE (Schuckert, 2005). In the long-run it ishoped this will reverse and they will use 20% less fuel.
Without further technology cost reductions beyond those assumed in Table 3.8, hydrogen andfuel cell vehicles represent very expensive CO2 emission abatement options. The CO2 emissionabatement cost of between USD 655 and USD 1 179 per tonne compares poorly with estimatesof the costs needed to stabilise emissions of USD 10-100/t of CO2.
Table 3.8
Hydrogen hybrids and FCV CO2 emissions reduction cost
Incremental Annual CO2 Additional Cost of CO2
invest. cost fuel use reduction cost reduction
(USD/vehicle) (GJ/yr) (t/yr) (USD/yr) (USD/t)
Gasoline 0 23.8 0.00 0Hydrogen hybrid 6 926 18.6 1.73 1 136 655Hydrogen FCV 12 516 11.8 1.73 1 845 1 064Hydrogen-hybrid FCV 14 000 10.5 1.73 2 045 1 179
Source: CONCAWE, 2003.
This brief analysis suggests that hydrogen-hybrid ICEVs may be an economic transitionstrategy to FCVs and could represent an option to build up a hydrogen refuelling network.
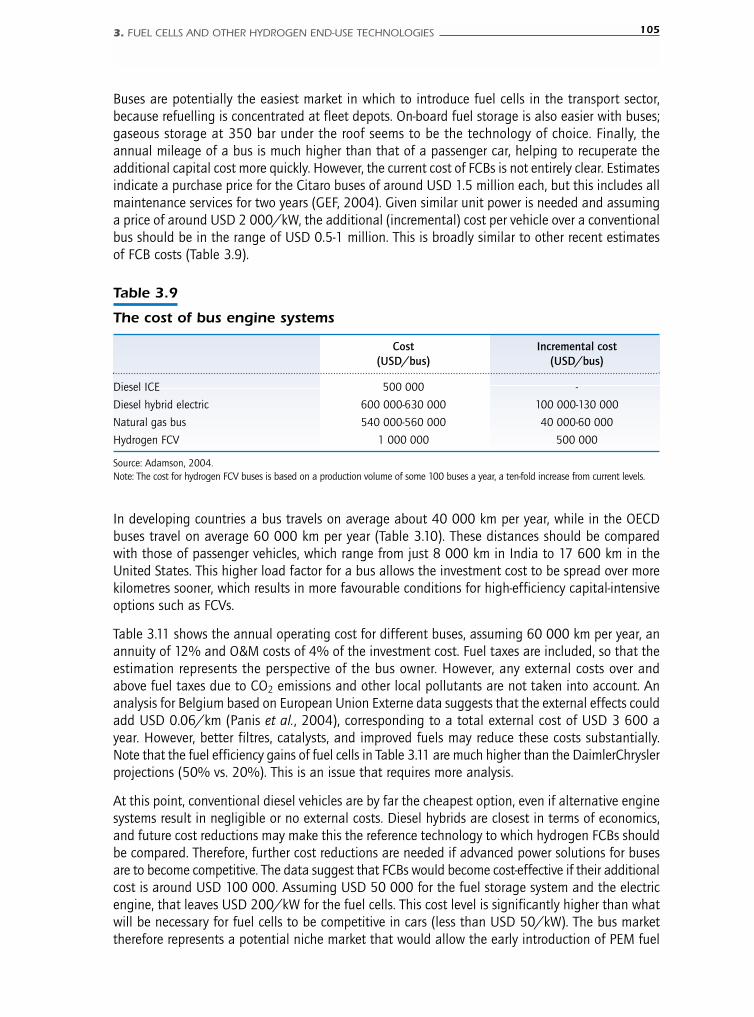
3. FUEL CELLS AND OTHER HYDROGEN END-USE TECHNOLOGIES 105
Buses are potentially the easiest market in which to introduce fuel cells in the transport sector,because refuelling is concentrated at fleet depots. On-board fuel storage is also easier with buses;gaseous storage at 350 bar under the roof seems to be the technology of choice. Finally, theannual mileage of a bus is much higher than that of a passenger car, helping to recuperate theadditional capital cost more quickly. However, the current cost of FCBs is not entirely clear. Estimatesindicate a purchase price for the Citaro buses of around USD 1.5 million each, but this includes allmaintenance services for two years (GEF, 2004). Given similar unit power is needed and assuminga price of around USD 2 000/kW, the additional (incremental) cost per vehicle over a conventionalbus should be in the range of USD 0.5-1 million. This is broadly similar to other recent estimatesof FCB costs (Table 3.9).
Table 3.9
The cost of bus engine systems
Cost Incremental cost(USD/bus) (USD/bus)
Diesel ICE 500 000 -
Diesel hybrid electric 600 000-630 000 100 000-130 000
Natural gas bus 540 000-560 000 40 000-60 000
Hydrogen FCV 1 000 000 500 000
Source: Adamson, 2004.Note: The cost for hydrogen FCV buses is based on a production volume of some 100 buses a year, a ten-fold increase from current levels.
In developing countries a bus travels on average about 40 000 km per year, while in the OECDbuses travel on average 60 000 km per year (Table 3.10). These distances should be comparedwith those of passenger vehicles, which range from just 8 000 km in India to 17 600 km in theUnited States. This higher load factor for a bus allows the investment cost to be spread over morekilometres sooner, which results in more favourable conditions for high-efficiency capital-intensiveoptions such as FCVs.
Table 3.11 shows the annual operating cost for different buses, assuming 60 000 km per year, anannuity of 12% and O&M costs of 4% of the investment cost. Fuel taxes are included, so that theestimation represents the perspective of the bus owner. However, any external costs over andabove fuel taxes due to CO2 emissions and other local pollutants are not taken into account. Ananalysis for Belgium based on European Union Externe data suggests that the external effects couldadd USD 0.06/km (Panis et al., 2004), corresponding to a total external cost of USD 3 600 ayear. However, better filtres, catalysts, and improved fuels may reduce these costs substantially.Note that the fuel efficiency gains of fuel cells in Table 3.11 are much higher than the DaimlerChryslerprojections (50% vs. 20%). This is an issue that requires more analysis.
At this point, conventional diesel vehicles are by far the cheapest option, even if alternative enginesystems result in negligible or no external costs. Diesel hybrids are closest in terms of economics,and future cost reductions may make this the reference technology to which hydrogen FCBs shouldbe compared. Therefore, further cost reductions are needed if advanced power solutions for busesare to become competitive. The data suggest that FCBs would become cost-effective if their additionalcost is around USD 100 000. Assuming USD 50 000 for the fuel storage system and the electricengine, that leaves USD 200/kW for the fuel cells. This cost level is significantly higher than whatwill be necessary for fuel cells to be competitive in cars (less than USD 50/kW). The bus markettherefore represents a potential niche market that would allow the early introduction of PEM fuel
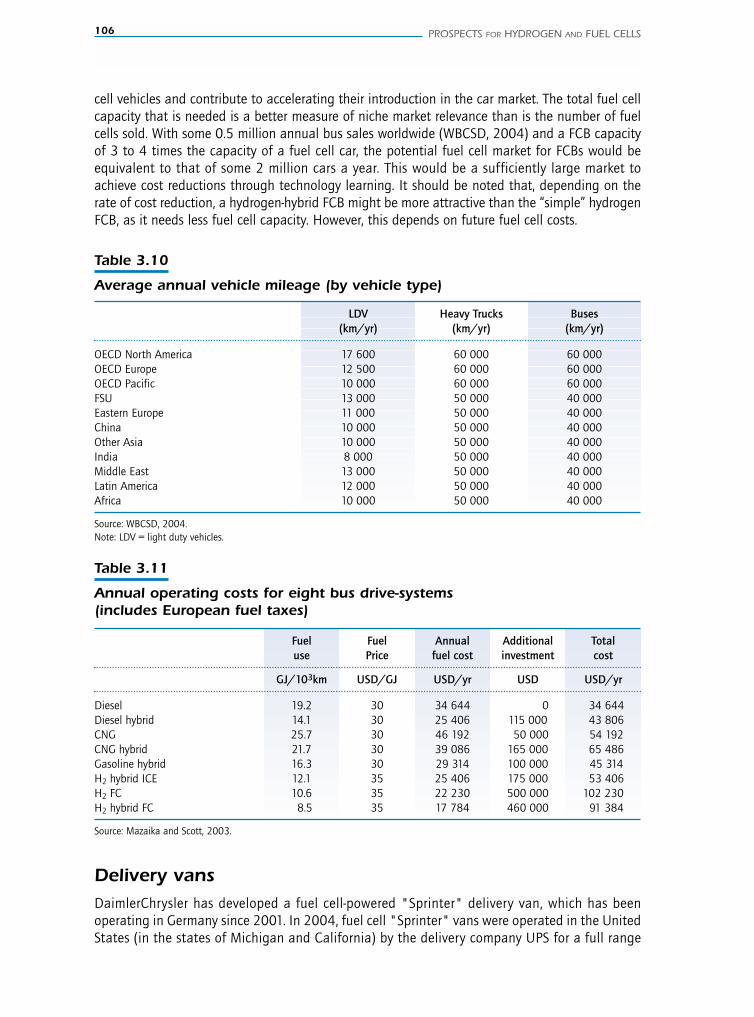
106 PROSPECTS FOR HYDROGEN AND FUEL CELLS
cell vehicles and contribute to accelerating their introduction in the car market. The total fuel cellcapacity that is needed is a better measure of niche market relevance than is the number of fuelcells sold. With some 0.5 million annual bus sales worldwide (WBCSD, 2004) and a FCB capacityof 3 to 4 times the capacity of a fuel cell car, the potential fuel cell market for FCBs would beequivalent to that of some 2 million cars a year. This would be a sufficiently large market toachieve cost reductions through technology learning. It should be noted that, depending on therate of cost reduction, a hydrogen-hybrid FCB might be more attractive than the “simple” hydrogenFCB, as it needs less fuel cell capacity. However, this depends on future fuel cell costs.
Table 3.10
Average annual vehicle mileage (by vehicle type)
LDV Heavy Trucks Buses(km/yr) (km/yr) (km/yr)
OECD North America 17 600 60 000 60 000OECD Europe 12 500 60 000 60 000OECD Pacific 10 000 60 000 60 000FSU 13 000 50 000 40 000Eastern Europe 11 000 50 000 40 000China 10 000 50 000 40 000Other Asia 10 000 50 000 40 000India 8 000 50 000 40 000Middle East 13 000 50 000 40 000Latin America 12 000 50 000 40 000Africa 10 000 50 000 40 000
Source: WBCSD, 2004.Note: LDV = light duty vehicles.
Table 3.11
Annual operating costs for eight bus drive-systems (includes European fuel taxes)
Fuel Fuel Annual Additional Totaluse Price fuel cost investment cost
GJ/103km USD/GJ USD/yr USD USD/yr
Diesel 19.2 30 34 644 0 34 644Diesel hybrid 14.1 30 25 406 115 000 43 806CNG 25.7 30 46 192 50 000 54 192CNG hybrid 21.7 30 39 086 165 000 65 486Gasoline hybrid 16.3 30 29 314 100 000 45 314H2 hybrid ICE 12.1 35 25 406 175 000 53 406H2 FC 10.6 35 22 230 500 000 102 230H2 hybrid FC 8.5 35 17 784 460 000 91 384
Source: Mazaika and Scott, 2003.
Delivery vansDaimlerChrysler has developed a fuel cell-powered "Sprinter" delivery van, which has beenoperating in Germany since 2001. In 2004, fuel cell "Sprinter" vans were operated in the UnitedStates (in the states of Michigan and California) by the delivery company UPS for a full range
3. FUEL CELLS AND OTHER HYDROGEN END-USE TECHNOLOGIES 107
of normal delivery services (EPA, 2004). The 55 kW electric motor allows a top speed of120 km/h and an operating range of 150 km. UPS has long-term plans to use FCVs (Cropper,2004). In Japan, a General Motors HydroGen3 FCV has been delivering packages for theFedEX company since July 2003.
With frequent stops and high annual mileage (20 000 to 32 000 km a year or twice the distanceof regular passenger cars), a delivery service is well suited to exploit the energy-saving potentialof fuel cells and obtain a more rapid recovery of the higher investment cost. In this marketsegment, FCVs would become cost-effective at an incremental cost of around USD 15 000 pervehicle. Assuming a 75 kW fuel cell system and USD 5 000 for hydrogen storage and the electricengine, the resulting competitiveness threshold for fuel cells would be USD 135/kW (givenEuropean fuel tax levels). The global stock of these medium duty trucks amounts to 26 million(WBCSD, 2004) and is projected to increase four-fold by 2050. Annual sales equal about2.5 million vehicles, a market volume large enough to allow for fuel cell cost reductions throughtechnology learning.
Wheelchairs and carts
Electric wheelchairs for handicapped persons and electric carts for aged-persons could be an importantmarket niche. Comfort and practicality is more important than cost. For example, they are paid forby long-term care insurance in Japan. In Japan, 7 000 electric wheelchairs and 29 000 electric cartswere sold in fiscal year 2004. The demand for electric carts for aged-persons is projected to increaserapidly. Worldwide demand is about ten times higher than in Japan.
Both electric wheelchairs and electric carts generally use 12V lead-acid batteries connected in seriesas a power source. The battery is available for about USD 500. In the case of electric wheelchairs,a 200 W output suffices for driving on flat paths, but about 1 to 1.5 kW output is necessary fordriving up a slope. Kurimoto Ltd. of Japan has developed electric wheelchairs and electric cartsequipped with a 250 W PEMFC and hybrid system operating on a rechargeable battery. Fuel cellwheelchairs offer the potential advantage of about twice the driving distance over existing batterysystems. They also offer the advantage of being able to be driven immediately after refuellingwithout worrying about the charging time, which is substantial for the existing batteries. Costreductions for the fuel cell systems and development of an appropriate refuelling infrastructure forthese vehicles pose important challenges.
Forklifts
Global sales of electric forklifts amount to 300 000 units per year (FCell Canada, 2004). In southernCalifornia, in the peak period of the late afternoon, almost 2% of total power capacity is used forelectric forklifts, golf carts, etc. (Cromie, 2004). Global sales of around 300 000 units per year equal100 000-150 000 car equivalents per year. An electric forklift working three shifts a day typicallycomes with three lead-acid batteries - one that’s in use, one that’s charging and one that’s cooling.Battery removal and charging is a time-consuming process that affects productivity and costs. Inaddition, machines become sluggish as the battery charge declines. A 65 kW battery pack for aclass 1 forklift costs about USD 4 000 or about USD 60/kW. With an additional cost of aboutUSD 3 000, a fuel cell system would offer higher productivity and no re-charging needs. For intenselyused forklits, the break-even fuel cell cost would be in the order of USD 100/kW. However, thiscould be a relatively small part of the market, as most forklifts are not operated intensely andovernight charging is usually sufficient with no substantial drawbacks.
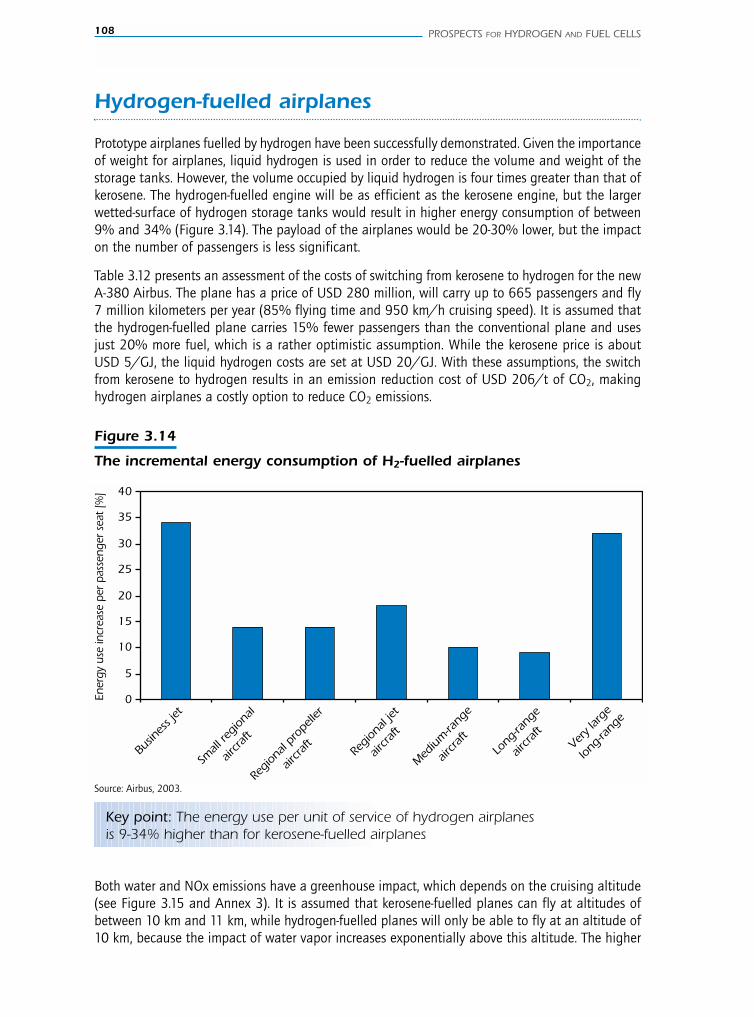
108 PROSPECTS FOR HYDROGEN AND FUEL CELLS
Both water and NOx emissions have a greenhouse impact, which depends on the cruising altitude(see Figure 3.15 and Annex 3). It is assumed that kerosene-fuelled planes can fly at altitudes ofbetween 10 km and 11 km, while hydrogen-fuelled planes will only be able to fly at an altitude of10 km, because the impact of water vapor increases exponentially above this altitude. The higher
Hydrogen-fuelled airplanes
Prototype airplanes fuelled by hydrogen have been successfully demonstrated. Given the importanceof weight for airplanes, liquid hydrogen is used in order to reduce the volume and weight of thestorage tanks. However, the volume occupied by liquid hydrogen is four times greater than that ofkerosene. The hydrogen-fuelled engine will be as efficient as the kerosene engine, but the largerwetted-surface of hydrogen storage tanks would result in higher energy consumption of between9% and 34% (Figure 3.14). The payload of the airplanes would be 20-30% lower, but the impacton the number of passengers is less significant.
Table 3.12 presents an assessment of the costs of switching from kerosene to hydrogen for the newA-380 Airbus. The plane has a price of USD 280 million, will carry up to 665 passengers and fly7 million kilometers per year (85% flying time and 950 km/h cruising speed). It is assumed thatthe hydrogen-fuelled plane carries 15% fewer passengers than the conventional plane and usesjust 20% more fuel, which is a rather optimistic assumption. While the kerosene price is aboutUSD 5/GJ, the liquid hydrogen costs are set at USD 20/GJ. With these assumptions, the switchfrom kerosene to hydrogen results in an emission reduction cost of USD 206/t of CO2, makinghydrogen airplanes a costly option to reduce CO2 emissions.
Figure 3.14
The incremental energy consumption of H2-fuelled airplanes
0
5
10
15
20
25
30
35
40
Busin
ess j
et
Small
regi
onal
aircraft
Regi
onal
prop
eller
aircraft
Regi
onal
jet
aircraft
Med
ium
-rang
e
aircraft
Long
-rang
e
aircraft
Very l
arge
long
-rang
e
Ener
gy u
se in
crea
se p
er p
asse
nger
sea
t [%
]
Key point: The energy use per unit of service of hydrogen airplanesis 9-34% higher than for kerosene-fuelled airplanes
Source: Airbus, 2003.

3. FUEL CELLS AND OTHER HYDROGEN END-USE TECHNOLOGIES 109
Table 3.12
Cost assessment for a very large hydrogen-fuelled airplane
Assumptions/notes Unit Cost
Kerosene plane Investment cost per seat USD 280 m per plane, 665 seats (USD 1000/seat) 420
Cost per seat occupied 75% load factor (USD 1000/seat) 560
Investment cost per passenger.km (USD/1000 pkm) 80
Kerosene per occupied seat per year 75% load factor, 1.6 MJ/passenger.km,950 km/h cruising speed (GJ/seat/yr) 10 000
Fuel + capital per seat occupied 12% annuity of cost per seat (USD/seat) 50 000and USD 5/GJ kerosene
CO2 emissions for kerosene 0.073 t of CO2/GJ kerosene (t/used seat/yr) 730
Hydrogen plane Cost per seat occupied 75% load factor, (USD 1000/seat) 690
but 15% fewer passengers
Investment cost per passenger.km (USD/1000 pkm) 99
Fuel + capital per seat occupied 12% annuity, 20% increasein fuel use per seat and
USD 20/GJ liq. hydrogen (USD/seat) 200 000
CO2 emission mitigation cost H2O and NOx not considered (USD/t of CO2) 206
Source: Lee et al., 2001.
Figure 3.15
Comparison of the fuel use and greenhouse emissions of kerosene and H2 airplanes
0
20
40
60
80
100
120
140
160
0 2 4 6 8 10 12 14
Cruising altitude [km]
Perf
orm
ance
ind
ex [
-]
Kerosene GWP effect
Cryoplane GWP effect
Kerosene Fuel use
Cryoplane Fuel use
Key point: A hydrogen airplane has lower emissions at all flight altitudes
Source: Svensson et al., 2004.Note: GWP = global warming potential in terms of CO2.
the airplane flies, the lower the air resistance and hence fuel consumption. Flying at 11 km requires15% less fuel than flying at an altitude of 10 km (Figure 3.15). The option of flying hydrogen-fuelledairplanes, so-called cryoplanes, at 9 km or lower has not been considered, it increases fuel consumptiondespite some non-CO2 benefits.
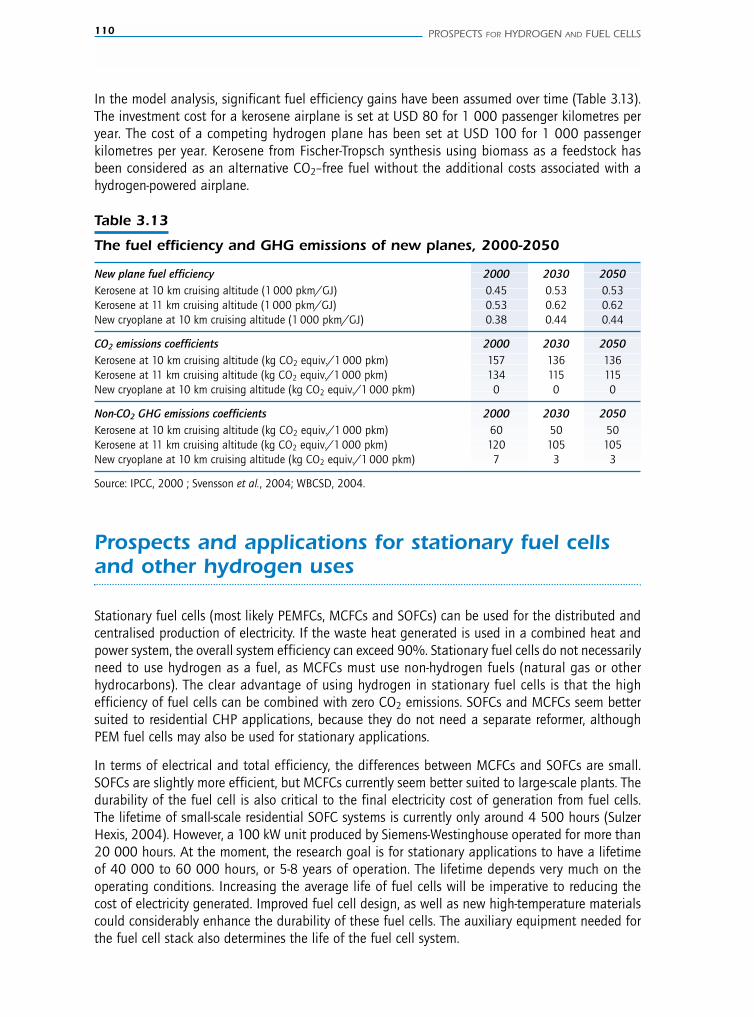
110 PROSPECTS FOR HYDROGEN AND FUEL CELLS
In the model analysis, significant fuel efficiency gains have been assumed over time (Table 3.13).The investment cost for a kerosene airplane is set at USD 80 for 1 000 passenger kilometres peryear. The cost of a competing hydrogen plane has been set at USD 100 for 1 000 passengerkilometres per year. Kerosene from Fischer-Tropsch synthesis using biomass as a feedstock hasbeen considered as an alternative CO2–free fuel without the additional costs associated with ahydrogen-powered airplane.
Table 3.13
The fuel efficiency and GHG emissions of new planes, 2000-2050
New plane fuel efficiency 2000 2030 2050Kerosene at 10 km cruising altitude (1 000 pkm/GJ) 0.45 0.53 0.53Kerosene at 11 km cruising altitude (1 000 pkm/GJ) 0.53 0.62 0.62New cryoplane at 10 km cruising altitude (1 000 pkm/GJ) 0.38 0.44 0.44
CO2 emissions coefficients 2000 2030 2050Kerosene at 10 km cruising altitude (kg CO2 equiv./1 000 pkm) 157 136 136Kerosene at 11 km cruising altitude (kg CO2 equiv./1 000 pkm) 134 115 115New cryoplane at 10 km cruising altitude (kg CO2 equiv./1 000 pkm) 0 0 0
Non-CO2 GHG emissions coefficients 2000 2030 2050Kerosene at 10 km cruising altitude (kg CO2 equiv./1 000 pkm) 60 50 50Kerosene at 11 km cruising altitude (kg CO2 equiv./1 000 pkm) 120 105 105New cryoplane at 10 km cruising altitude (kg CO2 equiv./1 000 pkm) 7 3 3
Source: IPCC, 2000 ; Svensson et al., 2004; WBCSD, 2004.
Prospects and applications for stationary fuel cellsand other hydrogen uses
Stationary fuel cells (most likely PEMFCs, MCFCs and SOFCs) can be used for the distributed andcentralised production of electricity. If the waste heat generated is used in a combined heat andpower system, the overall system efficiency can exceed 90%. Stationary fuel cells do not necessarilyneed to use hydrogen as a fuel, as MCFCs must use non-hydrogen fuels (natural gas or otherhydrocarbons). The clear advantage of using hydrogen in stationary fuel cells is that the highefficiency of fuel cells can be combined with zero CO2 emissions. SOFCs and MCFCs seem bettersuited to residential CHP applications, because they do not need a separate reformer, althoughPEM fuel cells may also be used for stationary applications.
In terms of electrical and total efficiency, the differences between MCFCs and SOFCs are small.SOFCs are slightly more efficient, but MCFCs currently seem better suited to large-scale plants. Thedurability of the fuel cell is also critical to the final electricity cost of generation from fuel cells.The lifetime of small-scale residential SOFC systems is currently only around 4 500 hours (SulzerHexis, 2004). However, a 100 kW unit produced by Siemens-Westinghouse operated for more than20 000 hours. At the moment, the research goal is for stationary applications to have a lifetimeof 40 000 to 60 000 hours, or 5-8 years of operation. The lifetime depends very much on theoperating conditions. Increasing the average life of fuel cells will be imperative to reducing thecost of electricity generated. Improved fuel cell design, as well as new high-temperature materialscould considerably enhance the durability of these fuel cells. The auxiliary equipment needed forthe fuel cell stack also determines the life of the fuel cell system.
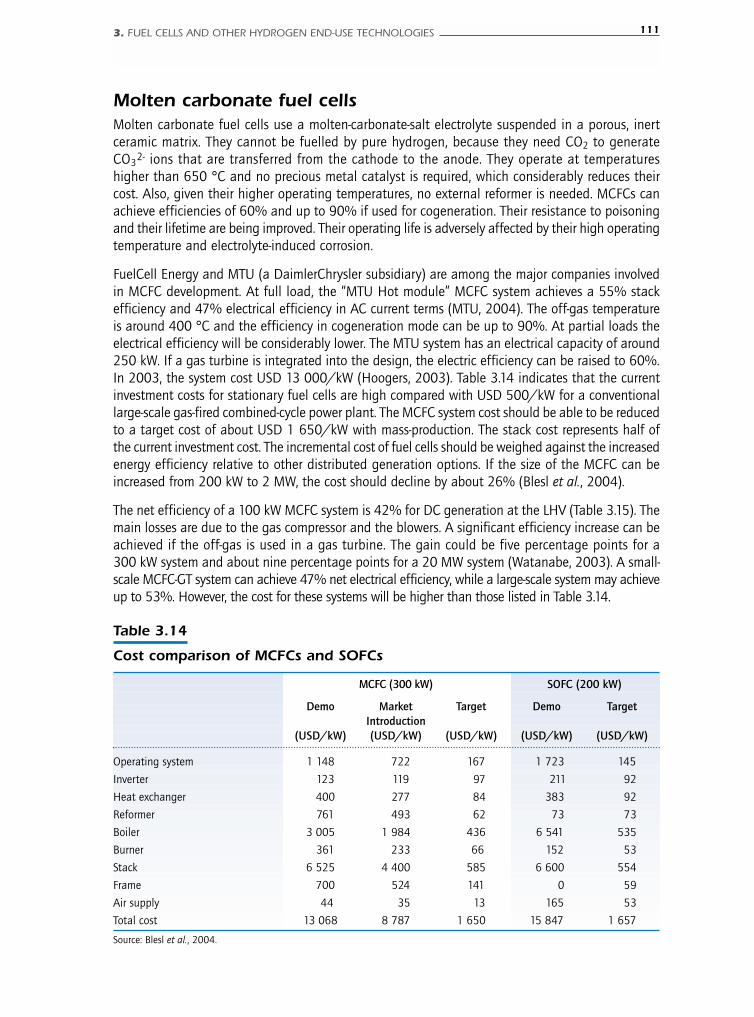
3. FUEL CELLS AND OTHER HYDROGEN END-USE TECHNOLOGIES 111
Molten carbonate fuel cellsMolten carbonate fuel cells use a molten-carbonate-salt electrolyte suspended in a porous, inertceramic matrix. They cannot be fuelled by pure hydrogen, because they need CO2 to generateCO3
2- ions that are transferred from the cathode to the anode. They operate at temperatureshigher than 650 °C and no precious metal catalyst is required, which considerably reduces theircost. Also, given their higher operating temperatures, no external reformer is needed. MCFCs canachieve efficiencies of 60% and up to 90% if used for cogeneration. Their resistance to poisoningand their lifetime are being improved. Their operating life is adversely affected by their high operatingtemperature and electrolyte-induced corrosion.
FuelCell Energy and MTU (a DaimlerChrysler subsidiary) are among the major companies involvedin MCFC development. At full load, the “MTU Hot module” MCFC system achieves a 55% stackefficiency and 47% electrical efficiency in AC current terms (MTU, 2004). The off-gas temperatureis around 400 °C and the efficiency in cogeneration mode can be up to 90%. At partial loads theelectrical efficiency will be considerably lower. The MTU system has an electrical capacity of around250 kW. If a gas turbine is integrated into the design, the electric efficiency can be raised to 60%.In 2003, the system cost USD 13 000/kW (Hoogers, 2003). Table 3.14 indicates that the currentinvestment costs for stationary fuel cells are high compared with USD 500/kW for a conventionallarge-scale gas-fired combined-cycle power plant. The MCFC system cost should be able to be reducedto a target cost of about USD 1 650/kW with mass-production. The stack cost represents half ofthe current investment cost. The incremental cost of fuel cells should be weighed against the increasedenergy efficiency relative to other distributed generation options. If the size of the MCFC can beincreased from 200 kW to 2 MW, the cost should decline by about 26% (Blesl et al., 2004).
The net efficiency of a 100 kW MCFC system is 42% for DC generation at the LHV (Table 3.15). Themain losses are due to the gas compressor and the blowers. A significant efficiency increase can beachieved if the off-gas is used in a gas turbine. The gain could be five percentage points for a300 kW system and about nine percentage points for a 20 MW system (Watanabe, 2003). A small-scale MCFC-GT system can achieve 47% net electrical efficiency, while a large-scale system may achieveup to 53%. However, the cost for these systems will be higher than those listed in Table 3.14.
Table 3.14
Cost comparison of MCFCs and SOFCs
MCFC (300 kW) SOFC (200 kW)
Demo Market Target Demo TargetIntroduction
(USD/kW) (USD/kW) (USD/kW) (USD/kW) (USD/kW)
Operating system 1 148 722 167 1 723 145
Inverter 123 119 97 211 92
Heat exchanger 400 277 84 383 92
Reformer 761 493 62 73 73
Boiler 3 005 1 984 436 6 541 535
Burner 361 233 66 152 53
Stack 6 525 4 400 585 6 600 554
Frame 700 524 141 0 59
Air supply 44 35 13 165 53
Total cost 13 068 8 787 1 650 15 847 1 657
Source: Blesl et al., 2004.
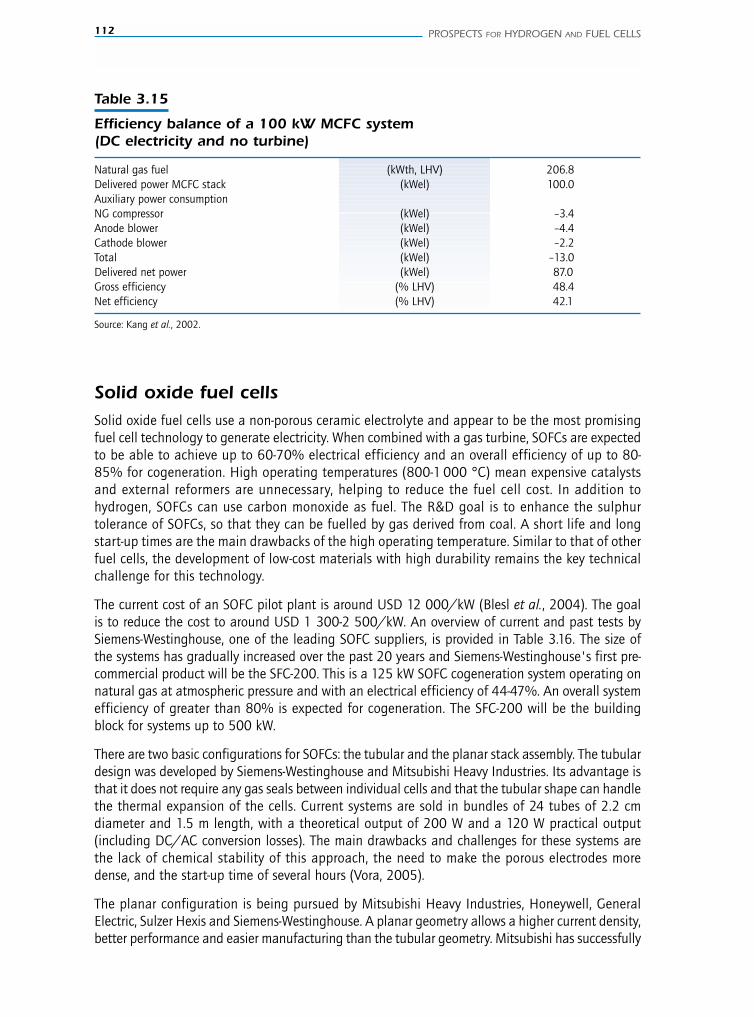
112 PROSPECTS FOR HYDROGEN AND FUEL CELLS
Solid oxide fuel cellsSolid oxide fuel cells use a non-porous ceramic electrolyte and appear to be the most promisingfuel cell technology to generate electricity. When combined with a gas turbine, SOFCs are expectedto be able to achieve up to 60-70% electrical efficiency and an overall efficiency of up to 80-85% for cogeneration. High operating temperatures (800-1 000 °C) mean expensive catalystsand external reformers are unnecessary, helping to reduce the fuel cell cost. In addition tohydrogen, SOFCs can use carbon monoxide as fuel. The R&D goal is to enhance the sulphurtolerance of SOFCs, so that they can be fuelled by gas derived from coal. A short life and longstart-up times are the main drawbacks of the high operating temperature. Similar to that of otherfuel cells, the development of low-cost materials with high durability remains the key technicalchallenge for this technology.
The current cost of an SOFC pilot plant is around USD 12 000/kW (Blesl et al., 2004). The goalis to reduce the cost to around USD 1 300-2 500/kW. An overview of current and past tests bySiemens-Westinghouse, one of the leading SOFC suppliers, is provided in Table 3.16. The size ofthe systems has gradually increased over the past 20 years and Siemens-Westinghouse's first pre-commercial product will be the SFC-200. This is a 125 kW SOFC cogeneration system operating onnatural gas at atmospheric pressure and with an electrical efficiency of 44-47%. An overall systemefficiency of greater than 80% is expected for cogeneration. The SFC-200 will be the buildingblock for systems up to 500 kW.
There are two basic configurations for SOFCs: the tubular and the planar stack assembly. The tubulardesign was developed by Siemens-Westinghouse and Mitsubishi Heavy Industries. Its advantage isthat it does not require any gas seals between individual cells and that the tubular shape can handlethe thermal expansion of the cells. Current systems are sold in bundles of 24 tubes of 2.2 cmdiameter and 1.5 m length, with a theoretical output of 200 W and a 120 W practical output(including DC/AC conversion losses). The main drawbacks and challenges for these systems arethe lack of chemical stability of this approach, the need to make the porous electrodes moredense, and the start-up time of several hours (Vora, 2005).
The planar configuration is being pursued by Mitsubishi Heavy Industries, Honeywell, GeneralElectric, Sulzer Hexis and Siemens-Westinghouse. A planar geometry allows a higher current density,better performance and easier manufacturing than the tubular geometry. Mitsubishi has successfully
Table 3.15
Efficiency balance of a 100 kW MCFC system(DC electricity and no turbine)
Natural gas fuel (kWth, LHV) 206.8Delivered power MCFC stack (kWel) 100.0Auxiliary power consumptionNG compressor (kWel) –3.4Anode blower (kWel) –4.4Cathode blower (kWel) –2.2Total (kWel) –13.0Delivered net power (kWel) 87.0Gross efficiency (% LHV) 48.4Net efficiency (% LHV) 42.1
Source: Kang et al., 2002.
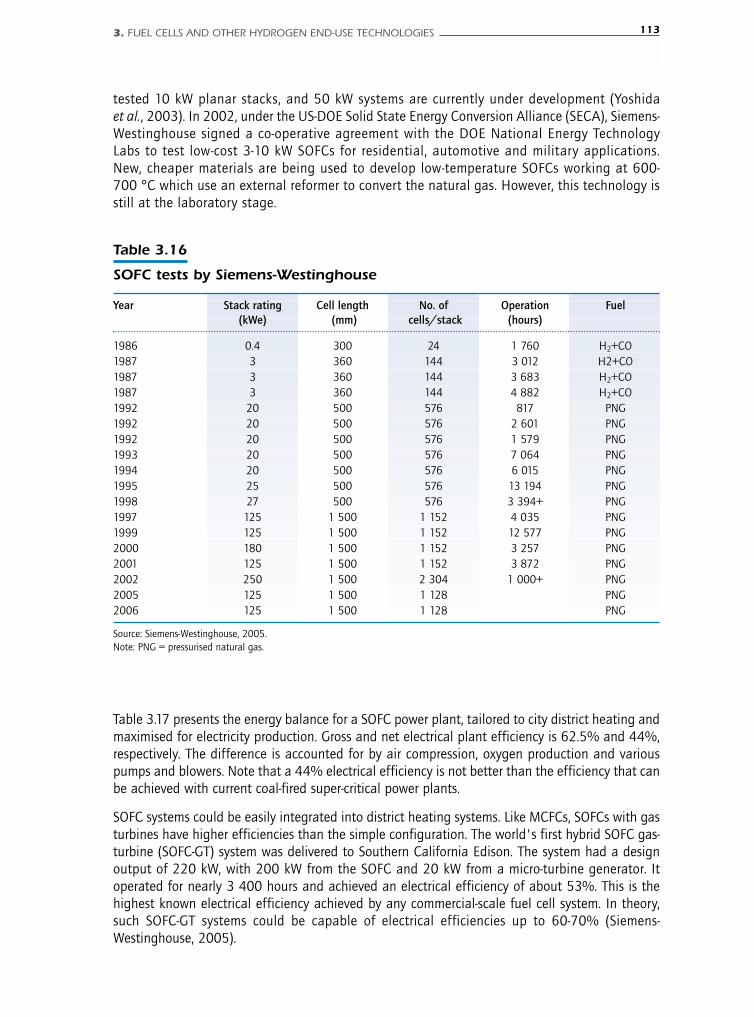
3. FUEL CELLS AND OTHER HYDROGEN END-USE TECHNOLOGIES 113
tested 10 kW planar stacks, and 50 kW systems are currently under development (Yoshidaet al., 2003). In 2002, under the US-DOE Solid State Energy Conversion Alliance (SECA), Siemens-Westinghouse signed a co-operative agreement with the DOE National Energy TechnologyLabs to test low-cost 3-10 kW SOFCs for residential, automotive and military applications.New, cheaper materials are being used to develop low-temperature SOFCs working at 600-700 °C which use an external reformer to convert the natural gas. However, this technology isstill at the laboratory stage.
Table 3.16
SOFC tests by Siemens-Westinghouse
Year Stack rating Cell length No. of Operation Fuel(kWe) (mm) cells/stack (hours)
1986 0.4 300 24 1 760 H2+CO1987 3 360 144 3 012 H2+CO1987 3 360 144 3 683 H2+CO1987 3 360 144 4 882 H2+CO1992 20 500 576 817 PNG1992 20 500 576 2 601 PNG1992 20 500 576 1 579 PNG1993 20 500 576 7 064 PNG1994 20 500 576 6 015 PNG1995 25 500 576 13 194 PNG1998 27 500 576 3 394+ PNG1997 125 1 500 1 152 4 035 PNG1999 125 1 500 1 152 12 577 PNG2000 180 1 500 1 152 3 257 PNG2001 125 1 500 1 152 3 872 PNG2002 250 1 500 2 304 1 000+ PNG2005 125 1 500 1 128 PNG2006 125 1 500 1 128 PNG
Source: Siemens-Westinghouse, 2005.Note: PNG = pressurised natural gas.
Table 3.17 presents the energy balance for a SOFC power plant, tailored to city district heating andmaximised for electricity production. Gross and net electrical plant efficiency is 62.5% and 44%,respectively. The difference is accounted for by air compression, oxygen production and variouspumps and blowers. Note that a 44% electrical efficiency is not better than the efficiency that canbe achieved with current coal-fired super-critical power plants.
SOFC systems could be easily integrated into district heating systems. Like MCFCs, SOFCs with gasturbines have higher efficiencies than the simple configuration. The world's first hybrid SOFC gas-turbine (SOFC-GT) system was delivered to Southern California Edison. The system had a designoutput of 220 kW, with 200 kW from the SOFC and 20 kW from a micro-turbine generator. Itoperated for nearly 3 400 hours and achieved an electrical efficiency of about 53%. This is thehighest known electrical efficiency achieved by any commercial-scale fuel cell system. In theory,such SOFC-GT systems could be capable of electrical efficiencies up to 60-70% (Siemens-Westinghouse, 2005).
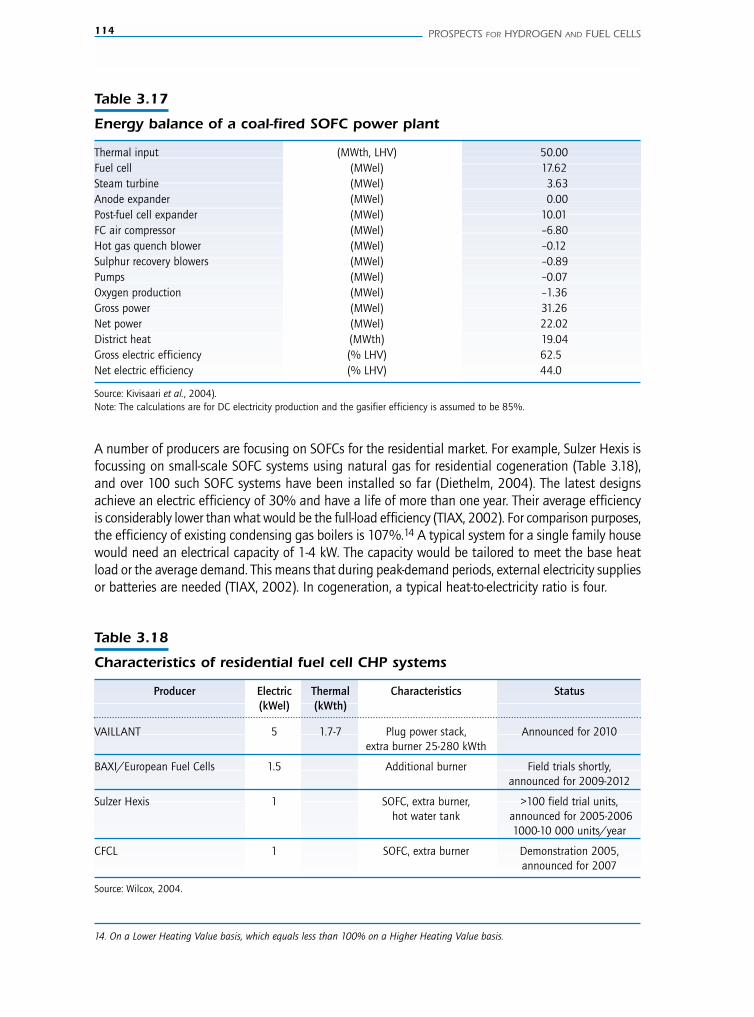
114 PROSPECTS FOR HYDROGEN AND FUEL CELLS
A number of producers are focusing on SOFCs for the residential market. For example, Sulzer Hexis isfocussing on small-scale SOFC systems using natural gas for residential cogeneration (Table 3.18),and over 100 such SOFC systems have been installed so far (Diethelm, 2004). The latest designsachieve an electric efficiency of 30% and have a life of more than one year. Their average efficiencyis considerably lower than what would be the full-load efficiency (TIAX, 2002). For comparison purposes,the efficiency of existing condensing gas boilers is 107%.14 A typical system for a single family housewould need an electrical capacity of 1-4 kW. The capacity would be tailored to meet the base heatload or the average demand. This means that during peak-demand periods, external electricity suppliesor batteries are needed (TIAX, 2002). In cogeneration, a typical heat-to-electricity ratio is four.
Table 3.17
Energy balance of a coal-fired SOFC power plant
Thermal input (MWth, LHV) 50.00Fuel cell (MWel) 17.62Steam turbine (MWel) 3.63Anode expander (MWel) 0.00Post-fuel cell expander (MWel) 10.01FC air compressor (MWel) –6.80Hot gas quench blower (MWel) –0.12Sulphur recovery blowers (MWel) –0.89Pumps (MWel) –0.07Oxygen production (MWel) –1.36Gross power (MWel) 31.26Net power (MWel) 22.02District heat (MWth) 19.04Gross electric efficiency (% LHV) 62.5Net electric efficiency (% LHV) 44.0
Source: Kivisaari et al., 2004).Note: The calculations are for DC electricity production and the gasifier efficiency is assumed to be 85%.
14. On a Lower Heating Value basis, which equals less than 100% on a Higher Heating Value basis.
Table 3.18
Characteristics of residential fuel cell CHP systems
Producer Electric Thermal Characteristics Status(kWel) (kWth)
VAILLANT 5 1.7-7 Plug power stack, Announced for 2010extra burner 25-280 kWth
BAXI/European Fuel Cells 1.5 Additional burner Field trials shortly,announced for 2009-2012
Sulzer Hexis 1 SOFC, extra burner, >100 field trial units,hot water tank announced for 2005-2006
1000-10 000 units/year
CFCL 1 SOFC, extra burner Demonstration 2005,announced for 2007
Source: Wilcox, 2004.
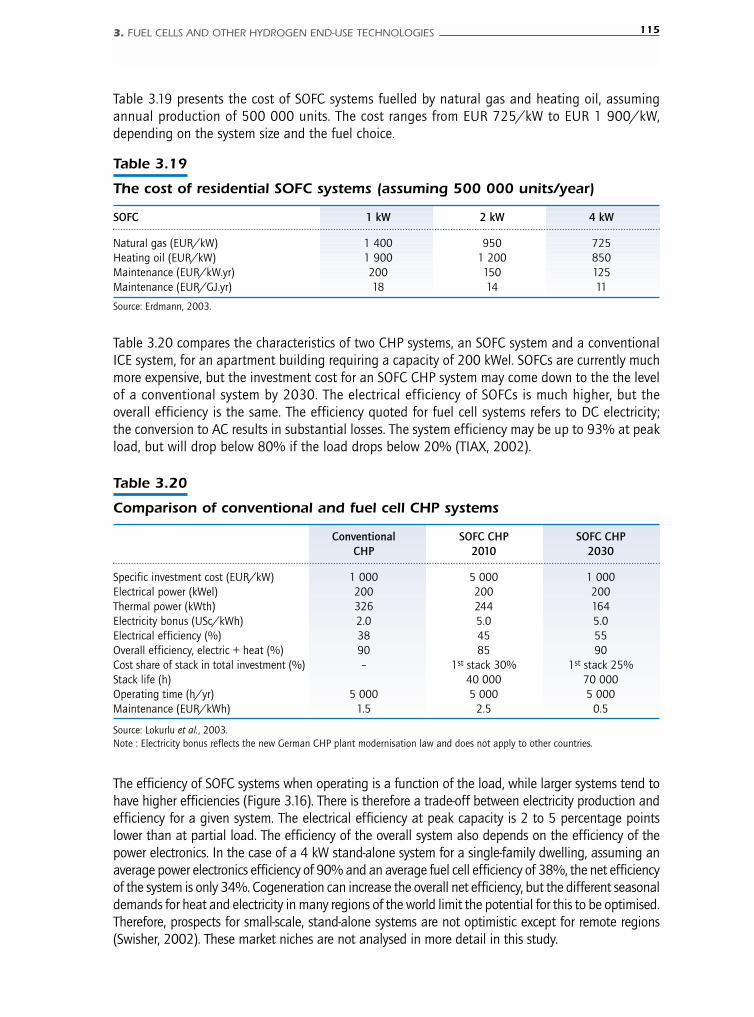
3. FUEL CELLS AND OTHER HYDROGEN END-USE TECHNOLOGIES 115
Table 3.19 presents the cost of SOFC systems fuelled by natural gas and heating oil, assumingannual production of 500 000 units. The cost ranges from EUR 725/kW to EUR 1 900/kW,depending on the system size and the fuel choice.
Table 3.19
The cost of residential SOFC systems (assuming 500 000 units/year)
SOFC 1 kW 2 kW 4 kW
Natural gas (EUR/kW) 1 400 950 725Heating oil (EUR/kW) 1 900 1 200 850Maintenance (EUR/kW.yr) 200 150 125Maintenance (EUR/GJ.yr) 18 14 11
Source: Erdmann, 2003.
Table 3.20 compares the characteristics of two CHP systems, an SOFC system and a conventionalICE system, for an apartment building requiring a capacity of 200 kWel. SOFCs are currently muchmore expensive, but the investment cost for an SOFC CHP system may come down to the the levelof a conventional system by 2030. The electrical efficiency of SOFCs is much higher, but theoverall efficiency is the same. The efficiency quoted for fuel cell systems refers to DC electricity;the conversion to AC results in substantial losses. The system efficiency may be up to 93% at peakload, but will drop below 80% if the load drops below 20% (TIAX, 2002).
Table 3.20
Comparison of conventional and fuel cell CHP systems
Conventional SOFC CHP SOFC CHPCHP 2010 2030
Specific investment cost (EUR/kW) 1 000 5 000 1 000Electrical power (kWel) 200 200 200Thermal power (kWth) 326 244 164Electricity bonus (USc/kWh) 2.0 5.0 5.0Electrical efficiency (%) 38 45 55Overall efficiency, electric + heat (%) 90 85 90Cost share of stack in total investment (%) – 1st stack 30% 1st stack 25%Stack life (h) 40 000 70 000Operating time (h/yr) 5 000 5 000 5 000Maintenance (EUR/kWh) 1.5 2.5 0.5
Source: Lokurlu et al., 2003.Note : Electricity bonus reflects the new German CHP plant modernisation law and does not apply to other countries.
The efficiency of SOFC systems when operating is a function of the load, while larger systems tend tohave higher efficiencies (Figure 3.16). There is therefore a trade-off between electricity production andefficiency for a given system. The electrical efficiency at peak capacity is 2 to 5 percentage pointslower than at partial load. The efficiency of the overall system also depends on the efficiency of thepower electronics. In the case of a 4 kW stand-alone system for a single-family dwelling, assuming anaverage power electronics efficiency of 90% and an average fuel cell efficiency of 38%, the net efficiencyof the system is only 34%. Cogeneration can increase the overall net efficiency, but the different seasonaldemands for heat and electricity in many regions of the world limit the potential for this to be optimised.Therefore, prospects for small-scale, stand-alone systems are not optimistic except for remote regions(Swisher, 2002). These market niches are not analysed in more detail in this study.
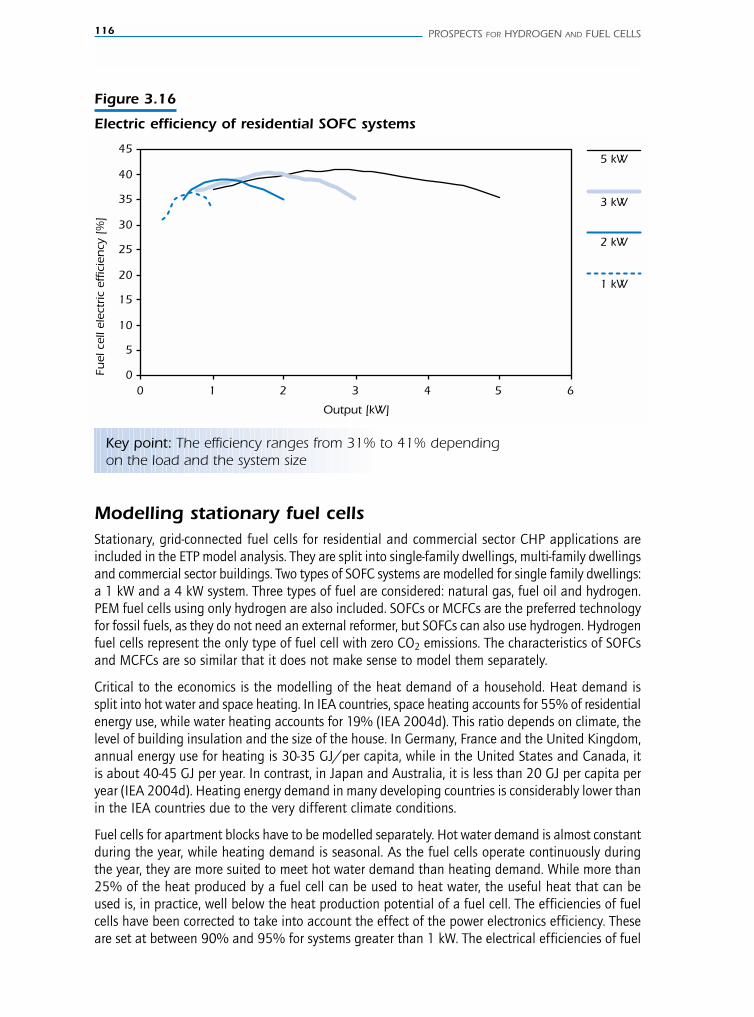
116 PROSPECTS FOR HYDROGEN AND FUEL CELLS
Figure 3.16
Electric efficiency of residential SOFC systems
5 kW
3 kW
2 kW
1 kW
0
5
10
15
20
25
30
35
40
45
0 1 2 3 4 5 6
Output [kW]
Fuel
cel
l ele
ctric
effic
ien
cy [
%]
Key point: The efficiency ranges from 31% to 41% dependingon the load and the system size
Modelling stationary fuel cells Stationary, grid-connected fuel cells for residential and commercial sector CHP applications areincluded in the ETP model analysis. They are split into single-family dwellings, multi-family dwellingsand commercial sector buildings. Two types of SOFC systems are modelled for single family dwellings:a 1 kW and a 4 kW system. Three types of fuel are considered: natural gas, fuel oil and hydrogen.PEM fuel cells using only hydrogen are also included. SOFCs or MCFCs are the preferred technologyfor fossil fuels, as they do not need an external reformer, but SOFCs can also use hydrogen. Hydrogenfuel cells represent the only type of fuel cell with zero CO2 emissions. The characteristics of SOFCsand MCFCs are so similar that it does not make sense to model them separately.
Critical to the economics is the modelling of the heat demand of a household. Heat demand issplit into hot water and space heating. In IEA countries, space heating accounts for 55% of residentialenergy use, while water heating accounts for 19% (IEA 2004d). This ratio depends on climate, thelevel of building insulation and the size of the house. In Germany, France and the United Kingdom,annual energy use for heating is 30-35 GJ/per capita, while in the United States and Canada, itis about 40-45 GJ per year. In contrast, in Japan and Australia, it is less than 20 GJ per capita peryear (IEA 2004d). Heating energy demand in many developing countries is considerably lower thanin the IEA countries due to the very different climate conditions.
Fuel cells for apartment blocks have to be modelled separately. Hot water demand is almost constantduring the year, while heating demand is seasonal. As the fuel cells operate continuously duringthe year, they are more suited to meet hot water demand than heating demand. While more than25% of the heat produced by a fuel cell can be used to heat water, the useful heat that can beused is, in practice, well below the heat production potential of a fuel cell. The efficiencies of fuelcells have been corrected to take into account the effect of the power electronics efficiency. Theseare set at between 90% and 95% for systems greater than 1 kW. The electrical efficiencies of fuel
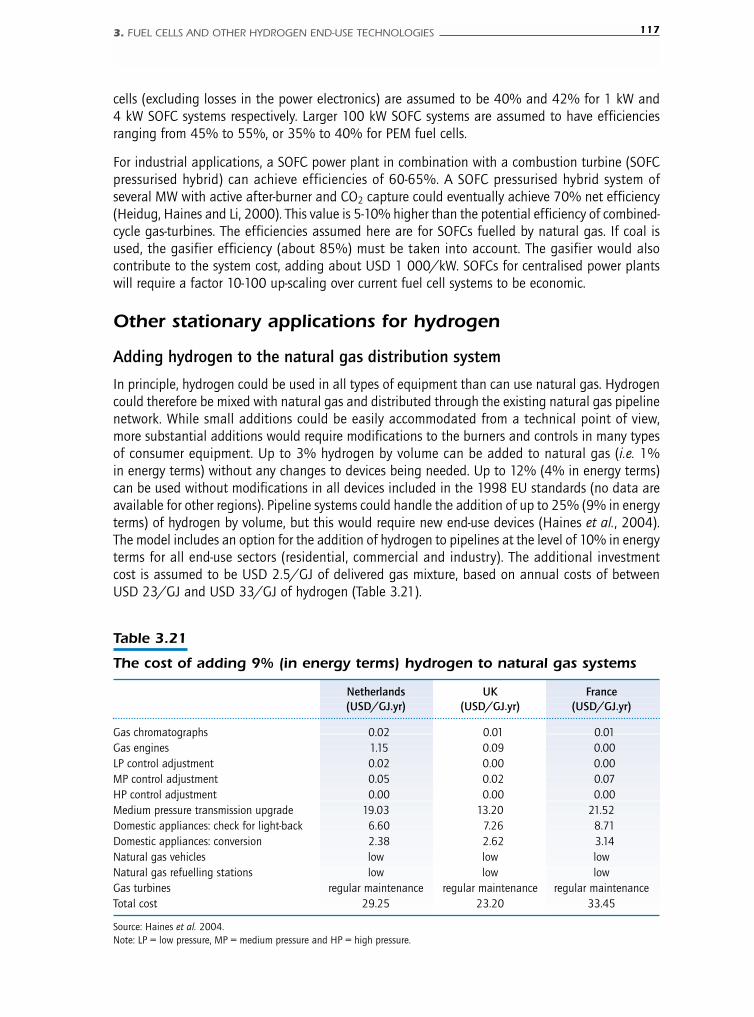
3. FUEL CELLS AND OTHER HYDROGEN END-USE TECHNOLOGIES 117
cells (excluding losses in the power electronics) are assumed to be 40% and 42% for 1 kW and4 kW SOFC systems respectively. Larger 100 kW SOFC systems are assumed to have efficienciesranging from 45% to 55%, or 35% to 40% for PEM fuel cells.
For industrial applications, a SOFC power plant in combination with a combustion turbine (SOFCpressurised hybrid) can achieve efficiencies of 60-65%. A SOFC pressurised hybrid system ofseveral MW with active after-burner and CO2 capture could eventually achieve 70% net efficiency(Heidug, Haines and Li, 2000). This value is 5-10% higher than the potential efficiency of combined-cycle gas-turbines. The efficiencies assumed here are for SOFCs fuelled by natural gas. If coal isused, the gasifier efficiency (about 85%) must be taken into account. The gasifier would alsocontribute to the system cost, adding about USD 1 000/kW. SOFCs for centralised power plantswill require a factor 10-100 up-scaling over current fuel cell systems to be economic.
Other stationary applications for hydrogen
Adding hydrogen to the natural gas distribution system
In principle, hydrogen could be used in all types of equipment than can use natural gas. Hydrogencould therefore be mixed with natural gas and distributed through the existing natural gas pipelinenetwork. While small additions could be easily accommodated from a technical point of view,more substantial additions would require modifications to the burners and controls in many typesof consumer equipment. Up to 3% hydrogen by volume can be added to natural gas (i.e. 1%in energy terms) without any changes to devices being needed. Up to 12% (4% in energy terms)can be used without modifications in all devices included in the 1998 EU standards (no data areavailable for other regions). Pipeline systems could handle the addition of up to 25% (9% in energyterms) of hydrogen by volume, but this would require new end-use devices (Haines et al., 2004).The model includes an option for the addition of hydrogen to pipelines at the level of 10% in energyterms for all end-use sectors (residential, commercial and industry). The additional investmentcost is assumed to be USD 2.5/GJ of delivered gas mixture, based on annual costs of betweenUSD 23/GJ and USD 33/GJ of hydrogen (Table 3.21).
Table 3.21
The cost of adding 9% (in energy terms) hydrogen to natural gas systems
Netherlands UK France(USD/GJ.yr) (USD/GJ.yr) (USD/GJ.yr)
Gas chromatographs 0.02 0.01 0.01Gas engines 1.15 0.09 0.00LP control adjustment 0.02 0.00 0.00MP control adjustment 0.05 0.02 0.07HP control adjustment 0.00 0.00 0.00Medium pressure transmission upgrade 19.03 13.20 21.52Domestic appliances: check for light-back 6.60 7.26 8.71Domestic appliances: conversion 2.38 2.62 3.14Natural gas vehicles low low lowNatural gas refuelling stations low low lowGas turbines regular maintenance regular maintenance regular maintenanceTotal cost 29.25 23.20 33.45
Source: Haines et al. 2004.Note: LP = low pressure, MP = medium pressure and HP = high pressure.
118 PROSPECTS FOR HYDROGEN AND FUEL CELLS
A special problem is that variations in the consumption of gas over the year would lead to variationsin the composition of the gas mixture if the supply of hydrogen is constant over the year, a likelypre-condition for the economic production of hydrogen. Alternatively, either the load factor for thehydrogen supply systems would need to be lower, raising the cost of the hydrogen, or hydrogengas storage would be needed. For the time being, no large-scale seasonal hydrogen storage isaccounted for in the model. Therefore, the cost assumptions are optimistic. In any event, thisoption will only be selected in the case of ambitious CO2 policies, because the additional investmentcost of USD 25/GJ translates into an abatement cost of more than USD 50/t of CO2 avoided,provided the H2 supply is CO2-free and the price is similar to the natural gas price.
Hydrogen use in industry
Hydrogen can be used by all types of burners where natural gas is used, provided that properadjustments are made. Hydrogen could be used for steam generation in natural gas-fired boilersor combined heat and power units, but its main advantages are exploited when hydrogen is usedin fuel cells. Hydrogen fuel cells for industrial CHP applications and hydrogen-fuelled burners aretechnology options used in the ETP model. Also, hydrogen can be used for specific productionprocesses, such as the production of direct reduced iron (DRI). At the moment, natural gas is themain fuel for this type of process, but the combined use of electric arc furnaces and hydrogen inthe DRI process would eliminate the CO2 emissions from primary steel production. This option hasbeen considered in the ETP model.
Hydrogen use in the power generation sector
As discussed in Chapter 2, hydrogen is a key intermediate step in CO2 capture and storage if pre-combustion CO2 removal is to be undertaken at centralised fossil-fuel power plants. In theseplants, fuelled in general by coal, hydrogen is a by-product emerging from the de-carbonisationprocess. It is then burnt in a gas mixture to produce electricity. Such plants offer important advantagesand the economies of scale necessary for the large-scale production of hydrogen without emissions.They also offer significant flexibility for the combined production of hydrogen and electricity. Incontrast, distributed electricity production from hydrogen only makes sense if the hydrogen usedis produced from intermittent electricity production (i.e. the hydrogen is produced to be an energystorage medium), or if it is to avoid CO2 emissions from small-scale cogeneration units.
Another application is the use of PEMFC vehicles for distributed power generation. This option isdiscussed in the Annex 5. Although potential technology breakthroughs could make this optionattractive, the IEA analysis suggests that currently this option faces too many unresolved issues ofa critical nature. Therefore, it has not been considered in the model analysis. Having said this, aninteresting concept could result in significant synergies based on the development of PEMFC systemsfor both stationary and mobile applications, as well as PEM electrolysers. An annual production of0.5 million FCVs (a large-scale plant) would require the production of 80 GW of PEM fuel cells. Ifcurrent estimates for stationary fuel cells are extrapolated to 2030, 25 GW of stationary FCV capacitymight be feasible. In addition, if 1% of global refuelling stations are converted into hydrogenrefuelling stations each year (with a capacity of 300 cars/day, necessitating 2 MW of electrolyser),136 GW of refuelling capacity would be built per year. When these three markets are combined,a PEMFC producer who had products in all the three market segments (mobile and stationaryfuel cells, and electrolysers) could double or even triple annual production, with considerableadvantages in terms of economies of scale and cost reductions. Such strategies have not beenconsidered in the analysis.
4. COMPETING TECHNOLOGY OPTIONS 119
Chapter 4.COMPETING TECHNOLOGY OPTIONS
H I G H L I G H T S
■ Hydrogen and fuel cell technologies compete with many alternative fuels and technologyoptions that can be applied to meet energy-security and environmental goals.
■ In the transport sector, major competitors for hydrogen include biofuels, CNG, and Fischer-Tropsch (FT) synfuels from coal and gas. Biofuels and efficiency improvements in advancedICEs and hybrid vehicles are attractive, low-cost options for transport in the short andmedium term. Plug-in hybrids are attractive in the longer term. Hydrogen-fuelled hybridvehicles are competing options for fuel cell vehicles (FCVs). The deployment of hydrogenFCVs faces a chicken-or-egg problem – no investment in infrastructure without substantialdemand, but no significant demand without that infrastructure. Hydrogen hybrid vehiclesface similar issues as FCVs for hydrogen on-board storage and the chicken-or-egginfrastructure problem, but they do not require as extensive drive-system cost reductions.Other technologies and fuel options do not face similar introduction barriers.
■ For both stationary and mobile applications, competing options also are energy efficiencyand large-scale electrification based on coal with CO2 capture and storage, nuclear, oreven renewable energy sources. Large-scale electrification in conjunction with plug-inhybrid vehicles and Li-ion batteries could lead to reconsideration of the role of electricityin transport.
■ For stationary applications – either distributed electricity generation or cogeneration – thecompetition is also severe. Highly-efficient, centralised coal and gas fired power plantswith CO2 capture, emerging renewable technologies and new nuclear power plants couldbecome strong competitors for all technologies for distributed generation including fuelcells. At the same time, new technologies such as micro-turbines and Stirling engines arebeing introduced for distributed heat and power production. Enhanced building insulationand industrial energy efficiency measures may also limit future heat demand. On one handa reduced heat demand limits the potential for stationary fuel cells, but on the other hand,an increased power-to-heat demand ratio makes fuel cells more attractive compared toother CHP technologies.
■ Assessing the future of hydrogen and fuel cells without taking into account competing optionswould result in misleading conclusions. Development risks, uncertainty surrounding eachtechnology and the competing options must be taken into account in setting energy policiesand strategies. Picking “winners” at this stage is premature.
Taking into account competing technology options and fuels is essential to assessing the realpotential of hydrogen and fuel cells. Some competing technologies have already been described inChapters 2 and 3. In this chapter, further direct competitors are discussed in more detail alongwith some policy issues which may affect the success of some technologies.
120 PROSPECTS FOR HYDROGEN AND FUEL CELLS
Competing options in the transportation sector
BiofuelsBiofuels accounted for 0.8% of total transportation sector energy use (0.6 EJ) in 2003, thoughthis figure is likely to continue to grow in the future. World ethanol production is likely to reach46 bn litres in 2005, 80% of which (0.78 EJ) is for fuel use. Around 40% of ethanol productiontakes place in the US, 40% in Brazil and 7% in Europe (FO Lichts, 2005). The production of biodieselfrom rapeseed and other oil seed crops is smaller, at about 3 bn litres (0.1 EJ). Two-thirds of theworld biodiesel production takes place in Europe.
Biofuel production is based on sugar cane in Brazil and on corn in the US. However, technologicaladvances mean that the economic resource base is gradually widening to include cellulosic cropsand even wood. Being able to use such low-cost feedstocks will help to increase the global productionof ethanol. At present, various countries and regions are planning a rapid expansion of ethanoluse. Some scenarios suggest that a ten-fold increase (to the equivalent of 4 mbd of oil products)by 2020 could be feasible, based on sugar cane ethanol alone (IEA 2004e).
This does not include the possibility of converting biomass via Fischer-Tropsch processes into liquidfuels, primarily biodiesel. The yield per hectare for this type of biodiesel would be much higherthan for current oil seed crops. However, costs are higher than for FT synfuels from gas and coalbecause of the small plant size that is dictated by the dispersed nature of a biomass feedstock.Production costs amount to USD 90 /bbl (USD 19/GJ) for a biomass feedstock price of 3 USD/GJ,with the potential to decline to USD 70-80/bbl (14-16 USD/GJ) (Hamelinck et al., 2004). Thehigh cost of production means that there are currently no plans to initiate large-scale production.This option is being investigated in Europe due to the relatively high share of diesel cars which arenot able to use ethanol.
The long-term prospects of bioethanol, or any other biofuels such as methanol and biodiesel,depend on low-cost biomass availability. This availability depends on future food demand, foodpatterns, agricultural productivity and competition for land from other uses. Analysis that takesthese factors into account suggests a cost-effective potential for “new” primary biomass rangingfrom 50 to 100 EJ by 2050 with emission reduction incentives of USD 80/t of CO2 (Gielen et al.,2002, 2003). This study assumes a total of 200 EJ of primary biomass could be available, includingboth traditional and new biomass (see Annex 1 for details). This assumes the global convergenceof agricultural yields and free trade in agricultural products. Given that the biomass potentialdepends on uncertain agriculture productivity gains, the availability of biomass in sensitivityanalysis has been reduced to 100 EJ.
Plug-in hybrids and other electric vehiclesIn the 1990s there was a lot of interest in electric vehicles with batteries that were charged fromthe grid. These vehicles were not commercially successful, because they did not have sufficient rangeand the weight of the batteries was prohibitive. In theory, the efficiency of such vehicles can behigher than the efficiency of hydrogen FCVs (Figure 4.1). However, electricity storage remains akey obstacle in terms of driving range and storage cost.
The interest in electric vehicles has increased in recent times because of the emergence of hybridvehicles. If the batteries are charged from the grid only a limited range is achieved, but hybridvehicles charge their batteries using the on-board ICE. Plug-in hybrids represent a new concept wherebatteries can be loaded with electricity from the grid, or through on-board electricity generation
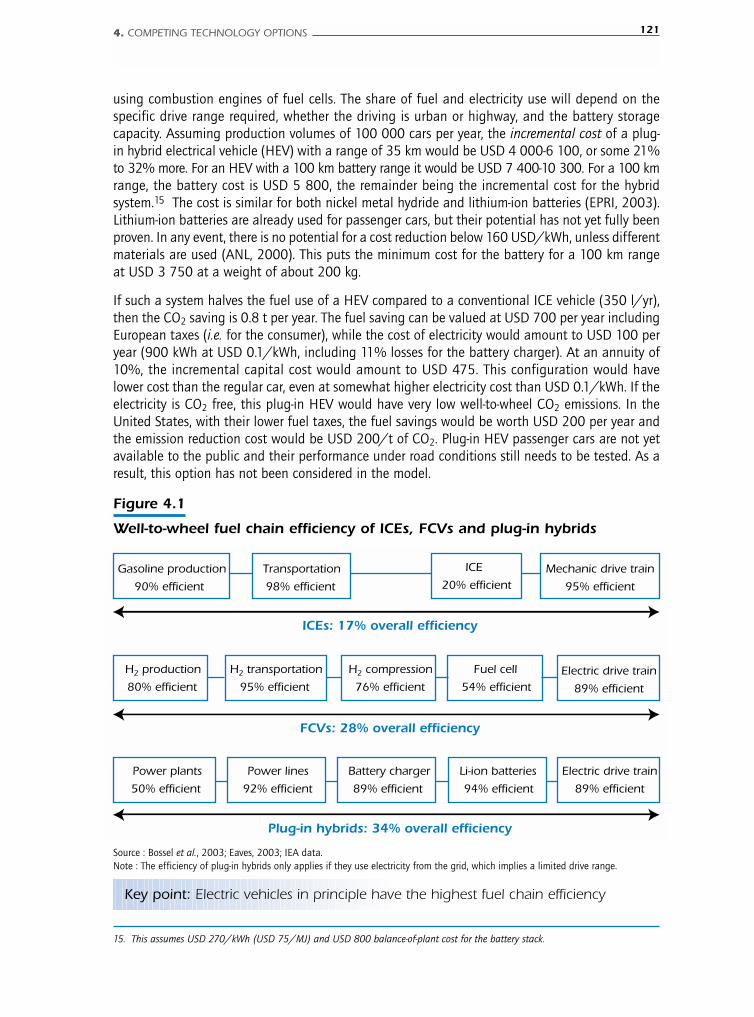
using combustion engines of fuel cells. The share of fuel and electricity use will depend on thespecific drive range required, whether the driving is urban or highway, and the battery storagecapacity. Assuming production volumes of 100 000 cars per year, the incremental cost of a plug-in hybrid electrical vehicle (HEV) with a range of 35 km would be USD 4 000-6 100, or some 21%to 32% more. For an HEV with a 100 km battery range it would be USD 7 400-10 300. For a 100 kmrange, the battery cost is USD 5 800, the remainder being the incremental cost for the hybridsystem.15 The cost is similar for both nickel metal hydride and lithium-ion batteries (EPRI, 2003).Lithium-ion batteries are already used for passenger cars, but their potential has not yet fully beenproven. In any event, there is no potential for a cost reduction below 160 USD/kWh, unless differentmaterials are used (ANL, 2000). This puts the minimum cost for the battery for a 100 km rangeat USD 3 750 at a weight of about 200 kg.
If such a system halves the fuel use of a HEV compared to a conventional ICE vehicle (350 l/yr),then the CO2 saving is 0.8 t per year. The fuel saving can be valued at USD 700 per year includingEuropean taxes (i.e. for the consumer), while the cost of electricity would amount to USD 100 peryear (900 kWh at USD 0.1/kWh, including 11% losses for the battery charger). At an annuity of10%, the incremental capital cost would amount to USD 475. This configuration would havelower cost than the regular car, even at somewhat higher electricity cost than USD 0.1/kWh. If theelectricity is CO2 free, this plug-in HEV would have very low well-to-wheel CO2 emissions. In theUnited States, with their lower fuel taxes, the fuel savings would be worth USD 200 per year andthe emission reduction cost would be USD 200/t of CO2. Plug-in HEV passenger cars are not yetavailable to the public and their performance under road conditions still needs to be tested. As aresult, this option has not been considered in the model.
4. COMPETING TECHNOLOGY OPTIONS 121
Figure 4.1
Well-to-wheel fuel chain efficiency of ICEs, FCVs and plug-in hybrids
H2 compression
76% efficientElectric drive train
89% efficient
H2 production
80% efficient
Fuel cell
54% efficient
H2 transportation
95% efficient
Battery charger
89% efficient
Electric drive train
89% efficient
Power plants
50% efficient
Li-ion batteries
94% efficient
Power lines
92% efficient
Mechanic drive train
95% efficient
Gasoline production
90% efficient
ICE
20% efficientTransportation
98% efficient
ICEs: 17% overall efficiency
FCVs: 28% overall efficiency
Plug-in hybrids: 34% overall efficiency
Key point: Electric vehicles in principle have the highest fuel chain efficiency
Source : Bossel et al., 2003; Eaves, 2003; IEA data.Note : The efficiency of plug-in hybrids only applies if they use electricity from the grid, which implies a limited drive range.
15. This assumes USD 270/kWh (USD 75/MJ) and USD 800 balance-of-plant cost for the battery stack.
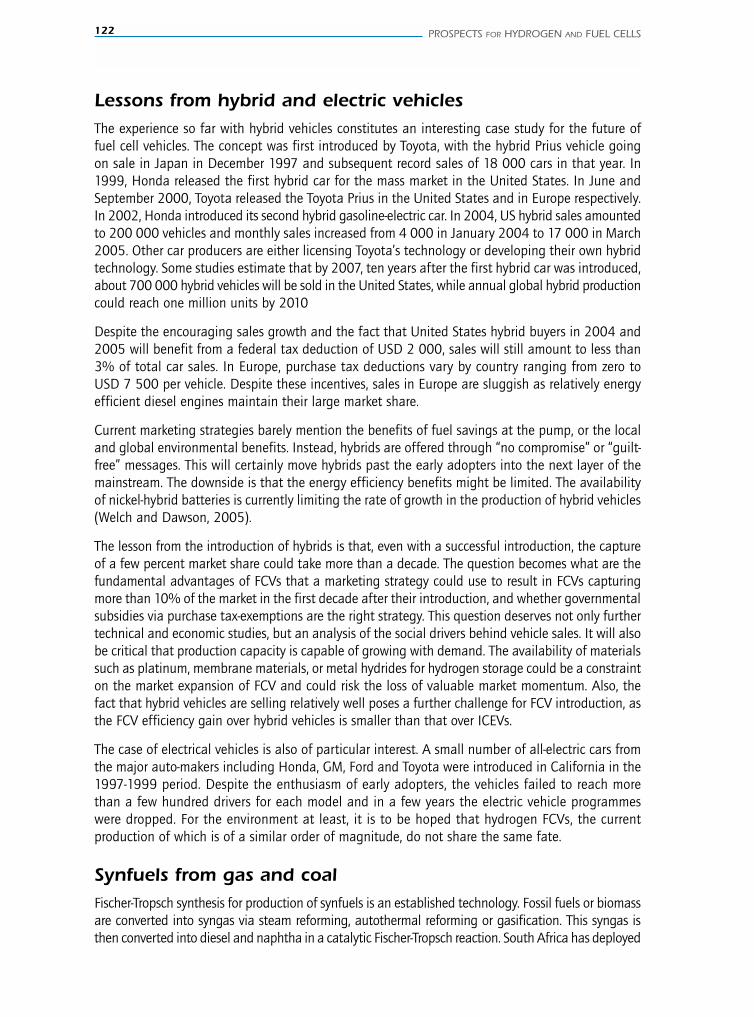
122 PROSPECTS FOR HYDROGEN AND FUEL CELLS
Lessons from hybrid and electric vehiclesThe experience so far with hybrid vehicles constitutes an interesting case study for the future offuel cell vehicles. The concept was first introduced by Toyota, with the hybrid Prius vehicle goingon sale in Japan in December 1997 and subsequent record sales of 18 000 cars in that year. In1999, Honda released the first hybrid car for the mass market in the United States. In June andSeptember 2000, Toyota released the Toyota Prius in the United States and in Europe respectively.In 2002, Honda introduced its second hybrid gasoline-electric car. In 2004, US hybrid sales amountedto 200 000 vehicles and monthly sales increased from 4 000 in January 2004 to 17 000 in March2005. Other car producers are either licensing Toyota’s technology or developing their own hybridtechnology. Some studies estimate that by 2007, ten years after the first hybrid car was introduced,about 700 000 hybrid vehicles will be sold in the United States, while annual global hybrid productioncould reach one million units by 2010
Despite the encouraging sales growth and the fact that United States hybrid buyers in 2004 and2005 will benefit from a federal tax deduction of USD 2 000, sales will still amount to less than3% of total car sales. In Europe, purchase tax deductions vary by country ranging from zero toUSD 7 500 per vehicle. Despite these incentives, sales in Europe are sluggish as relatively energyefficient diesel engines maintain their large market share.
Current marketing strategies barely mention the benefits of fuel savings at the pump, or the localand global environmental benefits. Instead, hybrids are offered through “no compromise” or “guilt-free” messages. This will certainly move hybrids past the early adopters into the next layer of themainstream. The downside is that the energy efficiency benefits might be limited. The availabilityof nickel-hybrid batteries is currently limiting the rate of growth in the production of hybrid vehicles(Welch and Dawson, 2005).
The lesson from the introduction of hybrids is that, even with a successful introduction, the captureof a few percent market share could take more than a decade. The question becomes what are thefundamental advantages of FCVs that a marketing strategy could use to result in FCVs capturingmore than 10% of the market in the first decade after their introduction, and whether governmentalsubsidies via purchase tax-exemptions are the right strategy. This question deserves not only furthertechnical and economic studies, but an analysis of the social drivers behind vehicle sales. It will alsobe critical that production capacity is capable of growing with demand. The availability of materialssuch as platinum, membrane materials, or metal hydrides for hydrogen storage could be a constrainton the market expansion of FCV and could risk the loss of valuable market momentum. Also, thefact that hybrid vehicles are selling relatively well poses a further challenge for FCV introduction, asthe FCV efficiency gain over hybrid vehicles is smaller than that over ICEVs.
The case of electrical vehicles is also of particular interest. A small number of all-electric cars fromthe major auto-makers including Honda, GM, Ford and Toyota were introduced in California in the1997-1999 period. Despite the enthusiasm of early adopters, the vehicles failed to reach morethan a few hundred drivers for each model and in a few years the electric vehicle programmeswere dropped. For the environment at least, it is to be hoped that hydrogen FCVs, the currentproduction of which is of a similar order of magnitude, do not share the same fate.
Synfuels from gas and coalFischer-Tropsch synthesis for production of synfuels is an established technology. Fossil fuels or biomassare converted into syngas via steam reforming, autothermal reforming or gasification. This syngas isthen converted into diesel and naphtha in a catalytic Fischer-Tropsch reaction. South Africa has deployed
this technology on a large-scale during the past 50 years and Sasol has been operating a 0.15 mbpdcoal-to-liquids plant for about 25 years, which has recently been changed to use cheaper gas as afeedstock. The product mix consists of 80% diesel and 20% naphtha. China has expressed interest inan advanced version of the Sasol conversion process. Two 0.08 mbpd plants based on indirect conversion(first gasification, followed by FT-synthesis) are being investigated. A 20 000 bpd plant based on directconversion (coal treatment with hydrogen) is currently operational (Coaltrans, 2003). The Chinese plansfor the CTL process could add up to 1.2 mbpd of production by 2020.
FT-synthesis from natural gas is also well established and further expansion up to 1 mbpd is plannedfor 2010, with the bulk of this capacity being located in the Middle East (Chemical Market Reporter,2004). The conversion efficiency is about 55%, with a theoretical maximum of about 78%. Due tothe energy losses, this process only makes economic sense if cheap gas is available. As the costs forLNG transportation decline and the demand for gas increases, the availability of cheap stranded gasis likely to decline and with it such options for gas-to-liquids (GTL) plants. The IEA WEO projects globalGTL capacity of 2.3 mb/d by 2030 (IEA, 2004a). It is not evident that FT-synthesis based on MiddleEast stranded gas, or LNG from the Middle East would also enhance the security of supply in the longterm. Outside the Middle East, the long-term availability of sufficient stranded gas (i.e. cheap gas) tofuel the world transportation fleet is less evident. The total amount of stranded gas in Figure 4.2 currentlyamounts to 6 000 EJ, or around half of total global gas reserves. This is equivalent to 60 years ofcurrent gas use, but the bulk of the stranded gas resources are in politically volatile regions.
4. COMPETING TECHNOLOGY OPTIONS 123
Figure 4.2
Stranded gas resources, by region
Middle East53%
FSU 20%
Other 12%
Latin America 7%
Africa 8%
Key point: Stranded gas is concentrated in the same regionsas oil reserves
Source: IEA data.
At the moment, a 40% liquid product yield (in energy terms) can be attained by coal based FTprocesses (Steynberg and Nel, 2004). Coal-based production is less sensitive to feedstock pricesthan the gas-based production, because capital costs are considerably higher due to the additionalcost of coal gasification, oxygen production, etc. The investment cost for an 80 000 bpd CTL plantis around USD 5 billion.
124 PROSPECTS FOR HYDROGEN AND FUEL CELLS
Current gas-based FT production costs are USD 25-30/bbl (USD 5-6 /GJ liquids), given a gas priceof USD 0.5/GJ (Marsh et al. 2003). For the CTL process the production cost is estimated to beabout USD 8-10/GJ liquid at a coal price of USD 1/GJ (Williams and Larson, 2003). This correspondsto a liquid fuel price of USD 45-55/bbl and to a crude oil price of 30-45 USD/bbl. However, currentUnited States designs for plants at the mine-mouth that use lignite at USD 0.5/GJ indicate aneven lower production cost of around USD 30/bbl of crude equivalent (Pedersen, 2005). A GTLproject needs at least 1.5 EJ gas in place, while a CTL process will only be economic for locationswith at least 2-4 Gt of coal reserves in place.
In the case of gas feedstock use, between 17% and 25% of the carbon entering the process is releasedas a process emission (the remainder rests in the liquid synfuel product). However, when coal is usedas a feedstock, the process emission amounts to more than 50% of the carbon in the coal. In thefuture, CO2 capture and storage could be applied in order to reduce or eliminate the CO2 emissions.
In recent years, the co-production of electricity and synfuels such as methanol, FT-diesel and hydrogenfrom coal, has been receiving increasing attention. Co-production would allow a high average loadfactor, which would reduce the capital cost component per unit of product. A study by Sasol pointsout that the co-production of FT transportation fuels and electricity from coal raises the energyconversion efficiency from 40% to 50%, compared to the same plant without electricity cogeneration.Such plants would produce synfuel and electricity in an 8:1 ratio (Steynberg and Nel, 2004), whileanalysis suggests that synfuel production costs may be reduced by 10 percent if a co-productionstrategy is applied (Yamashita and Barreto, 2003, Williams and Larson, 2003).
Other fuels under discussion are methanol and DiMethylEther (DME). Contrary to methanol, DMEis non-toxic. Both fuels could be produced from a wide range of feedstocks including coal, naturalgas and biomass. Methanol production from natural gas is an established technology. Currently,the bulk of methanol produced is used in the manufacture of chemicals.
Current DME production takes place in two-steps. First methanol is produced from syngas, whichis then catalytically dehydrated into DME. New production processes are under developmentwhere DME is produced directly from syngas in a single step. Various process designs have beenproposed for the co-production of methanol and DME, and for the cogeneration of DME and electricity.Such designs circumvent the problem of re-circulation of products because of incomplete conversionof feedstock into DME (Air Products, 2002; Ogawa et al., 2003). DME can be used as a fuel forpower generation turbines, diesel engines, or as an LPG replacement in households. Current globalDME production amounts to 0.15 Mt per year. Its main use is as an aerosol propellant for hairspray. Two coal-based DME plants are in operation in China, with a total capacity of 40 kt a year.A rapid expansion of Chinese DME production is planned, to more than 1 Mt a year (0.03 EJ/yr)in 2009 (Fleisch, 2004), while further gas-based projects are planned in the Middle East.
Non-conventional oilThere are three types of non-conventional oil resources: heavy oil, oil sands and bitumen, and oilshales. Medium heavy oil and extra heavy oil have a density ranging from 25° API to 7° API, anda viscosity ranging from 10 to 10 000 centiPoise (cP). These resources are mobile at reservoirconditions. Oil sands and bitumen in contrast are not mobile at reservoir conditions and have adensity ranging from 12° API to 7° API, and a viscosity above 10 000 cP. The reserves of extra heavyoils are concentrated in Venezuela, while the tar sands and bitumen reserves are concentrated inCanada. The amount of heavy oil in place (recoverable reserves) is 1 200 Gbbl and for tar sandsand bitumen it is 1 630 Gbbl. These two countries represent together about 80% of worldwidereserves. Canada’s tar sands and bitumen reserves are estimated at 310 Gbbl, while Venezuela’s

heavy oil reserves are 270 Gbbl. This makes the reserves of each of these countries similar to theoil reserves of Saudi Arabia
Oil sands contain around 10-15% bitumen, while 10% of oil sands are situated within 50 metersof the surface and can be economically mined in open pits. The oil recovery from oil sands thatare surface mined is high and can be up to 90%. The remaining 90% of oil sand resources can bemined using in-situ technologies that have much lower recovery rates of around 10-20%. A numberof underground (in-situ) production techniques are used, including: cyclic steam stimulation (CSS),pressure cyclic steam drive (PCSD), cold heavy oil production with sand (CHOPS) and solvent injectionand steam assisted gravity drainage (SAGD).
Given the better economics, open cast mining is currently the main production technology in Canada,accounting for about 80% of total production. The mined sand is transported to a processingplant where the bitumen is removed using mixing and cleaning processes that utilise water, causticsoda and some form of agitation. Following the cleaning, the bitumen is diluted with naphthaleneand sent to an upgrader. The heating of the bitumen to about 500 °C then yields about 70%syncrude. This syncrude has good yields of kerosene and other middle distillates. The remainingfraction either thermally cracks to form gaseous products or it is converted into petcoke.
The main CSS application is the Imperial Oil Cold Lake project (0.11 Mbpd in 2002). In this projectsteam is injected for some time, which is followed by production of the heated liquid bitumen (about80 °C). In the case of SAGD two horizontal wells are used on top of each other. Steam is injectedin the upper well and another well below the steam injection well is used for recovery of the liquefiedbitumen. SAGD has been tested at a pilot-plant scale (0.05 Mbpd in 2002 in 10 projects). Solventinjection uses the same double-well approach but with organic solvents instead of water. SAGDcould increase the recovery efficiency from less than 10% to 40%, which would increase therecoverable reserves substantially. If this can be proven in practice, it has the potential to raise theglobal reserves of oil sand and heavy oil to the level of conventional oil reserves.
However, the production of oil sands is energy, and hence CO2, intensive. CSS requires approximately1-1.4 GJ natural gas per barrel of bitumen produced and 20 kWh of electricity (0.18-0.23 GJ perGJ of bitumen produced). Approximately 75 kg of CO2 are released per barrel of bitumen producedfor CSS and up to 109 kg per barrel (12-18 kg CO2/GJ) for steam assisted extraction (Foley, 2001).The total emissions are therefore substantially higher than for conventional oil production.
The CSS steam-to-oil ratio is about 5:1. For SAGD, it is 2:1 to 4:1, with a potential for further reductionto 2:1 or even 1:1 for solvent based processes (Ali, 2003). So a significant potential exists to decreaseenergy use and emissions. On top of the emissions in bitumen production there are the emissionsfrom the bitumen upgrading. However, in the case where residues from upgrading are used togenerate the steam, no additional gas is needed (e.g. in case of the Canadian Long Lake project).
The operating cost for SAGD would be about USD 3/bbl, if gas is used to generate the steam, andUSD 1/bbl if upgrading residues are used. The capital cost and upgrading cost must then be added tothe operating costs. The total technical cost of production and upgrading is about USD 15/bbl. The costof adding CO2 capture to reduce upstream emissions may increase costs by USD 5/bbl (Cupcic, 2003).
The temperature of the reservoirs in the Venezuelan Orinoco tar sands at 1000 m depth is 55 °C.This high reservoir temperature reduces the viscosity of the oil and means the oil can be recoveredwithout, or with very limited, thermal stimulation (a steam-to-oil ratio of 0.3) (Ali, 2003). Theheavy oil, which has an average gravity of 9.5°API (1.00 t/m3), is extracted from wells that arearranged in clusters, using screw pumps. The production costs are well below the price for conventionaloil and this explains the rapidly increasing production of this type of oil.
4. COMPETING TECHNOLOGY OPTIONS 125
126 PROSPECTS FOR HYDROGEN AND FUEL CELLS
Canada produced 829 million barrels of bitumen in 2002 (Alberta 2003). By 2011, Alberta’s oilsands are expected to generate nearly 2 mbpd of crude oil representing 57 per cent of Canada’sprojected total crude oil production at that time. Venezuela has plans to apply deep conversiontechnology to the heavy oil in order to produce high-value transportation fuels. Delayed coking is theprimary conversion technology. Plans are to produce 622 000 bpd of syncrude by 2009.
Total Canadian and Venezuelan production will probably be around 3 mbpd of crude oil equivalent in2010, or 3% of world oil production. The IEA World Energy Outlook projects a total syncrude productionfrom both sources of 6 mbpd by 2030 (IEA, 2004a). This production is based on very large multi-billion dollar projects, whose planning takes time. Such projects require a stable policy environment.Such an environment is given for Canada, but less evident in the case of Venezuela.
Oil shale is an inorganic rock that contains kerogen, a type of immature oil that has never beenexposed to high temperatures. Lean shale contains about 4% kerogen. Rich shale contains about40% kerogen. When the rock is heated to 350-400 °C it yields 20-200 litres of oil per ton of shale.Advanced oil shale processing would generate roughly 286 kg CO2/bbl (54 kg/GJ) compared to59 kg CO2/bbl (11 kg/GJ) for conventional oil. Reductions to 169 kg/bbl (32 kg/GJ) are planned(Innovest Strategic Value Advisors, 2001). The raw shale oil produced would constitute a relativelylight crude with a 42° API gravity, 0.4wt% sulphur and 1.0wt% nitrogen. The oil is further processedinto hydro-treated naphtha and low sulphur medium shale oil of 27° API.
The world’s largest oil shale project was the Stuart shale oil project in Australia. The plant washeavily opposed by NGOs. In July 2004 it was announced that the plant would be closed down.There are some oil shale mining activities in Estonia, Brazil and China, but they are on a smallscale. The bulk of the global oil shale resources are located in the United States. There is morethan 500 Gbbl of oil in place in oil shales of more than 25 gallon/ton, in a layer at least 3 metresthick. Lower-quality resources are double this figure (DOE 2004a). In-situ recovery methods areunder development that could reduce the environmental impacts of oil shale production dramatically.The mining and upgrading of oil shale to syncrude costs USD 30/bbl, if the in-situ process is applied(Shell estimate). Given the successful development of the Canadian oil sands industry, oil shaleprocessing may emerge in coming years as a new source of production. However, even if a significantshare of global oil supply could technically be produced from oil shale in the long term, it isunlikely that an industry of more than 1 mbpd will be operational by 2020.
Compressed natural gas (CNG)Car engines can run on natural gas. This requires some minor modifications to gasoline engines. Theuse of gas requires a gas tank, and it shortens the life span of the engine. Retro-fitting mid-size gasolinecars to natural gas costs currently USD 2 200 - 3 400 per car. An additional disadvantage is that thepower output of the car is reduced by 15-20%. At the moment such a retro-fit is attractive inGermany because natural gas is not subject to the substantial fuel taxes of oil fuels. However, itsexpansion is limited by the availability of natural gas refuelling stations. In terms of cost, the retro-fitinvestment is equivalent to USD 0.35/litre of gasoline equivalent, or USD 10/GJ. These capital costsare not negligible, and must be taken into account for proper comparison of alternative fuels. Worldwide there are about 3.8 million natural gas-fuelled vehicles, mainly in Argentina, Brazil, Pakistan,Italy, India and the United States (IANGV, 2004). This equals about 0.5% of the world vehicle stock.This makes CNG a serious alternative transportation fuel option.
Alternative fuels and energy policy targetsFigure 4.3 shows a qualitative assessment of transportation fuel options and their perceived contributionto energy-security and CO2 emissions reductions. Obviously, this classification is only indicative and
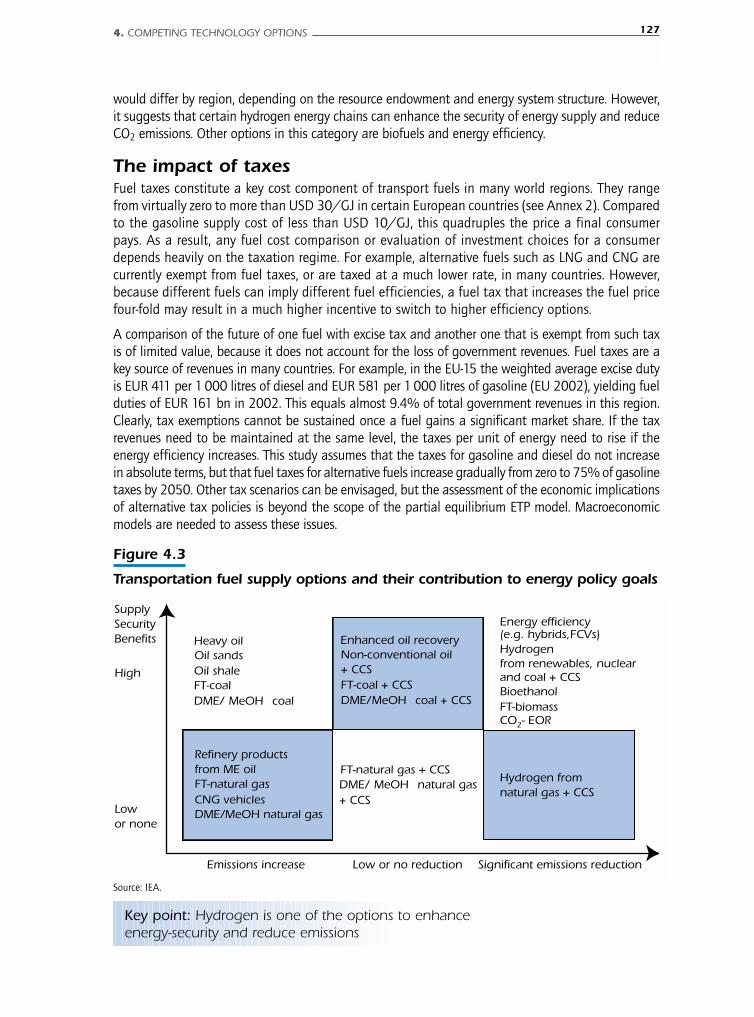
would differ by region, depending on the resource endowment and energy system structure. However,it suggests that certain hydrogen energy chains can enhance the security of energy supply and reduceCO2 emissions. Other options in this category are biofuels and energy efficiency.
The impact of taxesFuel taxes constitute a key cost component of transport fuels in many world regions. They rangefrom virtually zero to more than USD 30/GJ in certain European countries (see Annex 2). Comparedto the gasoline supply cost of less than USD 10/GJ, this quadruples the price a final consumerpays. As a result, any fuel cost comparison or evaluation of investment choices for a consumerdepends heavily on the taxation regime. For example, alternative fuels such as LNG and CNG arecurrently exempt from fuel taxes, or are taxed at a much lower rate, in many countries. However,because different fuels can imply different fuel efficiencies, a fuel tax that increases the fuel pricefour-fold may result in a much higher incentive to switch to higher efficiency options.
A comparison of the future of one fuel with excise tax and another one that is exempt from such taxis of limited value, because it does not account for the loss of government revenues. Fuel taxes are akey source of revenues in many countries. For example, in the EU-15 the weighted average excise dutyis EUR 411 per 1 000 litres of diesel and EUR 581 per 1 000 litres of gasoline (EU 2002), yielding fuelduties of EUR 161 bn in 2002. This equals almost 9.4% of total government revenues in this region.Clearly, tax exemptions cannot be sustained once a fuel gains a significant market share. If the taxrevenues need to be maintained at the same level, the taxes per unit of energy need to rise if theenergy efficiency increases. This study assumes that the taxes for gasoline and diesel do not increasein absolute terms, but that fuel taxes for alternative fuels increase gradually from zero to 75% of gasolinetaxes by 2050. Other tax scenarios can be envisaged, but the assessment of the economic implicationsof alternative tax policies is beyond the scope of the partial equilibrium ETP model. Macroeconomicmodels are needed to assess these issues.
4. COMPETING TECHNOLOGY OPTIONS 127
Figure 4.3
Transportation fuel supply options and their contribution to energy policy goals
Emissions increase Significant emissions reduction
Lowor none
High
SupplySecurityBenefits
Refinery products from ME oil
Energy efficiency (e.g. hybrids,FCVs) Hydrogen from renewables, nuclear
and coal + CCS
Hydrogen from natural gas + CCS
FT-biomass
FT-coal + CCS
Non-conventional oil + CCS
CO2- EOR
CNG vehicles
FT-natural gas + CCS
Bioethanol
Enhanced oil recovery
Low or no reduction
Oil shale
Heavy oil
DME/ MeOH natural gas + CCS
Oil sands
FT-natural gas
DME/MeOH coal + CCSFT-coalDME/ MeOH coal
DME/MeOH natural gas
Key point: Hydrogen is one of the options to enhanceenergy-security and reduce emissions
Source: IEA.
128 PROSPECTS FOR HYDROGEN AND FUEL CELLS
Competing options for stationary applications
Residential uses
Existing buildings are usually connected to the electricity grid and equipped with systems to generateheat and hot water from fossil fuels or electricity. In certain regions where winter heating andsummer cooling are needed, heat pumps have a significant market share. CHP systems havetraditionally received a lot of attention in regions with long heating seasons without the need forsummer cooling. However, CHP systems are gradually gaining market share in other regions.
Gas is one of the most widely used residential heating fuels in industrialised countries. Old gasboilers may achieve an efficiency of 75% (room-based systems) to 85% (centralised systems). Newcondensing gas boilers can achieve up to 107% efficiency (Holsteijn, 2002). Efficiencies of140% can be achieved through a combination of a gas-fired heat pump and a condensing boiler.A range of small improvements are possible for boilers, such as replacing the pilot flame by electric-ignition (5% savings), reduced heat capacity of on/off burners (4% savings), or water pumps withpermanent magnet motors (4% savings) (Holsteijn, 2002). The distribution system, the emittersand the room temperature control system also matter. Savings of between 10% and 20% can beachieved through options such as improved piping insulation, low temperature/large-surfaceradiators, or behavioural feedback control units with room thermostats (Holsteijn and Kemna,2001). Low capacity factors may pose important limitations for a switch to more energy-efficient,but high capital-cost technologies.
Apart from high-efficiency fossil-fuelled boilers, solar heating systems are making inroads in manyregions. The total global capacity of solar heaters stood at almost 93 GW in 2003 (Weiss et al.,2005). The total yield from these systems was 0.2 EJ, compared to 50 EJ fossil fuel use in theresidential and commercial sector, or a 0.5% share. While their current use is still limited, the growthrate is around 20% per year. Most solar heating systems are used to generate hot water. Their futureexpansion, possibly in combination with heat pumps and insulation measures, could limit the marketpotential for residential fuel cells.
The demand for heat depends on the climate, the insulation level and the desired interior temperature.The average household temperature in the UK has risen from 13 °C to 18 °C over the last 30 years,and a further increase to 20 °C is projected by 2020 (Powergen, 2003). Cultural differences canalso play an important role. In Japan, traditional one-room heating systems based on keroseneburners are still widely used, in combination with an electric heating system under the table(a “kotatsu”). These cultural differences can affect the prospects for fuel cells in the residential andcommercial sectors and must be assessed on a regional, or even national basis.
For space and hot water heating one can differentiate, in general terms, between systems that convertheat into useful energy (burners and boilers), and systems that use energy to separate energy fromthe environment into a hot and a cold part (chillers and heat pumps). Chillers and heat pumps canachieve efficiencies that are well above 100%, because the energy taken from the environment is“free”. These systems are slowly penetrating the market. Their main disadvantages are that theyrequire high-quality fuels such as electricity or gas, and that they have a high investment cost dueto their complex technology. Therefore, the bulk of energy services are still delivered by systems thatconvert fossil energy or electricity directly into useful energy. A gradual trend exists toward heatpumps, aided by the move to packaged systems. These standardised modular systems have achievedcost reductions due to the economies of scale in standardised factory production.
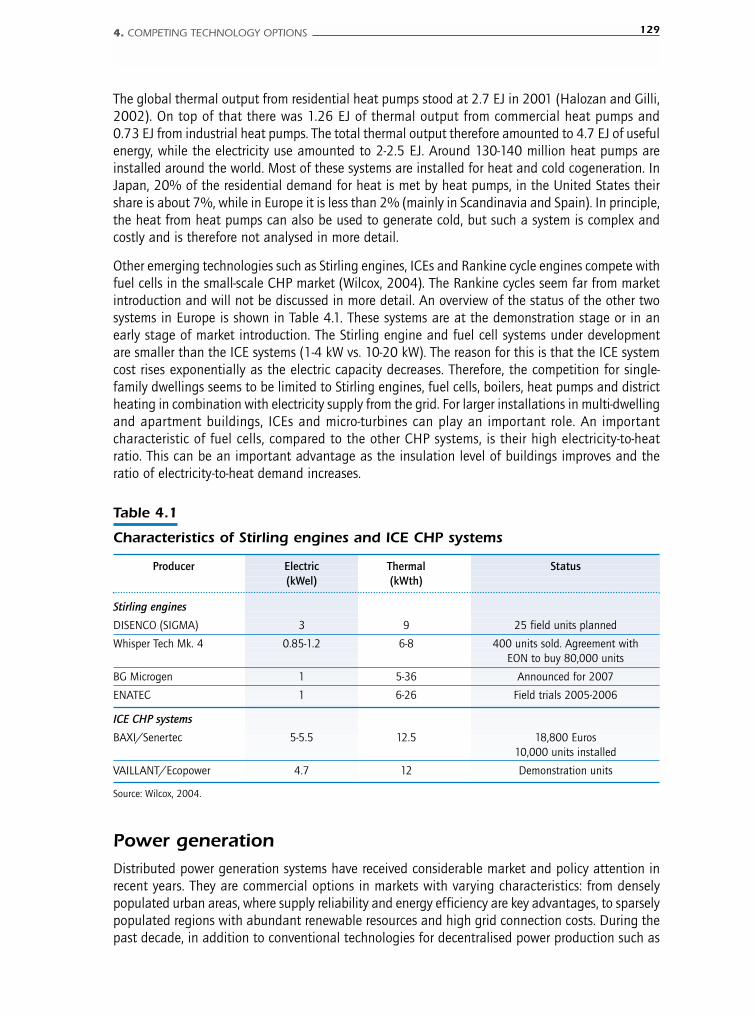
The global thermal output from residential heat pumps stood at 2.7 EJ in 2001 (Halozan and Gilli,2002). On top of that there was 1.26 EJ of thermal output from commercial heat pumps and0.73 EJ from industrial heat pumps. The total thermal output therefore amounted to 4.7 EJ of usefulenergy, while the electricity use amounted to 2-2.5 EJ. Around 130-140 million heat pumps areinstalled around the world. Most of these systems are installed for heat and cold cogeneration. InJapan, 20% of the residential demand for heat is met by heat pumps, in the United States theirshare is about 7%, while in Europe it is less than 2% (mainly in Scandinavia and Spain). In principle,the heat from heat pumps can also be used to generate cold, but such a system is complex andcostly and is therefore not analysed in more detail.
Other emerging technologies such as Stirling engines, ICEs and Rankine cycle engines compete withfuel cells in the small-scale CHP market (Wilcox, 2004). The Rankine cycles seem far from marketintroduction and will not be discussed in more detail. An overview of the status of the other twosystems in Europe is shown in Table 4.1. These systems are at the demonstration stage or in anearly stage of market introduction. The Stirling engine and fuel cell systems under developmentare smaller than the ICE systems (1-4 kW vs. 10-20 kW). The reason for this is that the ICE systemcost rises exponentially as the electric capacity decreases. Therefore, the competition for single-family dwellings seems to be limited to Stirling engines, fuel cells, boilers, heat pumps and districtheating in combination with electricity supply from the grid. For larger installations in multi-dwellingand apartment buildings, ICEs and micro-turbines can play an important role. An importantcharacteristic of fuel cells, compared to the other CHP systems, is their high electricity-to-heatratio. This can be an important advantage as the insulation level of buildings improves and theratio of electricity-to-heat demand increases.
4. COMPETING TECHNOLOGY OPTIONS 129
Table 4.1
Characteristics of Stirling engines and ICE CHP systems
Producer Electric Thermal Status(kWel) (kWth)
Stirling engines
DISENCO (SIGMA) 3 9 25 field units planned
Whisper Tech Mk. 4 0.85-1.2 6-8 400 units sold. Agreement withEON to buy 80,000 units
BG Microgen 1 5-36 Announced for 2007
ENATEC 1 6-26 Field trials 2005-2006
ICE CHP systems
BAXI/Senertec 5-5.5 12.5 18,800 Euros10,000 units installed
VAILLANT/Ecopower 4.7 12 Demonstration units
Source: Wilcox, 2004.
Power generation Distributed power generation systems have received considerable market and policy attention inrecent years. They are commercial options in markets with varying characteristics: from denselypopulated urban areas, where supply reliability and energy efficiency are key advantages, to sparselypopulated regions with abundant renewable resources and high grid connection costs. During thepast decade, in addition to conventional technologies for decentralised power production such as
130 PROSPECTS FOR HYDROGEN AND FUEL CELLS
oil and gas engines, a lot of attention has focused on micro-turbines, Stirling engines and renewabletechnologies. Decentralised power supply systems using renewable energy have been introducedin areas where the transmission and distribution system is absent or inadequate.
Combined heat and power production is the largest segment of the existing decentralised generationmarket. Large-scale CHP systems, based on gas turbines or boilers, represent 96% of the CHP marketworld wide (WADE, 2003). Such systems have reached maturity at a scale of 1 MW or more. Morerecently, attention has switched to the use of fuel cells in small-scale CHP systems due to the largepotential market for their use in the residential and commercial sectors. Their electric conversionefficiency is high compared to other small-scale decentralised electricity supply options, but thecomparison is less favorable when compared to large-scale centralised electricity supply optionswith grid delivery. A state-of-the-art gas-fired combined cycle plant can achieve a net electric efficiencyof 57%, while a state-of-the-art hard coal-fired power plant under supercritical steam conditionscan achieve net electric efficiency 46% (Meier et al., 2004). Moreover, a substantial potential existsto increase the efficiencies of these conventional technologies even further, to 50-55% for coal-fired plants (IGCC and ultra-supercritical steam cycles) and to greater than 60% for gas-firedpower plants. These values are higher than the 40-50% electric efficiency that is projected fordecentralised fuel cell systems, even if the 5-7% losses in electricity transportation and distributionare subtracted in the case of centralised production.
In CHP mode, decentralised systems can have an overall efficiency advantage due to their use ofthe residual heat, which is generally not utilised at centralised power plants. In particular, if acontinuous heat demand is required, rather than just seasonal space heating or cooling, the useof significant additional quantities of heat can significantly raise the overall efficiency and mayfavour fuel cell systems. However, moving from centralised power production to distributed fuelcells will also be hampered by the fact that CO2 capture and storage will not be economical fordistributed systems. Therefore, if decentralised fuel cell systems are not to add to CO2 emissions,they will need to run on hydrogen that has been produced without emissions.
Transmission and distribution costs are high in remote areas with low population densities. Inthese areas fuel cells may have a competitive advantage over other centralised electricity supplyoptions. An electricity supply system based on decentralised fuel cells may offer superior efficiency,reliability and availability performance in comparison with other systems (e.g. renewable systems).Depending on the circumstances, a decentralised fuel cell system may also offer superior reliabilityand supply security than the grid supply from centralised production.
Prospects also exist for fuel cell integration into centralised power production. The current targetis to integrate fuel cells into medium-sized power plants of several tens of MW. This could representa balanced strategy that takes advantage of the benefits of decentralised production (such ascogeneration) and centralised production (such as economies of scale and high electric efficiency).Depending on the specific application and operating conditions, SOFCs, MCFCs, or even PEMFCsmay be competitive. A speculative scenario - not considered in this study - might be where technologybreakthroughs in decentralised hydrogen production systems resulted in the use of PEMFCs andFCVs not only in transport applications, but also for decentralised power production in the residentialand commercial sectors. This would allow for spill-over learning effects between sectors.
5. DEFINING THE ENERGY CONTEXT 131
Chapter 5.DEFINING THE ENERGY CONTEXT
H I G H L I G H T S
■ The analysis of two basic scenarios helps define the energy context (BASE Scenario) andmap the key drivers and policies for hydrogen and fuel cells (MAP Scenario). These twoscenarios provide the starting point for analysing the potential of hydrogen and fuel cellsunder a range of different assumptions.
■ The BASE scenario is a business-as-usual scenario which includes only currently enactedenergy policies. In the absence of significant new climate policies, energy demand morethan doubles by 2050 and CO2 emissions reach almost 60 Gt of CO2 per year. Fuel usein the transport sector also increases, but improvements in vehicle efficiency result inalmost 20% lower fuel demand in comparison with the IEAs WEO 2004 Reference Scenarioprojections for 2030. Important changes occur in the supply of transportation fuels beyond2030. In 2050, about 40% of the demand in the transportation sector is supplied byalternative fuels, primarily FT synfuels from coal and gas (some 30%) and biofuels (lessthan 10%). In addition, the use of efficient technologies limits the growth in demand forconventional oil refinery products. However, hydrogen plays a negligible role, due in partto the success of other non-conventional fuels. This result suggests that business-as-usualtrends in energy policy will not necessarily result in switching to hydrogen and fuel cells,even in the presence of energy-security concerns.
■ The MAP scenario includes a global incentive of USD 50/t of CO2 as a proxy to representa set of new policies and measures aimed at reducing emissions and improving energy-security. In the presence of these policies, global emissions are stabilised below 30 Gt ofCO2 per year over the projection period. Total energy use declines by 8% in 2050 comparedto the BASE scenario and the use of renewable energy increases at the expense of coal.The combination of effective climate and energy-security policies makes hydrogen asignificant player in the market for transport fuels. Oil still accounts for more than 50%of the fuel demand, but biofuels gain 25% of the market, hydrogen gains 10% and FTsynfuels 10%.
■ In the MAP scenario hydrogen use in 2050 amounts to 15.7 EJ. Around 90% of this hydrogenis used in the transport sector, primarily in passenger cars. Initially, hydrogen-hybrid vehiclesplay a important role, but from 2025 onwards sales of FCVs takeoff. Although, the totaldemand for hydrogen may appear small, the high efficiency of FCVs means that this hydrogenis fueling some 27% of all passenger cars in 2050.
■ As the MAP scenario is solely intended to “map” key parameters and hydrogen technologies,it is not a “best guess” scenario for hydrogen and fuel cells. For instance, it does not accountfor transition issues such as the chicken-or-egg problem. Hydrogen-specific scenarios basedon consistent sets of assumptions are discussed in Chapter 7.
132 PROSPECTS FOR HYDROGEN AND FUEL CELLS
■ In both the BASE and MAP scenarios, the installed capacity of stationary fuel cells – whichare not necessarily fuelled by hydrogen – is about 5% of global electricity productioncapacity in 2050. They are concentrated in industry, residential and commercial sectors.The fact that fuel cells are selected in both the BASE and MAP scenarios, despite thedifferent policy settings, suggests that they are a robust and competitive technology optionin niche markets.
After a brief description of the ETP model, this chapter describes the structure of the model analysis.It then discusses the results of the basic preparatory work that defines the reference scenarios andidentifies the key drivers (technologies, policies and assumptions) for hydrogen and fuel cells to“take off” in the energy market.
All scenarios in this analysis are compared to the ETP BASE scenario. The BASE scenario includesenergy and climate policies enacted before mid-2004. This means there are no substantial CO2
or energy-security policies in the post-Kyoto period, and no incentives to reduce CO2 emissions.A brief discussion of the BASE scenario is followed by a detailed discussion of the MAP referencescenario, which includes CO2 and energy-security policies. The name MAP refers to the fact thatthis scenario is intended to “map” the key technologies and drivers for hydrogen and fuel cells.Building on the MAP scenario, a sensitivity analysis explores the impact of varying individualparameters on the potential of hydrogen and fuel cells. The results of this analysis are discussedin Chapter 6. Chapter 7 discusses four more hydrogen-specific scenarios that provide an insightinto the long-term opportunities for hydrogen and fuel cells, as well as the combined impact ofdrivers and policies.
The Energy Technology Perspectives model
The IEA Energy Technology Perspective model is a bottom-up engineering-economic modelthat is based on the MARKAL (MARKet ALlocation) linear-programming model system (Fishboneand Abilock, 1981 and Loulou et al., 2004). The MARKAL model system has been developedover the past 30 years by the IEA Implementing Agreement on Energy Technology SystemsAnalysis Programme (ETSAP, 2004 and ETSAP, 2005). It is a technical tool to analyse technologycompetition and technology policies in the energy market, and to support decision-making inthe energy sector. Given the current energy system and technology mix, MARKAL models analysetheir evolution over time and provides minimum-cost configurations, given selected assumptionsfor energy policies and technology development. This class of models is not intended forforecasting, but for analysing the role of technologies and policies by taking into accountbasic assumptions and uncertainties. MARKAL-type models are also known as partial-equilibriummodels, as they only provide a microeconomic representation of the part of the world economythat is relevant to energy (e.g. they do not model the negative impact of higher energy costson economic growth).
The ETP model includes 15 world regions and accounts for energy trading among these regions.The energy system is modelled by a number of inter-dependent processes and flows representedthrough their technical and economic characteristics. At present, the ETP model incorporates1 500 energy demand and supply technologies, including energy production, extraction, conversion,

transport, distribution and end-use technologies (in the transport, industry, services and residentialsectors). Given a certain demand for energy services and appropriate normative and technicalconstraints (e.g. policy measures, natural resource availability, technical limitations for capacitybuilding, etc.), the model determines the least-cost configuration of the energy system over time,and determines the optimal physical and monetary flows. The model provides an abstract representationof the real world where decisions are based on rigid optimisation criteria (i.e. least-cost). User-definedconstraints help represent the “real world” that is characterised by non-optimal decisions. More informationon the ETP model and its technology database is given in Annex 1 and 2.
Overview of the analysis
Figure 5.1 provides an overview of the analyses carried out in this study, the results of which arereported in Chapters 5 to 7. A set of 40 model runs has been carried out to provide an insight intothe future role of hydrogen and fuel cells in the energy market. The results include the:
● Market potential for hydrogen and fuel cells.
● Cost implications for the global energy system.
● Key drivers for gaining market share and transition issues.
● Impact of different types and levels of policies and incentives.
● Impact on different world regions.
● The contribution of hydrogen and fuel cells to energy policy targets.
The impacts of hydrogen and fuel cell technologies are analysed from the perspective of the threeshared goals of the IEA, namely: energy-security, environmental protection and affordable energyenergy supplies for economic growth.
The baseline for the analysis (see Figure 5.1) is set by looking at the ETP BASE scenario. As mentionedabove, this scenario includes energy and climate policies enacted before mid-2004. It is a business-as-usual scenario with no new environmental or energy-security policies. This scenario provides thebase set of results to which other model scenarios are compared. The analysis continues with theMAP scenario that includes a global incentive to reduce CO2 emissions. The incentive is a modellinginstrument that is used to represent a range of regulatory and policy measures aimed at mitigatingclimate change and improving energy-security. The MAP scenario is intended to map the keytechnologies and drivers for hydrogen and fuel cells.
Based on the results of the MAP scenario, a sensitivity analysis has been carried out to investigatethe impact of varying individual drivers such as technology improvements, policy measures andeconomic parameters. The results of the MAP scenario and the sensitivity analysis have thenbeen used to define four more hydrogen-specific scenarios that analyse the combined effect ofa full range of policies and key drivers on the potential of hydrogen and fuel cells. These scenarios(Figure 5.1) are characterised by the acronym ESTEC: environment (E), supply security (S),technological progress (T), economic conditions (E) and competing options (C). A plus (+) signbeneath each letter of the acronym means that parameter values have a positive impact onhydrogen and fuel cell potential, while the minus (-) sign indicates negative effects. A zero (0)indicates that the parameter value is somewhere in between. The scenarios present the interactionof positive and negative factors that affect the potential of hydrogen and fuel cells, and provideinformation and suggestions regarding the related policies and benefits in terms of emissionmitigation and energy-security. The most optimistic outlook for hydrogen and fuel cells is providedby the ESTEC +++++ scenario.
5. DEFINING THE ENERGY CONTEXT 133
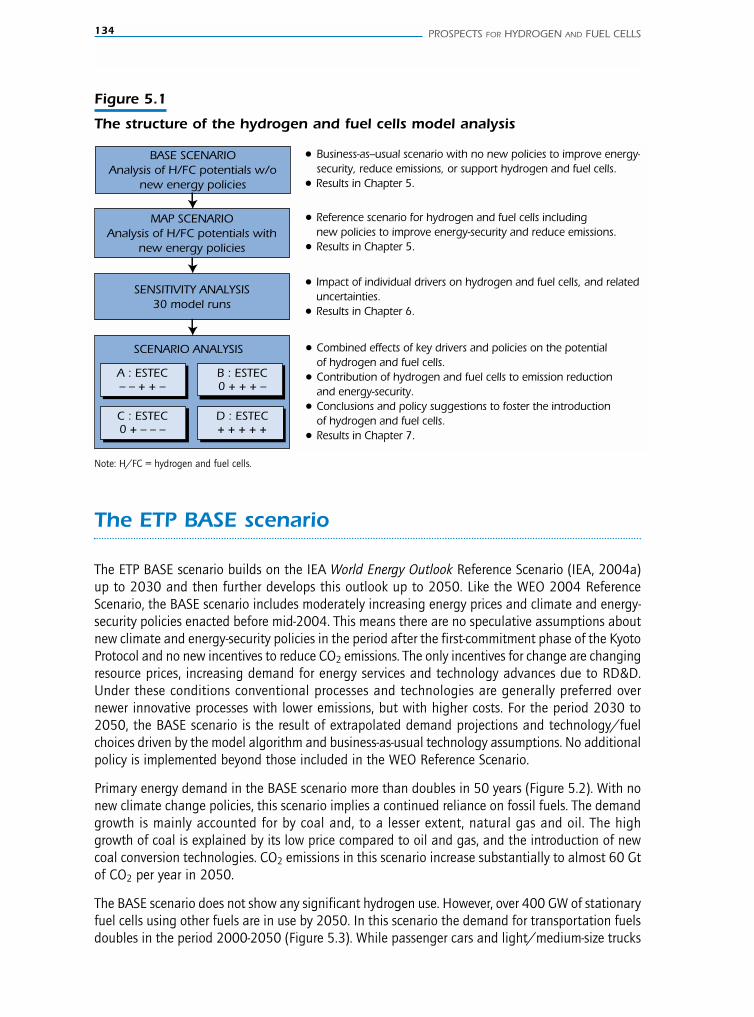
134 PROSPECTS FOR HYDROGEN AND FUEL CELLS
The ETP BASE scenario
The ETP BASE scenario builds on the IEA World Energy Outlook Reference Scenario (IEA, 2004a)up to 2030 and then further develops this outlook up to 2050. Like the WEO 2004 ReferenceScenario, the BASE scenario includes moderately increasing energy prices and climate and energy-security policies enacted before mid-2004. This means there are no speculative assumptions aboutnew climate and energy-security policies in the period after the first-commitment phase of the KyotoProtocol and no new incentives to reduce CO2 emissions. The only incentives for change are changingresource prices, increasing demand for energy services and technology advances due to RD&D.Under these conditions conventional processes and technologies are generally preferred overnewer innovative processes with lower emissions, but with higher costs. For the period 2030 to2050, the BASE scenario is the result of extrapolated demand projections and technology/fuelchoices driven by the model algorithm and business-as-usual technology assumptions. No additionalpolicy is implemented beyond those included in the WEO Reference Scenario.
Primary energy demand in the BASE scenario more than doubles in 50 years (Figure 5.2). With nonew climate change policies, this scenario implies a continued reliance on fossil fuels. The demandgrowth is mainly accounted for by coal and, to a lesser extent, natural gas and oil. The highgrowth of coal is explained by its low price compared to oil and gas, and the introduction of newcoal conversion technologies. CO2 emissions in this scenario increase substantially to almost 60 Gtof CO2 per year in 2050.
The BASE scenario does not show any significant hydrogen use. However, over 400 GW of stationaryfuel cells using other fuels are in use by 2050. In this scenario the demand for transportation fuelsdoubles in the period 2000-2050 (Figure 5.3). While passenger cars and light/medium-size trucks
Figure 5.1
The structure of the hydrogen and fuel cells model analysis
BASE SCENARIOAnalysis of H/FC potentials w/o
new energy policies
MAP SCENARIOAnalysis of H/FC potentials with
new energy policies
SENSITIVITY ANALYSIS 30 model runs
SCENARIO ANALYSIS
A : ESTEC– – + + –
B : ESTEC0 + + + –
C : ESTEC0 + – – –
D : ESTEC+ + + + +
● Business-as–usual scenario with no new policies to improve energy- security, reduce emissions, or support hydrogen and fuel cells.● Results in Chapter 5.
● Reference scenario for hydrogen and fuel cells including new policies to improve energy-security and reduce emissions.● Results in Chapter 5.
● Impact of individual drivers on hydrogen and fuel cells, and related uncertainties.● Results in Chapter 6.
● Combined effects of key drivers and policies on the potential of hydrogen and fuel cells.● Contribution of hydrogen and fuel cells to emission reduction and energy-security. ● Conclusions and policy suggestions to foster the introduction of hydrogen and fuel cells.● Results in Chapter 7.
Note: H/FC = hydrogen and fuel cells.
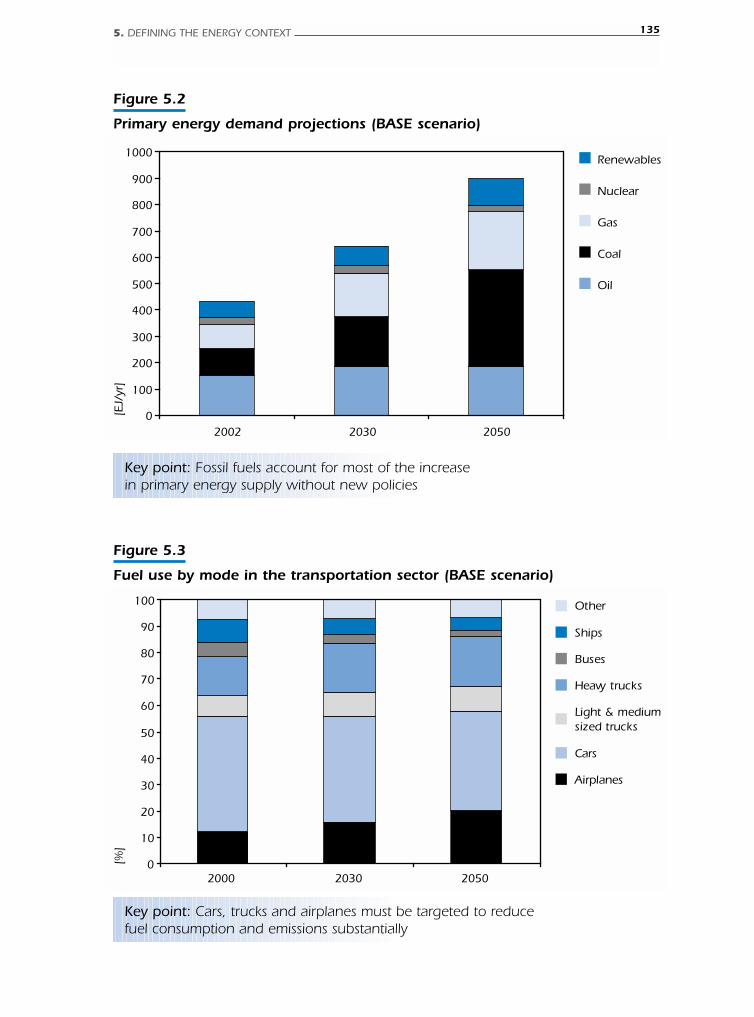
5. DEFINING THE ENERGY CONTEXT 135
Figure 5.2
Primary energy demand projections (BASE scenario)[E
J/yr
]
Coal
Gas
Nuclear
Renewables
Oil
0
100
200
300
400
500
600
700
800
900
1000
2002 2030 2050
Key point: Fossil fuels account for most of the increasein primary energy supply without new policies
Figure 5.3
Fuel use by mode in the transportation sector (BASE scenario)
0
10
20
30
40
50
60
70
80
90
100
2000 2030 2050
Other
Ships
Buses
Heavy trucks
Light & medium sized trucks
Cars
Airplanes
[%]
Key point: Cars, trucks and airplanes must be targeted to reducefuel consumption and emissions substantially
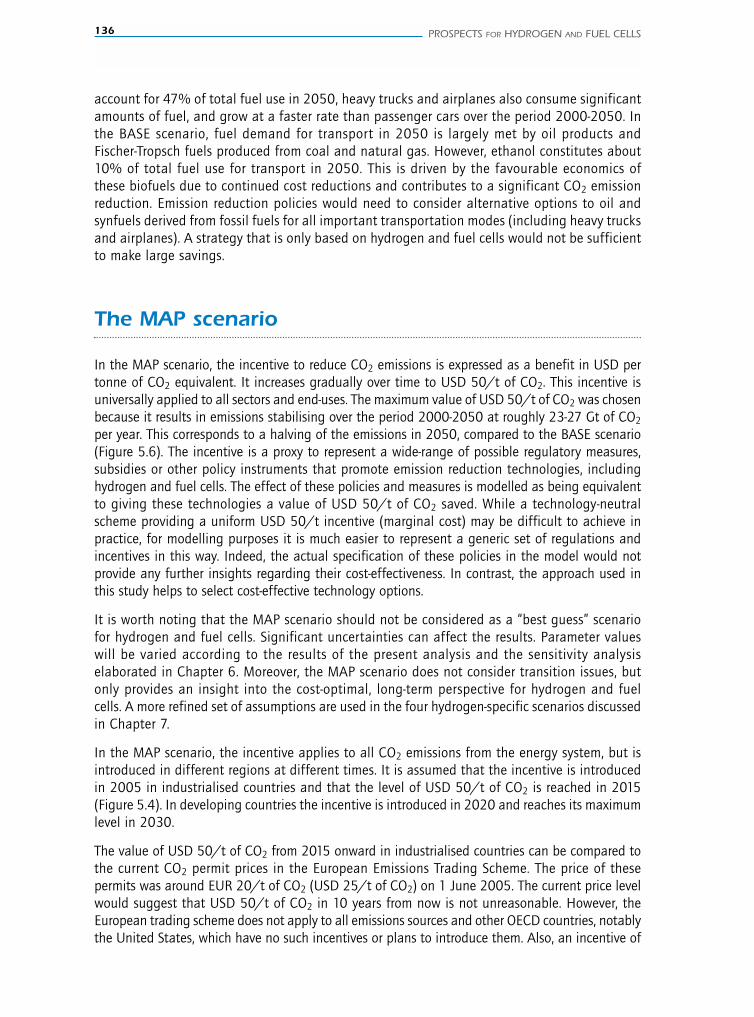
136 PROSPECTS FOR HYDROGEN AND FUEL CELLS
account for 47% of total fuel use in 2050, heavy trucks and airplanes also consume significantamounts of fuel, and grow at a faster rate than passenger cars over the period 2000-2050. Inthe BASE scenario, fuel demand for transport in 2050 is largely met by oil products andFischer-Tropsch fuels produced from coal and natural gas. However, ethanol constitutes about10% of total fuel use for transport in 2050. This is driven by the favourable economics ofthese biofuels due to continued cost reductions and contributes to a significant CO2 emissionreduction. Emission reduction policies would need to consider alternative options to oil andsynfuels derived from fossil fuels for all important transportation modes (including heavy trucksand airplanes). A strategy that is only based on hydrogen and fuel cells would not be sufficientto make large savings.
The MAP scenario
In the MAP scenario, the incentive to reduce CO2 emissions is expressed as a benefit in USD pertonne of CO2 equivalent. It increases gradually over time to USD 50/t of CO2. This incentive isuniversally applied to all sectors and end-uses. The maximum value of USD 50/t of CO2 was chosenbecause it results in emissions stabilising over the period 2000-2050 at roughly 23-27 Gt of CO2
per year. This corresponds to a halving of the emissions in 2050, compared to the BASE scenario(Figure 5.6). The incentive is a proxy to represent a wide-range of possible regulatory measures,subsidies or other policy instruments that promote emission reduction technologies, includinghydrogen and fuel cells. The effect of these policies and measures is modelled as being equivalentto giving these technologies a value of USD 50/t of CO2 saved. While a technology-neutralscheme providing a uniform USD 50/t incentive (marginal cost) may be difficult to achieve inpractice, for modelling purposes it is much easier to represent a generic set of regulations andincentives in this way. Indeed, the actual specification of these policies in the model would notprovide any further insights regarding their cost-effectiveness. In contrast, the approach used inthis study helps to select cost-effective technology options.
It is worth noting that the MAP scenario should not be considered as a “best guess” scenariofor hydrogen and fuel cells. Significant uncertainties can affect the results. Parameter valueswill be varied according to the results of the present analysis and the sensitivity analysiselaborated in Chapter 6. Moreover, the MAP scenario does not consider transition issues, butonly provides an insight into the cost-optimal, long-term perspective for hydrogen and fuelcells. A more refined set of assumptions are used in the four hydrogen-specific scenarios discussedin Chapter 7.
In the MAP scenario, the incentive applies to all CO2 emissions from the energy system, but isintroduced in different regions at different times. It is assumed that the incentive is introducedin 2005 in industrialised countries and that the level of USD 50/t of CO2 is reached in 2015(Figure 5.4). In developing countries the incentive is introduced in 2020 and reaches its maximumlevel in 2030.
The value of USD 50/t of CO2 from 2015 onward in industrialised countries can be compared tothe current CO2 permit prices in the European Emissions Trading Scheme. The price of thesepermits was around EUR 20/t of CO2 (USD 25/t of CO2) on 1 June 2005. The current price levelwould suggest that USD 50/t of CO2 in 10 years from now is not unreasonable. However, theEuropean trading scheme does not apply to all emissions sources and other OECD countries, notablythe United States, which have no such incentives or plans to introduce them. Also, an incentive of
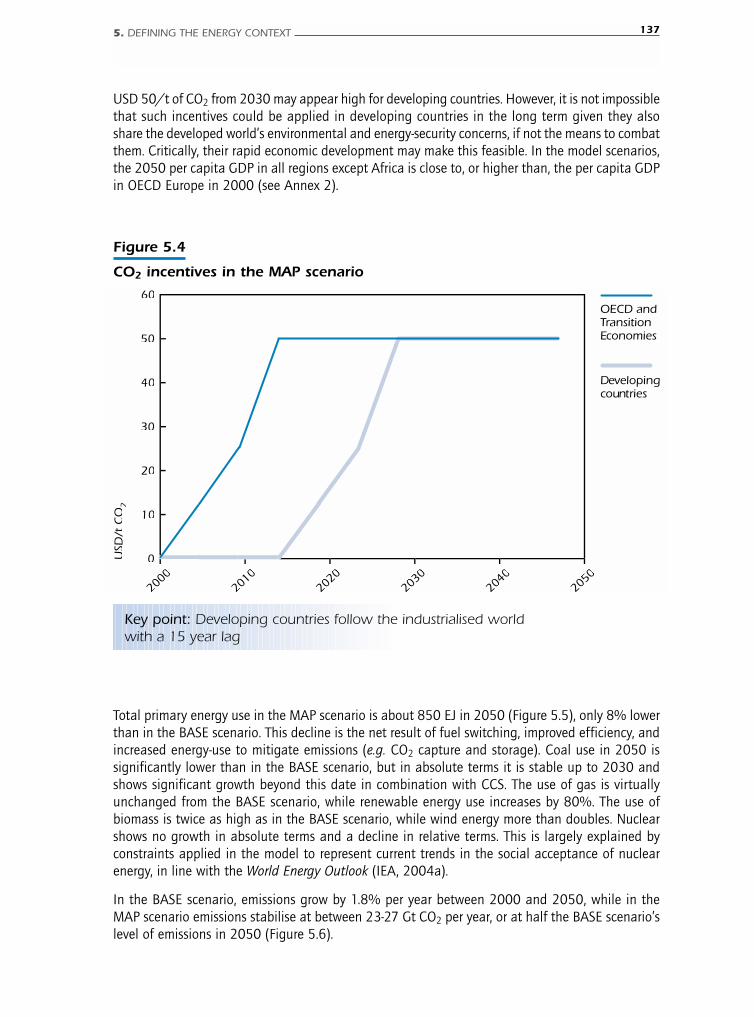
USD 50/t of CO2 from 2030 may appear high for developing countries. However, it is not impossiblethat such incentives could be applied in developing countries in the long term given they alsoshare the developed world’s environmental and energy-security concerns, if not the means to combatthem. Critically, their rapid economic development may make this feasible. In the model scenarios,the 2050 per capita GDP in all regions except Africa is close to, or higher than, the per capita GDPin OECD Europe in 2000 (see Annex 2).
5. DEFINING THE ENERGY CONTEXT 137
Figure 5.4
CO2 incentives in the MAP scenario
USD
/t C
O2
60
20
10
0
40
30
50
2010
2000
2020
2030
2040
2050
Developing countries
OECD and Transition Economies
Key point: Developing countries follow the industrialised worldwith a 15 year lag
Total primary energy use in the MAP scenario is about 850 EJ in 2050 (Figure 5.5), only 8% lowerthan in the BASE scenario. This decline is the net result of fuel switching, improved efficiency, andincreased energy-use to mitigate emissions (e.g. CO2 capture and storage). Coal use in 2050 issignificantly lower than in the BASE scenario, but in absolute terms it is stable up to 2030 andshows significant growth beyond this date in combination with CCS. The use of gas is virtuallyunchanged from the BASE scenario, while renewable energy use increases by 80%. The use ofbiomass is twice as high as in the BASE scenario, while wind energy more than doubles. Nuclearshows no growth in absolute terms and a decline in relative terms. This is largely explained byconstraints applied in the model to represent current trends in the social acceptance of nuclearenergy, in line with the World Energy Outlook (IEA, 2004a).
In the BASE scenario, emissions grow by 1.8% per year between 2000 and 2050, while in theMAP scenario emissions stabilise at between 23-27 Gt CO2 per year, or at half the BASE scenario’slevel of emissions in 2050 (Figure 5.6).
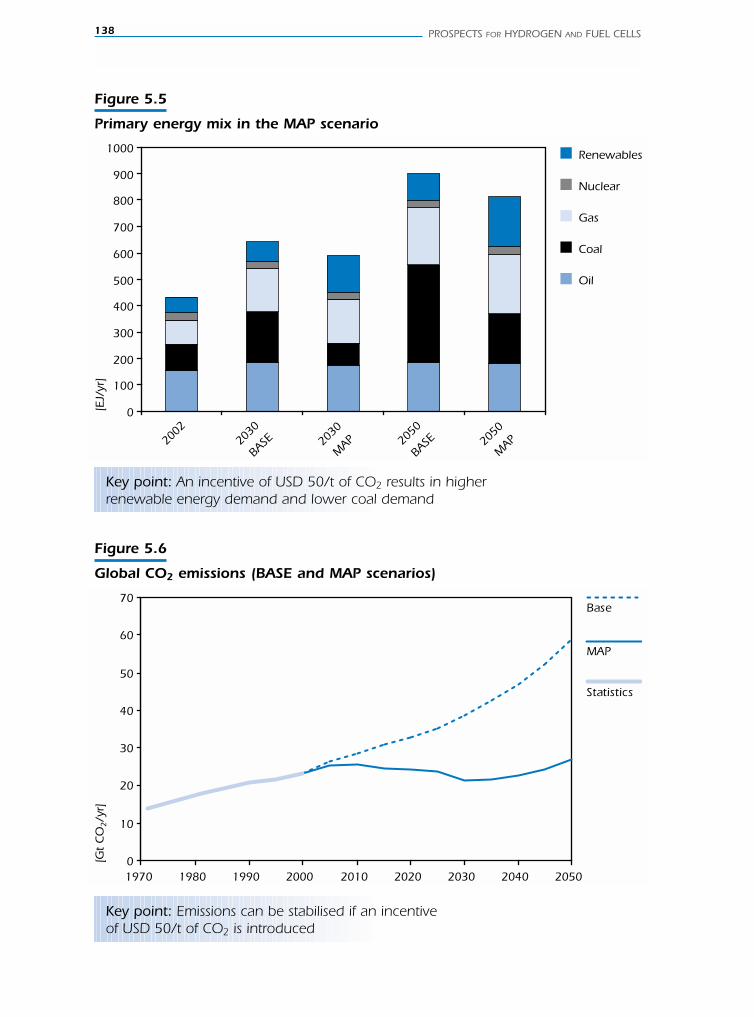
138 PROSPECTS FOR HYDROGEN AND FUEL CELLS
Figure 5.5
Primary energy mix in the MAP scenario
[EJ/
yr]
Coal
Gas
Nuclear
Renewables
Oil
0
100
200
300
400
500
600
700
800
900
1000
2002
2030
2030
2050
2050
BASEM
APBASE
MAP
Key point: An incentive of USD 50/t of CO2 results in higherrenewable energy demand and lower coal demand
Figure 5.6
Global CO2 emissions (BASE and MAP scenarios)
0
10
20
30
40
50
60
70
1970 1980 1990 2000 2010 2020 2030 2040 2050
[Gt
CO
2/y
r]
Base
MAP
Statistics
Key point: Emissions can be stabilised if an incentiveof USD 50/t of CO2 is introduced
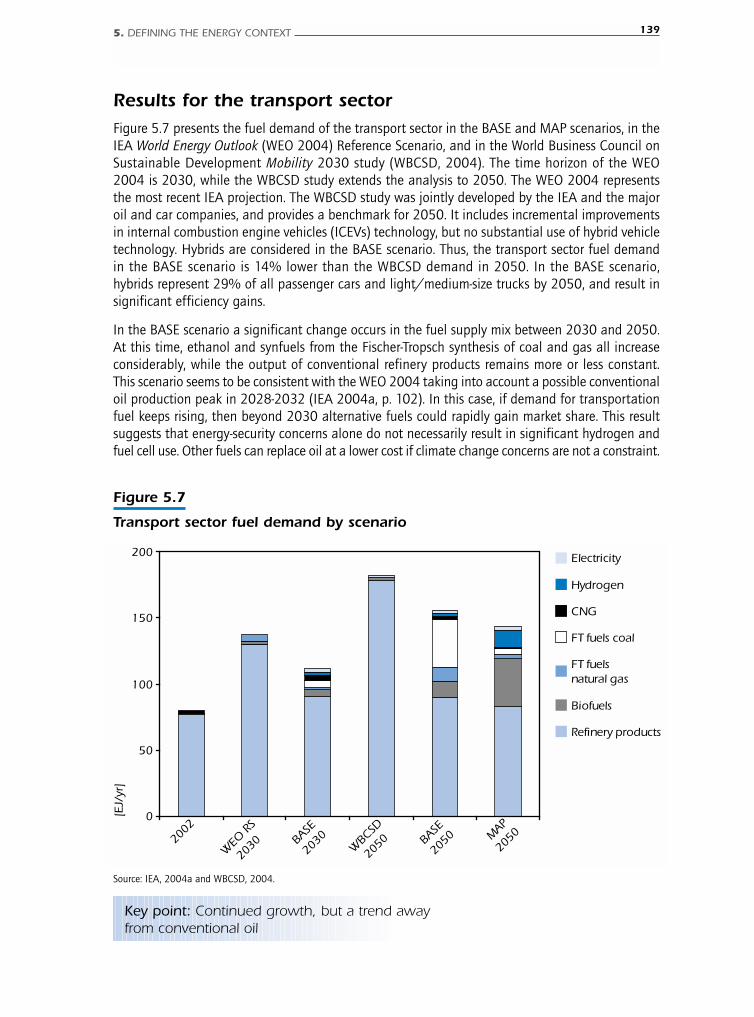
Results for the transport sectorFigure 5.7 presents the fuel demand of the transport sector in the BASE and MAP scenarios, in theIEA World Energy Outlook (WEO 2004) Reference Scenario, and in the World Business Council onSustainable Development Mobility 2030 study (WBCSD, 2004). The time horizon of the WEO2004 is 2030, while the WBCSD study extends the analysis to 2050. The WEO 2004 representsthe most recent IEA projection. The WBCSD study was jointly developed by the IEA and the majoroil and car companies, and provides a benchmark for 2050. It includes incremental improvementsin internal combustion engine vehicles (ICEVs) technology, but no substantial use of hybrid vehicletechnology. Hybrids are considered in the BASE scenario. Thus, the transport sector fuel demandin the BASE scenario is 14% lower than the WBCSD demand in 2050. In the BASE scenario,hybrids represent 29% of all passenger cars and light/medium-size trucks by 2050, and result insignificant efficiency gains.
In the BASE scenario a significant change occurs in the fuel supply mix between 2030 and 2050.At this time, ethanol and synfuels from the Fischer-Tropsch synthesis of coal and gas all increaseconsiderably, while the output of conventional refinery products remains more or less constant.This scenario seems to be consistent with the WEO 2004 taking into account a possible conventionaloil production peak in 2028-2032 (IEA 2004a, p. 102). In this case, if demand for transportationfuel keeps rising, then beyond 2030 alternative fuels could rapidly gain market share. This resultsuggests that energy-security concerns alone do not necessarily result in significant hydrogen andfuel cell use. Other fuels can replace oil at a lower cost if climate change concerns are not a constraint.
5. DEFINING THE ENERGY CONTEXT 139
Figure 5.7
Transport sector fuel demand by scenario
[EJ/
yr]
Electricity
Hydrogen
CNG
FT fuels coal
FT fuels natural gas
Biofuels
Refinery products
0
50
100
150
200
2002
WEO
RS
2030 BA
SE
2030
WBC
SD
2050 BA
SE
2050 M
AP
2050
Key point: Continued growth, but a trend awayfrom conventional oil
Source: IEA, 2004a and WBCSD, 2004.
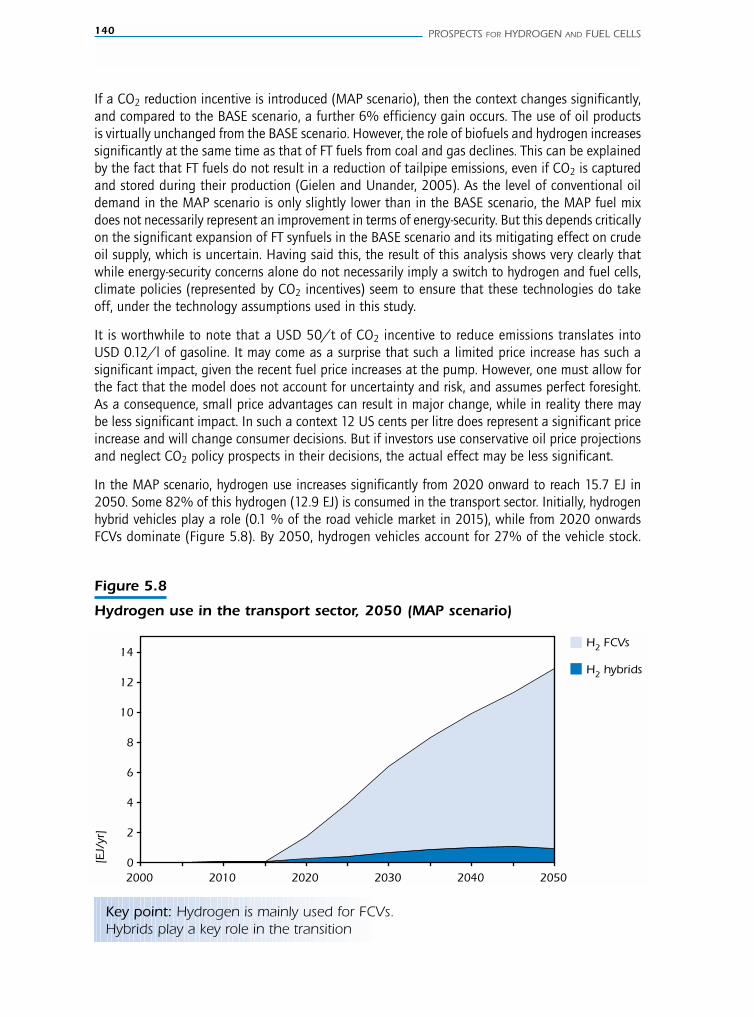
140 PROSPECTS FOR HYDROGEN AND FUEL CELLS
If a CO2 reduction incentive is introduced (MAP scenario), then the context changes significantly,and compared to the BASE scenario, a further 6% efficiency gain occurs. The use of oil productsis virtually unchanged from the BASE scenario. However, the role of biofuels and hydrogen increasessignificantly at the same time as that of FT fuels from coal and gas declines. This can be explainedby the fact that FT fuels do not result in a reduction of tailpipe emissions, even if CO2 is capturedand stored during their production (Gielen and Unander, 2005). As the level of conventional oildemand in the MAP scenario is only slightly lower than in the BASE scenario, the MAP fuel mixdoes not necessarily represent an improvement in terms of energy-security. But this depends criticallyon the significant expansion of FT synfuels in the BASE scenario and its mitigating effect on crudeoil supply, which is uncertain. Having said this, the result of this analysis shows very clearly thatwhile energy-security concerns alone do not necessarily imply a switch to hydrogen and fuel cells,climate policies (represented by CO2 incentives) seem to ensure that these technologies do takeoff, under the technology assumptions used in this study.
It is worthwhile to note that a USD 50/t of CO2 incentive to reduce emissions translates intoUSD 0.12/l of gasoline. It may come as a surprise that such a limited price increase has such asignificant impact, given the recent fuel price increases at the pump. However, one must allow forthe fact that the model does not account for uncertainty and risk, and assumes perfect foresight.As a consequence, small price advantages can result in major change, while in reality there maybe less significant impact. In such a context 12 US cents per litre does represent a significant priceincrease and will change consumer decisions. But if investors use conservative oil price projectionsand neglect CO2 policy prospects in their decisions, the actual effect may be less significant.
In the MAP scenario, hydrogen use increases significantly from 2020 onward to reach 15.7 EJ in2050. Some 82% of this hydrogen (12.9 EJ) is consumed in the transport sector. Initially, hydrogenhybrid vehicles play a role (0.1 % of the road vehicle market in 2015), while from 2020 onwardsFCVs dominate (Figure 5.8). By 2050, hydrogen vehicles account for 27% of the vehicle stock.
Figure 5.8
Hydrogen use in the transport sector, 2050 (MAP scenario)
0
2
4
6
8
10
12
14
2000 2010 2020 2030 2040 2050
[EJ/
yr]
H2 FCVs
H2 hybrids
Key point: Hydrogen is mainly used for FCVs.Hybrids play a key role in the transition
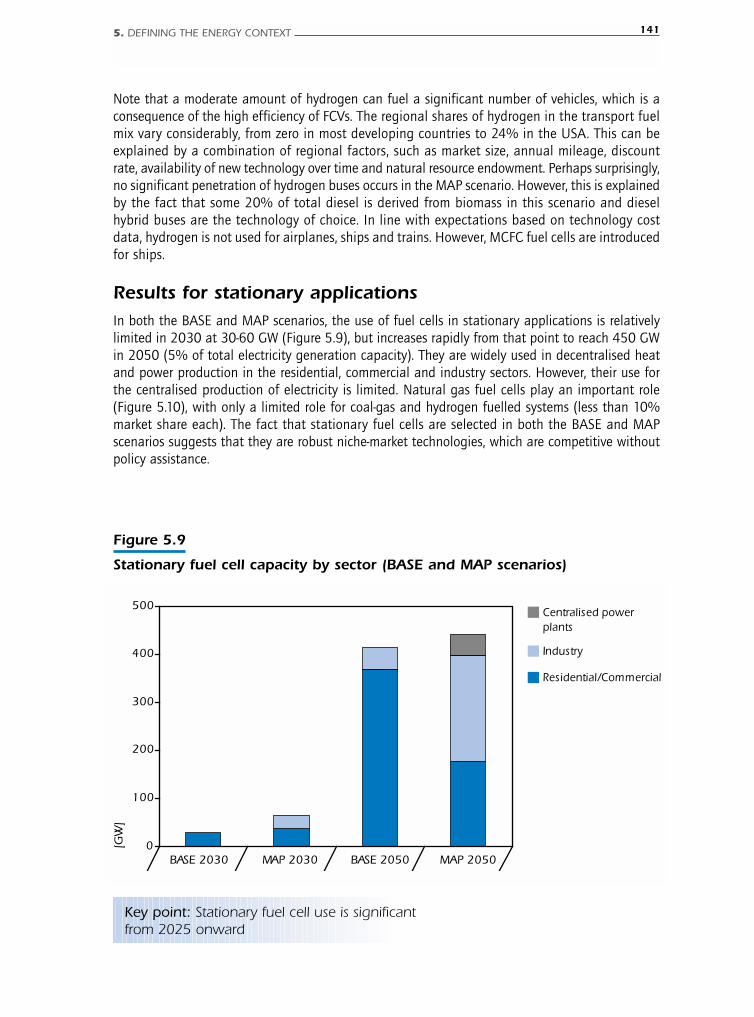
Note that a moderate amount of hydrogen can fuel a significant number of vehicles, which is aconsequence of the high efficiency of FCVs. The regional shares of hydrogen in the transport fuelmix vary considerably, from zero in most developing countries to 24% in the USA. This can beexplained by a combination of regional factors, such as market size, annual mileage, discountrate, availability of new technology over time and natural resource endowment. Perhaps surprisingly,no significant penetration of hydrogen buses occurs in the MAP scenario. However, this is explainedby the fact that some 20% of total diesel is derived from biomass in this scenario and dieselhybrid buses are the technology of choice. In line with expectations based on technology costdata, hydrogen is not used for airplanes, ships and trains. However, MCFC fuel cells are introducedfor ships.
Results for stationary applications In both the BASE and MAP scenarios, the use of fuel cells in stationary applications is relativelylimited in 2030 at 30-60 GW (Figure 5.9), but increases rapidly from that point to reach 450 GWin 2050 (5% of total electricity generation capacity). They are widely used in decentralised heatand power production in the residential, commercial and industry sectors. However, their use forthe centralised production of electricity is limited. Natural gas fuel cells play an important role(Figure 5.10), with only a limited role for coal-gas and hydrogen fuelled systems (less than 10%market share each). The fact that stationary fuel cells are selected in both the BASE and MAPscenarios suggests that they are robust niche-market technologies, which are competitive withoutpolicy assistance.
5. DEFINING THE ENERGY CONTEXT 141
Figure 5.9
Stationary fuel cell capacity by sector (BASE and MAP scenarios)
0
100
200
300
400
500
BASE 2030 MAP 2030 BASE 2050 MAP 2050
[GW
]
Centralised power plants
Industry
Residential/Commercial
Key point: Stationary fuel cell use is significantfrom 2025 onward
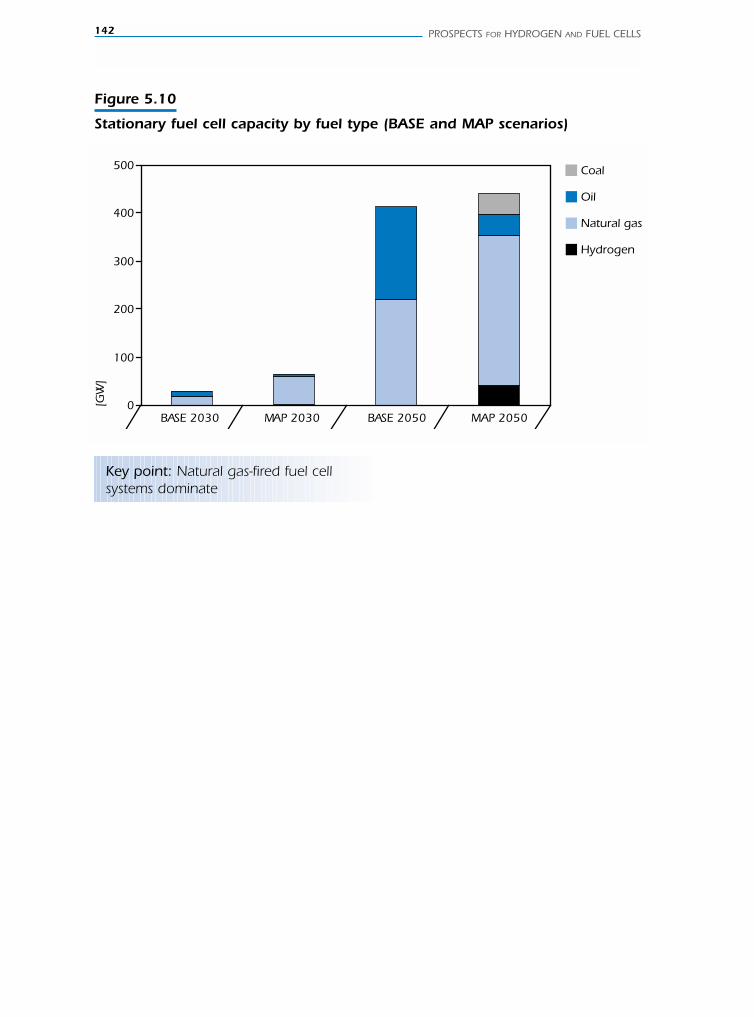
142 PROSPECTS FOR HYDROGEN AND FUEL CELLS
Figure 5.10
Stationary fuel cell capacity by fuel type (BASE and MAP scenarios)
BASE 2030 MAP 2030 BASE 2050 MAP 2050
[GW
]
Coal
Oil
Natural gas
Hydrogen
0
100
200
300
400
500
Key point: Natural gas-fired fuel cellsystems dominate
6. KEY DRIVERS FOR HYDROGEN AND FUEL CELLS: SENSITIVITY ANALYSIS 143
Chapter 6.KEY DRIVERS FOR HYDROGEN AND FUEL CELLS:SENSITIVITY ANALYSIS
H I G H L I G H T S
■ Hydrogen and fuel cells can play an important role in the future, but hydrogen demandis sensitive to a number of key parameters that are subject to significant uncertainties.These can be split into three areas: economic development and energy policies, competingfuels and energy technologies, and future development of hydrogen and fuel cells. Thesensitivity analysis suggests that the uptake of fuel cells and hydrogen appears to be moresensitive to downside risks than upside ones. This implies that policy is crucial to exploitingthe benefits of hydrogen and fuel cells.
■ A limited number of factors have a positive effect on the future demand for hydrogen,while most factors have a negative effect. Significantly, relative to the MAP scenario(15.7 EJ H2 in 2050), the sensitivity analysis indicates a maximum variation of ± 80%in hydrogen demand as a result of changes in the assumptions for individual parameters.A number of parameters have the potential to increase or decrease hydrogen demand by± 30%. The combined effects of various parameters (“scenarios”) may result in largervariations and are discussed in Chapter 7.
■ Factors with a major positive impact are: higher levels of the CO2 reduction incentive(i.e. more ambitious climate policies), favourable assumptions on FCV cost and efficiency,higher oil prices, low fuel taxes on hydrogen, development of nuclear energy and cheaperhydrogen production using nuclear heat, and timely development of infrastructure forcentralised hydrogen production and distribution.
■ Among factors that have a significant negative impact are: lower levels of the CO2 reductionincentive (i.e. less ambitious climate policies), adoption of energy-security policies in the absenceof a CO2 reduction incentive, missing the most ambitious targets for FCV cost reduction, theeffects of the “chicken-or-egg” transition problems, consumers using a higher “hurdle-rate” forbuying cars, and extending the time horizon of the analysis to 2070. In contrast, thecharacteristics of competing technologies, although important, have a smaller impact.
■ This analysis suggests the timely meeting of the most ambitious technology developmenttargets for hydrogen and fuel cells (improved performance and cost reductions) is criticalto their gaining an initial market share before other competing options take off. Delaysin technical progress result in a “lock-in” effect by other technologies that are closer tomarket introduction, which then grow at the expense of hydrogen.
■ Coal-based hydrogen and electricity cogeneration with CO2 capture and storage (CCS) isof particular importance to the cheap centralised production of hydrogen in the long term.Strong developments in nuclear and renewable energy may also favour hydrogen andfuel cells. But depending on developments, they also expose hydrogen to competition fromcheap and CO2-free electricity and biofuels, which are alternative options to reduce emissionsand enhance energy security.
144 PROSPECTS FOR HYDROGEN AND FUEL CELLS
Building on the MAP scenario discussed in Chapter 5, this sensitivity analysis aims to quantify theuncertainties that surround the model results. The uncertainties considered are the technical,economic and policy issues that can be analysed by ETP-type models. Other uncertainties, such asthose due to industrial strategies, investment risk and public acceptance of new technologies arebeyond the scope of this analysis. The sensitivity analysis indicates that a number of key parametershave a significant impact on the potential demand for hydrogen and fuel cells. How these parametersinteract to reinforce or offset one another is the subject of the scenario analysis presented in Chapter7. The sensitivity analysis in this chapter is crucial to understanding the conclusions of Chapter 7.
The key model inputs are split into government policies and economic parameters, hydrogen andfuel cell technology characteristics, and the characteristics of competing technologies and fuels.The goal of the sensitivity analysis is to quantify how sensitive the potential demand for hydrogenand fuel cells is to individual drivers in each of these three groupings. This will provide insightsinto the conditions that are needed for a successful transition to a hydrogen economy. The pre-selection of key parameters was provided by previous ETP studies (IEA, 2004c; Gielen and Podkanski,2005; Gielen et al., 2005) and by the results of the MAP scenario. Table 6.1 provides an overviewof the drivers that were pre-selected and their values in the MAP scenario, as well as the range ofvalues that were considered in the sensitivity analysis.
Government policies and socio-economic parameters
CO2 reduction incentives
In Chapter 5, the MAP scenario assumes a global incentive to reduce CO2 of USD 50/t of CO2.This was chosen as a reference value, because it enables emissions stabilisation. However, the futureof climate policies beyond the first commitment period of the Kyoto Protocol in 2008-2012 is unclear.Climate policies will depend on insights regarding the urgency needed based on emerging climatechanges and on the outcomes of difficult international negotiations. If, and when, developingcountries will act to curb their emissions is also unclear. Consequently, both the incentive level andits scope are matters that merit sensitivity analysis.
Two alternative incentive levels of USD 25/t of CO2 (the MAP25 scenario) and USD 100/t of CO2
(the MAP100 scenario) are examined in addition to the reference MAP scenario value ofUSD 50/t of CO2. The impact of halving the incentive level in the MAP25 scenario is less than a5 EJ hydrogen demand reduction (Figure 6.1). Hydrogen demand in the MAP25 and MAP scenariosfollows a similar path, but with a five year delay in the case of the lower incentive. The MAP100scenario roughly doubles the demand for hydrogen of the MAP scenario. These results confirmthat the potential for hydrogen to contribute to reducing emissions is high, but that it can be limitedby competition with cheaper options to reduce emissions and by policy measures that do notassign an appropriate value to avoiding emissions. However, many studies suggest that the damagecaused by a tonne of CO2 to the environment and human health should be valued at less thanUSD 50/t of CO2 and that a significant potential exists for reducing greenhouse gases throughland-use management at a cost well below USD 50/t of CO2.
In the MAP scenario, the CO2 emissions path is consistent with the stabilisation of CO2 in the atmosphereat a level of 550 ppm (Figure 6.2) during this century, based on the IPCC scenarios (IPCC, 2001).Under the MAP25 scenario, emissions would continue to rise and are not consistent with the stabilisationof CO2 concentration. The MAP100 scenario is the only scenario where global emissions declinesignificantly below 2000 levels. The MAP100 scenario is consistent with the stabilisation of CO2 in the
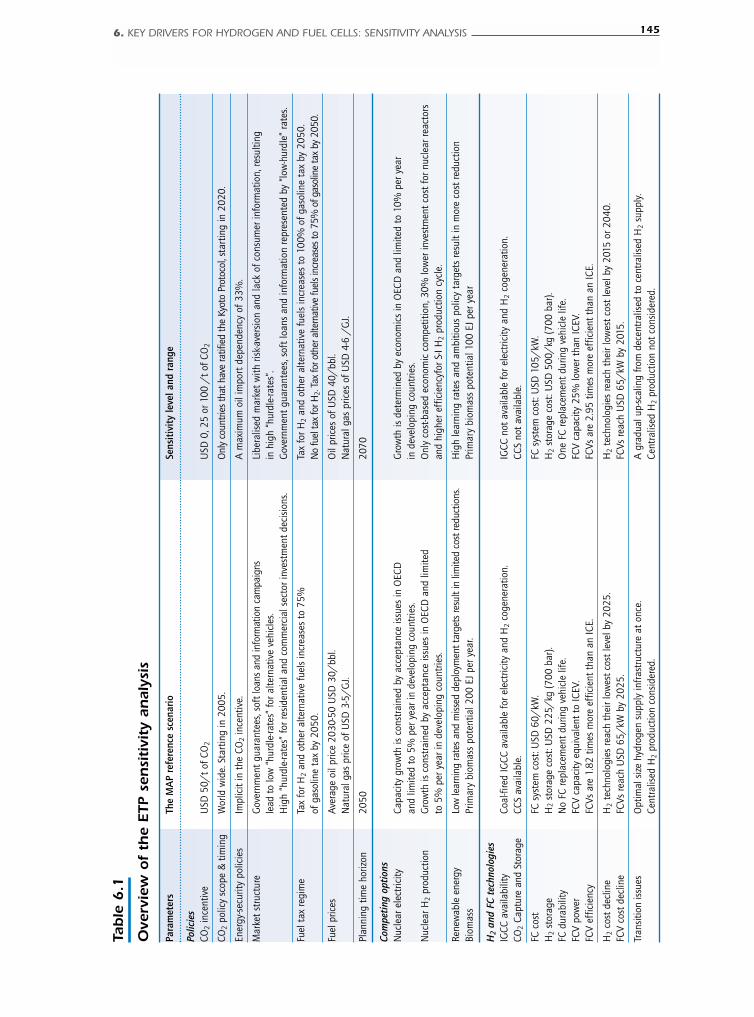
6. KEY DRIVERS FOR HYDROGEN AND FUEL CELLS: SENSITIVITY ANALYSIS 145
Table
6.1
Ove
rvie
w o
f th
e ETP
sen
siti
vity
an
alys
is
Para
met
ers
The
MA
P re
fere
nce
scen
ario
Se
nsit
ivit
y le
vel a
nd r
ange
Polic
ies
CO2
ince
ntiv
eU
SD 5
0/t
of C
O2
USD
0, 2
5 or
100
/t
of C
O2
CO2
polic
y sc
ope
& t
imin
gW
orld
wid
e. S
tart
ing
in 2
005.
Onl
y co
untri
es th
at h
ave
ratif
ied
the
Kyot
o Pr
otoc
ol, s
tart
ing
in 2
020.
Ener
gy-se
curit
y po
licie
sIm
plic
it in
the
CO
2in
cent
ive.
A m
axim
um o
il im
port
dep
ende
ncy
of 3
3%.
Mar
ket
stru
ctur
eG
over
nmen
t gu
aran
tees
, sof
t loa
ns a
nd in
form
atio
n ca
mpa
igns
Li
bera
lised
mar
ket
with
risk
-ave
rsio
n an
d la
ck o
f con
sum
er in
form
atio
n, re
sulti
ngle
ad t
o lo
w “
hurd
le-ra
tes”
for a
ltern
ativ
e ve
hicl
es.
in h
igh
“hur
dle-
rate
s”.
Hig
h “h
urdl
e-ra
tes”
for r
esid
entia
l and
com
mer
cial
sec
tor i
nves
tmen
t de
cisi
ons.
Gov
ernm
ent
guar
ante
es, s
oft
loan
s an
d in
form
atio
n re
pres
ente
d by
“lo
w-h
urdl
e” ra
tes.
Fuel
tax
regi
me
Tax
for H
2an
d ot
her a
ltern
ativ
e fu
els
incr
ease
s to
75%
Ta
x fo
r H2
and
othe
r alte
rnat
ive
fuel
s in
crea
ses
to 1
00%
of g
asol
ine
tax
by 2
050.
of g
asol
ine
tax
by 2
050.
No
fuel
tax
for H
2. Ta
x fo
r oth
er a
ltern
ative
fuel
s inc
reas
es to
75%
of g
asol
ine
tax
by 2
050.
Fuel
pric
esAv
erag
e oi
l pric
e 20
30-5
0 U
SD 3
0/bb
l.O
il pr
ices
of U
SD 4
0/bb
l.N
atur
al g
as p
rice
of U
SD 3
-5/
GJ.
Nat
ural
gas
pric
es o
f USD
4-6
/G
J.
Plan
ning
tim
e ho
rizon
2050
2070
Com
peti
ng o
ptio
nsN
ucle
ar e
lect
ricity
Capa
city
gro
wth
is c
onst
rain
ed b
y ac
cept
ance
issu
es in
OEC
DG
row
th is
det
erm
ined
by
econ
omic
s in
OEC
D a
nd li
mite
d to
10%
per
yea
ran
d lim
ited
to 5
% p
er y
ear i
n de
velo
ping
cou
ntrie
s.in
dev
elop
ing
coun
trie
s.N
ucle
ar H
2pr
oduc
tion
Gro
wth
is c
onst
rain
ed b
y ac
cept
ance
issu
es in
OEC
D a
nd li
mite
d O
nly
cost
-bas
ed e
cono
mic
com
petit
ion,
30%
low
er in
vest
men
t co
st fo
r nuc
lear
reac
tors
to 5
% p
er y
ear i
n de
velo
ping
cou
ntrie
s.an
d hi
gher
eff
icie
ncyf
or S
-I H
2pr
oduc
tion
cycl
e.
Rene
wab
le e
nerg
yLo
w le
arni
ng ra
tes
and
miss
ed d
eplo
ymen
t tar
gets
resu
lt in
lim
ited
cost
redu
ctio
ns.
Hig
h le
arni
ng ra
tes
and
ambi
tious
pol
icy
targ
ets
resu
lt in
mor
e co
st re
duct
ion
Biom
ass
Prim
ary
biom
ass
pote
ntia
l 200
EJ
per y
ear.
Prim
ary
biom
ass
pote
ntia
l 100
EJ
per y
ear
H2
and
FC t
echn
olog
ies
IGCC
ava
ilabi
lity
Coal
-fire
d IG
CC a
vaila
ble
for e
lect
ricity
and
H2
coge
nera
tion.
IGCC
not
ava
ilabl
e fo
r ele
ctric
ity a
nd H
2co
gene
ratio
n.CO
2Ca
ptur
e an
d St
orag
eCC
S av
aila
ble.
CCS
not
avai
labl
e.
FC c
ost
FC s
yste
m c
ost:
USD
60/
kW.
FC s
yste
m c
ost:
USD
105
/kW
.H
2st
orag
eH
2st
orag
e co
st: U
SD 2
25/
kg (7
00 b
ar).
H2
stor
age
cost
: USD
500
/kg
(700
bar
).FC
dur
abili
tyN
o FC
repl
acem
ent
durin
g ve
hicl
e lif
e.
One
FC
repl
acem
ent
durin
g ve
hicl
e lif
e.FC
V po
wer
FC
V ca
paci
ty e
quiv
alen
t to
ICEV
.FC
V ca
paci
ty 2
5% lo
wer
tha
n IC
EV.
FCV
effic
ienc
y FC
Vs a
re 1
.82
times
mor
e ef
ficie
nt t
han
an IC
E.
FCVs
are
2.9
5 tim
es m
ore
effic
ient
tha
n an
ICE.
H2
cost
dec
line
H2
tech
nolo
gies
reac
h th
eir l
owes
t co
st le
vel b
y 20
25.
H2
tech
nolo
gies
reac
h th
eir l
owes
t co
st le
vel b
y 20
15 o
r 204
0.FC
V co
st d
eclin
eFC
Vs re
ach
USD
65/
kW b
y 20
25.
FCVs
reac
h U
SD 6
5/kW
by
2015
.
Tran
sitio
n is
sues
Opt
imal
siz
e hy
drog
en s
uppl
y in
frast
ruct
ure
at o
nce.
A g
radu
al u
p-sc
alin
g fro
m d
ecen
tral
ised
to
cent
ralis
ed H
2su
pply
. Ce
ntra
lised
H2
prod
uctio
n co
nsid
ered
.Ce
ntra
lised
H2
prod
uctio
n no
t co
nsid
ered
.
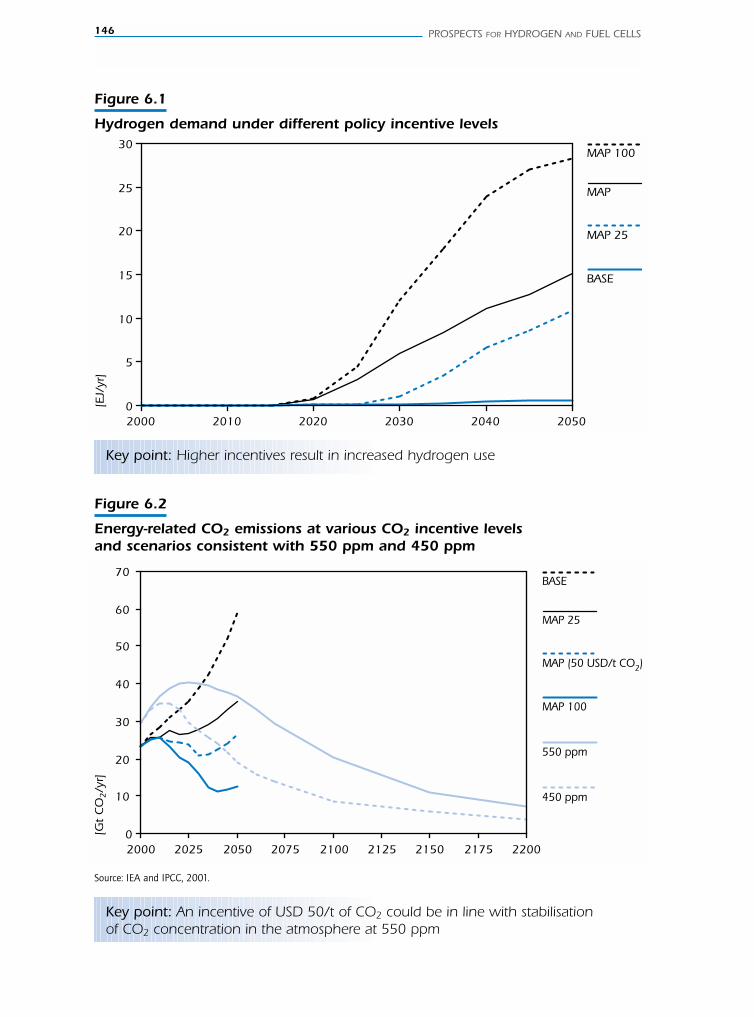
146 PROSPECTS FOR HYDROGEN AND FUEL CELLS
Figure 6.1
Hydrogen demand under different policy incentive levels
MAP 100
MAP
MAP 25
BASE
0
5
10
15
20
25
30
2000 2010 2020 2030 2040 2050
[EJ/
yr]
Key point: Higher incentives result in increased hydrogen use
Figure 6.2
Energy-related CO2 emissions at various CO2 incentive levelsand scenarios consistent with 550 ppm and 450 ppm
MAP (50 USD/t CO2)
BASE
MAP 25
MAP 100
550 ppm
450 ppm
0
10
20
30
40
50
60
70
2000 2025 2050 2075 2100 2125 2150 2175 2200
[Gt
CO
2/y
r]
Key point: An incentive of USD 50/t of CO2 could be in line with stabilisationof CO2 concentration in the atmosphere at 550 ppm
Source: IEA and IPCC, 2001.
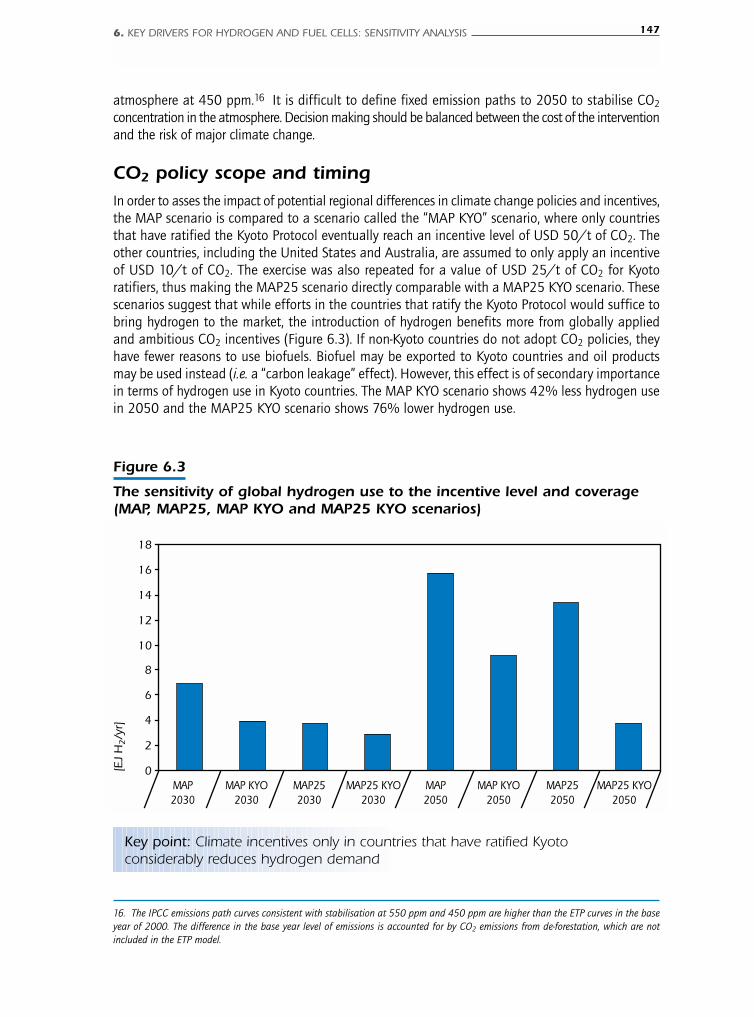
6. KEY DRIVERS FOR HYDROGEN AND FUEL CELLS: SENSITIVITY ANALYSIS 147
atmosphere at 450 ppm.16 It is difficult to define fixed emission paths to 2050 to stabilise CO2
concentration in the atmosphere. Decision making should be balanced between the cost of the interventionand the risk of major climate change.
CO2 policy scope and timingIn order to asses the impact of potential regional differences in climate change policies and incentives,the MAP scenario is compared to a scenario called the “MAP KYO” scenario, where only countriesthat have ratified the Kyoto Protocol eventually reach an incentive level of USD 50/t of CO2. Theother countries, including the United States and Australia, are assumed to only apply an incentiveof USD 10/t of CO2. The exercise was also repeated for a value of USD 25/t of CO2 for Kyotoratifiers, thus making the MAP25 scenario directly comparable with a MAP25 KYO scenario. Thesescenarios suggest that while efforts in the countries that ratify the Kyoto Protocol would suffice tobring hydrogen to the market, the introduction of hydrogen benefits more from globally appliedand ambitious CO2 incentives (Figure 6.3). If non-Kyoto countries do not adopt CO2 policies, theyhave fewer reasons to use biofuels. Biofuel may be exported to Kyoto countries and oil productsmay be used instead (i.e. a “carbon leakage” effect). However, this effect is of secondary importancein terms of hydrogen use in Kyoto countries. The MAP KYO scenario shows 42% less hydrogen usein 2050 and the MAP25 KYO scenario shows 76% lower hydrogen use.
16. The IPCC emissions path curves consistent with stabilisation at 550 ppm and 450 ppm are higher than the ETP curves in the baseyear of 2000. The difference in the base year level of emissions is accounted for by CO2 emissions from de-forestation, which are notincluded in the ETP model.
Figure 6.3
The sensitivity of global hydrogen use to the incentive level and coverage(MAP, MAP25, MAP KYO and MAP25 KYO scenarios)
0
2
4
6
8
10
12
14
16
18
MAP 2030
MAP KYO 2030
MAP25 2030
MAP25 KYO 2030
MAP 2050
MAP KYO 2050
MAP25 2050
MAP25 KYO 2050
[EJ
H2/y
r]
Key point: Climate incentives only in countries that have ratified Kyotoconsiderably reduces hydrogen demand
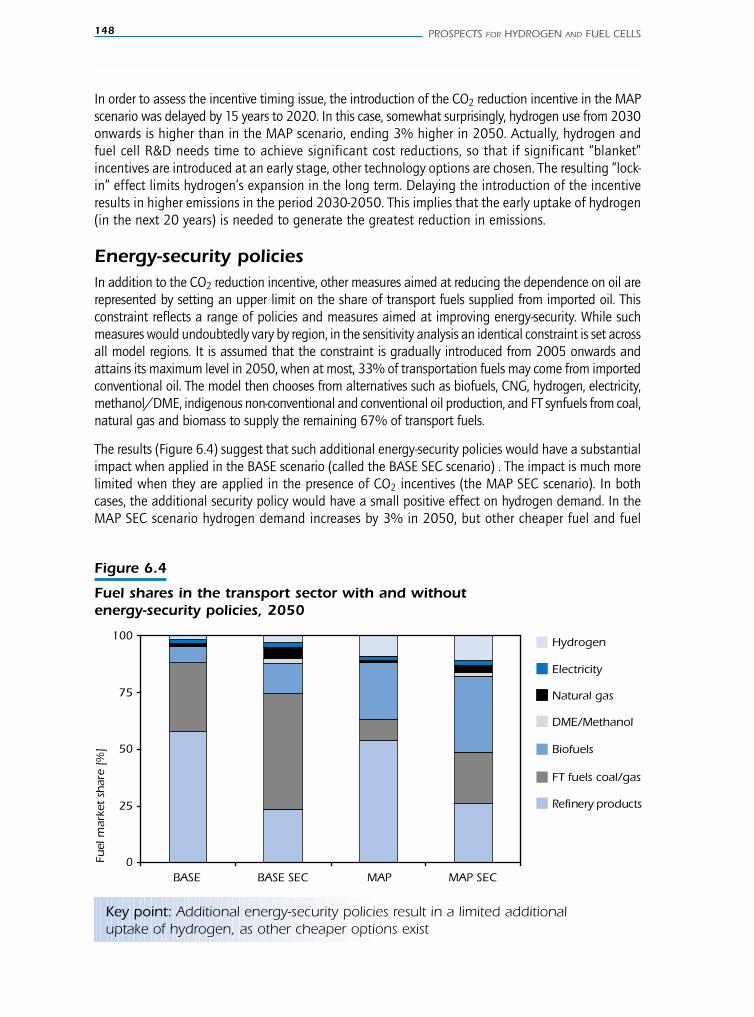
148 PROSPECTS FOR HYDROGEN AND FUEL CELLS
In order to assess the incentive timing issue, the introduction of the CO2 reduction incentive in the MAPscenario was delayed by 15 years to 2020. In this case, somewhat surprisingly, hydrogen use from 2030onwards is higher than in the MAP scenario, ending 3% higher in 2050. Actually, hydrogen andfuel cell R&D needs time to achieve significant cost reductions, so that if significant “blanket”incentives are introduced at an early stage, other technology options are chosen. The resulting “lock-in” effect limits hydrogen’s expansion in the long term. Delaying the introduction of the incentiveresults in higher emissions in the period 2030-2050. This implies that the early uptake of hydrogen(in the next 20 years) is needed to generate the greatest reduction in emissions.
Energy-security policiesIn addition to the CO2 reduction incentive, other measures aimed at reducing the dependence on oil arerepresented by setting an upper limit on the share of transport fuels supplied from imported oil. Thisconstraint reflects a range of policies and measures aimed at improving energy-security. While suchmeasures would undoubtedly vary by region, in the sensitivity analysis an identical constraint is set acrossall model regions. It is assumed that the constraint is gradually introduced from 2005 onwards andattains its maximum level in 2050, when at most, 33% of transportation fuels may come from importedconventional oil. The model then chooses from alternatives such as biofuels, CNG, hydrogen, electricity,methanol/DME, indigenous non-conventional and conventional oil production, and FT synfuels from coal,natural gas and biomass to supply the remaining 67% of transport fuels.
The results (Figure 6.4) suggest that such additional energy-security policies would have a substantialimpact when applied in the BASE scenario (called the BASE SEC scenario) . The impact is much morelimited when they are applied in the presence of CO2 incentives (the MAP SEC scenario). In bothcases, the additional security policy would have a small positive effect on hydrogen demand. In theMAP SEC scenario hydrogen demand increases by 3% in 2050, but other cheaper fuel and fuel
Figure 6.4
Fuel shares in the transport sector with and withoutenergy-security policies, 2050
Hydrogen
Electricity
Natural gas
DME/Methanol
Biofuels
FT fuels coal/gas
Refinery products
0
25
50
75
100
BASE BASE SEC MAP MAP SEC
Fuel
mar
ket
shar
e [%
]
Key point: Additional energy-security policies result in a limited additionaluptake of hydrogen, as other cheaper options exist
efficiency options are selected to meet the lion’s share of the requirements of the security goal. Notably,additional synfuels from biomass, gas and coal are introduced. The result confirms that energy-security policies alone do not necessarily result in a substantial switch to hydrogen, because othercheaper options exist to achieve energy security and diversification. However, increased use of FTfuels may result in substantially higher well-to-wheel CO2 emissions.
Market structureThe MAP scenario assumes consumers’ discount rates for investment in the transport sector thatrange from 3% per annum in Japan to 9.7% per annum in the FSU (in real terms). Although, thisis consistent with capital borrowing by companies, it is a model simplification. Consumers generallyface higher costs of borrowing than do companies. Certain consumers look at the full life-cyclecost, while others focus on the investment cost only. The latter case is equivalent to an infinitelyhigh discount rate. This is often reflected in economic studies through a so-called “hurdle-rate”. Toreflect the uncertainty in what discount rates consumers use, an alternative scenario assumes that“hurdle-rates” add 9% to the basic discount rate in the transport sector, thus giving a range of12% to 18.7% per annum. This scenario of higher discount rates in the transport sector reduceshydrogen use significantly, from 15.7 EJ in the MAP scenario to 10.9 EJ in 2050.
For stationary fuel cells, the assumed discount rate differs by sector. Relatively low discount rateshave been applied in the electricity sector (3% to 9.7% per annum) and in the industrial sector(7.5% to 14.3%). The discount rate in the residential and commercial sectors ranges from 12% to28.2%. In the sensitivity analysis, this discount rate has been reduced to the same level as for theelectricity sector (MAP LDR scenario). This resulted in a 33% increase in fuel cell capacity. The resultsuggests that the high cost of fuel cell systems can be a significant barrier for consumers. In fact,the problem may be even more severe if the owner and the tenant are different persons. Theowner does not reap the benefits of efficiency measures and has no incentive to invest in capital-intensive equipment such as fuel cells.
Fuel tax regimeIn the MAP scenario, fuel taxes for alternative fuels gradually increase from zero in 2005 to 75%of the gasoline tax in 2050. In the sensitivity analysis, the tax is assumed to rise over time to100% of the gasoline tax in 2050. This translates into a 6% increase in hydrogen demand, becausethe tax increase reduces the competitiveness other alternative fuels more than for hydrogen, dueto the higher fuel efficiency of FCVs. As a consequence, higher taxes result in a comparative advantagefor hydrogen.
In a second sensitivity analysis hydrogen was exempt from all taxes. This model run resulted in 38%higher hydrogen demand in 2050 than in the MAP scenario and represents a scenario wherehydrogen is particularly favoured by public policies. The results suggest that tax exemption wouldbe particularly effective in high-tax regions such as Japan and Europe, where hydrogen use wouldincrease three-fold. This instrument would be less effective in other regions with much lower fueltaxes. However, the impact of such a policy on government revenues would be important.
Fuel pricesFuel prices are a key factor in determining the choice of energy technologies used and, as a result,the future levels of different emissions. While fuel prices may experience large fluctuations in theshort term, the ETP model analysis is more concerned with average prices and long-term trends. Itdoes not attempt to model the impact of short-term energy price volatility.
6. KEY DRIVERS FOR HYDROGEN AND FUEL CELLS: SENSITIVITY ANALYSIS 149
150 PROSPECTS FOR HYDROGEN AND FUEL CELLS
Oil prices in the BASE and MAP scenarios are in line with the long-term projections in the IEA WEO2004, in which they rise steadily to reach USD 29/bbl (real 2000 prices) in 2030, at which levelthey stabilise. However, given the uncertainties regarding long-term supply availability and demand,different long-term oil price scenarios have been considered. The impact of higher prices has beenassessed in the sensitivity analysis by varying long-term oil and gas prices. A Middle East oil supplycurve twice as steep as in the MAP scenario has been considered, which results in a long-termaverage oil price of USD 35/bbl in 2030 and up to USD 40/bbl in 2050 (real 2000 prices).17
The gas price has been varied accordingly. The higher oil and gas price assumptions are combinedwith limited expansion potential for non-conventional crude, FT-synfuels and other alternative fuels.18
Only hydrogen was not constrained. This could reflect a situation where the uncertainty concerningfuture oil prices limits investment in capital-intensive synfuel production facilities, at a time whengovernments are actively supporting the development of a hydrogen economy.
Under these assumptions, hydrogen demand is 4.8 EJ (30%) higher than in the MAP scenarioin 2050. This indicates an important sensitivity to fossil fuel prices, assuming the limited expansionpotential of other alternative fuels. This model run represents a scenario where the economic,technical, environmental and security factors are favourable to hydrogen, but where governmentrevenues are not compromised, as in the preceding sensitivity analysis on fuel tax exemptions.While fossil fuel prices themselves are not under the control of energy policy makers, higher taxeson fossil fuels could have a similar effect. However, the political feasibility of substantially highertaxes is also uncertain.
Planning time horizonThe ETP model’s time horizon is from 2000 to 2050. Developments that occur after this date arenot taken into account in the optimal investment path calculated by the model. Such “short-sightedness”can affect the results. For example, if oil production declines further after 2050, sensible energypolicies would be taking such depletion into account before 2050, because a transition to a newenergy system can take decades. Also, if post-2050 technology learning benefits are expected to besignificant for a technology or fuel, such expectations might result in the increased use of thesetechnologies or fuels in the period 2000-2050. This might have the impact of reducing or increasingthe potential market for hydrogen and other options. To analyse such effects, the time horizon ofthe model has been extended to 2070, while leaving the other parameters at their 2050 levels.
The somewhat surprising result is a 43% decline in hydrogen demand in 2050 relative to the MAPscenario. The main reason is that oil prices in the 2020-2050 period are much higher (20-50%)if a 2070 time horizon is used. The model to some extent “sees” the long-term oil availabilityproblem beyond 2050, and the higher oil prices in the period 2020-2050 facilitate earlier andwidespread introduction of synfuels at a time when hydrogen and FCVs are still relatively costly.Once a large investment has been made, hydrogen has to “wait” for the next investment cycle(“lock-in effect”). The result suggests that, given the current state of hydrogen and fuel celltechnology, a very rapid increase of oil prices would not benefit hydrogen, unless rapid technologyadvances takes place at the same time.
17. These values represent a 5-year average of high and low prices. During the second oil shock at the beginning of the 1980s oil reacheda price level of more than USD 60/bbl (real 2000 prices), but in the second half of the decade the price dropped to about USD 20/bbl.18. Previous analysis showed that only different OPEC behaviour does not result in a substantial price increase, as more synfuels fromcoal and gas are introduced. These fuels would become cost-effective at oil price levels between USD 30/bbl and USD 40/bbl (Gielenand Unander, 2005). The key uncertainty is how fast the production of these alternatives can expand. Continued uncertainty concerningoil price prospects may deter investments in capital-intensive synfuel production facilities.

If the oil price would have been kept constant, it is likely that this sensitivity analysis would haveresulted in higher hydrogen use.
Competing technologies and fuels
Renewables
The future of hydrogen and fuel cells also depends on the development of competing technologyoptions such as renewables. A key question for renewable energy relates to its potential availabilityand cost in the future. The cost of renewables is determined by the capital cost, as the primaryenergy source is usually free (wind, sun, etc.). Future capital costs are a function of current capitalcosts and technology learning (i.e. R&D learning and “learning-by-doing” in commercial settings).Future cost levels are uncertain due to the uncertainty about learning rates. Factors that affect theaccuracy of the cost estimates are little or no cost history (e.g. PV and fuel cells), highly site-specific installation costs (e.g. hydropower, biomass and geothermal), and market dynamics thatobscure the relation between capacity and investment cost (e.g. PV and CCGTs). The learning ratesused in this study are in line with the range found in the literature (Cody and Tiedje, 1997; Neij,1997; Harmon, 2000; IEA, 2000; Junginger et al., 2005).
In the MAP scenario, investment cost reductions for renewables are based on the cumulativecapacity that follows from the deployment path in the WEO 2004 Reference Scenario, in combinationwith technology learning rates. Investment costs decline by a fixed factor for each doubling ofthe installed cumulative capacity (IEA, 2000). In the sensitivity analysis (MAPREN scenario), currentand prospective policy initiatives for the deployment of renewables are added to the ETP modelbased on the WEO 2004 Alternative Scenario up to 2030. Beyond 2030, actual investments aredetermined by the model based on their cost. The sensitivity of hydrogen to the development ofrenewables has also been looked at in two increasingly optimistic scenarios, where cost reductionsare achieved through even higher market uptake. The potential costs and availability of renewableenergy need to be considered in tandem. Although cheap renewable options exist today, theirpotential in terms of energy supply is limited. However, renewables’ contribution could be increasedif more expensive renewable options achieve cost reductions.
The result of these assumptions is that the cost of renewable electricity generation declines fasterover time and hydrogen demand is 5% less in 2050 than in the MAP scenario due to greaterelectricity generation from renewables. Much of this reduction is due to lowered capacity of FutureGen-type coal-fired IGCC power plants that cogenerate electricity and hydrogen, since the use of renewablesexpands at the expense of coal.
Another scenario explores in more detail the role of biomass and biofuels. Primary biomass in theMAP scenario increases from 0 to 200 EJ per annum in 2050, while in this sensitivity analysis thebiomass availability rises to only 100 EJ per annum. The reduced potential for biofuels translatesinto an increased demand for hydrogen of 9% in 2050. The lower availability of biofuels is alsobalanced by increased use of other synfuels and refinery products. It is important to note thatbiofuels and hydrogen are not strictly alternative options, as they do not compete head-to-head.Hydrogen does not directly compete with diesel in the medium and heavy freight sector, shipping,and aviation sectors. Synthetic diesel from biomass is a better CO2-free alternative in this marketsegment. A further result of the analysis is that biofuels production is a higher value use of biomassthan electricity production (Figure 6.5). This is confirmed in the MAP scenario with a 200 EJ primarybiomass potential, as well as in the sensitivity analysis with a 100 EJ biomass potential in 2050.
6. KEY DRIVERS FOR HYDROGEN AND FUEL CELLS: SENSITIVITY ANALYSIS 151
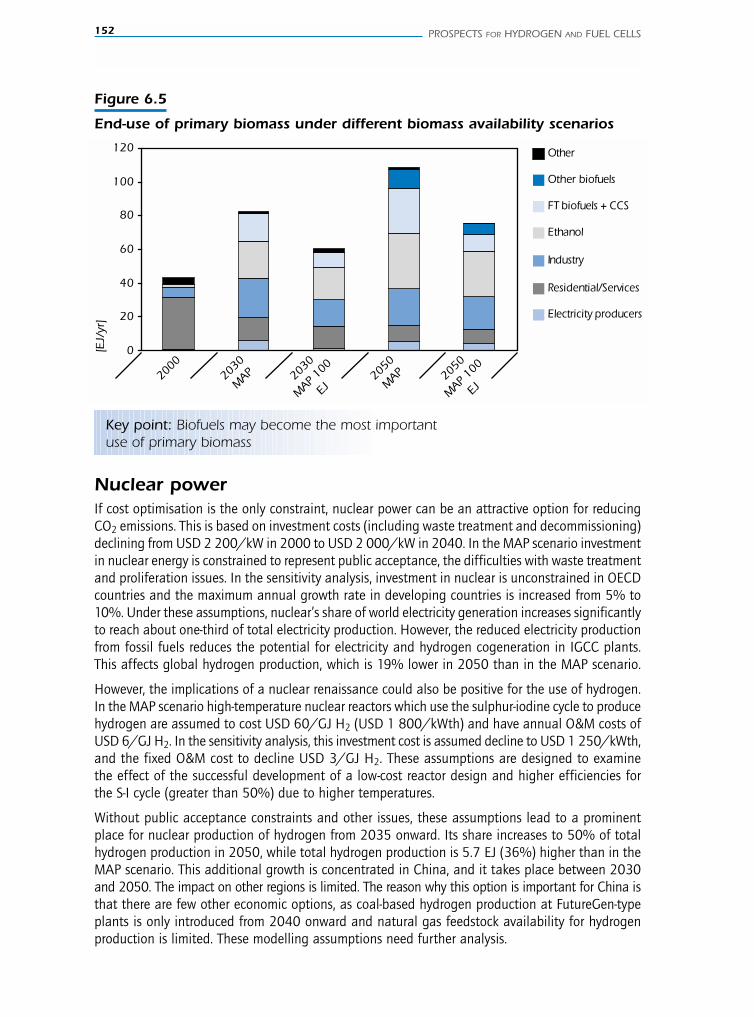
Nuclear powerIf cost optimisation is the only constraint, nuclear power can be an attractive option for reducingCO2 emissions. This is based on investment costs (including waste treatment and decommissioning)declining from USD 2 200/kW in 2000 to USD 2 000/kW in 2040. In the MAP scenario investmentin nuclear energy is constrained to represent public acceptance, the difficulties with waste treatmentand proliferation issues. In the sensitivity analysis, investment in nuclear is unconstrained in OECDcountries and the maximum annual growth rate in developing countries is increased from 5% to10%. Under these assumptions, nuclear’s share of world electricity generation increases significantlyto reach about one-third of total electricity production. However, the reduced electricity productionfrom fossil fuels reduces the potential for electricity and hydrogen cogeneration in IGCC plants.This affects global hydrogen production, which is 19% lower in 2050 than in the MAP scenario.
However, the implications of a nuclear renaissance could also be positive for the use of hydrogen.In the MAP scenario high-temperature nuclear reactors which use the sulphur-iodine cycle to producehydrogen are assumed to cost USD 60/GJ H2 (USD 1 800/kWth) and have annual O&M costs ofUSD 6/GJ H2. In the sensitivity analysis, this investment cost is assumed decline to USD 1 250/kWth,and the fixed O&M cost to decline USD 3/GJ H2. These assumptions are designed to examinethe effect of the successful development of a low-cost reactor design and higher efficiencies forthe S-I cycle (greater than 50%) due to higher temperatures.
Without public acceptance constraints and other issues, these assumptions lead to a prominentplace for nuclear production of hydrogen from 2035 onward. Its share increases to 50% of totalhydrogen production in 2050, while total hydrogen production is 5.7 EJ (36%) higher than in theMAP scenario. This additional growth is concentrated in China, and it takes place between 2030and 2050. The impact on other regions is limited. The reason why this option is important for China isthat there are few other economic options, as coal-based hydrogen production at FutureGen-typeplants is only introduced from 2040 onward and natural gas feedstock availability for hydrogenproduction is limited. These modelling assumptions need further analysis.
152 PROSPECTS FOR HYDROGEN AND FUEL CELLS
Figure 6.5
End-use of primary biomass under different biomass availability scenarios
0
20
40
60
80
100
120
2030
MAP20
0020
30
MAP
100
EJ20
50
MAP 20
50
MAP
100
EJ
[EJ/
yr]
Other
Other biofuels
FT biofuels + CCS
Ethanol
Industry
Residential/Services
Electricity producers
Key point: Biofuels may become the most importantuse of primary biomass

Hydrogen and fuel cell technologies
Technology availabilityThe projected contribution of hydrogen to energy supplies is, to a large extent, based on technologiesthat are not yet commercially proven. If only proven technologies are considered, the role of hydrogenmight be significantly less. The goal of this sensitivity analysis is to quantify the impact this restrictionmight have.
Hydrogen production from fossil fuels with CO2 capture and storage, particularly the cogenerationof electricity and hydrogen in IGCC plants, plays a significant role in the MAP scenario. To assessthe sensitivity of the model results to the availability of IGCC plants and CCS technologies, twoseparate scenarios were examined. The first scenario excluded the cogeneration of electricity andhydrogen in IGCC plants, while a second, more restrictive scenario also removed all CCS technologyoptions. This could reflect a situation where underground CO2 storage is not pursued any furtherdue to emerging safety problems or poor public acceptance of this technology option.
Figure 6.6 shows the hydrogen production for the MAP scenario and the two alternative cases. Totalhydrogen demand is 33% to 52% lower in 2050 than in the MAP scenario. This indicates thatCCS is a key enabling technology in a transition to the CO2-free production of hydrogen, which inturn shows the importance of fossil fuels for the production of hydrogen in the 2050 time frame.The decline in hydrogen demand is accompanied by a significant change in the technology mix.This result is somewhat of a surprise, because the hydrogen fuel cost constitutes a relatively minorpart of the overall cost of the hydrogen energy system, including the cost of FCVs. The availabilityof the coal-based synfuel cogeneration units is a further uncertainty for total hydrogen use.
The absence of CCS technologies also has an impact, in this case positive, on the prospects forstationary fuel cells. Decentralised fuel cell plants are unlikely to be candidates for CCS. The absenceof CCS technologies therefore removes some of the advantages that centralised technologies withCCS have over stationary fuel cells. Stationary fuel cells therefore become relatively more attractiveas decentralised fuel cell use is 20% higher than in the MAP scenario in 2050.
6. KEY DRIVERS FOR HYDROGEN AND FUEL CELLS: SENSITIVITY ANALYSIS 153
Figure 6.6
The sensitivity of hydrogen to the availability of FutureGen Plants and CCS, 2050
0
5
10
15
20
MAP MAP no FutureGen MAP no CCS
[EJ
H2/y
r]
Key point: CCS is a key enabling technology for hydrogen
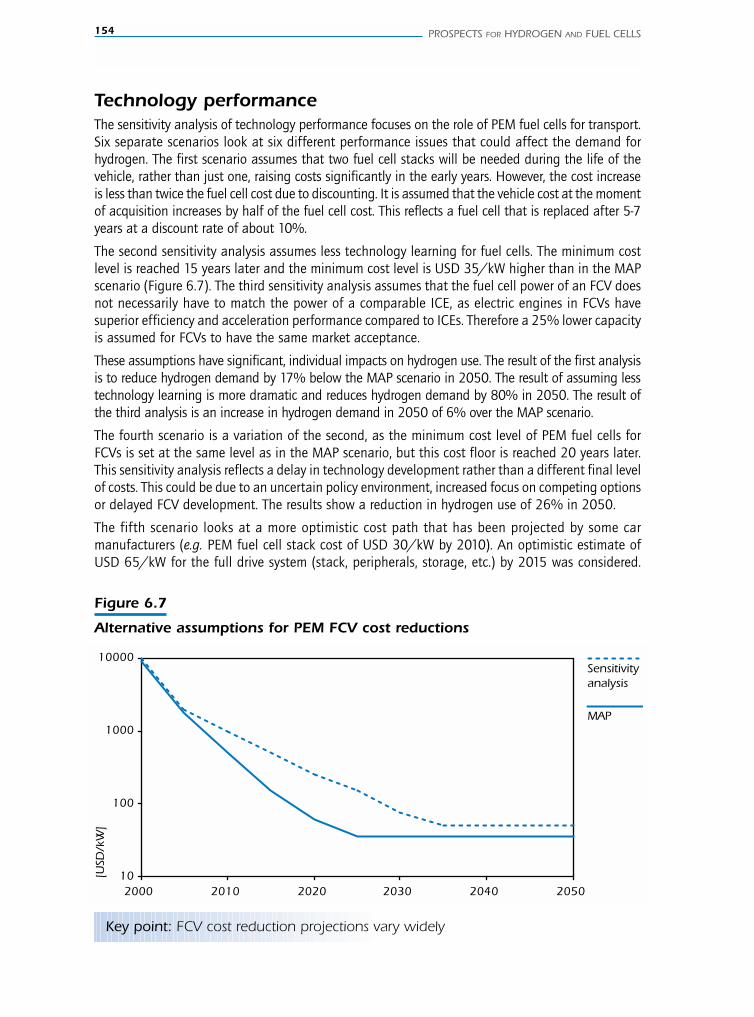
154 PROSPECTS FOR HYDROGEN AND FUEL CELLS
Technology performanceThe sensitivity analysis of technology performance focuses on the role of PEM fuel cells for transport.Six separate scenarios look at six different performance issues that could affect the demand forhydrogen. The first scenario assumes that two fuel cell stacks will be needed during the life of thevehicle, rather than just one, raising costs significantly in the early years. However, the cost increaseis less than twice the fuel cell cost due to discounting. It is assumed that the vehicle cost at the momentof acquisition increases by half of the fuel cell cost. This reflects a fuel cell that is replaced after 5-7years at a discount rate of about 10%.
The second sensitivity analysis assumes less technology learning for fuel cells. The minimum costlevel is reached 15 years later and the minimum cost level is USD 35/kW higher than in the MAPscenario (Figure 6.7). The third sensitivity analysis assumes that the fuel cell power of an FCV doesnot necessarily have to match the power of a comparable ICE, as electric engines in FCVs havesuperior efficiency and acceleration performance compared to ICEs. Therefore a 25% lower capacityis assumed for FCVs to have the same market acceptance.
These assumptions have significant, individual impacts on hydrogen use. The result of the first analysisis to reduce hydrogen demand by 17% below the MAP scenario in 2050. The result of assuming lesstechnology learning is more dramatic and reduces hydrogen demand by 80% in 2050. The result ofthe third analysis is an increase in hydrogen demand in 2050 of 6% over the MAP scenario.
The fourth scenario is a variation of the second, as the minimum cost level of PEM fuel cells forFCVs is set at the same level as in the MAP scenario, but this cost floor is reached 20 years later.This sensitivity analysis reflects a delay in technology development rather than a different final levelof costs. This could be due to an uncertain policy environment, increased focus on competing optionsor delayed FCV development. The results show a reduction in hydrogen use of 26% in 2050.
The fifth scenario looks at a more optimistic cost path that has been projected by some carmanufacturers (e.g. PEM fuel cell stack cost of USD 30/kW by 2010). An optimistic estimate ofUSD 65/kW for the full drive system (stack, peripherals, storage, etc.) by 2015 was considered.
Figure 6.7
Alternative assumptions for PEM FCV cost reductions
MAP
Sensitivity analysis
10
100
1000
10000
2000 2010 2020 2030 2040 2050
[USD
/kW
]
Key point: FCV cost reduction projections vary widely

6. KEY DRIVERS FOR HYDROGEN AND FUEL CELLS: SENSITIVITY ANALYSIS 155
Figure 6.8
Impact of FCV efficiency assumptions on their stock share(passenger cars, light/medium sized trucks and delivery vans)
MAP high efficiency
MAP
0
5
10
15
20
25
30
35
2000 2010 2020 2030 2040 2050
Sto
ck s
har
e FC
Vs
[%]
Key point: Assuming a 60% higher efficiency for FCVsincreases their share by 60% in 2050
This resulted in hydrogen demand in the 2020-2030 period being about 1 EJ per annum higherthan in the MAP scenario, and 0.5 EJ higher in 2050.
The efficiency gain of FCVs over ICEVs was also considered as a sufficiently important issue for sensitivityanalysis. The default assumption in the ETP model is a relative FCV efficiency of 1.82, compared tothe advanced ICE. The US-DOE uses a relative efficiency factor of 2.27 for 2010 that increases to2.95 in 2050. Japanese government sources also estimate a higher efficiency potential than the ETPassumption. A comparison of FCV penetration under the MAP scenario and the US-DOE efficiencyassumptions is shown in Figure 6.8. Data refer to the total of three market segments: passenger cars,SUVs and light trucks, and delivery vans and medium trucks. Under the optimistic set of efficiencyassumptions, the FCV stock is 60% greater. In terms of hydrogen use, the impact is an increase of1.1 EJ (7%). The reason is that more efficient FCVs require less hydrogen.
Transition issuesThe MAP scenario does not account for the potentially problematic transition issues that face hydrogen.As a consequence, the model chooses to immediately opt for the least-cost supply option of centralisedlarge-scale hydrogen production with a pipeline distribution system. However, in reality, a transitionperiod may be needed during which decentralised production is used. The necessity of a transitionperiod has been included in a model scenario to assess the sensitivity of hydrogen to this problem.In it, only the decentralised production of hydrogen from electrolysis and natural gas reforming canbe used initially. Once market uptake gains momentum, a transition to centralised production canthen gradually take place. The details of this modelling approach are elaborated in Annex 1.
The sensitivity analysis shows that when transition issues are considered in the model (called theMAP CHE scenario), hydrogen demand is 42% lower than the MAP scenario in 2050 (Figure 6.9).This result suggests that transition issues are an important determinant of hydrogen’s long-term
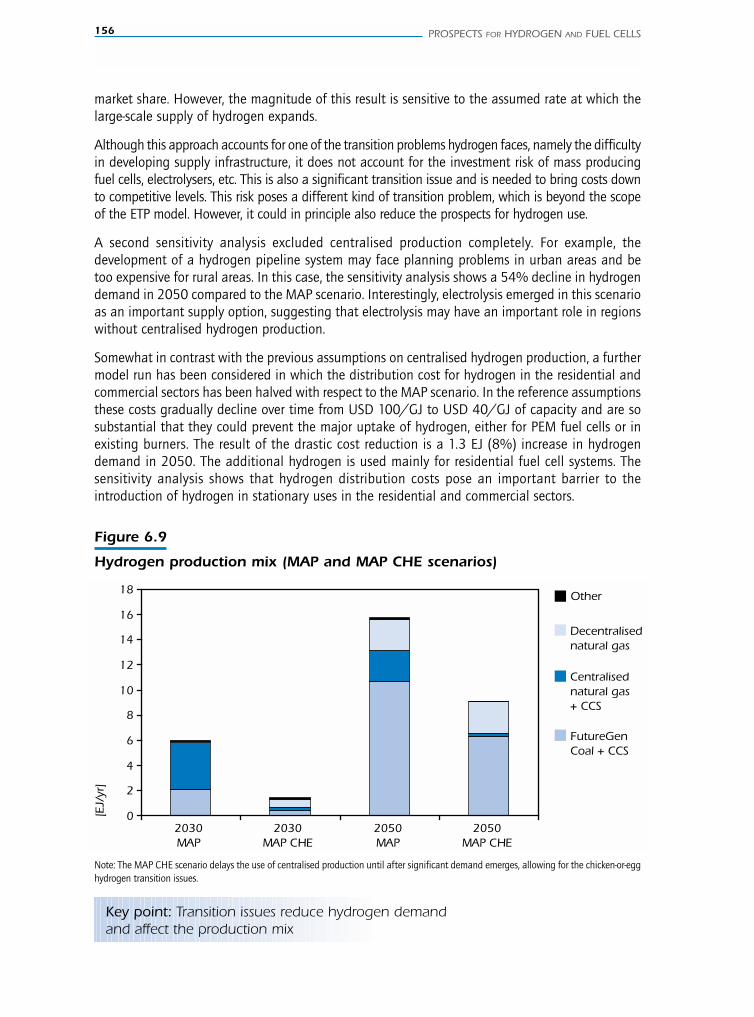
156 PROSPECTS FOR HYDROGEN AND FUEL CELLS
market share. However, the magnitude of this result is sensitive to the assumed rate at which thelarge-scale supply of hydrogen expands.
Although this approach accounts for one of the transition problems hydrogen faces, namely the difficultyin developing supply infrastructure, it does not account for the investment risk of mass producingfuel cells, electrolysers, etc. This is also a significant transition issue and is needed to bring costs downto competitive levels. This risk poses a different kind of transition problem, which is beyond the scopeof the ETP model. However, it could in principle also reduce the prospects for hydrogen use.
A second sensitivity analysis excluded centralised production completely. For example, thedevelopment of a hydrogen pipeline system may face planning problems in urban areas and betoo expensive for rural areas. In this case, the sensitivity analysis shows a 54% decline in hydrogendemand in 2050 compared to the MAP scenario. Interestingly, electrolysis emerged in this scenarioas an important supply option, suggesting that electrolysis may have an important role in regionswithout centralised hydrogen production.
Somewhat in contrast with the previous assumptions on centralised hydrogen production, a furthermodel run has been considered in which the distribution cost for hydrogen in the residential andcommercial sectors has been halved with respect to the MAP scenario. In the reference assumptionsthese costs gradually decline over time from USD 100/GJ to USD 40/GJ of capacity and are sosubstantial that they could prevent the major uptake of hydrogen, either for PEM fuel cells or inexisting burners. The result of the drastic cost reduction is a 1.3 EJ (8%) increase in hydrogendemand in 2050. The additional hydrogen is used mainly for residential fuel cell systems. Thesensitivity analysis shows that hydrogen distribution costs pose an important barrier to theintroduction of hydrogen in stationary uses in the residential and commercial sectors.
Figure 6.9
Hydrogen production mix (MAP and MAP CHE scenarios)
0
2
4
6
8
10
12
14
16
18
2030 MAP
2030 MAP CHE
2050 MAP
2050 MAP CHE
[EJ/
yr]
Other
Decentralised natural gas
Centralisednatural gas+ CCS
FutureGenCoal + CCS
Key point: Transition issues reduce hydrogen demandand affect the production mix
Note: The MAP CHE scenario delays the use of centralised production until after significant demand emerges, allowing for the chicken-or-egghydrogen transition issues.
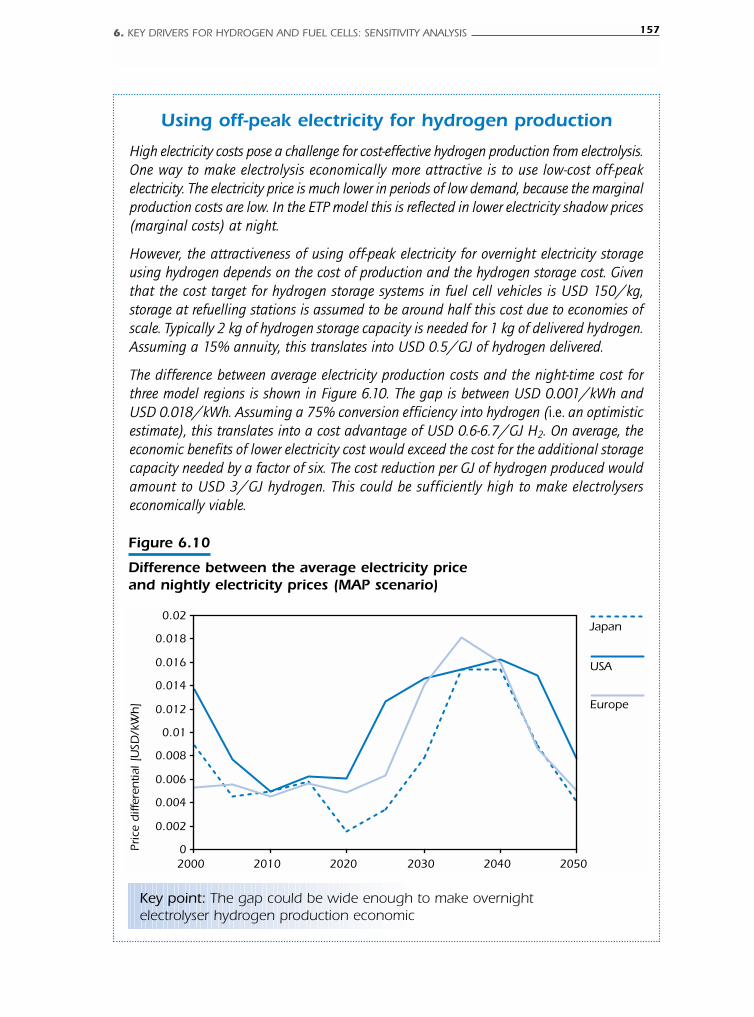
6. KEY DRIVERS FOR HYDROGEN AND FUEL CELLS: SENSITIVITY ANALYSIS 157
Using off-peak electricity for hydrogen production
High electricity costs pose a challenge for cost-effective hydrogen production from electrolysis.One way to make electrolysis economically more attractive is to use low-cost off-peakelectricity. The electricity price is much lower in periods of low demand, because the marginalproduction costs are low. In the ETP model this is reflected in lower electricity shadow prices(marginal costs) at night.
However, the attractiveness of using off-peak electricity for overnight electricity storageusing hydrogen depends on the cost of production and the hydrogen storage cost. Giventhat the cost target for hydrogen storage systems in fuel cell vehicles is USD 150/kg,storage at refuelling stations is assumed to be around half this cost due to economies ofscale. Typically 2 kg of hydrogen storage capacity is needed for 1 kg of delivered hydrogen.Assuming a 15% annuity, this translates into USD 0.5/GJ of hydrogen delivered.
The difference between average electricity production costs and the night-time cost forthree model regions is shown in Figure 6.10. The gap is between USD 0.001/kWh andUSD 0.018/kWh. Assuming a 75% conversion efficiency into hydrogen (i.e. an optimisticestimate), this translates into a cost advantage of USD 0.6-6.7/GJ H2. On average, theeconomic benefits of lower electricity cost would exceed the cost for the additional storagecapacity needed by a factor of six. The cost reduction per GJ of hydrogen produced wouldamount to USD 3/GJ hydrogen. This could be sufficiently high to make electrolyserseconomically viable.
Figure 6.10
Difference between the average electricity priceand nightly electricity prices (MAP scenario)
Japan
USA
Europe
0
0.002
0.004
0.006
0.008
0.01
0.012
0.014
0.016
0.018
0.02
2000 2010 2020 2030 2040 2050
Pric
e d
iffer
entia
l [U
SD/k
Wh
]
Key point: The gap could be wide enough to make overnightelectrolyser hydrogen production economic
158 PROSPECTS FOR HYDROGEN AND FUEL CELLS
Overview of the sensitivity analysis results
The sensitivity analysis suggests that there are a key set of parameters that have a significant impacton the future role of hydrogen technology, as they affect hydrogen use by more than 10%. Policiesto reduce CO2 emissions, the socio-economic environment and the rate of hydrogen technologydevelopments are of key importance. However, in the presence of CO2 incentives that drive majorfuel substitution, energy-security policies and competing technology options seem of less importance.In general, the sensitivity analysis shows a significant downside potential and limited upside potentialfor the parameters varied (Table 6.2).
The following variables are of high importance, as they affect hydrogen use by more than 10%:
● The presence of CO2 policy targets.
● The contribution of non-Kyoto countries to reducing their emissions substantially.
● Fuel tax regimes for hydrogen.
● Future oil prices.
● Post-2050 planning considerations.
● The availability of the FutureGen-type option for the cogeneration of hydrogen and electricityfrom coal.
● The successful development of CCS technologies.
● The acceptance of nuclear.
● The ultimate minimum cost of FCVs and the FCV drive system lifetime.
● The timing of FCV cost reductions.
● Consumer acceptance and awareness of more efficient technologies (“hurdle-rates”).
● Hydrogen supply transition issues and the development of a centralised production system.
The following variables affect hydrogen use by less than 10%:
● Delaying the introduction of CO2 policies by 15 years.
● Alternative fuel taxes increasing to 100% of gasoline taxes.
● Policies to improve the security of oil supply.
● Accelerated cost reductions for renewable technologies.
● Lower biomass availability.
● Allowing 25% reduced power capacity requirements for fuel cells in FCVs.
● Assuming low “hurdle-rates” for the residential and commercial sectors.
Assuming a lower capacity for FCVs has a limited impact on total hydrogen use, the more optimisticefficiency assumptions result in a 50% increase of FCV use. Therefore, capacity is also an importantparameter. Energy-security policies can have a positive impact in a scenario without CO2 policies,but their additional impact is limited when ambitious CO2 policies are considered.
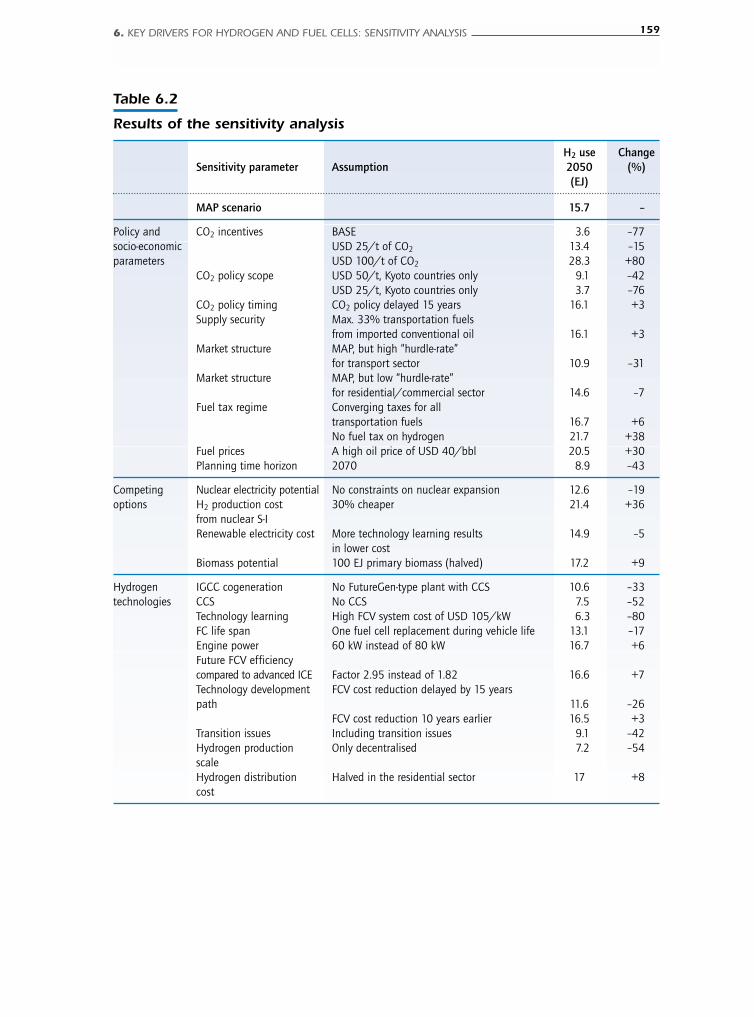
6. KEY DRIVERS FOR HYDROGEN AND FUEL CELLS: SENSITIVITY ANALYSIS 159
Table 6.2
Results of the sensitivity analysis
H2 use ChangeSensitivity parameter Assumption 2050 (%)
(EJ)
MAP scenario 15.7 –
Policy and CO2 incentives BASE 3.6 –77socio-economic USD 25/t of CO2 13.4 –15parameters USD 100/t of CO2 28.3 +80
CO2 policy scope USD 50/t, Kyoto countries only 9.1 –42USD 25/t, Kyoto countries only 3.7 –76
CO2 policy timing CO2 policy delayed 15 years 16.1 +3Supply security Max. 33% transportation fuels
from imported conventional oil 16.1 +3Market structure MAP, but high “hurdle-rate”
for transport sector 10.9 –31Market structure MAP, but low “hurdle-rate”
for residential/commercial sector 14.6 –7Fuel tax regime Converging taxes for all
transportation fuels 16.7 +6No fuel tax on hydrogen 21.7 +38
Fuel prices A high oil price of USD 40/bbl 20.5 +30Planning time horizon 2070 8.9 –43
Competing Nuclear electricity potential No constraints on nuclear expansion 12.6 –19options H2 production cost 30% cheaper 21.4 +36
from nuclear S-I Renewable electricity cost More technology learning results 14.9 –5
in lower costBiomass potential 100 EJ primary biomass (halved) 17.2 +9
Hydrogen IGCC cogeneration No FutureGen-type plant with CCS 10.6 –33technologies CCS No CCS 7.5 –52
Technology learning High FCV system cost of USD 105/kW 6.3 –80FC life span One fuel cell replacement during vehicle life 13.1 –17Engine power 60 kW instead of 80 kW 16.7 +6Future FCV efficiencycompared to advanced ICE Factor 2.95 instead of 1.82 16.6 +7Technology development FCV cost reduction delayed by 15 years path 11.6 –26
FCV cost reduction 10 years earlier 16.5 +3Transition issues Including transition issues 9.1 –42Hydrogen production Only decentralised 7.2 –54scaleHydrogen distribution Halved in the residential sector 17 +8cost

7. SCENARIO ANALYSIS AND REGIONAL ACTIVITIES 161
Chapter 7.SCENARIO ANALYSISAND REGIONAL ACTIVITIES
H I G H L I G H T S
■ Hydrogen may conquer a significant market share if vigorous policies for climate changemitigation and energy security are combined with considerable reductions in the costsof hydrogen and fuel cells. Under these conditions, various emerging technologiescontribute to stabilising emissions and help diversify the energy system. Hydrogen andfuel cells are part of this broad technology portfolio.
■ In the most favourable scenario, with incentives to reduce CO2 emissions and quickly declininghydrogen and fuel cell costs, hydrogen emerges as a player in the energy system beyond 2030.In this scenario 12.5 EJ of hydrogen would be used by 2050, mostly in the transportationsector. While in absolute terms this appears as a limited amount of energy in comparisonwith the total primary energy supply of around 785 EJ, its impact on transportation is verysignificant. The efficiency of PEM fuel cell vehicles is such that some 30% of the global fleetof passenger cars (some 700 million cars) would be fuelled by this relatively small amountof hydrogen. Fuel cell vehicles would start gaining market share between 2020 and 2025.
■ If the hydrogen produced for energy use is added to the hydrogen used for otherapplications (refinery and chemicals), more than 22 EJ of hydrogen would be used by2050. This represents more than a four-fold increase with respect to the current level ofhydrogen production.
■ However, hydrogen plays a significant role only under favourable assumptions. Under lessoptimistic assumptions for technology development and policy measures, hydrogen andfuel cells are unlikely to reach the critical mass that is needed for a successful marketuptake. In this case, market introduction barriers would cause competing fuels and technologyoptions, such as biofuels and synfuels from coal and gas, to play a more important role.
■ If the most favourable scenario is compared to a similar scenario where hydrogen andfuel cells are not part of the technology portfolio, the net benefit of hydrogen and fuelcells is found to be a 5% reduction in CO2 emissions (1.4 Gt CO2) and a 2% reductionin oil use by 2050. This may appear to be a limited benefit. However, if vigorous CO2
policies are in place, a number of alternative fuels and technologies, such as hydrogen,biofuels, CNG and FT synfuels from coal and gas with CCS, would all be playing a role ina competitive energy market. In such a diverse and optimised world, neither hydrogennor any one of the other emerging technologies is crucial to mitigate emissions, but theircollective uptake results in emission stabilisation.
■ However, the lack of hydrogen would result in significant changes in the transportationsystem. The 30% of passenger cars and light-medium trucks fuelled by hydrogen fuelcells by 2050 would be replaced by ethanol vehicles (10%) and advanced gasoline ICEVs,gasoline hybrids, and natural gas fuelled vehicles (20% in total). The increased use ofgasoline and natural gas to fuel vehicles would account for a total emissions increaseof 1.4 Gt CO2 per year.
162 PROSPECTS FOR HYDROGEN AND FUEL CELLS
■ The diversification of the energy system is such that the lack of hydrogen in the energymix does not imply dramatic changes in energy security. The net impact would only bea 2% increase in total conventional and unconventional oil use by 2050. However, oilimports from the Middle East would be 14% higher by 2050 due to the earlier depletionof non-Middle East oil supply sources. This would be associated with a rapid expansionof oil substitutes.
■ Stationary fuel cell capacity in all scenarios ranges from 200 to 300 GW by 2050. Thisis equal to some 2-3% of total installed capacity. This result suggests that stationaryfuel cells, namely SOFCs and MCFCs, represent a robust technology option that is notsignificantly affected by policy strategies and other variables. Most of these fuel cellswould be fired by natural gas, but up to 22% of them could use oil refinery products.As a consequence, these fuel cells would not result in a reduction of emissions.
■ Stationary fuel cells would concentrate in the residential, commercial and industrialsectors, and fill the market between large-scale CHP units and small-scale boilers, thusextending the economic feasibility of CHP to the scale of buildings. Fuel cells for centralisedpower production play a role in only one scenario, where in combination with coal-firedintegrated-gasifier combined-cycles, some 25 GW of IGCC-SOFC plants are installed worldwide by 2050.
■ Hydrogen PEM fuel cells for stationary applications do not show up in any scenarios.This result can be explained by the cost of a dedicated hydrogen supply system and bythe flexibility of the SOFC and MCFC systems, which do not need a fuel reformer, areless sensitive to poisoning than PEM fuel cells, and have superior conversion efficiency.Stationary hydrogen fuel cells, however, could benefit from the development of a hydrogendistribution system for transport. Such a synergy has not been considered in the analysis.So, in principle, hydrogen fuel cells could play a more important role than the results inthese scenarios suggest.
■ In cost-optimal scenarios, hydrogen production in the early market uptake phase is primarilyfrom decentralised natural gas reforming and electrolysis, while centralised productionfrom coal and natural gas, with CO2 capture and storage, plays a major role in thelonger term. Production from nuclear and renewable energy does not play a significantrole. However, the cost of hydrogen production from nuclear heat and from biomass mightbe only slightly higher than from fossil fuels. If so, nuclear and renewable hydrogen couldenter the production mix, especially if cost is not the only criterion for the selection ofthe production technology or if CO2 capture and storage technologies are not availableor competitive.
■ If ambitious climate and energy-security policies are adopted, the regional potential forhydrogen and fuel cells seems to be high in the OECD regions and in China. In all regions,transport applications dominate the hydrogen market. The share of hydrogen FCVs varieswidely across regions. In the most optimistic scenario, China is the region with the highesthydrogen FCV share (60%) in 2050, but this result is highly dependent on the scenarioassumptions. The same applies to India, which has an FCV share of 42%. In OECD countries,the share seems to be somewhat more stable across scenarios. In the most favourablescenario the FCV share is 10% in Australia, 22% in Japan, 35% in Canada, 36-48% inEurope and 42% in the United States. Hydrogen use would start around 2020 in Europeand North America, and around 2025 in the other regions. Differences in hydrogen
7. SCENARIO ANALYSIS AND REGIONAL ACTIVITIES 163
penetration across regions may be explained by different economic conditions, discountrates, availability of infrastructure, citizen attitude to investment in capital-intensivetechnologies, energy and fuel taxes, and mobility needs. The lower per capita use in theOECD Pacific can be explained by the lower energy intensity in key countries such asJapan and the lower annual car-mileage, which does not favour investment in capital-intensive technologies such as FCVs.
The sensitivity analysis in Chapter 6 showed that a number of parameters can significantly affectthe potential for hydrogen and fuel cells. When combined, these individual drivers may interact inways that reinforce or offset their respective individual impacts. Scenario analysis is a way of assessingsuch interactions. A scenario is defined as a coherent combination of parameters and assumptionsthat can influence the future role of hydrogen and fuel cells.
This chapter discusses and compares four scenarios that have been developed on the basis of thesensitivity analysis illustrated in the previous chapter. The scenario analysis is not intended to providepredictions for the future of hydrogen and fuel cell technologies, but instead depicts in a quantitativemanner the role these technologies could play under a set of selected assumptions for energy policiesand technology development. Also, the four scenarios discussed here do not pretend to cover thefull spectrum of possible developments. The outcomes of the scenario analysis can be used to gainmore insights regarding uncertainties and to develop hedging strategies to deal with theseuncertainties. The results also provide information on the consequences of energy policy strategiesand measures on hydrogen and fuel cell prospects. Finally, they can highlight key R&D areas anddirections to further develop hydrogen and fuel cell technologies in order to maximise their chancesof success. The four scenarios are first discussed on a global level and subsequently analysed fromthe perspective of their regional implications.
Global scenario analysis
The four scenarios (A, B, C and D) in this analysis are characterised by the acronym ESTEC thatsummarises the five dimensions used to define the scenarios: environment (E), supply security (S),technological progress (T), economic conditions (E) and competing options (C). Each dimension in eachscenario is associated with a plus (+), minus (–) or neutral (0) symbol in series following the acronym,or beneath each letter, indicating that a set of parameters for that dimension have a positive, negativeor neutral effect on the potential use of hydrogen and fuel cells. For instance, a higher incentive toreduce CO2 emissions would be characterised by a plus sign under the E for environment or as thefirst sign in a list following ESTEC. The parameters that are considered in these scenarios are thosethat were identified to be of high importance in the sensitivity analysis described in Chapter 6.
Environmental policies (E) are represented through CO2 reduction incentives that can vary in level,coverage and timing. Either all countries or only countries that have ratified the Kyoto Protocol areassumed to apply the incentives. The CO2 reduction incentive is a way of representing the combinedimpact of policies, regulations, subsidies, taxes, etc., that have the effect of reducing emissionsand enhancing energy security. Given the nature of many CO2 reduction options, this incentivealso tends to encourage options that result in significant benefits in terms of energy-security(e.g. policies to foster more efficient vehicles). However, in other circumstances (e.g. the use ofcoal) environment and energy-security goals are in potential conflict. From an economic point of

164 PROSPECTS FOR HYDROGEN AND FUEL CELLS
view, the CO2 incentives have the net effect of giving hydrogen technologies a benefit that isequivalent to the incentive level multiplied by the marginal CO2 effect. The CO2 reduction incentiveis a modelling tool capable of easily representing a set of coherent policies. The evaluation of single,regional or sector-specific policy measures would be impractical and of limited relevance to aglobal analysis with a long-term perspective. Moreover, it would not be capable of assessing whethera certain option makes economic sense. By setting a level for the incentive, this approach then letsthe model identify cost-effective solutions.
Explicit energy-security policies (S) are represented through targets to reduce oil import dependencyand through taxation policies that favour the use of alternative fuels over conventional oil. Theimport dependency has been limited to one-third of total transportation fuel demand in three outof the four scenarios for OECD countries and China. The sensitivity analysis in Chapter 6 indicatedthat such policies can have an important impact in the case of weak CO2 policies. Moreover, threescenarios assume that by 2050 fuel taxes on alternative fuels gradually converge on the currentregional gasoline taxes. One scenario assumes that taxes on alternative fuels reach only 75% ofthe gasoline tax level by 2050.
Technology advances (T) in hydrogen and fuel cells are modelled through three sets of variables: thecost of the FCV drive system, the efficiency of the FCVs and a gradual transition from distributed tocentralised hydrogen production. This last model characterisation is intended to represent the additionaleffort needed to overcome transition and infrastructure barriers, such as the chicken-or-egg problem.Transition issues may significantly reduce or delay hydrogen penetration in the energy market. All fourscenarios in this chapter have the same assumptions for the transition issues. The important point isthat these issues were not considered in the BASE and MAP scenarios. As for the cost of the FCV drivesystem, two different cost levels of USD 65/kW and USD 105/kW are assumed to be achieved overtime. The relative efficiency of FCVs compared to advanced ICEVs was set at a constant value of 1.82(the MAP and BASE level) or assumed to improve gradually to 2.95 by 2050.
Economic conditions (the second E) are modelled through oil and gas price assumptions, as wellas the discount rates in the transport, service and residential sectors. Three scenarios assume ahigher average oil price path of USD 35/bbl by 2030, which then increases to USD 40/bbl in2050. As in the WEO 2004 Reference Scenario, one scenario uses a lower oil price assumption ofUSD 29/bbl in 2030, which is constant thereafter. In each scenario, the gas price follows the oiltrend. Varying discount rates reflect consumer willingness to invest in capital goods, their timepreferences, and the impact of government information campaigns and policies.
Finally, the prospects for competing options (C) includes a set of assumptions for alternative technologies,transportation fuels, CO2-free electricity production from nuclear and renewable energy, and fossilfuels with CCS. Technology progress for renewables has been modelled through learning assumptionsthat are in line with either the MAP scenario or with more optimistic technology learning assumptions(see the MAPREN scenario in Chapter 6). The biomass potential is assumed to be100 EJ or 200 EJ perannum by 2050. The potential of nuclear is the same as in the MAP scenario, that is, twice as high.
The detailed assumptions for each of the ESTEC scenarios are presented in Table 7.1. The storybehind each of the ESTEC scenarios is presented below.
A. ESTEC ––++–Weak CO2 policies, liberalised markets and market-driven technological developmentWeak CO2 policies (no post-Kyoto quantitative targets), moderate government support for emergingtechnologies and a lack of government stewardship in decreasing oil dependency characterise this
scenario. All types of alternative fuels are developed further by economic conditions, public andprivate R&D investment, and competition among energy companies. From a policy viewpoint,governments focus on the continued liberalisation of the global markets in order to strengthencompetition and growth. In comparison with other scenarios, this scenario represents a technologyand market-driven future. In this scenario, hydrogen and fuel cell technologies will only be chosenif they can compete with other energy options on a cost basis. This is a very challenging environmentin which to achieve a transition to hydrogen.
B. ESTEC 0+++–
Strong new CO2 policies in Kyoto countries and rapid technological developmentAmbitious CO2 policies in countries that ratify the Kyoto Protocol are balanced by limited abatementpolicies in other countries. Continued uncertainty about the prospects for conventional oil supplyresults in policy efforts to reduce oil imports. Substantial new R&D policy efforts foster technologydevelopment and breakthroughs. This scenario depicts a continued lack of agreement on CO2 policiesat an international level, which is somewhat compensated for by significant technology progress.Whether or not considerably different CO2 incentives in Kyoto and non-Kyoto countries are compatiblewith the macroeconomic equilibrium among regional economies is open to discussion, but it isbeyond the scope of this analysis.
C. ESTEC 0+–––
Strong new CO2 policies in Kyoto countries, but technological development lagsWith CO2 and energy-security policies the same as in the previous scenario, this third scenario ischaracterised by technology development lags and/or a reluctance by consumers to accept newtechnologies. Government tax policies in favour of alternative fuels partially compensate for thetechnology lag. As a consequence, most emphasis is put on biofuels and synfuels that can beintegrated into the existing fuel supply infrastructure. The development of these alternative fuelsreduces the relative attractiveness of hydrogen. Given the importance of rapid technological progressfor hydrogen as identified in the sensitivity analysis, this is perhaps the most challenging environmentfor hydrogen and fuel cells.
D. ESTEC +++++
Strong new CO2 policies world wide, with rapid technological developmentDriven by the evidence of climate change and the spirit of co-operation, all countries agree in thecoming two decades to combat CO2 emissions and global warming. Continued oil price fluctuationsand increased concerns about energy-security issues result in new policies to limit oil dependencyin industrialised countries. Technology development proceeds rapidly for hydrogen due to industrialand government-sponsored RD&D activities. The policy emphasis on hydrogen focuses less attentionon synfuels and biofuels, while industry is reluctant to invest in alternative options that lackgovernment support. As a consequence, the technology progress for alternative options lagsbehind hydrogen. This is the most favourable scenario for hydrogen.
Comparing scenarios A and B highlights the importance of government policies, because these twoscenarios differ in environmental (first E) and security (S) policies only. Comparing scenarios B andC highlights the importance of the technology progress and economic conditions (“hurdle-rates” andthe oil price). Scenario D reflects an optimistic case where policy, socio-economic trends and technologydevelopments work together in a way that is favourable for hydrogen and fuel cells.
7. SCENARIO ANALYSIS AND REGIONAL ACTIVITIES 165
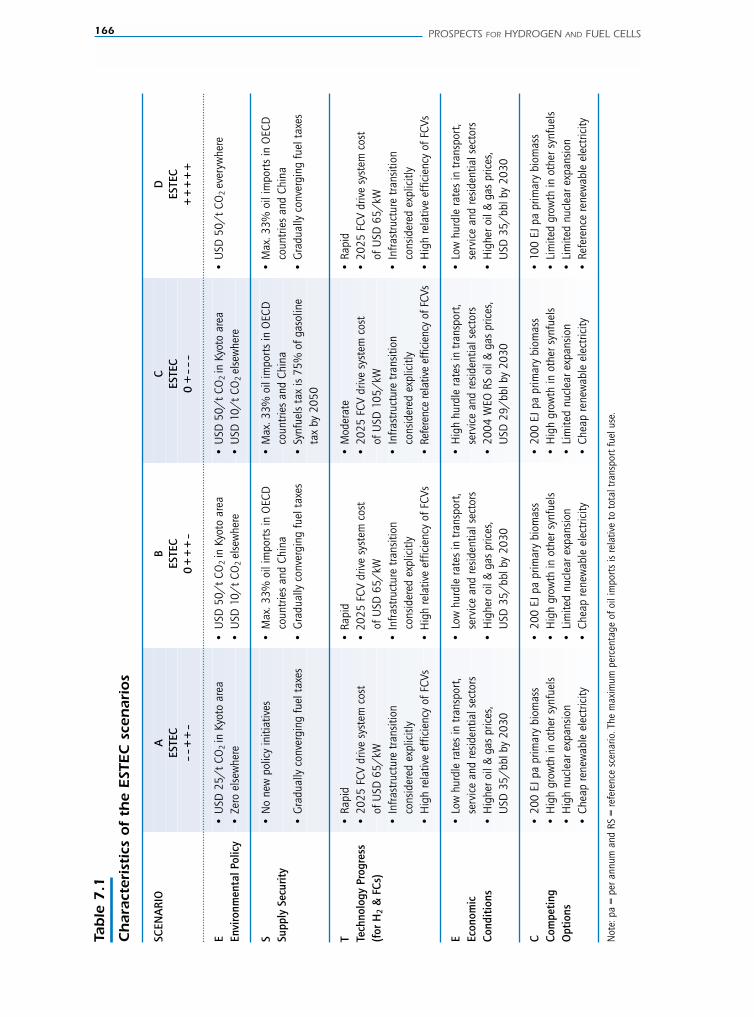
166 PROSPECTS FOR HYDROGEN AND FUEL CELLS
Table
7.1
Ch
arac
teri
stic
s of
the
EST
EC
sce
nar
ios
SCEN
ARI
OA
BC
DES
TEC
ESTE
CES
TEC
ESTE
C–
–+
+–
0+
++
–0
+–
––
++
++
+
E•
USD
25/
t CO
2 in
Kyo
to a
rea
•U
SD 5
0/t
CO2
in K
yoto
are
a•
USD
50/
t CO
2 in
Kyo
to a
rea
•U
SD 5
0/t
CO2
ever
ywhe
reEn
viro
nmen
tal P
olic
y•
Zero
els
ewhe
re•
USD
10/
t CO
2 el
sew
here
•U
SD 1
0/t
CO2
else
whe
re
S•
No
new
pol
icy
initi
ativ
es•
Max
. 33%
oil
impo
rts
in O
ECD
• M
ax. 3
3% o
il im
port
s in
OEC
D•
Max
. 33%
oil
impo
rts
in O
ECD
Supp
ly S
ecur
ity
coun
trie
s an
d Ch
ina
coun
trie
s an
d Ch
ina
coun
trie
s an
d Ch
ina
•G
radu
ally
con
verg
ing
fuel
tax
es•
Gra
dual
ly c
onve
rgin
g fu
el t
axes
• S
ynfu
els
tax
is 7
5% o
f gas
olin
e •
Gra
dual
ly c
onve
rgin
g fu
el t
axes
tax
by 2
050
T•
Rap
id
• R
apid
• M
oder
ate
• R
apid
Te
chno
logy
Pro
gres
s•
202
5 FC
V dr
ive
syst
em c
ost
• 2
025
FCV
driv
e sy
stem
cos
t •
202
5 FC
V dr
ive
syst
em c
ost
• 2
025
FCV
driv
e sy
stem
cos
t(f
or H
2&
FCs
) of
USD
65/
kW
of U
SD 6
5/kW
of U
SD 1
05/
kWof
USD
65/
kW•
Infra
stru
ctur
e tr
ansi
tion
• In
frast
ruct
ure
tran
sitio
n •
Infra
stru
ctur
e tr
ansi
tion
•
Infra
stru
ctur
e tr
ansi
tion
cons
ider
ed e
xplic
itly
cons
ider
ed e
xplic
itly
cons
ider
ed e
xplic
itly
cons
ider
ed e
xplic
itly
• H
igh
rela
tive
effic
ienc
y of
FCV
s•
Hig
h re
lativ
e ef
ficie
ncy
of F
CVs
• R
efer
ence
rela
tive
effic
ienc
y of
FCV
s•
Hig
h re
lativ
e ef
ficie
ncy
of F
CVs
E•
Low
hur
dle
rate
s in
tra
nspo
rt,
•Lo
w h
urdl
e ra
tes
in t
rans
port
,•
Hig
h hu
rdle
rate
s in
tra
nspo
rt,
•Lo
w h
urdl
e ra
tes
in t
rans
port
,Ec
onom
ic
serv
ice
and
resi
dent
ial s
ecto
rsse
rvic
e an
d re
side
ntia
l sec
tors
serv
ice
and
resi
dent
ial s
ecto
rsse
rvic
e an
d re
side
ntia
l sec
tors
Cond
itio
ns•
Hig
her o
il &
gas
pric
es,
•H
ighe
r oil
& g
as p
rices
, •
2004
WEO
RS
oil &
gas
pric
es,
•H
ighe
r oil
& g
as p
rices
,U
SD 3
5/bb
l by
2030
USD
35/
bbl b
y 20
30U
SD 2
9/bb
l by
2030
USD
35/
bbl b
y 20
30
C•
200
EJ p
a pr
imar
y bi
omas
s•
200
EJ p
a pr
imar
y bi
omas
s•
200
EJ p
a pr
imar
y bi
omas
s•
100
EJ p
a pr
imar
y bi
omas
sCo
mpe
ting
•H
igh
grow
th in
oth
er s
ynfu
els
•H
igh
grow
th in
oth
er s
ynfu
els
•H
igh
grow
th in
oth
er s
ynfu
els
•Li
mite
d gr
owth
in o
ther
syn
fuel
sO
ptio
ns•
Hig
h nu
clea
r exp
ansi
on
•Li
mite
d nu
clea
r exp
ansi
on•
Lim
ited
nucl
ear e
xpan
sion
•Li
mite
d nu
clea
r exp
ansi
on•
Chea
p re
new
able
ele
ctric
ity•
Chea
p re
new
able
ele
ctric
ity•
Chea
p re
new
able
ele
ctric
ity•
Refe
renc
e re
new
able
ele
ctric
ity
Not
e: p
a =
per a
nnum
and
RS
= re
fere
nce
scen
ario
. The
max
imum
per
cent
age
of o
il im
port
s is
rela
tive
to t
otal
tra
nspo
rt fu
el u
se.
Results of the scenario analysis
Global hydrogen demandThe most favourable set of assumptions in the ESTEC scenarios for hydrogen, Scenario D, result inhydrogen demand appearing from 2015 onward and reaching 12.4 EJ in 2050 (Figure 7.1). This isless than the 15.7 EJ in the MAP scenario, because the MAP scenario does not take into accounttransition issues, such as the difficulty of infrastructure deployment, the early dominance of moreexpensive decentralised production and the overall chicken-or-egg problem during the transitionphase. While transition technologies such as decentralised hydrogen production are essential forthe uptake of hydrogen, they tend to be more expensive than large-scale centralised production.They also reduce the rate at which hydrogen penetrates the market with respect to an ideal worldwhere large-scale capacity and infrastructure are in place at the very beginning of the process. Theoverall result of the transition is a more gradual uptake of large-scale industrial processes. Moreover,the assumption of a 62% higher efficiency for FCVs than in the MAP scenario results in 38%lower hydrogen demand at a given market share.
However, total world hydrogen production would be higher than this 12.4 EJ, which is just for energyuse, as the production for non-energy uses in 2050 is not included. Currently, chemical and refineryuses require around 5 EJ of hydrogen per year. Although not modelled, non-energy use could raisetotal hydrogen production by 2050 to more than 22 EJ per year, or more than four times current hydrogenproduction. Also, because of the higher efficiency of FCVs in this scenario, the contribution of 12.4 EJof hydrogen to satisfying energy service demand is higher than in the MAP scenario. This is particularlytrue for Scenario D, because by 2050, 97% of all hydrogen used is in the transport sector.
The other three scenarios (A, B and C) show significantly lower hydrogen demand than scenario D.This suggests that widespread hydrogen use in the next 50 years is not a “given fact” and thathydrogen seems to play an important role only if rather ambitious CO2 policies are in place andfurther favourable conditions exist. The fact that scenario D shows significantly higher hydrogenuse than the other three scenarios is the consequence of a number of factors. In addition toenvironmental policies, strong technology advances driven by government RD&D programmes inconjunction with the relatively slow development of competing options play a key role.
According to scenarios A, B and C, different sets of assumptions could considerably limit hydrogenprospects in favour of other options. However, apart from conventional options, no emergingtechnology option seems in the position to play a dominant role in the future transport fuel mix(Figure 7.2). Therefore, hydrogen should be regarded as one potentially important option in abroad portfolio of technologies that can gain market share if a rapid improvement in their performanceand economics is achieved, and if aggressive CO2 abatement policies are in place.
In terms of impact on the overall energy system, hydrogen plays a minor role. Figure 7.3 shows theprimary energy mix in the four ESTEC scenarios. Differences across the four scenarios are limited,as all scenarios include substantial actions to reduce emissions, improve efficiency and reduce energydemand. The total primary energy demand use varies by just 10% across scenarios (from 785 EJto 865 EJ in 2050), while total fossil fuel demand varies from 620 EJ to 700 EJ, thus suggestinga continued heavy reliance on fossil fuels. However, coal use does decrease continuously fromscenario A to scenario D, which is also the most efficient scenario. In absolute terms, the impactof hydrogen on the overall energy mix is in the range of a few percentage points. Even assuminga low conversion efficiency of 60% of primary energy into hydrogen, the total hydrogen used inthe most favourable scenario D would require less than 3% of total primary energy use.
7. SCENARIO ANALYSIS AND REGIONAL ACTIVITIES 167
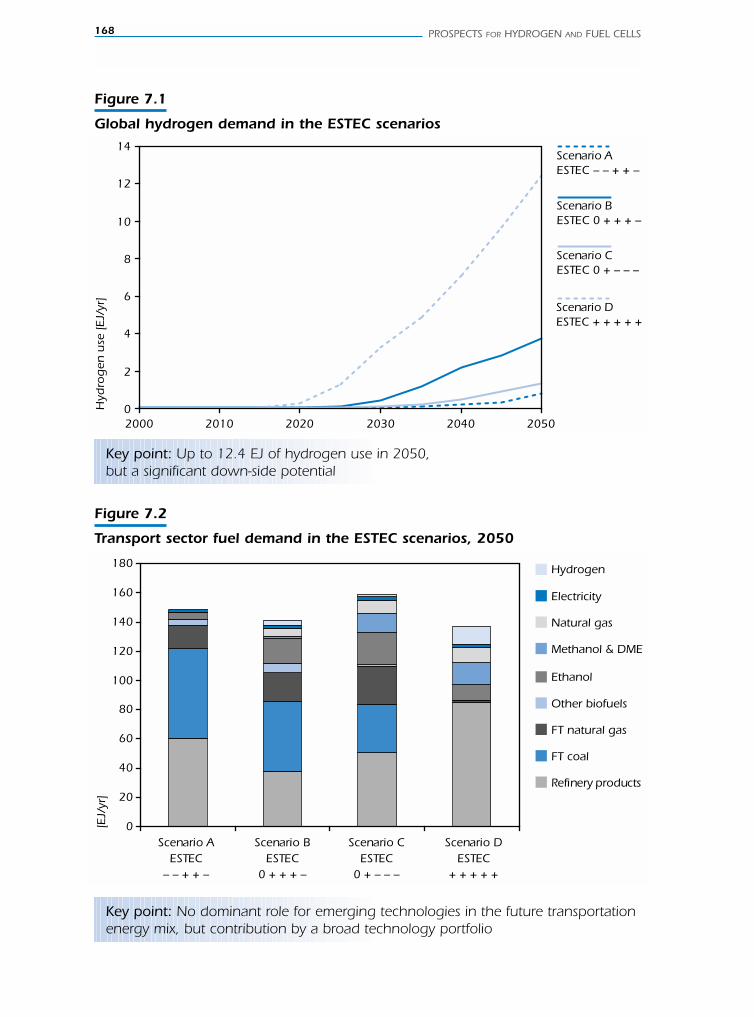
168 PROSPECTS FOR HYDROGEN AND FUEL CELLS
Figure 7.1
Global hydrogen demand in the ESTEC scenarios
Scenario AESTEC – – + + –
Scenario BESTEC 0 + + + –
Scenario CESTEC 0 + – – –
Scenario DESTEC + + + + +
0
2
4
6
8
10
12
14
2000 2010 2020 2030 2040 2050
Hyd
rog
en u
se [E
J/yr
]
Figure 7.2
Transport sector fuel demand in the ESTEC scenarios, 2050
Hydrogen
Electricity
Natural gas
Methanol & DME
Ethanol
Other biofuels
FT natural gas
FT coal
Refinery products
0
20
40
60
80
100
120
140
160
180
Scenario A ESTEC
– – + + –
Scenario B ESTEC
0 + + + –
Scenario C ESTEC
0 + – – –
Scenario D ESTEC
+ + + + +
[EJ/
yr]
Key point: Up to 12.4 EJ of hydrogen use in 2050,but a significant down-side potential
Key point: No dominant role for emerging technologies in the future transportationenergy mix, but contribution by a broad technology portfolio

There are also some interesting differences in the regional distribution of hydrogen demand. In themost favourable scenario for hydrogen (scenario D), hydrogen demand is concentrated in NorthAmerica, Europe and China (see Figure 7.4). Hydrogen demand starts around 2015 in Europe andNorth America, and around 2025 in the other regions. This uptake in various regions over a relativelyshort period of time suggests that favourable conditions for hydrogen introduction exist underdifferent economic conditions.
In absolute terms, hydrogen demand in the OECD Pacific region is significantly lower than in theother OECD regions. However, the difference in per capita hydrogen use is much smaller (Figure 7.5).This difference can be explained by lower overall energy demand in this smaller region. Also, lowerannual car-mileage in the key countries of the OECD Pacific does not favour investment in highlyefficient, but high-cost technologies. In scenario D, hydrogen use in OECD regions ranges from3.5 GJ to 7 GJ per capita, with considerably lower values in other regions. The higher per capitahydrogen use in North America can be explained by the higher annual mileage, larger car-size, lowerfuel efficiency and higher car ownership rates in this region. The implicit assumption in the analysisis that the characteristics of the North American market are inherent to low population density, low-density suburban habitation patterns and a heavy reliance on SUVs and pick-up trucks. Current NorthAmerican per capita oil product demand is a factor of 2.2 to 2.6 times higher than in Europe and theOECD Pacific regions, and can to a large extent be attributed to these factors. Therefore, a high percapita demand for hydrogen is not necessarily a measure of its success, but simply the result of adversefactors beyond the control of regional energy policy makers.
In three out of four scenarios, per capita use is lower in all regions outside the OECD. This suggeststhat hydrogen is a more robust energy technology option for the OECD region.
7. SCENARIO ANALYSIS AND REGIONAL ACTIVITIES 169
Figure 7.3
Total primary energy demand in the ESTEC scenarios, 2050
Renewables
Nuclear
Natural gas
Oil
Coal
Scenario A ESTEC
– – + + –
Scenario B ESTEC
0 + + + –
Scenario C ESTEC
0 + – – –
Scenario D ESTEC
+ + + + +
[EJ/
yr]
0
200
400
600
800
1000
Key point: The differences between the scenarios are limited
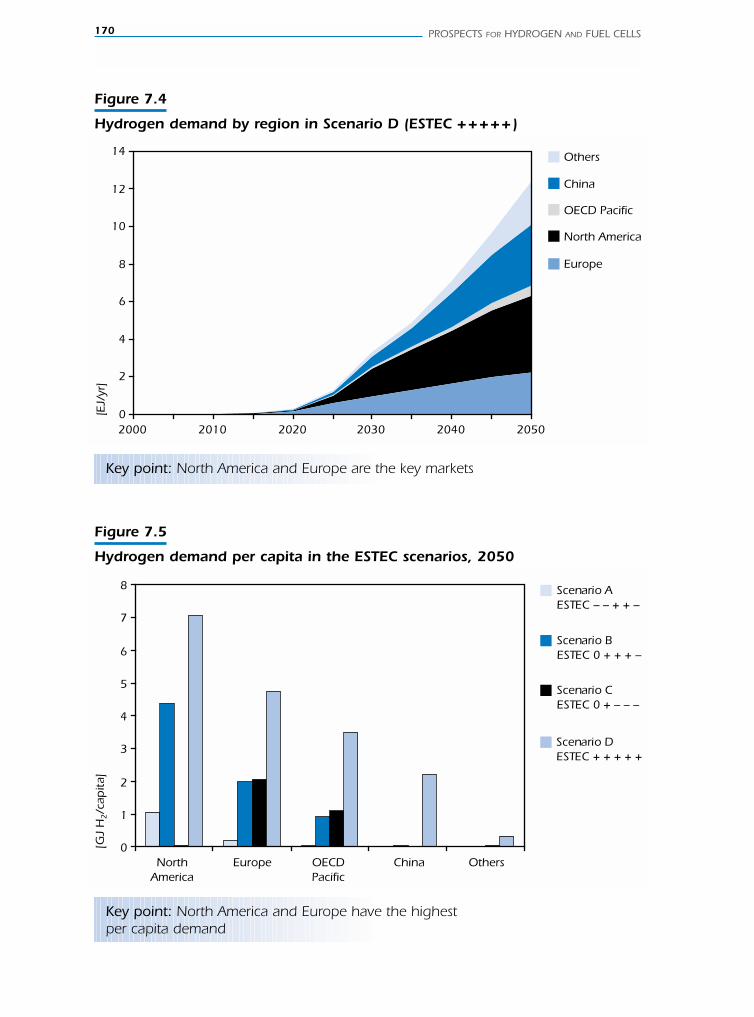
170 PROSPECTS FOR HYDROGEN AND FUEL CELLS
Figure 7.4
Hydrogen demand by region in Scenario D (ESTEC +++++)
Others
China
OECD Pacific
North America
Europe
[EJ/
yr]
0
2
4
6
8
10
12
14
2000 2010 2020 2030 2040 2050
Key point: North America and Europe are the key markets
Figure 7.5
Hydrogen demand per capita in the ESTEC scenarios, 2050
Scenario AESTEC – – + + –
Scenario BESTEC 0 + + + –
Scenario CESTEC 0 + – – –
Scenario DESTEC + + + + +
0
1
2
3
4
5
6
7
8
North America
Europe OECD Pacific
China Others
[GJ
H2/c
apita]
Key point: North America and Europe have the highestper capita demand
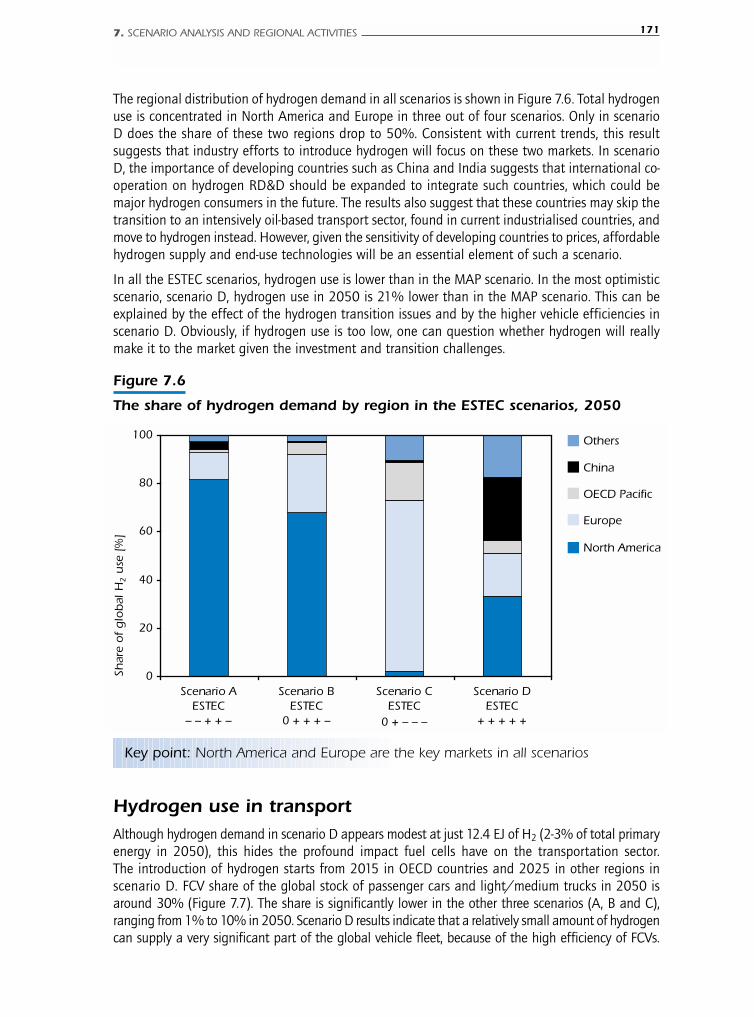
The regional distribution of hydrogen demand in all scenarios is shown in Figure 7.6. Total hydrogenuse is concentrated in North America and Europe in three out of four scenarios. Only in scenarioD does the share of these two regions drop to 50%. Consistent with current trends, this resultsuggests that industry efforts to introduce hydrogen will focus on these two markets. In scenarioD, the importance of developing countries such as China and India suggests that international co-operation on hydrogen RD&D should be expanded to integrate such countries, which could bemajor hydrogen consumers in the future. The results also suggest that these countries may skip thetransition to an intensively oil-based transport sector, found in current industrialised countries, andmove to hydrogen instead. However, given the sensitivity of developing countries to prices, affordablehydrogen supply and end-use technologies will be an essential element of such a scenario.
In all the ESTEC scenarios, hydrogen use is lower than in the MAP scenario. In the most optimisticscenario, scenario D, hydrogen use in 2050 is 21% lower than in the MAP scenario. This can beexplained by the effect of the hydrogen transition issues and by the higher vehicle efficiencies inscenario D. Obviously, if hydrogen use is too low, one can question whether hydrogen will reallymake it to the market given the investment and transition challenges.
7. SCENARIO ANALYSIS AND REGIONAL ACTIVITIES 171
Figure 7.6
The share of hydrogen demand by region in the ESTEC scenarios, 2050
Scenario A ESTEC
– – + + –
Scenario B ESTEC
0 + + + –
Scenario C ESTEC
0 + – – –
Scenario D ESTEC
+ + + + +
Others
China
OECD Pacific
Europe
North America
0
20
40
60
80
100
Shar
e o
f g
lob
al H
2 u
se [
%]
Key point: North America and Europe are the key markets in all scenarios
Hydrogen use in transport Although hydrogen demand in scenario D appears modest at just 12.4 EJ of H2 (2-3% of total primaryenergy in 2050), this hides the profound impact fuel cells have on the transportation sector.The introduction of hydrogen starts from 2015 in OECD countries and 2025 in other regions inscenario D. FCV share of the global stock of passenger cars and light/medium trucks in 2050 isaround 30% (Figure 7.7). The share is significantly lower in the other three scenarios (A, B and C),ranging from 1% to 10% in 2050. Scenario D results indicate that a relatively small amount of hydrogencan supply a very significant part of the global vehicle fleet, because of the high efficiency of FCVs.
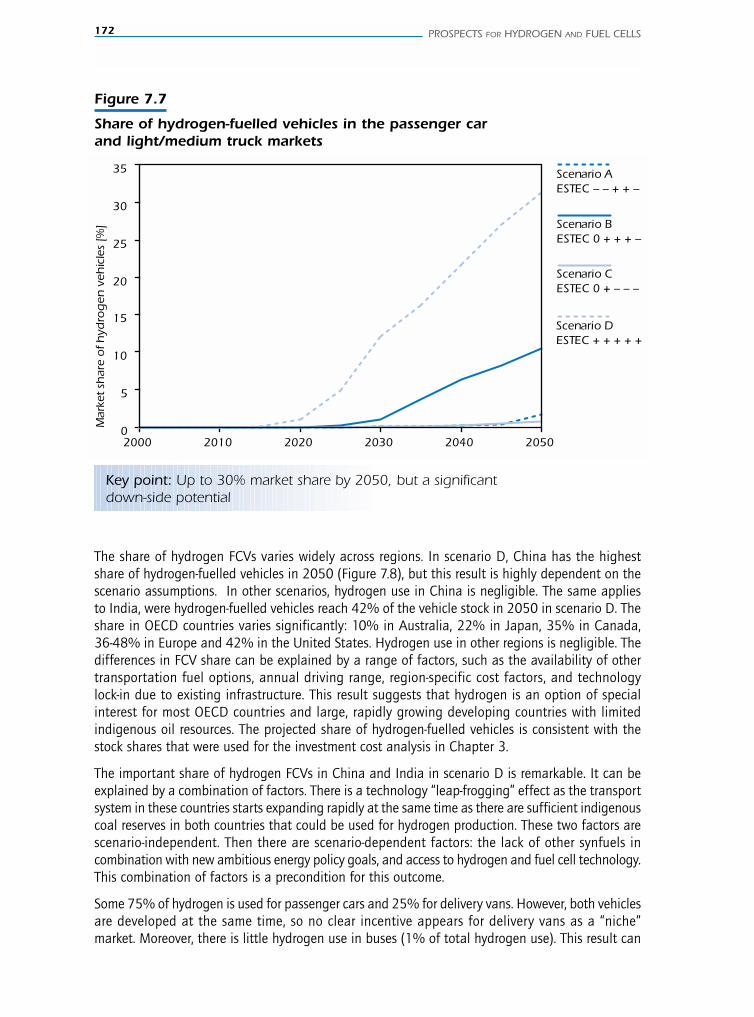
172 PROSPECTS FOR HYDROGEN AND FUEL CELLS
Figure 7.7
Share of hydrogen-fuelled vehicles in the passenger carand light/medium truck markets
Scenario AESTEC – – + + –
Scenario BESTEC 0 + + + –
Scenario CESTEC 0 + – – –
Scenario DESTEC + + + + +
0
5
10
15
20
25
30
35
2000 2010 2020 2030 2040 2050
Mar
ket s
har
e o
f hyd
rog
en v
ehic
les
[%]
Key point: Up to 30% market share by 2050, but a significantdown-side potential
The share of hydrogen FCVs varies widely across regions. In scenario D, China has the highestshare of hydrogen-fuelled vehicles in 2050 (Figure 7.8), but this result is highly dependent on thescenario assumptions. In other scenarios, hydrogen use in China is negligible. The same appliesto India, were hydrogen-fuelled vehicles reach 42% of the vehicle stock in 2050 in scenario D. Theshare in OECD countries varies significantly: 10% in Australia, 22% in Japan, 35% in Canada,36-48% in Europe and 42% in the United States. Hydrogen use in other regions is negligible. Thedifferences in FCV share can be explained by a range of factors, such as the availability of othertransportation fuel options, annual driving range, region-specific cost factors, and technologylock-in due to existing infrastructure. This result suggests that hydrogen is an option of specialinterest for most OECD countries and large, rapidly growing developing countries with limitedindigenous oil resources. The projected share of hydrogen-fuelled vehicles is consistent with thestock shares that were used for the investment cost analysis in Chapter 3.
The important share of hydrogen FCVs in China and India in scenario D is remarkable. It can beexplained by a combination of factors. There is a technology “leap-frogging” effect as the transportsystem in these countries starts expanding rapidly at the same time as there are sufficient indigenouscoal reserves in both countries that could be used for hydrogen production. These two factors arescenario-independent. Then there are scenario-dependent factors: the lack of other synfuels incombination with new ambitious energy policy goals, and access to hydrogen and fuel cell technology.This combination of factors is a precondition for this outcome.
Some 75% of hydrogen is used for passenger cars and 25% for delivery vans. However, both vehiclesare developed at the same time, so no clear incentive appears for delivery vans as a “niche”market. Moreover, there is little hydrogen use in buses (1% of total hydrogen use). This result can
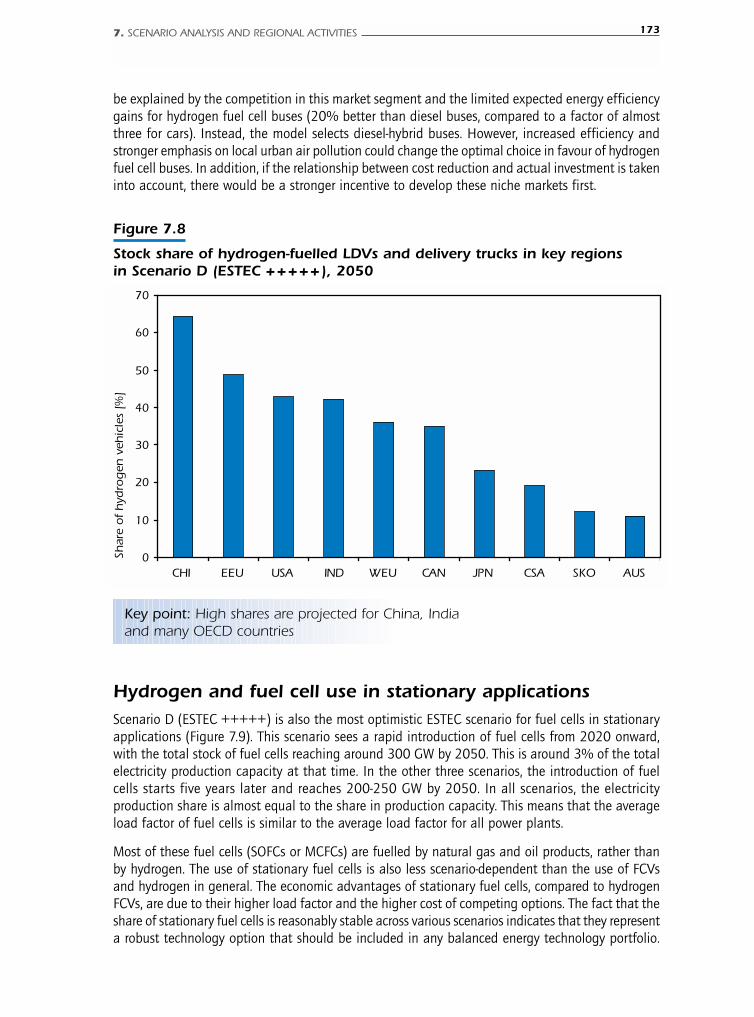
be explained by the competition in this market segment and the limited expected energy efficiencygains for hydrogen fuel cell buses (20% better than diesel buses, compared to a factor of almostthree for cars). Instead, the model selects diesel-hybrid buses. However, increased efficiency andstronger emphasis on local urban air pollution could change the optimal choice in favour of hydrogenfuel cell buses. In addition, if the relationship between cost reduction and actual investment is takeninto account, there would be a stronger incentive to develop these niche markets first.
7. SCENARIO ANALYSIS AND REGIONAL ACTIVITIES 173
Figure 7.8
Stock share of hydrogen-fuelled LDVs and delivery trucks in key regionsin Scenario D (ESTEC +++++), 2050
0
10
20
30
40
50
60
70
CHI EEU USA IND WEU CAN JPN CSA SKO AUS
Shar
e o
f h
ydro
gen
veh
icle
s [%
]
Key point: High shares are projected for China, Indiaand many OECD countries
Hydrogen and fuel cell use in stationary applicationsScenario D (ESTEC +++++) is also the most optimistic ESTEC scenario for fuel cells in stationaryapplications (Figure 7.9). This scenario sees a rapid introduction of fuel cells from 2020 onward,with the total stock of fuel cells reaching around 300 GW by 2050. This is around 3% of the totalelectricity production capacity at that time. In the other three scenarios, the introduction of fuelcells starts five years later and reaches 200-250 GW by 2050. In all scenarios, the electricityproduction share is almost equal to the share in production capacity. This means that the averageload factor of fuel cells is similar to the average load factor for all power plants.
Most of these fuel cells (SOFCs or MCFCs) are fuelled by natural gas and oil products, rather thanby hydrogen. The use of stationary fuel cells is also less scenario-dependent than the use of FCVsand hydrogen in general. The economic advantages of stationary fuel cells, compared to hydrogenFCVs, are due to their higher load factor and the higher cost of competing options. The fact that theshare of stationary fuel cells is reasonably stable across various scenarios indicates that they representa robust technology option that should be included in any balanced energy technology portfolio.

174 PROSPECTS FOR HYDROGEN AND FUEL CELLS
Figure 7.9
Global stationary fuel cell use in the ESTEC scenarios
Scenario AESTEC – – + + –
Scenario BESTEC 0 + + + –
Scenario CESTEC 0 + – – –
Scenario DESTEC + + + + +
0
50
100
150
200
250
300
350
2000 2010 2020 2030 2040 2050
Stat
ion
ary
fuel
cel
l cap
acity
[GW
]
Key point: Market introduction from 2020 and growingto 200-300 GW by 2050
Stationary fuel cell use in 2030 is concentrated in the residential and commercial sectors (Figure7.10). In the period 2030-2050, the main growth is in the cogeneration of electricity and heat (CHPapplications) in the industrial sector. Fuel cells only play a significant role in centralised power productionin scenario D, with about 25 GW of coal-fired IGCC-SOFC systems in 2050. The ESTEC scenarioshighlight the important contribution of fuel cells in decentralised power production applications.
In terms of the fuel input used by these fuel cells, natural gas fuel cell systems dominate in both2030 and 2050 (Figure 7.11). However, in 2050 an important proportion, up to 22% of all fuel cells,use fuel oil or other oil refinery products. In the most optimistic scenario, coal-gas fuel cells are usedin centralised power plants. Interestingly, there is no use of hydrogen fuel cells for stationary applicationsin any of the ESTEC scenarios. This result can be explained by the high cost of a dedicated hydrogensupply system, but also by the flexibility of the SOFC and MCFC systems, which do not need a fuelreformer, are less sensitive to poisoning than PEM fuel cells, and have higher conversion efficiencies.Stationary fuel cells compete with a number of relatively low-cost CO2-free electricity supply optionssuch as renewables, centralised fossil-fuel power plants with CCS, and nuclear. Despite this, theirshare is rather stable across scenarios and is not very sensitive to any of the policy settings assumed.This can be seen either as an advantage or as a drawback for these technologies. For example, evermore ambitious CO2 policies do not necessarily benefit stationary fuel cells.
Assuming the extensive use of hydrogen in transportation and the associated development of refuellingstation infrastructure by 2050, a certain number of stationary hydrogen fuel cells could also beconnected to the distribution system, thus improving the economies of scale of the overall hydrogensystem. Such a synergy has not been considered in this analysis, but in principle the availability ofhydrogen for automotive applications could be a driver for the use of hydrogen stationary fuel cells.

7. SCENARIO ANALYSIS AND REGIONAL ACTIVITIES 175
Figure 7.10
Global stationary fuel cell capacity by sector in the ESTEC scenarios
Industry
Residential & commercial
Centralised power plants
Scenario A ESTEC
– – + + – 2030
Scenario B ESTEC
0 + + + – 2030
Scenario C ESTEC
0 + – – – 2030
Scenario D ESTEC
+ + + + + 2030
Scenario A ESTEC
– – + + – 2050
Scenario B ESTEC
0 + + + – 2050
Scenario C ESTEC
0 + – – – 2050
Scenario D ESTEC
+ + + + + 2050
0
50
100
150
200
250
300
350
[GW
]
Key point: Starting from 2020 and growingto 200-300 GW by 2050
Figure 7.11
Global stationary fuel cell capacity by fuel input in the ESTEC scenarios
Scenario A ESTEC
– – + + – 2030
Scenario B ESTEC
0 + + + – 2030
Scenario C ESTEC
0 + – – – 2030
Scenario D ESTEC
+ + + + + 2030
Scenario A ESTEC
– – + + – 2050
Scenario B ESTEC
0 + + + – 2050
Scenario C ESTEC
0 + – – – 2050
Scenario D ESTEC
+ + + + + 2050
[GW
]
Hydrogen
Coal
Fuel oil
Natural gas
0
50
100
150
200
250
300
350
Key point: Gas-fired systems dominate
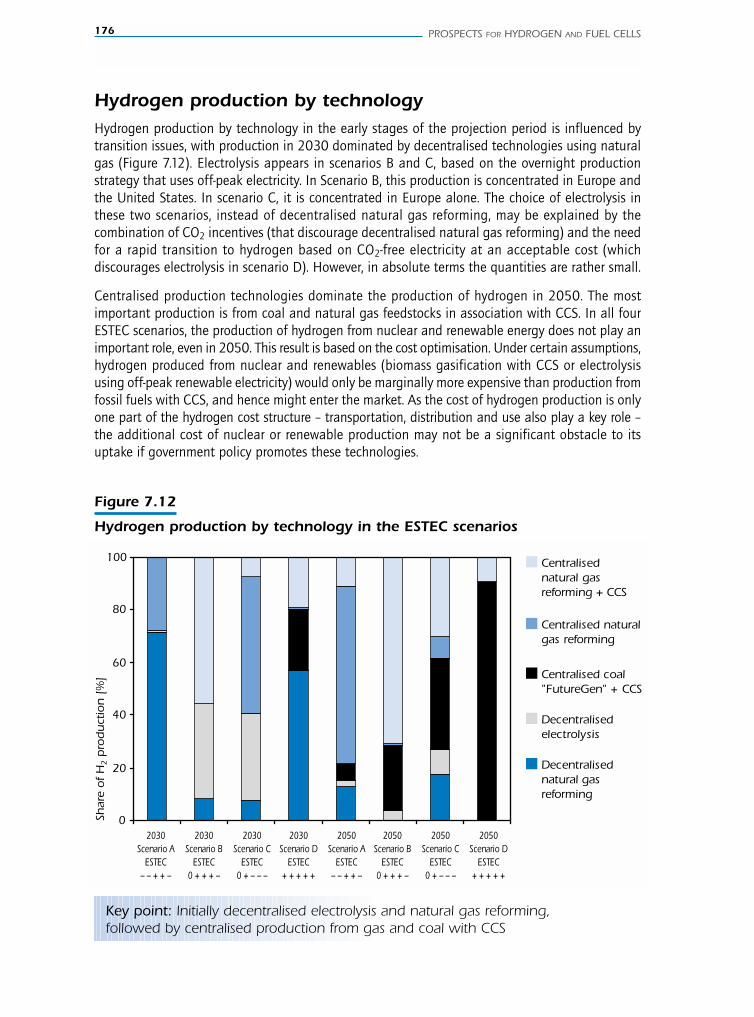
176 PROSPECTS FOR HYDROGEN AND FUEL CELLS
Hydrogen production by technology Hydrogen production by technology in the early stages of the projection period is influenced bytransition issues, with production in 2030 dominated by decentralised technologies using naturalgas (Figure 7.12). Electrolysis appears in scenarios B and C, based on the overnight productionstrategy that uses off-peak electricity. In Scenario B, this production is concentrated in Europe andthe United States. In scenario C, it is concentrated in Europe alone. The choice of electrolysis inthese two scenarios, instead of decentralised natural gas reforming, may be explained by thecombination of CO2 incentives (that discourage decentralised natural gas reforming) and the needfor a rapid transition to hydrogen based on CO2-free electricity at an acceptable cost (whichdiscourages electrolysis in scenario D). However, in absolute terms the quantities are rather small.
Centralised production technologies dominate the production of hydrogen in 2050. The mostimportant production is from coal and natural gas feedstocks in association with CCS. In all fourESTEC scenarios, the production of hydrogen from nuclear and renewable energy does not play animportant role, even in 2050. This result is based on the cost optimisation. Under certain assumptions,hydrogen produced from nuclear and renewables (biomass gasification with CCS or electrolysisusing off-peak renewable electricity) would only be marginally more expensive than production fromfossil fuels with CCS, and hence might enter the market. As the cost of hydrogen production is onlyone part of the hydrogen cost structure – transportation, distribution and use also play a key role –the additional cost of nuclear or renewable production may not be a significant obstacle to itsuptake if government policy promotes these technologies.
Figure 7.12
Hydrogen production by technology in the ESTEC scenarios
2030 Scenario A
ESTEC – – + + –
2030 Scenario B
ESTEC 0 + + + –
2030 Scenario C
ESTEC 0 + – – –
2030 Scenario D
ESTEC+ + + + +
2050 Scenario A
ESTEC – – + + –
2050 Scenario B
ESTEC 0 + + + –
2050 Scenario C
ESTEC 0 + – – –
2050 Scenario D
ESTEC+ + + + +
0
20
40
60
80
100
Decentralisednatural gasreforming
Decentralised electrolysis
Centralised coal"FutureGen" + CCS
Centralised natural gas reforming
Centralisednatural gas reforming + CCS
Shar
e o
f H
2 p
rod
uct
ion
[%
]
Key point: Initially decentralised electrolysis and natural gas reforming,followed by centralised production from gas and coal with CCS
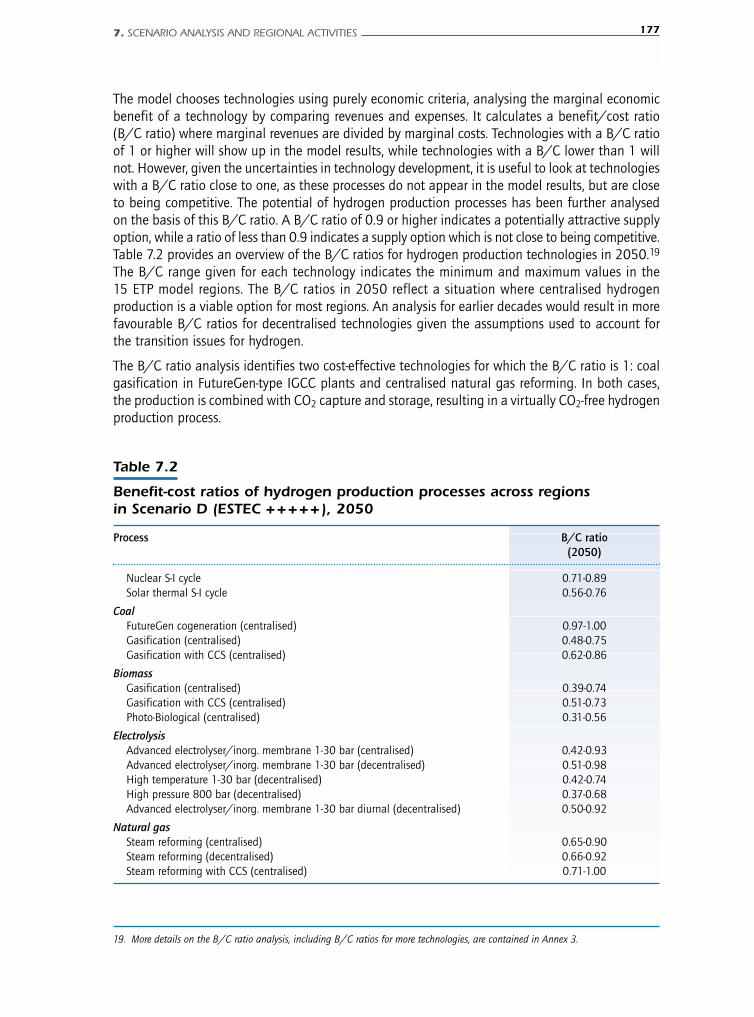
The model chooses technologies using purely economic criteria, analysing the marginal economicbenefit of a technology by comparing revenues and expenses. It calculates a benefit/cost ratio(B/C ratio) where marginal revenues are divided by marginal costs. Technologies with a B/C ratioof 1 or higher will show up in the model results, while technologies with a B/C lower than 1 willnot. However, given the uncertainties in technology development, it is useful to look at technologieswith a B/C ratio close to one, as these processes do not appear in the model results, but are closeto being competitive. The potential of hydrogen production processes has been further analysedon the basis of this B/C ratio. A B/C ratio of 0.9 or higher indicates a potentially attractive supplyoption, while a ratio of less than 0.9 indicates a supply option which is not close to being competitive.Table 7.2 provides an overview of the B/C ratios for hydrogen production technologies in 2050.19
The B/C range given for each technology indicates the minimum and maximum values in the15 ETP model regions. The B/C ratios in 2050 reflect a situation where centralised hydrogenproduction is a viable option for most regions. An analysis for earlier decades would result in morefavourable B/C ratios for decentralised technologies given the assumptions used to account forthe transition issues for hydrogen.
The B/C ratio analysis identifies two cost-effective technologies for which the B/C ratio is 1: coalgasification in FutureGen-type IGCC plants and centralised natural gas reforming. In both cases,the production is combined with CO2 capture and storage, resulting in a virtually CO2-free hydrogenproduction process.
7. SCENARIO ANALYSIS AND REGIONAL ACTIVITIES 177
19. More details on the B/C ratio analysis, including B/C ratios for more technologies, are contained in Annex 3.
Table 7.2
Benefit-cost ratios of hydrogen production processes across regionsin Scenario D (ESTEC +++++), 2050
Process B/C ratio(2050)
Nuclear S-I cycle 0.71-0.89Solar thermal S-I cycle 0.56-0.76
CoalFutureGen cogeneration (centralised) 0.97-1.00Gasification (centralised) 0.48-0.75Gasification with CCS (centralised) 0.62-0.86
BiomassGasification (centralised) 0.39-0.74Gasification with CCS (centralised) 0.51-0.73Photo-Biological (centralised) 0.31-0.56
ElectrolysisAdvanced electrolyser/inorg. membrane 1-30 bar (centralised) 0.42-0.93Advanced electrolyser/inorg. membrane 1-30 bar (decentralised) 0.51-0.98High temperature 1-30 bar (decentralised) 0.42-0.74High pressure 800 bar (decentralised) 0.37-0.68Advanced electrolyser/inorg. membrane 1-30 bar diurnal (decentralised) 0.50-0.92
Natural gasSteam reforming (centralised) 0.65-0.90Steam reforming (decentralised) 0.66-0.92Steam reforming with CCS (centralised) 0.71-1.00
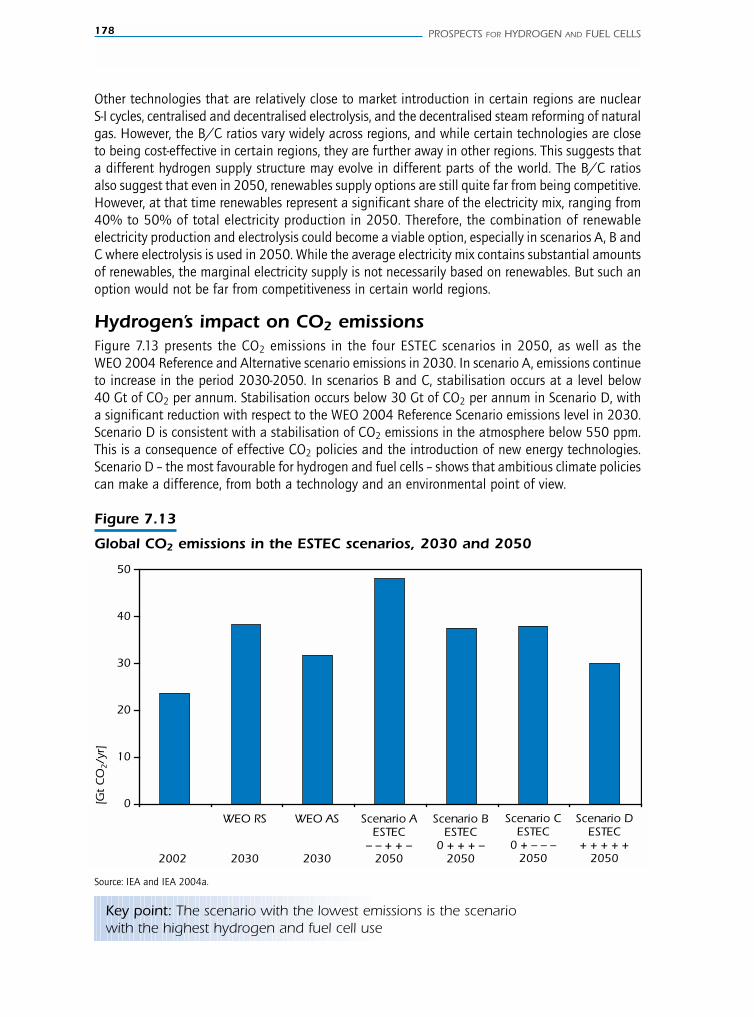
178 PROSPECTS FOR HYDROGEN AND FUEL CELLS
Other technologies that are relatively close to market introduction in certain regions are nuclearS-I cycles, centralised and decentralised electrolysis, and the decentralised steam reforming of naturalgas. However, the B/C ratios vary widely across regions, and while certain technologies are closeto being cost-effective in certain regions, they are further away in other regions. This suggests thata different hydrogen supply structure may evolve in different parts of the world. The B/C ratiosalso suggest that even in 2050, renewables supply options are still quite far from being competitive.However, at that time renewables represent a significant share of the electricity mix, ranging from40% to 50% of total electricity production in 2050. Therefore, the combination of renewableelectricity production and electrolysis could become a viable option, especially in scenarios A, B andC where electrolysis is used in 2050. While the average electricity mix contains substantial amountsof renewables, the marginal electricity supply is not necessarily based on renewables. But such anoption would not be far from competitiveness in certain world regions.
Hydrogen’s impact on CO2 emissions Figure 7.13 presents the CO2 emissions in the four ESTEC scenarios in 2050, as well as theWEO 2004 Reference and Alternative scenario emissions in 2030. In scenario A, emissions continueto increase in the period 2030-2050. In scenarios B and C, stabilisation occurs at a level below40 Gt of CO2 per annum. Stabilisation occurs below 30 Gt of CO2 per annum in Scenario D, witha significant reduction with respect to the WEO 2004 Reference Scenario emissions level in 2030.Scenario D is consistent with a stabilisation of CO2 emissions in the atmosphere below 550 ppm.This is a consequence of effective CO2 policies and the introduction of new energy technologies.Scenario D – the most favourable for hydrogen and fuel cells – shows that ambitious climate policiescan make a difference, from both a technology and an environmental point of view.
Figure 7.13
Global CO2 emissions in the ESTEC scenarios, 2030 and 2050
0
10
20
30
40
50
[Gt
CO
2/y
r]
2002
WEO RS
2030
WEO AS
2030
Scenario A ESTEC
– – + + – 2050
Scenario B ESTEC
0 + + + – 2050
Scenario C ESTEC
0 + – – – 2050
Scenario D ESTEC
+ + + + + 2050
Key point: The scenario with the lowest emissions is the scenariowith the highest hydrogen and fuel cell use
Source: IEA and IEA 2004a.
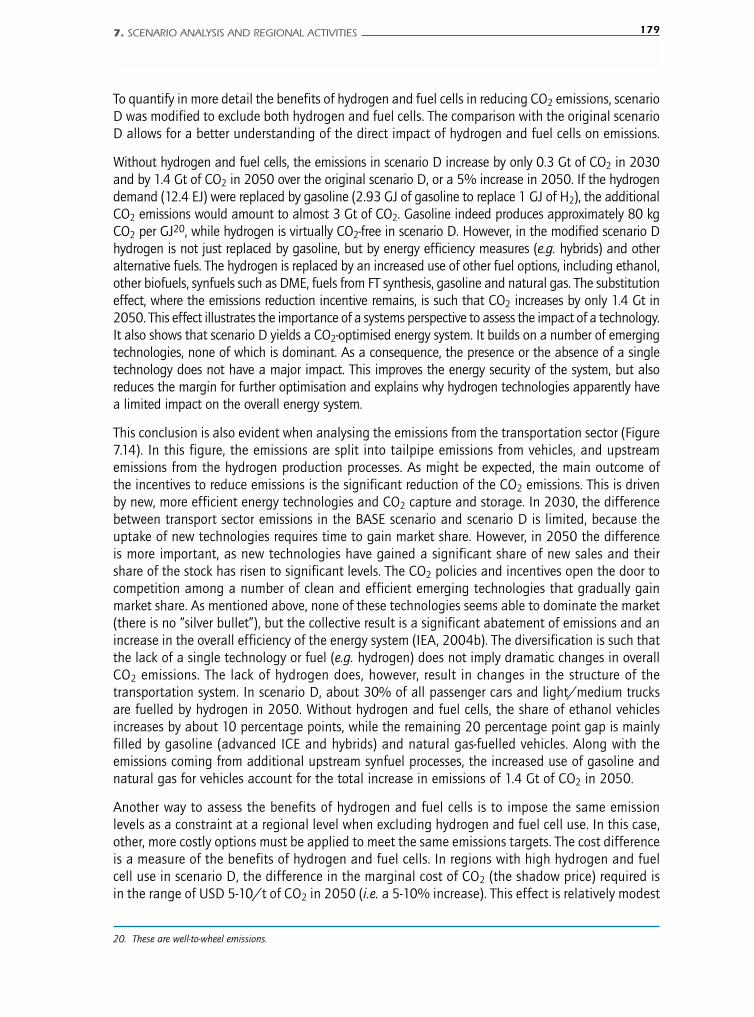
To quantify in more detail the benefits of hydrogen and fuel cells in reducing CO2 emissions, scenarioD was modified to exclude both hydrogen and fuel cells. The comparison with the original scenarioD allows for a better understanding of the direct impact of hydrogen and fuel cells on emissions.
Without hydrogen and fuel cells, the emissions in scenario D increase by only 0.3 Gt of CO2 in 2030and by 1.4 Gt of CO2 in 2050 over the original scenario D, or a 5% increase in 2050. If the hydrogendemand (12.4 EJ) were replaced by gasoline (2.93 GJ of gasoline to replace 1 GJ of H2), the additionalCO2 emissions would amount to almost 3 Gt of CO2. Gasoline indeed produces approximately 80 kgCO2 per GJ20, while hydrogen is virtually CO2-free in scenario D. However, in the modified scenario Dhydrogen is not just replaced by gasoline, but by energy efficiency measures (e.g. hybrids) and otheralternative fuels. The hydrogen is replaced by an increased use of other fuel options, including ethanol,other biofuels, synfuels such as DME, fuels from FT synthesis, gasoline and natural gas. The substitutioneffect, where the emissions reduction incentive remains, is such that CO2 increases by only 1.4 Gt in2050. This effect illustrates the importance of a systems perspective to assess the impact of a technology.It also shows that scenario D yields a CO2-optimised energy system. It builds on a number of emergingtechnologies, none of which is dominant. As a consequence, the presence or the absence of a singletechnology does not have a major impact. This improves the energy security of the system, but alsoreduces the margin for further optimisation and explains why hydrogen technologies apparently havea limited impact on the overall energy system.
This conclusion is also evident when analysing the emissions from the transportation sector (Figure7.14). In this figure, the emissions are split into tailpipe emissions from vehicles, and upstreamemissions from the hydrogen production processes. As might be expected, the main outcome ofthe incentives to reduce emissions is the significant reduction of the CO2 emissions. This is drivenby new, more efficient energy technologies and CO2 capture and storage. In 2030, the differencebetween transport sector emissions in the BASE scenario and scenario D is limited, because theuptake of new technologies requires time to gain market share. However, in 2050 the differenceis more important, as new technologies have gained a significant share of new sales and theirshare of the stock has risen to significant levels. The CO2 policies and incentives open the door tocompetition among a number of clean and efficient emerging technologies that gradually gainmarket share. As mentioned above, none of these technologies seems able to dominate the market(there is no “silver bullet”), but the collective result is a significant abatement of emissions and anincrease in the overall efficiency of the energy system (IEA, 2004b). The diversification is such thatthe lack of a single technology or fuel (e.g. hydrogen) does not imply dramatic changes in overallCO2 emissions. The lack of hydrogen does, however, result in changes in the structure of thetransportation system. In scenario D, about 30% of all passenger cars and light/medium trucksare fuelled by hydrogen in 2050. Without hydrogen and fuel cells, the share of ethanol vehiclesincreases by about 10 percentage points, while the remaining 20 percentage point gap is mainlyfilled by gasoline (advanced ICE and hybrids) and natural gas-fuelled vehicles. Along with theemissions coming from additional upstream synfuel processes, the increased use of gasoline andnatural gas for vehicles account for the total increase in emissions of 1.4 Gt of CO2 in 2050.
Another way to assess the benefits of hydrogen and fuel cells is to impose the same emissionlevels as a constraint at a regional level when excluding hydrogen and fuel cell use. In this case,other, more costly options must be applied to meet the same emissions targets. The cost differenceis a measure of the benefits of hydrogen and fuel cells. In regions with high hydrogen and fuelcell use in scenario D, the difference in the marginal cost of CO2 (the shadow price) required isin the range of USD 5-10/t of CO2 in 2050 (i.e. a 5-10% increase). This effect is relatively modest
7. SCENARIO ANALYSIS AND REGIONAL ACTIVITIES 179
20. These are well-to-wheel emissions.
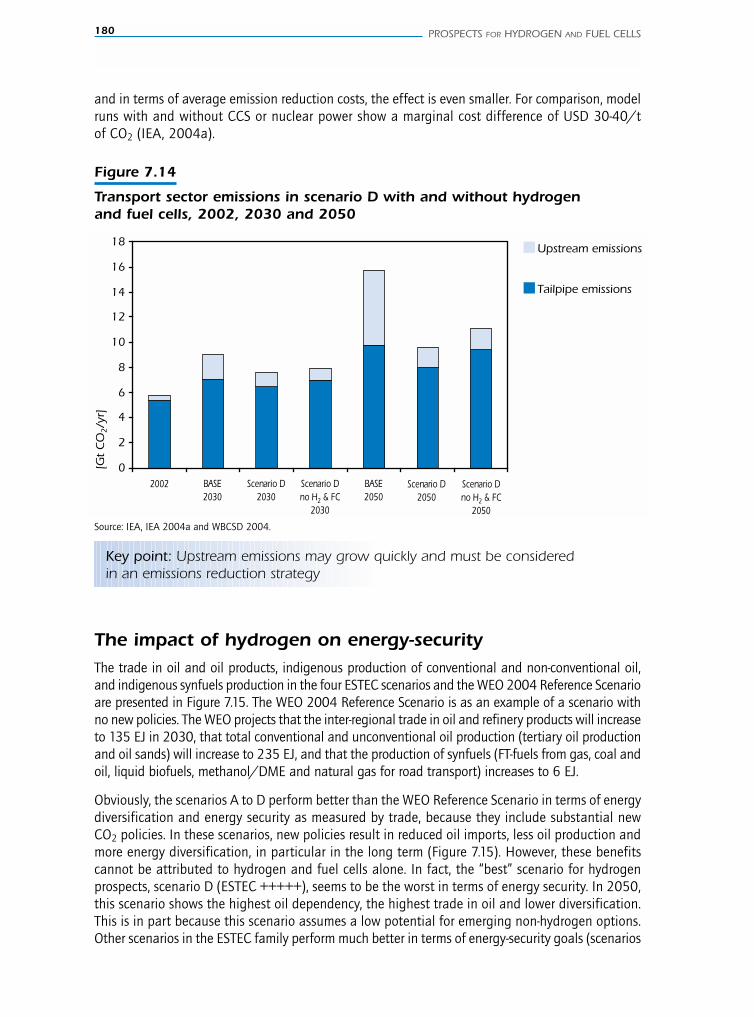
180 PROSPECTS FOR HYDROGEN AND FUEL CELLS
and in terms of average emission reduction costs, the effect is even smaller. For comparison, modelruns with and without CCS or nuclear power show a marginal cost difference of USD 30-40/tof CO2 (IEA, 2004a).
Figure 7.14
Transport sector emissions in scenario D with and without hydrogenand fuel cells, 2002, 2030 and 2050
Tailpipe emissions
Upstream emissions
0
2
4
6
8
10
12
14
16
18
[Gt
CO
2/y
r]
2002
Scenario D 2030
BASE 2030
Scenario D no H2 & FC
2030
BASE 2050
Scenario D 2050
Scenario D no H2 & FC
2050
Key point: Upstream emissions may grow quickly and must be consideredin an emissions reduction strategy
Source: IEA, IEA 2004a and WBCSD 2004.
The impact of hydrogen on energy-security The trade in oil and oil products, indigenous production of conventional and non-conventional oil,and indigenous synfuels production in the four ESTEC scenarios and the WEO 2004 Reference Scenarioare presented in Figure 7.15. The WEO 2004 Reference Scenario is as an example of a scenario withno new policies. The WEO projects that the inter-regional trade in oil and refinery products will increaseto 135 EJ in 2030, that total conventional and unconventional oil production (tertiary oil productionand oil sands) will increase to 235 EJ, and that the production of synfuels (FT-fuels from gas, coal andoil, liquid biofuels, methanol/DME and natural gas for road transport) increases to 6 EJ.
Obviously, the scenarios A to D perform better than the WEO Reference Scenario in terms of energydiversification and energy security as measured by trade, because they include substantial newCO2 policies. In these scenarios, new policies result in reduced oil imports, less oil production andmore energy diversification, in particular in the long term (Figure 7.15). However, these benefitscannot be attributed to hydrogen and fuel cells alone. In fact, the “best” scenario for hydrogenprospects, scenario D (ESTEC +++++), seems to be the worst in terms of energy security. In 2050,this scenario shows the highest oil dependency, the highest trade in oil and lower diversification.This is in part because this scenario assumes a low potential for emerging non-hydrogen options.Other scenarios in the ESTEC family perform much better in terms of energy-security goals (scenarios
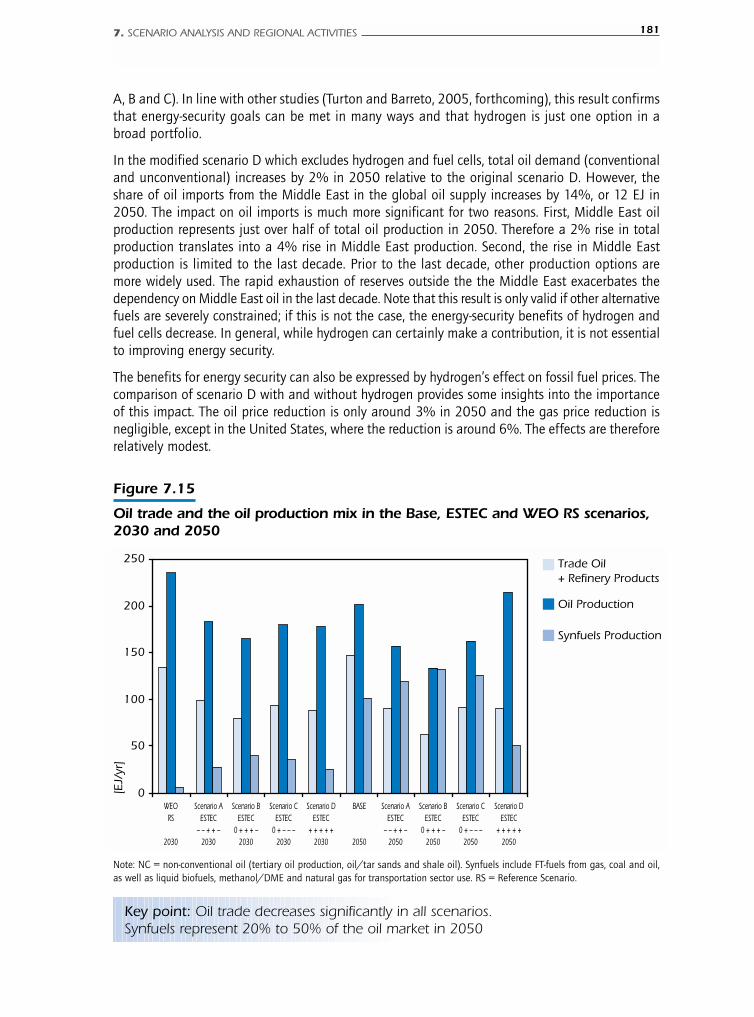
A, B and C). In line with other studies (Turton and Barreto, 2005, forthcoming), this result confirmsthat energy-security goals can be met in many ways and that hydrogen is just one option in abroad portfolio.
In the modified scenario D which excludes hydrogen and fuel cells, total oil demand (conventionaland unconventional) increases by 2% in 2050 relative to the original scenario D. However, theshare of oil imports from the Middle East in the global oil supply increases by 14%, or 12 EJ in2050. The impact on oil imports is much more significant for two reasons. First, Middle East oilproduction represents just over half of total oil production in 2050. Therefore a 2% rise in totalproduction translates into a 4% rise in Middle East production. Second, the rise in Middle Eastproduction is limited to the last decade. Prior to the last decade, other production options aremore widely used. The rapid exhaustion of reserves outside the the Middle East exacerbates thedependency on Middle East oil in the last decade. Note that this result is only valid if other alternativefuels are severely constrained; if this is not the case, the energy-security benefits of hydrogen andfuel cells decrease. In general, while hydrogen can certainly make a contribution, it is not essentialto improving energy security.
The benefits for energy security can also be expressed by hydrogen’s effect on fossil fuel prices. Thecomparison of scenario D with and without hydrogen provides some insights into the importanceof this impact. The oil price reduction is only around 3% in 2050 and the gas price reduction isnegligible, except in the United States, where the reduction is around 6%. The effects are thereforerelatively modest.
7. SCENARIO ANALYSIS AND REGIONAL ACTIVITIES 181
Figure 7.15
Oil trade and the oil production mix in the Base, ESTEC and WEO RS scenarios,2030 and 2050
0
50
100
150
200
250
[EJ/
yr]
Trade Oil + Refinery Products
Oil Production
Synfuels Production
Scenario A ESTEC
– – + + – 2030
WEO RS
2030
BASE
2050
Scenario B ESTEC
0 + + + – 2030
Scenario C ESTEC
0 + – – – 2030
Scenario D ESTEC
+ + + + + 2030
Scenario A ESTEC
– – + + – 2050
Scenario B ESTEC
0 + + + – 2050
Scenario C ESTEC
0 + – – –2050
Scenario D ESTEC
+ + + + + 2050
Key point: Oil trade decreases significantly in all scenarios.Synfuels represent 20% to 50% of the oil market in 2050
Note: NC = non-conventional oil (tertiary oil production, oil/tar sands and shale oil). Synfuels include FT-fuels from gas, coal and oil,as well as liquid biofuels, methanol/DME and natural gas for transportation sector use. RS = Reference Scenario.
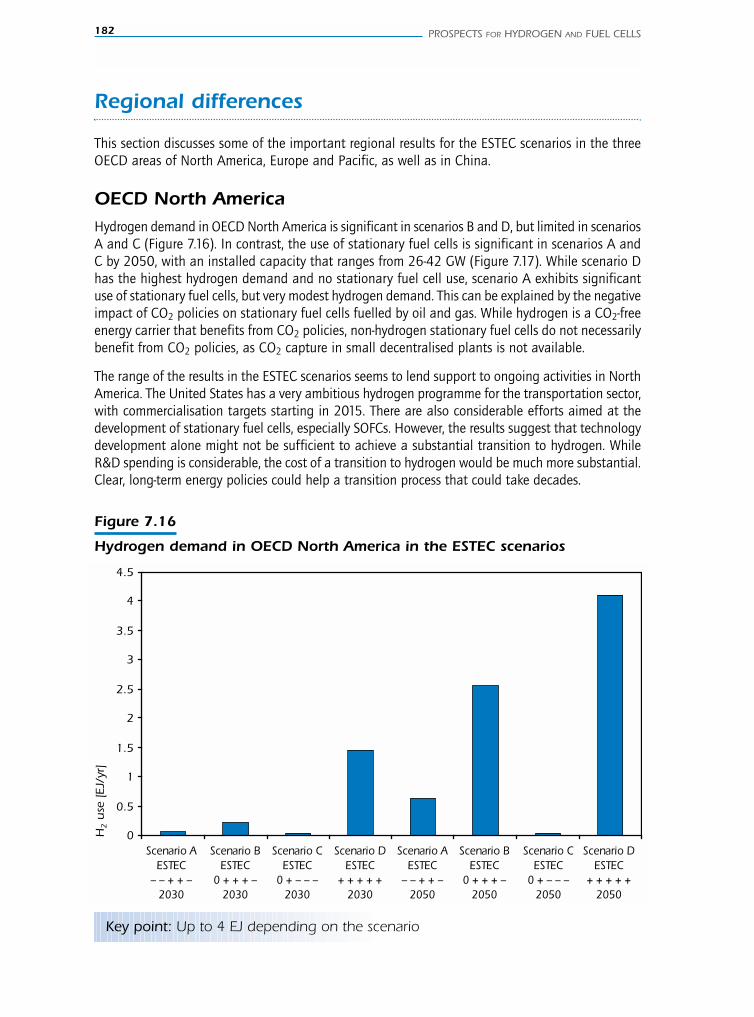
182 PROSPECTS FOR HYDROGEN AND FUEL CELLS
Regional differences
This section discusses some of the important regional results for the ESTEC scenarios in the threeOECD areas of North America, Europe and Pacific, as well as in China.
OECD North AmericaHydrogen demand in OECD North America is significant in scenarios B and D, but limited in scenariosA and C (Figure 7.16). In contrast, the use of stationary fuel cells is significant in scenarios A andC by 2050, with an installed capacity that ranges from 26-42 GW (Figure 7.17). While scenario Dhas the highest hydrogen demand and no stationary fuel cell use, scenario A exhibits significantuse of stationary fuel cells, but very modest hydrogen demand. This can be explained by the negativeimpact of CO2 policies on stationary fuel cells fuelled by oil and gas. While hydrogen is a CO2-freeenergy carrier that benefits from CO2 policies, non-hydrogen stationary fuel cells do not necessarilybenefit from CO2 policies, as CO2 capture in small decentralised plants is not available.
The range of the results in the ESTEC scenarios seems to lend support to ongoing activities in NorthAmerica. The United States has a very ambitious hydrogen programme for the transportation sector,with commercialisation targets starting in 2015. There are also considerable efforts aimed at thedevelopment of stationary fuel cells, especially SOFCs. However, the results suggest that technologydevelopment alone might not be sufficient to achieve a substantial transition to hydrogen. WhileR&D spending is considerable, the cost of a transition to hydrogen would be much more substantial.Clear, long-term energy policies could help a transition process that could take decades.
Figure 7.16
Hydrogen demand in OECD North America in the ESTEC scenarios
Scenario A ESTEC
– – + + – 2030
Scenario B ESTEC
0 + + + – 2030
Scenario C ESTEC
0 + – – – 2030
Scenario D ESTEC
+ + + + + 2030
Scenario A ESTEC
– – + + – 2050
Scenario B ESTEC
0 + + + – 2050
Scenario C ESTEC
0 + – – – 2050
Scenario D ESTEC
+ + + + + 2050
0
0.5
1
1.5
2
2.5
3
3.5
4
4.5
H2 u
se [
EJ/
yr]
Key point: Up to 4 EJ depending on the scenario
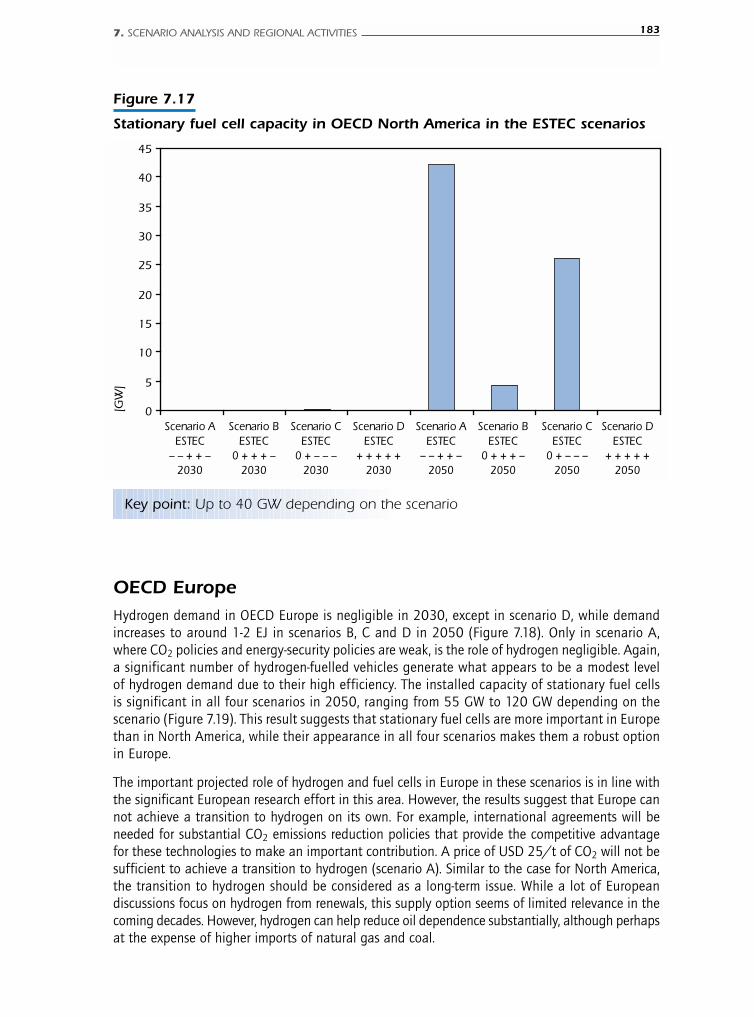
OECD Europe Hydrogen demand in OECD Europe is negligible in 2030, except in scenario D, while demandincreases to around 1-2 EJ in scenarios B, C and D in 2050 (Figure 7.18). Only in scenario A,where CO2 policies and energy-security policies are weak, is the role of hydrogen negligible. Again,a significant number of hydrogen-fuelled vehicles generate what appears to be a modest levelof hydrogen demand due to their high efficiency. The installed capacity of stationary fuel cellsis significant in all four scenarios in 2050, ranging from 55 GW to 120 GW depending on thescenario (Figure 7.19). This result suggests that stationary fuel cells are more important in Europethan in North America, while their appearance in all four scenarios makes them a robust optionin Europe.
The important projected role of hydrogen and fuel cells in Europe in these scenarios is in line withthe significant European research effort in this area. However, the results suggest that Europe cannot achieve a transition to hydrogen on its own. For example, international agreements will beneeded for substantial CO2 emissions reduction policies that provide the competitive advantagefor these technologies to make an important contribution. A price of USD 25/t of CO2 will not besufficient to achieve a transition to hydrogen (scenario A). Similar to the case for North America,the transition to hydrogen should be considered as a long-term issue. While a lot of Europeandiscussions focus on hydrogen from renewals, this supply option seems of limited relevance in thecoming decades. However, hydrogen can help reduce oil dependence substantially, although perhapsat the expense of higher imports of natural gas and coal.
7. SCENARIO ANALYSIS AND REGIONAL ACTIVITIES 183
Figure 7.17
Stationary fuel cell capacity in OECD North America in the ESTEC scenarios
Scenario A ESTEC
– – + + – 2030
Scenario B ESTEC
0 + + + – 2030
Scenario C ESTEC
0 + – – – 2030
Scenario D ESTEC
+ + + + + 2030
Scenario A ESTEC
– – + + – 2050
Scenario B ESTEC
0 + + + – 2050
Scenario C ESTEC
0 + – – – 2050
Scenario D ESTEC
+ + + + + 2050
0
5
10
15
20
25
30
35
40
45
[GW
]
Key point: Up to 40 GW depending on the scenario
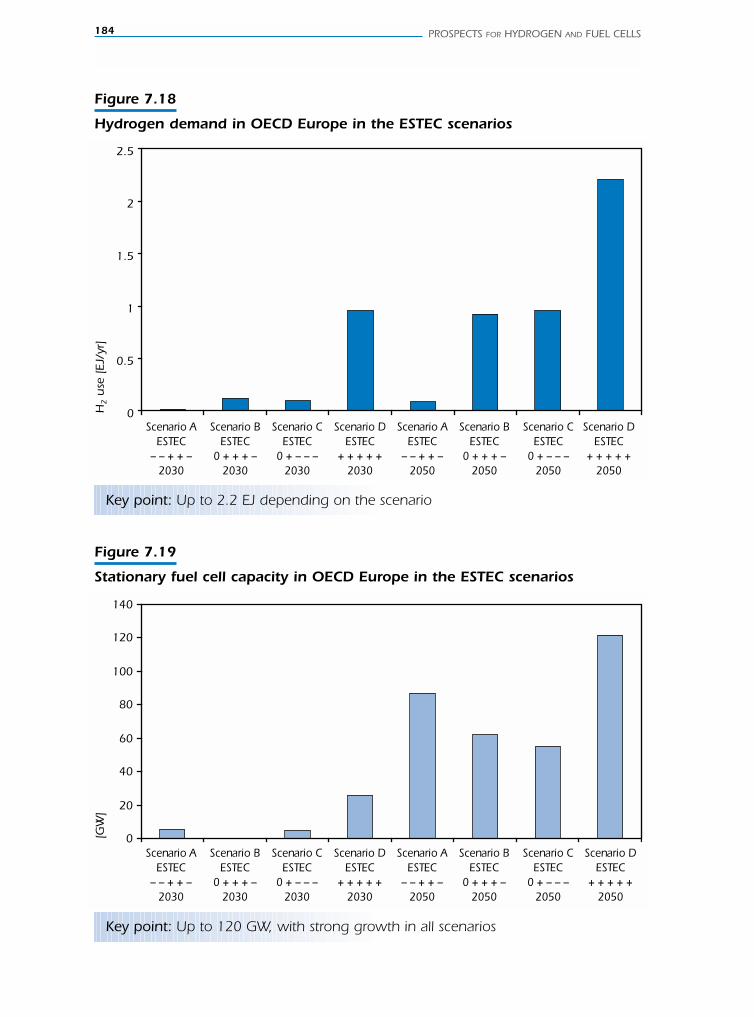
184 PROSPECTS FOR HYDROGEN AND FUEL CELLS
Figure 7.18
Hydrogen demand in OECD Europe in the ESTEC scenarios
Scenario A ESTEC
– – + + – 2030
Scenario B ESTEC
0 + + + – 2030
Scenario C ESTEC
0 + – – – 2030
Scenario D ESTEC
+ + + + + 2030
Scenario A ESTEC
– – + + – 2050
Scenario B ESTEC
0 + + + – 2050
Scenario C ESTEC
0 + – – – 2050
Scenario D ESTEC
+ + + + + 2050
H2 u
se [
EJ/
yr]
0
0.5
1
1.5
2
2.5
Key point: Up to 2.2 EJ depending on the scenario
Figure 7.19
Stationary fuel cell capacity in OECD Europe in the ESTEC scenarios
Scenario A ESTEC
– – + + – 2030
Scenario B ESTEC
0 + + + – 2030
Scenario C ESTEC
0 + – – – 2030
Scenario D ESTEC
+ + + + + 2030
Scenario A ESTEC
– – + + – 2050
Scenario B ESTEC
0 + + + – 2050
Scenario C ESTEC
0 + – – – 2050
Scenario D ESTEC
+ + + + + 2050
[GW
]
0
20
40
60
80
100
120
140
Key point: Up to 120 GW, with strong growth in all scenarios
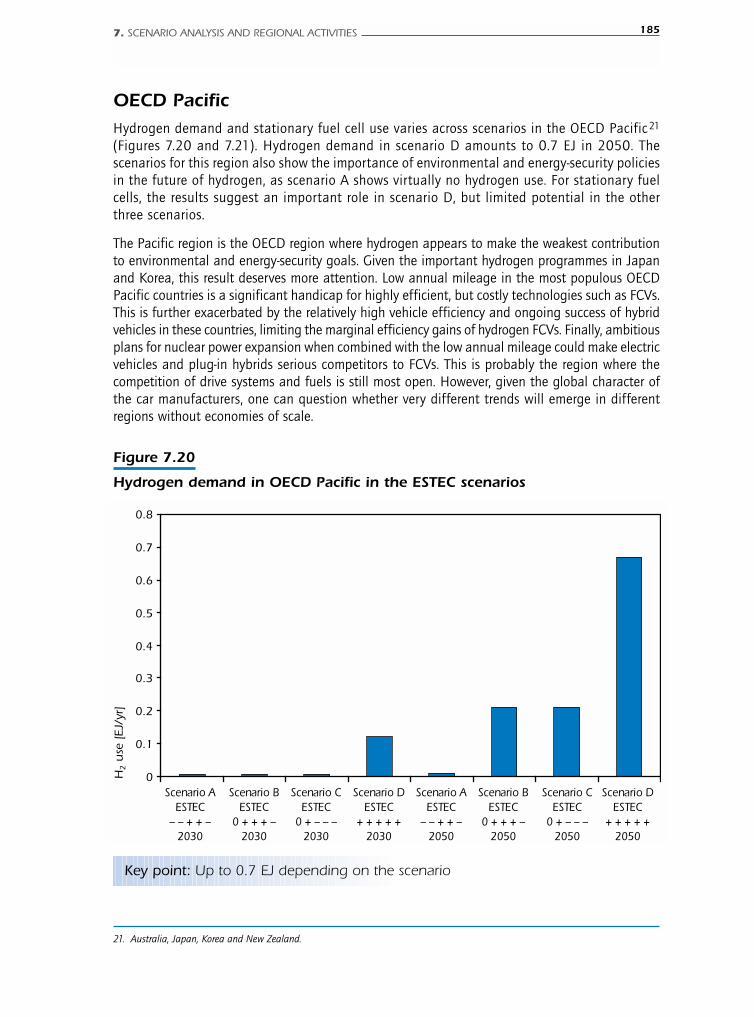
OECD PacificHydrogen demand and stationary fuel cell use varies across scenarios in the OECD Pacific21
(Figures 7.20 and 7.21). Hydrogen demand in scenario D amounts to 0.7 EJ in 2050. Thescenarios for this region also show the importance of environmental and energy-security policiesin the future of hydrogen, as scenario A shows virtually no hydrogen use. For stationary fuelcells, the results suggest an important role in scenario D, but limited potential in the otherthree scenarios.
The Pacific region is the OECD region where hydrogen appears to make the weakest contributionto environmental and energy-security goals. Given the important hydrogen programmes in Japanand Korea, this result deserves more attention. Low annual mileage in the most populous OECDPacific countries is a significant handicap for highly efficient, but costly technologies such as FCVs.This is further exacerbated by the relatively high vehicle efficiency and ongoing success of hybridvehicles in these countries, limiting the marginal efficiency gains of hydrogen FCVs. Finally, ambitiousplans for nuclear power expansion when combined with the low annual mileage could make electricvehicles and plug-in hybrids serious competitors to FCVs. This is probably the region where thecompetition of drive systems and fuels is still most open. However, given the global character ofthe car manufacturers, one can question whether very different trends will emerge in differentregions without economies of scale.
7. SCENARIO ANALYSIS AND REGIONAL ACTIVITIES 185
21. Australia, Japan, Korea and New Zealand.
Figure 7.20
Hydrogen demand in OECD Pacific in the ESTEC scenarios
Scenario A ESTEC
– – + + – 2030
Scenario B ESTEC
0 + + + – 2030
Scenario C ESTEC
0 + – – – 2030
Scenario D ESTEC
+ + + + + 2030
Scenario A ESTEC
– – + + – 2050
Scenario B ESTEC
0 + + + – 2050
Scenario C ESTEC
0 + – – – 2050
Scenario D ESTEC
+ + + + + 2050
H2 u
se [
EJ/
yr]
0
0.1
0.2
0.3
0.4
0.5
0.6
0.7
0.8
Key point: Up to 0.7 EJ depending on the scenario

186 PROSPECTS FOR HYDROGEN AND FUEL CELLS
China Of the four ESTEC scenarios, hydrogen demand in China is only significant in scenario D (Figure 7.22).It is the scenario where China adopts ambitious CO2 policies and again suggests that a hydrogentransition will only happen in the case of ambitious policy targets. Energy-security policiesalone are not sufficient to bring hydrogen to the market, even in a region with limited indigenousoil resources such as China.
Stationary fuel cells have not been considered for heating in the residential and service sectors inChina. The reason is the wide range of climate zones in China that will result in very differentevaluation perspectives for fuel cells. While fuel cells may make sense in northern China, their usein southern China seems less likely. In addition, the regional availability of natural gas posesconstraints on stationary fuel cell use. The use of fuel cells in industry and in the power sector hasbeen considered, but they are not chosen by the model in any of the four ESTEC scenarios. However,industrial fuel cell use may make sense in urban areas where the use of coal-fired boilers has beenbanned. In urban centres such as Beijing and Shanghai, where natural gas is available or will becomeavailable, there may be a role for fuel cells in industrial CHP applications in small to medium-scaleindustries. Given the importance of China to future demand trends, this is an area that would benefitfrom further analysis at a more detailed modelling level.
Figure 7.21
Stationary fuel cell capacity in OECD Pacific in the ESTEC scenarios
Scenario A ESTEC
– – + + – 2030
Scenario B ESTEC
0 + + + – 2030
Scenario C ESTEC
0 + – – – 2030
Scenario D ESTEC
+ + + + + 2030
Scenario A ESTEC
– – + + – 2050
Scenario B ESTEC
0 + + + – 2050
Scenario C ESTEC
0 + – – – 2050
Scenario D ESTEC
+ + + + + 2050
[GW
]
00
1010
2020
3030
4040
5050
6060
Key point: Up to 50 GW, depending on the scenario
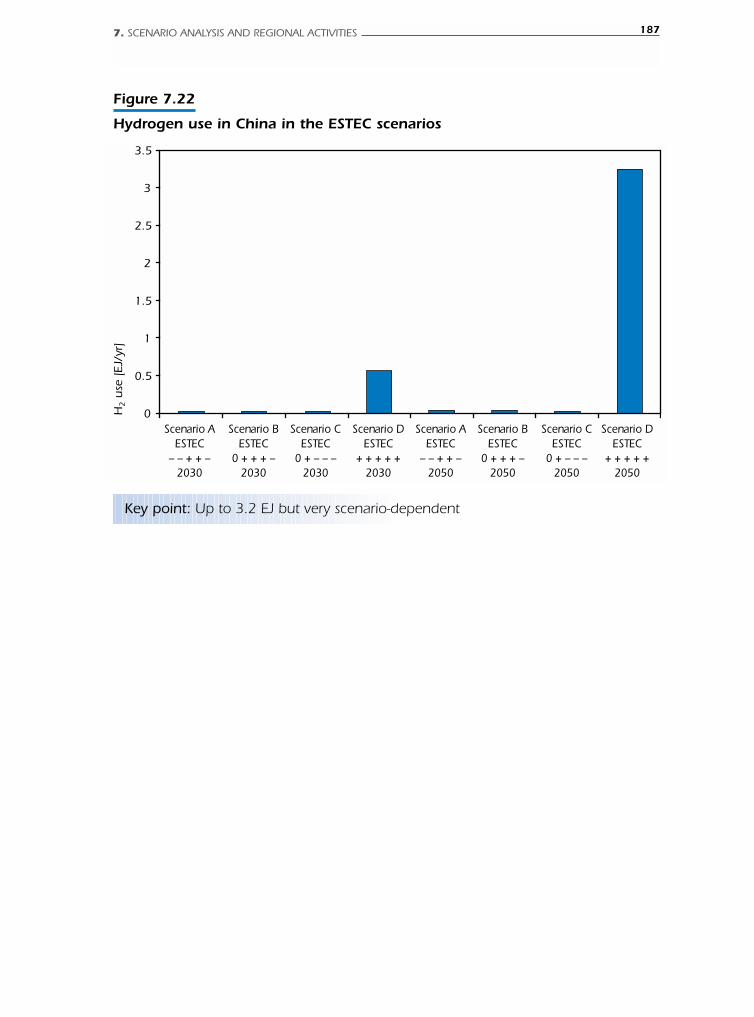
7. SCENARIO ANALYSIS AND REGIONAL ACTIVITIES 187
Figure 7.22
Hydrogen use in China in the ESTEC scenarios
Scenario A ESTEC
– – + + – 2030
Scenario B ESTEC
0 + + + – 2030
Scenario C ESTEC
0 + – – – 2030
Scenario D ESTEC
+ + + + + 2030
Scenario A ESTEC
– – + + – 2050
Scenario B ESTEC
0 + + + – 2050
Scenario C ESTEC
0 + – – – 2050
Scenario D ESTEC
+ + + + + 2050
H2 u
se [
EJ/
yr]
0
0.5
1
1.5
2
2.5
3
3.5
Key point: Up to 3.2 EJ but very scenario-dependent

8. CONCLUSIONS AND CHALLENGES AHEAD 189
Chapter 8.CONCLUSIONS AND CHALLENGES AHEAD
H I G H L I G H T S
■ No single energy technology, based on current prospects, offers the potential to be a “silverbullet” capable of curbing emissions and improving the security of energy supply. Thisapplies both to hydrogen and fuel cells. Instead, a balanced RD&D approach is neededto develop a broad technology portfolio.
■ Hydrogen and fuel cells can play a significant role in the future energy market if the currenttargets for reducing technology costs can be met in a timely manner and if governmentsenact new, concerted policies to mitigate emissions and limit oil dependency. Policiessolely aimed at enhancing energy-security would not necessarily result in a transition tohydrogen. Other technologies and fuels (e.g. synfuels from coal) would be more cost-effective at increasing energy diversification in a CO2-unconstrained world.
■ Under most favourable assumptions, hydrogen and fuel cells will contribute to meetingthe global energy demand in transport, with hydrogen fuel cell vehicles reaching up to30% of the vehicle stock by 2050. Fuel cells can also help meet the demand for distributedCHP, with some 200-300 GW by 2050. The collective impact of a number of emergingtechnologies (including hydrogen and fuel cells) and appropriate policies could stabiliseCO2 emissions in the period 2000-2050 and help diversify the energy system.
■ Development of a complete hydrogen supply infrastructure at this point in time is premature.Hydrogen and fuel cell research and demonstration are still at the development stage.The solutions to current technical issues and bottlenecks, such as better fuel cell performanceand hydrogen on-board storage, may have a considerable impact on the choice of thetechnologies for hydrogen production, distribution and refuelling.
■ Hydrogen and fuel cell RD&D efforts should focus on hydrogen production (cost-effective,CO2-free hydrogen and better decentralised production technologies), fuel cells (costreduction, durability, new materials and concepts) and on-board hydrogen storage. Emphasisshould also be put on hydrogen transportation and distribution. Insufficient progress inreducing the cost and energy consumption of the technologies for hydrogen transportationand distribution – a precondition for centralised production – could have a negative impacton the future of hydrogen as an energy carrier.
■ Some high-risk/high-reward technology options are presently at a very early stage ofdevelopment. These technologies include photo-electrolysis, the biological production ofhydrogen, water splitting by nuclear and solar heat, new materials for on-board solidstorage, and new fuel cell concepts. Their prospects are presently unclear but they maypotentially achieve significant breakthroughs with considerable impact on hydrogen andfuel cell applications, as well as on the overall energy system. The currently impressiveadvances in solid-state physics and materials science may also lead to unexpected andpleasant surprises in these R&D areas for hydrogen and fuel cells.
190 PROSPECTS FOR HYDROGEN AND FUEL CELLS
Previous chapters provided a detailed overview of the impact that potential technology advances, energypolicies and other key drivers may have on the introduction of hydrogen and fuel cells in the energymarket. R&D directions, infrastructure investment needs and the role hydrogen and fuel cells can play incurbing CO2 emissions and improving energy supply security were a part of that discussion. This chapterbuilds on the main findings to discuss in more detail the policy insights emerging from the study.
Market prospects for hydrogen and fuel cells
New technologies may quickly conquer the market if they offer immediate benefits such as lowercosts, superior performance or new, attractive services, even if they are costly. If this is not the case,if the new technologies offer “only” collective economic or social benefits in the mid to long-termat a higher cost than existing technologies, then they will need both government policies and“technology learning” to become economically competitive and enter the market. Governmentpolicies and technology learning driven by private investment hold important synergies and shouldact in concert in order to speed up market deployment.
At present, hydrogen and fuel cells appear to be a rather costly option to mitigate CO2 emissionsand enhance energy-security. Current prospects for cost reductions are unlikely to result in a significanteconomic advantage over existing technologies. Therefore, hydrogen and fuel cells are unlikely toemerge in future energy markets without decisive government policies and technology breakthroughsthat reduce costs substantially.
In a business-as-usual scenario (e.g. BASE, see Chapter 5) with no substantial new policies forenvironmental protection and energy diversification, hydrogen and fuel cells do not play a significanta role in the future energy mix. Also, policies solely aimed at enhancing energy-security would notnecessarily result in a transition to hydrogen. In a CO2-unconstrained world, other technologiesand fuels (e.g. coal) would be more cost-effective in increasing energy diversification.
Hydrogen may conquer a significant market share if effective policies for both CO2 mitigation and energy-security are in place in conjunction with a considerable reduction in the cost of hydrogen and fuel cells.
For the sake of this study, these policies have been collectively represented by an economic incentiveto curb CO2 emissions. The incentive, expressed in USD per tonne of CO2 emissions avoided, representsa variety of regulatory measures, subsidies and other policy instruments that promote hydrogenand other technologies with the potential to reduce emissions and improve energy diversification.All these policy instruments have the net effect of giving new technologies a value in terms ofemissions avoided. For example, under realistic assumptions for technology advances, a CO2 incentivethat increased gradually up to USD 50/t CO2 would stabilise emissions over the period 2000-2050 and halve the level of emissions in 2050 in comparison with the business-as usual scenario.The resulting energy mix would also be significantly more diverse.
The adoption of the CO2 incentive paves the way for intense competition among a number of newtechnologies with the potential to gain market share. None of them seems to be able to play adominant role in the future energy market (there is no “silver bullet” in energy technology), incomparison, for example, with the role played by oil in transport. However, their collective effectstabilises emissions and helps improve energy security by diversifying the energy system. Hydrogenand fuel cells are part of this broad technology portfolio.
In the most favourable, cost-optimal scenario (i.e. ESTEC D) – with the CO2 incentive graduallyincreasing up to USD 50/t CO2 and with quickly declining costs for hydrogen and fuel cells –hydrogen emerges as an important fuel in the transport sector beyond 2030. Some 12.5 EJ ofhydrogen would be used in 2050, mostly in the transportation sector. While in absolute terms this
appears to be a small amount of energy in comparison with a total primary energy supply of around785 EJ, its impact on transportation is very significant. The efficiency of PEM fuel cell vehicles issuch that some 30% (i.e. 700 million cars) of the global fleet of passenger cars would be fuelledby this relatively small amount of hydrogen in 2050. Fuel cell vehicles (cars, delivery vans, etc.)would start gaining market share between 2015 and 2025. In this scenario, if the hydrogen usedas an energy carrier is added to the hydrogen used for other applications (refinery processes andchemicals), more than 22 EJ of hydrogen would be used in 2050. This amount represents morethan a four-fold increase with respect to current hydrogen production.
Under less optimistic assumptions for technology development and policy measures, hydrogen andfuel cells are unlikely to reach the critical mass that is needed for a successful market uptake. Marketintroduction barriers and competing fuel and technology options, such as biofuels and Fischer-Tropsch (FT) synfuels, would play a more important role. However, in all scenarios with CO2 incentives,the global oil trade is 30-50% lower in comparison with scenarios (e.g. BASE) without new CO2
policies. This is a significant improvement in the security of energy supply, but it cannot be attributedto hydrogen and fuel cells alone.
The net benefit of hydrogen and fuel cells can be estimated if the most favourable scenario iscompared to a similar scenario where hydrogen and fuel cells are not part of the technology portfolio.The net benefit of hydrogen and fuel cells is then a 5% reduction in CO2 emissions (1.4 Gt CO2)and a 2% reduction in oil use in 2050. This may appear as a limited benefit. However, if vigorousCO2 policies are in place, the resulting fuel/technology mix would be optimised for emissionsmitigation. In these conditions the absence of hydrogen and fuel cells allows a number of new,alternative technologies, such as biofuels, CNG and FT synfuels from coal and gas with CCS, to playa larger role in a competitive energy market. In such a diversified and optimised world, the roleplayed by a single emerging technology is necessarily limited. Neither hydrogen nor other emergingtechnologies seem to be crucial to mitigating emissions in these scenarios, but their collective impactstabilises emissions. In the scenario without hydrogen and fuel cells, the 30% of passenger cars andlight/medium trucks fuelled by hydrogen fuel cells in 2050 would be replaced by ethanol vehicles(about 10%) and gasoline advanced ICE, hybrids and natural gas-fuelled vehicles (the remaining 20%).The increased emissions from the additional FT synfuel production and the increased use of gasolineand natural gas for vehicles account for the total emission increase of 1.4 Gt CO2 per year.
The impact on energy-security is also limited, i.e. a 2% reduction in total conventional andunconventional oil use in 2050. However, the presence of hydrogen would reduce oil imports fromMiddle East by 14% in 2050 and, significantly, would reduce the need for a rapid expansion ofother oil substitutes in the transportation sector.
In all scenarios, stationary fuel cell capacity ranges from 200 GW to 300 GW by 2050. This resultsuggests that stationary fuel cells, namely solid oxide fuel cells and molten carbonate fuel cells,represent a robust technology option that is not significantly affected by policy strategies andother variables. Most such fuel cells would be fired by natural gas. However, up to 22% of all fuelcells would use oil refinery products in 2050. Hydrogen PEM fuel cells for stationary applicationsdo not show up in any scenarios. This result can be explained by the cost of a dedicated hydrogensupply system, but also by the flexibility of the SOFC and MCFC systems, which do not need a fuelreformer, are less sensitive to poisoning than PEM fuel cells and have a superior conversion efficiency.Stationary hydrogen fuel cells, however, could benefit from the development of a hydrogen distributionsystem for transport, as this may lower the hydrogen supply cost. However, the implications ofsuch a synergy have not been considered in this analysis.
Fuel cells for stationary use would concentrate in residential and industrial sectors and fill themarket gap between large-scale CHP units and small-scale boilers. This would extend the economic
8. CONCLUSIONS AND CHALLENGES AHEAD 191
192 PROSPECTS FOR HYDROGEN AND FUEL CELLS
feasibility of CHP to buildings with limited heat demand. Fuel cells for centralised power productionplay a role in only one scenario, in combination with coal fired IGCC plants. In this scenario some25 GW of IGCC-SOFC plants are installed world wide by 2050.
In cost-optimal scenarios, hydrogen production in the early market uptake phase is primarily basedon decentralised natural gas reforming and electrolysis. Centralised production from coal and naturalgas with CO2 capture and storage plays a major role in the long term. The need for decentralisedproduction increases the cost of hydrogen during the transition phase. In the early market introductionphase, the limited demand for hydrogen does not justify the construction of an extensive distributioninfrastructure and there is insufficient demand to operate large centralised production unitscontinuously. In these scenarios, production from nuclear and renewable energy does not appearto play a significant role. However, the cost of hydrogen production from nuclear heat or frombiomass could be only slightly higher than hydrogen from fossil fuels. If so, nuclear and renewablehydrogen could enter the production mix on a significant scale, especially if production cost is notthe only criterion for the selection of the hydrogen production technology, or if technologies forCO2 capture and storage face unexpected problems.
If ambitious climate and energy-security policies are adopted, the regional potential for hydrogenand fuel cells seems to be high in the OECD regions and in China. In all regions, transport applications(hydrogen fuel cell vehicles, FCVs) dominate the hydrogen market. The share of hydrogen FCVs varieswidely across regions. In the most optimistic scenario, the region with the highest FCV stock shareby 2050 is actually China (60%), followed by India, which has up to 42% hydrogen FCV share in2050. A leap-frogging effect may occur in these countries as they have limited existing infrastructurefor transport fuels already in place. Their large indigenous coal reserves, potentially available forhydrogen production, may also facilitate a transition to hydrogen. This result, however, is highlyscenario-dependent. The share of FCVs in OECD countries is somewhat more stable across scenarios,although there is significant variation between regions. Under the most favourable assumptions,it ranges from 10% in Australia to 22% in Japan, 35% in Canada, 36-48% in Europe and 42%in the United States. Hydrogen use in other regions is negligible.
Hydrogen use starts around 2015-2020 in Europe and North America, and around 2025 in theother regions. This relatively narrow window in which uptake in various regions occurs suggests thatconditions for hydrogen introduction exist in different economies and geo-political areas. Differencesin hydrogen penetration across regions may be explained by different economic conditions, discountrates, availability of infrastructure, citizen attitudes to investment in capital-intensive technologies,energy and fuel taxes, and mobility needs. In absolute terms, hydrogen use in the OECD Pacificappears to be significantly lower than in the other OECD regions. However, in terms of per capitause, the difference is much smaller. The remaining difference can be explained by the lower energyintensity in key countries of the OECD Pacific area (particularly Japan) and the lower annualcar-mileage. In comparison, current North American per capita oil product use is a factor 2.2 to2.6 times higher than in Europe and the OECD Pacific regions.
Technology prospects
Hydrogen technologies
Hydrogen can contribute to energy security and the diversity of the energy supply as, in principle,it can be produced from all primary energy sources, using a number of different processes. Hydrogen
produced from renewables, nuclear energy and from coal or natural gas, with CO2 capture andstorage, results in hydrogen that is a CO2-free energy carrier and offers considerable potential foremissions mitigation.
Hydrogen for refinery and industrial uses (some 40 million tonnes a year, equivalent to 5EJ) iscurrently produced via established technologies, primarily natural gas reforming, but also coalgasification and water electrolysis. However, to produce cost-effective hydrogen for energy use, thesetechnologies need higher efficiency, significant cost reductions and the development of cheap andsafe techniques for CO2 capture and storage. RD&D efforts are focused on high-efficiency gasreforming, coal gasification in IGCC plants and electrolysis at high temperatures and pressures.Solar and nuclear heat to split water, biomass gasification, and photo-biological processes are alsobeing developed. These technologies, although at different levels of development, are all still farfrom market introduction.
Small-scale, decentralised natural gas reforming (without CO2 capture) and electrolysis appear tobe the technologies of choice to produce hydrogen in the early market introduction phase. Mostcurrent RD&D is focused on decentralised production technologies, as they do not require costlyinfrastructure for hydrogen transportation and distribution. However, decentralised technologiesgenerally have a low efficiency and need substantial cost reductions if they are to become competitive.In addition, a fundamental disadvantage of decentralised natural gas reforming installations isthat the capture of CO2 emissions in small plants is difficult and expensive, and hence not likelyto be feasible. As far as electrolysis is concerned, current and projected costs are even higher thanthose for decentralised natural gas reforming. In addition, prospects for producing hydrogen fromrenewable electricity are limited, even in the long term. While a substantial part of the electricitysupply may be based on renewables by 2050, the availability of surplus renewable electricity forhydrogen production will probably be limited to a few world regions.
The current cost of hydrogen from decentralised production may exceed USD 50/GJ H2, but variouscentralised production options promise hydrogen at USD 10-15/GJ H2. Though sensitive to naturalgas and electricity prices, the cost of natural gas reforming may be reduced to less thanUSD 15/GJ H2 by 2030 and that of electrolysis to below USD 20/GJ H2. Even lower – belowUSD 10/GJ H2 – is the projected cost of hydrogen from coal gasification in centralised IGCCplants with CO2 capture. The long-term costs of hydrogen from high-temperature water splittingcould be USD 10/GJ H2 using nuclear heat and USD 20/GJ H2 using solar heat. Higher costs areprojected for other technologies. However, the less developed the technology is at the presenttime, the higher is the uncertainty regarding the projected production costs.
Hydrogen can fuel combustion engines and turbines, but it offers its full benefits in terms of higherefficiency and reduced CO2 and other pollutant emissions when used in fuel cells. The use of hydrogenFCVs could solve the problems of the oil-dependence and emissions mitigation in transport at thesame time. Stationary residential uses and power generation are also attractive fuel cell applications,especially in situations where combined heat and power (CHP) systems are needed.
Hydrogen on-board storage for fuel cell vehicles is a key RD&D issue, since on-board hydrocarbonreforming has proved to be difficult. Unfortunately, existing on-board storage options do not yet meetthe technical and cost targets needed to be competitive. Gaseous storage at 350-700 bar andliquid storage at -253 °C are commercially available, but remain costly and energy intensive options.The cost of the hydrogen tank is around USD 600-800/kg H2 and the electrical energy required forcompression and liquefaction is more than 12% and 35% of the hydrogen energy content, respectively.Solid storage may offer potentially decisive advantages, but it is still at an early stage of development,with a number of materials being investigated. The promising characteristics of carbon nano-structures
8. CONCLUSIONS AND CHALLENGES AHEAD 193
194 PROSPECTS FOR HYDROGEN AND FUEL CELLS
have not been confirmed. Without further breakthroughs, gaseous storage at 700 bar seems thetechnology of choice for passenger cars at present. However, such a system would not meet therequired targets for cost and performance. The global character of the car industry is such that on-board storage technologies, as well as hydrogen quality and safety standards, must be establishedbefore the deployment of the full-scale hydrogen infrastructure. Indeed, the choice of on-board storagesystem may have a significant impact (e.g. hydrogen pressure) on the choice of the optimal hydrogeninfrastructure (production, distribution and refuelling). Therefore, the identification of a suitableand cost-effective storage technology is an urgent issue to bring hydrogen to the market.
In the case of centralised hydrogen production, the cost of hydrogen transportation and distribution,and the refuelling stations, add considerably to the total hydrogen supply cost. These costs rangefrom USD 5/GJ to 10/GJ of hydrogen for large-scale supply systems; however, they may be evenhigher during the initial development phase. Hydrogen transportation by pipeline seems to be theleast-costly option to move hydrogen. However, because of the low gas density and its highlypermeable nature (it requires less permeable materials than does natural gas), hydrogen pipelinesare five times more expensive in terms of energy needs as natural gas pipelines and twice as expensivein terms of investment in materials and equipment. The transportation and distribution of liquidhydrogen is even more expensive, and may not be practical for large quantities of gas.
Estimating the global investment required for hydrogen infrastructure is a difficult exercise. Forexample, whether current natural gas pipelines may be used to transport hydrogen is still a matterof discussion. At the very least, adaptation or replacement of some materials and componentswould be required. The cost of the hydrogen supply infrastructure needed for road transportwould be in the order of several hundred billion US dollars. If centralised production is adopted,the cost of a hydrogen pipeline supply system for the transport sector would range fromUSD 0.1 to 1 trillion. The incremental investment cost for hydrogen refuelling stations would besomewhere between USD 0.2 trillion and USD 0.7 trillion for centralised and decentralisedproduction respectively. A full hydrogen economy (extensive hydrogen use for both transport andstationary applications) would require pipeline investment in the order of USD 2.5 trillion, thebulk of which would be needed for the connection of commercial and residential customers.Assuming early retirement and partial replacement of the existing natural gas supply system, asignificant part of this cost would be an incremental cost.
While these investment costs are very significant, their order of magnitude is not inconsistent withthe USD 16 trillion investment that would be required for the overall energy supply system until2030 according to the World Energy Outlook Reference Scenario (IEA, 2004a). Even consideringthe uncertainty affecting current estimates, it appears that the cost of a transition to hydrogenwould add substantially to the total investment required in the energy system (from a few percentto some tens of percent). In absolute terms, however, the hydrogen investment should be consideredas a deterrent to the transition to hydrogen. It would be relatively affordable if compared to theglobal (undiscounted) world GDP over the period to 2050-year (some 5 350 trillion USD) and tothe total investment in terms of percentage of the GDP, i.e. some 23% of the global annual GDP.Who should bear this investment cost is, of course, an important matter for future discussion.
Fuel cell technologies Fuel cells are the technology of choice to exploit the full benefits of hydrogen in terms of energy-security, emissions and efficiency.
Proton exchange membrane fuel cells can be used for both stationary and transport applications.Because of their high sensitivity to carbon monoxide and sulphur pollutants, they need to be fuelled
by a pure hydrogen (e.g. produced by electrolysis). If hydrogen from natural gas reforming or fromresidual industrial gases is used, purification is needed before use. At present, PEMFCs seem tobe the best technology candidate for fuel cell vehicles. The current cost of PEMFCs exceedsUSD 2 000/kW, but a reduction in stack costs to USD 100/kW seems to be achievable bymass-production and technology learning. However, further reductions to below USD 50/kW willbe needed to produce FCVs that are competitive with ICEVs. This will require fundamental advancesin materials, higher fuel cell power densities and attention to elements of the fuel cell engineother than the fuel cell stack. Research is focusing on high-temperature membranes that areless prone to poisoning and enable on-board reforming. Because of these ongoing developmentsin PEM fuel cell technology, it would be premature to make choices now about the hydrogeninfrastructure, as they will depend on the hydrogen purity requirements of PEMFCs. Direct ethanolfuel cells could also become an attractive option for transport applications, but they are still ata very early stage of development.
Hydrogen FCVs are at least twice as efficient as a current “reference” ICE car. However, FCVs arenot yet ready for commercialisation. In addition to fuel cell stack cost reductions, they needimprovements in their durability and reliability. Other components such as the cost of the balanceof plant, electric drive and hydrogen storage system, also determine the FCV cost, buthave received less attention so far. Assuming that the cost of PEM fuel cell stacks decline toUSD 35/kW in 2030, then the FCV incremental cost in comparison with a conventional ICEVwould be USD 2 200 per vehicle, or USD 7 600 if the cost only fell to USD 75/kW. The globalincremental cost for some 700 million FCVs that could be sold by 2050 would then have arange from USD 1 to 2.3 trillion.
Drive systems for fuel cell passenger cars could be competitive at costs of USD 50-100/kW. However,high-mileage vehicles are niche markets that could support higher fuel cell costs. For example,FC buses could be competitive with a fuel cell stack cost of USD 200/kW, delivery vans atUSD 135/kW and forklifts at USD 100/kW. Buses could in principle be the largest and mostpromising market. Although current production volumes are very small (some 10 buses a year),market developments could drive increasing production volumes and significant declines in PEMstack costs. Following this cost reduction, PEM fuel cells could be introduced into passenger carsas well. However, recent estimates based on ongoing demonstration projects suggest that thefuel efficiency of fuel cell buses could be only 20% higher than diesel ICE buses. Moreover,diesel-hybrid buses are emerging as a serious competing option. However, stringent local airpollutant standards could encourage the use of hydrogen fuel cell buses.
Molten carbonate fuel cells and solid oxide fuel cells are the best candidates for stationaryapplications. They are less sensitive to pollutants than PEMFCs. Current MCFCs are fuelled by naturalgas, while SOFCs can be fuelled by both hydrocarbons and pure hydrogen. Both MCFCs and SOFCsoperate at high temperatures and do not require external reformers. Their electric efficiency is higherthan that of PEMFCs, but they cannot be used for cars because of their high operating temperature,which results in long start-up times. MCFCs seem best suited for large-scale systems, while SOFCscould also be used on the scale of single-family dwellings.
Stationary fuel cells could fill the market between large-scale CHP units and small-scale boilers, extendingthe economic feasibility of CHP to the scale of individual buildings. Decentralised power generationwithout heat production seems to be less attractive, as the efficiency of fuel cells would be lowerthan for other centralised electricity generation technologies, even if distribution losses are accountedfor. In CHP applications stationary fuel cells may achieve overall efficiencies higher than 85%, butelectric efficiencies of 60% are still a challenging target for stationary fuel cell systems. Stationary
8. CONCLUSIONS AND CHALLENGES AHEAD 195
196 PROSPECTS FOR HYDROGEN AND FUEL CELLS
fuel cells can bear higher costs (USD 700-1000/kW) than those for mobile applications, due to thehigher load factor achieved and the higher cost of competing options. Their costs are expected todecline by a factor of 5 to 10 through mass-production and technology learning, thus becomingcompetitive. Both the fuel cell stack (50% of the cost) and balance of plant need cost reductions.
Direct methanol fuel cells use methanol as a fuel. They are the best candidates for portableapplications, but their low efficiency is likely to preclude their use in mobile and stationarysituations. However, other fuel cell types, e.g. direct ethanol fuel cells, may benefit fromtechnology learning spill-over effects (membranes, mass-production technologies, etc.). Incontrast, PEMFCs are not practical for portable devices, because of hydrogen storage problems,nor are MCFCs and SOFCs, because of their high operating temperature. In terms of commercialmaturity, portable DMFCs appear close to market introduction. They are likely to be followedby stationary MCFCs and SOFCs systems for decentralised use. More time is needed for thecommercialisation of mobile PEMFCs, although they are urgently needed to meet environmentaland energy-security objectives.
Competing options
Hydrogen and fuel cell technologies compete with many other alternative fuels and technologyoptions that can be applied to meet energy-security and environmental goals.
In the transportation sector, hydrogen FCVs face a chicken-or-egg problem, in that little demand islikely without the infrastructure to provide cheap hydrogen, but the investment in this expensiveinfrastructure is unlikely without significant demand. Various other technologies and fuel optionsdo not face similar barriers to introduction. Major competing options include biofuels, CNG, FTsynfuels from coal and gas, hybrid ICEs, and plug-in hybrid vehicles. Biofuels are a short-term, low-cost fuel alternative in the transport sector. More efficient advanced ICE engines and hybrid vehicles,using gasoline or diesel, could also represent a viable alternative to hydrogen FCVs, but theywould not yield the same reductions in emissions. Hydrogen-hybrid vehicles face the same on-board storage issues as FCVs and a similar chicken-or-egg problem applies, but they do not requirethe same challenging cost reductions for the drive system.
For both stationary and mobile applications, competing options are also energy efficiency measuresand large-scale electrification based on coal with CCS, nuclear, or renewable and nuclear energy.Large-scale electrification in conjunction with plug-in hybrid vehicles and Li-ion batteries couldalso lead to the role of electricity in the transport sector being reconsidered.
The competition in stationary applications – either distributed electricity generation or cogeneration– is also intense. Centralised, highly efficient coal and gas-fired power plants with CCS, emergingrenewable technologies, and new nuclear power plants are strong competitors that all distributedtechnologies have to beat. At the same time, new technologies such as micro-turbines and Stirlingengines are being introduced for combined heat and power cogeneration. Enhanced buildinginsulation and energy efficiency programmes in industry may also limit the future demand forheat. On one hand the reduced demand for heat limits the potential for stationary fuel cells, buton the other hand, an increased power-to-heat ratio makes fuel cells more attractive in comparisonwith other CHP technologies.
The analysis in this study suggests that an assessment of the potential of hydrogen and fuel cellswithout taking into account competing options would lead to misleading conclusions and couldresult in an overly optimistic assessment of hydrogen’s potential.
Uncertainties regarding hydrogenand fuel cell prospects
Hydrogen and fuel cells can play a role in the energy sector under a range of future conditionsthat are subject to significant uncertainties. Key factors can be split into three areas: economicconditions, energy policies and market developments; future developments in hydrogen technologies;and the role of competing options to meet policy targets.
A limited number of factors have a positive effect on the future use of hydrogen, while most ofthem have a negative effect. The sensitivity analysis indicates a maximum variation of ± 80% inhydrogen use when individual drivers are varied. Factors with major impact are CO2 and energy-security policies; future FCV costs and performance; the severity of chicken-or-egg transition problems;timely development of a centralised hydrogen production and distribution infrastructure; andconsumers’ criteria for buying cars. Future oil supply issues (quantities and prices) are obviously ofprimary importance. Competing technologies also play an important role that is not very sensitiveto their technical characteristics. Also, specific measures aimed at enhancing energy security donot have a major impact if substantial CO2 policies (e.g. CO2 incentives) are already in place.
However, major uncertainties concern whether and how these factors will materialise, rather thantheir individual impact on the potential of hydrogen and fuel cells. For example, reaching internationalagreement on concerted measures to curb emissions and enhance the security of energy suppliesis a difficult and time-consuming business. Similarly, the future prospects for coal-based cogenerationof hydrogen and electricity may be affected by higher than expected costs and poor social acceptanceof the CO2 capture and storage technology. Strong developments in nuclear and renewable energymay enhance the prospects for CO2-free hydrogen and hence fuel cells. However, they could alsoweaken the prospects for hydrogen and fuel cells by making available large quantities of cheapand CO2-free electricity and biofuels, which would then compete as alternative options to mitigateemissions and enhance energy-security.
In the transport sector, uncertainties concern not only the choice of PEMFCs materials, the on-board storage system, and the choice between hybrid ICEVs and FCVs, but also who will bear thelarge investment in hydrogen production, distribution and refuelling infrastructure. At present, it isunclear what the incentive would be for major oil companies and electrical utilities to invest inhydrogen infrastructure, unless clear government policies are established.
Also, the rate at which production can expand is an important issue for the policy timing and thespeed of the transition. Current cumulative FCV production stands at about 600 vehicles, comparedto annual car production of some 50 million vehicles. At this moment, no car maker has plans tomass-produce hydrogen-fuelled vehicles. Producers will initially offer a single model in a singlecountry to explore market acceptance, and will then gradually expand into other regions. Pastexperience from various industrial sectors may be of interest. Introduction of hybrid vehicles tooka decade to achieve 0.5% of the market. The semi-conductor industry (which faces no competition)has been growing at some 15% per annum over the period 1960-2000. At such a high growthrate, the market for FCVs would increase from 0.5% to 30% in 30 years.
How fast the production volume will grow is also important for technology learning and the rate ofcost reductions, and for setting public support policies. Should the introduction of hydrogen be supportedby public incentives in the early market introduction phase, the level of the financial support will dependstrongly on how rapidly technology learning can make hydrogen economically competitive.
8. CONCLUSIONS AND CHALLENGES AHEAD 197
198 PROSPECTS FOR HYDROGEN AND FUEL CELLS
RD&D challenges and opportunities
Current public spending on hydrogen and fuel cell RD&D, at USD 1 billion a year, is substantial ifcompared to the total annual budget for energy RD&D of around USD 8 billion. However, presentefforts are small in comparison with the investment needed to support the introduction of hydrogentechnologies into the energy market. This would imply a landslide change in government energypolicy, with a dominant emphasis on technology innovation. In an ideal case, governments shouldfirst establish credible and long-term energy-security and environmental policies and targets, withoutwhich no reason exists to switch to hydrogen. They should then foster the establishment ofinternational standards for hydrogen and fuel cells in close consultation with industry, promoteinfrastructure investment, and provide incentives for consumers to adopt new technologies. Animportant part of the policy strategy could be the use of government procurement programmes(e.g. for car fleets) to help promote technology learning and early introduction into niche markets.However, past and current trends for energy RD&D budgets run contrary to the need for an evengreater effort to introduce hydrogen and fuel cells. Government energy RD&D budgets have beenfalling in recent decades and, according to IEA statistics, the total energy RD&D expenditure in2002 of just under USD 8 billion was only 50% of the 1980 value.
In the transportation sector, the current private RD&D investment exceeds public investment. Industrialstrategies, however, vary considerably. DaimlerChrysler and Ford rely on Ballard fuel cells; GeneralMotors (GM), Honda and Toyota are developing their own fuel cells. GM is developing the skateboardchassis FCV concept. DaimlerChrysler is focusing on fuel cell vehicles and bus test fleets. Nissan isalready leasing FCVs to private customers for demonstration purposes and Honda is aiming to do soby the end of 2005. Ford and Mazda are also working on hydrogen ICE vehicles. BMW is working onhydrogen ICEs with fuel cells for the auxiliary power unit. Toyota is following a phased approach, firstcommercialising its hybrid vehicles and subsequently aiming at integrating fuel cells into the hybridconcept. A number of other car companies not only focus on hydrogen, but also on other solutionssuch as biofuels (e.g. Volkswagen, Peugeot-Citroën). Several new players are trying to enter the carmarket using revolutionary fuel cell engine technologies. This range of approaches indicates that thereis no clear optimal strategy to get hydrogen and fuel cells to the market.
The initial target for market introduction in 2004 has subsequently been moved to 2010. Somemajor car makers are now talking about introduction after 2012 (Adamson, 2005) and othercompanies envisage commercialisation after 2020. This suggests that achieving the target ofreplacing conventional vehicles and fuels to curb emissions and improve energy-security is provingto be more challenging than expected, and that different visions exist on how to get there.
The timely meeting of the most ambitious targets for technology improvement (performance andcost reductions) appears as an essential pre-condition for the success of hydrogen and fuel cells.Delays in technical progress could result in other technology paths that are closer to commercialmaturity being “locked-in” ahead of hydrogen.
The discussion of hydrogen and fuel cell technologies in this analysis presents a wide range ofpossible options, from market-ready solutions to theoretical concepts. While selecting winners ispremature, identifying technologies that may become important in the short-term and those that arefurther away from market introduction is an important part of setting RD&D priorities and investment.
There are some low-risk/low-surprise options, such as natural gas reforming, water electrolysis, coalgasification, high-pressure gaseous storage, improved fuel cell balance of plant and manufacturingtechnologies, hydrogen burners for gas turbines, and hydrogen ICEs. What these technologies may

offer, and their possible future developments, are already rather well delineated. There are alsotechnologies with large margins for improvement, such as new materials for PEM membranes andcatalysts. Other broader technologies will have a potential impact not only on hydrogen and fuelcells, but also on the wider energy sector, i.e. CO2 capture and storage. A different category is thehigh-risk/high-reward options such as photo-electrolysis, biological production, water splitting bynuclear and solar heat, on-board solid storage, and new fuel cell concepts. If successful, some ofthese technologies may represent major breakthroughs in energy technology, with tremendousimpacts on the future applications for hydrogen and fuel cells, and on the wider energy system. Atpresent, most of these options are in a very early stage of development and the data available ontheir potential performance and costs are too uncertain to conduct a quantitative analysis. Therefore,they have not been included in this study. However, a balanced RD&D investment strategy basedon costs/benefit criteria should take into account these technology options.
Taking a slightly broader view, it should be taken into account that relevant RD&D work for hydrogenand fuel cells does not need huge single investments, such as other centralised energy technologies(e.g. nuclear fusion), to improve their prospects. As a consequence, RD&D activities are carried outin both small and large public/private laboratories and research organisations. In principle, withsuch a huge number of opportunities and economic attractiveness, some technology solutions couldalready be in the infancy stage of their development, or even available in industrial labs, pendingpatent applications or in the expectation of a future market start-up. In addition, many aspects ofhydrogen and fuel cell RD&D deal with developments in solid state physics and materials science.These booming disciplines promise tremendous advances with potentially broader impact ontechnology, including unexpected and pleasant breakthroughs in hydrogen and fuel cells.
8. CONCLUSIONS AND CHALLENGES AHEAD 199

ANNEXES 201
Annex 1ETP MODEL CHARACTERISTICS
In order to quantitatively assess the merits of hydrogen and fuel cells in relation to other technologyand policy options, the IEA has used an in-house tool known as the Energy Technology Perspectives(ETP) model. This enables the benefits of technology options, including hydrogen and fuel cells, tobe analysed in a structured, logical manner.
This annex provides an overview of the structure and scope of the ETP model, and the assumptionsthat lie behind the analysis. Given the large size of the model, only its general structure is outlined,followed by a discussion of the key parameters that affect hydrogen and fuel cells. This annex willbe of interest to those wishing to understand the quantitative analysis that lies behind the resultsprovided in Chapters 4, 5, 6 and 7.
The value of the ETP model in the analysisof technology prospects
The ETP model belongs to the MARKAL family of bottom-up systems engineering models (Fishboneand Abilock, 1981; Loulou et al., 2004). The MARKAL model framework has been developedduring the past 30 years by the Energy Technology Systems Analysis Programme (ETSAP), one ofthe IEA implementing agreements.
A model is a structured, logical and reproducible method used to analyse a complex policy problem.Given that it is not possible to predict the future with any certainty, the goal of the exercise is to“model for insights”, not to “model for figures”. Every model is a simplified representation of asystem or market, in this case the global supply and demand of energy, and will be based on a setof data that approximates the real world. Each model has its own unique characteristics thataffect the results and conclusions.
The ETP model is a complex model. Using it to analyse the prospects for hydrogen and fuel cells requiresa significant expenditure of resources. However, this complexity and the level of effort required to makeit work is needed if a robust assessment of the prospects for different technologies is to result. Thereason is that this framework accounts for a large number of key characteristics of the energy systemthat are of importance for long-term decision making. If these characteristics were not accounted for,the outcome of the analysis may not accurately reflect the complex interactions in the global energysystem and in all likelihood would be less relevant for decision making. The model has the followingcharacteristics, some of which are elaborated on in more detail:
● The model splits the world into 15 regions.22 This allows an accurate representation of thespecific characteristics of the energy system at a regional level, e.g. the availability of primaryenergy sources, the acceptance of nuclear, the regional availability of capital, etc.
● The model optimises the energy system for the next 50 years. Such a long-term perspective isneeded in order to properly assess the role of hydrogen and fuel cells.
● The model provides insights concerning the effect of deploying hydrogen and fuel cells on globalfossil fuel and electricity markets, an issue that has received limited attention so far.
22. The 15 regions considered in this study are: Africa, Australia/New Zealand, Canada, China, Central and South America (CSA), EasternEurope, the Former Soviet Union (FSU), India, Japan, Mexico, Middle East, Other Developing Asia (ODA), South Korea, the US and Western Europe.
202 PROSPECTS FOR HYDROGEN AND FUEL CELLS
● The model accounts for competing emission reduction strategies in certain sectors. For example,hydrogen and fuel cells compete with renewables and energy efficiency options to achieve theleast-cost emissions reduction.
● The model provides a dynamic assessment of the interactions between competing options. Forexample, the use of more hydrogen from fossil fuels with CCS may reduce but not displaceentirely the use of biofuels. This provides a more accurate assessment of the marginal benefitsin terms of emissions reduction of using hydrogen than a back-of-the-envelope calculation wheregasoline and hydrogen cars are compared.
● Emerging hydrogen and fuel cell technologies are explicitly modelled.
● The model contains a database of current and emerging technologies. Therefore the assessmentof hydrogen and fuel cells is not based just on the current energy system, but also on thepossible characteristics of the future energy system. This is of vital importance to the analysisif significant changes in the energy system are anticipated, such as might occur if CO2 policiesare strengthened.
● The representation of technologies in the model is based on detailed data. These data are drawnfrom engineering studies and scientific literature. This detailed technology description enablesthe identification of technology RD&D opportunities. This is an advantage of the ETP modelover econometric top-down models with very aggregate representations of technology that donot allow assessments of technology development prospects and the identification of RD&Dopportunities.
● The model contains detailed representations of energy efficiency options and renewable energycosts and availability. This is essential to determining the marginal abatement costs of both options.
● The model explicitly takes into account capital stock turnover, which is critical in assessing thereal world rate at which new technologies can penetrate the energy system.
● The model includes a detailed representation of electricity supply and demand, accounting forthe difference between base-load and peaking plants, and the intermittent nature of somerenewables. The annual electricity load curve is calculated by region, based on the demand foruseful energy. The load of individual power plants varies over the year and over the life of theplant, depending on demand and installed capacity. CHP is represented in detail, with a seasonalheat load curve. This detailed representation of the electricity system is of key importance forthe assessment of fuel cells and hydrogen production from electricity.
● The model takes into account carbon leakage (e.g. if industry relocates) and the regionaleffects on the energy system due to regional differences in CO2 policies.
The representation of the energy system in the model
The ETP model is a micro-economic representation of part of the world economy, divided into15 regions. The model is not a general equilibrium model; only the energy sector is modelled. Themodel covers the production of primary energy carriers (e.g. coal), their conversion into final energycarriers (e.g. gasoline) and the conversion of final energy carriers into useful energy, or “energy services”(e.g. lighting). This energy system (Figure A1.1) is modelled as a set of inter-dependent technicalproduct flows and processes.23 Various technologies can be used to generate certain product flows,
23. Models of this type, which start from descriptions of technical options, are often called “bottom-up” models in comparison with“top-down” models that start from a description of the economy as a whole.
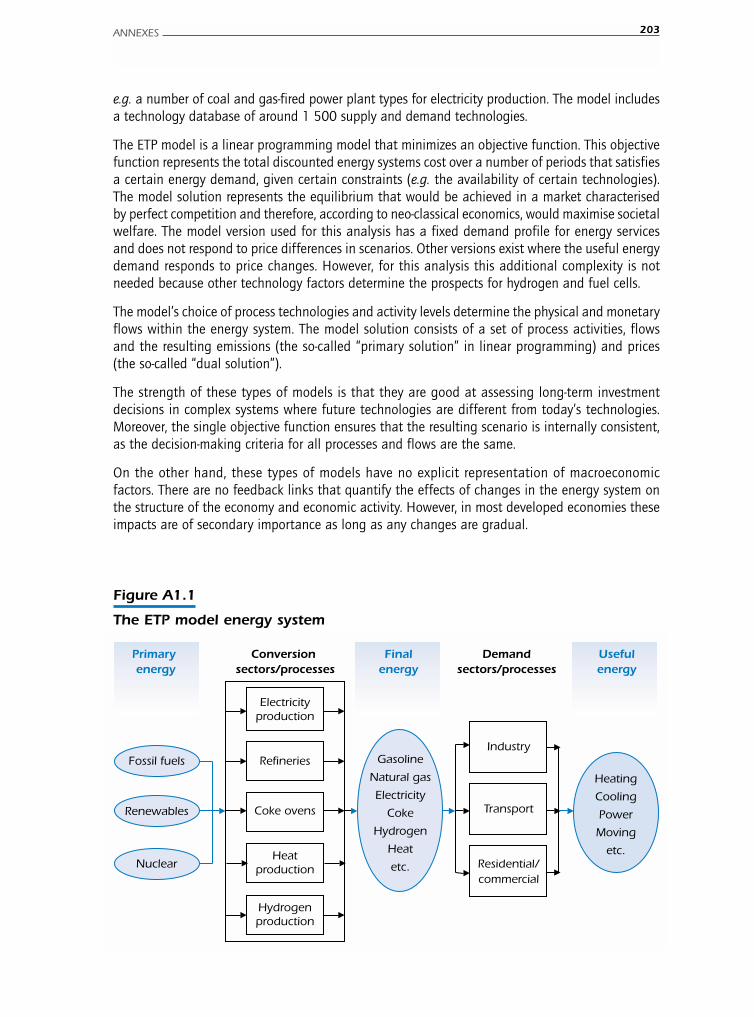
e.g. a number of coal and gas-fired power plant types for electricity production. The model includesa technology database of around 1 500 supply and demand technologies.
The ETP model is a linear programming model that minimizes an objective function. This objectivefunction represents the total discounted energy systems cost over a number of periods that satisfiesa certain energy demand, given certain constraints (e.g. the availability of certain technologies).The model solution represents the equilibrium that would be achieved in a market characterisedby perfect competition and therefore, according to neo-classical economics, would maximise societalwelfare. The model version used for this analysis has a fixed demand profile for energy servicesand does not respond to price differences in scenarios. Other versions exist where the useful energydemand responds to price changes. However, for this analysis this additional complexity is notneeded because other technology factors determine the prospects for hydrogen and fuel cells.
The model’s choice of process technologies and activity levels determine the physical and monetaryflows within the energy system. The model solution consists of a set of process activities, flowsand the resulting emissions (the so-called “primary solution” in linear programming) and prices(the so-called “dual solution”).
The strength of these types of models is that they are good at assessing long-term investmentdecisions in complex systems where future technologies are different from today’s technologies.Moreover, the single objective function ensures that the resulting scenario is internally consistent,as the decision-making criteria for all processes and flows are the same.
On the other hand, these types of models have no explicit representation of macroeconomicfactors. There are no feedback links that quantify the effects of changes in the energy system onthe structure of the economy and economic activity. However, in most developed economies theseimpacts are of secondary importance as long as any changes are gradual.
ANNEXES 203
Figure A1.1
The ETP model energy system
Hydrogenproduction
Industry
Residential/commercial
Electricityproduction
Refineries
Transport
Heating
Cooling
Power
Moving
etc.
Gasoline
Natural gas
Electricity
Coke
Hydrogen
Heat
etc.
Renewables
Fossil fuels
Nuclear
Usefulenergy
Primary energy
Conversion sectors/processes
Finalenergy
Demandsectors/processes
Coke ovens
Heatproduction
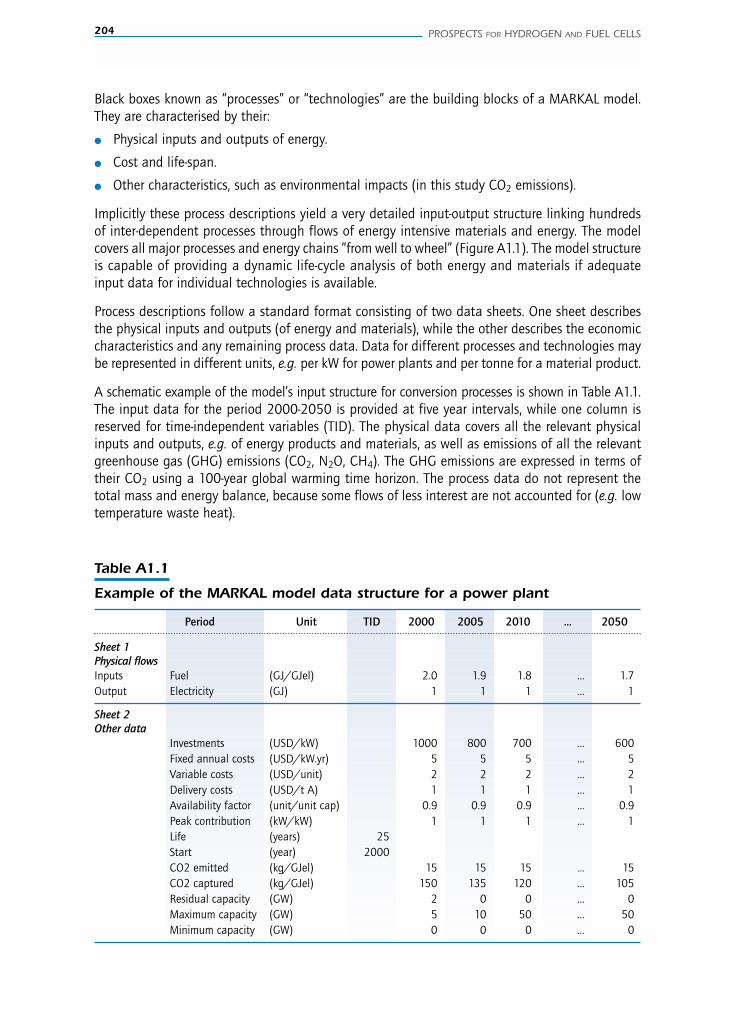
204 PROSPECTS FOR HYDROGEN AND FUEL CELLS
Black boxes known as “processes” or “technologies” are the building blocks of a MARKAL model.They are characterised by their:
● Physical inputs and outputs of energy.
● Cost and life-span.
● Other characteristics, such as environmental impacts (in this study CO2 emissions).
Implicitly these process descriptions yield a very detailed input-output structure linking hundredsof inter-dependent processes through flows of energy intensive materials and energy. The modelcovers all major processes and energy chains “from well to wheel” (Figure A1.1). The model structureis capable of providing a dynamic life-cycle analysis of both energy and materials if adequateinput data for individual technologies is available.
Process descriptions follow a standard format consisting of two data sheets. One sheet describesthe physical inputs and outputs (of energy and materials), while the other describes the economiccharacteristics and any remaining process data. Data for different processes and technologies maybe represented in different units, e.g. per kW for power plants and per tonne for a material product.
A schematic example of the model’s input structure for conversion processes is shown in Table A1.1.The input data for the period 2000-2050 is provided at five year intervals, while one column isreserved for time-independent variables (TID). The physical data covers all the relevant physicalinputs and outputs, e.g. of energy products and materials, as well as emissions of all the relevantgreenhouse gas (GHG) emissions (CO2, N2O, CH4). The GHG emissions are expressed in terms oftheir CO2 using a 100-year global warming time horizon. The process data do not represent thetotal mass and energy balance, because some flows of less interest are not accounted for (e.g. lowtemperature waste heat).
Table A1.1
Example of the MARKAL model data structure for a power plant
Period Unit TID 2000 2005 2010 … 2050
Sheet 1Physical flowsInputs Fuel (GJ/GJel) 2.0 1.9 1.8 … 1.7Output Electricity (GJ) 1 1 1 … 1
Sheet 2Other data
Investments (USD/kW) 1000 800 700 ... 600Fixed annual costs (USD/kW.yr) 5 5 5 … 5Variable costs (USD/unit) 2 2 2 … 2Delivery costs (USD/t A) 1 1 1 … 1Availability factor (unit/unit cap) 0.9 0.9 0.9 … 0.9Peak contribution (kW/kW) 1 1 1 … 1Life (years) 25Start (year) 2000CO2 emitted (kg/GJel) 15 15 15 … 15CO2 captured (kg/GJel) 150 135 120 … 105Residual capacity (GW) 2 0 0 … 0Maximum capacity (GW) 5 10 50 … 50Minimum capacity (GW) 0 0 0 … 0
In order to optimise investment and the operation of particular technologies, the data sheetdistinguishes between three cost categories:
● Investment costs - which are proportional to the installed capacity.
● Fixed annual costs – which are proportional to the installed capacity.
● Variable costs – which are proportional to the production volume.
Regional cost multipliers and discount rates are applied in order to reflect the different economicconditions around the world (see Annex 2).
The input data is not fixed over the projection period. For instance, increasing process efficiencycan be modelled by decreasing inputs per unit of output (i.e. the declining fuel input needed inTable A1.1). This provides one way to account for “technology learning”, as investment costs canbe reduced over time as the installed capacity increases. A more complex alternative is where“technology learning” is endogenised and costs are calculated by the model as a function ofcumulative investment. This approach has not been applied in this study.
Bounds
The user of the model can impose restrictions on the deployment of certain technologies. Suchrestrictions (called “bounds” or constraints) may reflect consumer or political preferences,intentions or objectives expressed in policy papers, or physical constraints such as naturalresource availability.
This study includes a number of different types of constraints, including bounds on the maximumpenetration of certain technologies due to resource constraints and even social or strategicconsiderations (e.g. a maximum level of nuclear and hydro capacity, a maximum level of naturalgas imports from Russia into the European Union, etc.). They can also affect the rate of penetrationof certain technologies to allow for the time needed to commercialise certain technologies(e.g. the necessary time for building pilot plants and plant construction). Some constraints reflectthe starting capacity from earlier periods (e.g. for the existing building stock).
The ETP model matrix contains 750 000 rows, 950 000 columns and 5 000 000 non-zerovariables. Given the size of the model, it is not possible to discuss all the input data in detail.Key modules that affect the hydrogen and fuel cell technology choice will, however, be discussedin more detail.
Demand categories
Processes represent all activities that are necessary to provide certain products and services, suchas room space to be heated or vehicle-miles to be traveled. Many products and services can begenerated by a number of alternative (sets of) processes that feature different costs and differentGHG emissions.
The main end-use sectors currently contain 106 different “demand categories”. The number ofcategories by end-use sector are presented in Table A1.2. For each demand category, energy demandsare specified in terms of the energy service demanded (e.g. vehicle kilometres).
ANNEXES 205
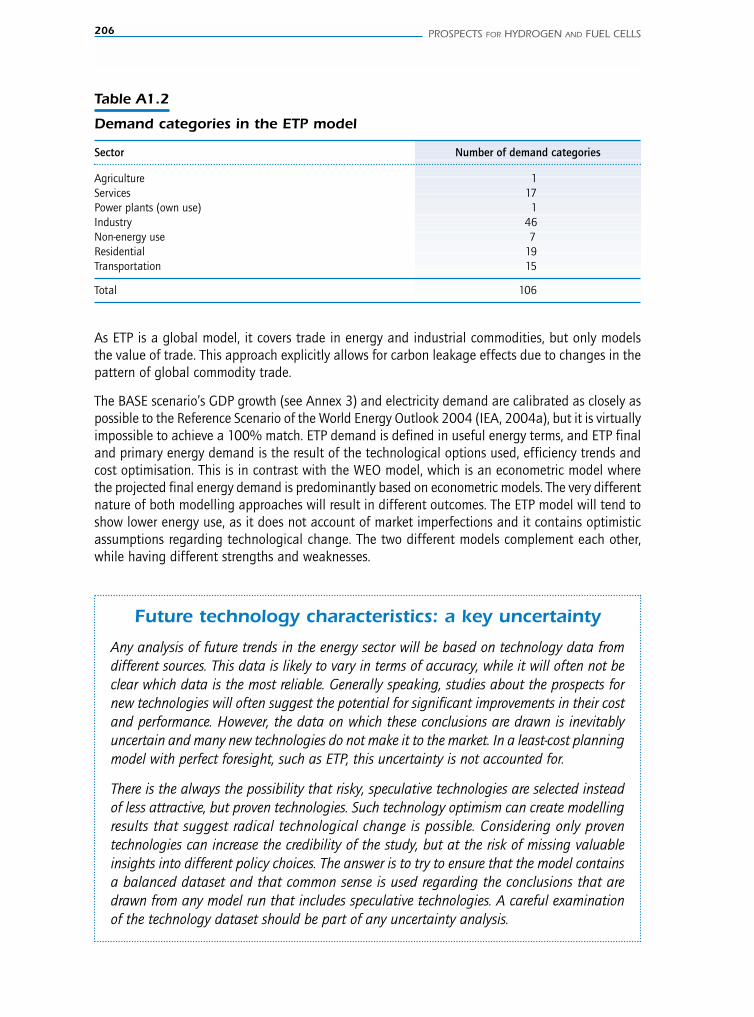
206 PROSPECTS FOR HYDROGEN AND FUEL CELLS
As ETP is a global model, it covers trade in energy and industrial commodities, but only modelsthe value of trade. This approach explicitly allows for carbon leakage effects due to changes in thepattern of global commodity trade.
The BASE scenario’s GDP growth (see Annex 3) and electricity demand are calibrated as closely aspossible to the Reference Scenario of the World Energy Outlook 2004 (IEA, 2004a), but it is virtuallyimpossible to achieve a 100% match. ETP demand is defined in useful energy terms, and ETP finaland primary energy demand is the result of the technological options used, efficiency trends andcost optimisation. This is in contrast with the WEO model, which is an econometric model wherethe projected final energy demand is predominantly based on econometric models. The very differentnature of both modelling approaches will result in different outcomes. The ETP model will tend toshow lower energy use, as it does not account of market imperfections and it contains optimisticassumptions regarding technological change. The two different models complement each other,while having different strengths and weaknesses.
Table A1.2
Demand categories in the ETP model
Sector Number of demand categories
Agriculture 1Services 17Power plants (own use) 1Industry 46Non-energy use 7Residential 19Transportation 15
Total 106
Future technology characteristics: a key uncertainty
Any analysis of future trends in the energy sector will be based on technology data fromdifferent sources. This data is likely to vary in terms of accuracy, while it will often not beclear which data is the most reliable. Generally speaking, studies about the prospects fornew technologies will often suggest the potential for significant improvements in their costand performance. However, the data on which these conclusions are drawn is inevitablyuncertain and many new technologies do not make it to the market. In a least-cost planningmodel with perfect foresight, such as ETP, this uncertainty is not accounted for.
There is the always the possibility that risky, speculative technologies are selected insteadof less attractive, but proven technologies. Such technology optimism can create modellingresults that suggest radical technological change is possible. Considering only proventechnologies can increase the credibility of the study, but at the risk of missing valuableinsights into different policy choices. The answer is to try to ensure that the model containsa balanced dataset and that common sense is used regarding the conclusions that aredrawn from any model run that includes speculative technologies. A careful examinationof the technology dataset should be part of any uncertainty analysis.
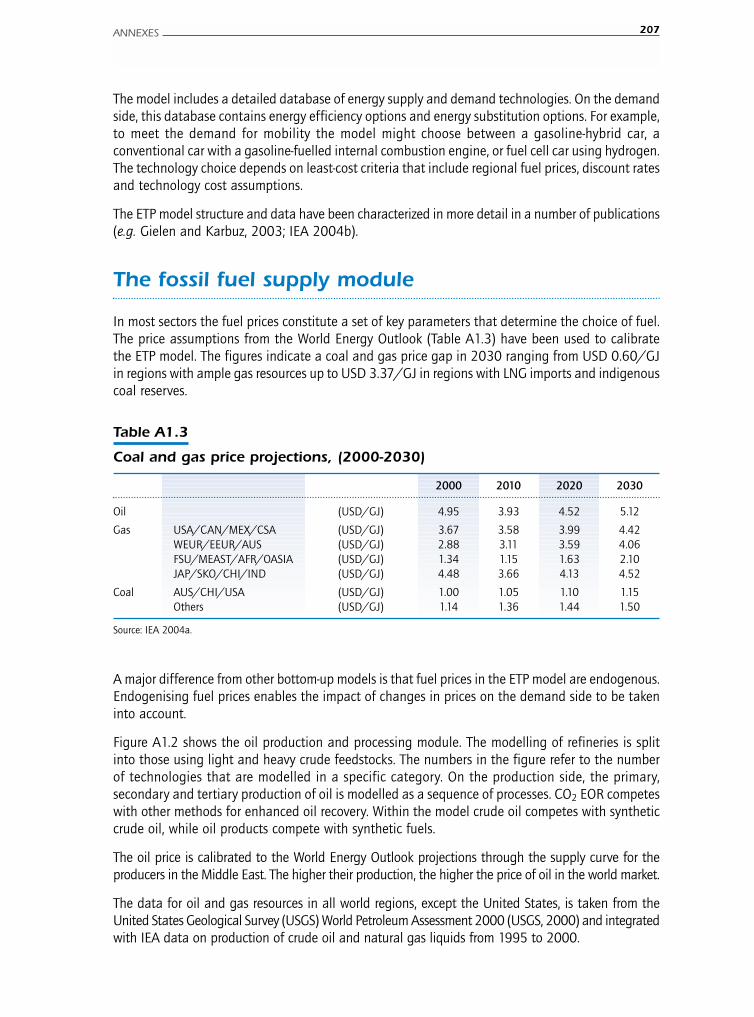
The model includes a detailed database of energy supply and demand technologies. On the demandside, this database contains energy efficiency options and energy substitution options. For example,to meet the demand for mobility the model might choose between a gasoline-hybrid car, aconventional car with a gasoline-fuelled internal combustion engine, or fuel cell car using hydrogen.The technology choice depends on least-cost criteria that include regional fuel prices, discount ratesand technology cost assumptions.
The ETP model structure and data have been characterized in more detail in a number of publications(e.g. Gielen and Karbuz, 2003; IEA 2004b).
The fossil fuel supply module
In most sectors the fuel prices constitute a set of key parameters that determine the choice of fuel.The price assumptions from the World Energy Outlook (Table A1.3) have been used to calibratethe ETP model. The figures indicate a coal and gas price gap in 2030 ranging from USD 0.60/GJin regions with ample gas resources up to USD 3.37/GJ in regions with LNG imports and indigenouscoal reserves.
ANNEXES 207
A major difference from other bottom-up models is that fuel prices in the ETP model are endogenous.Endogenising fuel prices enables the impact of changes in prices on the demand side to be takeninto account.
Figure A1.2 shows the oil production and processing module. The modelling of refineries is splitinto those using light and heavy crude feedstocks. The numbers in the figure refer to the numberof technologies that are modelled in a specific category. On the production side, the primary,secondary and tertiary production of oil is modelled as a sequence of processes. CO2 EOR competeswith other methods for enhanced oil recovery. Within the model crude oil competes with syntheticcrude oil, while oil products compete with synthetic fuels.
The oil price is calibrated to the World Energy Outlook projections through the supply curve for theproducers in the Middle East. The higher their production, the higher the price of oil in the world market.
The data for oil and gas resources in all world regions, except the United States, is taken from theUnited States Geological Survey (USGS) World Petroleum Assessment 2000 (USGS, 2000) and integratedwith IEA data on production of crude oil and natural gas liquids from 1995 to 2000.
Table A1.3
Coal and gas price projections, (2000-2030)
2000 2010 2020 2030
Oil (USD/GJ) 4.95 3.93 4.52 5.12
Gas USA/CAN/MEX/CSA (USD/GJ) 3.67 3.58 3.99 4.42WEUR/EEUR/AUS (USD/GJ) 2.88 3.11 3.59 4.06FSU/MEAST/AFR/OASIA (USD/GJ) 1.34 1.15 1.63 2.10JAP/SKO/CHI/IND (USD/GJ) 4.48 3.66 4.13 4.52
Coal AUS/CHI/USA (USD/GJ) 1.00 1.05 1.10 1.15Others (USD/GJ) 1.14 1.36 1.44 1.50
Source: IEA 2004a.
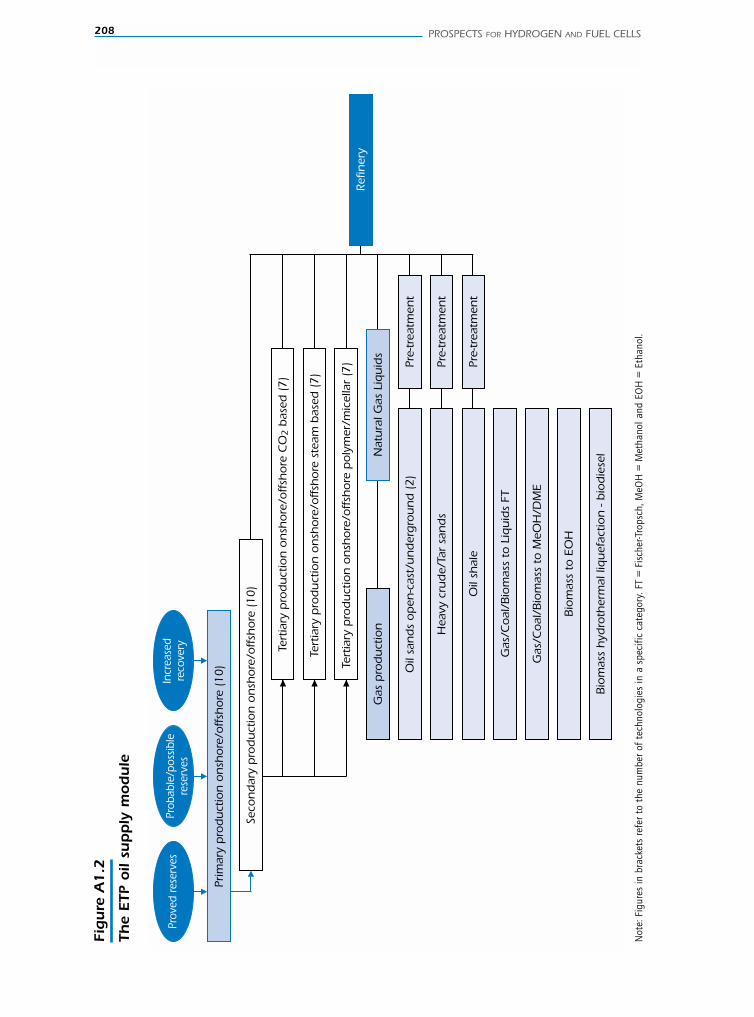
208 PROSPECTS FOR HYDROGEN AND FUEL CELLS
Fig
ure
A1
.2
The
ETP
oil
supply
mod
ule
Prob
able
/pos
sible
rese
rves
Prov
ed re
serv
esIn
crea
sed
reco
very
Prim
ary
pro
du
ctio
n o
nsh
ore
/off
sho
re (
10
)
Seco
nd
ary
pro
du
ctio
n o
nsh
ore
/off
sho
re (
10
)
Tert
iary
pro
du
ctio
n o
nsh
ore
/off
sho
re C
O2 b
ased
(7
)
Tert
iary
pro
du
ctio
n o
nsh
ore
/off
sho
re s
team
bas
ed (
7)
Tert
iary
pro
du
ctio
n o
nsh
ore
/off
sho
re p
oly
mer
/mic
ella
r (7
)
Gas
pro
du
ctio
nN
atu
ral G
as L
iqu
ids
Refin
ery
Pre-
trea
tmen
t
Pre-
trea
tmen
t
Pre-
trea
tmen
t
Oil
san
ds
op
en-c
ast/
un
der
gro
un
d (
2)
Hea
vy c
rud
e/Ta
r sa
nd
s
Oil
shal
e
Gas
/Co
al/B
iom
ass
to L
iqu
ids
FT
Gas
/Co
al/B
iom
ass
to M
eOH
/DM
E
Bio
mas
s to
EO
H
Bio
mas
s h
ydro
ther
mal
liq
uef
actio
n -
bio
die
sel
Not
e: F
igur
es in
bra
cket
s re
fer
to t
he n
umbe
r of
tec
hnol
ogie
s in
a s
peci
fic c
ateg
ory.
FT
= F
isch
er-Tr
opsc
h, M
eOH
= M
etha
nol a
nd E
OH
= E
than
ol.
The USGS assessment of world oil resourcesThe USGS study estimates the potential quantities of conventional oil, gas and NGL outside theUnited States that might be added to reserves in the period 1995-2025. The geologic distributionof petroleum resources is contained in the so-called Total Petroleum System (TPS). AssessmentUnits (AU), a volume of rock within the TPS that encompasses fields, discovered and undiscovered,sufficiently homogeneous in terms of geology, exploration strategy and risk characteristics toconstitute a single population of field characteristics with respect to criteria used for resourceassessment, were the basic units for this assessment.
In the USGS assessments, volumetric data of discovered resources are evaluated for each AU assums of volumes of individual fields, as reported in the databases of Petroconsultants (1996) andNRG Associates (1995).
Tables containing information regarding known and grown volumes of petroleum (i.e. conventionaloil, NGL and natural gas) in an assessment unit are also provided in the USGS study and publiclyavailable. Grown field sizes are defined as known field sizes adjusted upward using a growth functionin each AU.
Oil and gas resources in each world region, except the United States, are equal to the expected totalgrown volume of existing reserves plus the mean volumes of undiscovered oil, NGL and natural gas.
The USGS volumetric data were then aggregated into the 12 world regions used in the ETP modeland converted into their energy equivalents for input into the model. This was done for the median(F50) values of parameters available in the USGS assessment for undiscovered resources and usingthe relevant factors for conversion (API gravity and sulfur content for oil; inert gas, CO2 and hydrogensulfide content for natural gas).
In order to account for the different base years of the USGS study (1995) and the ETP model (2000),the USGS cumulative production figures were updated to the year 2000 using IEA data. Theremaining amount of grown oil, NGL and natural gas reserves and undiscovered resources werethen re-calculated for the year 2000.
The ETP model includes a number of different conventional and unconventional sources of gassupply (Figure A1.3). Gas transportation pipelines and LNG transportation are modelled in detail,given that transportation costs constitute a large proportion of the delivered price of gas. In themodel stranded gas (gas far from markets) can be converted into synfuels or LNG. In the long-term,new types of high-pressure pipelines may allow the transportation of gas to consumer marketsfrom remote areas.
The international coal market is one of the most competitive energy markets, with a widedistribution of resources and a large number of suppliers around the world. Coal reservesare significantly larger than oil and gas reserves, while estimated resource availability issufficiently high that there is unlikely to be any constraints on supply well beyond the modeltime horizon.
In all regions brown coal and hard coal are modelled separately (Figure A1.4). For hard coal witha high-ash content raw coal and washed coal are modelled separately. For hard coal with low ashcontent this difference is not made. The current model does not account for regional differencesin the sulphur content and mercury content of coal. In the residential and commercial sectorsbriquettes are also modelled. Transportation is split into two categories (demand close to themines and long-distance transportation).
ANNEXES 209
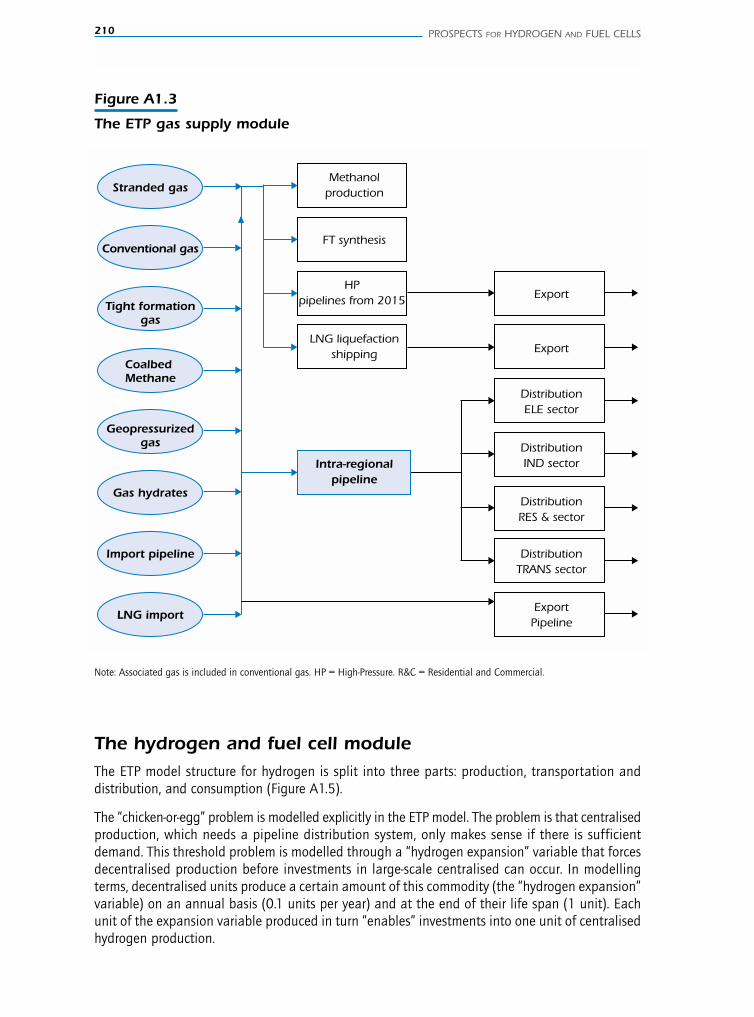
210 PROSPECTS FOR HYDROGEN AND FUEL CELLS
Figure A1.3
The ETP gas supply module
Stranded gas
Conventional gas
Tight formation gas
Coalbed Methane
Geopressurized gas
Gas hydrates
Import pipeline
LNG import
LNG liquefactionshipping
Intra-regional pipeline
HP pipelines from 2015
Export
Distribution ELE sector
Distribution IND sector
Distribution RES & sector
Distribution TRANS sector
Export Pipeline
Export
FT synthesis
Methanolproduction
Note: Associated gas is included in conventional gas. HP = High-Pressure. R&C = Residential and Commercial.
The hydrogen and fuel cell moduleThe ETP model structure for hydrogen is split into three parts: production, transportation anddistribution, and consumption (Figure A1.5).
The “chicken-or-egg” problem is modelled explicitly in the ETP model. The problem is that centralisedproduction, which needs a pipeline distribution system, only makes sense if there is sufficientdemand. This threshold problem is modelled through a “hydrogen expansion” variable that forcesdecentralised production before investments in large-scale centralised can occur. In modellingterms, decentralised units produce a certain amount of this commodity (the “hydrogen expansion”variable) on an annual basis (0.1 units per year) and at the end of their life span (1 unit). Eachunit of the expansion variable produced in turn “enables” investments into one unit of centralisedhydrogen production.
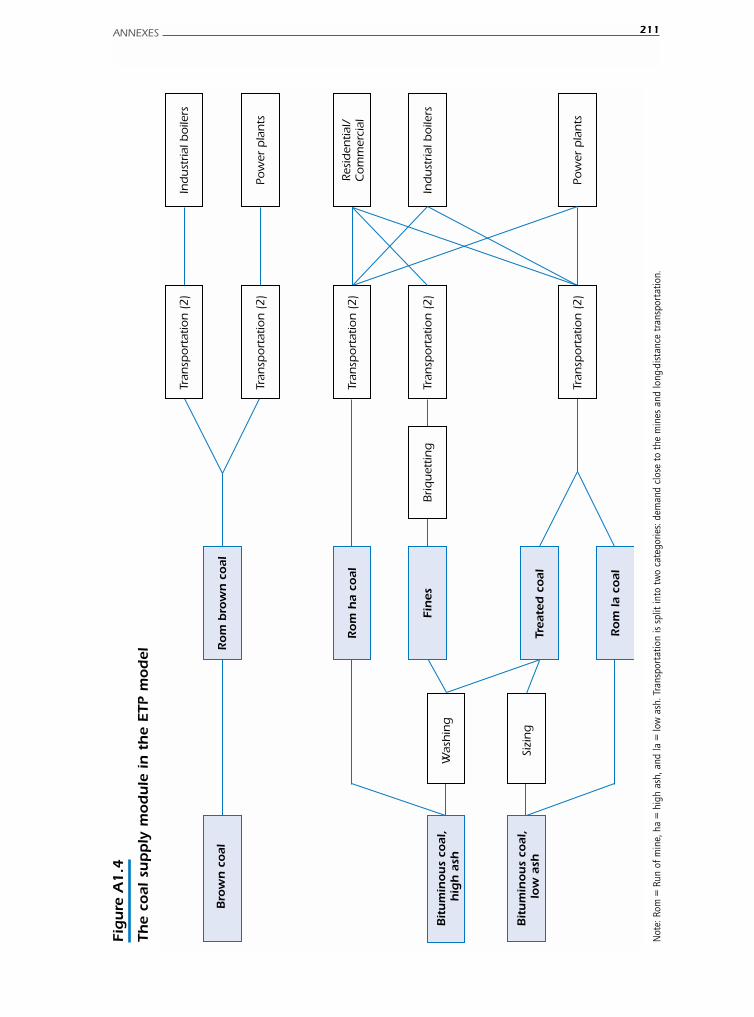
ANNEXES 211
Fig
ure
A1
.4
The
coal
supply
mod
ule
in
th
e ETP
mod
el
Bro
wn
coal
Was
hin
g
Sizi
ng
Rom
bro
wn
coal
Rom
ha
coal
Fin
esB
riq
uet
ting
Tran
spo
rtat
ion
(2
)
Tran
spo
rtat
ion
(2
)
Tran
spo
rtat
ion
(2
)
Pow
er p
lan
ts
Ind
ust
rial
bo
ilers
Pow
er p
lan
ts
Trea
ted
coal
Rom
la
coal
Tran
spo
rtat
ion
(2
)Re
sid
entia
l/C
om
mer
cial
Ind
ust
rial
bo
ilers
Tran
spo
rtat
ion
(2
)
Bit
um
inous
coal
,
hig
h a
sh
Bit
um
inous
coal
,
low
ash
Not
e: R
om =
Run
of m
ine,
ha
= hi
gh a
sh, a
nd la
= lo
w a
sh. T
rans
port
atio
n is
spl
it in
to t
wo
cate
gorie
s: de
man
d cl
ose
to t
he m
ines
and
long
-dis
tanc
e tr
ansp
orta
tion.
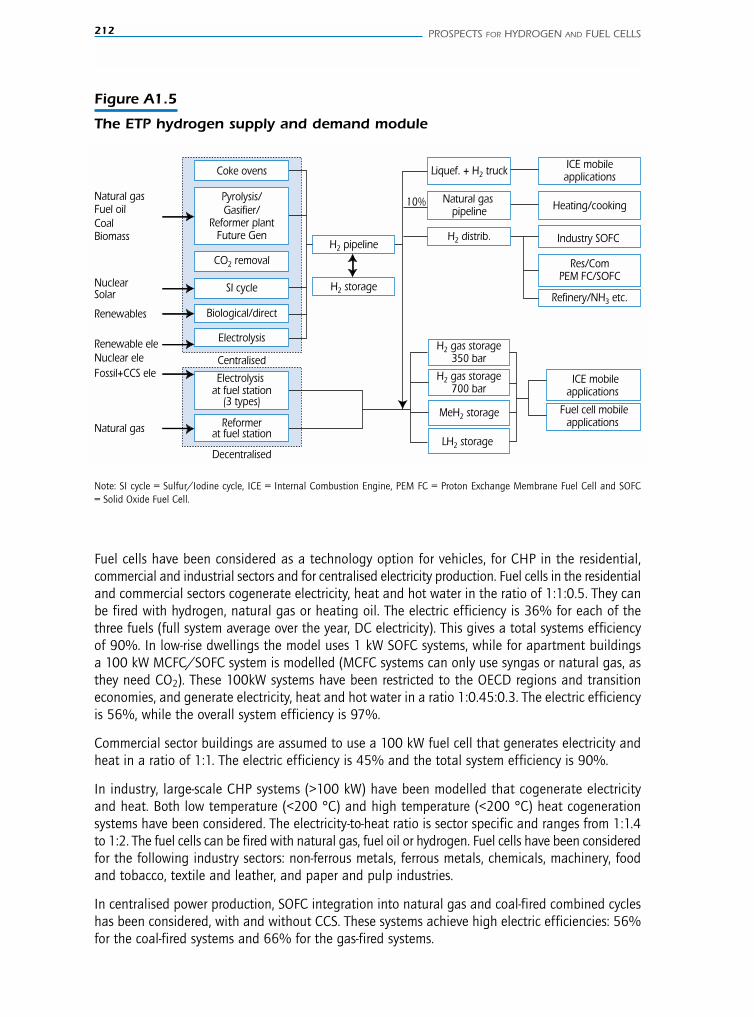
212 PROSPECTS FOR HYDROGEN AND FUEL CELLS
Fuel cells have been considered as a technology option for vehicles, for CHP in the residential,commercial and industrial sectors and for centralised electricity production. Fuel cells in the residentialand commercial sectors cogenerate electricity, heat and hot water in the ratio of 1:1:0.5. They canbe fired with hydrogen, natural gas or heating oil. The electric efficiency is 36% for each of thethree fuels (full system average over the year, DC electricity). This gives a total systems efficiencyof 90%. In low-rise dwellings the model uses 1 kW SOFC systems, while for apartment buildingsa 100 kW MCFC/SOFC system is modelled (MCFC systems can only use syngas or natural gas, asthey need CO2). These 100kW systems have been restricted to the OECD regions and transitioneconomies, and generate electricity, heat and hot water in a ratio 1:0.45:0.3. The electric efficiencyis 56%, while the overall system efficiency is 97%.
Commercial sector buildings are assumed to use a 100 kW fuel cell that generates electricity andheat in a ratio of 1:1. The electric efficiency is 45% and the total system efficiency is 90%.
In industry, large-scale CHP systems (>100 kW) have been modelled that cogenerate electricityand heat. Both low temperature (<200 °C) and high temperature (<200 °C) heat cogenerationsystems have been considered. The electricity-to-heat ratio is sector specific and ranges from 1:1.4to 1:2. The fuel cells can be fired with natural gas, fuel oil or hydrogen. Fuel cells have been consideredfor the following industry sectors: non-ferrous metals, ferrous metals, chemicals, machinery, foodand tobacco, textile and leather, and paper and pulp industries.
In centralised power production, SOFC integration into natural gas and coal-fired combined cycleshas been considered, with and without CCS. These systems achieve high electric efficiencies: 56%for the coal-fired systems and 66% for the gas-fired systems.
Figure A1.5
The ETP hydrogen supply and demand module
Heating/cooking
ICE mobile applications
Refinery/NH3 etc.H2 storage
Natural gas
Liquef. + H2 truck
Fuel oilCoal
Natural gas
Biomass
Fuel cell mobile applications
ICE mobile applications
Industry SOFC
10%
Res/ComPEM FC/SOFC
LH2 storage
SolarNuclear
H2 gas storage 350 bar
H2 gas storage 700 bar
MeH2 storage
Renewable ele
Fossil+CCS eleNuclear ele Centralised
Renewables
Decentralised
at fuel station
Electrolysis at fuel station
(3 types)
Natural gas pipeline
H2 distrib.H2 pipeline
Coke ovens
Electrolysis
SI cycle
CO2 removal
Biological/direct
Pyrolysis/Gasifier/
Reformer plantFuture Gen
Reformer
Note: SI cycle = Sulfur/Iodine cycle, ICE = Internal Combustion Engine, PEM FC = Proton Exchange Membrane Fuel Cell and SOFC= Solid Oxide Fuel Cell.
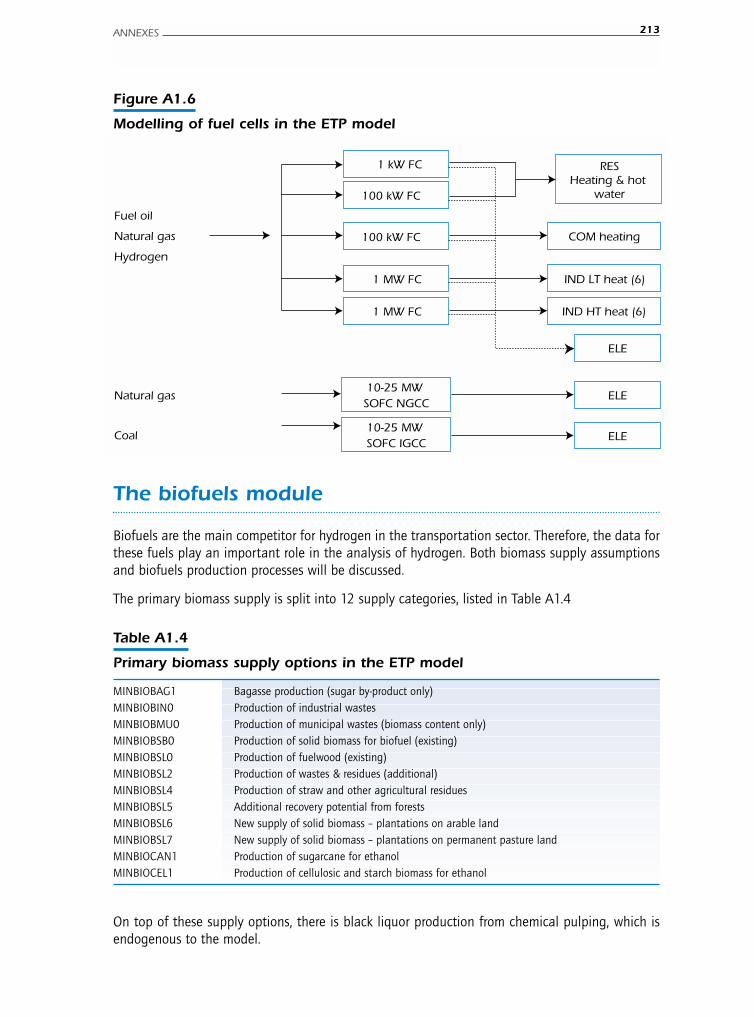
The biofuels module
Biofuels are the main competitor for hydrogen in the transportation sector. Therefore, the data forthese fuels play an important role in the analysis of hydrogen. Both biomass supply assumptionsand biofuels production processes will be discussed.
The primary biomass supply is split into 12 supply categories, listed in Table A1.4
ANNEXES 213
Figure A1.6
Modelling of fuel cells in the ETP model
Coal
RESHeating & hot
water
IND LT heat (6)
ELE
COM heating
1 kW FC
100 kW FC
10-25 MW SOFC IGCC
100 kW FC
IND HT heat (6)1 MW FC
Fuel oil
Natural gas
Hydrogen
Natural gas
ELE
10-25 MW SOFC NGCC
ELE
1 MW FC
Table A1.4
Primary biomass supply options in the ETP model
MINBIOBAG1 Bagasse production (sugar by-product only)MINBIOBIN0 Production of industrial wastesMINBIOBMU0 Production of municipal wastes (biomass content only)MINBIOBSB0 Production of solid biomass for biofuel (existing)MINBIOBSL0 Production of fuelwood (existing)MINBIOBSL2 Production of wastes & residues (additional)MINBIOBSL4 Production of straw and other agricultural residuesMINBIOBSL5 Additional recovery potential from forestsMINBIOBSL6 New supply of solid biomass – plantations on arable landMINBIOBSL7 New supply of solid biomass – plantations on permanent pasture landMINBIOCAN1 Production of sugarcane for ethanolMINBIOCEL1 Production of cellulosic and starch biomass for ethanol
On top of these supply options, there is black liquor production from chemical pulping, which isendogenous to the model.
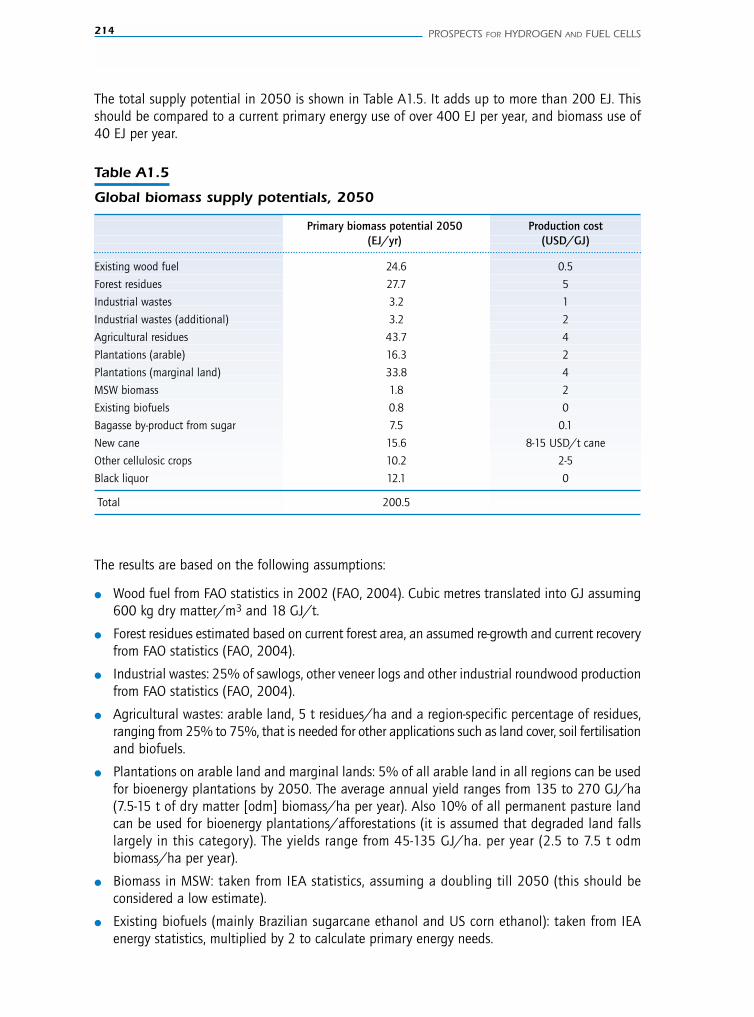
214 PROSPECTS FOR HYDROGEN AND FUEL CELLS
The total supply potential in 2050 is shown in Table A1.5. It adds up to more than 200 EJ. Thisshould be compared to a current primary energy use of over 400 EJ per year, and biomass use of40 EJ per year.
Table A1.5
Global biomass supply potentials, 2050
Primary biomass potential 2050 Production cost(EJ/yr) (USD/GJ)
Existing wood fuel 24.6 0.5
Forest residues 27.7 5
Industrial wastes 3.2 1
Industrial wastes (additional) 3.2 2
Agricultural residues 43.7 4
Plantations (arable) 16.3 2
Plantations (marginal land) 33.8 4
MSW biomass 1.8 2
Existing biofuels 0.8 0
Bagasse by-product from sugar 7.5 0.1
New cane 15.6 8-15 USD/t cane
Other cellulosic crops 10.2 2-5
Black liquor 12.1 0
Total 200.5
The results are based on the following assumptions:
● Wood fuel from FAO statistics in 2002 (FAO, 2004). Cubic metres translated into GJ assuming600 kg dry matter/m3 and 18 GJ/t.
● Forest residues estimated based on current forest area, an assumed re-growth and current recoveryfrom FAO statistics (FAO, 2004).
● Industrial wastes: 25% of sawlogs, other veneer logs and other industrial roundwood productionfrom FAO statistics (FAO, 2004).
● Agricultural wastes: arable land, 5 t residues/ha and a region-specific percentage of residues,ranging from 25% to 75%, that is needed for other applications such as land cover, soil fertilisationand biofuels.
● Plantations on arable land and marginal lands: 5% of all arable land in all regions can be usedfor bioenergy plantations by 2050. The average annual yield ranges from 135 to 270 GJ/ha(7.5-15 t of dry matter [odm] biomass/ha per year). Also 10% of all permanent pasture landcan be used for bioenergy plantations/afforestations (it is assumed that degraded land fallslargely in this category). The yields range from 45-135 GJ/ha. per year (2.5 to 7.5 t odmbiomass/ha per year).
● Biomass in MSW: taken from IEA statistics, assuming a doubling till 2050 (this should beconsidered a low estimate).
● Existing biofuels (mainly Brazilian sugarcane ethanol and US corn ethanol): taken from IEAenergy statistics, multiplied by 2 to calculate primary energy needs.
● New cane: estimated a potential doubling of global production between 2000-2050, based onproduction trends 1960-2005 according to FAO statistics. This additional production wouldrepresent about 30 million ha, or about 2% of global arable land.
● Other cellulosic crops: 5% of arable land, yields ranging from 5 to 10 t/ha per year.
● Black liquor: The 2050 potential represents a 4-5 fold increase of 2000 potentials. This assumesa strong growth in paper production, and a continued shift from mechanical pulp to chemicalpulp. This should be considered a high estimate.
In total, 12% of global arable land would be available for bioenergy production by 2050, 10% ofall pasture land, as well as maximizing the recovery of residues from forests and from agriculturefor bioenergy. If the full potential were used, one-third of the biomass would come from existingforests, one-third from by-products and one-third from dedicated plantations.
In 2003, world fuel ethanol production amounted to 28 billion litres. At 21.1 MJ/l (LHV), thatequals 0.4 mb/d (about 0.5% of global oil consumption). The production is mainly concentratedin Brazil and the United States. This production is based on sugar cane in Brazil and on corn in theUnited States. Data for ethanol production cost from cane and starch crops such as corn were takenfrom the FO Lichts newsletters (FO Lichts 2004, 2005a, 2005b). Various countries and regions areplanning a rapid expansion of ethanol production. Some scenarios suggest that a ten-fold increase(to 4 mbd) by 2020 would be feasible, based on sugar cane ethanol alone (IEA 2004c). The resourcebase for ethanol production is gradually widening to cellulosic crops, and even wood. Such low-costfeedstocks would result in an increase in the global production potential for low-cost ethanol.
Also, biomass can be converted via FT-processes. Costs are higher than for gas and coal, becauseof the unfavourable economies of scale related to the dispersed nature of the biomass resource.Production costs are around USD 90/bbl (USD 19/GJ) for a biomass feedstock price of USD 3/GJ(Hamelinck et al., 2004). These costs could be reduced to USD 70-80 /bbl (USD 14-16/GJ). Dueto its high cost this process is not currently in use. However, model analysis suggests that this maychange if CO2 incentives are introduced. A combination of FT-synthesis with CO2 capture and storagecould become attractive, provided sufficient economic of scale can be achieved. Such a productionprocess would result in net CO2 removal from the atmosphere.
One of the more exotic options for CO2 capture is the production of hydrogen and other synfuels frombiomass (Read and Lermit 2003). This strategy reduces atmospheric CO2 concentrations and producesenergy at the same time. The scale of biomass hydrogen production plants are typically one order ofmagnitude smaller than coal-based hydrogen production plants. Given that investment costs of chemicalplants typically increase with scale by a factor of 0.7, the specific investment costs for biomass-basedhydrogen production is twice that of coal-based hydrogen production per unit of energy.
Many other biofuels production technologies are under development, such as flash pyrolysis andhydrothermal liquefaction. HTU is an acronym for HydroThermal Upgrading. Biomass (wet chipsor a slurry) is treated with water in a mixed reactor at temperatures of 300-350 °C at pressures of120 to 180 bar for 5-10 minutes. This type of conversion process is called hydrothermal liquefaction.The oxygen content of the biomass is reduced from 40 weight% to about 10-15% by the selectiveformation of CO2. Under these conditions, an organic liquid (or “biocrude”) is formed, which resemblescrude oil. The biocrude can be upgraded to a naphtha-like product by removal of the remainingoxygen (by catalytic hydro-deoxygenation, using hydrogen). The upgraded product can be used asa feedstock in the production of chemicals based on the existing steamcracking technology (Naberet al 1999). The HTU process can take different feedstocks and could be an attractive option forfeedstocks with a high water content such as kitchen waste, or waste water treatment sludge,since no drying is required.
ANNEXES 215

216 PROSPECTS FOR HYDROGEN AND FUEL CELLS
Previous attempts in the United States in the 1970s and 1980s to develop a similar process failedbecause of problems with the biomass injection system and due to insufficient understanding ofthe reaction mechanisms and the process dynamics. The HTU process and its predecessors are basedon the use of water as a solvent. Other organic solvents may be more promising options (solvolysis),because they can reach similar temperatures in a liquid state at atmospheric pressures, resultingin significantly reduced process equipment costs (Venderbosch et al., 2000). More research is requiredbefore this process can become operational. Following successful pilot plant tests in recent years,the Dutch government has recently announced its support for a demonstration plant.
Figure A1.7
The bioenergy supply and demand module in the ETP model
CO2 capture & storage
Primary biomass (12 supply options)
Transportation sector
DME production (2)
Methanol production
FT synthesis
Hydrogen production
Hydrothermal liquefaction
Charcoal production
Electricity production (4)
Residential & commercial heating
Residential & commercial hot water
Industry process heat(4)
Industry steam (5)
Ethanol production (3)
Industry Feedstock
Industry CHP (14)
Residential & commercial cooking
Table A1.6
Biomass supply potential by region, 2050
(PJ/yr) AFR AUS CAN CHI CSA EEU FSU IND JPN MEA MEX ODA SKO USA WEU
MINBIOBAG1 434 115 0 623 3 166 0 0 1 449 6 0 236 1 310 0 155 0 7 494
MINBIOBIN0 150 83 452 234 257 123 252 50 31 26 17 502 2 658 400 3 237
MINBIOBMU0 20 20 20 20 20 20 20 20 87 0 40 20 11 910 580 1 808
MINBIOBSB0 0 0 0 0 569 0 0 0 0 0 0 0 0 240 25 835
MINBIOBSL0 5 737 33 33 2 063 2 909 170 644 3 246 1 77 410 8 414 27 465 358 24 586
MINBIOBSL2 151 83 452 234 257 123 252 50 31 26 17 502 2 658 400 3 237
MINBIOBSL4 3 500 1 900 1 700 2 700 8 300 1 600 7 600 3 000 200 1 200 500 2 000 100 6 600 2 800 43 700
MINBIOBSL5 4 236 242 2 432 194 10 368 106 5 779 3 451 4 484 24 118 2 561 702 27 704
MINBIOBSL6 2 496 672 309 1 925 1 999 387 1 364 2 183 60 880 335 1 407 23 1 584 679 16 303
MINBIOBSL7 8 104 1 855 131 5 400 8 309 176 1 620 149 6 2 592 720 2 090 1 2 104 534 33 791
MINBIOCAN1 4 000 400 0 1 600 4 000 0 0 1 600 0 0 0 4 000 0 0 0 15 600
MINBIOCEL1 1 479 299 274 1 141 1 185 258 808 1 294 35 391 198 834 13 1 408 603 10 221
Black liquor 108 1 632 814 4 400 340 245 140 480 525 25 95 435 270 1 265 835 11 609
30 414 7 334 6 617 20 534 41 679 3 208 18 479 13 524 1 433 5 221 3 052 21 538 566 18 607 7 917 200 124
The transport module
The transport sector is divided into 15 demand categories:
● Domestic aviation.
● International aviation.
● Buses.
● Minibuses.
● Three wheels.
● Heavy trucks.
● SUVs and light trucks.
● Light and medium commercial trucks.
● Cars.
● Two wheels.
● Taxis.
● Rail-freight.
● Rail-passenger.
● Domestic ships.
● International ships.
The demand projections and the reference efficiency trends are taken from the Sustainable Mobilitystudy. This study was jointly developed by the IEA and the World Business Council on SustainableDevelopment (WBCSD, 2004). Efficiency options have been considered for regular ICEs (up to a20% efficiency gain, compared to the autonomous efficiency gain). Hybrid vehicles have beenconsidered and can result in even more substantial efficiency gains.
Apart from efficiency measures, a number of fuel alternatives are considered for passenger cars:
● Gasoline.
● Diesel.
● DME.
● Pure ethanol (for flex vehicles).
● 10% ethanol in gasoline.
● Compressed Natural Gas (CNG).
● Hydrogen.
● LPG.
● Methanol.
In certain cases (e.g. in the case of hydrogen), the use of alternative fuels results in efficiencygains. Diesel and gasoline can be produced from crude oil in refineries, or they can be producedfrom coal, natural gas and biomass. If there is demand for such oil products in other sectors, it isnot possible to allocate the synthetic production of these fuels directly to the transportationsector. A weighted allocation has been used as a proxy in the analysis.
ANNEXES 217

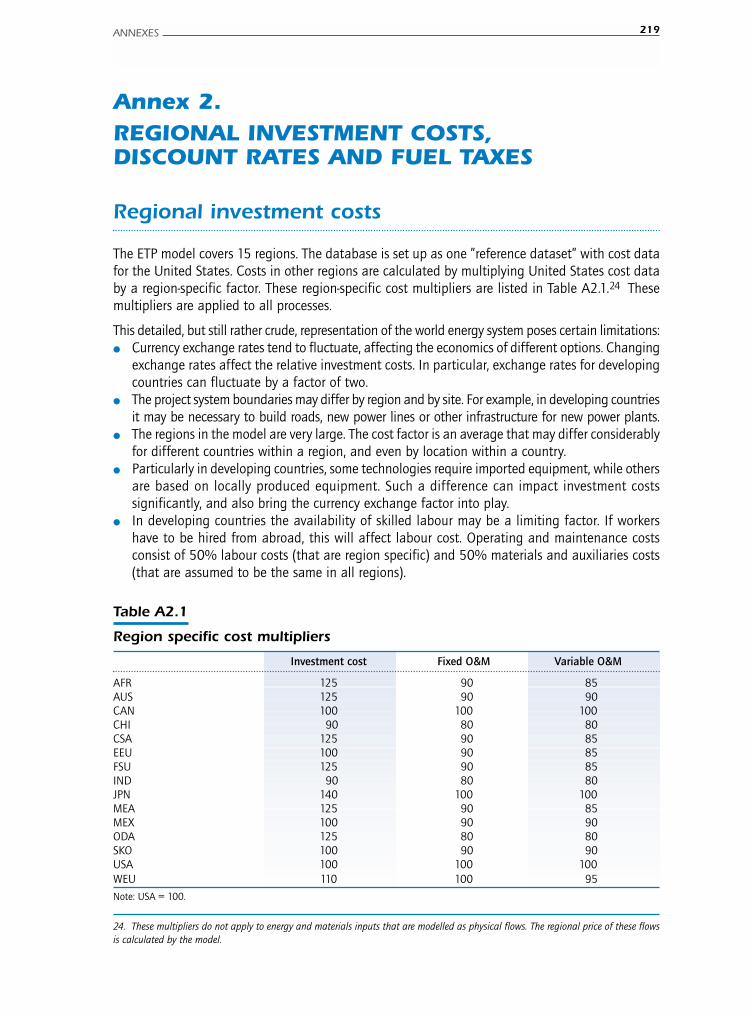
ANNEXES 219
Annex 2.REGIONAL INVESTMENT COSTS,DISCOUNT RATES AND FUEL TAXES
Regional investment costs
The ETP model covers 15 regions. The database is set up as one ”reference dataset” with cost datafor the United States. Costs in other regions are calculated by multiplying United States cost databy a region-specific factor. These region-specific cost multipliers are listed in Table A2.1.24 Thesemultipliers are applied to all processes.
This detailed, but still rather crude, representation of the world energy system poses certain limitations:● Currency exchange rates tend to fluctuate, affecting the economics of different options. Changing
exchange rates affect the relative investment costs. In particular, exchange rates for developingcountries can fluctuate by a factor of two.
● The project system boundaries may differ by region and by site. For example, in developing countriesit may be necessary to build roads, new power lines or other infrastructure for new power plants.
● The regions in the model are very large. The cost factor is an average that may differ considerablyfor different countries within a region, and even by location within a country.
● Particularly in developing countries, some technologies require imported equipment, while othersare based on locally produced equipment. Such a difference can impact investment costssignificantly, and also bring the currency exchange factor into play.
● In developing countries the availability of skilled labour may be a limiting factor. If workershave to be hired from abroad, this will affect labour cost. Operating and maintenance costsconsist of 50% labour costs (that are region specific) and 50% materials and auxiliaries costs(that are assumed to be the same in all regions).
24. These multipliers do not apply to energy and materials inputs that are modelled as physical flows. The regional price of these flowsis calculated by the model.
Table A2.1
Region specific cost multipliers
Investment cost Fixed O&M Variable O&M
AFR 125 90 85AUS 125 90 90CAN 100 100 100CHI 90 80 80CSA 125 90 85EEU 100 90 85FSU 125 90 85IND 90 80 80JPN 140 100 100MEA 125 90 85MEX 100 90 90ODA 125 80 80SKO 100 90 90USA 100 100 100WEU 110 100 95
Note: USA = 100.
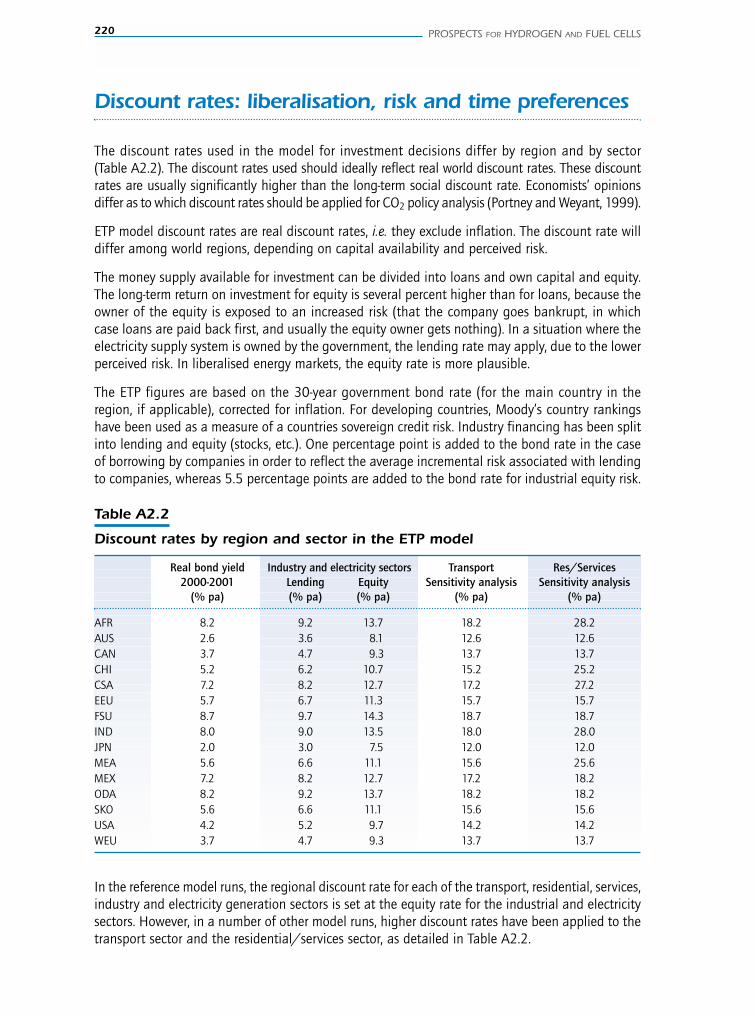
220 PROSPECTS FOR HYDROGEN AND FUEL CELLS
Discount rates: liberalisation, risk and time preferences
The discount rates used in the model for investment decisions differ by region and by sector(Table A2.2). The discount rates used should ideally reflect real world discount rates. These discountrates are usually significantly higher than the long-term social discount rate. Economists’ opinionsdiffer as to which discount rates should be applied for CO2 policy analysis (Portney and Weyant, 1999).
ETP model discount rates are real discount rates, i.e. they exclude inflation. The discount rate willdiffer among world regions, depending on capital availability and perceived risk.
The money supply available for investment can be divided into loans and own capital and equity.The long-term return on investment for equity is several percent higher than for loans, because theowner of the equity is exposed to an increased risk (that the company goes bankrupt, in whichcase loans are paid back first, and usually the equity owner gets nothing). In a situation where theelectricity supply system is owned by the government, the lending rate may apply, due to the lowerperceived risk. In liberalised energy markets, the equity rate is more plausible.
The ETP figures are based on the 30-year government bond rate (for the main country in theregion, if applicable), corrected for inflation. For developing countries, Moody’s country rankingshave been used as a measure of a countries sovereign credit risk. Industry financing has been splitinto lending and equity (stocks, etc.). One percentage point is added to the bond rate in the caseof borrowing by companies in order to reflect the average incremental risk associated with lendingto companies, whereas 5.5 percentage points are added to the bond rate for industrial equity risk.
Table A2.2
Discount rates by region and sector in the ETP model
Real bond yield Industry and electricity sectors Transport Res/Services2000-2001 Lending Equity Sensitivity analysis Sensitivity analysis
(% pa) (% pa) (% pa) (% pa) (% pa)
AFR 8.2 9.2 13.7 18.2 28.2AUS 2.6 3.6 8.1 12.6 12.6CAN 3.7 4.7 9.3 13.7 13.7CHI 5.2 6.2 10.7 15.2 25.2CSA 7.2 8.2 12.7 17.2 27.2EEU 5.7 6.7 11.3 15.7 15.7FSU 8.7 9.7 14.3 18.7 18.7IND 8.0 9.0 13.5 18.0 28.0JPN 2.0 3.0 7.5 12.0 12.0MEA 5.6 6.6 11.1 15.6 25.6MEX 7.2 8.2 12.7 17.2 18.2ODA 8.2 9.2 13.7 18.2 18.2SKO 5.6 6.6 11.1 15.6 15.6USA 4.2 5.2 9.7 14.2 14.2WEU 3.7 4.7 9.3 13.7 13.7
In the reference model runs, the regional discount rate for each of the transport, residential, services,industry and electricity generation sectors is set at the equity rate for the industrial and electricitysectors. However, in a number of other model runs, higher discount rates have been applied to thetransport sector and the residential/services sector, as detailed in Table A2.2.
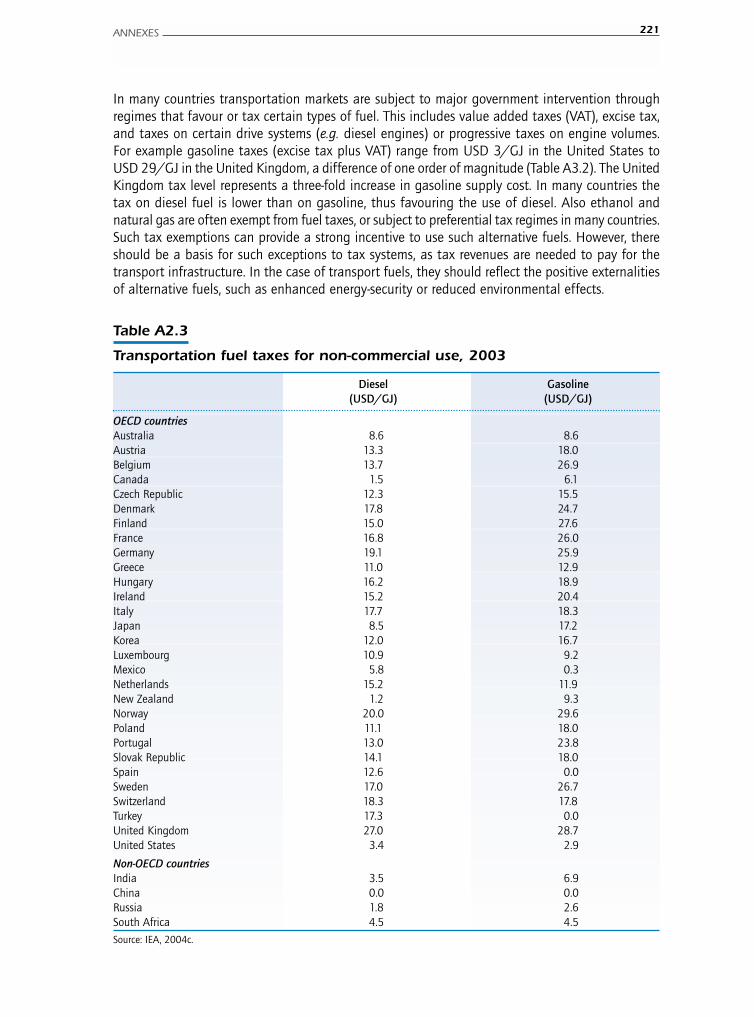
In many countries transportation markets are subject to major government intervention throughregimes that favour or tax certain types of fuel. This includes value added taxes (VAT), excise tax,and taxes on certain drive systems (e.g. diesel engines) or progressive taxes on engine volumes.For example gasoline taxes (excise tax plus VAT) range from USD 3/GJ in the United States toUSD 29/GJ in the United Kingdom, a difference of one order of magnitude (Table A3.2). The UnitedKingdom tax level represents a three-fold increase in gasoline supply cost. In many countries thetax on diesel fuel is lower than on gasoline, thus favouring the use of diesel. Also ethanol andnatural gas are often exempt from fuel taxes, or subject to preferential tax regimes in many countries.Such tax exemptions can provide a strong incentive to use such alternative fuels. However, thereshould be a basis for such exceptions to tax systems, as tax revenues are needed to pay for thetransport infrastructure. In the case of transport fuels, they should reflect the positive externalitiesof alternative fuels, such as enhanced energy-security or reduced environmental effects.
ANNEXES 221
Table A2.3
Transportation fuel taxes for non-commercial use, 2003
Diesel Gasoline(USD/GJ) (USD/GJ)
OECD countriesAustralia 8.6 8.6Austria 13.3 18.0Belgium 13.7 26.9Canada 1.5 6.1Czech Republic 12.3 15.5Denmark 17.8 24.7Finland 15.0 27.6France 16.8 26.0Germany 19.1 25.9Greece 11.0 12.9Hungary 16.2 18.9Ireland 15.2 20.4Italy 17.7 18.3Japan 8.5 17.2Korea 12.0 16.7Luxembourg 10.9 9.2Mexico 5.8 0.3Netherlands 15.2 11.9New Zealand 1.2 9.3Norway 20.0 29.6Poland 11.1 18.0Portugal 13.0 23.8Slovak Republic 14.1 18.0Spain 12.6 0.0Sweden 17.0 26.7Switzerland 18.3 17.8Turkey 17.3 0.0United Kingdom 27.0 28.7United States 3.4 2.9
Non-OECD countriesIndia 3.5 6.9China 0.0 0.0Russia 1.8 2.6South Africa 4.5 4.5
Source: IEA, 2004c.

222 PROSPECTS FOR HYDROGEN AND FUEL CELLS
For the model analysis it is assumed that the regional taxes remain at their current levels in absoluteterms (USD/GJ) through the period 2000-2050. The diesel tax in Europe is set at 75% of thegasoline tax. For alternative fuels (CNG, LPG, DME, ethanol, methanol) it is assumed that a tax isgradually introduced and reaches 75% of the gasoline tax by 2050. Synthetic gasoline and diesel(FT fuels) are assumed to be taxed like gasoline and diesel from oil, as it will be very difficult tojustify a difference. This approach of gradually increasing taxes ensures that government revenuestreams are not compromised as the use of alternative fuels grow.
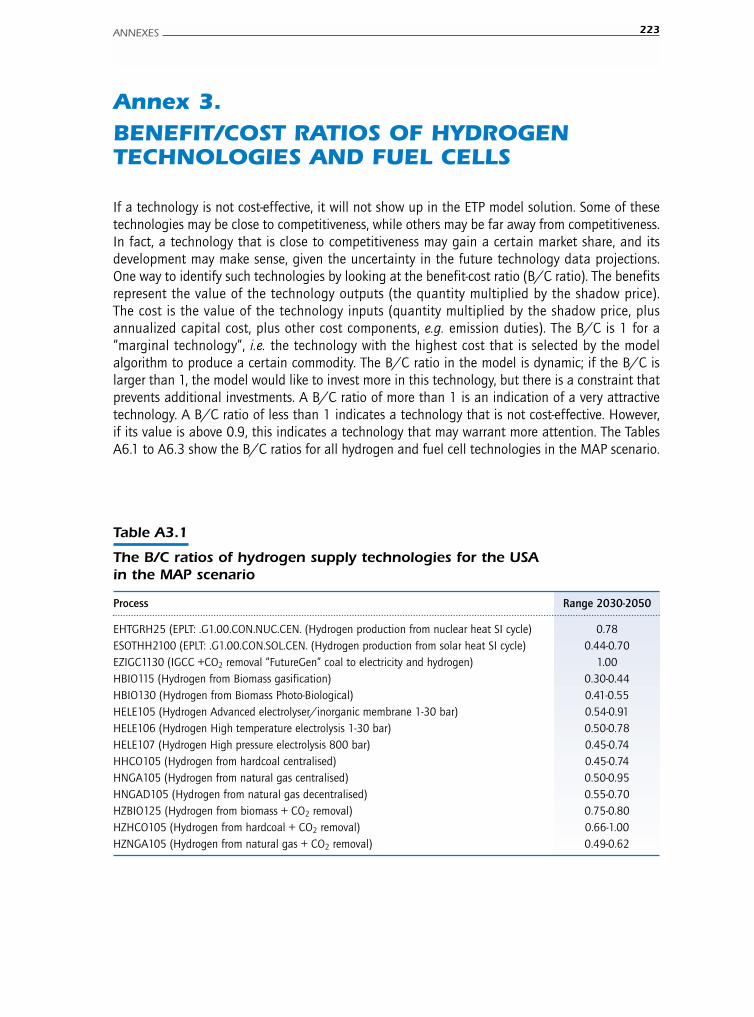
ANNEXES 223
Annex 3.BENEFIT/COST RATIOS OF HYDROGENTECHNOLOGIES AND FUEL CELLS
If a technology is not cost-effective, it will not show up in the ETP model solution. Some of thesetechnologies may be close to competitiveness, while others may be far away from competitiveness.In fact, a technology that is close to competitiveness may gain a certain market share, and itsdevelopment may make sense, given the uncertainty in the future technology data projections.One way to identify such technologies by looking at the benefit-cost ratio (B/C ratio). The benefitsrepresent the value of the technology outputs (the quantity multiplied by the shadow price).The cost is the value of the technology inputs (quantity multiplied by the shadow price, plusannualized capital cost, plus other cost components, e.g. emission duties). The B/C is 1 for a“marginal technology”, i.e. the technology with the highest cost that is selected by the modelalgorithm to produce a certain commodity. The B/C ratio in the model is dynamic; if the B/C islarger than 1, the model would like to invest more in this technology, but there is a constraint thatprevents additional investments. A B/C ratio of more than 1 is an indication of a very attractivetechnology. A B/C ratio of less than 1 indicates a technology that is not cost-effective. However,if its value is above 0.9, this indicates a technology that may warrant more attention. The TablesA6.1 to A6.3 show the B/C ratios for all hydrogen and fuel cell technologies in the MAP scenario.
Table A3.1
The B/C ratios of hydrogen supply technologies for the USAin the MAP scenario
Process Range 2030-2050
EHTGRH25 (EPLT: .G1.00.CON.NUC.CEN. (Hydrogen production from nuclear heat SI cycle) 0.78ESOTHH2100 (EPLT: .G1.00.CON.SOL.CEN. (Hydrogen production from solar heat SI cycle) 0.44-0.70EZIGC1130 (IGCC +CO2 removal “FutureGen” coal to electricity and hydrogen) 1.00HBIO115 (Hydrogen from Biomass gasification) 0.30-0.44HBIO130 (Hydrogen from Biomass Photo-Biological) 0.41-0.55HELE105 (Hydrogen Advanced electrolyser/inorganic membrane 1-30 bar) 0.54-0.91HELE106 (Hydrogen High temperature electrolysis 1-30 bar) 0.50-0.78HELE107 (Hydrogen High pressure electrolysis 800 bar) 0.45-0.74HHCO105 (Hydrogen from hardcoal centralised) 0.45-0.74HNGA105 (Hydrogen from natural gas centralised) 0.50-0.95HNGAD105 (Hydrogen from natural gas decentralised) 0.55-0.70HZBIO125 (Hydrogen from biomass + CO2 removal) 0.75-0.80HZHCO105 (Hydrogen from hardcoal + CO2 removal) 0.66-1.00HZNGA105 (Hydrogen from natural gas + CO2 removal) 0.49-0.62
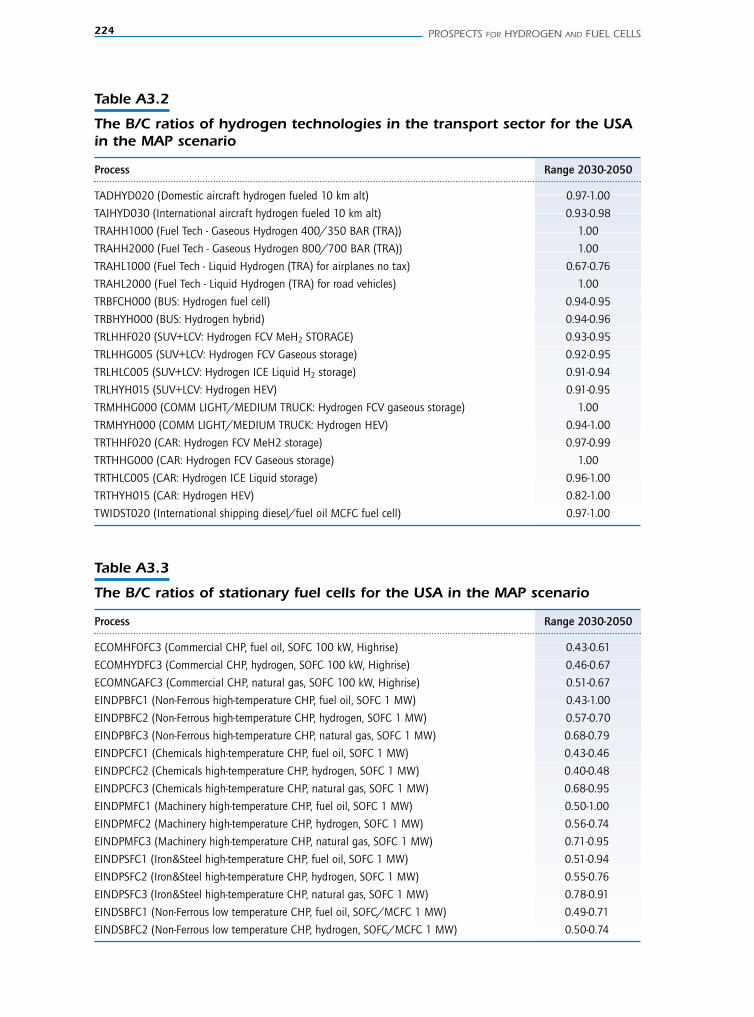
224 PROSPECTS FOR HYDROGEN AND FUEL CELLS
Table A3.2
The B/C ratios of hydrogen technologies in the transport sector for the USAin the MAP scenario
Process Range 2030-2050
TADHYD020 (Domestic aircraft hydrogen fueled 10 km alt) 0.97-1.00
TAIHYD030 (International aircraft hydrogen fueled 10 km alt) 0.93-0.98
TRAHH1000 (Fuel Tech - Gaseous Hydrogen 400/350 BAR (TRA)) 1.00
TRAHH2000 (Fuel Tech - Gaseous Hydrogen 800/700 BAR (TRA)) 1.00
TRAHL1000 (Fuel Tech - Liquid Hydrogen (TRA) for airplanes no tax) 0.67-0.76
TRAHL2000 (Fuel Tech - Liquid Hydrogen (TRA) for road vehicles) 1.00
TRBFCH000 (BUS: Hydrogen fuel cell) 0.94-0.95
TRBHYH000 (BUS: Hydrogen hybrid) 0.94-0.96
TRLHHF020 (SUV+LCV: Hydrogen FCV MeH2 STORAGE) 0.93-0.95
TRLHHG005 (SUV+LCV: Hydrogen FCV Gaseous storage) 0.92-0.95
TRLHLC005 (SUV+LCV: Hydrogen ICE Liquid H2 storage) 0.91-0.94
TRLHYH015 (SUV+LCV: Hydrogen HEV) 0.91-0.95
TRMHHG000 (COMM LIGHT/MEDIUM TRUCK: Hydrogen FCV gaseous storage) 1.00
TRMHYH000 (COMM LIGHT/MEDIUM TRUCK: Hydrogen HEV) 0.94-1.00
TRTHHF020 (CAR: Hydrogen FCV MeH2 storage) 0.97-0.99
TRTHHG000 (CAR: Hydrogen FCV Gaseous storage) 1.00
TRTHLC005 (CAR: Hydrogen ICE Liquid storage) 0.96-1.00
TRTHYH015 (CAR: Hydrogen HEV) 0.82-1.00
TWIDST020 (International shipping diesel/fuel oil MCFC fuel cell) 0.97-1.00
Table A3.3
The B/C ratios of stationary fuel cells for the USA in the MAP scenario
Process Range 2030-2050
ECOMHFOFC3 (Commercial CHP, fuel oil, SOFC 100 kW, Highrise) 0.43-0.61
ECOMHYDFC3 (Commercial CHP, hydrogen, SOFC 100 kW, Highrise) 0.46-0.67
ECOMNGAFC3 (Commercial CHP, natural gas, SOFC 100 kW, Highrise) 0.51-0.67
EINDPBFC1 (Non-Ferrous high-temperature CHP, fuel oil, SOFC 1 MW) 0.43-1.00
EINDPBFC2 (Non-Ferrous high-temperature CHP, hydrogen, SOFC 1 MW) 0.57-0.70
EINDPBFC3 (Non-Ferrous high-temperature CHP, natural gas, SOFC 1 MW) 0.68-0.79
EINDPCFC1 (Chemicals high-temperature CHP, fuel oil, SOFC 1 MW) 0.43-0.46
EINDPCFC2 (Chemicals high-temperature CHP, hydrogen, SOFC 1 MW) 0.40-0.48
EINDPCFC3 (Chemicals high-temperature CHP, natural gas, SOFC 1 MW) 0.68-0.95
EINDPMFC1 (Machinery high-temperature CHP, fuel oil, SOFC 1 MW) 0.50-1.00
EINDPMFC2 (Machinery high-temperature CHP, hydrogen, SOFC 1 MW) 0.56-0.74
EINDPMFC3 (Machinery high-temperature CHP, natural gas, SOFC 1 MW) 0.71-0.95
EINDPSFC1 (Iron&Steel high-temperature CHP, fuel oil, SOFC 1 MW) 0.51-0.94
EINDPSFC2 (Iron&Steel high-temperature CHP, hydrogen, SOFC 1 MW) 0.55-0.76
EINDPSFC3 (Iron&Steel high-temperature CHP, natural gas, SOFC 1 MW) 0.78-0.91
EINDSBFC1 (Non-Ferrous low temperature CHP, fuel oil, SOFC/MCFC 1 MW) 0.49-0.71
EINDSBFC2 (Non-Ferrous low temperature CHP, hydrogen, SOFC/MCFC 1 MW) 0.50-0.74
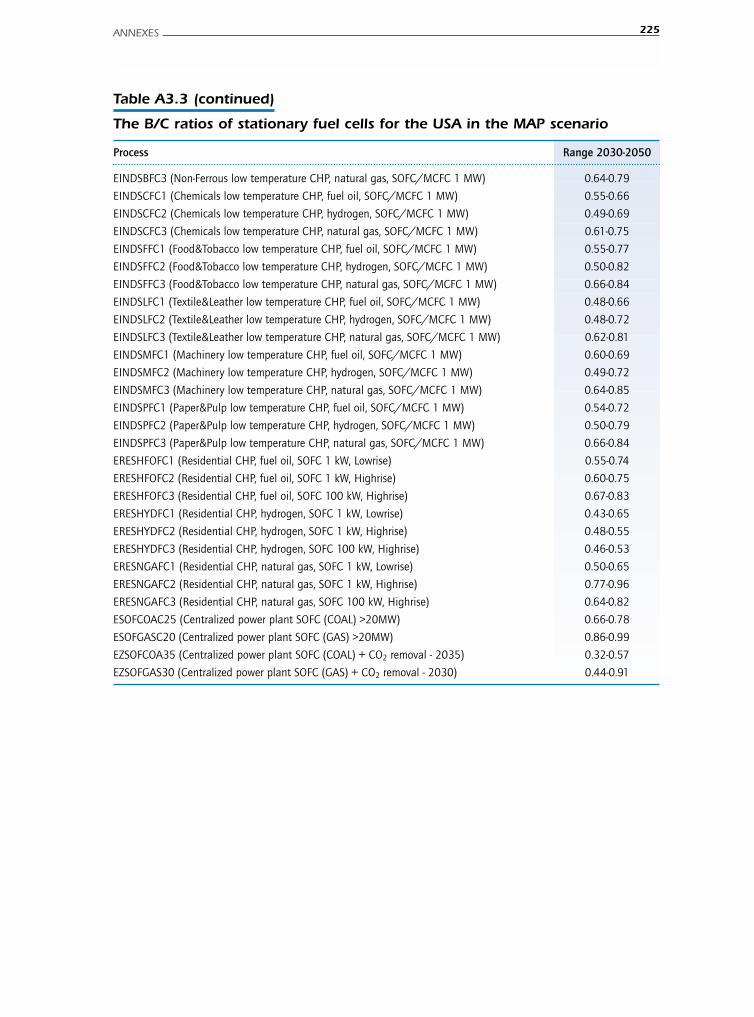
ANNEXES 225
Table A3.3 (continued)
The B/C ratios of stationary fuel cells for the USA in the MAP scenario
Process Range 2030-2050
EINDSBFC3 (Non-Ferrous low temperature CHP, natural gas, SOFC/MCFC 1 MW) 0.64-0.79
EINDSCFC1 (Chemicals low temperature CHP, fuel oil, SOFC/MCFC 1 MW) 0.55-0.66
EINDSCFC2 (Chemicals low temperature CHP, hydrogen, SOFC/MCFC 1 MW) 0.49-0.69
EINDSCFC3 (Chemicals low temperature CHP, natural gas, SOFC/MCFC 1 MW) 0.61-0.75
EINDSFFC1 (Food&Tobacco low temperature CHP, fuel oil, SOFC/MCFC 1 MW) 0.55-0.77
EINDSFFC2 (Food&Tobacco low temperature CHP, hydrogen, SOFC/MCFC 1 MW) 0.50-0.82
EINDSFFC3 (Food&Tobacco low temperature CHP, natural gas, SOFC/MCFC 1 MW) 0.66-0.84
EINDSLFC1 (Textile&Leather low temperature CHP, fuel oil, SOFC/MCFC 1 MW) 0.48-0.66
EINDSLFC2 (Textile&Leather low temperature CHP, hydrogen, SOFC/MCFC 1 MW) 0.48-0.72
EINDSLFC3 (Textile&Leather low temperature CHP, natural gas, SOFC/MCFC 1 MW) 0.62-0.81
EINDSMFC1 (Machinery low temperature CHP, fuel oil, SOFC/MCFC 1 MW) 0.60-0.69
EINDSMFC2 (Machinery low temperature CHP, hydrogen, SOFC/MCFC 1 MW) 0.49-0.72
EINDSMFC3 (Machinery low temperature CHP, natural gas, SOFC/MCFC 1 MW) 0.64-0.85
EINDSPFC1 (Paper&Pulp low temperature CHP, fuel oil, SOFC/MCFC 1 MW) 0.54-0.72
EINDSPFC2 (Paper&Pulp low temperature CHP, hydrogen, SOFC/MCFC 1 MW) 0.50-0.79
EINDSPFC3 (Paper&Pulp low temperature CHP, natural gas, SOFC/MCFC 1 MW) 0.66-0.84
ERESHFOFC1 (Residential CHP, fuel oil, SOFC 1 kW, Lowrise) 0.55-0.74
ERESHFOFC2 (Residential CHP, fuel oil, SOFC 1 kW, Highrise) 0.60-0.75
ERESHFOFC3 (Residential CHP, fuel oil, SOFC 100 kW, Highrise) 0.67-0.83
ERESHYDFC1 (Residential CHP, hydrogen, SOFC 1 kW, Lowrise) 0.43-0.65
ERESHYDFC2 (Residential CHP, hydrogen, SOFC 1 kW, Highrise) 0.48-0.55
ERESHYDFC3 (Residential CHP, hydrogen, SOFC 100 kW, Highrise) 0.46-0.53
ERESNGAFC1 (Residential CHP, natural gas, SOFC 1 kW, Lowrise) 0.50-0.65
ERESNGAFC2 (Residential CHP, natural gas, SOFC 1 kW, Highrise) 0.77-0.96
ERESNGAFC3 (Residential CHP, natural gas, SOFC 100 kW, Highrise) 0.64-0.82
ESOFCOAC25 (Centralized power plant SOFC (COAL) >20MW) 0.66-0.78
ESOFGASC20 (Centralized power plant SOFC (GAS) >20MW) 0.86-0.99
EZSOFCOA35 (Centralized power plant SOFC (COAL) + CO2 removal - 2035) 0.32-0.57
EZSOFGAS30 (Centralized power plant SOFC (GAS) + CO2 removal - 2030) 0.44-0.91

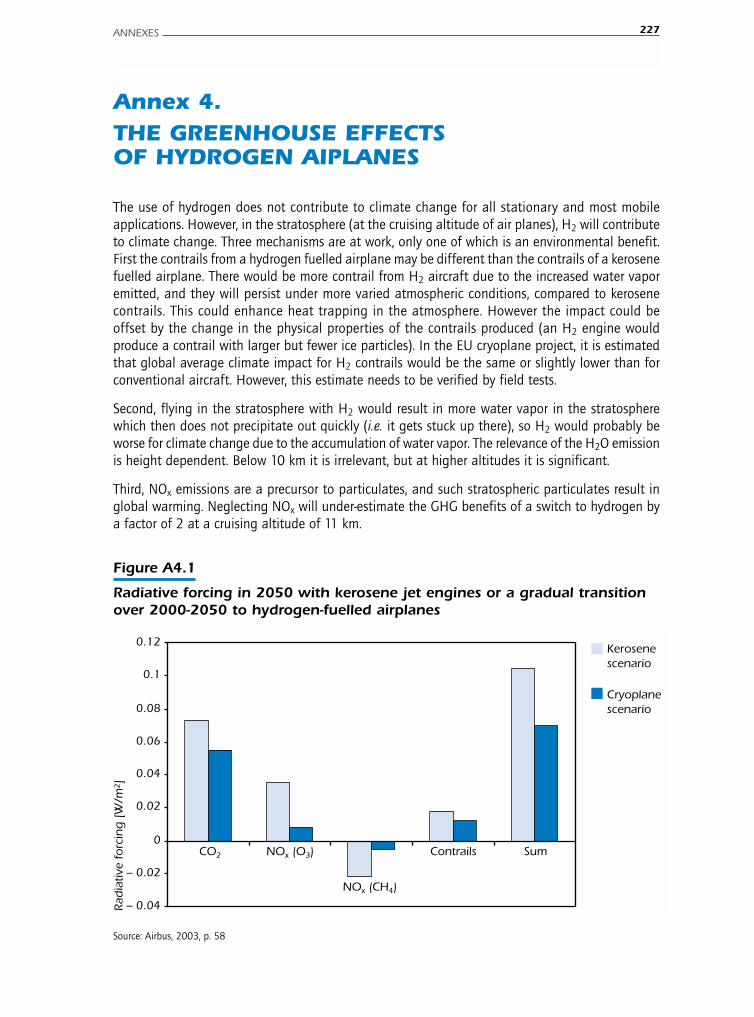
ANNEXES 227
Annex 4.THE GREENHOUSE EFFECTSOF HYDROGEN AIPLANES
The use of hydrogen does not contribute to climate change for all stationary and most mobileapplications. However, in the stratosphere (at the cruising altitude of air planes), H2 will contributeto climate change. Three mechanisms are at work, only one of which is an environmental benefit.First the contrails from a hydrogen fuelled airplane may be different than the contrails of a kerosenefuelled airplane. There would be more contrail from H2 aircraft due to the increased water vaporemitted, and they will persist under more varied atmospheric conditions, compared to kerosenecontrails. This could enhance heat trapping in the atmosphere. However the impact could beoffset by the change in the physical properties of the contrails produced (an H2 engine wouldproduce a contrail with larger but fewer ice particles). In the EU cryoplane project, it is estimatedthat global average climate impact for H2 contrails would be the same or slightly lower than forconventional aircraft. However, this estimate needs to be verified by field tests.
Second, flying in the stratosphere with H2 would result in more water vapor in the stratospherewhich then does not precipitate out quickly (i.e. it gets stuck up there), so H2 would probably beworse for climate change due to the accumulation of water vapor. The relevance of the H2O emissionis height dependent. Below 10 km it is irrelevant, but at higher altitudes it is significant.
Third, NOx emissions are a precursor to particulates, and such stratospheric particulates result inglobal warming. Neglecting NOx will under-estimate the GHG benefits of a switch to hydrogen bya factor of 2 at a cruising altitude of 11 km.
Figure A4.1
Radiative forcing in 2050 with kerosene jet engines or a gradual transitionover 2000-2050 to hydrogen-fuelled airplanes
Kerosene scenario
Cryoplanescenario
– 0.04
– 0.02
0
0.02
0.04
0.06
0.08
0.1
0.12
CO2 NOx (O3)
NOx (CH4)
Contrails Sum
Rad
iativ
e fo
rcin
g [
W/m
2]
Source: Airbus, 2003, p. 58

228 PROSPECTS FOR HYDROGEN AND FUEL CELLS
Figure A4.1 shows the radiative forcing in 2050 without any hydrogen airplanes and with a gradualtransition to hydrogen airplanes only by 2050. Due to the life span of CO2 in the stratosphere,CO2 represents an important part of the radiative forcing by 2050 due to the CO2 emitted bykerosene-fuelled airplanes in the period 2000-2050. However, due to the benefits of the otherfactors with a shorter lifespan, the overall impact is still reasonable. The difference between bothscenarios can be compared to a current radiative forcing of about 2.5 W/m2, or a reduction of1-1.5% from current levels.
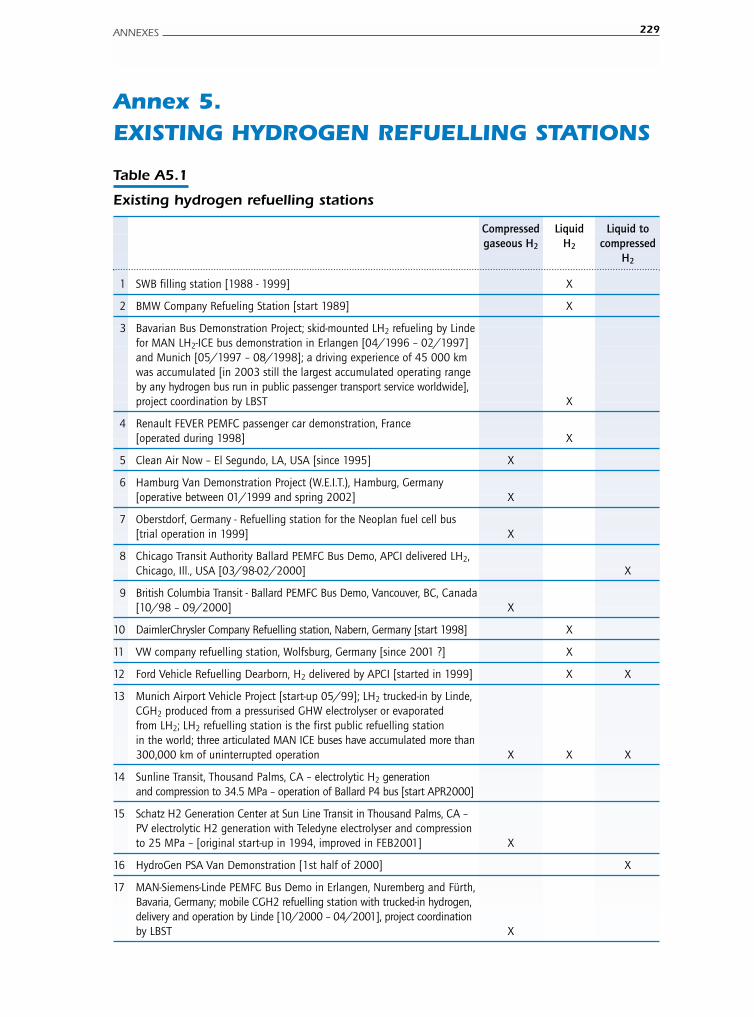
ANNEXES 229
Annex 5.EXISTING HYDROGEN REFUELLING STATIONS
Table A5.1
Existing hydrogen refuelling stations
Compressed Liquid Liquid togaseous H2 H2 compressed
H2
1 SWB filling station [1988 - 1999] X
2 BMW Company Refueling Station [start 1989] X
3 Bavarian Bus Demonstration Project; skid-mounted LH2 refueling by Lindefor MAN LH2-ICE bus demonstration in Erlangen [04/1996 – 02/1997]and Munich [05/1997 – 08/1998]; a driving experience of 45 000 kmwas accumulated [in 2003 still the largest accumulated operating rangeby any hydrogen bus run in public passenger transport service worldwide],project coordination by LBST X
4 Renault FEVER PEMFC passenger car demonstration, France[operated during 1998] X
5 Clean Air Now – El Segundo, LA, USA [since 1995] X
6 Hamburg Van Demonstration Project (W.E.I.T.), Hamburg, Germany[operative between 01/1999 and spring 2002] X
7 Oberstdorf, Germany - Refuelling station for the Neoplan fuel cell bus[trial operation in 1999] X
8 Chicago Transit Authority Ballard PEMFC Bus Demo, APCI delivered LH2,Chicago, Ill., USA [03/98-02/2000] X
9 British Columbia Transit - Ballard PEMFC Bus Demo, Vancouver, BC, Canada[10/98 – 09/2000] X
10 DaimlerChrysler Company Refuelling station, Nabern, Germany [start 1998] X
11 VW company refuelling station, Wolfsburg, Germany [since 2001 ?] X
12 Ford Vehicle Refuelling Dearborn, H2 delivered by APCI [started in 1999] X X
13 Munich Airport Vehicle Project [start-up 05/99]; LH2 trucked-in by Linde,CGH2 produced from a pressurised GHW electrolyser or evaporatedfrom LH2; LH2 refuelling station is the first public refuelling stationin the world; three articulated MAN ICE buses have accumulated more than300,000 km of uninterrupted operation X X X
14 Sunline Transit, Thousand Palms, CA – electrolytic H2 generationand compression to 34.5 MPa – operation of Ballard P4 bus [start APR2000]
15 Schatz H2 Generation Center at Sun Line Transit in Thousand Palms, CA –PV electrolytic H2 generation with Teledyne electrolyser and compressionto 25 MPa – [original start-up in 1994, improved in FEB2001] X
16 HydroGen PSA Van Demonstration [1st half of 2000] X
17 MAN-Siemens-Linde PEMFC Bus Demo in Erlangen, Nuremberg and Fürth,Bavaria, Germany; mobile CGH2 refuelling station with trucked-in hydrogen,delivery and operation by Linde [10/2000 – 04/2001], project coordinationby LBST X
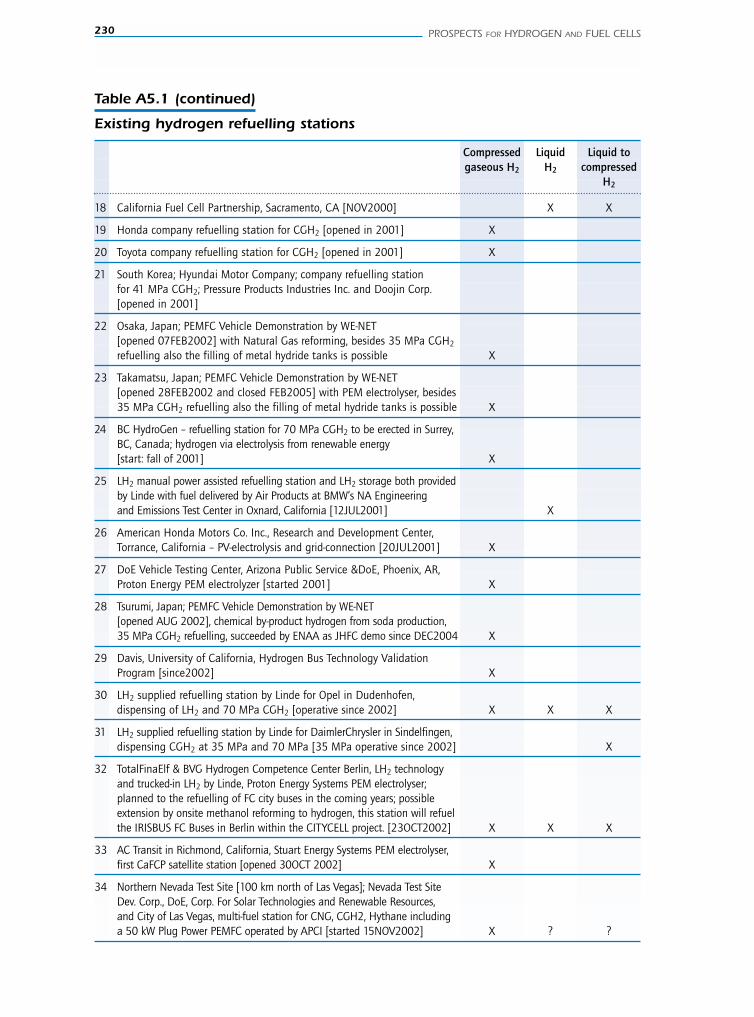
230 PROSPECTS FOR HYDROGEN AND FUEL CELLS
Table A5.1 (continued)
Existing hydrogen refuelling stations
Compressed Liquid Liquid togaseous H2 H2 compressed
H2
18 California Fuel Cell Partnership, Sacramento, CA [NOV2000] X X
19 Honda company refuelling station for CGH2 [opened in 2001] X
20 Toyota company refuelling station for CGH2 [opened in 2001] X
21 South Korea; Hyundai Motor Company; company refuelling stationfor 41 MPa CGH2; Pressure Products Industries Inc. and Doojin Corp.[opened in 2001]
22 Osaka, Japan; PEMFC Vehicle Demonstration by WE-NET[opened 07FEB2002] with Natural Gas reforming, besides 35 MPa CGH2
refuelling also the filling of metal hydride tanks is possible X
23 Takamatsu, Japan; PEMFC Vehicle Demonstration by WE-NET[opened 28FEB2002 and closed FEB2005] with PEM electrolyser, besides35 MPa CGH2 refuelling also the filling of metal hydride tanks is possible X
24 BC HydroGen – refuelling station for 70 MPa CGH2 to be erected in Surrey,BC, Canada; hydrogen via electrolysis from renewable energy[start: fall of 2001] X
25 LH2 manual power assisted refuelling station and LH2 storage both providedby Linde with fuel delivered by Air Products at BMW’s NA Engineeringand Emissions Test Center in Oxnard, California [12JUL2001] X
26 American Honda Motors Co. Inc., Research and Development Center,Torrance, California – PV-electrolysis and grid-connection [20JUL2001] X
27 DoE Vehicle Testing Center, Arizona Public Service &DoE, Phoenix, AR,Proton Energy PEM electrolyzer [started 2001] X
28 Tsurumi, Japan; PEMFC Vehicle Demonstration by WE-NET[opened AUG 2002], chemical by-product hydrogen from soda production,35 MPa CGH2 refuelling, succeeded by ENAA as JHFC demo since DEC2004 X
29 Davis, University of California, Hydrogen Bus Technology ValidationProgram [since2002] X
30 LH2 supplied refuelling station by Linde for Opel in Dudenhofen,dispensing of LH2 and 70 MPa CGH2 [operative since 2002] X X X
31 LH2 supplied refuelling station by Linde for DaimlerChrysler in Sindelfingen,dispensing CGH2 at 35 MPa and 70 MPa [35 MPa operative since 2002] X
32 TotalFinaElf & BVG Hydrogen Competence Center Berlin, LH2 technologyand trucked-in LH2 by Linde, Proton Energy Systems PEM electrolyser;planned to the refuelling of FC city buses in the coming years; possibleextension by onsite methanol reforming to hydrogen, this station will refuelthe IRISBUS FC Buses in Berlin within the CITYCELL project. [23OCT2002] X X X
33 AC Transit in Richmond, California, Stuart Energy Systems PEM electrolyser,first CaFCP satellite station [opened 30OCT 2002] X
34 Northern Nevada Test Site [100 km north of Las Vegas]; Nevada Test SiteDev. Corp., DoE, Corp. For Solar Technologies and Renewable Resources,and City of Las Vegas, multi-fuel station for CNG, CGH2, Hythane includinga 50 kW Plug Power PEMFC operated by APCI [started 15NOV2002] X ? ?
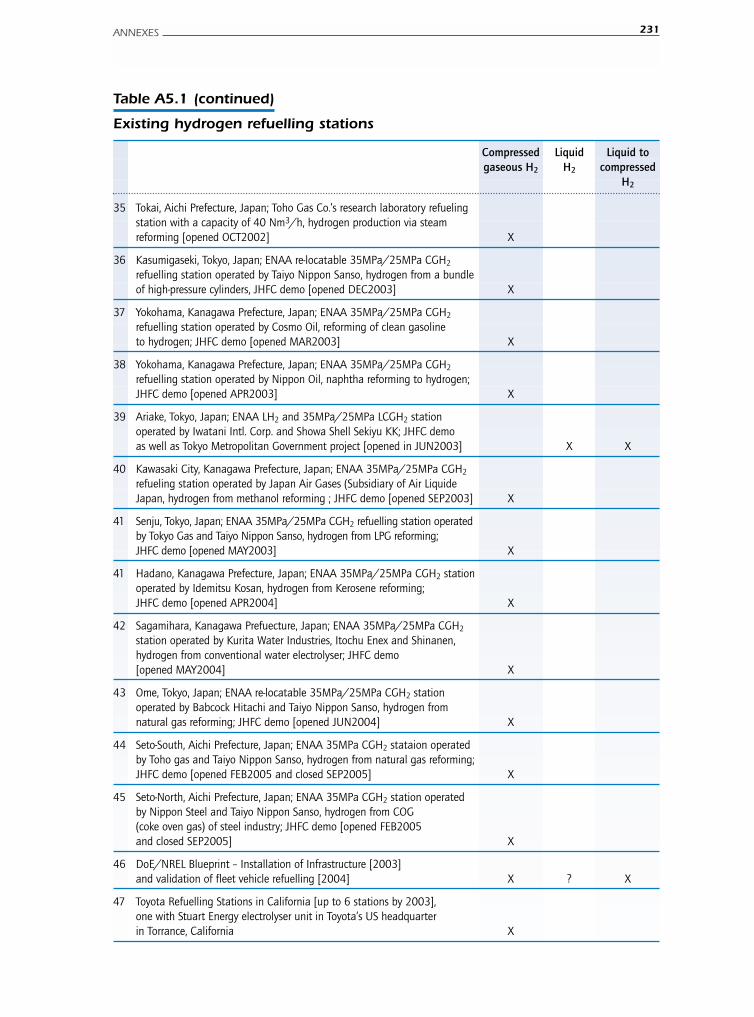
ANNEXES 231
Table A5.1 (continued)
Existing hydrogen refuelling stations
Compressed Liquid Liquid togaseous H2 H2 compressed
H2
35 Tokai, Aichi Prefecture, Japan; Toho Gas Co.’s research laboratory refuelingstation with a capacity of 40 Nm3/h, hydrogen production via steamreforming [opened OCT2002] X
36 Kasumigaseki, Tokyo, Japan; ENAA re-locatable 35MPa/25MPa CGH2
refuelling station operated by Taiyo Nippon Sanso, hydrogen from a bundleof high-pressure cylinders, JHFC demo [opened DEC2003] X
37 Yokohama, Kanagawa Prefecture, Japan; ENAA 35MPa/25MPa CGH2
refuelling station operated by Cosmo Oil, reforming of clean gasolineto hydrogen; JHFC demo [opened MAR2003] X
38 Yokohama, Kanagawa Prefecture, Japan; ENAA 35MPa/25MPa CGH2
refuelling station operated by Nippon Oil, naphtha reforming to hydrogen;JHFC demo [opened APR2003] X
39 Ariake, Tokyo, Japan; ENAA LH2 and 35MPa/25MPa LCGH2 stationoperated by Iwatani Intl. Corp. and Showa Shell Sekiyu KK; JHFC demoas well as Tokyo Metropolitan Government project [opened in JUN2003] X X
40 Kawasaki City, Kanagawa Prefecture, Japan; ENAA 35MPa/25MPa CGH2
refueling station operated by Japan Air Gases (Subsidiary of Air LiquideJapan, hydrogen from methanol reforming ; JHFC demo [opened SEP2003] X
41 Senju, Tokyo, Japan; ENAA 35MPa/25MPa CGH2 refuelling station operatedby Tokyo Gas and Taiyo Nippon Sanso, hydrogen from LPG reforming;JHFC demo [opened MAY2003] X
41 Hadano, Kanagawa Prefecture, Japan; ENAA 35MPa/25MPa CGH2 stationoperated by Idemitsu Kosan, hydrogen from Kerosene reforming;JHFC demo [opened APR2004] X
42 Sagamihara, Kanagawa Prefuecture, Japan; ENAA 35MPa/25MPa CGH2
station operated by Kurita Water Industries, Itochu Enex and Shinanen,hydrogen from conventional water electrolyser; JHFC demo[opened MAY2004] X
43 Ome, Tokyo, Japan; ENAA re-locatable 35MPa/25MPa CGH2 stationoperated by Babcock Hitachi and Taiyo Nippon Sanso, hydrogen fromnatural gas reforming; JHFC demo [opened JUN2004] X
44 Seto-South, Aichi Prefecture, Japan; ENAA 35MPa CGH2 stataion operatedby Toho gas and Taiyo Nippon Sanso, hydrogen from natural gas reforming;JHFC demo [opened FEB2005 and closed SEP2005] X
45 Seto-North, Aichi Prefecture, Japan; ENAA 35MPa CGH2 station operatedby Nippon Steel and Taiyo Nippon Sanso, hydrogen from COG(coke oven gas) of steel industry; JHFC demo [opened FEB2005and closed SEP2005] X
46 DoE/NREL Blueprint – Installation of Infrastructure [2003]and validation of fleet vehicle refuelling [2004] X ? X
47 Toyota Refuelling Stations in California [up to 6 stations by 2003],one with Stuart Energy electrolyser unit in Toyota’s US headquarterin Torrance, California X
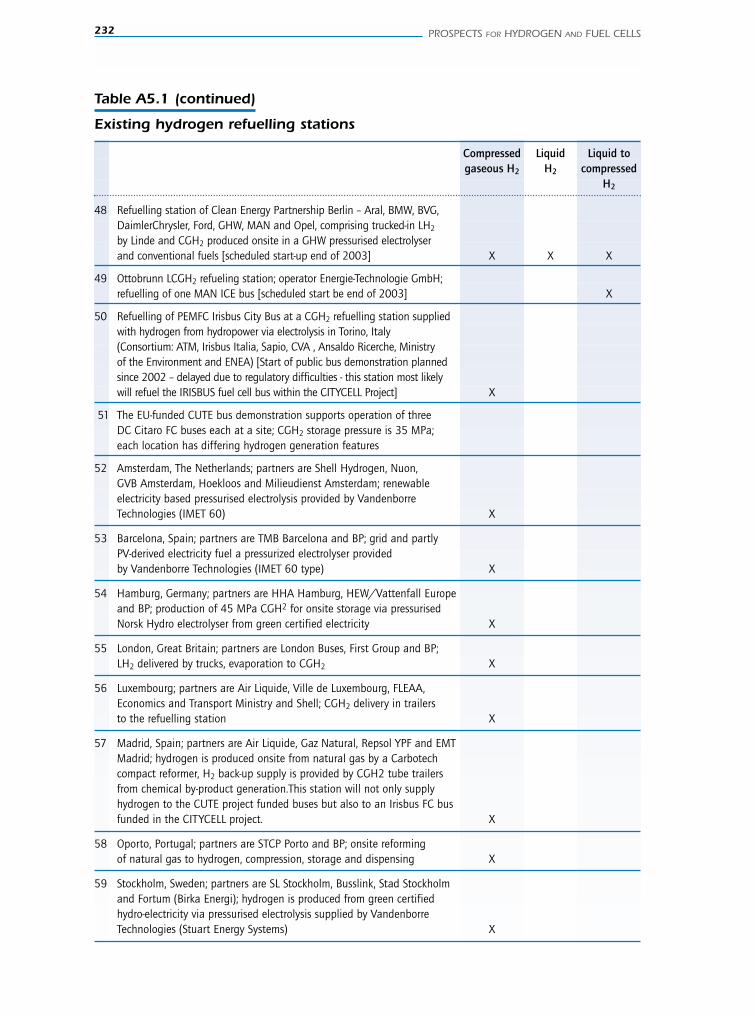
232 PROSPECTS FOR HYDROGEN AND FUEL CELLS
Table A5.1 (continued)
Existing hydrogen refuelling stations
Compressed Liquid Liquid togaseous H2 H2 compressed
H2
48 Refuelling station of Clean Energy Partnership Berlin – Aral, BMW, BVG,DaimlerChrysler, Ford, GHW, MAN and Opel, comprising trucked-in LH2
by Linde and CGH2 produced onsite in a GHW pressurised electrolyserand conventional fuels [scheduled start-up end of 2003] X X X
49 Ottobrunn LCGH2 refueling station; operator Energie-Technologie GmbH;refuelling of one MAN ICE bus [scheduled start be end of 2003] X
50 Refuelling of PEMFC Irisbus City Bus at a CGH2 refuelling station suppliedwith hydrogen from hydropower via electrolysis in Torino, Italy(Consortium: ATM, Irisbus Italia, Sapio, CVA , Ansaldo Ricerche, Ministryof the Environment and ENEA) [Start of public bus demonstration plannedsince 2002 – delayed due to regulatory difficulties - this station most likelywill refuel the IRISBUS fuel cell bus within the CITYCELL Project] X
51 The EU-funded CUTE bus demonstration supports operation of threeDC Citaro FC buses each at a site; CGH2 storage pressure is 35 MPa;each location has differing hydrogen generation features
52 Amsterdam, The Netherlands; partners are Shell Hydrogen, Nuon,GVB Amsterdam, Hoekloos and Milieudienst Amsterdam; renewableelectricity based pressurised electrolysis provided by VandenborreTechnologies (IMET 60) X
53 Barcelona, Spain; partners are TMB Barcelona and BP; grid and partlyPV-derived electricity fuel a pressurized electrolyser providedby Vandenborre Technologies (IMET 60 type) X
54 Hamburg, Germany; partners are HHA Hamburg, HEW/Vattenfall Europeand BP; production of 45 MPa CGH2 for onsite storage via pressurisedNorsk Hydro electrolyser from green certified electricity X
55 London, Great Britain; partners are London Buses, First Group and BP;LH2 delivered by trucks, evaporation to CGH2 X
56 Luxembourg; partners are Air Liquide, Ville de Luxembourg, FLEAA,Economics and Transport Ministry and Shell; CGH2 delivery in trailersto the refuelling station X
57 Madrid, Spain; partners are Air Liquide, Gaz Natural, Repsol YPF and EMTMadrid; hydrogen is produced onsite from natural gas by a Carbotechcompact reformer, H2 back-up supply is provided by CGH2 tube trailersfrom chemical by-product generation.This station will not only supplyhydrogen to the CUTE project funded buses but also to an Irisbus FC busfunded in the CITYCELL project. X
58 Oporto, Portugal; partners are STCP Porto and BP; onsite reformingof natural gas to hydrogen, compression, storage and dispensing X
59 Stockholm, Sweden; partners are SL Stockholm, Busslink, Stad Stockholmand Fortum (Birka Energi); hydrogen is produced from green certifiedhydro-electricity via pressurised electrolysis supplied by VandenborreTechnologies (Stuart Energy Systems) X
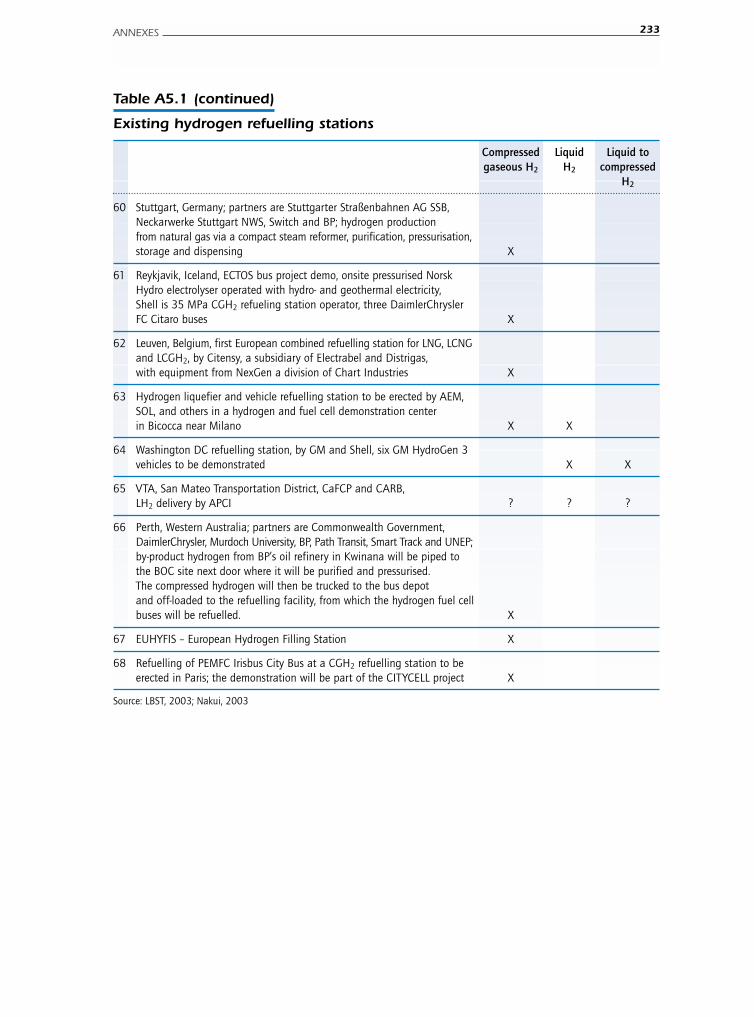
ANNEXES 233
Table A5.1 (continued)
Existing hydrogen refuelling stations
Compressed Liquid Liquid togaseous H2 H2 compressed
H2
60 Stuttgart, Germany; partners are Stuttgarter Straßenbahnen AG SSB,Neckarwerke Stuttgart NWS, Switch and BP; hydrogen production from natural gas via a compact steam reformer, purification, pressurisation,storage and dispensing X
61 Reykjavik, Iceland, ECTOS bus project demo, onsite pressurised NorskHydro electrolyser operated with hydro- and geothermal electricity,Shell is 35 MPa CGH2 refueling station operator, three DaimlerChryslerFC Citaro buses X
62 Leuven, Belgium, first European combined refuelling station for LNG, LCNGand LCGH2, by Citensy, a subsidiary of Electrabel and Distrigas,with equipment from NexGen a division of Chart Industries X
63 Hydrogen liquefier and vehicle refuelling station to be erected by AEM,SOL, and others in a hydrogen and fuel cell demonstration centerin Bicocca near Milano X X
64 Washington DC refuelling station, by GM and Shell, six GM HydroGen 3vehicles to be demonstrated X X
65 VTA, San Mateo Transportation District, CaFCP and CARB,LH2 delivery by APCI ? ? ?
66 Perth, Western Australia; partners are Commonwealth Government,DaimlerChrysler, Murdoch University, BP, Path Transit, Smart Track and UNEP;by-product hydrogen from BP’s oil refinery in Kwinana will be piped tothe BOC site next door where it will be purified and pressurised.The compressed hydrogen will then be trucked to the bus depotand off-loaded to the refuelling facility, from which the hydrogen fuel cellbuses will be refuelled. X
67 EUHYFIS – European Hydrogen Filling Station X
68 Refuelling of PEMFC Irisbus City Bus at a CGH2 refuelling station to beerected in Paris; the demonstration will be part of the CITYCELL project X
Source: LBST, 2003; Nakui, 2003

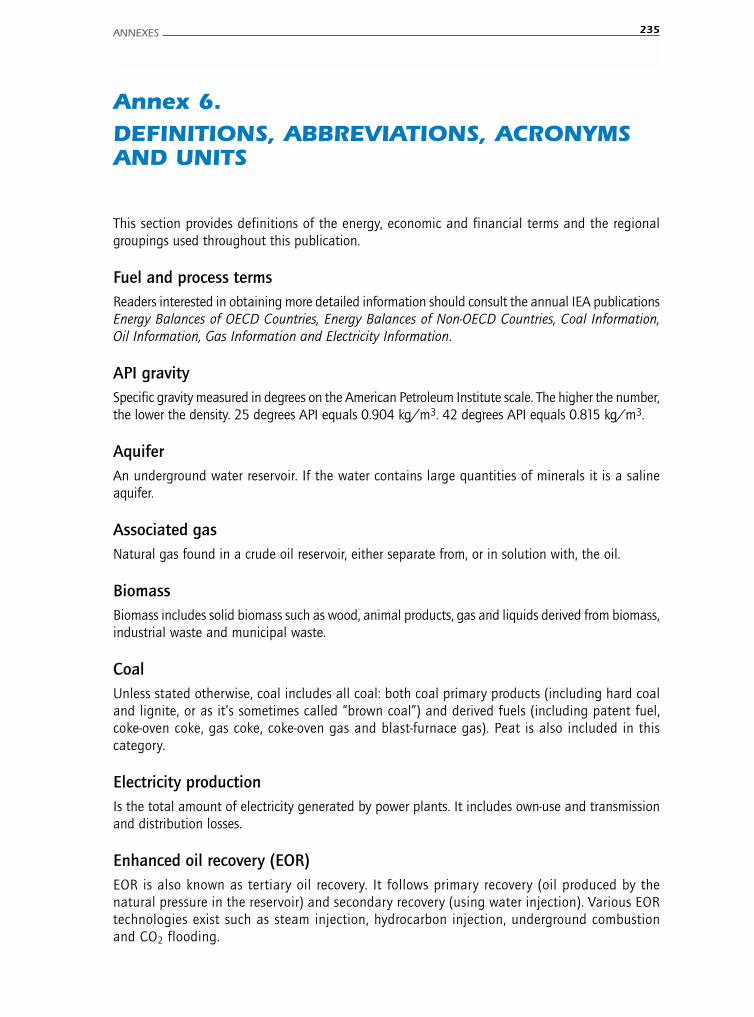
ANNEXES 235
Annex 6.DEFINITIONS, ABBREVIATIONS, ACRONYMSAND UNITS
This section provides definitions of the energy, economic and financial terms and the regionalgroupings used throughout this publication.
Fuel and process termsReaders interested in obtaining more detailed information should consult the annual IEA publicationsEnergy Balances of OECD Countries, Energy Balances of Non-OECD Countries, Coal Information,Oil Information, Gas Information and Electricity Information.
API gravity Specific gravity measured in degrees on the American Petroleum Institute scale. The higher the number,the lower the density. 25 degrees API equals 0.904 kg/m3. 42 degrees API equals 0.815 kg/m3.
AquiferAn underground water reservoir. If the water contains large quantities of minerals it is a salineaquifer.
Associated gas Natural gas found in a crude oil reservoir, either separate from, or in solution with, the oil.
BiomassBiomass includes solid biomass such as wood, animal products, gas and liquids derived from biomass,industrial waste and municipal waste.
Coal Unless stated otherwise, coal includes all coal: both coal primary products (including hard coaland lignite, or as it’s sometimes called “brown coal”) and derived fuels (including patent fuel,coke-oven coke, gas coke, coke-oven gas and blast-furnace gas). Peat is also included in thiscategory.
Electricity productionIs the total amount of electricity generated by power plants. It includes own-use and transmissionand distribution losses.
Enhanced oil recovery (EOR)EOR is also known as tertiary oil recovery. It follows primary recovery (oil produced by thenatural pressure in the reservoir) and secondary recovery (using water injection). Various EORtechnologies exist such as steam injection, hydrocarbon injection, underground combustionand CO2 flooding.
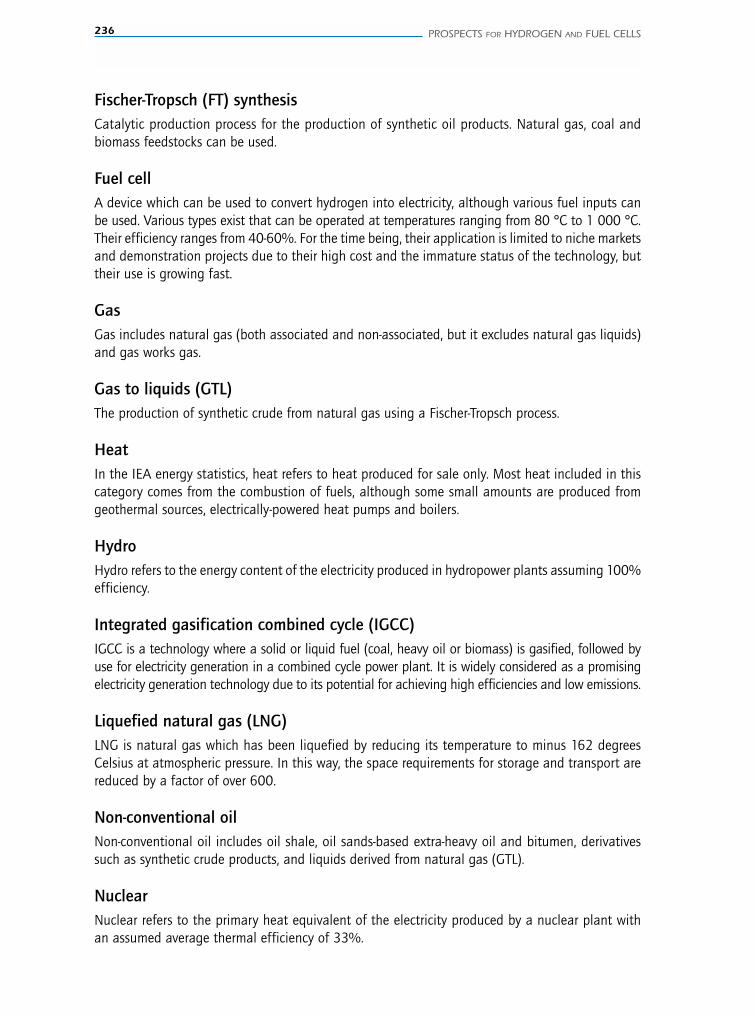
236 PROSPECTS FOR HYDROGEN AND FUEL CELLS
Fischer-Tropsch (FT) synthesisCatalytic production process for the production of synthetic oil products. Natural gas, coal andbiomass feedstocks can be used.
Fuel cellA device which can be used to convert hydrogen into electricity, although various fuel inputs canbe used. Various types exist that can be operated at temperatures ranging from 80 °C to 1 000 °C.Their efficiency ranges from 40-60%. For the time being, their application is limited to niche marketsand demonstration projects due to their high cost and the immature status of the technology, buttheir use is growing fast.
GasGas includes natural gas (both associated and non-associated, but it excludes natural gas liquids)and gas works gas.
Gas to liquids (GTL)The production of synthetic crude from natural gas using a Fischer-Tropsch process.
HeatIn the IEA energy statistics, heat refers to heat produced for sale only. Most heat included in thiscategory comes from the combustion of fuels, although some small amounts are produced fromgeothermal sources, electrically-powered heat pumps and boilers.
HydroHydro refers to the energy content of the electricity produced in hydropower plants assuming 100%efficiency.
Integrated gasification combined cycle (IGCC)IGCC is a technology where a solid or liquid fuel (coal, heavy oil or biomass) is gasified, followed byuse for electricity generation in a combined cycle power plant. It is widely considered as a promisingelectricity generation technology due to its potential for achieving high efficiencies and low emissions.
Liquefied natural gas (LNG)LNG is natural gas which has been liquefied by reducing its temperature to minus 162 degreesCelsius at atmospheric pressure. In this way, the space requirements for storage and transport arereduced by a factor of over 600.
Non-conventional oilNon-conventional oil includes oil shale, oil sands-based extra-heavy oil and bitumen, derivativessuch as synthetic crude products, and liquids derived from natural gas (GTL).
NuclearNuclear refers to the primary heat equivalent of the electricity produced by a nuclear plant withan assumed average thermal efficiency of 33%.
OilOil includes crude oil, natural gas liquids, refinery feedstocks and additives, other hydrocarbons,and petroleum products (refinery gas, ethane, liquefied petroleum gas, aviation gasoline, motorgasoline, jet fuel, kerosene, gas/diesel oil, heavy fuel oil, naphtha, white spirit, lubricants, paraffinwaxes, petroleum coke and other petroleum products).
Other RenewablesOther renewables include geothermal, solar, wind, tide, and wave energy for electricity generation.The direct use of geothermal and solar heat is also included in this category.
Other Transformation, Own Use and LossesOther transformation, own use and losses covers the use of energy by transformation industries andthe energy losses in converting primary energy into a form that can be used in the final consumingsectors. It includes energy use and loss by gas works, petroleum refineries, coal and gas transformationand liquefaction. It also includes energy used in coal mines, in oil and gas extraction and in electricityand heat production. Transfers and statistical differences are also included in this category
Renewables Renewables refer to energy resources, where energy is derived from natural processes that arereplenished constantly. They include geothermal, solar, wind, tide, wave, hydropower, biomass, andbiofuels.
Purchasing Power Parity (PPP)The rate of currency conversion that equalises the purchasing power of different currencies, i.e. makesallowance for the differences in price levels and spending patterns between different countries.
ScenarioAn analysis dataset based on a consistent set of assumptions.
REGIONAL GROUPINGS
AfricaComprises: Algeria, Angola, Benin, Botswana, Burkina Faso, Burundi, Cameroon, Cape Verde, the CentralAfrican Republic, Chad, Congo, the Democratic Republic of Congo, Cote d’Ivoire, Djibouti, Egypt,Equatorial Guinea, Eritrea, Ethiopia, Gabon, Gambia, Ghana, Guinea, Guinea-Bissau, Kenya, Lesotho,Liberia, Libya, Madagascar, Malawi, Mali, Mauritania, Mauritius, Morocco, Mozambique, Niger, Nigeria,Rwanda, Sao Tome and Principe, Senegal, Seychelles, Sierra Leone, Somalia, South Africa, Sudan,Swaziland, the United Republic of Tanzania, Togo, Tunisia, Uganda, Zambia, and Zimbabwe.
Central and South AmericaComprises: Antigua and Barbuda, Argentina, Bahamas, Barbados, Belize, Bermuda, Bolivia, Brazil,Chile, Colombia, Costa Rica, Cuba, Dominica, the Dominican Republic, Ecuador, El Salvador,French Guiana, Grenada, Guadeloupe, Guatemala, Guyana, Haiti, Honduras, Jamaica, Martinique,Netherlands Antilles, Nicaragua, Panama, Paraguay, Peru, St. Kitts-Nevis-Anguilla, Saint Lucia,St. Vincent-Grenadines and Suriname, Trinidad and Tobago, Uruguay, and Venezuela.
ANNEXES 237

238 PROSPECTS FOR HYDROGEN AND FUEL CELLS
ChinaRefers to the People’s Republic of China.
Developing CountriesComprises: China, India and other developing Asia, Central and South America, Africa and theMiddle East.
Former Soviet Union (FSU)Comprises: Armenia, Azerbaijan, Belarus, Estonia, Georgia, Kazakhstan, Kyrgyzstan, Latvia, Lithuania,Moldova, Russia, Ukraine, Uzbekistan, Tajikistan and Turkmenistan.
Middle EastComprises: Bahrain, Iran, Iraq, Israel, Jordan, Kuwait, Lebanon, Oman, Qatar, Saudi Arabia, Syria,the United Arab Emirates and Yemen. For oil and gas production it includes the neutral zone betweenSaudi Arabia and Iraq.
OECD Europe Comprises: Austria, Belgium, the Czech Republic, Denmark, Finland, France, Germany, Greece,Hungary, Iceland, Ireland, Italy, Luxembourg, the Netherlands, Norway, Poland, Portugal, Slovakia,Spain, Sweden, Switzerland, Turkey and the United Kingdom.
Organization of Petroleum Exporting Countries (OPEC) Comprises: Algeria, Indonesia, Iran, Iraq, Kuwait, Libya, Nigeria, Qatar, Saudi Arabia, the UnitedArab Emirates and Venezuela.
Other Developing Asia Comprises: Afghanistan, Bangladesh, Bhutan, Brunei, Chinese Taipei, Fiji, French Polynesia, Indonesia,Kiribati, Democratic People’s Republic of Korea, Malaysia, Maldives, Mongolia, Myanmar, Nepal,New Caledonia, Pakistan, Papua New Guinea, the Philippines, Samoa, Singapore, Solomon Islands,Sri Lanka, Thailand, Vietnam and Vanuatu.
AC Alternating currentAFC Alkaline Fuel CellAFR AfricaASU Air Separation UnitATR Autothermal ReformingAUS Australia and New Zealand
BOP Balance of Plant
CAN CanadaCC Combined cycleCCS CO2 Capture and StorageCDM Clean Development MechanismCERT Committee on Energy Research
and TechnologyCHI China CHP Combined Heat and Power CHOPS Cold heavy oil production
with sandCNG Compressed Natural GasCO Carbon monoxideCO2 Carbon dioxideCSA Central and South AmericaCSS Cyclic Steam StimulationCTL Coal-to-liquidsCUTE Clean Urban Transport for Europe
DC Direct currentDICI Direct-Injection,
Compression-IgnitionDISI Direct Injection Spark IgnitionDME Dimethyl EtherDMFC Direct Methanol Fuel CellDOE Department of EnergyDRI Direct Reduced Iron
EEU Eastern EuropeELAT® Solid Polymer Electrolyte ElectrodeEPA Environmental Protection Agency,
United StatesEOH EthanolEOR Enhanced Oil RecoveryEPR European Pressurized water
ReactorETP Energy Technology PerspectivesETSAP Energy Technology Systems
Analysis ProgrammeEU European UnionEUR Euro
FCB Fuel Cell BusFCV Fuel Cell VehicleFSU Former Soviet UnionFT Fischer-Tropsch
GDE Gas Diffusion ElectrodeGDL Gas Diffucion LayerGDP Gross Domestic ProductGEF Global Environment FundGHG Greenhouse GasGIS Geographical Information SystemGTL Gas-to-LiquidsGWP Global Warming Potential
H2 HydrogenHHV Higher Heating ValueHMFC Hydrogen Membrane Fuel CellHRSG Heat Recovery Steam GeneratorHSA Hydrogen Storage AlloyHTGR High Temperature Gas-cooled
Reactor
IBAD Ion Beam Assisted DepositionICE Internal Combustion EngineIEA International Energy AgencyIGCC Integrated Gasification Combined
CycleIND IndiaIPCC Intergovernmental Panel
on Climate ChangeIPHE International Partnership
for a Hydrogen Economy
JI Joint ImplementationJPN Japan
KOH Sodium Hydroxide
LDV Light Duty VehicleLH2 Liquid hydrogenLHV Lower Heating ValueLNG Liquefied Natural GasLPG Liquefied Petroleum GasLULUCF Land Use, Land Use Change
and Forestry
MCFC Molten Carbonate Fuel CellMEA Middle East
ANNEXES 239
ABBREVIATIONS AND ACRONYMS
240 PROSPECTS FOR HYDROGEN AND FUEL CELLS
MeOH MethanolMEX MexicoMOF Metal-Organic FrameworkMTBE Methyl Tertiary Butyl Ether
NGCC Natural Gas Combined CycleNOx Nitrogen Oxides
ODA Other Developing AsiaOECD Organisation for Economic
Co-operation and DevelopmentOPEC Organisation of Petroleum
Exporting CountriesORMOSILs Organically Modified
Silicates
PAFC Phosphoric Acid Fuel CellPCSD Pressure cyclic steam drivePEC PhotoElectrochemical CellPEMFC Proton Exchange Membrane
Fuel CellPISI Port Injection Spark IgnitionPFBC Pressurized Fluidized Bed
CombustionPOX Partial OxidationPSA Pressure Swing AbsorptionPt PlatinumPV PhotoVoltaics
RD&D Research, Developmentand Demonstration
SAGD Steam Assisted Gravity DrainageSECA Solid State Energy Conversion
AllianceS-I cycle Sulfur-Iodine cycleSKO South KoreaSMR Steam Methane ReformingSO2 Sulfur dioxideSOEC Solid Oxide Electrolyser CellSOFC Solid Oxide Fuel CellSUV Sports Utility Vehicle
TPES Total Primary Energy Supply
UNEP United Nations EnvironmentProgramme
USA United States of AmericaUSD United States Dollars
VHTR Very High Temperature Reactor
WBCSD World Business Council forSustainable Development
WEO World Energy OutlookWEU Western EuropeWHO World Health Organisation
ANNEXES 241
MJ megajoule = 106 joulesGJ gigajoule = 109 joulesPJ petajoule = 1015 joulesEJ exajoule = 1018 joulest tonne = metric ton
= 1000 kilogrammesMt megatonne = 103 tonnesGt gigatonne = 109 tonnesW wattkW kilowatt = 103 wattsMW megawatt = 106 wattsGW gigawatt = 109 wattsTW terawatt = 1012 wattskWth kilowatt thermal capacitykWel kilowatt electric capacitybbl (blue) barrel
BOE Barrels of Oil Equivalent.1 BOE = 159 litres
°C degrees CelsiuskWh kilowatt-hourmD millidarcies = 10–3 darciesmils 0.001 US dollarMPa megapascal = 106 PaNm3 Normal cubic metre. Measured
at 0 degrees Celsiusand a pressure of 1.013 bar.
ppm parts per millionPa pascalA AmpèreV VoltcP centiPoise%wt weight percent
UNITS

REFERENCES 243
REFERENCES
Abe, A., et al. (1998), “Studies of the Large-Scale Sea Transportation of the Liquid Hydrogen”,International Journal of Hydrogen Energy, Vol. 23, No. 2, p. 115-121.
Adamson, K.-A. (YEAR), “An Examination of Consumer Demand in the Secondary Niche Market forFuel Cells in Europe”, International Journal of Hydrogen Energy, Vol. 28, p. 771-780.
Adamson, K.-A. (2004), “Fuel Cell Today Market Survey: Buses”, Fuel Cell Today, www.fuelcelltoday.com
Adamson, K.-A. (2005), “Fuel Cell Today Market Survey: Light Duty Vehicles”, Fuel Cell Today,www.fuelcelltoday.com
Adcock, P., et al. (2004), “Electrodes for Hydrogen-Air Fuel Cells”, DOE HFCIT Program Review,WEBSITE, accessed 24 May.
Airbus (2003), “Liquid Hydrogen Fuelled Aircraft – Systems Analysis”, www.aero-net.org
Air Products (2002), Market Outlook for DiMethylEther (DME), report prepared for United StatesDepartment of Energy (DOE).
Ahluwalia, R.K., R. Kumar, A. Rousseau and X. Wang (2004), “Fuel Economy of Hydrogen Fuel CellVehicles”, Journal of Power Sources, Vol. 130, p. 192-201.
Alberta (2003), Alberta’s Oil Sands, Alberta Department of Energy, 9 September.
Amos, W.A. (1998), Costs of Storing And Transporting Hydrogen, National Renewable EnergyLaboratory, Ref. No. NREL/TP-570-25106, Golden.
An, F. and D. Santini (2003), Assessing Tank-to-Wheel Efficiencies of Advanced Technology Vehicles,SAE (Society of Automotive Engineers) paper 2003-01-0412, SAE, Warrendale.
ANL (Argonne National Laboratory) (2000), Costs of Lithium-ion Batteries for Vehicles, ANL,Center for Transportation Research, Argonne.
Apanel, G. (2004), “Direct Methanol Fuel Cells – Ready to go Commercial?”, Fuel Cells Bulletin,November, p. 12-17.
Armstrong, A. (2001), “Well-to-Wheels: Vehicle Efficiency Standards and Climate Change”, BP GlobalFuels Technology, Sunbury, presented at the NZ Road to Cleaner Air Conference, June.
Australian Government (2003), National Hydrogen Study, Government of Australia, Departmentof Industry, Tourism and Resources, Canberra.
Baker, A. (2005), “Fuel Cell Market Survey – Automotive Hydrogen Infrastructure”, Fuel Cell Today,www.fuelcelltoday.com
Ballard (2005), Fuel Cell Technology “Road Map”, Ballard ,www.ballard.com/be_informed/fuel_cell_technology/roadmap
Barbaro, P., et al. (2005), “First Direct Ethanol Fuel Cell with Platinum Free Electrodes: The Miracleof HyPerMec”, paper presented at the 19th meeting of the North American Catalysis Society,Philadelphia, 22-27 May, www.19nam.org/begin.pdf
Bar-On, I., R. Kirchain and R. Roth, (2002), “Technical Cost Analysis for PEM Fuel Cells”, Journal ofPower Sources, Vol. 109, p. 71-75.
Benemann, J.R. (2004), “Photosynthesis, Algae, CO2 and Bio-Hydrogen”, paper presented at theGCEP Energy Workshop, Stanford University, California, 27 April.
Berge, G. (2003), “CO2 – Fra Problem til Ressurs” (CO2 – From Problem to Resource), Miljøforum,Norwegian Oil Industry Association, Stavanger.
244 PROSPECTS FOR HYDROGEN AND FUEL CELLS
Berry, G. and A. Lamont (2003), Coupling Carbonless Electricity And Hydrogen Transportation,Lawrence Livermore National Laboratory, Energy and Environment Directorate, Berkley.
Blesl, M., U. Fahl and M. Ohl, (2004), “Hochtemperaturbrennstoffzellen und deren Kostenentwicklung”,BWK, Vol. 56, No. 5, p. 72-56.
BMWA (2005), “Strategy Report on Research Needs in the Field of Hydrogen EnergyTechnology”, Federal Ministry of Economics and Labour Research Report, No. 546, Germany. www.bmwa.bund.de/Navigation/Service/bestellservice,did=65646.html
Bossel, U., B. Eliasson and G. Taylor (2003), The Future of the Hydrogen Economy: Bright orBleak?, Final report, www.efcf.com/reports/
Brady, M. P., et al. (2005), “Cost-Effective Surface Modification for Metallic Bipolar Plates”, paperprepared for the 2005 US Department of Energy hydrogen fuel cells & infrastructure technologiesprogramme review, www.hydrogen.energy.gov/annual_review05_fuelcells.html#p_plant
Carlson, E. J., et al. (2004), Cost Analysis Of Fuel Cell Stacks/Systems,www.eere.energy.gov/hydrogenandfuelcells
Castle, W.F. (2002), “Air Separation and Liquefaction: Recent Development and Prospects forthe beginning of the New Millennium”, International Journal of Refrigeration, Vol. 25, No. 1,p. 158-172.
CERT (Committee on Energy Research and Technology) (2004), Preparation of the IEA’s BiennialProgramme for 2005 and 2006, CERT, IEA/CERT(2004)35.
Chemical Market Reporter (2004), GTL Could Become Major Chemicals Feedstock, 12 January.
Childress, J. and R. Childress (2004), “2004 World Gasification Survey: A PreliminaryEvaluation”, Gasification Technologies 2004, 4-6 October, Washington, DC.,www.gasification.org/Docs/2004_Papers/06CHIL.pdf
Cho, A. (2004), “Fire and ICE: Revving up for H2”, Science, Vol. 305, 13 August, p. 964-965.
Claassen, P.A.M., et al. (2000), “Feasibility of Biological Hydrogen Production from Biomass forUtilization in Fuel Cells”, Proceedings of the 1st World Energy Conference and Exhibition onBiomass for Energy and Industry, Seville, 5-9 June.
Clingendael (2004), Study on Energy Supply Security and Geopolitics, DG TREN/C1-06-2002,Institute for International Relations ‘Clingendael’, The Hague.
Coaltrans (2003), “Coal Liquefaction Enters New Phase”, May/June, Coaltrans, p. 24-25,www.coaltransinternational.com
CONCAWE (2003), “Well-to-Wheel Analysis of Future Automotive Fuels and Power Trains in theEuropean Context”, Version 1, November, Concawe/EUCAR, Brussels.
Cromie, R. (2004), Peak Load Reduction Program For Non-Road Electric Vehicles, Southern CaliforniaEdison Co., USA.
Cropper, M. (2003), “Fuel Cell Market Survey: Buses”, Fuel Cell Today, www.fuelcelltoday.com
Cropper, M. (2004), “Making a Clean Delivery – UPS Enters the Fuel Cell Playing Field”, Fuel Cell Today,www.fuelcelltoday.com
Cupcic, F. (2003), “Extra Heavy Oil and Bitumen. Impact of Technologies on the Recovery Factor”,paper presented at the ASPO Annual Meeting, Rueil-Malmaison, 26-27 May.
De Castro, E., et al. (2004), “Approaches for Low-Cost Components and MEAs for PEFCs:Current and Future Directions”, paper presented at the 2004 Fuel Cell Conference,http://www.fuelcellseminar.com/pdf/2004/82%20De%20Castro.pdf
Diemer, P., et al. (2004), “Potentials for Utilization of Coke Oven Gas on Integrated Iron and SteelWorks”, paper presented at the 2nd International Meeting on Ironmaking/1st InternationalSymposium on Iron Ore, Vitoria, Espirito Santo, 12-15 September.
Diethelm, R. (2004), “Sulzer Hexis. Heat and Electricity for Family Homes”, Sulzer,www.sulzer.com/com/NewsandMedia/Download/Archive/CMD_040913_HX.pdf
Dillon, R., et al. (2004), “International Activities in DMFC RD&D: Status of Technologies and PotentialApplications”, Journal of Power Sources, Vol. 127, p. 112-126.
E4tech (2003), Review of Fuel Cell Commercial Potential for DTI and the Carbon Trust,www.thecarbontrust.co.uk/carbontrust/about/publications/Fuel_cell_commercial_review.pdf
EC (European Commission) (2005a), Hydrogen and Fuel Cell Technology Platform - DeploymentStrategy, EC, Brussels.
EC (2005b), Hydrogen and Fuel Cell Technology Platform – Strategic Research Agenda, EC, Brussels.
EC (2005c), Implementing the Community Strategy to Reduce CO2 Emissions from Cars, Fifth AnnualCommunication on the Effectiveness of the Strategy, Communication from the Commission tothe Council and the European Parliament, COM(2005)269 Final, Brussels, 22 June.
Doty, F.D. (2004), A Realistic Look at Hydrogen Price Projections, www.dotynmr.com
DTE (2003), “Kwaliteitsregulering Gasdistributie Nederland”, Dienst uitvoering en Toezicht Energie,The Hague, www.dte.nl/images/12_8572_tcm7-5863.pdf
Eaves, S.C. and J. Eaves (2003), Fuel-Cell Vehicles: Solution or Shell Game?, www.evuk.co.uk
EIA (Energy Information Administration) (2004), Long Term World Oil Supply Scenarios, EIA, Washington,www.eia.doe.gov/pub/oil_gas/petroleum/feature_articles/2004/worldoilsupply/oilsupply04.html
EPA (Environmental Protection Agency) (2004), ”Fuel Cell Delivery Testing Program”, EPA,Washington, DC, www.epa.gov/otaq/fuelcell/program.htm
EPRI (Electric Power Research Institute) (2003), An Assessment of Advanced Battery Technologiesfor Plug-In Hybrid Electric and Battery Electric Vehicles, EPRI, http://www.epri.com/
Erdmann, G. (2003), “Future Economics of the Fuel Cell Housing Market”, International Journal ofHydrogen Energy, Vol. 28, p. 685-694.
Espinoza, R.L., et al. (1999), “Low Temperature Fischer-Tropsch Synthesis from a Sasol Perspective”,Applied Catalysis A, General 186, p. 13-26.
Eurostat (2004), Energy, Transport and Environment Indicators, Eurostat, Luxembourg.
Faass, R. (2001), “Cryoplane. Flugzeuge mit Wasserstoffantrieb”, Airbus, Hamburg, 6 December.
FAO (2004), Statistics, Food and Agricultural Organization of the United Nations, www.fao.org
Farouq Ali, S.M. (2003), “Heavy Oil – Ever More Mobile”, Journal of Petroleum Science and Engineering,Vol. 37, p. 5-9.
FCellReport (2004), “Canadian Firms Demo Fuel Cell-Powered Forklifts”, Fuel Cell Industry Report,May 2004, Vol. 5, No. 5.
FCTEC (2003), Direct Methanol Fuel Cells (DMFC), www.fctec.com/fctec_types_dmfc.asp
REFERENCES 245
246 PROSPECTS FOR HYDROGEN AND FUEL CELLS
Fishbone, L.G. and H. Abilock (1981), “MARKAL, a Linear-Programming Model for Energy SystemsAnalysis: Technical Description of the BNL version”. Energy Research, Vol. 5, p. 353-375.
Fleisch, T. (2004), “DME Opportunities and Challenges”, paper presented at the 1st InternationalDME conference, Paris, 12-14 October.
Foley D. (2001), Fuelling the Climate Crisis, the Continental Energy Plan, David Suzuki Foundation,www.davidsuzuki.org
FO Lichts (2004), “World Ethanol and Biofuels Report”, 22 June.
FO Lichts (2005a), “World Ethanol and Biofuels Report”, 8 January.
FO Lichts (2005b), “World Ethanol and Biofuels Report”, 28 January.
Fontell, E. (2004), H2 & FC Business Opportunities, Wärtsilä Corporation, 26 May.
Fuel Cells Canada (2004), “Forklifts”, www.fuelcellscanada.ca/Industry%20news/fcnews4.html
Gasteiger, H.A., J.E. Panels and S.G. Yan (2004), “Dependence of PEM Fuel Cell Performance OnCatalyst Loading”, Journal of Power Systems, Vol. 127, p. 162-171.
Gasteiger, H.A., et al. (2005), “Activity Benchmarks and Requirements for Pt, Pt-alloy and non-PtOxygen Reduction Catalysts for PEMFCs”, Applied Catalysis B: Environmental 56, p. 9-35.
GEF (Global Environment Facility) (2004), “GEF/UNDP Fuel Cell Bus Programme: Update”, preparedby the United Nations Development Programme, GEF/c.23/Inf.17, 11 May.
Gielen, D.J. (2004), “The Residential And Commercial Sectors in the IEA ETP Model”, IEA workingdocument, 21 January, IEA/OECD, Paris.
Gielen, D.J., et al. (2002), “Biomass Strategies for Climate Policies?”, Climate Policies, Vol. 2,p. 319-333.
Gielen, D.J., et al. (2003), “Modeling of Global Biomass Policies”, Biomass and Bioenergy, Vol. 25,p. 177-195.
Gielen, D.J. and S. Karbuz (2003), “Challenges in Energy And Environment Modelling: A Materials Perspective”,IEA, EET/2003/05, Paris, http://library.iea.org/dbtw-wpd/textbase/papers/2003/eet05.pdf
Gielen, D.J., et al. (2004), “Technology Learning in the ETP model”, paper presented at the 6thIAEE Modelling of Energy Economics and Policy conference, Zürich, 2-3 September.
Gielen, D.J., et al. (2005), “Modelling Energy Technology and Policy: The Role of Alternative Fuelsand Drive Systems in the Transportation Sector”, http://www.risoe.dk/rispubl/SYS/ris-r-1517.htm
Gielen, D.J. and J. Podkanski (2005), “Prospects for CO2 Capture and Storage”, Proceedings of the30th Clearwater Clean Coal Conference, Florida, 17-21 April.
Gielen, D.J. and Unander, F. (2005), “Alternative Fuels: An Energy Technology Perspective”, IEA,ETO/2005/01, Paris, http://www.iea.org/textbase/papers/2005/ETOAltFuels05.pdf
Green, D.W. and G.P. Willhite (1998), Enhanced Oil Recovery, Textbook Vol. 6, Society of PetroleumEngineers, Richardson.
Gray, D. and G. Tomlinson (2001), Coproduction of Ultra Clean Transportation Fuels, Hydrogen,and Electric Power from Coal, Mitretek Technical Report, No. MTR 2001-43, www.angtl.com
Gupta, P., et al. (2005), “Chemical Looping Combustion Of Coal To Produce Hydrogen”, Proceedingsof the 30th Clearwater Clean Coal Conference, Florida, 17-21 April.
H2fuelcelltechnology (2004), “ITM Power Makes Major Breakthroughs in Fuel Cell Technology”,www.h2fc.com/ITMPower.shtml
H2 Steering Panel (2004), The European Hydrogen and Fuel Cell Technology Platform, Draftreport to the Advisory council, 6 December.
Haack, D.P. (2005), “Scale-up of Carbon/Carbon Bipolar Plates”, paper presented atthe 2005 DOE Hydrogen Fuel Cells & Infrastructure Technologies Program Review,www.hydrogen.energy.gov/annual_review05_fuelcells.html#p_plant
Haider, G.M. (2000), “World Oil Reserves: Problems in Definition and Estimation”, OPEC Review,OPEC, Vienna, p. 305-327.
Haines, M.R., J.C. de Laat and E.A. Polman (2004), “Reduction of CO2 Emissions by Addition ofHydrogen to Natural Gas”, Proceedings of the 7th International Conference on Greenhouse GasControl Technologies, Vancouver, 5-9 September.
Halozan, H. and V.P. Gilli (2002), “Heat Pumps for Different World Regions – Now and in the Future”,paper prepared for the 15th World Energy Congress, Graz University of Technology, Austria,www.wec-austria.at
Hamelinck, C., et al. (2004), “Production of FT Transportation Fuels from Biomass: Technical Options,Process Analysis and Optimisation and Development Potential”, Energy, Vol. 29, pp. 1743-1771.
Heidug, W.K., M.R. Haines and K.J. Li (2000), “Economical Carbon Dioxide Recovery for Sequestrationfrom a Solid Oxide Fuel Cell Power Plant”, Proceedings of the 5th International Conference onGreenhouse Gas Control Technologies, 13-16 August, CSIRO Publishing, Collingwood, Victoria,p. 729-734.
Heinzel, A., C. Kreuz, F. Mahlendorf and O. Niemzig (2004), “Injection Moulded Low Cost BipolarPlates for PEM Fuel Cells”, Journal of Power Sources, Vol. 131, p. 35-40.
Holsteijn, R. van (2002), "Appendix 3: Technical Improvements and Technological Change”, Labellingand Other Measures for Heating Systems in Dwellings, Van Holsteijn and Kemna Engineering,Delft.
Hoogers, G. (2003), “Fuel Cells for Cogeneration, Technology and Markets Worldwide”, Cogenerationand On-site Power Production, Vol. 4, No. 3, July-August,www.jxj.com/magsandj/cospp/2003_04/fuel_cells.html
Houston Business Journal (2003), “ConocoPhillips to Pull Plug on Carbon Fiber Project”, Houston,13 February, www.bizjournals.com/houston/stories/2003/02/10/daily45.html
IANGV (2004), Latest International NGV Statistics, www.iangv.org/jaytech/default.php?PageID=130.
IC Insights (2002), “An In-Depth Analysis and Forecast of the Integrated Circuit Industry”, TheMcLean Report, www.icknowledge.com/economics/growth_rate.html
IEA (International Energy Agency) (2000), Experience Curves for Energy Technology Policy, IEA/OECD,Paris.
IEA (2003), World Energy Investment Outlook, World Energy Outlook series, IEA/OECD, Paris.
IEA (2004a), World Energy Outlook 2004, World Energy Outlook series, IEA/OECD, Paris.
IEA (2004b), Hydrogen and Fuel Cells - Review of National R&D Programmes, IEA/OECD, Paris.
IEA (2004c), Prospects for CO2 Capture and Storage, IEA/OECD, Paris.
IEA (2004d), Biofuels for Transport: An International Perspective, IEA/OECD, Paris.
IEA (2004e), Energy Prices & Taxes: Fourth Quarter 2004, Quarterly Statistics, IEA/OECD, Paris.
IEA (2004), 30 Years of Energy Use in IEA countries, IEA/OECD, Paris.
REFERENCES 247
248 PROSPECTS FOR HYDROGEN AND FUEL CELLS
IEA HIA (2005a), IEA Hydrogen Implementing Agreement: Priorities and Gaps in HydrogenProduction R&D, IEA/HIA, Paris, forthcoming.
IEA HIA (2005b), IEA Hydrogen Implementing Agreement: Priorities and Gaps in Hydrogen StorageR&D, IEA HIA, Paris, forthcoming.
Innovest Strategic Value Advisors (2001), “The Stuart Oil Shale Project: Implications of CarbonEmissions Constraints for Suncor Shareholders”, study commissioned by Greenpeace,www.greenpeace.org.au/climate/pdfs/spp.pdf
IPCC (Intergovernmental Panel on Climate Change) (2000), “Aircraft Technologyand its Relation to Emissions”, in Aviation and the Global Atmosphere,www.grida.no/climate/ipcc/aviation/110.htm
IPCC (2001), “Climate Change 2001: Emissions, Concentrations and TemperatureChanges Corresponding to Different Stabilisation Levels for CO2 Concentrations”, IPCC,www.grida.no/climate/ipcc_tar/slides/large/02.18.jpg
Ivy, J. (2004), Summary of Electrolytic Hydrogen Production: Milestone Completion Report, NationalRenewable Energy Laboratory, Report NREL/MP-560-36734, Golden.
Janssen, H., et al. (2001), “High-Pressure Electrolysis: The Key Technology for Efficient H2 Production”,Proceedings of the International Symposium on Hypothesis IV, 4-11 September, Stralsund.
Jeong, K.S. and B.S. Oh (2002), “Fuel Economy and Life-Cycle Cost Analysis of a Fuel Cell HybridVehicle”, Journal of Power Sources, Vol. 105, p. 58-65.
Jobwerx (2004), “Ticona Introduces First Engineering Thermoplastic Fuel Cell”,www.jobwerx.com/news/ticona_first_all-plastic_fuel_cell_news-id=946952.html
Kalhammer, F.R. (2004), “When Will We Be Able to Buy and Drive Fuel Cell Electric Vehicles?”,presented at ECS San Francisco Section meeting, San Jose, California, 3 February.
Kang, B.S., J.H. Koh and H.C. Lim (2002), “Effects of System Configuration and Operating Conditionon MCFC System Efficiency”, Journal of Power Sources, Vol. 108, p. 232-238.
Kawai, M. (2004), “Toyota Fuel Cell Operates At 500 Degrees Centigrade”, http://neasia.nikkeibp.com
Kinder Morgan (2002), “Rules of Thumb”, www.kne.com/co2/flood.cfm
Kivisaari, T., et al. (2004), “The Feasibility of a Coal Gasifer Combined with a High-Temperature FuelCell”, Chemical Engineering Journal, Vol. 100, p. 167-180.
Knights, S.D., et al. (2004), “Aging Mechanisms and Lifetime of PEFC and DMFC”, Journal ofPower Sources, Vol. 127, p. 127-134.
Kuschel, M. (2005), “Fuel Cell Fundamentals”, lecture at the University Bremen, Bremen, 13 May,www.ceramics.uni-bremen.de/mitarbeiter/mark.kuschel/1
Lange, T. de, et al. (2001), Co-Production of Fuels as an Option for Demkolec?, Energy ResearchCentre of the Netherlands (ECN), Report ECN-C-01-004, Petten.
Larsen, H., R. Feidenhans, L.S. Petersen (2004), Hydrogen System Energy Technologies in Global,European and Danish Perspective, Risø Energy Report 3, Roskilde, Denmark.
LBST (2003), “Existing Hydrogen Refueling Stations Projects”, www.h2cars.de/filling/h2fueling.html
Lee, J., et al. (2001), “Historical and Future Trends in Aircraft Performance, Cost and Emissions”,Annual Review of Energy and Environment, Vol. 26, p. 167-200.
Lipman, T.E., J.E. Edwards and D.M. Kammen (2004), “Fuel Cell System Economics: Comparing theCosts of Generating Power with Stationary and Motor Vehicle PEM Fuel Cell Systems”, EnergyPolicy, Vol. 32, p. 101-125.
Lokurlu, A., et al. (2003), “Fuel Cells for Mobile and Stationary Applications – Cost Analysis forCombined Heat and Power Stations on the Basis of Fuel Cells”, International Journal of HydrogenEnergy, Vol. 28, p. 703-711.
Loulou, R., G. Goldstein and K. Noble (2004), Documentation for the MARKAL Family of Models, IEA Energy Technology Systems Analysis Programme, www.etsap.org
Lovins, A. and B.D. Williams (1999), A Strategy for the Hydrogen Transition, Rocky Mountain Institute,Golden, www.rmi.org/sitepages/pid171.php
Marsh, G., et al. (2003), “Application of CO2 Removal to the Fischer-Tropsch Process to ProduceTransport Fuel”, Proceedings of the 6th International Conference on Greenhouse Gas ControlTechnologies, 1-4 October 2002 Kyoto, UK, Elsevier Science (Pergamon), Oxford, p. 45-50.
Matthiassen, O.M. (2003), CO2 as Injection Gas for Enhanced Oil Recovery and Estimation of thePotential on the Norwegian Continental Shelf, Norwegian University of Science and Technology(NTNU), Department of Petroleum Engineering and Applied Geophysics, Trondheim/Stavanger.
Mazaika, D.M. and P.B. Scott (2003), ZEV and Near-ZEV Heavy Duty Hydrogen Hybrid Electrics, ISEResearch, www.isecorp.com/hybrid_information_center/ise-technical-papers-reports.php
Meier, H.-J., et al. (2004), “Reference Power Plant North Rhine-Westphalia (RPP NRW)”, VGB PowerTech 2004, No. 5, p. 76-89.
METI (Ministry of Economy, Trade and Industry) (2005a), “Status of Development of Fuel Cell andHydrogen-Related Technologies and its Pathways for the Future”, paper prepared for the 13thFuel Cell Commercialisation Strategy Group meeting, April 19, METI, Hydrogen and Fuel CellPromotion Office, Agency for Natural Resources and Energy, Tokyo.
METI (2005b), “Japan’s Approach to Commercialisation of Fuel Cell/Hydrogen Technology”,presentation at the DOE Program Peer Review, May 23.
Metz, N. (1998), “World Wide Emissions 1980 To 1996 and Future Trends”, paper presented at theAlliance Internationale de Tourisme & Federation International de l’Automobile, PublicCommission Week, Salsomaggiore, Italy, 7 – 11 September.
Minz, M., et al. (2002), “Cost of some Hydrogen Fuel Infrastructure Options”, Transportation ResearchBoard paper, 16 January, Argonne National Laboratory, Transportation Technology R&D Center.
Moritis, G. (2004), “EOR Continues to Unlock Oil Resources”, Oil & Gas Journal, 12 April, p. 53-65.
Motyka, T., W.A. Summers and R. Zidan (2004), “Hydrogen Storage: The Key Challenge Facing aHydrogen Economy”, www.osti.gov/bridge
Mulder, F. and J. Girard (2005), Policy Implications of the Investment Needs and Economic Viabilityof 79 Hydrogen Pathway Options, SenterNovem, Utrecht, The Netherlands.
Mundschau, M.V., et al. (2005), “Advances in Hydrogen Separation Membrane Technology for theSeparation of CO2 and the Purification of Hydrogen Produced from Coal”, Proceedings of the30th Clearwater Clean Coal Conference, Florida, 17-21 April.
MTU (2004), “Das Brennstoffzellen Kraftwerk Hotmodule HM 300”, www.mtu-online.com/cfc/de/down/pics/daten.pdf
Myers, D.B., et al. (2002), “Cost and Performance of Stationary Hydrogen Fueling Appliances”,Task 2 Report, Direct Technologies, Arlington.
Naber J.E., et al. (1999), “The HTU® Process for Biomass Liquefaction; RD&D Strategy and PotentialBusiness Development”, Proceedings of the 4th Biomass Conference of the Americas, Oakland.
REFERENCES 249
250 PROSPECTS FOR HYDROGEN AND FUEL CELLS
Nakui, K. (2003), “Fuel Cell & Hydrogen Activities in Japan”, paper presented at the IEA ExCoMeeting, Paris, 6-8 October.
NASA (2004), Polymer Membranes for High Temperature PEM Fuel Cells and Solid Polymer Batteries,TOP3-00178, Glenn Research Centre, Cleveland, http://technology.grc.nasa.gov/tops/TOP300178.pdf
Newell, K. (2004), “Low Cost, High Efficiency, High Pressure Hydrogen Storage”, QuantumTechnologies for DOE Hydrogen, Fuel Cells & Infrastructure Technologies Program Review,Philadelphia.
NRC (2004), The Hydrogen Economy: Opportunities, Costs, Barriers and RD&D Needs, NationalResearch Council and National Academy of Engineering, The National Academies Press,Washington DC.
NRCAN (2005), “Polymeric Materials for Proton Exchange Membrane (PEM) Fuel Cells”, NaturalResources Canada, Ottawa. http://nmr-rmn.nrc-cnrc.gc.ca/research/PEM_presentation.pdf
NRG Associates (1995), “The Significant Oil and Gas Pools of Canada Data Base”, NRG Associates,Inc., Colorado Springs.
Nijkamp, M.G., et al. (2001), “Hydrogen Storage Using Physisorption – Materials Demand” .
Ogawa, T., et al. (2003), “Direct DiMethyl Ether Synthesis”, Journal of Natural Gas Chemistry, Vol.12, p. 219-227.
Ogden, J. (2002), “Review of Small Stationary Reformers for Hydrogen Production”, IEA/H2/TR-02/002, IEA Hydrogen Implementing Agreement, www.ieahia.org
Ouyang, M.G. (2004), “Demonstration of Hydrogen Fuel Cell City Bus in China”, presentation tothe IPHE meeting, Reykjavik, 24 September.
Panis, L., et al. (2004), “An Uncertainty Analysis of Air Pollution Externalities from Road Transportin Belgium in 2010”, Science of the Total Environment, 334-335, p. 287-298.
Paul, D. and J. Winslow (2005), “Highlights of the National Energy Technology Laboratory’s Researchon the Production and Separation of Hydrogen from Coal”, http://www.netl.doe.gov/
Pedersen, P. (2005), “The Economic Viability of an FT Facility Using PRB Coals”, Rentech,http://www.rentechinc.com/pdfs/WBC-Presentation-4-14-05.pdf
Petroconsultants, (1996a), “Petroleum Exploration and Production Database”, Petroconsultants,Houston.
Portney, P.R. and J.P. Weyant (1999), “Discounting and Intergenerational Equity”, Resources for theFuture, Washington, DC.
Prince-Richard, S. (2004), “A Techno-Economic Analysis of Decentralized Electrolytic HydrogenProduction for Fuel Cell Vehicles”, Master Thesis, University of Victoria, Canada,www.iesvic.uvic.ca/library/publications/Dissertation-SPRichard.pdf
PWC (2004), “2004 Worldwide Fuel Cell Industry Survey”, Price Waterhouse Coopers.
Rajashekara, K. (2000), Propulsion System Strategies for Fuel Cell Vehicles, SAE paper 2000-001-0369, SAE, Warrendale, Pennsylvania.
Read, P. and J. Lermit (2003), “Bio-Energy with Carbon Storage (BECS): A Sequential Decision Approachto the Threat of Abrupt Climate Challenge”, paper presented at the International Energy Workshop(IEW), Laxenburg, 23-26 June, www.iiasa.ac.at/Research/ECS/IEW2003/Abstracts/2003A_read.pdf
Renzi, S. and R. Crawford (2000), “Powering the Next Generation Automobile: Daimler Chrysler’sVenture into Fuel Cell Technology”, Corporate Environmental Strategy, Vol. 7, Issue 1, p. 38-50.
Romano, S. (2003), “Georgetown University Fuel Cell Transit Bus Program”,www.methanol.org/pdfFrame.cfm?pdf=GUBusCMAIpaper.pdf, accessed October 15, 2003.
Schuckert, M. (2005), “CUTE – A Major Step Towards Cleaner Urban Transport”, paper presentedat the Hydrogen and Fuel Cell Expert Workshop, IEA, Paris, 28 June.
Schultz, K. (2003), “Thermochemical Production of Hydrogen from Solar and Nuclear Energy”, paperpresented at the Stanford Global Climate and Energy Project, 14 April.
Shuldiner, H. (2005), “The Fuel Cell Follies”, Chief Executive, Vol. 210, July 2005,www.chiefexecutive.net/depts/technology/210.htm
Siemens Westinghouse (2005), “Demonstration Projects”,www.siemenswestinghouse.com/en/fuelcells/demonstrations/index.cfm
Smith, A.R. and J. Klosek (2001), “A review of Air Separation Technologies and their Integrationwith Energy Conversion Processes”, Fuel Processing Technology, Vol. 70, No. 2, p. 115-134.
Srosh, N. (2002), “Hydrogen Composite Tank Program”, Proceedings of the 2002 US DOE HydrogenProgram Review, NREL/CP-610-32405.
Stein, V. and T. Foster (2001), “Ceramic Membranes for Oxygen Production in Vision 21 GasificationSystems”, paper presented at the Gasification Technologies Conference, San Francisco, 7-10 October.
Steynberg, A.P. and H.G. Nel (2004), “Clean Coal Conversion Options Using Fischer-TropschTechnology”, Fuel, Vol. 83, No. 6, p. 765-770.
Stuart (2005), “Vandenborne IMET Technology Characteristics”, StuartEnergy,www.stuartenergy.com/main_our_products.html
Svensson, F., A. Hasselrot and J. Moldanova (2004), “Reduced Environmental Impact by LoweredCruise Altitude for Liquid Hydrogen-Fuelled Aircraft”, Aerospace Science and Technology, Vol. 8,p. 307-320.
Swisher, J.N. (2002), Cleaner Energy, Greener Profits: Fuel Cells as Cost-Effective Distributed EnergyResources, Rocky Mountain Institute, Snowmass, Colorado.
Syed, M.T., et al. (1998), “An Economic Analysis of Three Hydrogen Liquefaction Systems”, InternationalJournal of Hydrogen Energy, Vol. 23, No. 7, p. 565-576.
Thomas, C.E. and B.D. James (2000), “Fuel Options for Fuel Cell Vehicle: Hydrogen, Methanol orGasoline?”, International Journal of Hydrogen Energy, Vol. 25, p. 551-567.
Thompson, N. (2003), “Gas Distribution”, www.corrosioncost.com/pdf/gas.pdf
TIAX (2002), “Grid-Independent Residential Fuel Cell. Conceptual Design and Cost Estimate”,Washington, DC, www.seca.doe.gov/pubs/reports/Resid_FC_Final_10-18-02.pdf
Tosato, G. (2005), “Energy Technology Assessment with the MARKAL-Times Model Generator”, paperpresented at the Hydrogen and Fuel Cell Expert Workshop, IEA, Paris, 28 June.
Toyota (2005), www.pressroom.toyota.com/photo_library/display_release.html?id=20040623
Trembly, J., et al. (2005), “Adapting Planar Solid Oxide Fuel Cells for use With Solid Fuel Sourcesin the Production of Distributed Power”, Proceedings of the 30th Clearwater Coal Conference,Florida, 17-21 April.
Tsuchiya, H. and O. Kobayashi (2004), “Mass Production Cost of PEM Fuel Cell by Learning Curve”,International Journal of Hydrogen Energy, Vol. 29, p. 985-990.
Turton, H. and L.Barreto (2005), “Long-term security of energy supply and climate change”, EnergyPolicy, forthcoming.
REFERENCES 251
252 PROSPECTS FOR HYDROGEN AND FUEL CELLS
UNEP (2002), “Global Environmental Outlook 3”, United Nations Environment Programme,www.unep.org/GEO/geo3/english/index.htm.
US DOE (United States Department of Energy) (2001), “Low-Cost Electric Motor Manufacture”, USDOE, Washington, DC, www.eere.energy.gov/vehiclesandfuels/pdfs/success/delphi_4_3_01.pdf
US DOE (2004a), “On-Board Fuel Processing: Go/No-Go Decision”, US DOE, Decision Team CommitteeReport, www.eere.gov/hydrogenandfuelcells/
US DOE (2004b), “Strategic Significance of America’s Oil Shale Resource”, Vol. II, DE-AC01–03FE67758, Oil shale resources Technology and Economics, US DOE, Office of Deputy AssistantSecretary for Petroleum Reserves, Washington, DC.
US DOE (2004c), “FutureGen Integrated Hydrogen, Electric Power Production and CarbonSequestration Research Initiative”, US DOE, Office of Fossil Energy, Washington, DC, March.
US DOE (2005), “Hydrogen, Fuel Cells & Infrastructure Technologies Program, Multi-Year Research,Development and Demonstration Plan”, US DOE, Washington, DC, January.
USGS (2000), U.S. Geological Survey World Petroleum Assessment 2000 – Description and Results,USGS, http://pubs.usgs.gov/dds/dds-060.
Venderbosch, R.H., C. Sander and B. Tjeerdsma (2000), “Hydrothermal Conversion Of Wet Biomass,A Review”, Report GAVE-9919, NOVEM (Netherlands Agency for Energy and the Environment),Utrecht.
Vora, S. (2005), “Advances in Solid Oxide Electrolyser Cells”, paper presented at the Risø InternationalEnergy Conference, Roskilde, Denmark, 23-25 May.
WADE (2003), World Survey of Decentralised Energy 2002/2003, World Alliance for DecentralisedEnergy, Edinburgh.
Wards Auto World (2003), “Toyota, Honda Lease First Fuel Cell Vehicles”, article of 1 January,www.wardsauto.com/ar/auto_toyota_honda_lease_2, accessed May 10 2004.
Watanabe, T. (2003), “Development of High Efficiency Fuel Cell Power Plant Combined with GasTurbine”, paper presented at the International Gas Turbine Congress, Tokyo, 2-7 November.
Watanabe (2005), “Toyota’s Environmental Challenge – Toward Sustainable Mobility”, paperpresented at the International Energy Workshop, Kyoto, 5-7 July.
WBCSD (World Business Council for Sustainable Development) (2004), “Mobility 2030: Meetingthe Challenges to Sustainability”, WBCSD,www.wbcsd.ch/plugins/DocSearch/details.asp?type=DocDet&ObjectId=MTE0Njc
Weiss, W., I. Bergmann and G. Faninger (2005), “Solar Heating Worldwide, Markets and Contributionto the Energy Supply”, IEA Solar Heating & Cooling Programme, www.iea-shc.org
Welch, D. and C. Dawson (2005), “Itching to Ditch the Slow Lane. Better Batteries Will TurbochargeSales”, BusinessWeek, 25 April, p. 118-126.
WHO (World Health Organisation) (2002), The World Health Report 2002, WHO,www.who.int/whr/2002/en
Wilcox, C. (2004), “Micro-CHP: The Technology Takes Off”, EA Technology Ltd., www.chp-research.com/Downloadables/Chris%20Wilcox.pdf
Williams, R.H. and E.D Larson (2003), “A Comparison of Direct and Indirect Liquefaction Technologiesfor Making Fluid Fuels from Coal”, Energy for Sustainable Development, Vol. VII, No. 4, p. 103-129.

Wurster, R. (2002), “Pathways to a Hydrogen Refuelling Infrastructure Between Now and 2020-Time Scale & Investment Costs”, http://www.hydrogen.org/Wissen/pdf/H2-Infrastructure_Build-Up_18JUL2002-improved.pdf.
Yamashita, K. and L. Barreto (2003), “Integrated Energy Systems for the 21st Century: CoalGasification for Co-Producing Hydrogen, Electricity and Liquid Fuels”, report no. IR-03-039,International Institute for Applied Systems Analysis, Laxenburg, Austria.
Yoshida, Y., N. Hisatome and K. Takenobu (2003), “Development of SOFC for Products”, MitsubishiHeavy Industries Ltd. Technical Review, Vol. 40, No. 4, August.
Ziomek-Moroz, M. and J.A. Hawk (2005), “Degradation of Solid Oxide Fuel Cell Metallic Interconnectsin Fuels Containing Sulphur”, Proceedings of the 30th Clearwater Clean Coal Conference, Florida,17-21April.
REFERENCES 253


All IEA publications can be boughtonline on the IEA Web site:
You can also obtain PDFs ofall IEA books at 20% discount.
Books published before January 2004- with the exception of the statistics publications -
can be downloaded in PDF, free of charge,on the IEA Web site.
You can also send
your order
to your nearest
OECD sales point
or through
the OECD online
services:
www.oecdbookshop.org
CUSTOMERS INNORTH AMERICA
Turpin DistributionThe Bleachery143 West Street, New MilfordConnecticut 06776, USAToll free: +1 (800) 456 6323Fax: +1 (860) 350 [email protected]
www.turpin-distribution.com
International Energy Agency9, rue de la Fédération75739 Paris Cedex 15, France
www.iea.org/books
The Online BookshopInternational Energy Agency
CUSTOMERS INTHE REST OF THE WORLD
Turpin Distribution Services LtdStratton Business Park,
Pegasus Drive, Biggleswade,Bedfordshire SG18 8QB, UKTel.: +44 (0) 1767 604960Fax: +44 (0) 1767 604640
www.turpin-distribution.com
IEA BOOKSTel: +33 (0)1 40 57 66 90Fax: +33 (0)1 40 57 67 75
E-mail: [email protected]

IEA PUBLICATIONS9, rue de la Fédération, 75739 PARIS CEDEX 15
PRINTED IN FRANCE BY STEDI Média(61-2005-31 1P1) ISBN : 92-64-109-579 2005