for infrastructure elements report b – bond, transfer length, and
TRANSCRIPT

Final Report Prepared for Missouri Department of Transportation 2012 August Project TRyy1103 Report cmr 13-003
Self-Consolidating Concrete (SCC) for Infrastructure Elements
Report B – Bond, Transfer Length, and Development Length of Prestressing Strand
Prepared By:

FINALReportB
TRyy1103
ProjectTitle:Self‐ConsolidatingConcrete(SCC)forInfrastructureElements
ReportB:Self‐ConsolidatingConcrete(SCC)forInfrastructureElements:Bond,TransferLength,andDevelopmentLengthof
PrestressingStrandinSCC
Prepared for Missouri Department of Transportation
Construction and Materials
Missouri University of Science and Technology, Rolla, Missouri
July 2012 The opinions, findings, and conclusions expressed in this publication are those of the principal investigators and the Missouri Department of Transportation. They are not necessarily those of the U.S. Department of Transportation, Federal Highway Administration. This report does not constitute a standard or regulation
B-i

B-ii

B-iii
ABSTRACT
Due to its economic advantages, the use of self-consolidating concrete (SCC) has
increased rapidly in recent years. However, because SCC mixes typically have decreased
amounts of coarse aggregate and high amounts of admixtures, industry members have
expressed concerns that the bond of prestressing strand in SCC may be compromised.
While the bond performance of prestressing strand in a new material such as SCC is an
important topic requiring investigation, the results are only applicable if the research is
completed on strands with similar bond quality as the strands used in the field. Therefore,
the objectives of this research program were to investigate the transfer and development
lengths of prestressing strand in SCC and also evaluate the effectiveness of two proposed
bond tests in determining acceptable bond quality of strand.
Transfer and development lengths of 0.5-in. diameter (12.5 mm), Grade 270
prestressing strand were evaluated using rectangular beams constructed from normal and
high strength conventional concrete and SCC mixes. End slips at release and strain
readings over 28 days were used to calculate transfer lengths, and development lengths
were evaluated through four-point loading at varying embedment lengths. Additionally,
the NASP bond test and Large Block Pullout Tests (LBPT) were evaluated with strand
from three different sources to determine if one test could be considered more reliable at
predicting acceptable bond.
Results indicated that bond performance of SCC and conventional concrete were
comparable, and that AASHTO and ACI equations for transfer and development length
were generally conservative. The NASP bond test and LBPT were found to be equally
valid, but the acceptance limits for both tests appear to require revisions.
B-iv
TABLE OF CONTENTS
Page
ABSTRACT ....................................................................................................................... iii
LIST OF ILLUSTRATIONS ........................................................................................... viii
LIST OF TABLES ........................................................................................................... xiii
NOMENCLATURE ........................................................................................................ xvi
1. INTRODUCTION ...................................................................................................... 1
1.1. BACKGROUND ................................................................................................ 1
1.2. OBJECTIVES ..................................................................................................... 2
1.3. SCOPE ................................................................................................................ 3
1.4. OUTLINE ........................................................................................................... 4
2. LITERATURE REVIEW ........................................................................................... 6
2.1. INTRODUCTION .............................................................................................. 6
2.2. EXPLANATION OF TRANSFER LENGTH, FLEXURAL BOND LENGTH,
AND DEVELOPMENT LENGTH .................................................................... 6
2.3. BOND THEORY ................................................................................................ 7
2.3.1. Adhesion ................................................................................................... 8
2.3.2. Hoyer Effect ............................................................................................. 8
2.3.3. Mechanical Interlock. ............................................................................... 9
2.4. FACTORS AFFECTING TRANSFER AND DEVELOPMENT LENGTHS .. 9
2.4.1. Strand Size .............................................................................................. 10
2.4.2. Steel Stress Level ................................................................................... 10
2.4.3. Concrete Strength. .................................................................................. 10
2.4.4. Time Dependent Losses ......................................................................... 11
2.4.5. Type of Release ...................................................................................... 12
2.4.6. Consolidation and Consistency of Concrete around Strand ................... 12
2.5. ACI AND AASHTO CODE EQUATIONS ..................................................... 13
2.5.1. AASHTO LRFD Bridge Design Specifications ..................................... 13
2.5.2. ACI 318-11 ............................................................................................. 15
2.5.3. Background of the AASHTO and ACI Development Length

B-v
Equations. .............................................................................................. 16
2.6. RESEARCH REGARDING ACCEPTANCE OF A STANDARD BOND
TEST ................................................................................................................ 19
2.6.1. Logan (1997) .......................................................................................... 19
2.6.2. Rose and Russell (1997) ......................................................................... 21
2.6.3. NASP Bond Testing Rounds I-IV .......................................................... 22
2.6.4. Ramirez and Russell (2008).. ................................................................. 26
2.6.5. Current Status and Recent Developments .............................................. 27
2.7. RESEARCH REGARDING BOND OF PRESTRESSING STRAND
IN SCC ............................................................................................................. 28
2.7.1. Girgis and Tuan (2005) .......................................................................... 28
2.7.2. Larson, Peterman, and Esmaeily (2007) ................................................ 29
2.7.3. Pozolo and Andrawes (2011) ................................................................. 31
2.7.4. Staton, Do, Ruiz, and Hale (2009) ......................................................... 32
2.7.5. Floyd, Ruiz, Do, Staton, and Hale (2011) .............................................. 33
2.7.6. Boehm, Barnes, and Schindler (2010) .................................................... 34
2.7.7. Burgueño and Haq (2007) ...................................................................... 35
3. BOND TEST PROGRAM AND RESULTS ........................................................... 36
3.1. INTRODUCTION ............................................................................................ 36
3.2. TENSILE PROPERTIES OF PRESTRESSING STRANDS ........................... 38
3.2.1. Tension Test Setup and Procedure ......................................................... 38
3.2.2. Tension Test Results .............................................................................. 40
3.3. NASP BOND TEST ......................................................................................... 42
3.3.1. NASP Test Specimen Design ................................................................. 42
3.3.2. NASP Test Specimen Fabrication .......................................................... 45
3.3.3. NASP Test Setup and Procedure ............................................................ 49
3.3.4. NASP Test Results ................................................................................. 53
3.3.4.1 Results from Standard NASP Test in Mortar .............................53
3.3.4.2 Results from Modified NASP Test in Concrete .........................57
3.4. LARGE BLOCK PULLOUT TEST ................................................................. 61
3.4.1. LBPT Specimen Design ......................................................................... 61

B-vi
3.4.2. LBPT Specimen Fabrication .................................................................. 63
3.4.3. LBPT Test Setup and Procedure ............................................................ 66
3.4.4. LBPT Results ......................................................................................... 69
4. TRANSFER LENGTH AND DEVELOPMENT LENGTH TEST PROGRAM
AND RESULTS....................................................................................................... 76
4.1. INTRODUCTION ............................................................................................ 76
4.2. TRANSFER AND DEVELOPMENT LENGTH BEAM DESIGN................. 76
4.2.1. Mix/Specimen Identifications and Mix Designs .................................... 76
4.2.2. Fresh and Hardened Properties of Concrete Mixtures ........................... 78
4.2.3. Strand and Mild Reinforcement Design ................................................. 80
4.3. TRANSFER AND DEVELOPMENT LENGTH BEAM FABRICATION .... 83
4.4. TRANSFER LENGTH TEST SETUPS, PROCEDURES, AND RESULTS .. 86
4.4.1. 95% Average Mean Strain Method ........................................................ 87
4.4.1.1 DEMEC Instrumentation ............................................................87
4.4.1.2 95% Average Mean Strain Procedure .........................................91
4.4.1.3 95% Average Mean Strain Transfer Lengths ..............................93
4.4.2. End Slip Method of Determining Initial Transfer Length ...................... 97
4.4.2.1 Linear Potentiometer Setup and Procedure .................................98
4.4.2.2 Steel Ruler Setup and Procedure ...............................................105
4.4.2.3 Transfer Length Determination from End Slip Data ................107
4.5. DEVELOPMENT LENGTH TEST SETUP, PROCEDURE,
AND RESULTS ............................................................................................. 110
4.5.1. Four-Point Loading Setup and Instrumentation ................................... 111
4.5.2. Four-Point Loading Procedure ............................................................. 115
4.5.3. Four-Point Loading Results.................................................................. 116
5. DISCUSSION AND COMPARISON OF RESULTS ........................................... 120
5.1. INTRODUCTION .......................................................................................... 120
5.2. BOND TEST RESULTS ................................................................................ 120
5.2.1. Discussion of NASP Test in Mortar Results ........................................ 121
5.2.2. Discussion of NASP Test in Concrete Results ..................................... 128
5.2.3. Discussion of LBPT Results................................................................. 135

B-vii
5.2.4. Comparison of NASP Test in Mortar Results to LBPT Results .......... 136
5.3. TRANSFER LENGTH TEST RESULTS ...................................................... 140
5.3.1. Discussion of 95% Average Mean Strain Transfer Length Results ..... 140
5.3.1.1 Comparison of SCC to Conventional Concrete ........................146
5.3.1.2 Comparison of Normal Strength to High Strength ...................153
5.3.1.3 Comparison of Bottom Strand to Top Strand ...........................159
5.3.1.4 Change in Transfer Length over Time ......................................164
5.3.1.5 Comparison to AASHTO and ACI Equations for Transfer
Length. ......................................................................................166
5.3.2. Discussion of Initial End Slip Transfer Length Results ....................... 171
5.3.3. Correlation of NASP Test in Concrete Results to 95% Average Mean
Strain Transfer Lengths ....................................................................... 175
5.4. DEVELOPMENT LENGTH TEST RESULTS ............................................. 185
6. FINDINGS, CONCLUSIONS, AND RECOMMENDATIONS ........................... 191
6.1. FINDINGS ...................................................................................................... 191
6.1.1. Bond Test Results ................................................................................. 191
6.1.2. Transfer Length Test Results ............................................................... 192
6.1.3. Development Length Test Results ....................................................... 194
6.2. CONCLUSIONS ............................................................................................ 195
6.3. RECOMMENDATIONS ................................................................................ 197

B-viii
LIST OF ILLUSTRATIONS
Figure Page
2.1 – Variation of Stress in a Strand Along the Length of a Beam (Adapted from ACI
318-11) ......................................................................................................................... 7
2.2 – Hoyer Effect (Adapted from Russell and Burns 1993) .............................................. 8
2.3 – Original Representation of Flexural Bond Length (adapted from Tabatabai and
Dickson, 1993) ........................................................................................................... 18
3.1 – Bond Test Identification Code ................................................................................. 37
3.2 – Tension Test Specimens .......................................................................................... 39
3.3 – Tension Test Setup ................................................................................................... 40
3.4 – Fractured Tension Test Specimen ............................................................................ 41
3.5 – NASP Specimen Mold ............................................................................................. 43
3.6 – Strands with Bond Breakers..................................................................................... 43
3.7 – Mortar Mix in Drum Mixer ...................................................................................... 46
3.8 – Flow Test ................................................................................................................. 47
3.9 – Mortar Cubes ........................................................................................................... 47
3.10 – NASP Mold and Strand Setup ............................................................................... 48
3.11 – Filling Specimens for NASP Test in Concrete ...................................................... 49
3.12 – Capped NASP in Concrete Specimens and Cylinders ........................................... 49
3.13 – NASP Test Frame .................................................................................................. 51
3.14 – NASP Test Setup ................................................................................................... 52
3.15 – NASP Test Setup Details ....................................................................................... 52
3.16 – NASP Test LVDT Setup ........................................................................................ 53
3.17 – Typical Load vs. Slip Plot for NASP Test in Mortar (N-101-A) ........................... 54
3.18 – Typical Load vs. Slip Plot for Concrete NASP Test (N-101-S6) .......................... 58
3.19 – Cross-Section of LBPT Specimen ......................................................................... 62
3.20 – Profile of LBPT Specimen ..................................................................................... 62
3.21 – Strand Layout Pattern ............................................................................................ 63
3.22 – LBPT Specimen Before Casting ............................................................................ 64
3.23 – Casting the LBPT Specimen .................................................................................. 65

B-ix
3.24 – Finished LBPT Specimen ...................................................................................... 66
3.25 – LBPT Hydraulic Jack and Load Cell Setup ........................................................... 67
3.26 – Steel Table for LBPT ............................................................................................. 68
3.27 – Full LBPT Setup .................................................................................................... 69
3.28 – Visual Comparison of Strands ............................................................................... 72
3.29 – Towel Wipe Results for Strand Type 101 .............................................................. 73
3.30 – Towel Wipe Results for Strand Type 102 .............................................................. 73
3.31 – Towel Wipe Results for Strand Type 103 .............................................................. 73
4.1 – Mix and Specimen Identification Code ................................................................... 77
4.2 - Two-Strand Beam Cross-Section ............................................................................. 81
4.3 – Four-Strand Beam Cross-Section ............................................................................ 81
4.4 – Profile of Two-Strand Beams .................................................................................. 82
4.5 – Profile of Four-Strand Beams .................................................................................. 82
4.6 – C6 and S6 Prestressing Bed Layout ......................................................................... 84
4.7 – C10 and S10 Prestressing Bed Layout ..................................................................... 84
4.8 – Beam Fabrication at Coreslab Structures in Marshall, MO ..................................... 85
4.9 – Beams After Form Removal and Before Instrumentation ....................................... 85
4.10 – Bolt Cutting Strands at Release ............................................................................. 86
4.11 – Setting DEMEC Points with Setting Bar ............................................................... 88
4.12 – Honeycombing Preventing DEMEC Placement at Point 4 on C10-4-1_SW ........ 89
4.13 – Taking DEMEC Readings ..................................................................................... 90
4.14 – C6 and S6 Beams in Storage Yard at Coreslab...................................................... 90
4.15 – Mean Strains .......................................................................................................... 91
4.16 – Typical 95% Average Mean Strain Smoothed Curve for Determining Transfer
Lengths – S-10-2-2-NE and S10-2-2_SE ................................................................... 92
4.17 – Typical 95% Average Mean Strain Smoothed Curves for Determining Transfer
Lengths from 1 to 28 Days – S10-2-2-NE and S10-2-2_SE ...................................... 93
4.18 – Relationship Between Steel Stress and Strain and Transfer Length (adapted
from Russell and Burns, 1993) ................................................................................... 98
4.19 – Linear Potentiometer Setup .................................................................................... 99
4.20 – Synergy Data Acquisition Computer Setup ........................................................... 99
B-x
4.21 – Improved Potentiometer-FRP Assemblies with Zip Ties and Plastic Epoxy
(Top) and Gorilla Glue Expanding Foam (Bottom) ................................................. 102
4.22 – Typical End Slip Plot: C6 Two-Strand Beams Potentiometer Reading vs. Time
Elapsed Plot from Synergy ....................................................................................... 104
4.23 – Electrical Tape on Strands for Steel Ruler Measurements of End Slip ............... 106
4.24 – Four-Point Loading Test Setup for Evaluating 58-in. (1,473 mm) Embedment
Length ...................................................................................................................... 112
4.25 – 58 in. (1,473 mm) Embedment Length Test Setup .............................................. 113
4.26 – 73 in. (1,854 mm) Embedment Length Test Setup .............................................. 113
4.27 – LVDT Setup for Measuring Deflection at Midspan ............................................ 114
4.28 – Linear Potentiometer Setup on Four-Point Loading Tests .................................. 115
4.29 – Cracks Marked with Permanent Marker during Development Length Test ........ 116
4.30 – Typical Moment vs. Deflection and Strand End Slip vs. Deflection Plot from
Four-Point Loading Data .......................................................................................... 117
4.31 – Typical Concrete Crushing Failure for Development Length Tests .................... 118
5.1 – NASP in Mortar Pullout Values ............................................................................ 121
5.2 – N-101-B Load vs. Slip ........................................................................................... 123
5.3 – N-102-B Load vs. Slip ........................................................................................... 124
5.4 – N-103-B Load vs. Slip ........................................................................................... 124
5.5 – Comparison of N-101-A and N-101-B Pullout Loads ........................................... 128
5.6 – NASP in Concrete Pullout Loads – 1 Day ............................................................. 129
5.7 – NASP in Concrete Pullout Loads – 8 Day ............................................................. 130
5.8 – NASP in Concrete Pullout Loads √f’c – 1 Day ...................................................... 134
5.9 – NASP in Concrete Pullout Loads √f’c – 8 Day ...................................................... 134
5.10 – LBPT Average First Slip and Peak Pullout Loads .............................................. 136
5.11 – LBPT Pullout Loads vs. NASP Pullout Loads .................................................... 139
5.12 – C6 and S6 Transfer Length Locations ................................................................. 142
5.13 – C10 and S10 Transfer Length Locations ............................................................. 142
5.14 – Release of C10-2 Beams ...................................................................................... 144
5.15 – C6-2 and S6-2 Transfer Lengths with 90% Confidence Intervals ....................... 148
5.16 – C10-2 and S10-2 Transfer Lengths with 90% Confidence Intervals ................... 148

B-xi
5.17 – C10-2 (D) and S10-2 Transfer Lengths with 90% Confidence Intervals ............ 149
5.18 – C6-4 and S6-4 Transfer Lengths with 90% Confidence Intervals ....................... 151
5.19 – C10-4 and S10-4 Transfer Lengths with 90% Confidence Intervals ................... 151
5.20 – C10-4 and S10-4 (D) Transfer Lengths and 90% Confidence Intervals .............. 152
5.21 – C6-2 and C10-2 Transfer Lengths and 90% Confidence Intervals ...................... 154
5.22 – C6-2 and C10-2 (D) Transfer Lengths and 90% Confidence Intervals ............... 155
5.23 – S6-2 and S10-2 Transfer Lengths and 90% Confidence Intervals ....................... 155
5.24 – C6-4 and C10-4 Transfer Lengths and 90% Confidence Intervals ...................... 157
5.25 – S6-4 and S10-4 Transfer Lengths and 90% Confidence Intervals ....................... 158
5.26 – S6-4 and S10-4 (D) Transfer Lengths and 90% Confidence Intervals ................ 158
5.27 – C6-2 and C6-4 Transfer Lengths and 90% Confidence Intervals ........................ 160
5.28 – C10-2 and C10-4 Transfer Lengths and 90% Confidence Intervals .................... 161
5.29 – C10-2 (D) and C10-4 Transfer Lengths and 90% Confidence Intervals ............. 161
5.30 – S6-2 and S6-4 Transfer Lengths and 90% Confidence Intervals ......................... 162
5.31 – S10-2 and S10-4 Transfer Lengths and 90% Confidence Intervals ..................... 163
5.32 – S10-2 and S10-4 (D) Transfer Lengths and 90% Confidence Intervals .............. 163
5.33 – Average Transfer Lengths Compared to AASHTO and ACI Equations (Bottom
Strands) .................................................................................................................... 169
5.34 – Average Transfer Lengths Compared to AASHTO and ACI Equations (Top
Strands) .................................................................................................................... 170
5.35 – NCHRP Normalized NASP Pull-out Values vs. Concrete Strength (Ramirez
and Russell 2008) ..................................................................................................... 177
5.36 – NCHRP Normalized NASP Pull-out Values vs. √f’c (Ramirez
and Russell 2008) ..................................................................................................... 177
5.37 – NCHRP Transfer Lengths vs. Normalized NASP Bond Values (Ramirez
and Russell 2008) ..................................................................................................... 178
5.38 – Normalized NASP in Concrete Pullout Values vs. Concrete Strength (NCHRP
and Missouri S&T) ................................................................................................... 181
5.39 – Normalized NASP in Concrete Pullout Values vs. Square Root of Concrete
Strength (NCHRP and Missouri S&T) .................................................................... 182
5.40 – Normalized NASP Value vs. Transfer Length at Release ................................... 183

B-xii
5.41 – NCHRP Distribution of Bond and Flexural Failures for Strands A/B (Ramirez
and Russell 2008) ..................................................................................................... 187
5.42 – NCHRP and Missouri S&T Concrete Strength vs. Embedment Length
Development Test Results ........................................................................................ 188

B-xiii
LIST OF TABLES
Table Page
2.1 – NASP Round II R2 Values Comparing Moustafa, PTI, and NASP Pullout Results
Between Sites (Russell and Paulsgrove 1999b) ......................................................... 23
2.2 – Round III Coefficient of Variation (R2) Values Relating 28 Day Transfer Lengths to
Bond Test Pullout Values (adapted from Hawkins and Ramirez 2010) .................... 24
2.3 – Round III NASP Pullout Values and Failure Modes from Flexural Testing of Single
Strand Beams (Hawkins and Ramirez 2010) ............................................................. 25
2.4 – Round III NASP Pullout Values and Failure Modes from Flexural Testing of
Double Strand Beams (Hawkins and Ramirez 2010) ................................................ 25
2.5 – Girgis and Tuan Results ........................................................................................... 29
2.6 – Concrete Strength at Testing and Development Length Ranges ............................. 33
3.1 – Direct Tension Test Results ..................................................................................... 41
3.2 – Mortar Mix Design for NASP Tests ........................................................................ 45
3.3 – NASP Test in Mortar Test Matrix ........................................................................... 45
3.4 – NASP in Mortar Results for Strand 101 Mix A ....................................................... 55
3.5 – NASP in Mortar Results for Strand 101 Mix B ....................................................... 55
3.6 – NASP in Mortar Results for Strand 102 Mix B ....................................................... 56
3.7 – NASP in Mortar Results for Strand 103 Mix B ....................................................... 56
3.8 – Summary of NASP Test in Mortar Pullout Values and Mortar Properties .............. 57
3.9 – Concrete NASP Results – C6 and S6 ...................................................................... 59
3.10 – Concrete NASP Results – C10 and S10 ................................................................ 60
3.11 – Missouri S&T’s and Logan’s LBPT Mix Designs ................................................ 64
3.12 – Fresh and Hardened Properties of LBPT Concrete Mix ........................................ 66
3.13 – LBPT Results ......................................................................................................... 70
3.13 Continued – LBPT Results ....................................................................................... 71
3.14 – Summary of LBPT Pullout Loads.......................................................................... 75
4.1 – Mix Designs ............................................................................................................. 78
4.2 – Fresh Concrete Properties ........................................................................................ 79
4.3 – Concrete Strengths and 28 Day Moduli of Elasticity .............................................. 80

B-xiv
4.4 – Transfer Lengths for Top Strands of Four-Strand Beams (1-28 Days) ................... 94
4.5 – Transfer Lengths for Bottom Strands of Two-Strand Beams (1-28 Days) .............. 95
4.6 – Average Transfer Lengths for Top Strands of Four-Strand Beams ......................... 96
4.7 – Average Transfer Lengths for Bottom Strands of Two-Strand Beams .................... 96
4.8 – Measured End Slips from Linear Potentiometers .................................................. 105
4.9 – Measured End Slips from Steel Ruler .................................................................... 107
4.10 – Initial Transfer Lengths from Steel Ruler End Slips, Synergy End Slips, and
DEMEC Data for Bottom Strands on C6 and S6 Beams ......................................... 108
4.11 – Initial Transfer Lengths from Steel Ruler End Slips, Synergy End Slips, and
DEMEC Data for Bottom Strands on C10 and S10 Beams ..................................... 109
4.12 – Initial Transfer Lengths from Steel Ruler End Slips, Synergy End Slips, and
DEMEC Data for Top Strands on C6, S6, C10, and S10 Beams ............................. 110
4.13. Nominal and Actual Moment Capacities ............................................................... 118
4.14 – Summary of Average Nominal and Actual Moment Capacities ......................... 119
5.1 – Average Pullout 0.1-in. (2.54 mm) Pullout Values from Missouri S&T and NCHRP
10-62 for Strands 102 and 103 ................................................................................. 125
5.2 – N-101-A and N-101-B Pullout Loads .................................................................... 127
5.3 – NASP in Concrete Results for C6 and S6 Normalized to √f’c ............................... 132
5.4 – NASP in Concrete Results for C10 and S10 Normalized to √f’c ........................... 133
5.5 – LBPT Results Statistical Summary ........................................................................ 135
5.6 – NASP in Mortar and LBPT Pullout Loads ............................................................ 138
5.7 – Pass/Fail Results for NASP in Mortar and LBPT .................................................. 139
5.8 – Standard and Modified Transfer Length Averages (Bottom Strands) ................... 145
5.9 – Standard and Modified Length Averages (Top Strands) ....................................... 146
5.10 – Conventional Concrete vs. SCC: Summary of Statistical Differences Between
Bottom Strand Transfer Lengths .............................................................................. 149
5.11 – Conventional Concrete vs. SCC: Summary of Statistical Differences Between Top
Strand Transfer Lengths ........................................................................................... 152
5.12 – Normal Strength vs. High Strength: Summary of Statistical Differences Between
Bottom Strand Transfer Lengths .............................................................................. 156

B-xv
5.13 – Normal Strength vs. High Strength: Summary of Statistical Differences Between
Top Strand Transfer Lengths ................................................................................... 159
5.14 – Top Strand vs. Bottom Strand: Summary of Statistical Differences Between
Transfer Lengths ...................................................................................................... 165
5.15 – Summary of Increases in Transfer Lengths ......................................................... 165
5.16 – Ratio of Average Transfer Lengths to AASHTO and ACI Values (Bottom Strands)
.................................................................................................................................. 169
5.17 – Ratio of Average Transfer Lengths to AASHTO and ACI Values (Top Strands)
.................................................................................................................................. 170
5.18 – Comparison of Synergy-DEMEC and Ruler-DEMEC Transfer Lengths (Bottom
Strands) .................................................................................................................... 174
5.19 – Comparison of Synergy-DEMEC and Ruler-DEMEC Transfer Lengths (Top
Strands) .................................................................................................................... 175
5.20 – Summary of Data for Comparison with NCHRP Results .................................... 179
5.21 – Summary of Trend line Equations and R2 Values for NCHRP and Missouri S&T
Data .......................................................................................................................... 184
5.22 – Comparison of Measured Transfer Lengths to Values Calculated by Current and
Proposed AASHTO Equations ................................................................................. 185
5.23 – Comparison of Experimental and Calculated Moment Capacities ...................... 186
5.24 – Comparison of Development Lengths Calculated by Current and Proposed
AASHTO Equations ................................................................................................. 189

B-xvi
NOMENCLATURE
Symbol Description
Aps Area of prestressing strand, in2
db Nominal diameter of strand, in. (ACI 318-11 and AASHTO LRFD-07)
D Nominal diameter of strand, in. (Tabatabai and Dickson 1993)
Eps Modulus of elasticity of prestressing strand, psi or ksi
f'c Concrete compressive strength at 28 days or otherwise specified, psi
f'ci Concrete compressive strength at release, psi
fce Stress in concrete outside transfer zone due to stress in strand immediately
after release, psi or ksi
fpe Effective stress in the strand after losses, psi (AASHTO LRFD-07)
fps Stress in prestressing steel at nominal flexural strength, psi (ACI 318-11)
fpu Specified tensile strength of prestressing steel, psi (ACI 318-11)
fsb Average stress in the steel at general bond slip, psi or ksi (Tabatabai and
Dickson 1993)
fsi Stress in strand immediately after release, instead of after all losses, psi or
ksi (Buckner 1995)
fsi Stress in strand immediately before release, psi or ksi (Anderson and
Anderson 1976)
fse Effective stress in prestressing strand after allowance for all prestress
losses, psi or ksi (ACI 318-11 and Tabatabai and Dickson 1993)
fse Effective stress in prestressing strand immediately after release, psi or ksi
(Anderson and Anderson 1976)
fsu Stress developed in the strand at ultimate strength of a member, ksi
(Tabatabai and Dickson 1993)
fsu* Average stress in the prestressing steel at ultimate load, ksi (Tabatabai and
Dickson 1993)
fu Ultimate tensile strength of prestressing strand as determined through a
tension test in this research, ksi

B-xvii
le Embedment length, in.
ld Development length, in. (AASHTO LRFD-07 and ACI 318-11)
lfb Flexural bond length, in.
lt Transfer length, in.
L Embedment length, in. (Tabatabai and Dickson 1993)
LT Transfer length, in. (Tabatabai and Dickson 1993 and Anderson and
Anderson 1976)
Mcr Moment at which cracking first occurred in four-point load tests, k-in.
Mn Calculated nominal moment capacity for four-point loading specimens,
k-in.
Mu Ultimate applied moment for four-point loading specimens, k-in.
Ut Average bond stress, taken to be 0.4 ksi (Tabatabai and Dickson 1993)
Δ Measured end slip of strand at release, in.
εce Strain in prestressing strand immediately after release, in./in.
εse Strain in prestressing strand immediately after release, in./in.
εsi Strain in prestressing strand immediately before release, in./in.
Σ0 Circumference of prestressing strand, in. (Tabatabai and Dickson 1993)
κ Bond reduction factor of 1.6 for members greater than 24 in. deep
(AASHTO LRFD-07)

B-1
1. INTRODUCTION
1.1. BACKGROUND
Self-consolidating concrete (SCC) is a material that is on the forefront of
construction technology. The flowable nature of SCC eliminates the needs for mechanical
vibration and finishing, which are typically required during placement of conventional
concrete, saving costs in the form of labor, time, and equipment as well as increasing
production rates at precast plants. In addition, the ability of SCC to securely fill
formwork and congested areas of reinforcement under its own weight leads to a decrease
in the potential for honeycombing and voids, resulting in better aesthetic appearance and
structural quality. Despite the flowability of SCC, the concrete is still non-segregating
due to the addition of certain admixtures and proper proportioning of the mix. The cost
saving attributes, combined with the improved appearance and comparable structural
quality compared to conventional concrete, make SCC especially of interest to precasters.
Although the economic and performance benefits make SCC desirable for use in
construction, the addition of admixtures and adjustments to mix proportions that give
SCC its unique qualities can alter structural properties when compared to conventional
concrete, especially in terms of transfer and development lengths of prestressing strand.
Because SCC mixes typically have decreased amounts of coarse aggregate and high
amounts of admixtures, industry members have expressed concerns that the bond of
prestressing strand in SCC may be compromised. In response to these concerns, some
research programs have recently been implemented, especially by state Departments of
Transportation, to investigate the effects of SCC on prestressing strand and determine if
SCC is acceptable for precast plants to use in the construction of prestressed members,
such as infrastructure elements (Boehm et al. 2010, Larson et al. 2007).
While the bond of prestressing strand in SCC has been a current research subject,
the bond quality of prestressing strand in general has also been a topic of interest in
recent years. Only in the past few decades have concerns regarding excessive end slips of
strands and measured transfer lengths significantly longer than those predicted by the
AASHTO LRFD and ACI 318 equations begun to surface (Cousins et al. 1990). Research
has since indicated that bond quality is an inherent property of the strand and can vary

B-2
from source to source. These recent issues with bond quality are most likely due to the
current production process of prestressing strand compared to the original production
processes. Today’s strands are typically heated through induction, while the original
process employed convection heating. The convection process heated the strands to much
higher temperatures, and it is hypothesized that the higher temperatures burned off more
of the residues from the wire drawing process and combusted the organic impurities on
the surfaces (Rose and Russell 1997). It is believed that the lower temperatures from
induction heating result in more residues left on the strands, which could affect bond;
however, a direct correlation has not yet been established.
While the exact relationship between production process and bond quality has yet
to be determined, differences in bond quality of strands have still been proven to exist,
and as a result, several tests for assessing the bond quality of strands have been proposed.
These pullout tests consist of sections of strand cast in concrete or mortar, and acceptable
bond quality is determined by comparing the average pullout load to a minimum value.
The different pullout tests and the standard limits for the tests have been investigated
since the mid 1990’s, but a standard test and limit have still not been accepted.
Bond of prestressing strand has become an important topic in recent years,
especially as new materials are being developed and put into use. While the bond of
prestressing strand in a new material such as SCC is an important topic that deserves
investigation, the results are only valid and applicable if the research tests are completed
on strands with similar bond quality as the type of strand being used in the field.
Therefore, it is important to develop a test that can pre-qualify strand based on bond so
researchers as well as industry members can use similar strand types, so trends seen in
test results will be accurately reflected in the field.
1.2. OBJECTIVES
In order to investigate the possibility of implementing specifications that would
allow precasters to use SCC for the construction of infrastructure elements for Missouri
projects, the Missouri Department of Transportation (MoDOT) funded a research project
examining the effect of SCC on various structural properties, including shear, durability,
creep and shrinkage, bond with mild steel reinforcement, and bond with prestressing

B-3
strand. The portion of the research program related to the bond of prestressing strand is
presented in this report, and the main objectives of this portion of the research were to 1)
investigate the transfer and development lengths of 0.5-in.-diameter (12.7 mm), Grade
270 prestressing strand in normal strength and high strength conventional and SCC mixes
similar to those used by precast plants in Missouri, and 2) evaluate two pullout tests
proposed for the acceptance or rejection of strand based on bond quality.
In terms of evaluating the transfer and development lengths, the goals were to 1)
compare SCC results to conventional concrete results to determine if SCC compromises,
enhances, or has no effect on bond performance of prestressing strand, 2) compare SCC
and conventional concrete results to values predicted by AASHTO LRFD-07 and ACI
318 code equations to determine if the design equations are conservative, 3) compare the
normal strength concrete results to high strength concrete results to determine the effect
of concrete strength on bond, and 4) compare results from top-cast strands and bottom-
cast strands to evaluate the top-bar effect on prestressing strand.
Regarding the investigation of pullout tests, the goals were to 1) compare bond
quality of prestressing strand from three different sources using two proposed pullout test
methods and 2) correlate pullout results to measured transfer lengths.
The ultimate goal was to analyze the results from the transfer and development
length and bond portions of this research program and make recommendations to
MoDOT for guidelines regarding the use of SCC by precast plants for infrastructure
elements and the acceptance of prestressing strand based on bond.
1.3. SCOPE
In order to evaluate the bond of prestressing strand, first, a literature review that
included studies examining the transfer and development lengths of prestressing strand in
SCC as well as previous research related to pullout tests and strand bond quality was
conducted. Based on the literature review, a research plan was developed.
The transfer and development lengths of 0.5-in.-diameter (12.7 mm), Grade 270
prestressing strand were evaluated and compared in four concrete mixes. The four mixes
included a normal strength and high strength conventional concrete and a normal strength
and high strength SCC. Three 17-ft.-long (5.18 m) beams were cast from each mix for a

B-4
total of 12 full-scale specimens. For each mix, two beams were cast with two strands,
both on the bottom, and one beam was cast with four strands, two on the bottom and two
on the top. The four-strand beams were constructed to evaluate the effect of casting
position on transfer length. All beams were first used to measure transfer lengths
periodically from release to 28 days after casting. Once all transfer length data was
collected, the development lengths of the two-strand beams were evaluated through four-
point loading.
In the bond testing portion of this research program, 0.5-in.-diameter (12.7 mm),
Grade 270 strand from three different sources was evaluated through two different
proposed bond tests, and the pullout loads were compared to each other and to the
recommended minimum limit specified by each test. The strands were also then cast in a
modified bond test using the four concrete mixes used to construct the transfer and
development length beam specimens with the goal of determining if the pullout loads
from the tests performed in concrete could be correlated to the measured transfer lengths
and be an indicator of bond performance.
1.4. OUTLINE
This report is composed of six sections and six appendices. Section 1 gives a brief
introduction to the subject area and explains why this research was done. The first section
also presents the objectives and scope of work of the research covered in this report.
Section 2 contains the Literature Review conducted on the topics of bond and
specifically bond of prestressing strand in SCC. First, relevant terms and the mechanisms
of bond theory are defined and discussed. Next the AASHTO LRFD-07 and ACI 318-11
code equations for transfer and development length are presented along with a brief
background of the development of the equations. Finally, summaries of previous research
regarding general bond acceptance tests of prestressing strands and also bond, transfer
length, and development length of prestressing strands in SCC are explained.
Section 3 presents the bond test program portion of this research. The design and
fabrication of pullout specimens as well as the setup, procedure, and results for each test
are discussed. Setup and procedure for tension testing performed on samples of the

B-5
prestressing strands and the resulting mechanical properties are also included in this
section.
The transfer length and development length test program is explained in Section
4. This section outlines the design and fabrication of the prestressed beams used for this
research as well as the set-up, procedure, and results for the transfer length and
development length tests.
Section 5 contains the discussion of all results, including evaluation of bond
performance of prestressing strand in conventional concrete versus SCC and comparison
of results to AASHTO and ACI code provisions. A comparison and discussion of the two
bond tests evaluated in this program are also included in this section, along with
discussion of the correlation between results of the pullout tests and measured transfer
lengths.
Finally, the findings obtained from each section of the study along with the
conclusions that were drawn based on the findings are presented in Section 6. This
section also includes recommendations for proposed specifications and future research.
There are also six appendices included in this report. Appendix A includes the
summary of concrete compressive strengths from 1 to 28 days for the four concrete
mixes. Appendix B contains the load vs. deflection plots for the NASP in concrete tests,
while the load vs. time curves from the LBPT specimens are presented in Appendix C.
The 95% Average Mean Strain plots for transfer length determination are included in
Appendix D, and the end slip plots from the linear potentiometers connected to the
Synergy data acquisition system can be found in Appendix E. Finally, Appendix F
includes photos, moment and end slip vs. deflection plots, and descriptions of all four-
point load tests.

B-6
2. LITERATURE REVIEW
2.1. INTRODUCTION
This Literature Review first explains the relevant terms related to bond of
prestressing strand and then discusses theory of bond mechanisms and the factors that
affect transfer and development lengths. Next, the current AASHTO and ACI provisions
for transfer length and development length of prestressing strand are presented along with
information on the background of the development of the equations. Finally, previous
research regarding bond acceptance tests for prestressing strand and the bond of
prestressing strand in SCC are discussed.
2.2. EXPLANATION OF TRANSFER LENGTH, FLEXURAL BOND LENGTH,
AND DEVELOPMENT LENGTH
Transfer length, lt, is defined as the length from the free end of the member to the
point along the length of the beam where the effective prestress in the strand is fully
transferred to the concrete. The stress in the strand along the length of the transfer length
is assumed to vary linearly from zero at the free end to fpe, the effective prestress after
losses, at the end of the transfer length.
Flexural bond length, lfb, is defined as the length of fully bonded strand beyond
the transfer length that is required to fully develop the stress in the strand to fps, the
ultimate stress at nominal flexural capacity, when load is applied to the member.
Development length, ld, is the sum of the transfer length and flexural bond length.
The transfer length, flexural bond length, and development length are illustrated in
Figure 2.1.
Additionally, the term embedment length, le, is discussed frequently in this report.
Embedment length is the distance from the free end of the beam to the point along the
strand where the cross-section of the member is being assessed for strength. This is often
the closest point from the end of the strand to where the critical cross-section is, or where
the maximum moment is in the member, and the point where the strand would need to be
fully developed to maximum nominal flexural resistance. To investigate development
length, a beam is typically loaded with a point load, and the embedment length is the

B-7
distance from the free end of the beam to the point load. If the beam fails in flexure, the
strand is fully developed and the embedment length is greater than the development
length, but if the beam fails in bond, the embedment length is shorter than what is needed
to fully develop the strand.
Figure 2.1 – Variation of Stress in a Strand Along the Length of a Beam (Adapted from ACI 318-11)
2.3. BOND THEORY
Combinations of several factors have been shown to contribute to bond of
prestressing strand to concrete. Depending on the circumstances, adhesion, Hoyer effect,
and mechanical interlocking can act singly or in combinations to resist slippage of the
strand in concrete (Russell and Burns 1993). Research completed by Janney (1953)
regarding bond of plain wires and strand in concrete led him to conclude that friction is a
fps
fpe
lt lfb
ld
Distance from Free End of Strand
At nominal strength of member
Prestress only

B-8
major contributor to bond. While friction is not individually discussed in this section,
friction plays a large role in both the Hoyer effect and mechanical interlocking.
2.3.1. Adhesion. Adhesion is the thin layer of glue that chemically forms
between the strand and the concrete. As soon as the strand slips, adhesion is lost, and the
bond stress that had been contributed by adhesion goes to zero and is transferred to other
bond mechanisms. Since the transfer zone is characterized by the strand moving relative
to the concrete, adhesion does not contribute to the bond in the transfer zone (Russell and
Burns 1993).
2.3.2. Hoyer Effect. In the transfer zone, a major contributor to bond is a
factor known as the Hoyer effect. As a strand is stressed, the strand becomes longer, but
also thinner due to Poisson’s effect. When the strand is cut, the release of the stress
causes the wires in the strand to expand back to their original forms, but this expansion is
resisted by the concrete. As a result, wedging action occurs between the strand and
concrete as the strand produces a normal force on the concrete from radial expansion, and
the resulting friction resists the movement of the strand into the concrete (Figure 2.2).
Figure 2.2 – Hoyer Effect (Adapted from Russell and Burns 1993)
The Hoyer effect is only applicable in the transfer zones because the radial
expansion only occurs at the ends where the strand slips relative to the concrete. Once an
outside load is applied, as the wave of stress that starts at the maximum moment zone
gets pushed into the transfer zone, the stress in the strand increases and the strand

B-9
becomes thinner again. The frictional forces from Hoyer effect decrease and mechanical
interlock is then the only force resisting bond.
2.3.3. Mechanical Interlock. When concrete is cast around prestressing strand,
the concrete molds around the strand and between the grooves of the wires. When the
strand tries to move through the concrete and untwist due to release of stress, the concrete
ridges formed between the wires resist the movement. This effect is known as mechanical
interlock. While some of this friction helps bond the strand in the transfer zone,
mechanical interlock is the main form of resistance in flexural bond (Russell and Burns
1993).
2.4. FACTORS AFFECTING TRANSFER AND DEVELOPMENT LENGTHS
Over the years, many studies have been completed regarding transfer length and
development length of prestressing strands, and although the current equations are
functions of only stress in the strand after losses and at ultimate as well as nominal strand
diameter, many other factors have also been proven to affect bond. Zia and Mostafa
(1977) conducted an extensive literature review on previous testing regarding
development length and attempted to pinpoint the many factors that affect bond. Based
on their findings, some of the factors that have been found to influence transfer length
and development length include:
1. Strand size (diameter)
2. Strand stress level
3. Concrete strength
4. Time dependent effects (losses)
5. Type of release (gradual or sudden)
6. Consolidation and consistency of concrete around strand
7. Surface condition of strand (clean, rusted, epoxy-coated)
8. Confinement
9. Cover and spacing
10. Type of strand (stress relieved, low relaxation)
11. Type of loading (static, repeated, impact)

B-10
The effects of the first six factors are briefly discussed below.
2.4.1. Strand Size. It is commonly accepted that an increase in strand
diameter results in an increase in transfer and development lengths. Kaar, LaFraugh, and
Mass (1963) were some of the first researchers to document this aspect. Based on transfer
length testing of 0.25-in., 0.375-in., 0.5-in., and 0.6-in.-diameter (6.35 mm, 9.53 mm,
12.7 mm, and 15.2 mm) strands, it was noted that larger diameter strands yielded longer
transfer lengths, and the relationship between strand diameter and transfer length at
release was approximately linear (Kaar, et al. 1963). Based on this research, the direct
relationship between strand diameter and transfer length was adopted into current code
equations for transfer length and development length.
2.4.2. Steel Stress Level. With an increase of initial stress in the strand, the
surface area that is required to transfer the stress to the concrete also increases, resulting
in longer transfer lengths. The current equations for transfer and development lengths are
based on fse, or effective stress after all losses. While this is reasonable for flexural bond
length, it has been noted that the use of fse does not necessarily seem applicable to
transfer length at release, and that fsi, or the stress in the strand immediately after release
instead of after all losses, should instead be applied to the calculation of transfer length
(Buckner 1995). This approach would result in longer, more conservative transfer length
calculations. As discussed, the equation for transfer length was developed based on
research performed in the 1950’s and 60’s using Grade 250 strands which were also
stressed to lower levels than what is commonly used today theoretically rendering the
equation unconservative for today’s use. Some researchers have proposed equations for
transfer length expressed as a function of fsi instead of fse (Zia and Mostafa 1977,
Buckner 1995), but research has not consistently shown that the current equation is, in
fact, unconservative, so no changes have yet been made to the current AASHTO and ACI
equations.
2.4.3. Concrete Strength. Although the study performed by Kaar, LaFraugh, and
Mass in 1963 indicated that concrete strength had little effect on transfer length, many
studies since have proven the correlation between high concrete strengths and decreased
transfer lengths. The bond over the transfer length is primarily due to friction between the
strand and the concrete caused by radial expansion of the strand at release that occurs due

B-11
to Poisson’s effect. According to Barnes et al. (2003), this friction depends on how well
the concrete surrounding the strand reacts to the pressure caused by the increasing
circumference. The release results in radial cracking in the concrete surrounding the
strand, which softens the concrete. Therefore, a higher tensile strength and stiffness
means the concrete can respond better to the radial expansion, resulting in better friction
and shorter transfer lengths. Since the ACI 318-11 Sections 8.5.1 and 9.5.3.2 show that
modulus of elasticity and modulus of rupture are directly related to the square root of
concrete strength, it follows that transfer length should also be related to the square root
of concrete strength at release (Barnes et al. 2003).
While Kaar, LaFraugh, and Mass only studied concrete release strengths up to
5,000 psi (34.5 MPa), today’s release strengths can range to over 10,000 psi (68.9 MPa).
Many researchers, including Mitchell et al. (1993), Lane (1998), and Ramirez and Russell
(2008), have since published studies relating increased concrete strengths to decreased
transfer lengths. The studies have also resulted in a number of proposed, revised
equations for transfer length and development length (Zia and Mostafa 1977, Mitchell et
al. 1993, Lane 1998, Ramirez and Russell 2008), almost all of which relate transfer
length to the square root of concrete compressive strength. However, much debate still
exists over the exact effect of concrete strength on transfer and development lengths, and
since the current equation is considered conservative for high concrete strengths, there is
no immediate rush to update the equation.
2.4.4. Time Dependent Losses. Research has shown that transfer lengths tend
to increase over time. Barnes et al. (2003) suggested although stress in the strand
decreases over time due to losses, transfer lengths still do not decrease over time because
of the inelasticity of the concrete immediately surrounding the strand. The increases in
transfer lengths are most likely due to propagation of the radial cracking and the resulting
softening of the concrete grip (Barnes et al. 2003). Transfer lengths measured by Kaar,
LaFraugh, and Mass showed average increase in transfer lengths of 6% over one year,
with the maximum increase being 19% (1963). In FHWA research, transfer lengths of 32
AASHTO Type II beams increased 30% in 28 days and then an additional 7% between
28 and 185 days (Lane 1998). Research by Barnes et al. (2003) showed 28 day average
transfer lengths increases of 10-20%, with some individual increases as high as 50%.

B-12
Also, Boehm et al. (2010) reported 0.5-in.-diameter (12.7 mm) strands in conventional
concrete had a 38% increase in transfer length over three months.
2.4.5. Type of Release. Sudden release methods, such as flame cutting, have
been proven to result in longer transfer lengths than more gradual release methods, such
as detensioning. In their review of data from previous studies for the establishment of a
new development length equation, Zia and Mostafa separately plotted transfer lengths vs.
the ratio of the initial stress in the strand at release to concrete strength at release (fsi/f’ci)
for ends exposed to sudden release and ends exposed to gradual release and found that for
a given fsi/f’ci value, the transfer lengths from sudden release were longer than transfer
lengths from gradual release (1977).
Similarly, transfer lengths have also been shown to be longer at live ends, or
locations where the strand is first cut to relieve tension, as opposed to dead ends, or ends
not directly adjacent to the first release point in the strand. Kaar, LaFraugh, and Mass
found that for strands up to 0.5-in. (12.7 mm) in diameter, live end transfer lengths
averaged 20% longer than dead end transfer lengths, while 0.6-in.-diameter (15.2 mm)
strands showed a 30% increase from dead to live ends (1963). For uncoated strands,
Cousins et al. (1990) found that transfer lengths at live ends for 0.5-in. and 0.6-in.-
diameter (12.7 mm and 15.2 mm) strands averaged 8% higher than dead ends, while
0.375-in.-diameter (9.53 mm) strands actually had live end transfer lengths 6% shorter
than the dead ends. Additionally, Russell and Burns (1997) reported live end transfer
lengths to be 34% longer than dead end transfer lengths.
2.4.6. Consolidation and Consistency of Concrete around Strand. As the use
of new types of concrete, such as SCC, becomes more prevalent, the properties of the
concrete surrounding the strand is becoming an increasingly important topic. Since SCC
is not mechanically vibrated, it is still being debated whether the flowable nature of SCC
results in adequate consolidation around the strand, or if it could actually improve the
condition of consolidation around the strand compared to vibrated conventional concrete
(Larson et al. 2007). Several studies reporting conflicting results on the effect of SCC on
bond of prestressing strand are discussed in Section 2.7 of this report.
Related to the aspect of condition of concrete surrounding the strand is the subject
of strand locations in members. ACI-318-11 and the AASHTO LRFD-07 code account

B-13
for the “top bar effect” for mild deformed reinforcing bars, which implies that bars
located in the top of a member during casting have longer development lengths than bars
located at the bottom. This phenomenon has been attributed to various reasons, including
bleed water and air getting trapped on the bottom surfaces of the top bars (Peterman
2007) and the idea that concrete-bar friction results mainly from concrete consolidated
above bars than immediately below (Wan et al. 2002). In a research study by Petrou and
Joiner (2000), end slips of strands in prestressed piles from five plants were analyzed, and
top strands were found to have end slips an average of 2.3 times longer than bottom
strands, with some instances showing end slips of top strands up to 4-5 times longer. In a
subsequent research program, Wan measured end slips of strands in 32 18-in.-square (457
mm) concrete piles and noted that top-cast strands had average end slips of 0.140 in.
(3.56 mm), while bottom-cast strands had end slips of only 0.058 in. (1.47 mm) (2002).
However, ACI and AASHTO currently have no provision for increasing development
lengths of prestressing strands located in the top of a member. A 1.3 multiplier was
suggested by Buckner (1995) and Lane (1998) and incorporated to Section 5.11.4.2 of the
AASHTO code shortly after, but the provision has since been removed (Peterman 2007).
2.5. ACI AND AASHTO CODE EQUATIONS
The AASHTO LRFD Bridge Design Specifications (2007), which shall hereby be
referred to as the AASHTO code, is the governing document for the design of prestressed
bridge girders used by the Missouri Department of Transportation, so the AASHTO
equations for transfer length and development length were used as the basis for the
analyses in this program. Additionally, results were compared to values determined by
equations in ACI’s Building Code Requirements for Structural Concrete, or ACI 318-11.
This subsection identifies the relevant code equations and discusses the backgrounds
behind the equations.
2.5.1. AASHTO LRFD Bridge Design Specifications. The guidelines for the
development of prestressing strand can be found in Section 5.11.4 of the AASHTO code.
Although there is no specific equation for transfer length in the AASHTO code, Section
5.11.4.1 states that “the transfer length may be taken as 60 strand diameters.” Therefore,

B-14
the AASHTO equation for transfer length in inches, lt, can be represented by Eq. 2.1,
where db is the nominal diameter of the strand in inches.
60 (2.1)
In terms of development length, Section 5.11.4.2 of AASHTO then defines the
minimum development length in Eq. 5.11.4.2-1, which is shown here as Eq. 2.2, where ld
is the development length in inches, κ is a multiplier of 1.0 for members with depth less
than or equal to 24 in. (610 mm) and 1.6 for members deeper than 24 in. (610 mm), fps is
the average stress in the prestressing steel at the time for which the nominal resistance of
the member is required in ksi, fpe is the effective stress in the prestressing steel after
losses in ksi, and db is the nominal strand diameter in inches.
κ
23
(2.2)
The 1.6 multiplier for deep members is based on research performed by Shahawy
(2001), which indicated a relationship between shear and bond. Three-point load tests
were performed on 83 prestressed pile specimens with six different cross-sections and 12
AASHTO Type II girders at varying embedment lengths and shear spans, and the
slippage of strands, applied moments, and final failure modes were noted. These tests
indicated that members with depths greater than 24 in. (610 mm) needed development
lengths up to 50% longer than those predicted by the original AASHTO equation, or Eq.
2.2 without the κ factor. Shahawy came to the conclusion that for deep members, the
shear-flexural interaction has a significant effect on development length, and he proposed
a new development length equation with factors to take into account the effect of shear
on strand slippage before failure. AASHTO did not adopt the proposed equation, but
based on the research, added a 1.6 multiplier for members with a depth greater than 24 in.
(610 mm) to the development length equation, which when applied to Shahawy’s
research results, proved to give mostly conservative results.
B-15
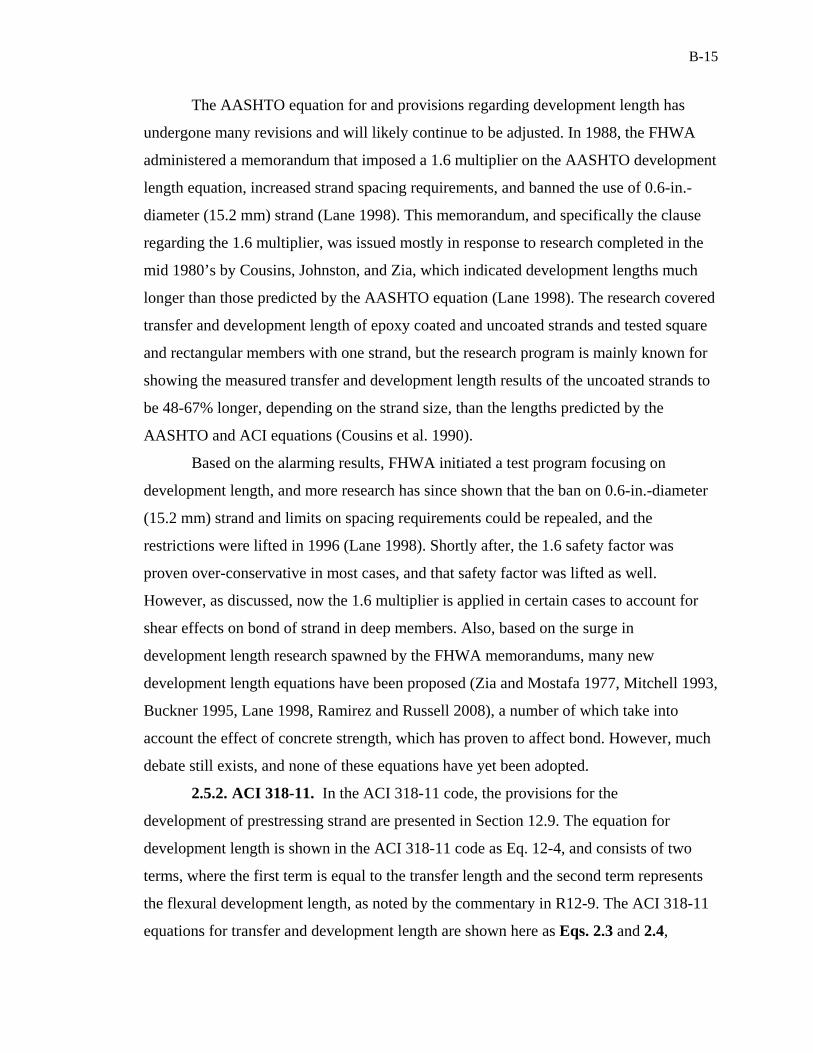
The AASHTO equation for and provisions regarding development length has
undergone many revisions and will likely continue to be adjusted. In 1988, the FHWA
administered a memorandum that imposed a 1.6 multiplier on the AASHTO development
length equation, increased strand spacing requirements, and banned the use of 0.6-in.-
diameter (15.2 mm) strand (Lane 1998). This memorandum, and specifically the clause
regarding the 1.6 multiplier, was issued mostly in response to research completed in the
mid 1980’s by Cousins, Johnston, and Zia, which indicated development lengths much
longer than those predicted by the AASHTO equation (Lane 1998). The research covered
transfer and development length of epoxy coated and uncoated strands and tested square
and rectangular members with one strand, but the research program is mainly known for
showing the measured transfer and development length results of the uncoated strands to
be 48-67% longer, depending on the strand size, than the lengths predicted by the
AASHTO and ACI equations (Cousins et al. 1990).
Based on the alarming results, FHWA initiated a test program focusing on
development length, and more research has since shown that the ban on 0.6-in.-diameter
(15.2 mm) strand and limits on spacing requirements could be repealed, and the
restrictions were lifted in 1996 (Lane 1998). Shortly after, the 1.6 safety factor was
proven over-conservative in most cases, and that safety factor was lifted as well.
However, as discussed, now the 1.6 multiplier is applied in certain cases to account for
shear effects on bond of strand in deep members. Also, based on the surge in
development length research spawned by the FHWA memorandums, many new
development length equations have been proposed (Zia and Mostafa 1977, Mitchell 1993,
Buckner 1995, Lane 1998, Ramirez and Russell 2008), a number of which take into
account the effect of concrete strength, which has proven to affect bond. However, much
debate still exists, and none of these equations have yet been adopted.
2.5.2. ACI 318-11. In the ACI 318-11 code, the provisions for the
development of prestressing strand are presented in Section 12.9. The equation for
development length is shown in the ACI 318-11 code as Eq. 12-4, and consists of two
terms, where the first term is equal to the transfer length and the second term represents
the flexural development length, as noted by the commentary in R12-9. The ACI 318-11
equations for transfer and development length are shown here as Eqs. 2.3 and 2.4,

B-16
respectively, where lt is the transfer length in inches, ld is the development length in
inches, fse is the effective stress in the prestressing steel after losses in psi, fps is the stress
in the prestressing steel at the nominal flexural strength in psi, and db is the nominal
diameter of the strand in inches.
3000
(2.3)
3000 1000 (2.4)
It should be noted that the ACI equation for development length (Eq. 2.4) is equal
to the AASHTO equation for development length (Eq. 2.2) when the depth of the
member is less than or equal to 24 in. (610 mm).
ACI 318-11 also provides an additional equation for transfer length for the shear
design of prestressed members. In Section 11.3.4, ACI 318-11 requires that shear designs
of prestressed members be based on a reduced stress in the strand for sections of a
member that are closer to the support than the transfer length. For this design, the transfer
length is to be taken as 50 times the nominal diameter of the strand. This additional ACI
transfer length equation is presented here as Eq. 2.5, where lt is the transfer length in
inches and db is the nominal diameter of the strand in inches.
50 (2.5)
2.5.3. Background of the AASHTO and ACI Development Length Equations.
As discussed, although the AASHTO and ACI equations for development length (Eq. 2.2
and Eq. 2.4, respectively) are formatted differently, they are essentially the same
equation (when к = 1.0 for Eq. 2.2). The equation was first incorporated into ACI-318 in
1963, and AASHTO also adopted it 10 years later. According to an extensive study
conducted by Tabatabai and Dickson (1993) on the origins of the equation, the basis of
the equation stems from research conducted by Hanson and Kaar and Kaar, LaFraugh,
and Mass for the Portland Cement Association (PCA) in the 1950’s and 1960’s. The

B-17
studies were conducted with 250 ksi (1.72 GPa), stress relieved strands, which were
stressed to 60%-70% of capacity and cast in concrete strengths up to 5,500 psi (34.5
MPa). Majority of today’s prestressed members are constructed with 270 ksi (1.86 GPa),
low relaxation strands that are often subjected to higher initial stresses and cast in
concrete with higher strengths. These differences between practices today vs. practices
decades ago could be cause for concern as to whether the design equations derived on
outdated construction methods can still adequately apply to members today.
Hanson and Kaar tested 0.25-in., 0.375-in., and 0.5-in.-diameter (6.4 mm, 9.5
mm, and 12.7 mm) Grade 250 prestressing strands in members at varying embedment
lengths. Although Hanson and Kaar recommended minimum embedment lengths based
on their research, the current transfer length and development length equations were
actually developed by Alan H. Mattock. The values calculated from Mattock’s equations,
which are based on Hanson and Kaar’s data and findings, are actually less conservative
than Hanson and Kaar’s recommendations (Tabatabai and Dickson 1993).
Based on the assumption that the force in the steel must equal the transfer bond
force, Mattock used Eq. 2.6 to solve for transfer length in inches, Lt, where Ut is the
average bond stress in ksi, Σ0 is the circumference of the prestressing strand in inches, Aps
is the area of prestressing strand in ksi, and fse is the effective stress in the strand after
losses in ksi.
(2.6)
Ut was assumed to be 0.4 ksi (2.76 MPa) based on the data from Hanson and
Kaar, and Σ0 and Aps were taken to be 4/3πD and 0.725πD2/4, respectively, where D is
the nominal diameter of the strand in inches, to account for the actual circumference and
area of the prestressing strand. Substituting these values into Eq. 2.6 yielded Eq. 2.7,
which is equal to the current transfer length equation specified by ACI.
D3
(2.7)

B-18
It should be noted that the basis for the transfer length equation is an average of
the results from Hanson and Kaar, and is not meant to be conservative. The same is true
of the equation derived for flexural development length. When evaluating flexural bond
length, for each specimen, Mattock plotted the increase in steel stress from the effective
prestress at the point of general bond slip (fsb – fse) and the increase in steel stress from
the effective prestress at ultimate failure (fsu – fse) vs. the embedment length minus the
transfer length divided by the nominal diameter, as seen in Figure 2.3. The trend line is
presented in Eq. 2.8, and as shown in Figure 2.3, in many cases the line runs above the
point of general bond slip but below ultimate failure. According to Mattock, the line is “a
reasonable mean line for general bond slip” (Tabatabai and Dickson 1993).
∗ 0.9D
(2.8)
Conversion: 1 ksi = 6.89 MPa 1 in. = 25.4 mm
Figure 2.3 – Original Representation of Flexural Bond Length
(adapted from Tabatabai and Dickson, 1993)
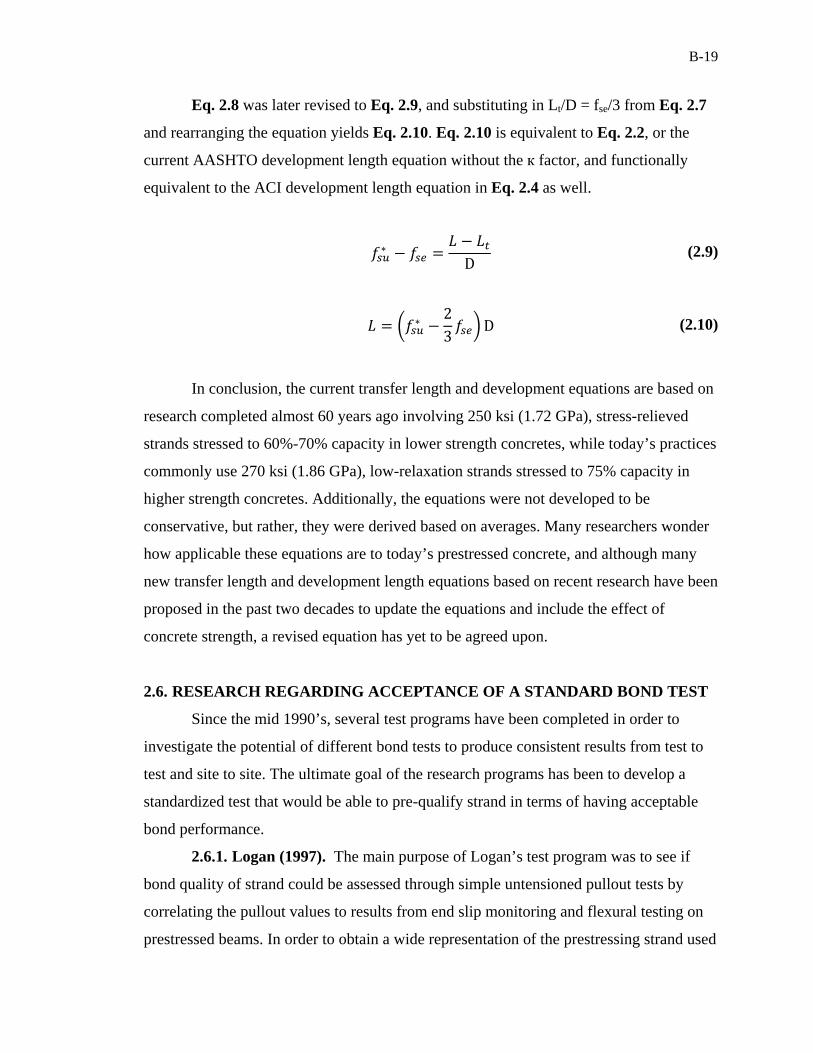
B-19
Eq. 2.8 was later revised to Eq. 2.9, and substituting in Lt/D = fse/3 from Eq. 2.7
and rearranging the equation yields Eq. 2.10. Eq. 2.10 is equivalent to Eq. 2.2, or the
current AASHTO development length equation without the к factor, and functionally
equivalent to the ACI development length equation in Eq. 2.4 as well.
∗D
(2.9)
∗ 23
D (2.10)
In conclusion, the current transfer length and development equations are based on
research completed almost 60 years ago involving 250 ksi (1.72 GPa), stress-relieved
strands stressed to 60%-70% capacity in lower strength concretes, while today’s practices
commonly use 270 ksi (1.86 GPa), low-relaxation strands stressed to 75% capacity in
higher strength concretes. Additionally, the equations were not developed to be
conservative, but rather, they were derived based on averages. Many researchers wonder
how applicable these equations are to today’s prestressed concrete, and although many
new transfer length and development length equations based on recent research have been
proposed in the past two decades to update the equations and include the effect of
concrete strength, a revised equation has yet to be agreed upon.
2.6. RESEARCH REGARDING ACCEPTANCE OF A STANDARD BOND TEST
Since the mid 1990’s, several test programs have been completed in order to
investigate the potential of different bond tests to produce consistent results from test to
test and site to site. The ultimate goal of the research programs has been to develop a
standardized test that would be able to pre-qualify strand in terms of having acceptable
bond performance.
2.6.1. Logan (1997). The main purpose of Logan’s test program was to see if
bond quality of strand could be assessed through simple untensioned pullout tests by
correlating the pullout values to results from end slip monitoring and flexural testing on
prestressed beams. In order to obtain a wide representation of the prestressing strand used

B-20
in the western hemisphere, Logan collected samples of strand from six sources from
across the country.
First, pullout tests based on the method created by Saad Moustafa were run on
each strand source. Six strands from each source were cast vertically with an 18 in. (457
mm) embedment length in a block of standard structural concrete. The blocks were cured
overnight, and then a jack was used to pull out each strand until the peak load could no
longer be sustained. Four of the six samples had average maximum pullout loads ranging
from 36.8 kips to 41.6 kips (164 kN to 185 kN), while the other two sources had average
values of 11.2 (49.8 kN) and 10.7 kips (47.6 kN). When these results were compared to
the performance of the strands in the end slip and flexural testing of the beams, the beams
with the four strands with high pullout values had transfer and development lengths less
than predicted by ACI 318-95, while the beams with the strands with low pullout
capacities failed in bond, meaning the transfer length and development lengths predicted
by ACI 318-95 were unconservative for those strands. Based on these results, Logan
proposed lowering the minimum pullout value from 38.2 kips (170 kN), as determined by
Moustafa, to 36 kips (160 kN) because the strands with pullout values of 37.7 kips (168
kN) and 36.8 kips (164 kN) performed well in the beam testing. Logan suggested that this
minimum pullout limit could be even further reduced, but further testing would have to
be done on strands with pullout capacities between 11.2 kips (49.8 kN) and 36.8 kips
(164 kN).
In order to test the transfer length and development length of the strands, 17-ft.-
long (5.18 m) beams with 6.5 in. x 12 in. (165 mm x 305 mm) cross-sections and one
strand located at 2 in. (50.8 mm) from the bottom were constructed. The end slips of the
strands into the concrete at release were measured, and then the end slip values were used
in conjunction with Mast’s strand slip theory to calculate transfer lengths. The calculated
transfer lengths were then compared to transfer lengths calculated by the equation in ACI
318-95. Each end of the beam was then tested in flexure at a different embedment length,
and it was noted whether each test resulted in either a flexural or bond failure. By
comparing the transfer lengths calculated by end slip to the calculated and actual moment
capacities, it was found that Mast’s strand slip theory accurately predicted which beams
failed in bond and which failed in flexure.

B-21
Logan also investigated whether factors such as color, noticeable residue, rust,
and pitch of the outer strands could be used to predict bond quality. Before each of the
pullout tests, Logan noted the color and rust of the strands, wiped a clean towel over each
strand to visually quantify the amount of residue on each, and measured the pitch of the
outside wires, or the distance for one wire to make a complete revolution around the
strand. Overall, Logan found no strong correlation between any of the factors and the
pullout capacities of the strands, so it was concluded that neither color, residue, rust, nor
pitch can be considered a reliable predictor of bond.
2.6.2. Rose and Russell (1997). The research program was designed to evaluate
the effectiveness of three test methods that could be used to assess the bond of
prestressing strand. Data from simple untensioned direct tension pullout tests,
pretensioned direct pullout tests, and measured end slips and transfer lengths on beams
were used to determine the relative bond performance of Grade 270 0.5-in.-diameter
(12.7 mm) strands from different manufacturers and having different surface conditions
of as-received, cleaned, silane treated, and weathered. The ultimate goal was to see if one
test could be considered superior.
The simple untensioned pullout tests were based on Logan’s method (1997) and
consisted of strands cast vertically with 18 in. (457 mm) of embedment length in 2 ft. x 3
ft. x 4 ft. (610 mm x 914 mm x 1,219 mm) blocks of concrete. The tensioned pullout
tests had 5.5 in. (127 mm) square cross-sections and were 12 in. (305 mm) in length with
12 in. (305 mm) embedment. It was thought that the tensioned pullout tests would more
closely represent the bond in prestressed members because these tests would include the
Hoyer effect resulting from the release of tension. The beams used for end slip and
transfer length measurements had 6 in. x 12 in. (152 mm x 305 mm) cross-sections and
were 17 ft. (5.18 m) in length, except for the beams with the silane-treated strand, which
were 24 ft. (7.32 m) long. Each beam contained two strands, and the beams were
instrumented so that strain readings could be taken with a detachable mechanical strain
gage (DEMEC gage). The 95% Average Mean Strain Method was then used to analyze
the transfer lengths.
Ultimately, it was concluded that the end slip measurements consistently gave the
most accurate assessment of bond. The greater the end slip, the longer the transfer length,

B-22
and the typical equation was found to be adequate. In terms of the pullout tests, the
simple untensioned test was found to be better than the tensioned pullout test, but no
strong correlation existed between the simple pullout results and the transfer lengths. The
tensioned pullout test was found to be difficult to set up and run and also yielded
inconsistent results. Except for the silane treated strand, the simple tension test showed
that the lower the maximum pullout value, the higher the transfer length. The silane-
treated strand showed adequate bond performance in the simple pullout test, but had the
largest measured transfer lengths. Therefore, it was concluded that simple untensioned
pullout test mirroring Logan’s method is still not an overly reliable predictor of bond.
2.6.3. NASP Bond Testing Rounds I-IV. In the late 1990’s, the North
American Strand Producers (NASP) funded a research project to compare tests designed
to assess strand bond and ultimately determine a test suitable for strand bond acceptance.
This project consisted of several rounds of testing and was based out of the University of
Oklahoma (OU).
The first round of testing compared the Moustafa test, the PTI bond test, and the
friction bond test (Russell and Paulsgrove 1999a). From the results, it was determined the
friction bond test gave inconclusive and inconsistent results, so in Rounds II and III,
researchers continued to investigate the Moustafa Test and the PTI test, but in these
rounds, the friction bond test was discarded and the NASP bond test was added. The
NASP bond test was similar to the PTI test, but a mortar with Type III cement, sand, and
water was used in place of the grout of Type I cement and water that was specified by the
PTI test. The addition of sand made the mix stiffer and minimized shrinkage (Russell and
Paulsgrove 1999b).
In Round II, in order to determine the repeatability and reproducibility of the three
tests, several series of the three tests were completed at different locations. The Moustafa
test was run at Stresscon in Colorado, the Florida Wire and Cable Company (FWC), and
OU, while the PTI and NASP tests were only completed at FWC and OU.
One conclusion that was reached from the Round II of testing was that results
indicated that the Moustafa test was a good predictor of relative bond but was not a good
absolute predictor of bond; the rank of strands was always the same at each site, but the
specific pullout values did not correlate well between sites. This conclusion was further

B-23
confirmed in Round III of testing. In terms of the NASP bond test vs. the PTI test, the
NASP test showed slightly more consistent results. For both tests, it was noted that the
pullout values had the least variation at a slip of 0.1 in. (2.54 mm). For this slip, plotting
results comparing NASP test series from OU and FWC resulted in coefficients of
determination (R2 values) of 0.97 and 0.98, indicating a strong correlation of test results
between tests at the same site as well as between sites, as seen in Table 2.1. These
coefficients of determination were significantly higher than R2 values derived from
comparing results from different sites for either the Moustafa or PTI test (Table 2.1).
Therefore, a main conclusion from this round of testing was that the NASP bond test was
standing out as the most replicable of the three (Russell and Paulsgrove 1999b).
Table 2.1 – NASP Round II R2 Values Comparing Moustafa, PTI, and NASP Pullout Results Between Sites (Russell and Paulsgrove 1999b)
Round III of the testing included flexural beam specimens, and one of the main
goals was to see if transfer lengths and development lengths could be correlated to
pullout values from the three tests to determine if absolute limits of pullout values could
be set for any of the tests. Single strand beams and double strand beams were constructed
at OU and FWC with strand from four different sources. Transfer lengths were computed

B-24
by measuring the strand draw-in at release and at 28 days. Table 2.2 shows the R2 values
correlating 28 day transfer length to pullout values for the three tests. The Moustafa test
had generally low correlations across the board, while the PTI test had low correlations at
one site but high correlations at the other. The NASP test had consistently reasonable
correlations at both sites for both beam types. Comparing the pullout values to 28 day
transfer lengths further strengthened the argument for focusing further research on
developing the NASP bond test (Hawkins and Ramirez 2010).
Table 2.2 – Round III Coefficient of Variation (R2) Values Relating 28 Day Transfer Lengths to Bond Test Pullout Values (adapted from Hawkins and Ramirez 2010)
Test
OU FWC Single Strand
Transfer Lengths
Double Strand Transfer Lengths
Single Strand Transfer Lengths
Double Strand Transfer Lengths
Moustafa Pullout Values
0.50 0.50 0.73 0.87
PTI Pullout Values
0.52 0.29 0.95 0.84
NASP Pullout Values
0.83 0.73 0.98 0.76
In order to evaluate development length, each end of each beam was tested in
four-point loading at an embedment length of either 73 in. (1,854 mm) or 58 in. (1,473
mm) and the mode of failure was noted. The results are summarized in Table 2.3 for the
single strand beams and Table 2.4 for the double strand beams. N corresponds to tests
completed at 73 in. (1,854 mm) embedment, and S represents tests completed at 58 in.
(1,473 mm) embedment. Bond failures indicated that the embedment length was not
sufficient to develop sufficient stress in the strand, and the results from the development
length testing were used to help set 10,500 lb. (46.7 kN) average pullout value and 9,000
lb. (40.0 kN) individual pullout value minimum limits for bond acceptance for the NASP
test (Hawkins and Ramirez 2010).
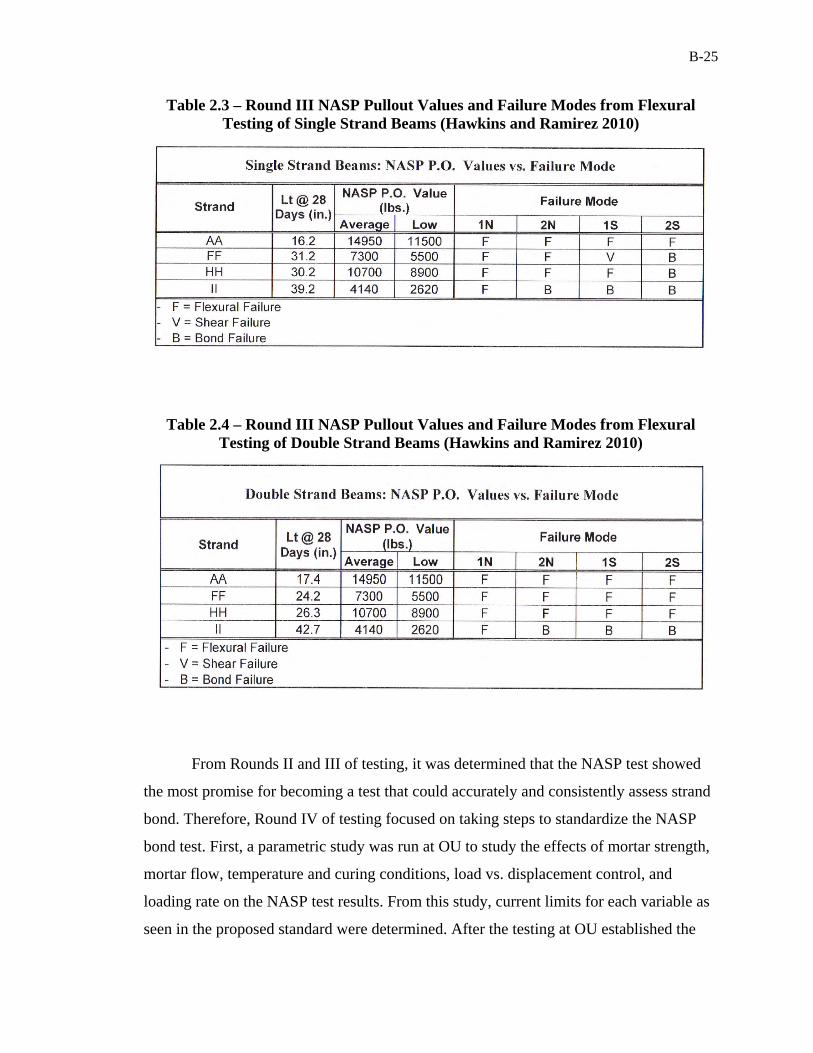
B-25
Table 2.3 – Round III NASP Pullout Values and Failure Modes from Flexural Testing of Single Strand Beams (Hawkins and Ramirez 2010)
Table 2.4 – Round III NASP Pullout Values and Failure Modes from Flexural Testing of Double Strand Beams (Hawkins and Ramirez 2010)
From Rounds II and III of testing, it was determined that the NASP test showed
the most promise for becoming a test that could accurately and consistently assess strand
bond. Therefore, Round IV of testing focused on taking steps to standardize the NASP
bond test. First, a parametric study was run at OU to study the effects of mortar strength,
mortar flow, temperature and curing conditions, load vs. displacement control, and
loading rate on the NASP test results. From this study, current limits for each variable as
seen in the proposed standard were determined. After the testing at OU established the

B-26
more specific standard limits and procedures, round robin testing was completed on
several strand samples at OU, Purdue University, and University of Arkansas to see how
well the test would replicate between sites using various cement and sand sources.
Plotting the NASP results from Purdue and University of Arkansas to results from OU
resulted in R2 values of 0.92 and 0.89, respectively, and trends from both comparisons
were very close to the “perfect fit” line, or the same pullout load from both sites. From
these observations, it was concluded that the NASP test is reproducible and can be
replicated from site to site with acceptably consistent results (Russell 2006).
2.6.4. Ramirez and Russell (2008). As part of the testing done for the National
Cooperative Research Program (NCHCP) Report 603, Ramirez and Russell investigated
bond and corresponding transfer and development lengths of 0.5-in. and 0.6-in.-diameter
(12.7mm and 15.2mm) prestressing strand in high strength concretes. Due to the recent
increase in use of high strength concrete, the main purpose of this program was to
investigate the effect of concrete strength on bond of prestressing strands and propose
revised transfer and development length equations to AASHTO.
Eight I-shaped beams and 43 rectangular beams were constructed using four
strand sources and concretes with one day target strengths ranging from 4 to 10 ksi (27.5
to 68.9 MPa) to monitor transfer lengths through DEMEC readings and end slips and to
evaluate development lengths through four-point flexural testing at varying embedment
lengths. Another goal of the research program was to refine and standardize the NASP
test, and Rounds III and IV of NASP round-robin testing were completed as a part of this
test program. Additionally, a modified NASP test in concrete was also implemented to
determine how concrete strength directly affects bond.
From their research, Ramirez and Russell concluded that increasing concrete
strength results in improved bond performance. Pullout values for the modified NASP in
concrete test increased as concrete strength increased, and members with high concrete
strength displayed shorter transfer lengths. In terms of bond, the results from this
program showed the NASP test in mortar to be a good indicator of bond performance.
The pullout results from the standard NASP test in mortar correlated well with transfer
and development length results; strands with high NASP pullout values consistently had
shorter transfer and development lengths.

B-27
Ultimately, based on their results, the research team made recommendations to
AASHTO for updates to the bond, transfer, and development provisions in the code.
First, the report proposed new transfer and development length equations, which take into
account the effect of concrete strength. Additionally, the researchers recommended that
the NASP test be accepted as the Standard Test for Strand Bond and implemented to
control bond quality of strands. However, to date, no official revisions have yet been
made to the AASHTO code.
2.6.5. Current Status and Recent Developments. Currently, Logan’s
modified Moustafa test, now known as the Large Block Pullout Test (LBPT), is required
to be conducted in PCI member plants to assure the bond quality of strand
(Precast/Prestressed Concrete Institute 2003). However, as the current research has
shown, LBPT results are difficult to reproduce from site to site, and the NASP test is
proving to be more reliable than the LBPT. Although the NASP test shows promise for
becoming the “Standard Test Method to Assess the Bond of 0.5-in. (12.7 mm) and 0.6-in.
(15.2 mm) Seven Wire Strand with Cementitious Material,” a due diligence report
conducted on the four rounds of testing came to several conclusions that show more
testing is required before the test is accepted as a standard (Hawkins and Ramirez 2010).
First, since Round IV testing exposed the NASP test’s sensitivity to mortar flow
and strength, it can be assumed that sand angularity can also have a significant effect on
results. Hawkins and Ramirez suggest that a range of angularity be specified since
angularity greatly affects workability. Also, although the goal of Round IV round robin
testing was to prove that the test was reproducible between sites, Hawkins and Ramirez
deemed the results as not “statistically defensible,” and suggested that more testing be
done at between four to six independent sites. They also recommend that more
development length testing be done to identify pullout limits (Hawkins and Ramirez
2010). A research program funded by PCI addressing these issues about the NASP test is
currently beginning to get underway at the time of this report.
Although the NASP test appears to be the front runner for becoming the standard
bond test, recent developments with the LBPT have shown that the test may still be
potentially viable as a reproducible test. Based on a recent, unpublished study, Logan has
discovered a correlation between soft limestone coarse aggregates and low pullout values,

B-28
and test results have suggested that using a coarse aggregate with a Mohs hardness value
of 6.0 or higher will improve the consistency of results (Logan, personal communication,
October 20, 2011). Further testing needs to be completed in order to determine if the
standardization of the hardness of the coarse aggregate will truly improve reproducibility
of the LBPT from site to site.
2.7. RESEARCH REGARDING BOND OF PRESTRESSING STRAND IN SCC
As the use of SCC has become more and more popular, an increasing number of
studies have been completed in order to investigate the bond of prestressing strand in
SCC. In these studies, transfer and development lengths of prestressing strand in SCC
were compared to the lengths measured in conventional concrete to determine if bond
behavior between the two concretes is comparable. Experimentally determined transfer
and development lengths were also compared to values calculated by the AASHTO and
ACI equations. The findings of these studies are presented in this section.
2.7.1. Girgis and Tuan (2005). Three mixes were investigated in this study: two
SCC mixes (Mix 1 and Mix 2) and one conventional mix (Mix 3). The SCC mixes had
partial replacement of cement with Class C fly ash and also contained a viscosity
modifying admixture (VMA). One full scale NU bridge girder was cast per mix and each
girder contained 0.6-in.-diameter (15.2 mm) strand, which was pre-qualified through the
Moustafa test, now known as the Large Block Pullout Test, using Logan’s concrete mix.
The bridge girders, which were parts of three different projects around Nebraska, were
instrumented with DEMEC points, and readings were taken at 1, 3, 7, 14, and 28 days
after casting. Transfer lengths were calculated using the 95% Average Mean Strain
Method. Moustafa pullout tests were also completed on the 0.6-in.-diameter (15.2 mm)
strands with the three concrete mixes to determine if pullout values in the concrete mix
could be correlated to transfer lengths. Smaller pullout tests were also performed on #4,
#6, and #8 deformed bars and 0.6-in.-diameter (15.2 mm) strand.
The SCC mixes had much longer initial transfer lengths than the conventional
mix; Mix 1 had an average initial transfer length 80% higher than Mix 3, and Mix 2 had
an average initial transfer length over two times that of Mix 3. However, the Moustafa
pullout values from the tests completed in the concrete mixes did not predict the longer

B-29
transfer lengths in the SCC. It would be assumed that higher pullout values would
correspond to shorter transfer lengths, but, in fact, Mix 2 had the highest average pullout
load, yet had the longest initial transfer length. The Moustafa pullout values from the
concrete mixes and initial transfer lengths from this study are presented in Table 2.5.
Table 2.5 – Girgis and Tuan Results
Mix Concrete
Type Girder Type
Average Pullout Load (kip)
Average Initial Transfer Length
(in.) Mix 1 SCC NU1100 43.4 36 Mix 2 SCC NU900 54.2 43 Mix 3 Conventional NU1350 48.0 20
Conversion: 1 kip = 4.45 kN 1 in. = 25.4 mm
2.7.2. Larson, Peterman, and Esmaeily (2007). Larson, Peterman, and
Esmaeily undertook a project funded by the Kansas Department of Transportation
(KDOT) to investigate the bond performance of prestressing strand in SCC. The main
goal was to determine if ACI and AASHTO equations would still be conservative when
applied to SCC so Kansas precasters would be permitted to use the material to construct
bridge girders.
First, Large Block Pullout Tests were run on strand that was to be used in the
project. Pullout tests were performed using Logan’s specified mix in order to qualify the
strand based on pullout values determined by Logan, and strands were also cast in blocks
of SCC to compare pullout values in SCC to those of the standard mix. The strands in
Logan’s mix passed the bond acceptance criteria, but in terms of comparing pullout
values from the two concretes, the pullout values for the SCC tests were significantly
lower than the pullout values from the conventional concrete; the average SCC pullout
value was 22.5 kips (100 kN) while the average pullout value from Logan’s concrete mix
was 39.5 kips (176 kN).

B-30
Several types of beams were then constructed with 0.5-in.-diameter (12.7 mm),
Grade 270 prestressing strand to measure transfer lengths due to end slip and then to
evaluate development length through four-point load testing. The same SCC mix, which
contained no VMA or supplemental cementitious materials, was used for all specimens.
Six single strand beams (SSB) with 8 in. x 12 in. (203 mm x 305 mm) cross-sections
were cast with one strand located 2 in. (50.8 mm) from the bottom, and six top strand
beams (TSB) with 8 in. x 24 in. (203 mm x 610 mm) cross-sections were cast with one
strand located at 22 in. (559 mm) from the bottom in order to study the top strand effect.
The depth of the TSB’s was decreased to 12 in. (305 mm) at the maximum moment range
so the SSB and TSB results could be compared. Finally, four T-beams (TB) were cast
with strands at a depth of 19 in. (483 mm).
The transfer lengths were determined by measuring strand end slips with a caliper
at release and at 21 days and using the values to calculate transfer lengths according to
Mast’s slip theory. The 21 day average transfer lengths were found to be 21 in. (533 mm)
for the SSB specimens, 30 in. (762 mm) for the TSB specimens, and 29 in. (737 mm) for
the TB specimens. Additionally, the specimens with bottom strands (TB and SSB)
showed increases in transfer length ranging from 10-20%, while the top strands (TSB
specimens) had increases of 40-45%.
All development length tests failed in flexure due to strand rupture. The actual
maximum moments surpassed the calculated nominal moment capacities by 10-20% for
the beams tested at 100% of the calculated development length and 25-30% for the beams
tested at 80% of the calculated development length.
Overall, several conclusions were made based on the results of this test program.
First, the “top strand effect” theory appeared to be supported; average measured 21 day
transfer lengths for the TSB specimens were approximately 50% longer than measured
bottom strand transfer lengths, and top strand transfer lengths also showed a much higher
increase over 21 days than the bottom strands. Top strands in the study also had on
average over 60% longer transfer lengths than the current ACI provision of 50db. Another
main conclusion that was drawn was that the ACI and AASHTO code equations for
transfer length and development length of bottom strands are conservative and adequate
for SCC. Finally, even though the SCC pullout values were low, the results from the
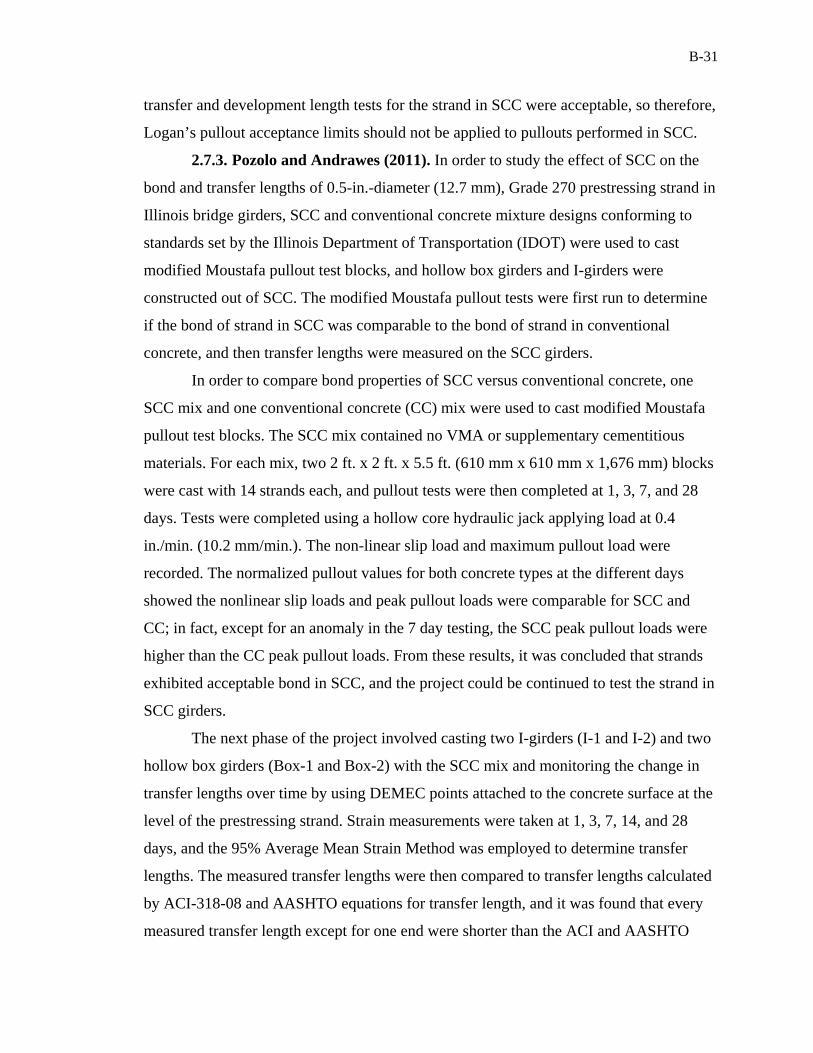
B-31
transfer and development length tests for the strand in SCC were acceptable, so therefore,
Logan’s pullout acceptance limits should not be applied to pullouts performed in SCC.
2.7.3. Pozolo and Andrawes (2011). In order to study the effect of SCC on the
bond and transfer lengths of 0.5-in.-diameter (12.7 mm), Grade 270 prestressing strand in
Illinois bridge girders, SCC and conventional concrete mixture designs conforming to
standards set by the Illinois Department of Transportation (IDOT) were used to cast
modified Moustafa pullout test blocks, and hollow box girders and I-girders were
constructed out of SCC. The modified Moustafa pullout tests were first run to determine
if the bond of strand in SCC was comparable to the bond of strand in conventional
concrete, and then transfer lengths were measured on the SCC girders.
In order to compare bond properties of SCC versus conventional concrete, one
SCC mix and one conventional concrete (CC) mix were used to cast modified Moustafa
pullout test blocks. The SCC mix contained no VMA or supplementary cementitious
materials. For each mix, two 2 ft. x 2 ft. x 5.5 ft. (610 mm x 610 mm x 1,676 mm) blocks
were cast with 14 strands each, and pullout tests were then completed at 1, 3, 7, and 28
days. Tests were completed using a hollow core hydraulic jack applying load at 0.4
in./min. (10.2 mm/min.). The non-linear slip load and maximum pullout load were
recorded. The normalized pullout values for both concrete types at the different days
showed the nonlinear slip loads and peak pullout loads were comparable for SCC and
CC; in fact, except for an anomaly in the 7 day testing, the SCC peak pullout loads were
higher than the CC peak pullout loads. From these results, it was concluded that strands
exhibited acceptable bond in SCC, and the project could be continued to test the strand in
SCC girders.
The next phase of the project involved casting two I-girders (I-1 and I-2) and two
hollow box girders (Box-1 and Box-2) with the SCC mix and monitoring the change in
transfer lengths over time by using DEMEC points attached to the concrete surface at the
level of the prestressing strand. Strain measurements were taken at 1, 3, 7, 14, and 28
days, and the 95% Average Mean Strain Method was employed to determine transfer
lengths. The measured transfer lengths were then compared to transfer lengths calculated
by ACI-318-08 and AASHTO equations for transfer length, and it was found that every
measured transfer length except for one end were shorter than the ACI and AASHTO

B-32
limits. The one end that did not meet the ACI and AASHTO criteria had low concrete
strength and was the end that was first released. Overall, the measured lengths averaged
86% below 50db, 72% below 60db, and 69% below fpedb/3, so it was determined that
strands would exhibit acceptable bond in SCC girders in Illinois.
2.7.4. Staton, Do, Ruiz, and Hale (2009). For this program, the researchers
evaluated the transfer lengths of 0.6-in-diameter (15.2 mm), Grade 270 prestressing
strand in two different SCC mixtures and a high strength conventional concrete. The
mixes included an SCC with Type I cement (SCC-I), an SCC with Type III cement and
Class C fly ash (SCC-III), and a high-strength conventional concrete (HSC). The strand
was first prequalified through the NASP bond test, and then beams were constructed and
instrumented with DEMEC points to measure the transfer lengths of the strands over
time.
In order to evaluate transfer lengths, 18-ft.-long (5.49 m) beams with 6.5 in. x 12
in. (165 mm x 305 mm) cross-sections, two strands at 2 in. (50.8 mm) from the bottom,
and stirrups at 6 in. (152 mm) on center were constructed from three different mixes.
Eight beams were cast with the SCC-I, and the SCC-III and HSC were used to cast 6
beams each for a total of 20 beams. The beams were instrumented with DEMEC points,
and readings were taken at 1, 3, 7, 14, and 28 days. The 95% Average Mean Strain
Method was then used to determine transfer lengths.
The transfer lengths at all ages were compared for all mixes using 90%
confidence intervals. Overall, it was found that there was no statistical difference between
the HSC and SCC-I transfer lengths, but transfer lengths at 28 days were 3.5 in. (88.9
mm) shorter for the SCC-III beams than for the HSC beams. In terms of transfer length
growth, both the SCC-I and SCC-III beams averaged about 8% growth, while the HSC
transfer lengths averaged around 12% growth. Also, all measured transfer lengths were
shorter than lengths calculated by the ACI and AASHTO equations. For SCC, the
measured transfer lengths averaged about 60% below the transfer length predicted by the
ACI equation. However, it should be noted that the strands in this research were released
by detensioning, and a harsher release method might have resulted in longer transfer
lengths.

B-33
2.7.5. Floyd, Ruiz, Do, Staton, and Hale (2011). This research program was a
continuation of the study of transfer lengths of 0.6-in.-diameter (15.2 mm) strand in SCC
by Staton, Do, Ruiz, and Hale. The same beams that were used to measure transfer
lengths were also then tested to evaluate the effects of SCC on development length. One
end of each beam was tested by applying a single point load to a simple span at a
predetermined embedment length. For each test, the failure moment and first slip moment
were noted and compared to the calculated nominal moment capacity, and from these
observations, it was determined whether the beam failed in bond or flexure. The
embedment length for each test was varied based on whether the embedment length of
the previous test resulted in a bond or flexural failure. Ultimately, the development length
for each concrete type was narrowed down to a range based on failure modes resulting
from the different embedment lengths (Table 2.6). For instance, based on results, the
development length for 0.6-in.-diameter (15.2 mm) strand in SCC-I is most likely longer
than 35 in. (889 mm) but shorter than 37.5 in (953 mm).
Table 2.6 – Concrete Strength at Testing and Development Length Ranges
Concrete Type
f’c,test (psi) Development Lengths Low End
(in) High End
(in) SCC-I 14,770 35 37.5
SCC-III 13,190 30 32.5 HSC 14,510 30 35
Conversion: 1 psi = 6.89 kPa 1 in. = 25.4 mm
In conclusion, it was determined that the HSC and SCC specimens had
comparable development lengths, although SCC-I appeared to have development lengths
slightly greater than the HSC. Still, all experimentally determined development lengths
were much shorter than lengths calculated by the ACI/AASHTO equation; SCC-I and
HSC development lengths were 60-66% shorter, and SCC-III lengths were 64-67%
shorter.

B-34
2.7.6. Boehm, Barnes, and Schindler (2010). The Alabama Department of
Transportation funded a study dedicated to determining if the use of SCC is feasible for
bridge girder construction in Alabama. Six AASHTO Type I girders with 0.5-in.-
diameter (12.7 mm) “special” Grade 270 prestressing strand composite decks were used
to evaluate transfer lengths and development lengths. A moderate strength conventional
concrete (STD-M), a moderate strength SCC (SCC-MS), and a high strength (SCC-HS)
were used for comparison, and two beams were constructed per mix. All three mixes
contained Type III cement, and the two SCC mixes also contained ground granulated
blast furnace slag (GGBFS). Also, for the SCC mixes, SCC-MS contained a VMA, while
SCC-HS did not. The moderate strength conventional concrete and SCC had target
release strengths of 5,000 psi (34.5 MPa), while the high strength SCC had a target
release strength of 10,000 psi (68.9 MPa). DEMEC points and the 95% Average Mean
Strain Method were used to monitor transfer lengths over three months, and strand draw-
in was measured at release with a steel ruler. Flexural bond length was evaluated using
four-point loading, and for each mix, one test was completed at an embedment length of
135 in. (3,429 mm), one at 85 in. (2,159 mm), and two at 65 in. (1,651 mm). The
development length calculated by AASHTO was 124 in. (3,150 mm).
Through the transfer lengths determined by the 95% Average Mean Strain
Method, the study concluded that there was no significant difference between transfer
lengths of strands in conventional concrete or SCC for full size girders. Additionally, the
ACI and AASHTO equations for transfer length were found to be generally conservative,
especially for high strength concretes. Also, SCC transfer lengths were found to increase
an average of 28% over three months, while transfer lengths in conventional concrete
increased 38%. In terms of the transfer lengths determined from the draw-in
measurements, the study found little correlation between these values and the transfer
lengths determined by the 95% Average Mean Strain Method.
All four-point load tests failed in flexure, even at the embedment lengths
significantly shorter than the value recommended by AASHTO. Therefore, the AASHTO
equation was deemed conservative. Results also showed that SCC performed comparably
to conventional concrete, exceeding calculated nominal moment capacities by similar
amounts.

B-35
Overall, SCC was determined to be comparable to conventional concrete in terms
of bond. Additionally, the AASHTO and ACI equations for transfer length and
development length were found to be conservative for both SCC and conventional
concrete. Ultimately, this study approved the potential use of SCC in bridge girders in
Alabama.
2.7.7. Burgueño and Haq (2007). Burgueño and Haq investigated the effect of
how the different methods and admixtures used in making SCC can affect bond of
prestressing strand. The study included three SCC mixes (SCC1, SCC2, and SCC3) and
one conventional mix (NCC). SCC1 had a 0.35 water to cement ratio with decreased
coarse aggregate, increased fines, and a significant amount of high range water reducer
(HRWR), while SCC3 had a 0.45 water to cement ratio, proportions of aggregate similar
to those of conventional concrete, and additions of a HRWR and a viscosity modifying
admixture (VMA) to produce the fluidity and stability. SCC2 had a 0.40 water to cement
ratio and admixture and aggregate proportions between those of SCC1 and SCC3. The
three SCC mixes were also compared to a conventional concrete (NCC). Large Block
Pullout Tests were completed using the four mixes, and 38-ft. long T-beams using 0.5-
in.-diameter (12.7 mm), Grade 270 prestressing strand were cast from each mix to
monitor transfer length using DEMEC points and the 95% Average Mean Strain Method
and evaluate development length through three-point flexural tests.
Overall, the NCC was found to have slightly better bond than the SCC mixes. The
SCC mixes on average had 12% lower pullout values, 36% longer transfer lengths, and
3% longer development lengths. Although transfer lengths were longer for SCC than
NCC, the transfer lengths in all SCC mixes were still shorter than the transfer lengths
predicted by the ACI code. In terms of comparing the three SCC mixes to determine
effects of mix proportioning on bond, it appeared that SCC1 (high fines mix) had the
lowest bond capacity of the three, and SCC3 (conventional mix with HRWR and VMA)
showed the highest bond capacity of the three.
B-36
3. BOND TEST PROGRAM AND RESULTS
3.1. INTRODUCTION
The bond test program involved two types of pullout tests: the North American
Strand Producers (NASP) Pullout Test and the Large Block Pullout Test (LBPT). The
NASP test consists of six pullout specimens, where each specimen is composed of a
section of strand cast concentrically in a cylinder of specified mortar. The LBPT is
comprised of six strands cast in a block of concrete having a specific mix design. Both
the NASP test and LBPT specify that the pullout tests are to be performed 24 hours after
casting. Because there is currently no accepted standard for the testing of bond of
prestressing strand, the main purpose of the bond test program was to compare the NASP
test in mortar and the LBPT to see if one test could be deemed more reliable than the
other in terms of qualifying strand based on bond. In order to compare the two tests,
prestressing strand from three different sources was obtained, and the standard NASP test
in mortar and the LBPT were performed on strand from each source.
Additionally, the NASP test was also performed using the four concrete mixes
that were developed for the transfer length and development length portions of the
project, instead of the specified mortar. The NASP tests in concrete were performed only
on strands from the same source as the beams, and the purpose of the testing was to see if
any correlation could be made between the pullout values and transfer lengths. For each
mixture, six total NASP specimens were made and three specimens were tested at 1 day
and the remaining three were tested at 8 days. While the standard NASP test in mortar
assesses only the bond quality of the strand itself, the NASP test in concrete gives an idea
of the actual bond behavior of the strand in a specific concrete and concrete strength.
Prestressing strand from three different sources was used for comparing the
standard NASP test in mortar and the LBPT. In this report, the strands will be identified
as 101, 102, or 103 to designate the source. Strand type 101was the strand type that was
used in the beams, and strands 102 and 103 were samples of strand remaining from
previous bond testing completed during NCHRP 10-62. Samples 102 and 103 were used
to provide a comparison between different strand manufacturers. Because three different

B-37
sources of strand were used for multiple pullout tests, an identification code was
developed to distinguish the specific bond test and strand combinations (Figure 3.1).
Figure 3.1 – Bond Test Identification Code
For instance, N-101-A-1 designates the first specimen in the group of six NASP
tests using strand type 101 in mortar Mix A, while N-101-C6-1 designates the first
specimen in a group of six NASP tests using strand type 101 in the conventional
concrete, 6,000 psi (41.4 MPa) target strength mix.
A few notes should be made concerning the NASP test in concrete specimens.
First, the concrete mix designs used for the beams, and consequently the NASP tests in
concrete, are discussed in Section 4.2. Also, all NASP in concrete tests were completed
with strand type 101 because this was the strand type used in the beams. Finally, the
NASP tests in concrete were run with three specimens tested at 1 day and three
specimens tested at 8 days; therefore, it should be noted that for the NASP tests in

B-38
concrete, specimens numbered 1-3 were tested at 1 day, and specimens numbered 4-6
were tested at 8 days. Consequently, N-101-C6-1 indicates a C6 NASP specimen tested
at 1 day, while N-101-C6-4 indicates a C6 NASP specimen tested at 8 days.
Finally, L-101-1 designates the first specimen in the group of the six type 101
strands cast for the LBPT. Since one concrete mix was used for the LBPT, the mix
identification label was dropped for the LBPT identifiers.
This chapter first describes program used to determine the strands’ tensile
properties in Section 3.2. Section 3.2 also summarizes ultimate tensile strength, fu, and
modulus of elasticity, Eps, of each source. Next, Section 3.3 presents the set-up,
instrumentation, procedure, and results for the standard NASP tests in mortar as well as
the NASP tests in concrete. Finally, the set-up, instrumentation, procedure, and results for
the LBPT are reported in Section 3.4.
3.2. TENSILE PROPERTIES OF PRESTRESSING STRANDS
The tensile properties of the three strand types used were found in order to aid in
the evaluation of the pullout tests and to determine the ultimate moment capacities of the
full-scale prestressed beams. Tensile tests were completed on strand types 101, 102, and
103, and the average ultimate strength and modulus of elasticity were found for each
source.
3.2.1. Tension Test Setup and Procedure. Three tension specimens were tested
for each strand source. The strands were cut into 18-in.-long (457 mm) sections and 3-in.-
long (76.2 mm) aluminum tube sleeves were placed on each end of each test specimen to
protect the strand from the grip serrations and facilitate gripping, as suggested in ASTM
A1061/A1061M-09: Standard Test Methods for Testing Multi-Wire Steel Strand. The
aluminum sleeves consisted of 6061 aluminum tubing with a 0.625 in. (15.9 mm) outside
diameter, 0.527 in. (13.4 mm) inside diameter, and 0.049 in. (1.24 mm) wall thickness.
Two sleeves were slid onto each specimen, and then small welds were placed on each end
of the strand to ensure the wires would be loaded uniformly and also to keep the
aluminum sleeves from sliding off the specimen. A set of three tension test specimens
can be seen in Figure 3.2.

B-39
Figure 3.2 – Tension Test Specimens
An MTS 880 Universal Testing Machine was used to apply tension to each
specimen until fracture. Each strand was centered and clamped into the grips. The
gripping strength was initially set at 3.5 ksi (24.1 MPa), but the first set of tests exhibited
slippage. As a result, after the first set of tests, the gripping strength was increased to 7.5
ksi (51.2 MPa), and no further slippage was experienced. The initial set that showed
slippage in the grips was discarded, and an additional three specimens of the same strand
type were tested using the 7.5 ksi (51.2 MPa) gripping strength to determine the final
properties.
After setting the specimen in the grips, an initial load of 4,130 lb. (18.3 kN),
which corresponds to 10% of the minimum specified fracture load, was applied based on
ASTM A416/A416M-10: Standard Specification for Steel Strand, Uncoated Seven-Wire
for Prestressed Concrete. Then, a 2-in.-long (50.8 mm) extensometer was attached near
the middle of the section between the grips. The tension test setup with the extensometer
is shown in Figure 3.3. Each specimen was then loaded at a rate of 3,235 lb./min. (14.4
kN/min.) until fracture. The load rate was chosen based on the limitations in ASTM
A370-11a: Standard Test Methods and Definitions for Mechanical Testing of Steel
Products, the limitations of the MTS equipment, and previous strand tensile testing
performed on the MTS test machine. The majority of specimens fractured in the grips,
but all specimens failed above the minimum fracture load of 41,300 lb (184 kN), so the
Aluminum sleeves

B-40
tests were considered valid according to ASTM A1061. A fractured specimen that failed
away from the grips is pictured in Figure 3.4.
The data acquisition system recorded load, strain, and stroke and was set to record
four readings per second. For each tension specimen, the extensometer was removed after
a strain reading of approximately 0.008 in./in. was reached, and then the specimen
continued to be loaded until failure. The extensometer was able to record sufficient data
for the determination of the modulus of elasticity but was removed at a safe margin
before fracture so the extensometer would not be damaged. Yield strength, which would
have corresponded to a strain of 0.01 in./in., was not determined.
3.2.2. Tension Test Results. The collected load and extensometer data was
used to determine the ultimate tensile strength (fu) and the modulus of elasticity (Eps) for
each strand source. The average, standard deviation, and coefficient of variation (COV)
results for fu and Eps presented in Table 3.1 are based on three tension test specimens per
strand type.
Figure 3.3 – Tension Test Setup
Specimen
Extensometer

B-41
Figure 3.4 – Fractured Tension Test Specimen
Table 3.1 – Direct Tension Test Results
Strand Type Statistic fu (ksi) Eps (ksi)
101
Average 287.5 29,400
Std. Dev. 1.8 1,131.4
COV 0.63% 3.85%
102
Average 285.0 27,500
Std. Dev. 0.2 193.0
COV 0.06% 0.70%
103
Average 287.7 28,500
Std. Dev. 0.3 71.6
COV 0.12% 0.25%
Conversion: 1 ksi = 6.89 MPa
B-42
3.3. NASP BOND TEST
The NASP Bond Test was performed in both the specified mortar, so results could
be compared to the LBPT results, and the four concrete mixes, so pullout results could be
correlated to transfer lengths. Aside from the mortar vs. concrete mixes, the specimen
design and testing methods were virtually identical for both types of NASP tests.
3.3.1. NASP Test Specimen Design. The NASP specimen molds were identical
for both the mortar and concrete NASP tests. The molds were constructed from 18-in.-
long (457 mm) sections of 5 in. (127 mm) outside diameter, 1/8-in.-thick (3.18 mm) steel
tubing. The sections of tube were welded to 6 in. x 6 in. x ¼ in. (152 mm x 152 mm x
6.35 mm) steel plates with a 5/8-in.-diameter (15.9 mm) hole in the center. A 1 ¾ in. (44.5
mm) section of inverted 2 in. x 2 in. (50.8 mm x 50.8 mm) angle was welded onto the
side of the tube at the open end to allow for the attachment of an LVDT during testing.
Before testing, the angle piece on each specimen mold was checked with a level to ensure
a horizontal surface and adjusted as necessary. A diagram of the steel mold is shown in
Figure 3.5.
The strands were cut into 32-in.-long (813 mm) segments and were positioned so
that 2 in. (50.8 mm) of strand would protrude from the top in order for the LVDT to
measure slip, and 12 in. (305 mm) would extend from the bottom so the chuck would
have sufficient strand to grip. A grinder was used to shape the top end of each strand, so
that the outer wires were tapered upwards to the center wire, which had a level surface
for the LVDT. Additionally, a 2-in.-long (50.8 mm) bond breaker constructed from foam
insulation was wrapped around the strand and secured with duct tape. As shown in
Figure 3.5, the bond breaker was positioned immediately above the hole in the bottom
plate, and extended upward 2 in. (50.8 mm) into the mortar or concrete. The bond
breakers are depicted in Figure 3.6.

B-43
Conversion: 1 in. = 25.4 mm
Figure 3.5 – NASP Specimen Mold
Figure 3.6 – Strands with Bond Breakers

B-44
For the NASP test in mortar, a significant number of trial batches of mortar were
required in order to develop a mortar mix design that would meet the specific
requirements set forth by the proposed standard in Appendix H of NCHRP 603 (Ramirez
and Russell 2008). The proposed standard requires a mortar flow greater than or equal to
100 but less than or equal to 125 as measured in accordance with the procedure in ASTM
C1437-07: Standard Test Method for Flow of Hydraulic Cement Mortar. Furthermore,
the 24-hour average compressive strength of three mortar cubes was required to fall
within the range of 4,500 psi (31.0 MPa) to 5,000 psi (34.5 MPa). The mortar consisted
of Type III cement, fine aggregate, and water. The fine aggregate gradation conformed to
ASTM C33/C33M-11a: Standard Specification for Concrete Aggregates. For the first few
trial batches, the moisture content of the fine aggregate was measured and factored into
the mix design; however because of the variability of results obtained, all fine aggregate
for the remaining trial and final batches was oven dried to maintain more precise control
of the water-cement ratio.
The initial NASP test for strand type 101 was completed during the summer of
2011, but the NASP tests for strand types 102 and 103 were completed over six months
later in February of 2012. The mix design that was developed during the summer, Mix A,
for strand type 101 did not meet the requirements of the proposed standard when used for
testing strand types 102 and 103. When trial batches of Mix A were produced in
February, the batches gave comparable 24 hour strengths to the trial batches of Mix A
that were produced the previous summer, but the flow values were consistently lower
than the previous batches and did not meet the criteria of the standard. Therefore, a
revised mix design, Mix B, meeting the flow and strength criteria was developed for
testing of strand types 102 and 103. Mix B was significantly different from Mix A in
terms of proportioning, and because extra samples of strand type 101 were still available
during the testing of types 102 and 103, the NASP test was performed again on strand
type 101 in March 2012 with the new mix design, Mix B. The final mortar mix designs
can be found in Table 3.2, and the test matrix for the NASP test in mortar is shown in
Table 3.3.
For the NASP tests in concrete, the NASP specimens were poured at Coreslab
Structures in Marshall, Missouri from the same batches that were used for the beams and

B-45
using strand type 101, which was the same strand type used in the beams. The mix
designs for the C6, S6, C10, and S10 concretes can be found in Table 4.1 in Section 4.2.
Table 3.2 – Mortar Mix Design for NASP Tests
Mix ID Water/Cement
Ratio Sand/Cement
Ratio Oven Dried Sand (lb/ft3)
Type III Cement (lb/ft3)
Water (lb/ft3)
A 0.38 1.2 : 1 64.3 53.4 20.7 B 0.395 0.9 : 1 52.7 58.6 23.5
Conversion: 1 lb/ft3 = 16.0 kg/m3
Table 3.3 – NASP Test in Mortar Test Matrix
Strand Type Mix A Mix B 101 X X 102 X 103 X
3.3.2. NASP Test Specimen Fabrication. For the mortar specimens, the mortar
was mixed in a 2 ft3 (0.056 m3) drum mixer according to a procedure based on ASTM
C192/C192M-07: Standard Practice for Making and Curing Concrete Test Specimens in
the Laboratory. The mixer was started and all of the sand and enough water to produce a
slurry were added. After the sand and water had thoroughly mixed, the cement and
remaining water were then added in approximately three equal increments, allowing time
for mixing between each increment. Once all the components were in the mixer, the
mortar was mixed for three minutes. Then, the mixer was stopped for approximately two
minutes while the blades were scraped with a spatula. Finally, the mortar was mixed for
an additional two minutes. Figure 3.7 shows the mortar in the drum mixer.

B-46
Figure 3.7 – Mortar Mix in Drum Mixer
The flow test was performed according to ASTM C1437-07: Standard Test
Method for Flow of Hydraulic Cement Mortar immediately after mixing. After
conducting the flow test, the mortar cube molds and NASP steel casings were filled.
Three sets of three 2 in. x 2 in. x 2 in. (50.8 mm x 50.8 mm x 50.8 mm) mortar cubes
were made according to ASTM C109/C109M-11a: Standard Test Method for
Compressive Strength of Hydraulic Cement Mortars (Using 2 in. or 50 mm cube
specimens). Three sets of cubes were made so that the mortar strength could be
monitored before, during, and after testing. During the casting process, cube molds were
also weighed before and after being filled in order to determine fresh unit weight. The
flow test and cube-making process are depicted in Figures 3.8 and 3.9, respectively.
In order to fill the NASP molds, the six molds were placed on a custom wooden
platform with two rows of three 5/8-in.-diameter (15.9 mm) holes on the top and bottom
sections of plywood so that the strands could be placed vertically in the molds and rest at
the correct height, as seen in Figure 3.10. The steel tubes were filled in three equal
layers, and each layer was vibrated with a handheld 1 in2 (645 mm2) battery powered
vibrator. Once the specimen molds were filled and vibrated, wooden caps designed to fit
securely around the mold and with 5/8-in.-diameter (15.9 mm) holes in the center of each

B-47
were placed on the top of each specimen to ensure the strands would remain plumb and
concentric within the mold. The cube molds and table holding the six specimens were
placed in the moist cure room for 24 hours.
Figure 3.8 – Flow Test
Figure 3.9 – Mortar Cubes

B-48
Figure 3.10 – NASP Mold and Strand Setup
For the NASP tests in concrete, the only difference is the steel molds were filled
with the appropriate concrete mix instead of mortar. Once again, the molds were filled in
three equal layers, and each layer was vibrated with the 1 in2 (645 mm2) handheld
vibrator. Filling of the molds for one of the concrete mixes can be seen in Figure 3.11.
The caps were placed on the molds to keep the strands plum and concentric, and the
outside of the molds were vibrated once more to ensure consolidation. The specimens
were match cured with the beams. Six specimens were made for each mix, and for each
mix, three specimens were tested at 24 hours and three specimens were tested at 8 days.
Concrete cylinders measuring 4 in. x 8 in. (102 mm x 203 mm) were used to determine
the compressive strength of the concrete at the times of testing. The final capped NASP
specimens and cylinders for one of the concrete mixes can be seen in Figure 3.12.
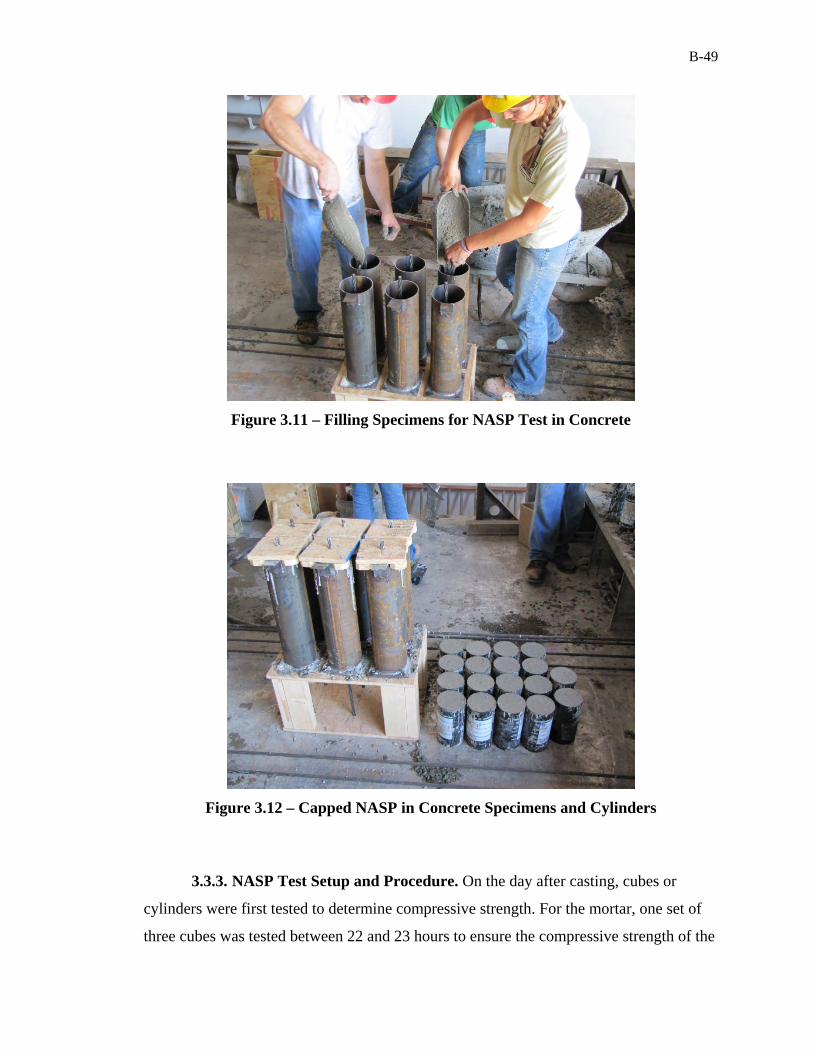
B-49
Figure 3.11 – Filling Specimens for NASP Test in Concrete
Figure 3.12 – Capped NASP in Concrete Specimens and Cylinders
3.3.3. NASP Test Setup and Procedure. On the day after casting, cubes or
cylinders were first tested to determine compressive strength. For the mortar, one set of
three cubes was tested between 22 and 23 hours to ensure the compressive strength of the

B-50
mortar was at or near 4,500 psi (31.0 MPa). The second set of cubes was tested at around
24 hours, which corresponded to the beginning of NASP testing, and the third set was
tested after the NASP testing was complete, or at around 25 or 26 hours. The average
compressive strengths from immediately before and immediately after testing were
averaged to determine the reported mortar compressive strength during testing. For the
concrete NASP tests, a target compressive strength range was not required, so one set of
three cylinders was tested at around 24 hours to determine compressive strength.
For the mortar NASP tests, all six specimens were tested at approximately 24
hours, while three specimens were tested at 24 hours and three specimens were tested at 8
days for each concrete mix. The specimens were tested using an MTS 880 Universal
Testing Machine and steel frames that had been constructed specifically for the test. The
frames, which are illustrated and dimensioned in Figure 3.13, were subsequently secured
within the grips of the MTS via vertical plates welded to the top and bottom. The top
frame held the cylindrical NASP specimen, and a chuck gripped the strand and bore
against the top plate of the bottom frame, securing the specimen at approximately 6 in.
(152 mm) from the bottom plate of the specimen, as show in Figure 3.14. Additionally, a
steel plate was placed between the chuck and the bottom frame, and a steel plate and
neoprene pad were placed under the specimen on the top frame, as seen in Figure 3.15.
The bottom crosshead remained stationary, while the top crosshead moved upwards,
applying load to the strand. The test method specifies that the load be applied at a rate of
0.1 in./min. (2.54 mm/min.), but the rate also must not exceed 8,000 lb./min. (35.6
kN/min.). The specimen was loaded at 0.1 in./min. (2.54 mm/min.) but a calculation was
performed later using Eq. 3.1, which was also used by researchers in Round IV of the
NASP testing (Russell 2006) to ensure the load rate was under 8,000 lb./min. (35.6
kN/min.). In Eq. 3.1, T6000 is the time elapsed in seconds when the pullout load was 6,000
lb. (26.7 kN) and T4000 is the time elapsed in seconds when the pullout load was 4,000 lb.
(17.8 kN). Time and load values were interpolated from the data.
6,000 4,00060
(3.1)

B-51
An LVDT was secured in a specially constructed steel apparatus that was
designed to be clamped to the specimen and would position the LVDT onto the center
wire of the portion of strand protruding from the top, as seen in Figure 3.16. The data
acquisition system collected the MTS stroke and load data and the LVDT readings at a
rate of two readings per second. The load rate was applied to the specimen until a slip of
0.1 in. (2.54 mm) was observed.
Conversion: 1 lb = 4.45 N 1 in. = 25.4 mm
Figure 3.13 – NASP Test Frame

B-52
Figure 3.14 – NASP Test Setup
Conversion: 1 in. = 25.4 mm Figure 3.15 – NASP Test Setup Details
Specimen
LVDT
Chuck
Steel frames

B-53
Figure 3.16 – NASP Test LVDT Setup
3.3.4. NASP Test Results. In this section, the NASP test results have been
divided into the results for the tests in mortar and the tests in concrete. The results are
presented in load vs. slip plots, and the loads at 0.001 in. (0.025 mm) and 0.1 in. (2.54
mm) of slip for each specimen are presented in tables.
3.3.4.1 Results from Standard NASP Test in Mortar. The results from the
NASP tests in mortar performed on the samples of strand from three different sources are
presented in this subsection. First, the load data from the MTS and the slip data from the
LVDT were organized into load vs. slip plots. An example load vs. slip plot can be found
in Figure 3.17. The plot shows the load vs. slip curves for all six specimens of the same
strand type, and the average minimum pullout load for acceptable bond quality as
suggested by the proposed standard is also marked on each plot. For 0.5-in.-diameter
(12.7 mm) strand, the average minimum pullout value is 10,500 lb (46.7 kN). All plots
LVDT
C - Clamp
Steel LVDT holder

B-54
for the mortar NASP tests for strand types 101, 102, and 103 can be found in the
discussion of the NASP test results in Section 5.2.1.
Conversion: 1 lb = 4.45 N 1 in. = 25.4 mm
Figure 3.17 – Typical Load vs. Slip Plot for NASP Test in Mortar (N-101-A)
Tables 3.4, 3.5, 3.6, and 3.7 present the loads at slip values of 0.001 in. (0.025
mm) and 0.1 in. (2.54 mm) for the NASP tests performed on strand and mortar mix
combinations of 101-A, 101-B, 102-B, and 103-B, respectively. The mortar strength,
mortar flow, and average loading rate for each set of tests are also reported in each table.
Table 3.8 summarizes the average loads at 0.001 in. (0.025 mm) and 0.1 in. (2.54 mm)
slip, as well as fresh and hardened properties of the mortar used for each test so the
results from the different tests can be compared side by side.
0
5,000
10,000
15,000
20,000
25,000
0 0.05 0.1
Loa
d (l
b)
Displacement (in.)
N-101-A-1
N-101-A-2
N-101-A-3
N-101-A-4
N-101-A-5
N-101-A-6
Min.

B-55
Table 3.4 – NASP in Mortar Results for Strand 101 Mix A
Specimen ID Load at 0.001 in.
Slip (lb) Load at 0.1 in. Slip
(lb) N-101-A-1 12,500 22,100 N-101-A-2 10,600 22,900 N-101-A-3 12,600 23,000 N-101-A-4 11,100 21,100 N-101-A-5 13,100 20,600 N-101-A-6 11,500 20,000 Average 11,900 21,600 Std. Dev. 965 1,249
COV 8.1% 5.8% f’c = 4,980 psi Flow = 112.1 Average Load Rate = 6,539 lb./min.
Conversion: 1 lb. = 4.45 N 1 psi = 6.89 kPa 1 in. = 25.4 mm
Table 3.5 – NASP in Mortar Results for Strand 101 Mix B
Specimen ID Load at 0.001 in.
Slip (lb) Load at 0.1 in. Slip
(lb) N-101-B-1 8,100 19,100 N-101-B-2 6,500 17,300 N-101-B-3 7,800 17,800 N-101-B-4 7,200 19,100 N-101-B-5 8,900 18,200 N-101-B-6 5,200 17,800 Average 7,300 18,200 Std. Dev. 1,311 751
COV 18.0% 4.1% f’c = 5,000 psi
Flow = 100.2 Average Load Rate = 6,933 lb/min.
Conversion: 1 lb. = 4.45 N 1 psi = 6.89 kPa 1 in. = 25.4 mm

B-56
Table 3.6 – NASP in Mortar Results for Strand 102 Mix B
Specimen ID Load at 0.001 in.
Slip (lb) Load at 0.1 in. Slip
(lb) N-102-B-1 3,200 11,000 N-102-B-2 3,300 12,400 N-102-B-3 4,200 12,600 N-102-B-4 1,900 9,300 N-102-B-5 3,800 12,400 N-102-B-6 2,400 12,300 Average 3,100 11,700 Std. Dev. 860 1,289
COV 27.4% 11.0% f’c = 4,820 psi Flow = 116.0 Average Load Rate = 6,420 lb./min.
Conversion: 1 lb. = 4.45 N, 1 psi =6.89 kPa 1 in. = 25.4 mm
Table 3.7 – NASP in Mortar Results for Strand 103 Mix B
Specimen ID Load at 0.001 in.
Slip (lb) Load at 0.1 in. Slip
(lb) N-103-B-1 3,500 15,800 N-103-B-2 2,600 20,500 N-103-B-3 1,800 18,600 N-103-B-4 700 16,000 N-103-B-5 8,700* 19,700 N-103-B-6 1,200 21,300 Average 2,000 18,700 Std. Dev. 1,091 2,295
COV 55.6% 12.3% f’c = 4,770 psi Flow = 111.6 Average Load Rate = 6,590 lb./min.
* - Value was statistically removed from average and std. dev.
Conversion: 1 lb. = 4.45 N 1 psi = 6.89 kPa 1 in. = 25.4 mm

B-57
Table 3.8 – Summary of NASP Test in Mortar Pullout Values and Mortar Properties
Strand/Mix ID
Avg. Load at 0.001 in.
(lb.)
Avg. Load at 0.1 in.
(lb.)
f’c (psi)
Flow Unit
Weight (lb/ft3)
Average Load Rate (lb/min.)
N-101-A 11,900 21,600 4,980 112.1 142.9 6,539 N-101-B 7,300 18,200 5,000 100.2 136.5 6,933 N-102-B 3,100 11,700 4,820 116.0 134.2 6,420 N-103-B 1,960 18,700 4,770 111.6 134.9 6,590
Conversion: 1 lb. = 4.45 N 1 psi = 6.89 kPa
1 lb/ft3 = 16.0 kg/m3 1 in. = 25.4 mm
3.3.4.2 Results from Modified NASP Test in Concrete. The results from the 24
-hour and 8 day NASP tests run on the concrete NASP specimens are presented here.
First, the load data from the MTS and the slip data from the LVDT were organized into
load vs. slip plots. An example load vs. slip plot can be found in Figure 3.18. Each plot
shows the curves for the three specimens of the same concrete mix tested at either 1 day
or 8 days. All plots for the concrete NASP tests can be found in Appendix B.
The written procedure specifies that the pullout load is defined as the load at 0.1
in. (2.54 mm) of strand slip, but the pullout load at 0.001 in. (0.025 mm) of slip was also
recorded. Table 3.9 contains the individual and average loads corresponding to 0.001 in.
(0.025 mm) and 0.1 in. (2.54 mm) of slip for concrete mixes C6 and S6 tested at 1 day
and 8 days, as well the standard deviation and coefficient of variation for each set of three
loads. Table 3.10 contains the same data for the C10 and S10 mixes.
In Table 3.9, specimen N-101-C10-1 does not have a 0.1 in. (2.54 mm) pullout
load value because this was the first test completed, and the test reached the maximum
stroke of the MTS before the slip reached 0.1 in. (2.54 mm). The allowable stroke
distance was increased after this test, so this problem was not encountered again.

B-58
Conversion: 1 lb = 4.45 N 1 in. = 2.54 mm
Figure 3.18 – Typical Load vs. Slip Plot for Concrete NASP Test (N-101-S6)
0
5,000
10,000
15,000
20,000
25,000
30,000
0 0.05 0.1 0.15
Loa
d (l
b)
Displacement (in.)
N-101-S6-1
N-101-S6-2
N-101-S6-3

59
Table 3.9 – Concrete NASP Results – C6 and S6
Conversion: 1 lb. = 4.45 N 1 in. = 2.54 mm
Mix Day Specimen
ID f'c
(psi)
Load at Slip of 0.001 in. Load at Slip of 0.1 in.
Load (lb.)
Average (lb.)
Std. Dev. (lb.)
COV Load (lb.)
Average (lb.)
Std. Dev. (lb.)
COV
C6
1 Day
N-101-C6-1 4,810
16,900 17,700 971 5.49%
20,900 21,100 529 2.51% N-101-C6-2 17,500 20,700
N-101-C6-3 18,800 21,700
8 Day
N-101-C6-4
5,620
18,200
18,900 2,676 14.16%
24,900
24,200 907 3.75% N-101-C6-5 16,700 24,600
N-101-C6-6 21,900 23,200
S6
1 Day
N-101-S6-1 5,660
18,700 18,000 1,127 6.26%
23,900 23,700 874 3.69% N-101-S6-2 18,600 24,400
N-101-S6-3 16,700 22,700
8 Day
N-101-S6-4
6,690
18,100
19,000 1,137 5.99%
24,700
26,200 1,375 5.25% N-101-S6-5 18,700 26,500
N-101-S6-6 20,300 27,400

B-60
Table 3.10 – Concrete NASP Results – C10 and S10
Conversion: 1 lb. = 4.45 N 1 in. = 2.54 mm
Mix Day Specimen ID f’c
(psi)
Load at Slip of 0.001 in. Load at Slip of 0.1 in.
Load (lb.)
Average (lb.)
Std. Dev. (lb.)
COV Load (lb.)
Average (lb.)
Std. Dev. (lb.)
COV
C10
1 Day
N-101-C10-1
5,670
14,000
15,000 850 5.67%
N/A
26,700 1,202 4.51% N-101-C10-2 15,300 27,500
N-101-C10-3 15,600 25,800
8 Day
N-101-C10-4
7,950
15,500
17,100 2,600 15.20%
24,400
28,600 3,707 12.96%N-101-C10-5 15,700 30,200
N-101-C10-6 20,100 31,300
S10
1 Day
N-101-S10-1
6,330
13,600
12,900 1,358 10.52%
29,000
27,300 9,420 34.51%N-101-S10-2 11,300 17,100
N-101-S10-3 13,700 35,700
8 Day
N-101-S10-4
8,600
18,500
16,900 1,550 9.17%
39,600
36,700 3,799 10.35%N-101-S10-5 15,400 38,100
N-101-S10-6 16,900 32,400

B-61
3.4. LARGE BLOCK PULLOUT TEST
The large block pullout test was performed on all three strand sources to compare
results to those of the standard NASP test in mortar. Samples of strand 101 were received
four months before samples of 102 and 103, so the samples of strand type 101 were
wrapped in plastic, secured with duct tape, and stored in a closed container until testing to
keep the strands in as-received condition. A single block was cast with six strands from
each source, and the pullout tests to determine load at first slip and peak load were
performed approximately 24 hours after casting.
3.4.1. LBPT Specimen Design. The LBPT specimen was designed based on
Logan’s study completed in 1997. The 2 ft. x 2 ft. x 6 ft.-8 in. (610 mm x 610 mm x 203
mm) block of concrete was designed to hold 18 strand samples, six samples from each of
the three strand sources. Strands were cut to 52 in. (1321 mm) lengths, so each strand
could have 18 in. (457 mm) of bonded length, a 2 in. (50.8 mm) bond breaker made from
foam insulation and duct tape, and 32 in. (813 mm) of strand protruding from the
concrete surface to accommodate the test setup. The strands were spaced in two rows 12
in. (305 mm) apart, and each row contained nine strands spaced at 8 in. (203 mm) on
center. The mile reinforcing and strand layout are shown in Figures 3.19 and 3.20. All
mild reinforcing conformed to ASTM A615, Grade 60. Steel chairs measuring 5 in. (127
mm) high were used to support the mild steel cage, which in turn provided attachment
points and support for the strand samples.

B-62
Conversion: 1 in. = 25.4 mm
Figure 3.19 – Cross-Section of LBPT Specimen
Conversion: 1 in. = 25.4 mm
Figure 3.20 – Profile of LBPT Specimen

B-63
3.4.2. LBPT Specimen Fabrication. Due to the large volume of concrete
required, the LBPT specimen was cast at a precast plant, and the test was performed on
site the day after casting. The form was constructed out of three 8 ft. x 2 ft. (2438 mm x
610 mm) standard formwork panels, which made up the sides and bottom of the form.
Standard formwork panels measuring 2 ft. x 3 ft. (610 mm x 914 mm) were secured on
each end, but an end block made of a plywood panel and 2x4’s was placed at one end of
the form to shorten the standard form to the required length of 6 ft.-8 in. (2032 mm). The
formwork and reinforcing cage were constructed at the Missouri S&T High Bay
Structures Laboratory, and then for casting, the formwork and cage were transported by
truck to Prestressed Casting Company, a precast plant located in Springfield, Missouri.
Upon arrival at the plant, the formwork and mild steel cage were placed on top of
a precasting bed, and the strands were tied to the designated locations on the longitudinal
bars of the reinforcing cage using wire ties. The strands were labeled with duct tape flags
and were arranged so that the different strand sources were mixed throughout locations
on the specimen to randomize the test in case any inconsistencies in the concrete existed.
The strand layout pattern was the same pattern used by Logan (1997) and is shown in
Figure 3.21. A picture of the LBPT specimen before casting can be seen in Figure 3.22.
Figure 3.21 – Strand Layout Pattern
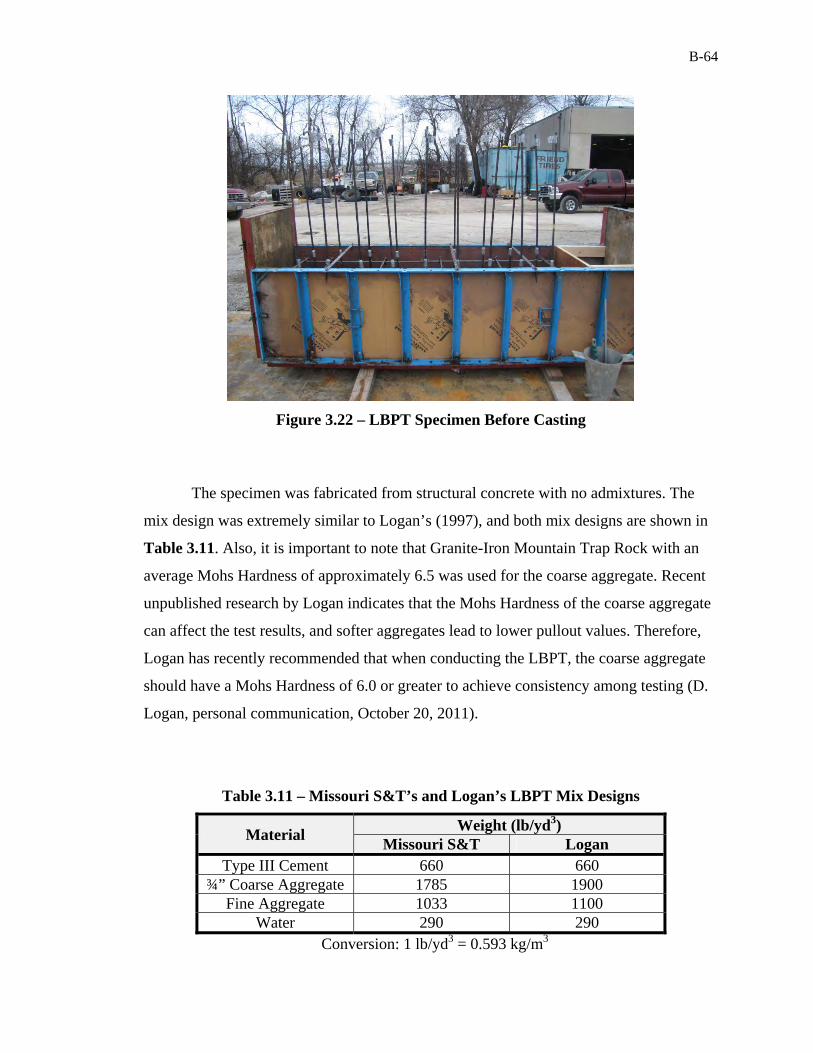
B-64
Figure 3.22 – LBPT Specimen Before Casting
The specimen was fabricated from structural concrete with no admixtures. The
mix design was extremely similar to Logan’s (1997), and both mix designs are shown in
Table 3.11. Also, it is important to note that Granite-Iron Mountain Trap Rock with an
average Mohs Hardness of approximately 6.5 was used for the coarse aggregate. Recent
unpublished research by Logan indicates that the Mohs Hardness of the coarse aggregate
can affect the test results, and softer aggregates lead to lower pullout values. Therefore,
Logan has recently recommended that when conducting the LBPT, the coarse aggregate
should have a Mohs Hardness of 6.0 or greater to achieve consistency among testing (D.
Logan, personal communication, October 20, 2011).
Table 3.11 – Missouri S&T’s and Logan’s LBPT Mix Designs
Material Weight (lb/yd3)
Missouri S&T Logan Type III Cement 660 660
¾” Coarse Aggregate 1785 1900 Fine Aggregate 1033 1100
Water 290 290 Conversion: 1 lb/yd3 = 0.593 kg/m3
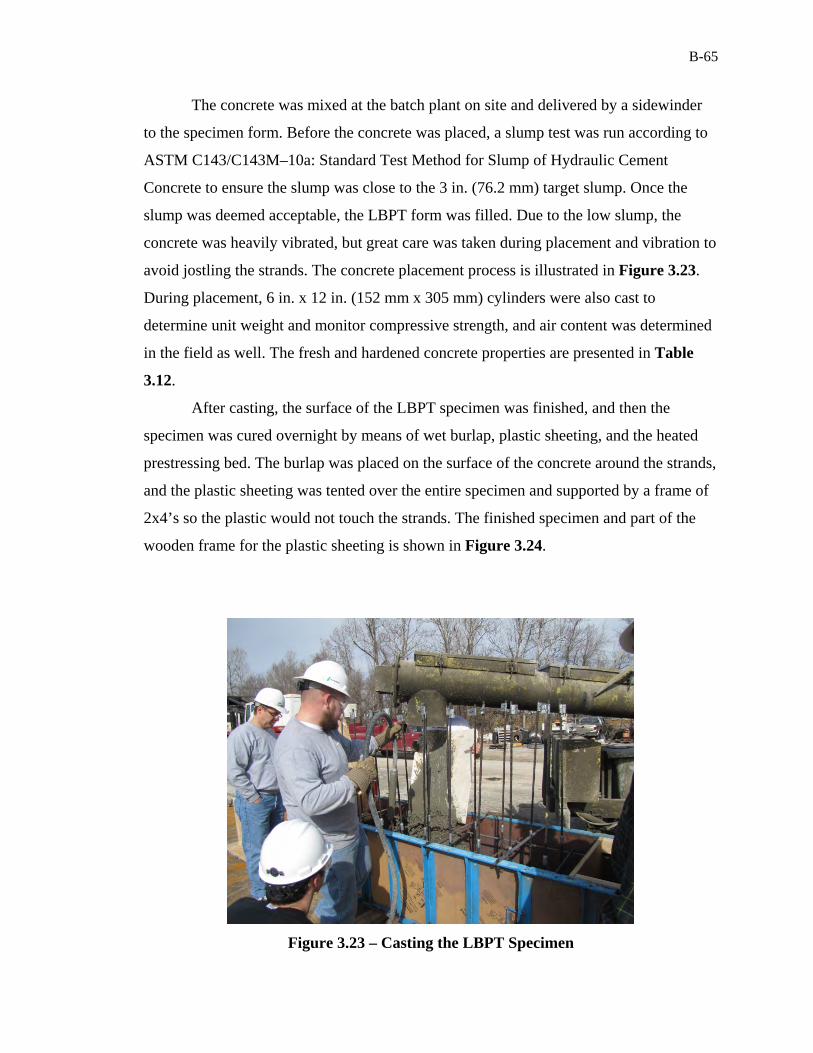
B-65
The concrete was mixed at the batch plant on site and delivered by a sidewinder
to the specimen form. Before the concrete was placed, a slump test was run according to
ASTM C143/C143M–10a: Standard Test Method for Slump of Hydraulic Cement
Concrete to ensure the slump was close to the 3 in. (76.2 mm) target slump. Once the
slump was deemed acceptable, the LBPT form was filled. Due to the low slump, the
concrete was heavily vibrated, but great care was taken during placement and vibration to
avoid jostling the strands. The concrete placement process is illustrated in Figure 3.23.
During placement, 6 in. x 12 in. (152 mm x 305 mm) cylinders were also cast to
determine unit weight and monitor compressive strength, and air content was determined
in the field as well. The fresh and hardened concrete properties are presented in Table
3.12.
After casting, the surface of the LBPT specimen was finished, and then the
specimen was cured overnight by means of wet burlap, plastic sheeting, and the heated
prestressing bed. The burlap was placed on the surface of the concrete around the strands,
and the plastic sheeting was tented over the entire specimen and supported by a frame of
2x4’s so the plastic would not touch the strands. The finished specimen and part of the
wooden frame for the plastic sheeting is shown in Figure 3.24.
Figure 3.23 – Casting the LBPT Specimen

B-66
Table 3.12 – Fresh and Hardened Properties of LBPT Concrete Mix
Fresh or Hardened Concrete Property Value f’c at Test (psi) 4,250
Slump (in.) 4 Unit Weight (lb./ft3) 143.3
Air Content 2.5% Conversion: 1 psi = 6.89 kPa
1 in. = 25.4 mm 1 lb./ft3 = 16.0 kg/m3
Figure 3.24 – Finished LBPT Specimen
3.4.3. LBPT Test Setup and Procedure. On the night before the day of
casting, all strands were labeled with duct tape flags and then subjected to a visual
inspection and towel wipe test, as prescribed by Logan (1997). The strands were first
visually observed for color, rust spots, and rust coatings, and then a clean, white rag was
wiped down the length of the strand, and the amount of residue on the rag was noted. The
results of the visual observations and towel wipe tests are presented in Section 3.4.4.
After completing the visual observations and towel wipe tests, the strands were packed in
a shipping box for transportation to the precast plant for casting the next day.

B-67
The strands were cast in the LBPT specimen as described in Section 3.4.2, and
then the research team returned to the precast plant approximately 24 hours after casting
to perform the pullout tests. The average strength of the concrete at the time of testing
was 4,250 psi (29.3 MPa). Logan maintains that LBPT can be performed in concrete
strengths ranging from 3,500 psi (24.1 MPa) to 5,900 psi (40.7 MPa) and still give
consistent results, so the compressive strength of the concrete at the time of testing was
deemed acceptable. Also, it should be noted that no honeycombing or voids were
observed in the concrete, indicating adequate consolidation.
Upon arrival at the plant, the form was removed, and then the data acquisition
system, 100 kip (4.45 kN) load cell, and 30 ton (8.90 kN) hollow core hydraulic jack
were set up. For each strand, first, a steel table was placed over the strand, and then the
jack was placed on the strand, followed by a steel plate, the load cell, another steel plate,
and a prestressing chuck. The setup is illustrated in Figure 3.25.
Figure 3.25 – LBPT Hydraulic Jack and Load Cell Setup
Chuck
Hydraulic jack
Steel platesLoad cell
Steel table

B-68
The 8 in. x 6 in. x 6-in. (203 mm x 152 mm x 152 mm) steel table, which is
pictured in Figure 3.26, was constructed from a 1-in.-thick (25.4 mm) steel plate with a 5/8-in.-diameter (15.9 mm) hole in the center and four 2 in. x 2 in. (50.8 mm x 50.8 mm)
sections of angle. The table was designed based on the one used by Logan, and the
purpose of the table was to give the jack a flat surface to contact and help distribute the
load to the concrete.
Figure 3.26 – Steel Table for LBPT
Once the jack and load cell were positioned on the strand, a three-person team
was used to run the test, as shown in Figure 3.27. One person operated the pump to apply
load to the strand, one person observed the strand and reported first slip, and one person
monitored the data acquisition system to record the load at first slip and peak load.
According to Logan, load is supposed to be applied at approximately 20 kips/min. (89.0
kN/min.). Since the load was applied via a manual pump, there was no direct way to
monitor the load rate, so the individual at the data acquisition system used a stopwatch
and monitored the load. Based on the load cell and stopwatch, the individual instructed
the pump operator to either increase or decrease the loading rate. Additionally, a sample

B-69
test block with two strands was cast at the same time as the LBPT specimen, and the test
block was used to refine the test procedure prior to performing the actual strand pullout
tests.
Figure 3.27 – Full LBPT Setup
Load was applied until the data acquisition system indicated a distinct drop off in
load or until there was a loud noise and a sudden drop off in load. The load noise was
determined to be the chuck slipping as the strand stretched and tried to untwist, but then
suddenly snapped back into its twisted state. The load at first slip was determined through
coordination between the individual watching the strand and the individual monitoring
the data acquisition system. At first noticeable movement, the person watching the strand
called out “Slip!”, and the person monitoring the data acquisition system recorded the
load value at that moment. Peak load was estimated in the field and then refined through
analysis of the collected load data.
3.4.4. LBPT Results. The results from the visual observations, towel wipe
tests, and the actual pullout tests are summarized for each strand in Table 3.13 and then
discussed in the following paragraphs.
Pump for hydraulic jack
Data acquisition system
Person watching for first slip

B-70
Table 3.13 – LBPT Results
Specimen ID
First Slip
Load (kips)
Peak Load (kips)
Surface Condition (Visual and Towel
Wipe) Test Description
L-101-1 15.9 34.3
No rust Light/moderate residue
Gradual slip to loud noise abrupt drop off in load
2” pullout
L-101-2 17.9 34.2
No rust Light/moderate residue
Gradual slip to peak load, test stopped 1” pullout
L-101-3 20.2 35.9
Light rust Moderate residue
Gradual slip to clear peak load, then load noise and abrupt drop off in load
3” pullout
L-101-4 31.2 38.8
Moderate rust spots in bonded area
Moderate residue
Gradual slip to loud noise and abrupt drop off in load
1.5” pullout
L-101-5 19.2 38.5
Moderate/heavy rust spots in bonded area
Moderate residue
Gradual slip to loud noise and abrupt drop off in load
2.75” pullout
L-101-6 22.1 38.1
No rust Light residue
Gradual slip to loud noise and abrupt drop off in load
3” pullout
L-102-1 9.7 27.1
Dull, light rust layer Heavy Residue
Gradual slip to loud noise and abrupt drop off in load
2.5” pullout
L-102-2 12.3 27.1
Dull, light rust layer Moderate residue
Gradual slip to peak load, test stopped 2” pullout
L-102-3 13.8 31.0*
Dull, light rust layer Moderate residue
Gradual slip to peak load, test stopped 2” pullout
Data recording accidently stopped at slip
* - Data collection was accidently stopped midway through the test, and this is the estimated value from the field.
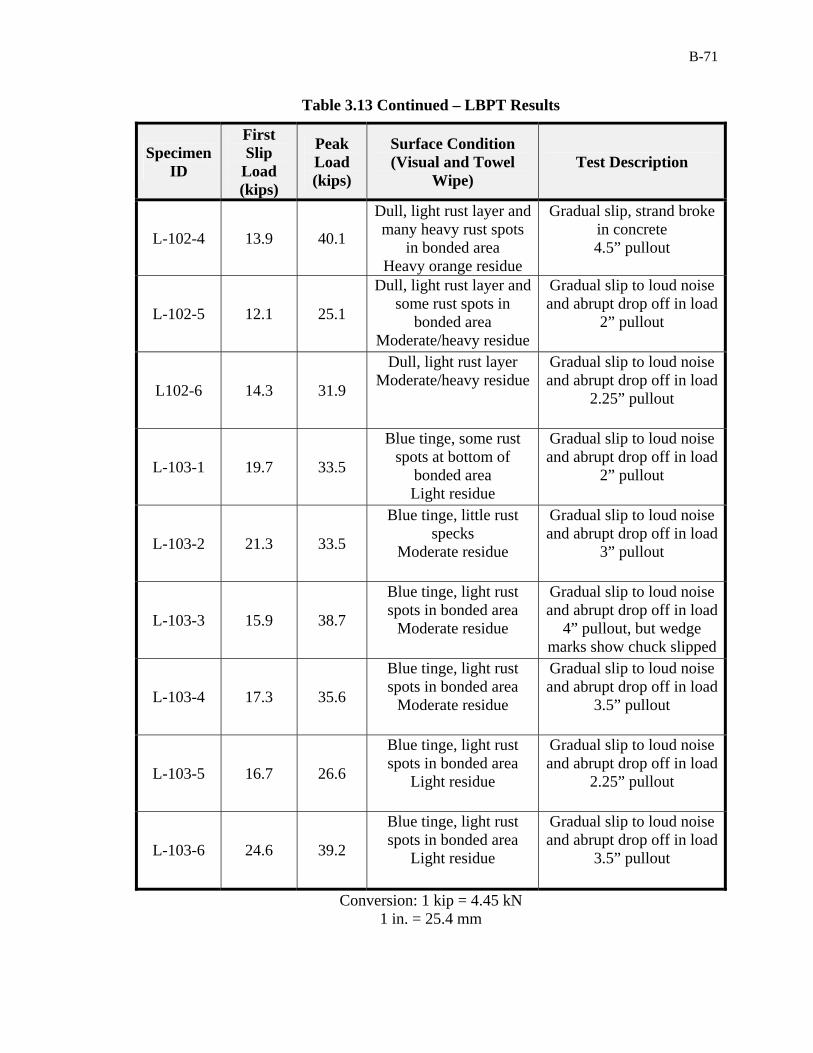
B-71
Table 3.13 Continued – LBPT Results
Specimen ID
First Slip
Load (kips)
Peak Load (kips)
Surface Condition (Visual and Towel
Wipe) Test Description
L-102-4 13.9 40.1
Dull, light rust layer and many heavy rust spots
in bonded area Heavy orange residue
Gradual slip, strand broke in concrete 4.5” pullout
L-102-5 12.1 25.1
Dull, light rust layer and some rust spots in
bonded area Moderate/heavy residue
Gradual slip to loud noise and abrupt drop off in load
2” pullout
L102-6 14.3 31.9
Dull, light rust layer Moderate/heavy residue
Gradual slip to loud noise and abrupt drop off in load
2.25” pullout
L-103-1 19.7 33.5
Blue tinge, some rust spots at bottom of
bonded area Light residue
Gradual slip to loud noise and abrupt drop off in load
2” pullout
L-103-2 21.3 33.5
Blue tinge, little rust specks
Moderate residue
Gradual slip to loud noise and abrupt drop off in load
3” pullout
L-103-3 15.9 38.7
Blue tinge, light rust spots in bonded area
Moderate residue
Gradual slip to loud noise and abrupt drop off in load
4” pullout, but wedge marks show chuck slipped
L-103-4 17.3 35.6
Blue tinge, light rust spots in bonded area
Moderate residue
Gradual slip to loud noise and abrupt drop off in load
3.5” pullout
L-103-5 16.7 26.6
Blue tinge, light rust spots in bonded area
Light residue
Gradual slip to loud noise and abrupt drop off in load
2.25” pullout
L-103-6 24.6 39.2
Blue tinge, light rust spots in bonded area
Light residue
Gradual slip to loud noise and abrupt drop off in load
3.5” pullout
Conversion: 1 kip = 4.45 kN 1 in. = 25.4 mm

B-72
In terms of the visual observations, a comparison of the strands can be seen in
Figure 3.28. Strand type 102 showed the largest number of rust spots and also appeared
to have a dull, light rust over all surfaces. Strand types 101 and 103 appeared to be
similar in terms of very little noticeable rust, but strand type 103 actually had a slightly
shiny, almost blue tinge to the wires. A written description of the visual observations for
each strand can be found in Table 3.11.
Figure 3.28 – Visual Comparison of Strands
The results of the towel wipe test for strand types 101, 102, and 103 are displayed
in Figures 3.29, 3.30, and 3.31, respectively. Compared to the other strand types, type
102 had a noticeable moderate to heavy brown/orange residue on almost all strands
(Figure 3.30). Strand type 103 showed very light residue (Figure 3.31), and strand type
101 exhibited light to moderate amounts of residue (Figure 3.29). A written description
of the results of the towel wipe test for each strand can be found in Table 3.13.
101
102
103

B-73
Figure 3.29 – Towel Wipe Results for Strand Type 101
Figure 3.30 – Towel Wipe Results for Strand Type 102
Figure 3.31 – Towel Wipe Results for Strand Type 103
Time and load were collected by the data acquisition system at a sampling rate of
two points per second, and the data was converted into excel files to plot load vs. time
and determine the maximum applied load. The load vs. time plots can be found in
Appendix C. The estimated first slip load and peak load determined from the collected
data are summarized for each strand in Table 3.13. A summary of just the first slip and
peak pullout loads, along with the averages, standard deviations, and coefficients of

B-74
variation for each strand type are presented in Table 3.14. For comparison, it should be
noted that Logan’s limits for first slip and peak load are 16 kips (71.2 kN) and 36 kips
(160 kN), respectively.
As the footnote on Tables 3.13 and 3.14 indicate, the peak load for L-102-3 is
load from field observations because the data was not collected electronically. However,
this value is still considered valid because during analysis, it was noted that estimated
values were very close to the values determined through analysis of the electronically
collected data. Additionally, as noted in the footnote in Table 3.14, the peak load for L-
102-4 and the first slip load for L-101-4 were not included in their respective averages or
standard deviations. For L-102-4, because the peak load exceeded 40 kips and it was
observed that the strand became untwisted above the concrete at failure, it was
determined that this specimen actually ruptured in the concrete. This was seen as an
anomaly, especially since this was the strand type with the worst bond overall, so the
peak load value was not used in the analysis. Additionally, the first slip load of L-101-4
was deemed high, so the value was not included in the first slip average for that
specimen.
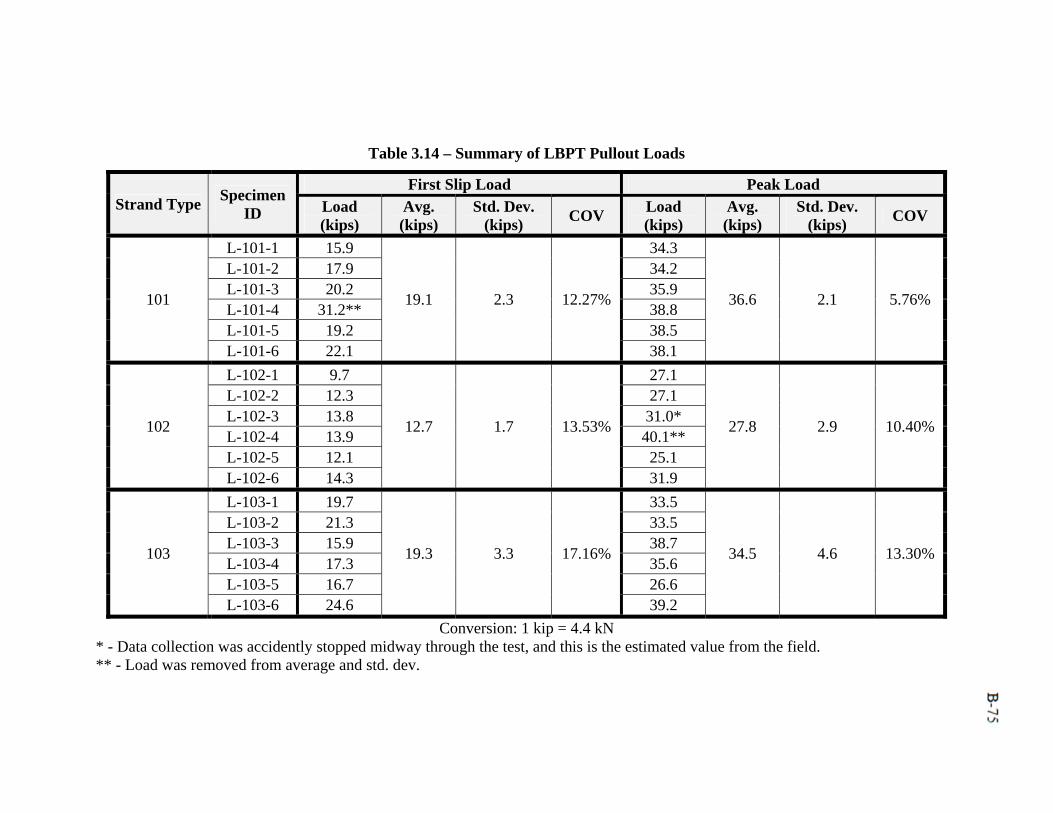
75
Table 3.14 – Summary of LBPT Pullout Loads
Strand Type Specimen
ID
First Slip Load Peak Load
Load (kips)
Avg. (kips)
Std. Dev. (kips)
COV Load (kips)
Avg. (kips)
Std. Dev. (kips)
COV
101
L-101-1 15.9
19.1 2.3 12.27%
34.3
36.6 2.1 5.76%
L-101-2 17.9 34.2 L-101-3 20.2 35.9 L-101-4 31.2** 38.8 L-101-5 19.2 38.5 L-101-6 22.1 38.1
102
L-102-1 9.7
12.7 1.7 13.53%
27.1
27.8 2.9 10.40%
L-102-2 12.3 27.1 L-102-3 13.8 31.0* L-102-4 13.9 40.1** L-102-5 12.1 25.1 L-102-6 14.3 31.9
103
L-103-1 19.7
19.3 3.3 17.16%
33.5
34.5 4.6 13.30%
L-103-2 21.3 33.5 L-103-3 15.9 38.7 L-103-4 17.3 35.6 L-103-5 16.7 26.6 L-103-6 24.6 39.2
Conversion: 1 kip = 4.4 kN * - Data collection was accidently stopped midway through the test, and this is the estimated value from the field. ** - Load was removed from average and std. dev.
B-76
4. TRANSFER LENGTH AND DEVELOPMENT LENGTH TEST PROGRAM
AND RESULTS
4.1. INTRODUCTION
In order to study the effect that different concrete mixes have on transfer length
and development length, twelve 17-foot long (5,182 mm) rectangular prestressed beams
with either two or four strands were constructed. The beams were first used to measure
transfer lengths at release and then periodically over two months. After all transfer length
measurements had been taken, each end of each beam was tested in flexure at different
span lengths to determine if development lengths calculated from AASHTO and ACI
codes are conservative for the concrete mixes tested. The design and fabrication of the
beams are presented in Sections 4.2 and 4.3, respectively. Section 4.4 covers the setup,
procedure, and result for each transfer length test, and the setup, procedure, and results
from the development length test program are presented in Section 4.5.
4.2. TRANSFER AND DEVELOPMENT LENGTH BEAM DESIGN
In terms of specimen design, the concrete mixes were based on typical mix
designs produced around Missouri, and the dimensions and reinforcement layouts of the
specimens were based on previous research done by Ramirez and Russell (2008). The
details of the mix designs and specimen designs are discussed in this subsection.
4.2.1. Mix/Specimen Identifications and Mix Designs. The goal of the research
was to evaluate the effects of type of concrete and concrete strength on strand bond
performance. As a result, four mix designs were developed: a normal and high strength
conventional concrete and a normal and high strength self-consolidating concrete (SCC).
The target strengths for the normal strength and high strength mixes were 6,000 psi (41.4
MPa) and 10,000 psi (69.0 MPa), respectively. An identification code was developed to
distinguish the mixes and specimens, as shown in Figure 4.1.
For example, C6 simply refers to the conventional concrete, 6,000 psi (41.4 MPa)
target strength mix, while C6-2-1 refers to the beam fabricated with the conventional
concrete, 6,000 psi (41.4 MPa) target strength mix, having two strands, and being the first
of two beams constructed with the specific mix and strand layout. Since the two-strand

B-77
beams were used for testing both transfer length and development length, an additional
code was added to distinguish between the tests. For instance, C6-2-1_NE indicates the
transfer length testing on the north end of the strand on the east side of the beam
previously described, while C6-2-1_58 indicates the testing of the 58 in. (1,473 mm)
embedment length on the same beam. All directions for transfer length designation are
relative to the cardinal position of casting.
Figure 4.1 – Mix and Specimen Identification Code

B-78
The normal strength conventional mix (C6) is MoDOT’s A-1 precast/prestressed
mix, and the remaining mix designs were developed based on results from surveys that
were sent to precast plants around Missouri and previous research performed at Missouri
S&T. This step ensured that the concrete used in the research would be comparable to the
concrete that is being used in the field. The mix designs are broken down in Table 4.1.
Table 4.1 – Mix Designs
Material Concrete Mix ID
C6 S6 C10 S10
Type III Cement (lb/yd3) 750 750 840 840
Class C Fly Ash (lb/yd3) 0 0 210 210
Water (lb/yd3) 278 278 315 315
Fine Aggregate (lb/yd3) 1166 1444 1043 1291
Coarse Aggregate (lb/yd3) 1611 1333 1440 1192
MB-AE-90 (oz/yd3) [oz/cwt] 11.3 [1.5]
11.3 [1.5]
13.7 [1.3]
10.5 [1.0]
Glenium 7700 (oz/yd3) [oz/cwt] 29.3 [3.9]
46.5 [6.2]
52.5 [5.0]
75.6 [7.2]
Conversion: 1 lb/yd3 = 0.593 kg/m3 1 oz/yd3 = 38.7 mL/m3
4.2.2. Fresh and Hardened Properties of Concrete Mixtures. All mixes were
first tested in trial batches in the Materials Lab at Missouri S&T in order to work out the
correct mix proportions to obtain the target fresh and hardened properties before the final
specimens were constructed at Coreslab Structures, Inc. (Coreslab) in Marshall, MO.
Final fresh and hardened properties of all four concrete mixtures were measured and
recorded.
In terms of fresh properties, slump, slump flow, and J-ring were performed on the
appropriate mixes, and unit weight and air content were found for all mixes. The standard
slump test was run on the conventional concrete mixes according to ASTM
C143/C143M-10a: Standard Test Method for Slump of Hydraulic Cement Concrete.

B-79
Slump flow for the SCC mixes was measured according to ASTM C1611/C116M-09
Standard Test Method for Slump Flow of Self-Consolidating Concrete using Filling
Procedure B in Section 8.2.2 with the inverted slump mold. Additionally, passing ability
of the SCC mixes was evaluated using ASTM C1621/C1621M-09b: Standard Test
Method for Passing Ability of Self-Consolidating Concrete by J-Ring. Air content for all
mixes was determined using a Type B pressure meter and following ASTM
C231/C231M-10: Standard Test Method for Air Content of Freshly Mixed Concrete by
the Pressure Method. Finally, unit weight of each mix was determined through the
rodding procedure specified in Section 6.3 of ASTM C138/C138M-10b: Standard Test
Method for Density (Unit Weight), Yield, and Air Content (Gravimetric) of Concrete.
The fresh properties of all four mixtures are shown in Table 4.2.
Table 4.2 – Fresh Concrete Properties
Property Concrete Mix ID
C6 S6 C10 S10
Slump (in.) 8.5 N/A 4.5 N/A
Slump Flow (in.) N/A 28 N/A 22
J-Ring (in.) N/A 28 N/A 18
Unit Weight (lb/ft3) 137.6 139.2 142.4 141.6
Air Content (%) 6 7.5 6.5 7
Conversion: 1 in. = 25.4 mm 1 lb/ft3 = 16.0 kg/m3
In terms of hardened concrete properties, compressive strength was measured at
1, 4, 8, 14, and 28 days, and the modulus of elasticity was determined at 28 days. The
normal strength mixes had target one day strengths of 4,000 psi (27.6 MPa) and target 28
day strengths of 6,000 psi (41.4 MPa), while the high strength mixes were designed to
reach 6,000 psi (41.4 MPa) and 10,000 psi (69.0 MPa) at one day and 28 days,
respectively. All compressive strengths were determined by testing 4 in. x 8 in. (102 mm
x 203 mm) cylinders on the Forney compressive testing machine and following ASTM

B-80
C39/C39M-11a: Standard Test Method for Compressive Strength of Cylindrical Concrete
Specimens.
In addition to testing compressive strength, the modulus of elasticity of each
concrete mix was tested and recorded at 28 days. To determine modulus of elasticity of
each mix, a two-ring modulus test frame was used in accordance with the procedure
specified by ASTM C469/C469M-10: Standard Test Method for Static Modulus of
Elasticity and Poisson’s Ratio of Concrete in Compression.
Table 4.3 summarizes the initial and 28 day compressive strengths and the 28-day
moduli of elasticity for the four mixes. The C10 mix was the only mix that did not reach
the one day target strength, and three of the four mixes did not reach the target 28 day
strengths. C6 was just slightly under the goal of 6,000 psi (41.4 MPa), while the two high
strength mixes fell short of the 10,000 psi (69.0 MPa) target strength. However, the 28
day strengths of C10 and S10 were still high enough to be significantly different than the
28 day C6 and S6 strengths. A full 28 day strength curve can be found in Appendix A.
Table 4.3 – Concrete Strengths and 28 Day Moduli of Elasticity
Property C6 S6 C10 S10
f'ci (psi) 4810 5660 5670 6330
f'c (psi) 5730 6950 8480 9250
Modulus of Elasticity (psi) 4,126,500 4,820,500 4,806,800 4,736,900
Conversion: 1 psi = 6.89 kPa
4.2.3. Strand and Mild Reinforcement Design. The beams used for measuring
transfer length and testing development length were designed based on the specimens
constructed for similar research completed by Ramirez and Russell (2008). The beams
were designed to be 17 ft. (5,182 mm) in length with 6.5 in.-wide (165 mm) by 12 in.-
high (305 mm) cross-sections. The prestressing strand for all beams consisted of 0.5 in.-
diameter (12.7 mm), Grade 270, low relaxation seven wire strand from the same roll. As
illustrated in Figure 4.2, the two-strand beams were constructed with two strands placed
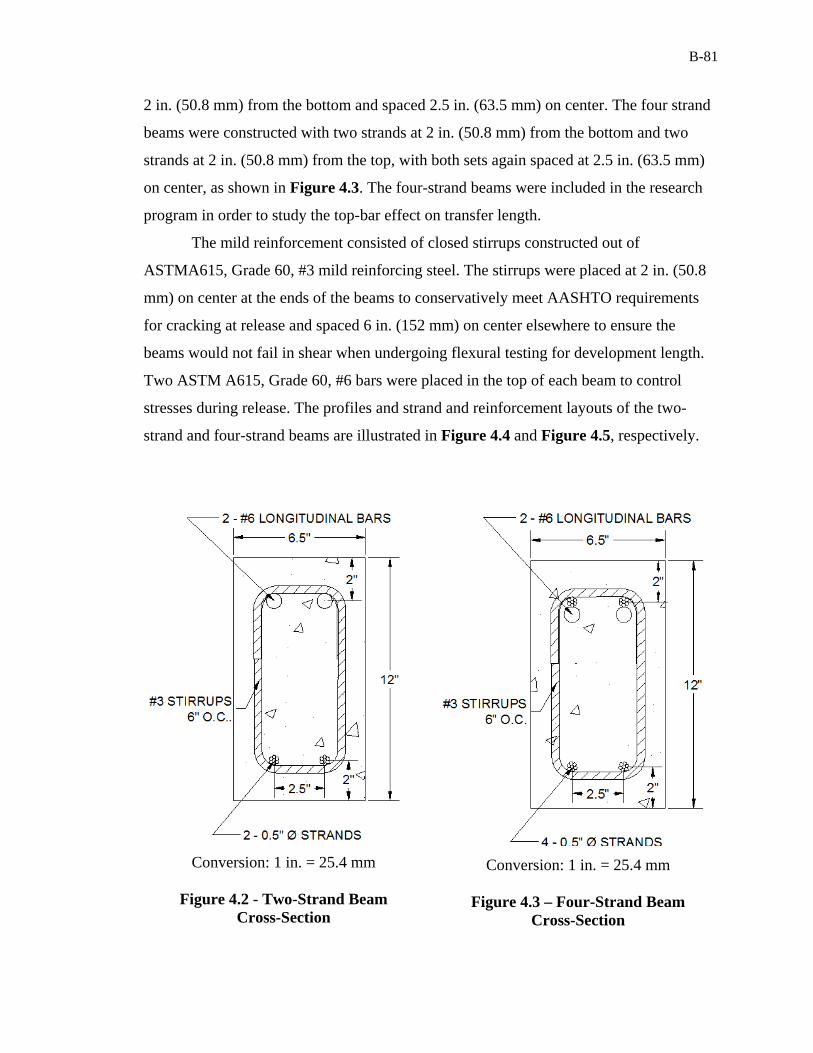
B-81
2 in. (50.8 mm) from the bottom and spaced 2.5 in. (63.5 mm) on center. The four strand
beams were constructed with two strands at 2 in. (50.8 mm) from the bottom and two
strands at 2 in. (50.8 mm) from the top, with both sets again spaced at 2.5 in. (63.5 mm)
on center, as shown in Figure 4.3. The four-strand beams were included in the research
program in order to study the top-bar effect on transfer length.
The mild reinforcement consisted of closed stirrups constructed out of
ASTMA615, Grade 60, #3 mild reinforcing steel. The stirrups were placed at 2 in. (50.8
mm) on center at the ends of the beams to conservatively meet AASHTO requirements
for cracking at release and spaced 6 in. (152 mm) on center elsewhere to ensure the
beams would not fail in shear when undergoing flexural testing for development length.
Two ASTM A615, Grade 60, #6 bars were placed in the top of each beam to control
stresses during release. The profiles and strand and reinforcement layouts of the two-
strand and four-strand beams are illustrated in Figure 4.4 and Figure 4.5, respectively.
Conversion: 1 in. = 25.4 mm
Figure 4.2 - Two-Strand Beam Cross-Section
Conversion: 1 in. = 25.4 mm
Figure 4.3 – Four-Strand Beam Cross-Section

82
Conversion: 1 in. = 25.4 mm 1 ft. = 305 mm
Conversion: 1 in. = 25.4 mm 1 ft. = 305 mm
Figure 4.4 – Profile of Two-Strand Beams
Figure 4.5 – Profile of Four-Strand Beams

B-83
4.3. TRANSFER AND DEVELOPMENT LENGTH BEAM FABRICATION
The beams were cast at Coreslab, a precast plant in Marshall, Missouri. Three
beams designed to measure transfer length and development length were cast per mix:
two two-strand beams and one four-strand beam. Additionally, one beam designed for
shear testing was fabricated from each mix. While the shear beams are shown in the
prestressing bed layout (Figures 4.6 and 4.7), the testing of these beams is not covered in
this report.
The C6 and S6 beams were cast on July 21, 2011, while the C10 and S10 beams
were cast on July 25, 2011. All sets of beams were released at approximately 24-26 hours
after casting. The beams were cast in a 100-ft.-long (30.48 m) prestressing bed with the
two-strand beams cast in one line, the four-strand beams cast in another line, and the
shear beams cast in a third line. The prestressing bed layout for the C6 and S6 beams is
depicted in Figure 4.6, while the layout for the C10 and S10 beams is shown in Figure
4.7.
For each mix, the concrete was mixed at the on-site batch plant and then delivered
to the bed by a sidewinder. Fresh properties were measured and recorded, and once the
batch was deemed acceptable, the sidewinder proceeded to fill the four beam molds (two
two-strand beams, one four-strand beam, and one shear beam). One batch in the
sidewinder was sufficient to complete all four beams, so the mix was kept consistent
from beam to beam. The beams constructed with the conventional concretes were heavily
vibrated, and the SCC beams were also lightly vibrated to ensure full consolidation. The
sidewinder and beam fabrication process is illustrated in Figure 4.8.
Casting for both the normal strength and high strength mixes took place between
late morning and early afternoon on the days of casting. The beams were cured with wet
burlap and plastic overnight, and then the forms were removed early the next morning so
the instrumentation could be applied before releasing the strands. Figure 4.9 shows the
transfer length and the development length beams after removal of the forms and before
instrumentation. Strands were released between 24-26 hours after casting, and bolt cutters
were used to release the strands one at a time. Since transfer length is affected by method
of release, and the harsher the release method, the longer the transfer length, cutting the
strands abruptly with bolt cutters was a conservative, or worst-case, method of release. In

84
Figure 4.6 – C6 and S6 Prestressing Bed Layout
Figure 4.7 – C10 and S10 Prestressing Bed Layout

B-85
Figure 4.8 – Beam Fabrication at Coreslab Structures in Marshall, MO
Figure 4.9 – Beams After Form Removal and Before Instrumentation
order to try and release each strand all at once, one person lined up at each location where
the strand would need to be cut to separate all the beams, and then the strands were
ordered to be cut at the same time on cue. Figure 4.10 demonstrates how bolt cutters

B-86
were used to release the strands. It should be noted that often, not all strands were cut on
the first try at all locations. Consequences of the sequence of strand release will be
discussed in Section 5.3.1.
Figure 4.10 – Bolt Cutting Strands at Release
4.4. TRANSFER LENGTH TEST SETUPS, PROCEDURES, AND RESULTS
Tests were done to determine transfer length at release as well as monitor the
change in transfer length over time. The 95% Average Mean Strain Method, which
depended on readings from demountable mechanical (DEMEC) points and a DEMEC
strain gauge, was the main method employed to determine transfer lengths periodically
from release to approximately 56 days after casting. Additionally, transfer lengths at
release were also determined by the end slip method, which involves calculating an initial
transfer length based on how much the strand slips into the concrete upon cutting. End
slip of the strands was measured by linear potentiometers as well as by hand with a steel
tape measure.
B-87
4.4.1. 95% Average Mean Strain Method. The 95% Average Mean Strain
Method relies on the theory of strain compatibility between the strand and concrete.
When a pretensioned strand is released, the strand loses some stress due to elastic
shortening. In the transfer zone, the stress and strain in the steel and concrete are equal to
zero at the unrestrained end of the beam and increase linearly as the strand transfers its
stress to the concrete through bond. Beyond the transfer zone in the fully bonded area, the
change in strain of the strand from the initial strain to the strain after release is equal to
the strain in the concrete. By measuring concrete surface strain with DEMEC points and
a DEMEC gauge, the point where the concrete strain, or the change in strain of the
strand, becomes constant can be determined, and this point is the transfer length. Russell
and Burns (1993) explained the use of DEMEC points and the 95% Average Mean Strain
Method in depth, and many researchers have since used this process to successfully
determine transfer lengths.
The following subsections explain the process of affixing the DEMEC points,
taking DEMEC readings, converting the readings into strains, plotting the strains, and
determining transfer lengths based on the plots. The final transfer lengths at 1, 4, 8, 14,
28, and approximately 56 days as determined by the 95% Average Mean Strain Method
are presented in subsection 4.4.1.3.
4.4.1.1 DEMEC Instrumentation. On the morning after casting, the forms were
removed, and a permanent marker was used to mark each beam with the correct beam
identification code and to mark each end with cardinal points of NE, NW, SE, or SW
based on casting position. Since each beam contained two strands of interest (the top two
strands on the four strand beams), and each strand had two ends once the beam was
released, the direction labels identified the four distinct transfer lengths per beam.
The DEMEC points were to be applied on the concrete surface at each transfer
length location at the level of the prestressing strand. Therefore, after identifying the
beams, a 5-ft.-long (1.52 m) line was marked starting from the end of the beam at each of
the four transfer length locations on each beam at 2 in. (50.8 mm) from the bottom on the
two strand beams and 2 in. (50.8 mm) from the top on the four-strand beams. A
plexiglass template with nine 1/8-in.-diameter (3.18 mm) holes was then used to mark
where the DEMEC points should be applied. The holes in the template began 0.98 in. (25

B-88
mm) from each end, and the holes were spaced 3.94 in. (100 mm) apart. The template
was lined up with the closest end of the beam, and the first nine holes were marked along
the line that had been drawn. Then the template was repositioned such that the first hole
in the template lined up with the last hole that was marked, and an additional eight points
were marked for a total of 17 points per transfer length location.
Once all the points were marked, a three-person team worked to apply a dab of 5-
minute, concrete-metal epoxy to each marking, affix a DEMEC point, and set the points
with the 7.87 in. (200 mm) setting bar. Figure 4.11 depicts setting the DEMEC points. A
few points could not be set due to surface honeycombing over the area where the point
was supposed to be located. In these cases, the point was simply skipped. An example of
this can be seen in Figure 4.12, where point 4 on C10-4-1_SW could not be placed due
to honeycombing.
Figure 4.11 – Setting DEMEC Points with Setting Bar
After all the points were set, initial readings were taken with the DEMEC gauge
before the strands were cut. Figure 4.13 shows an example of how the DEMEC readings
were taken. Since the DEMEC gauge is designed to measure points set with the 7.87 in.

B-89
(200 mm) setting bar, and the points were spaced 3.94 in. (100 mm) apart, overlapping
readings were taken. If points were missing due to honeycombing or set incorrectly and
unreadable, the readings involving that point were simply skipped. After the initial
reading, subsequent readings were taken immediately after release (1 day), and then at 4,
8, 14, and 28 days, and then at the time of development length testing, or around 56 days.
All subsequent readings were compared back to the initial reading to determine the
change from the initial point prior to strand release.
The beams were stored in the storage yard at Coreslab through 28 days so that the
DEMEC points would not be disturbed by travel from the plant to the university. Figure
4.14 shows the storage conditions for the beams. Although the beams were subject to
temperature and humidity changes from being stored outdoors, the DEMEC reference bar
was not needed for corrections. For this research, the absolute change from the initial
reading did not matter, only the relative change. The 95% Average Mean Strain Method
is not based on the strain readings themselves, but simply where the strain readings along
the length of the beam become constant.
Figure 4.12 – Honeycombing Preventing DEMEC Placement at Point 4 on C10-4-1_SW

B-90
Figure 4.13 – Taking DEMEC Readings
Figure 4.14 – C6 and S6 Beams in Storage Yard at Coreslab

B-91
4.4.1.2 95% Average Mean Strain Procedure. The first step in the 95%
Average Mean Strain Procedure was determining the strains. The initial readings were
subtracted from the final DEMEC readings on a given day, and the change in DEMEC
reading was multiplied by the calibration factor provided by the manufacturer to convert
the DEMEC number into microstrain. Consecutive sets of three readings were then
averaged so the final plot would have a “smoothed curve.” The first point consisted of the
mean of the first two readings, and the mean of every three readings was taken after that.
An illustration of how the readings were averaged can be found in Figure 4.15, and the
pattern shown would continue for all points. If readings were missing due to missing or
faulty points, the other two readings in the set of three were averaged to obtain the mean
strain for that point.
Figure 4.15 – Mean Strains
Once the mean strains and the values’ corresponding distances from the end of the
beam were determined, a plot of microstrain vs. distance from the end of the beam was
created for each strand. A typical smoothed mean strain plot for one strand with readings
from immediately after release is illustrated in Figure 4.16. In this particular case, the

B-92
plot shows the strains along the north and south ends of the east strand of beam S10-2-2.
The plateaus on each of the curves indicate where the strain became constant, which
indicates that the prestressing force had been fully transferred to the beam.
Conversion: 1 in. = 25.4 mm
Figure 4.16 – Typical 95% Average Mean Strain Smoothed Curve for Determining Transfer Lengths – S-10-2-2-NE and S10-2-2_SE
In order to apply the 95% Average Mean Strain Method, the points on each
plateau were averaged to come up with an average mean strain value. Determining which
points should be included in the plateau is subjective, but the method is designed so that
subtle fluctuations in including or not including a point one way or the other has a
negligible effect on the transfer length (Russell and Burns 1993). After an average value
of the plateau was determined, a line was drawn on the plot at 95% of the average mean
0
50
100
150
200
250
300
350
400
450
0 24 48 72 96 120 144 168 192
Mic
rost
rain
Distance from North End of Beam (in)
North South North AMS South AMS
εavg1
εavg2
εavg3
LT

B-93
strain value. The intersection of the 95% average mean strain line and the smoothed
curve on each plot indicates the transfer length for that strand end. This intersection
calculation was done by linearly interpolating between the two curve points where the
95% average mean strain line met the curve.
4.4.1.3 95% Average Mean Strain Transfer Lengths. Four transfer lengths
were determined per beam for a total of eight bottom transfer lengths and four top
transfer lengths per day, per mix. A typical strain plot for one strand is shown in Figure
4.17. The plot contains the strain profiles for DEMEC readings taken at 1, 4, 8, 14, 28,
and approximately 56 days. All strain plots, like the typical plot shown in Figure 4.17,
are included in Appendix D.
Conversion: 1 in. = 25.4 mm
Figure 4.17 – Typical 95% Average Mean Strain Smoothed Curves for Determining Transfer Lengths from 1 to 28 Days – S10-2-2-NE and S10-2-2_SE
0
200
400
600
800
1000
1200
1400
0 24 48 72 96 120 144 168 192
Mic
rost
rain
Distance from North End of Beam (in.)
1 Day 4 Day 8 Day 14 Day 28 Day 57 Day

B-94
Tables 4.4 and 4.5 list transfer lengths for all specimens for 1, 4, 8, 14, 28 and
approximately 56 days as determined by the 95% Average Mean Strain Method. Table
4.4 reports transfer lengths of the top strands of the four-strand beams, while Table 4.5
reports the transfer lengths of the bottom strands of the two-strand beams. Table 4.6
summarizes the average transfer lengths, standard deviations, and coefficients of
variation (COV) for the top strands for each mix at each day. Table 4.7 contains the same
average value, standard deviation, and COV summary for the bottom strands. N/A
indicates that a transfer length reading could not be obtained because the DEMEC
readings did not result in a plot where a conclusive transfer length could be determined.
Table 4.4 – Transfer Lengths for Top Strands of Four-Strand Beams (1-28 Days)
Transfer Length ID 1 Day (in.)
4 Day (in.)
8 Day (in.)
14 Day (in.)
28 Day (in.)
~56 Day(in.)
C6-4-1
NE N/A N/A N/A N/A N/A N/A
NW N/A N/A N/A N/A N/A N/A
SE 31.3 N/A 30.0 31.2 31.8 N/A
SW 18.2 N/A 24.9 24.1 25.9 26.3
S6-4-1
NE 20.5 24.7 22.6 22.2 20.9 22.8
NW N/A N/A N/A N/A N/A N/A
SE N/A N/A N/A N/A N/A N/A
SW 15.9 18.9 21.9 20.1 19.2 22.0
C10-4-1
NE 18.8 19.7 19.4 19.8 23.9 22.3
NW 15.3 16.5 17.6 16.6 17.0 18.8
SE 15.1 13.3 14.7 14.8 15.8 N/A
SW 18.9 19.2 19.2 18.8 19.2 19.7
S10-4-1
NE 18.0 15.5 14.2 14.7 14.7 15.2
NW 17.6 18.4 17.1 17.5 16.6 18.2
SE 27.7 21.2 28.1 27.9 28.0 29.0
SW 14.0 12.8 14.8 15.9 14.0 15.6
Conversion: 1 in. = 25.4 mm
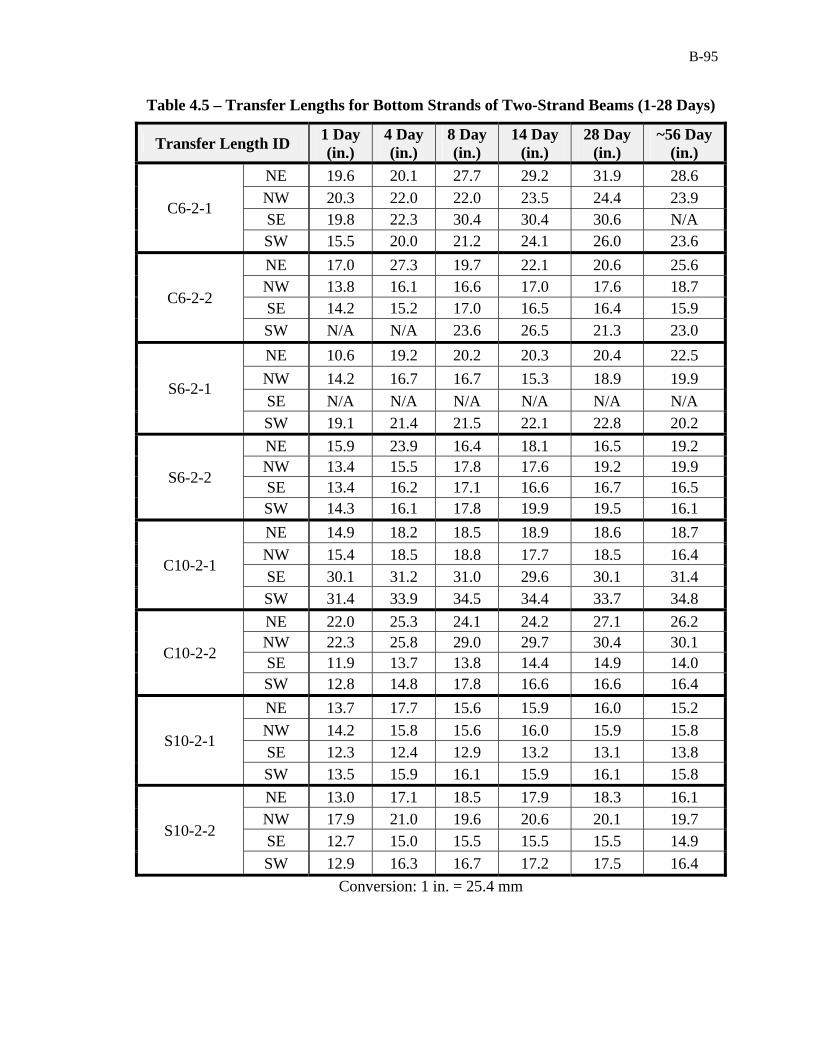
B-95
Table 4.5 – Transfer Lengths for Bottom Strands of Two-Strand Beams (1-28 Days)
Transfer Length ID 1 Day (in.)
4 Day (in.)
8 Day (in.)
14 Day (in.)
28 Day (in.)
~56 Day (in.)
C6-2-1
NE 19.6 20.1 27.7 29.2 31.9 28.6
NW 20.3 22.0 22.0 23.5 24.4 23.9 SE 19.8 22.3 30.4 30.4 30.6 N/A SW 15.5 20.0 21.2 24.1 26.0 23.6
C6-2-2
NE 17.0 27.3 19.7 22.1 20.6 25.6 NW 13.8 16.1 16.6 17.0 17.6 18.7 SE 14.2 15.2 17.0 16.5 16.4 15.9
SW N/A N/A 23.6 26.5 21.3 23.0
S6-2-1
NE 10.6 19.2 20.2 20.3 20.4 22.5
NW 14.2 16.7 16.7 15.3 18.9 19.9
SE N/A N/A N/A N/A N/A N/A SW 19.1 21.4 21.5 22.1 22.8 20.2
S6-2-2
NE 15.9 23.9 16.4 18.1 16.5 19.2 NW 13.4 15.5 17.8 17.6 19.2 19.9 SE 13.4 16.2 17.1 16.6 16.7 16.5 SW 14.3 16.1 17.8 19.9 19.5 16.1
C10-2-1
NE 14.9 18.2 18.5 18.9 18.6 18.7
NW 15.4 18.5 18.8 17.7 18.5 16.4 SE 30.1 31.2 31.0 29.6 30.1 31.4 SW 31.4 33.9 34.5 34.4 33.7 34.8
C10-2-2
NE 22.0 25.3 24.1 24.2 27.1 26.2 NW 22.3 25.8 29.0 29.7 30.4 30.1 SE 11.9 13.7 13.8 14.4 14.9 14.0 SW 12.8 14.8 17.8 16.6 16.6 16.4
S10-2-1
NE 13.7 17.7 15.6 15.9 16.0 15.2
NW 14.2 15.8 15.6 16.0 15.9 15.8 SE 12.3 12.4 12.9 13.2 13.1 13.8 SW 13.5 15.9 16.1 15.9 16.1 15.8
S10-2-2
NE 13.0 17.1 18.5 17.9 18.3 16.1 NW 17.9 21.0 19.6 20.6 20.1 19.7 SE 12.7 15.0 15.5 15.5 15.5 14.9
SW 12.9 16.3 16.7 17.2 17.5 16.4
Conversion: 1 in. = 25.4 mm

B-96
Table 4.6 – Average Transfer Lengths for Top Strands of Four-Strand Beams
Transfer Length ID 1 Day (in.)
4 Day (in.)
8 Day (in.)
14 Day (in.)
28 Day (in.)
~56 Day(in.)
C6-4
Avg. 24.8 N/A 27.5 27.6 28.9 26.3
Std. Dev. 9.25 N/A 3.63 4.98 4.15 N/A
COV 37.4% N/A 13.2% 18.0% 14.4% N/A
S6-4
Avg. 18.2 21.8 22.2 21.1 20.1 22.4
Std. Dev. 3.26 4.15 0.55 1.50 1.20 0.58
COV 17.9% 19.0% 2.5% 7.1% 6.0% 2.6%
C10-4 Avg. 17.0 17.2 17.7 17.5 19.0 20.3
Std. Dev. 2.08 2.95 2.19 2.22 3.59 1.80
COV 12.2% 17.1% 12.3% 12.7% 18.9% 8.9%
S10-4
Avg. 19.3 17.0 18.6 19.0 18.3 19.5
Std. Dev. 5.86 3.63 6.50 6.02 6.52 6.46
COV 30.3% 21.4% 35.0% 31.7% 35.6% 33.1%
Conversion: 1 in. = 25.4 mm
Table 4.7 – Average Transfer Lengths for Bottom Strands of Two-Strand Beams
Transfer Length ID 1 Day (in.)
4 Day (in.)
8 Day (in.)
14 Day (in.)
28 Day (in.)
~56 Day (in.)
C6-2
Avg. 17.2 20.4 22.3 23.7 23.6 24.2
Std. Dev. 2.76 4.07 4.85 5.09 5.69 5.55
COV 16.1% 19.9% 21.8% 21.5% 24.1% 24.4%
S6-2
Avg. 14.4 18.4 18.2 18.6 19.2 19.2
Std. Dev. 2.61 3.20 1.90 2.35 2.17 2.21
COV 18.1% 17.4% 10.5% 12.7% 11.3% 11.5%
C10-2
Avg. 20.1 22.7 23.4 23.2 23.7 23.5
Std. Dev. 7.63 7.53 7.38 7.38 7.35 8.06
COV 37.9% 33.2% 31.5% 31.8% 31.0% 34.3%
S10-2
Avg. 13.8 16.4 16.3 16.5 16.6 15.9
Std. Dev. 1.76 2.44 2.04 2.15 2.09 1.71
COV 12.8% 14.9% 12.5% 13.0% 12.6% 10.7%
Conversion: 1 in. = 25.4 mm

B-97
4.4.2. End Slip Method of Determining Initial Transfer Length. While the
95% Average Mean Strain Method was the main method used for determining both the
transfer lengths at release and the transfer lengths over time, the end slip method was also
used to determine initial transfer lengths. The end slip method computes the initial
transfer length, LT, based on the amount the strand slips into the concrete upon release.
The relationship between the end slip and transfer length can be seen in Eq. 4.1, where
Eps is the modulus of elasticity of the steel strand in ksi, fsi is the stress in the strand
immediately before release in ksi, and Δ is the measured end-slip of the strand in inches.
2 (4.1)
The theory of the relationship between end slip and transfer length was first
thoroughly explained by Anderson and Anderson (1976), and has since been explained
and successfully used by other researchers. When a tensioned strand is cut, the
prestressing force is transferred to the member, shortening the member as well as the
strand. The strand loses some of its prestress, and this loss in stress is known as elastic
shortening. This is shown in Figure 4.18, where fsi is the stress in the strand immediately
before release, and fse is stress in strand after elastic shortening immediately after release.
The stress in the strand varies linearly from zero at the end of the member to fse at a
certain distance from the end of the member, or the transfer length, LT. Because of the
linear relationship between stress and strain, it can also be said that the strain varies
linearly in the transfer zone, from zero at the end to εse = fse/Eps at the transfer length. Due
to strain compatibility, it is assumed that in the fully bonded area, the strain in the
concrete, εce, equals the change in strain of the steel, (fsi-fse)/Eps. The strain in the concrete
therefore varies linearly from zero at the end to (fsi-fse)/Eps at the transfer length. As a
result, in the transfer zone, there is a differential strain that varies from εsi = fsi/Eps at the
end of the member, where both the strain in the concrete and steel are zero, to zero at the
transfer length, where the strain in the concrete equals the change in strain of the steel.
This differential strain is represented by the shaded area in Figure 4.18, and the area is
equal to the slip of the strand relative to the concrete. The area is represented by the

B-98
integral in Eq. 4.2, but because the variations in concrete and steel strains in the transfer
zone are linear, the integral can be simplified to Eq. 4.1.
ε ε x dx ε x dx (4.2)
Figure 4.18 – Relationship Between Steel Stress and Strain and Transfer Length (adapted from Russell and Burns, 1993)
In this test program, the end slips of the strands were measured in two ways: by
computer with electronic linear potentiometers and by hand with a steel ruler. The end
slips measured by each method were then used in conjunction with Eq. 4.1 to determine
transfer lengths.
4.4.2.1 Linear Potentiometer Setup and Procedure. The first method of end
slip determination involved securing linear potentiometers to the ends of the strands
before they were cut and attaching the potentiometers to a Synergy data acquisition
computer (Synergy). The linear potentiometer setup on the strands of a two strand beam

B-99
is depicted in Figure 4.19, while the Synergy data acquisition computer is shown in
Figure 4.20.
Figure 4.19 – Linear Potentiometer Setup
Figure 4.20 – Synergy Data Acquisition Computer Setup
Synergy and Voltage Box
3-Wire Cables
Linear Potentiometers

B-100
The linear potentiometers, which could measure displacements up to 1.5 in. (38.1
mm), were epoxied on to 2 in. x 4 in. (50.8 mm x 102 mm) sections of FRP, which were
then bolted to the strands. The initial epoxy that was used to bond the potentiometers to
the FRP did not perform well on the first set of beams and resulted in numerous failures
between the potentiometer and FRP, so different epoxies and methods of securing the
potentiometers to the sections of FRP were experimented with when the potentiometers
were used on the next release day. The methods of securing the potentiometers to the
FRP bases are described later in this subsection. Two sets of holes were drilled through
the FRP bases, and the potentiometer-FRP assemblies were bolted to the strands with two
0.5-in.-diameter (12.7 mm) U-bolts, as seen in Figure 4.19. Each potentiometer-FRP
assembly was rotated about its strand until the free end was lined up with a smooth
portion of the beam end. Once the potentiometers were lined up in a suitable position, the
U-bolts were securely tightened with a wrench. The potentiometers were attached to the
strands so that initial readings of approximately 0.1 in. (2.54 mm) to 0.5 in. (12.7 mm)
could be read on the Synergy, meaning that the potentiometers were slightly depressed
and making solid contact with the beam. The initial readings were subtracted from the
final slip readings to determine the amount of strand slip. The potentiometers were
attached to a power box with 3-wire cables, and the power box was hooked up to the
Synergy via banana jack cables. The sample rate on the Synergy was set to record data at
1000 samples per second.
The Synergy could record up to 16 data sets at one time. The beams were cut one
line at a time, so the potentiometers were first attached to the line of two-strand beams,
and after all the two-strand beams had been released, the potentiometers were then
attached to the strands of the four-strand beams. Although there were 16 transfer length
locations on the line of the four two-strand beams, only 12 readings could be taken on
each day because the cables could not reach the far north and south ends of the line of
beams. In regards to the four-strand beams, on the first day (C6 and S6 beams), only two
readings could be taken because only two potentiometer-FRP assemblies remained intact
after the release of the two-strand beams. On the second release day (C10 and S10
beams), significantly more potentiometer-FRP assemblies survived the release of the
two-strand beams due to improved bonding methods, so potentiometers were attached to

B-101
all 16 transfer length locations on the two four-strand beams. Although the eight transfer
length locations on the top strands were the only locations of importance on the four-
strand beams, the potentiometers were attached to the bottom strands as well in order to
collect as much data as possible and also determine if any relationship existed between
the bottom strand readings from the two-strand beams and the four-strand beams.
As mentioned, the bonding of the potentiometers to the FRP bases proved to be
problematic. Initially, the surfaces of the FRP sections were roughened with sandpaper,
and an 8-minute multi-use epoxy was used to attach the potentiometers to the FRP plates.
On the first day of use, almost all potentiometers detached or loosened from their FRP
bases due to the sudden release of the strands. It was noted that the epoxy on the broken
bonds had a slightly tacky texture, and because the testing was completed in an open shed
during the summer, one hypothesis was that the heat affected the epoxy’s bonding ability.
Before the potentiometers were used on the next set of beams, several methods
were used to try to improve the bond of the potentiometers to the FRP plates. First, the
surfaces of the FRP plates were roughened to a greater degree by using a very small
grinding wheel attached to a Dremmel. Then, several different epoxies were tested with
the intent of determining which one performed the best. The three epoxies tested included
a 5-minute plastic bonder epoxy, gorilla glue epoxy, and gorilla glue expanding foam.
Additionally, two plastic zip ties were added to each potentiometer-FRP assembly to
facilitate bonding as the epoxy dried as well as add an extra securing measure to the
assembly. A picture of the improved potentiometer-FRP assemblies with zip ties, plastic
epoxy, and gorilla glue expanding foam can be seen in Figure 4.21. Although
significantly more assemblies remained intact on the second release day, there was no
improvement in the acquisition of readable results.
In order to determine the end slips from the data collected on the Synergy, the
files were first downloaded from the Synergy to a personal computer and saved as
Microsoft Excel files. Data was then organized into potentiometer reading vs. time plots.
Since the potentiometers were attached to one line of beams at a time during the release
process, plots were organized to include data from the same line of beams so the same
amount of elapsed time could be shown. Each data series from each potentiometer shows

B-102
readings from a few seconds before the first strand in the line was cut to a few seconds
after the last cut had been made on the line of beams.
Figure 4.21 – Improved Potentiometer-FRP Assemblies with Zip Ties and Plastic Epoxy (Top) and Gorilla Glue Expanding Foam (Bottom)
An example potentiometer vs. time plot is shown in Figure 4.22, which illustrates
the end slips for the C6 line of two-strand beams (C6-2-1 and C6-2-2). The plot shows
the plateau of initial readings for each location where a potentiometer was applied and
then shows the gradual change in the potentiometer readings over time as the strands
were cut. End slip values were determined by averaging the values on the initial and final
plateaus and then subtracting the average initial reading from the average final reading.
However, very few potentiometers actually showed changes in readings that could be
accepted as valid data.
The potentiometer readings vs. time plots show that there were several standard
ways that the potentiometer readings changed as the strands were cut. Sudden jumps to
zero, such as 2-1_NE in Figure 4.22, indicate that the white or red wires in the three wire
cable became disconnected from the potentiometer, or the assembly broke or slipped off

B-103
the strand. Sudden jumps to readings of 1.5 in. (38.1 mm) indicate only the black wire
became disconnected from the potentiometer. Although 1.5-in. (38.1 mm) is not shown
on the y-axis of the plots because the majority of readings were within the range of 0 in.
to 0.5 in. (12.7 mm), it can be assumed that any data series that exits the top of the plot,
such as 2-1_SW in Figure 4.22, goes to 1.5 in. (38.1 mm).
Of the data series that show jumps not immediately going to 0 in. or 1.5 in. (38.1
mm), many of these are negative jumps. In the case of a negative jump, this means the
potentiometer moved out from its initial position and slipped backwards, resulting in an
invalid reading. A positive jump indicates a potentially good reading, where the strand
slipped into the concrete, and the potentiometer was pushed in. However, there is still no
guarantee that a positive jump is a valid end slip. After seeing how sensitive the
potentiometers ended up being in terms of bond to the plate, disconnected wires, and
slippage on the strand, there is a strong possibility that outside stimuli other than the
slipping of the stand, such as accidentally bumping the strand or potentiometer, could
have affected the readings. Despite this possibility, it was determined that all positive
jumps greater than 0.01 in (0.25 mm), which still only corresponds to a transfer length of
approximately 3 in. (76.2 mm), were deemed reasonable to report as valid end slips.
Several other special situations also had to be considered when evaluating the end
slip data. A few of the potentiometers registered a valid positive jump, but after a while
the readings went to 0 in. or 1.5 in. (38.1 mm). For example, 2-1_SE, 2-1_NE, and 2-
2_NW in Figure 4.22 all seemed to register a slight positive slip, but then the readings
abruptly went to 0 in. after 10 to 35 seconds. In these cases, it was determined that the
plateau of the final potentiometer reading was held long enough to be considered valid.
The other type of special case involved series that showed a significant amount of noise
in the data, such as 2-1_NW in Figure 4.22. Noise most likely indicates that the strand or
potentiometer was bumped or somehow affected by outside stimuli. In these cases, if the
potentiometer registered a stable reading after the noise, the ultimate change from initial
to final reading was still considered valid if the change was positive and significant. In
the specific case of C6-2-1_NW, it was decided that even though there was a stable
plateau after the noise, the data should be rendered invalid. The fact that the reading first

B-104
dropped to 0 in. and then increased back up again put the stability and validity of the
potentiometer into question.
In conclusion, the interpretation of end slip data was highly subjective at times,
and a lot of assumptions had to be made about which data could be considered valid. All
potentiometer reading vs. time plots can be found in Appendix E.
Conversion: 1 in. = 25.4 mm
Figure 4.22 – Typical End Slip Plot: C6 Two-Strand Beams Potentiometer Reading vs. Time Elapsed Plot from Synergy
Table 4.8 shows the end slips measured from the data acquisition system. Each
two-strand beam had four possible locations (bottom), while each four strand beam had
eight possible locations (bottom and top). A dash indicates a potentiometer was not
applied at that location due to either the cables being unable to reach the end of the beam
line or a lack of a sufficient number of potentiometers. “N/A” indicates that no
0
0.05
0.1
0.15
0.2
0.25
0.3
0.35
0.4
0.45
0.5
0 10 20 30 40 50 60 70
Pot
enti
omet
er R
eadi
ng (
in.)
Time Elapsed (seconds)
2-1_NE 2-1_SE 2-2_NE 2-1_NW 2-1_SW 2-2_NW

B-105
reasonable data could be obtained from the readings, while a number in the cell is the
measured end slip in inches.
Table 4.8 – Measured End Slips from Linear Potentiometers
Specimen ID Bottom Top
NE (in.)
NW (in.)
SE (in.)
SW (in.)
NE (in.)
NW (in.)
SE (in.)
SW (in.)
C6-2-1 N/A N/A 0.025 0.028 C6-2-2 0.033 0.025 - - C6-4-1 - - - - N/A - - -
S6-2-1 - - N/A N/A S6-2-2 N/A 0.050 N/A 0.051 S6-4-1 - - - - - - - N/A
C10-2-1 - - N/A N/A C10-2-2 N/A N/A 0.041 0.036 C10-4-1 N/A N/A 0.066 N/A N/A N/A N/A N/A
S10-2-1 0.029 0.083 0.025 0.016 S10-2-2 0.031 0.016 - - S10-4-1 N/A N/A N/A 0.050 N/A N/A N/A N/A
Conversion: 1 in. = 25.4 mm
4.4.2.2 Steel Ruler Setup and Procedure. In addition to electronic collection of
end slip data, a steel ruler was also used to measure end slip by hand. First, black
electrical tape was wrapped around the strand with approximately 2 in. (50.8 mm) of
strand showing between the end of the beam and the beginning of the tape. The taped
strands can be seen in Figure 4.23. Next, a steel ruler was used to measure the initial
distance from the surface of the beam to the beginning of the tape. The measurements
were taken to the nearest 1/32 in. (0.79 mm). In order to keep the measurements as
consistent as possible, initial and final measurements were taken by the same individual.
Additionally, for each measurement, a permanent marker was used to mark a line on the
concrete surface, indicating where the steel ruler had been placed to take the initial
measurement. This way, the ruler could be lined up in the same place to take the final

B-106
measurement. Measurements were taken at all possible transfer length locations on all
beams.
Figure 4.23 – Electrical Tape on Strands for Steel Ruler Measurements of End Slip
The end slip measurements in inches as measured by hand with the steel ruler are
presented in Table 4.9. C10-2-1_SW and S10-4-1_NW (bottom) did not have final
readings because on each beam, the portion of concrete with the mark where the ruler had
been lined up to take the initial reading had broken off when the beam was released.
Additionally, C6-4-1_NE (bottom), S6-4-1_SE (bottom), C10-2-2_NW, and S10-4-1_NE
(bottom) showed increases in end slip, which is contrary to what was expected.
Tape Markings

B-107
Table 4.9 – Measured End Slips from Steel Ruler
Specimen ID Bottom Top
NE (in.)
NW (in.)
SE (in.)
SW (in.)
NE (in.)
NW (in.)
SE (in.)
SW (in.)
C6-2-1 0.125 0.031 0.031 0.063 C6-2-2 0.063 0.063 0.031 0.063 C6-4-1 -0.156 0.063 0.094 0.063 0.094 0.063 0.094 0.063
S6-2-1 0.063 0.031 0.031 0.094 S6-2-2 0.063 0.063 0.063 0.000 S6-4-1 0.031 0.063 -0.094 0.031 0.031 0.094 0.063 0.063
C10-2-1 0.000 0.063 0.000 N/A C10-2-2 0.047 -0.125 0.063 0.063 C10-4-1 0.000 0.047 0.000 0.031 0.031 0.016 0.031 0.047
S10-2-1 0.063 0.047 0.047 0.063 S10-2-2 0.047 0.063 0.078 0.094 S10-4-1 -0.016 N/A 0.047 0.031 0.016 0.000 0.031 0.063
Conversion: 1 in. = 25.4 mm
4.4.2.3 Transfer Length Determination from End Slip Data. Once all of the
end slip values were determined, the values were used to calculate initial transfer lengths,
using Eq. 4.1, as discussed in Section 4.3.2. Eps was taken to be the experimentally
determined modulus of elasticity of the prestressing strand, or 29400 ksi (203 GPa), and
fsi, or the stress in the strand before release, was taken to be 75% of 270 ksi (1,862 MPa).
The measured end slips in inches were inserted into the equation to calculate a transfer
length at each applicable location.
2 (4.1)
Tables 4.10 – 4.12 summarize the transfer lengths in inches calculated from the
measured end slips from both the linear potentiometers (Synergy) and the steel ruler. The
last column in each table also includes the transfer lengths determined by the 95%
Average Mean Strain Method from the 1 Day DEMEC data for comparison. Table 4.10
reports the transfer lengths for the bottom strands of the C6 and S6 beams, while Table
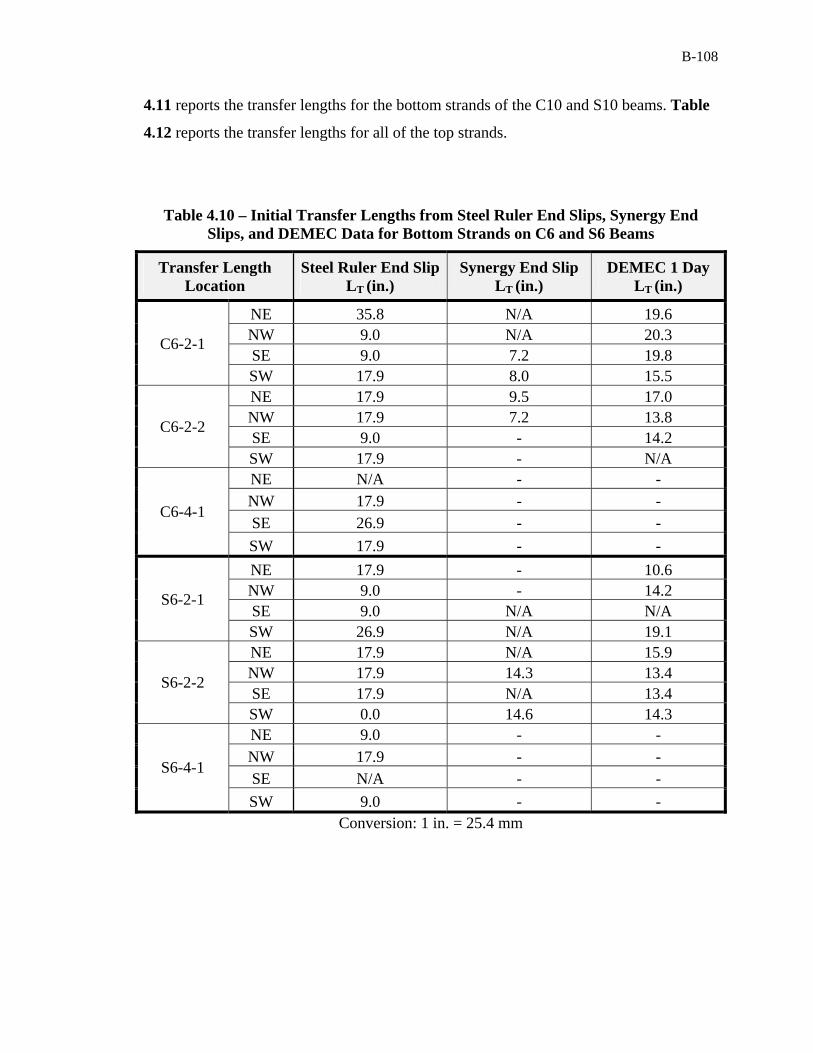
B-108
4.11 reports the transfer lengths for the bottom strands of the C10 and S10 beams. Table
4.12 reports the transfer lengths for all of the top strands.
Table 4.10 – Initial Transfer Lengths from Steel Ruler End Slips, Synergy End Slips, and DEMEC Data for Bottom Strands on C6 and S6 Beams
Transfer Length Location
Steel Ruler End Slip LT (in.)
Synergy End Slip LT (in.)
DEMEC 1 Day LT (in.)
C6-2-1
NE 35.8 N/A 19.6 NW 9.0 N/A 20.3 SE 9.0 7.2 19.8 SW 17.9 8.0 15.5
C6-2-2
NE 17.9 9.5 17.0 NW 17.9 7.2 13.8 SE 9.0 - 14.2 SW 17.9 - N/A
C6-4-1
NE N/A - - NW 17.9 - - SE 26.9 - -
SW 17.9 - -
S6-2-1
NE 17.9 - 10.6 NW 9.0 - 14.2 SE 9.0 N/A N/A SW 26.9 N/A 19.1
S6-2-2
NE 17.9 N/A 15.9 NW 17.9 14.3 13.4 SE 17.9 N/A 13.4 SW 0.0 14.6 14.3
S6-4-1
NE 9.0 - - NW 17.9 - - SE N/A - -
SW 9.0 - - Conversion: 1 in. = 25.4 mm

B-109
Table 4.11 – Initial Transfer Lengths from Steel Ruler End Slips, Synergy End Slips, and DEMEC Data for Bottom Strands on C10 and S10 Beams
Transfer Length Location
Steel Ruler End Slip LT (in.)
Synergy End Slip LT (in.)
DEMEC 1 Day LT (in.)
C10-2-1
NE 0.0 - 14.9 NW 17.9 - 15.4 SE 0.0 N/A 30.1 SW N/A N/A 31.4
C10-2-2
NE 13.4 N/A 22.0 NW N/A N/A 22.3 SE 17.9 11.7 11.9 SW 17.9 10.3 12.8
C10-4-1
NE 0.0 N/A - NW 13.4 N/A - SE 13.4 18.9 -
SW 17.9 N/A -
S10-2-1
NE 13.4 8.3 13.7 NW 17.9 23.8 14.2 SE 13.4 7.2 12.3 SW 17.9 4.6 13.5
S10-2-2
NE 13.4 8.9 13.0 NW 17.9 4.6 17.9 SE 22.4 - 12.7 SW 26.9 - 12.9
S10-4-1
NE N/A N/A - NW N/A N/A - SE 13.4 N/A -
SW 9.0 14.3 - Conversion: 1 in. = 25.4 mm

B-110
Table 4.12 – Initial Transfer Lengths from Steel Ruler End Slips, Synergy End Slips, and DEMEC Data for Top Strands on C6, S6, C10, and S10 Beams
Transfer Length Location
Steel Ruler End Slip LT (in.)
Synergy End Slip LT (in.)
DEMEC 1 Day LT (in.)
C6-4-1
NE 26.9 N/A N/A NW 17.9 - N/A SE 26.9 - 31.3
SW 17.9 - 18.2
S6-4-1
NE 9.0 - 20.5 NW 26.9 - N/A SE 17.9 - N/A
SW 17.9 N/A 15.9
C10-4-1
NE 9.0 N/A 18.8 NW 4.5 N/A 15.3 SE 9.0 N/A 15.1
SW 13.4 N/A 18.9
S10-4-1
NE 4.5 N/A 18.0 NW 0.0 N/A 17.6 SE 9.0 N/A 27.7
SW 17.9 N/A 14.0 Conversion: 1 in. = 25.4 mm
4.5. DEVELOPMENT LENGTH TEST SETUP, PROCEDURE, AND RESULTS
A four-point loading test setup was used to test each end of the beams in flexure
at different embedment lengths, where the embedment length is the distance from the end
of the beam to the first load point, and then determine if the beam failed in flexure or
bond. There is no direct way to test development length, but iterative testing of different
embedment lengths can indicate a range in which the development length falls.
Theoretically, if the embedment length at testing was exactly equal to the development
length, the member would fail in bond and flexure at the same time. A bond failure
indicates the strand could not be fully developed, so the development length is longer
than the tested embedment length, while a flexural failure indicates that the strand was
able to be fully developed, so the embedment length was longer than the actual
development length.

B-111
For each beam, one end was first tested at an embedment length of 58-in. (1,473
mm), and then the other end was tested at an embedment length of 73-in. (1,854 mm).
The shorter length corresponds to approximately 80% of the ACI/AASHTO
recommended development length, and the longer length is approximately equal to the
calculated ACI/AASHTO development length. As noted in Section 2.5, the ACI and
AASHTO equations for development length are equal when the member is less than or
equal to 24-in. (610 mm) deep. The mode of failure was determined through a
combination of noting the crack pattern, determining if the applied moment at failure fell
below or exceeded the calculated nominal moment capacity, and noting if the strands on
the tested end experienced any significant slip. A flexural failure, which would be
indicated by strand yielding or concrete crushing, a failure moment at or above the
nominal moment, and negligible end slips in the strands, would imply that the strand had
enough effective, bonded length to fully develop the moment capacity.
4.5.1. Four-Point Loading Setup and Instrumentation. The four-point load
tests were completed on a steel frame designed for flexural beam testing at the Missouri
S&T Structural Engineering High Bay Research Laboratory (SERL). The beams were
supported on two steel plates on top of rollers, and two hydraulic actuators were used to
apply two point loads at 24 in. (610 mm) apart using spreader beams (Figure 4.24). Since
the beams were tested one end at a time, the supports were positioned so the end of the
beam could be tested at the correct embedment length, and the two point loads would be
positioned in the middle of the simply supported span. The end not being tested was
cantilevered over one of the supports.
For each beam, the 58 in. (1,473 mm) embedment length was tested first, and then
the beam was shifted to test the 73 in. (1,854 mm) embedment length on the other end.
The beam test setups for the 58 in. (1,473 mm) and 73 in. (1,854 mm) embedment length
tests are illustrated in Figures 4.25 and 4.26, respectively. Figures 4.25 and 4.26 also
show how portions of the beam overlapped during each test. The shaded portion of the
beam in Figure 4.25 indicates where the maximum moment region would be during the
73 in. (1,854 mm) test. This shows that the 73 in. (1,854 mm) embedment length was
largely unaffected by the 58 in. (1,473 mm) test because the majority of the end tested in
the 73-in. (1,854 mm) test was cantilevered over one support during the 58 in. (1,473

B-112
mm) test, and therefore unaffected by the loading. Figure 4.26 shows cracks indicating
approximately where the failed portion from the 58 in. (1,473 mm) test would have been
located on the beam during the 73 in. (1,854 mm) test. Although the failed portion of the
beam from the 58 in. (1,473 mm) test fell partly within the span of the 73 in. (1,854 mm)
test, the failed portion did not fall within the maximum moment zone of the 73 in. (1,854
mm) test. Furthermore, additional development length was available on the side of the
beam containing the failed portion from the 58 in (1,473 mm) test due to the cantilevered
portion extending beyond the support.
Figure 4.24 – Four-Point Loading Test Setup for Evaluating 58-in. (1,473 mm) Embedment Length
From these observations, several assumptions were made regarding the effect the
first flexural test would have on the second. First, it was assumed that the bond of 73 in.
(1,854 mm) embedment length would have been negligibly affected by the 58 in. (1,473
Hydraulic Actuators

B-113
mm) test because 68 in. (1,727 mm) of the 73 in. (1,854 mm) was cantilevered. It was
also assumed that the zone experiencing maximum moment during the 73 in. (1,854 mm)
test would still be able to develop full moment capacity because the area was assumed to
be fully bonded to begin with, and the area also should not have seen a moment close to
the nominal capacity during the 58 in. (1,473 mm) test. Figure 4.26 corroborates this by
showing that while cracks did form and extend outside the region between the two point
loads, the failed portion from the 58 in. (1,473 mm) test still did not affect the maximum
moment zone of the 73 in. (1,854 mm) test. Based on these assumptions, the 73 in. (1,854
mm) test on each beam was assumed to be valid. Furthermore, this test setup has been
successfully used in previous research (Ramirez and Russell 2008).
Figure 4.25 – 58 in. (1,473 mm) Embedment Length Test Setup
Figure 4.26 – 73 in. (1,854 mm) Embedment Length Test Setup

B-114
Instrumentation was installed to measure deflection of the beam and slip in the
strands. In order to measure deflection, a Linear Voltage Differential Transformer
(LVDT) was placed on a level section of angle bolted at midspan of the span (Figure
4.27). Also, the linear potentiometers that were used to measure initial end slip of the
strands at release were attached to the strands on the end of the beam to monitor slipping
of the strands (Figure 4.28). In order to keep the slip measurements consistent, the free
end of the potentiometer was lined up at the top of the strands. On some beams, the area
of contact was uneven, so in these cases, 1 in. x 1 in. (25.4 mm x 25.4 mm) sections of
plexiglass were attached to the contact areas with an epoxy, which is also shown in
Figure 4.28. A description of the linear potentiometers can be found in Section 4.3.2.1.
A data acquisition system was used to record the load applied by each actuator, deflection
as measured by the LVDT, and slip in the strands as measured by the linear potentiometer
on each strand.
Figure 4.27 – LVDT Setup for Measuring Deflection at Midspan

B-115
Figure 4.28 – Linear Potentiometer Setup on Four-Point Loading Tests
4.5.2. Four-Point Loading Procedure. Once the beam was positioned at the
correct tested embedment length and the instrumentation was installed, the beam was
loaded in a displacement controlled method until failure. Most of the beams were loaded
at increments of 0.05 in. (1.27 mm) of deflection until the total deflection reached 1.0 in.
(25.4 mm). After 1.0 in. (25.4 mm) of total deflection, the beam continued to be loaded at
increments of 0.05 in. (1.27 mm), but the beam was only checked and marked for cracks
at increments of 0.1 in. (2.54 mm) of deflection until failure. Failure was determined to
be when the beam would no longer support any additional load.
At each deflection step, the beam was checked for cracks, and any crack or
continuation of a crack were marked with permanent marker, and the maximum load for
that step was written next to the end of the crack (Figure 4.29). The load that
corresponded to initial flexural cracking and the ultimate failure mode were visually
noted. The loads applied by the hydraulic actuators, end slips as measured by the
potentiometers, and deflection at midspan as measured by the LVDT were monitored
throughout the test by the data acquisition systems. From the recorded data, moment vs.
deflection and end-slip vs. deflection were plotted for each test, and a typical plot of both
relationships can be found in Figure 4.30. The applied moments include the moment

B-116
from the self-weight of the beam. Additionally, the load cells were located above the
spreader beam, so moment resulting from the dead load of the spreader beam was also
added into the final applied moment.
Figure 4.29 – Cracks Marked with Permanent Marker during Development Length Test
4.5.3. Four-Point Loading Results. In Figure 4.30, the dashed line on the
plot indicates the calculated nominal moment capacity for the beam. The experimentally
determined ultimate strength and modulus of elasticity of the strand as well as the actual
strength of the concrete were used in the calculations of the nominal moment capacities.
In Figure 4.30, the peak of the moment curve exceeds the calculated nominal moment
capacity, and the end slip remained negligible throughout the test. The combination of
these results indicates C10-2-1_58 failed in flexure. Plots, photographs, and a summary
of the loading method and results of each test can be found in Appendix F.

B-117
Conversion: 1 in. = 25.4 mm 1 k-in. = 113 N-m
Figure 4.30 – Typical Moment vs. Deflection and Strand End Slip vs. Deflection Plot
from Four-Point Loading Data
Table 4.12 identifies the observed cracking moment (Mcr), ultimate applied
moment (Mu), and calculated nominal moment (Mn) for each test as well as the ratio of
the ultimate applied moment to the calculated nominal moment, average strand end slip,
visual observations regarding failure, and the final failure mode. In terms of the Mu/Mn
ratio, a ratio greater than one indicates the beam had a greater moment capacity than
predicted, and therefore, the embedment length was conservative. The final failure mode
was determined through analysis of a combination of the Mu/Mn ratio, average strand end
slip, and visual observations. Since all beams had a Mu/Mn ratio greater than one, showed
virtually no end slip in the strands, and largely exhibited concrete crushing in the
maximum moment zone (Figure 4.31), all tests were determined to have failed in flexure.
Table 4.13 summarizes the average moment capacities and average Mu/Mn ratios for
each mix at each embedment length.
00.10.20.30.40.50.60.70.80.91
0100200300400500600700800900
1000
0 0.5 1 1.5 2
End
Sli
p (i
n)
Mom
ent (
k-in
)
Deflection (in)
Moment Mn Avg. SE/SW Strands
Mn = 773.6 k-in

B-118
Figure 4.31 – Typical Concrete Crushing Failure for Development Length Tests
Table 4.12. Nominal and Actual Moment Capacities
Test ID Mcr
(k-in) Mu
(k-in)Mn
(k-in)Mu/Mn
Average End Slip
(in.)
Visual Observations
Failure Mode
C6-2-1_58 469.2 811.8 742.7 1.093 0.000 Concrete Crushing
Flexural
C6-2-1_73 529.5 834.8 742.7 1.124 0.000 Concrete Crushing
Flexural
C6-2-2_58 482.7 836.6 742.7 1.126 0.000 Concrete Crushing
Flexural
C6-2-2_73 498.4 837.6 742.7 1.128 0.000 Concrete Crushing
Flexural
S6-2-1_58 523.3 867.7 757.9 1.145 0.000 Concrete Crushing
Flexural
S6-2-1_73 505.5 878.4 757.9 1.159 0.000 Concrete
Crushing* Flexural
S6-2-2_58 501.7 889.9 757.9 1.174 0.000 Concrete Crushing
Flexural
S6-2-2_73 460.7 843.1 757.9 1.112 0.000 Concrete Crushing
Flexural
* Concrete crushing occurred outside the maximum moment zone
Concrete crushing in maximum moment zone

B-119
Table 4.12 Continued – Nominal and Actual Moment Capacities
Test ID Mcr
(k-in) Mu
(k-in)Mn
(k-in)Mu/Mn
Average End Slip
(in.)
Visual Observations
FailureMode
C10-2-1_58 534.2 880.3 773.6 1.138 0.000 Concrete Crushing
Flexural
C10-2-1_73 495.6 880.7 773.6 1.138 0.000 Concrete Crushing
Flexural
C10-2-2_58 466.7 875.3 773.6 1.132 0.001 Concrete Crushing
Flexural
C10-2-2_73 492.1 885.8 773.6 1.145 0.000 Concrete Crushing
Flexural
S10-2-1_58 499.1 883.3 790.7 1.117 0.000 Concrete Crushing
Flexural
S10-2-1_73 519.7 904.2 790.7 1.144 0.000 Concrete Crushing
Flexural
S10-2-2_58 553.1 901.1 790.7 1.140 0.000 Concrete Crushing
Flexural
S10-2-2_73 530.1 871.7 790.7 1.102 0.000 Concrete Crushing
Flexural
Conversion: 1 in. = 25.4 mm 1 k-in. = 113 N-m
Table 4.13 – Summary of Average Nominal and Actual Moment Capacities
Mix ID Mn (k-in)
58 in. (1,473 mm) 73 in. (1,854 mm)
Mu (k-in) Mu/Mn Mu (k-in) Mu/Mn
C6 742.7 824.2 1.110 836.2 1.126 S6 757.9 878.8 1.160 860.8 1.136
C10 773.6 877.8 1.135 883.3 1.142 S10 790.7 892.2 1.128 888.0 1.123
Conversion: 1 k-in. = 113 N-m

B-120
5. DISCUSSION AND COMPARISON OF RESULTS
5.1. INTRODUCTION
The two main objectives of this research program were to 1) evaluate two
different bond tests and 2) compare bond performance of SCC vs. conventional concrete
through a test program investigating transfer and development lengths of 0.5-in.-diameter
(12.7 mm), Grade 270 prestressing strand.
In terms of analysis of the bond tests, the main goals were to 1) compare and
evaluate the consistency of two types of pullout tests designed to assess bond-ability of
prestressing strand, and 2) determine if pullout test values can be correlated to measured
transfer lengths.
For the transfer and development length testing portion of the study, the goals
were to 1) determine if a significant difference was seen between bond performance of
prestressing strand in SCC vs. conventional concrete, 2) compare experimental transfer
and development length results to values calculated from equations in the AASHTO and
ACI codes to determine if the equations that are being used in design are conservative for
both conventional concrete and SCC, 3) evaluate the effect of concrete strength on bond
performance, and 4) determine if casting position has a significant effect on transfer
length of prestressing strand.
The analyses of results in relation to these research goals are discussed in this
section.
5.2. BOND TEST RESULTS
Several different analyses were performed on the results from the NASP tests in
mortar and concrete and the LBPT. First, the three strand types were analyzed based on
bond acceptance limits of the NASP test in mortar and the LBPT, and then the overall
pass/fail and relative rankings from each test were compared to each other to see if both
tests produced similar results. The results from the NASP tests in concrete were then
analyzed to determine if any differences could be seen between the pullout tests done in
conventional concrete versus SCC and also compared to equations based on concrete
compressive strength determined by previous research.

B-121
5.2.1. Discussion of NASP Test in Mortar Results. The pullout values for 0.1
in. (2.54 mm) and 0.001 in. (0.025 mm) for strand types 101, 102, and 103 are presented
in Table 3.8 but are also displayed graphically in Figure 5.1 for ease of comparison and
discussion. In Figure 5.1, the error bars represent one standard deviation above and
below the average. For reasons discussed in Section 3.3.1, N-101-A and N-101-B were
completed with the same strand source but two different mix designs. N-101-B, N-102-B,
and N-103-B were directly compared to evaluate relative bond quality of the three
sources, and N-101-A was compared to N-101-B to determine the effect of mortar mix
design on pullout values.
Conversion: 1 in. = 25.4 mm 1 lb. = 4.45 N
Figure 5.1 – NASP in Mortar Pullout Values
The NASP test specifies that for 0.5-in.-diameter (12.7 mm) strand, the minimum
average pullout value at a strand slip of 0.1 in. (2.54 mm) is 10,500 lb (46.7 kN), and no
individual test should have a result falling below 9,000 lb (40.0 kN). Strand types 101
and 103 were comparable and showed the best bond quality by exceeding the specified
0
5,000
10,000
15,000
20,000
25,000
N-101-A N-101-B N-102-B N-103-B
Loa
d (l
b.)
0.001 in.
0.1 in.
0.1 in. Limit

B-122
average minimum pullout value by 73% and 75%, respectively. Strand type 102 also
passed, but exceeded the minimum required value by only 11%. Strand type 102 also
came close to failing the individual requirement with N-102-B-4 having a 0.1 in. (2.54
mm) pullout value of 9,300 lb (41.4 kN) (Table 3.6). Still, all three strand types exceeded
the minimum bond acceptance criteria as specified by the NASP test, and as a result, all
sources were deemed to have acceptable bond quality based on the proposed standard.
Although all strands passed strictly based on the criteria, several other
observations were noted that could possibly affect analysis of bond quality. First,
although the bond acceptance criteria in the proposed standard is based on the load at 0.1
in. (2.54 mm) slip, in this research, the loads at 0.001 in. (0.025 mm) slip were also
recorded so the strands could also be analyzed and compared based on “first slip.”
Interestingly, in the analysis of the results, it was discovered that N-103-B had the highest
average pullout value at 0.1 in. (2.54 mm) but the lowest average pullout value at 0.001
in (0.025 mm), as shown in Figure 5.1. Although strand 103 appeared to have the best
bond quality based on the 0.1 in. (2.54 mm) slip load, initial slip was caused by an
extremely low load compared to the other two strand types. First slip is caused by the
sudden loss of adhesion, or the chemical bond that forms between the strand and mortar
or concrete. Currently, the proposed standard bases acceptance only on the 0.1 in. (2.54
mm) pullout load, but the low 0.001 in. (0.025 mm) pullout load could possibly indicate a
problem with adhesion, which could affect bond performance, or at least warrant more
investigation.
Additionally, analysis of the load vs. slip plots of the three strand types showed a
trend that could help distinguish acceptable from poor bond quality. The load vs. slip
plots for N-101-B, N-102-B, and N-103-B are presented in Figures 5.2, 5.3, and 5.4,
respectively. Strand types 101 and 103 both had average pullout values that exceeded the
minimum required average by over 70%, and both load vs. slip plots, shown in Figures
5.2 and 5.4, indicate that for each specimen, the loads were still increasing at a slip of 0.1
in. (0.025 mm). However, strand type 102, which only exceeded the minimum average by
11%, shows a distinct plateau, or softening, and eventually a gradual decrease in load as
slip continues to increase (Figure 5.3). The plateaus in loads for strand type 102, which
were not seen in the load vs. slip plots for types 101 and 103, which clearly had high

B-123
bond quality, is a sign that strand type 102 may still have questionable bond quality even
though the strand type passed based on the threshold values. This concern was also noted
by Hawkins and Ramirez in their due diligence study performed on the four rounds of
NASP testing (2010).
Conversion: 1 in. = 25.4 mm 1 lb = 4.45 N
Figure 5.2 – N-101-B Load vs. Slip
0
5,000
10,000
15,000
20,000
25,000
0 0.02 0.04 0.06 0.08 0.1 0.12
Loa
d (l
b.)
Displacement (in.)
N-101-B-1
N-101-B-2
N-101-B-3
N-101-B-4
N-101-B-5
N-101-B-6
Min.

B-124
Conversion: 1 in. = 25.4 mm 1 lb = 4.45 N
Figure 5.3 – N-102-B Load vs. Slip
Conversion: 1-in. = 25.4 mm 1 lb = 4.45 N
Figure 5.4 – N-103-B Load vs. Slip
0
5,000
10,000
15,000
20,000
25,000
0 0.02 0.04 0.06 0.08 0.1 0.12
Loa
d (l
b)
Displacement (in.)
N-102-B-1
N-102-B-2
N-102-B-3
N-102-B-4
N-102-B-5
N-102-B-6
Min.
0
5,000
10,000
15,000
20,000
25,000
0 0.02 0.04 0.06 0.08 0.1 0.12
Loa
d (l
b)
Displacement (in.)
N-103-B-1
N-103-B-2
N-103-B-3
N-103-B-4
N-103-B-5
N-103-B-6
Min.

B-125
While no known previous bond testing had been done on strand type 101, NASP
tests had been completed on strand types 102 and 103 during NCHRP 10-62, and samples
of the two strand types were sent to Missouri S&T to be blindly tested to see if similar
NASP test results could be obtained. After testing was completed at Missouri S&T, the
previous results from NCHRP 10-62 were acquired and compared to the results from this
test program. The 0.1 in. (2.54 mm) average pullout value results from NCHRP 10-62
and Missouri S&T for strands 102 and 103 and the percent differences are displayed in
Table 5.1.
Table 5.1 – Average Pullout 0.1-in. (2.54 mm) Pullout Values from Missouri S&T and NCHRP 10-62 for Strands 102 and 103
Strand ID
NCHRP 10-62 Pullout Load (lb)
Missouri S&T Pullout Load (lb)
Percent Difference
102 10,600 11,700 9.9% 103 13,300 18,700 33.8%
Conversion: 1 lb = 4.45 N
The results from Missouri S&T were higher than the results from NCHRP 10-62,
and the values from strand type 102 had a difference of 9.9% while there was a 33.8%
difference between the pullout values for strand type 103. The differences between the
average pullout values from NCHRP 10-62 and Missouri S&T could be explained by
several factors. First, the strands were sent to Missouri S&T months after the initial
testing, and that time could have allowed the strand surface quality to degrade. Also, the
mix designs and compressive strength and flow properties of the mixes used for the tests
conducted for NCHRP 10-62 were unknown. Even if the compressive strengths and flow
values for the tests done by NCHRP 10-62 were within the acceptable ranges, as were the
mixes used by Missouri S&T, differences in mix designs, such as the water/cement ratio
or amount and angularity of the sand could have affected the pullout loads.
While the proposed standard only specifies compressive strength and flow ranges
and has no restrictions on mix proportioning, the round robin testing completed for the
development of the NASP test indicated that the desired mix properties can usually be

B-126
obtained by using a mix design with a 0.45 water/cement ratio and a sand/cement ratio of
around 2:1 (Hawkins and Ramirez 2010). Most literature from other research where the
NASP test was completed indicates the use of mix designs similar to this. However, with
the materials available, Missouri S&T was unable to create a mix with the desired
properties using the conventional mix proportions and instead used a mix with a
water/cement ratio of 0.395 and a sand/cement ratio of 0.9:1, which is drastically
different than the proposed typical proportions. There are many unknowns regarding the
treatment of the strands between tests and the mix designs, but on the surface, the
noticeable differences appear to indicate that in this case, the test did not seem to be
reproducible between sites.
The effect of differences in mix proportioning was tested to an extent through
comparing pullout values from strand type 101 in mortar Mix A and mortar Mix B.
Strand type 101 was initially tested months before types 102 and 103, and the mix design
that had originally been used for type 101, mortar Mix A, did not give the same flow
properties when tested in trial batches again before testing 102 and 103, most likely due
to changes in the sand. A new mix design, mortar Mix B, which also met the strength and
flow properties was developed. The mix designs for Mix A and Mix B were discussed in
Section 3.3.1 and can be found in Table 3.2. Mix B had a slightly higher water/cement
ratio and a much lower sand/cement ratio compared to Mix A. After testing was
completed on types 102 and 103 with Mix B, it was decided that remaining samples of
type 101 should be tested in Mix B as well, so all pullout values could be directly
compared. The samples of strand 101 were wrapped in plastic and stored in a closed
container for the six months between the initial and final testing.
The pullout values for strand type 101 in mortar mixes A and B are shown in
Table 5.2. Both the 0.001 in. (0.025 mm) and 0.1 in. (2.54 mm) pullout loads were
consistently lower in Mix B compared to Mix A. The 0.1 in. (2.54 mm) average pullout
value for Mix B was 15.7% lower than Mix A, and the 0.001 in. (0.025 mm) average
pullout value for Mix B was 38.7% lower. The 0.001 in. (0.025 mm) and 0.1 in (2.54
mm) average pullout loads are presented graphically in Figure 5.5, with error bars
representing 95% confidence intervals for each set. When comparing the 0.001 in. (0.025
mm) and 0.1 in. (2.54 mm) pullout loads between the two mixes, the 95% confidence

B-127
interval error bars do not overlap at either slip value. Therefore, both the pullout values at
0.001 in. (0.025 mm) and the pullout values at 0.1 in. (2.54 mm) were found to be
statistically different between the NASP test completed in Mix A and the NASP test
completed in Mix B. As Table 3.8 shows, both mixes had strengths and flows falling
within the required ranges, so it is proposed that the differences in mix proportioning was
the reason behind the difference in pullout values. One hypothesis is that the significant
decrease in sand content in Mix B could have decreased the effects of mechanical
interlock and friction on the strand, causing the lower pullout values.
Since the different mix proportioning between Mix A and Mix B seemed to affect
the pullout values, it would follow that the NASP tests completed at other sites with the
more conventional mix designs should also produce different pullout values from the
values determined at Missouri S&T. However, based on previous tests in literature, the
mixes used for NCHRP 10-62 most likely had more sand than Mix B used by Missouri
S&T, which should increase the pullout values according to the conclusion drawn from
the results of strand 101 in Mix A and Mix B. However, this was not the case, as shown
in Table 5.1.
Table 5.2 – N-101-A and N-101-B Pullout Loads
Specimen No.N-101-A (lb) N-101-B (lb)
0.001 in. 0.1 in 0.001 in. 0.1 in
1 12,500 22,100 8,100 19,100 2 10,600 22,900 6,500 17,300 3 12,600 23,000 7,800 17,800 4 11,100 21,100 7,200 19,100 5 13,100 20,600 8,900 18,200 6 11,500 20,000 5,200 17,800
Avg. 11,900 21,600 7,300 18,200 Std. Dev. 978 1,242 1,304 741
COV 8.2% 5.8% 17.9% 4.1% Conversion: 1 in. = 25.4 mm
1 lb = 4.45 N
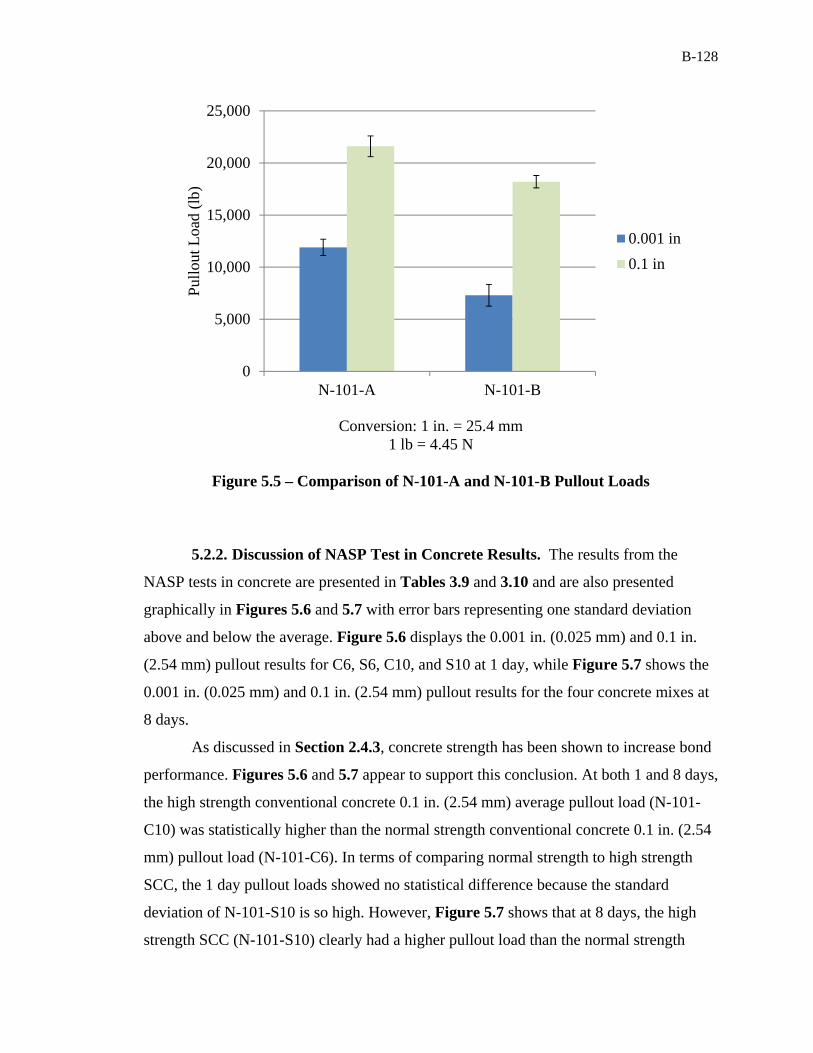
B-128
Conversion: 1 in. = 25.4 mm 1 lb = 4.45 N
Figure 5.5 – Comparison of N-101-A and N-101-B Pullout Loads
5.2.2. Discussion of NASP Test in Concrete Results. The results from the
NASP tests in concrete are presented in Tables 3.9 and 3.10 and are also presented
graphically in Figures 5.6 and 5.7 with error bars representing one standard deviation
above and below the average. Figure 5.6 displays the 0.001 in. (0.025 mm) and 0.1 in.
(2.54 mm) pullout results for C6, S6, C10, and S10 at 1 day, while Figure 5.7 shows the
0.001 in. (0.025 mm) and 0.1 in. (2.54 mm) pullout results for the four concrete mixes at
8 days.
As discussed in Section 2.4.3, concrete strength has been shown to increase bond
performance. Figures 5.6 and 5.7 appear to support this conclusion. At both 1 and 8 days,
the high strength conventional concrete 0.1 in. (2.54 mm) average pullout load (N-101-
C10) was statistically higher than the normal strength conventional concrete 0.1 in. (2.54
mm) pullout load (N-101-C6). In terms of comparing normal strength to high strength
SCC, the 1 day pullout loads showed no statistical difference because the standard
deviation of N-101-S10 is so high. However, Figure 5.7 shows that at 8 days, the high
strength SCC (N-101-S10) clearly had a higher pullout load than the normal strength
0
5,000
10,000
15,000
20,000
25,000
N-101-A N-101-B
Pul
lout
Loa
d (l
b)
0.001 in
0.1 in
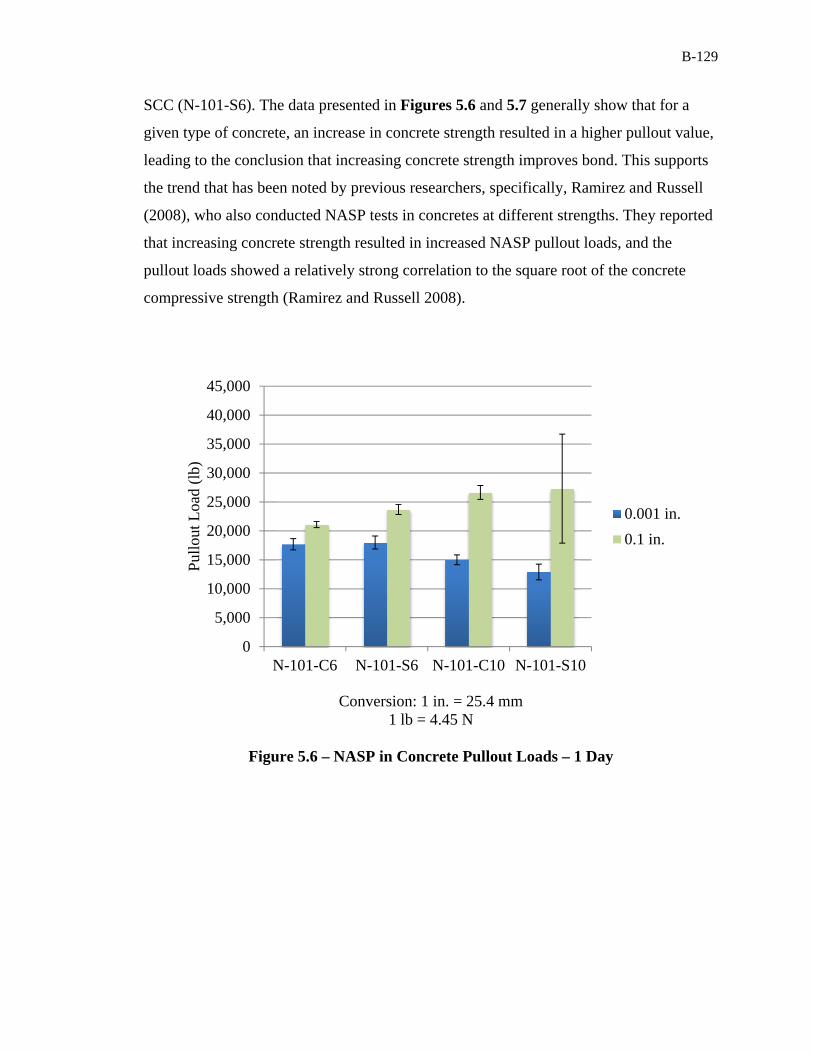
B-129
SCC (N-101-S6). The data presented in Figures 5.6 and 5.7 generally show that for a
given type of concrete, an increase in concrete strength resulted in a higher pullout value,
leading to the conclusion that increasing concrete strength improves bond. This supports
the trend that has been noted by previous researchers, specifically, Ramirez and Russell
(2008), who also conducted NASP tests in concretes at different strengths. They reported
that increasing concrete strength resulted in increased NASP pullout loads, and the
pullout loads showed a relatively strong correlation to the square root of the concrete
compressive strength (Ramirez and Russell 2008).
Conversion: 1 in. = 25.4 mm 1 lb = 4.45 N
Figure 5.6 – NASP in Concrete Pullout Loads – 1 Day
0
5,000
10,000
15,000
20,000
25,000
30,000
35,000
40,000
45,000
N-101-C6 N-101-S6 N-101-C10 N-101-S10
Pul
lout
Loa
d (l
b)
0.001 in.
0.1 in.
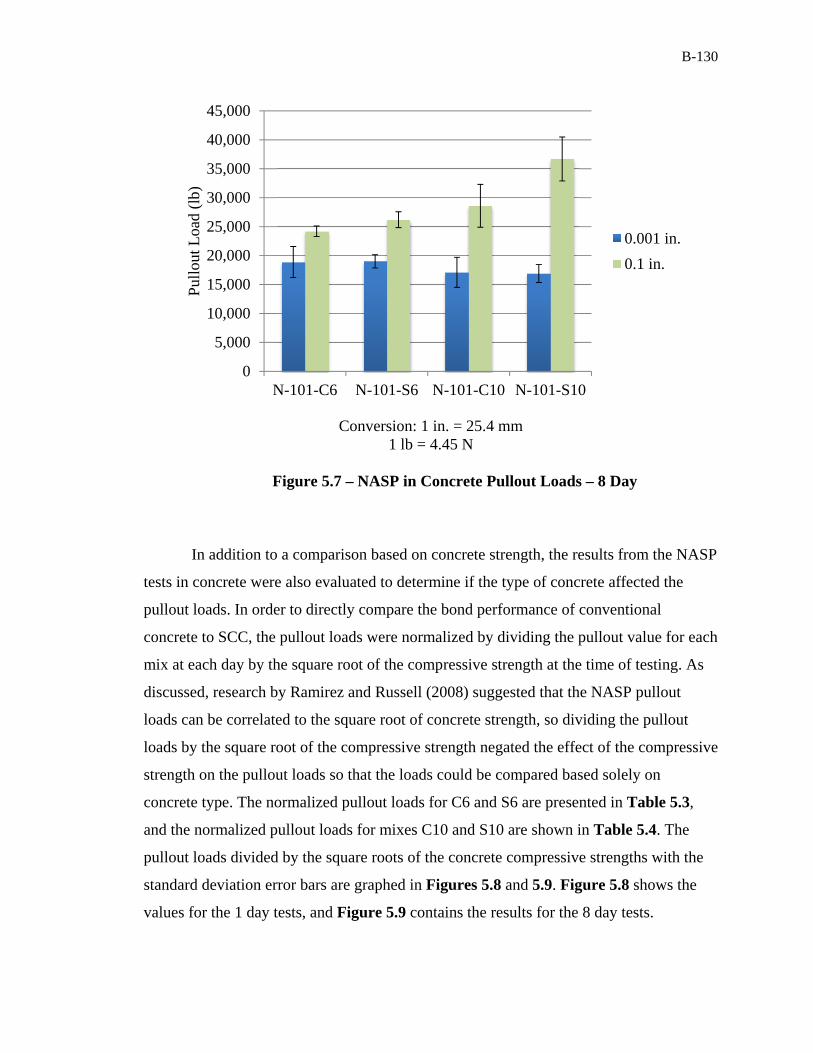
B-130
Conversion: 1 in. = 25.4 mm 1 lb = 4.45 N
Figure 5.7 – NASP in Concrete Pullout Loads – 8 Day
In addition to a comparison based on concrete strength, the results from the NASP
tests in concrete were also evaluated to determine if the type of concrete affected the
pullout loads. In order to directly compare the bond performance of conventional
concrete to SCC, the pullout loads were normalized by dividing the pullout value for each
mix at each day by the square root of the compressive strength at the time of testing. As
discussed, research by Ramirez and Russell (2008) suggested that the NASP pullout
loads can be correlated to the square root of concrete strength, so dividing the pullout
loads by the square root of the compressive strength negated the effect of the compressive
strength on the pullout loads so that the loads could be compared based solely on
concrete type. The normalized pullout loads for C6 and S6 are presented in Table 5.3,
and the normalized pullout loads for mixes C10 and S10 are shown in Table 5.4. The
pullout loads divided by the square roots of the concrete compressive strengths with the
standard deviation error bars are graphed in Figures 5.8 and 5.9. Figure 5.8 shows the
values for the 1 day tests, and Figure 5.9 contains the results for the 8 day tests.
0
5,000
10,000
15,000
20,000
25,000
30,000
35,000
40,000
45,000
N-101-C6 N-101-S6 N-101-C10 N-101-S10
Pul
lout
Loa
d (l
b)
0.001 in.
0.1 in.

B-131
According to Figure 5.8, at 1 day, there was virtually no difference between bond
performance of the normal strength conventional concrete and SCC (C6 and S6) at either
0.001 in. (0.025 mm) or 0.1 in. (2.54 mm) of slip. However, in terms of the high strength
mixes, the conventional concrete mix (C10) appeared to have slightly better bond in
terms of first slip, but there was no difference at 0.1-in. (2.54 mm) pullout loads, mostly
due to the high standard deviation in the results from the S10 mix.
Regarding the 8 day results, Figure 5.9 shows that once again, there was no
difference in bond performance between the normal strength conventional concrete and
SCC (C6 and S6) at either 0.001 in. (0.025 mm) or 0.1 in. (2.54 mm) of strand slip.
According to Figure 5.9, at 8 days, there was also no difference in bond performance
between the high strength conventional and SCC mixes (C10 and S10). Based on the
averages, the S10 mix did appear to somewhat out-perform the C10 mix at the 0.1-in.
(2.54 mm) slip benchmark, but error bars overlapped slightly, so that conclusion could
not be definitively drawn.
In conclusion, for the NASP test performed with concrete instead of mortar,
generally no difference was noted between the bond performance of SCC vs.
conventional concrete. However, one conclusion that could be drawn from analysis of
Figures 5.8 and 5.9 is that the high strength mixes (C10 and S10) consistently had lower
pullout loads at 0.001 in. (0.025 mm) of slip than the conventional strength mixes (C6
and S6), and since the loads had been normalized with respect to concrete strength, this
observation is most likely due to other factors affecting the concrete, such as mix design.
Based on previous discussion, the low first slip load is likely due to a change in the
adhesion between the strand and the concrete, indicating that the high strength mixes had
lower adhesion with the strand than the normal strength mixes. The only major
differences that was noted between the high strength and normal strength mix designs
was that the high strength mixes contained some fly ash replacement and higher
cementitious content, while the normal strength mixes did not, and this could be a
possible factor affecting the adhesion.

132
Table 5.3 – NASP in Concrete Results for C6 and S6 Normalized to √f’c
Mix Day Specimen
ID √f'c (psi)
Load/√f'c at Slip of 0.001 in. Load/√f'c at Slip of 0.1 in.
Load/√f'c (lb√psi)
Avg. Load/√f'c (lb/√psi)
Std. Dev. (lb.)
COV Load/√f'c (lb√psi)
Avg. Load/√f'c (lb/√psi)
Std. Dev. (lb.)
COV
C6
1 Day
N-C6-1 69.35
243.7 255.7 14.0 5.48%
301.4 304.2 7.6 2.51% N-C6-2 252.3 298.5
N-C6-3 271.1 312.9
8 Day
N-C6-4
74.97
242.8
252.6 35.7 14.14%
332.1
323.3 12.1 3.74% N-C6-5 222.8 328.1
N-C6-6 292.1 309.5
S6
1 Day
N-S6-1 75.23
248.6 239.3 15.0 6.26%
317.7 314.6 11.6 3.69% N-S6-2 247.2 324.3
N-S6-3 222.0 301.7
8 Day
N-S6-4
81.79
221.3
232.7 13.9 5.98%
302.0
320.3 16.8 5.25% N-S6-5 228.6 324.0
N-S6-6 248.2 335.0 Conversion: 1 in. = 25.4 mm
1 lb = 4.45 N 1 psi = 6.89 kPa

B-133
Table 5.4 – NASP in Concrete Results for C10 and S10 Normalized to √f’c
Mix Day Specimen
ID √f'c (psi)
Load/√f'c at Slip of 0.001 in. Load/√f'c at Slip of 0.1 in.
Load/√f'c (lb√psi)
Avg. Load/√f'c (lb/√psi)
Std. Dev. (lb.)
COV Load/√f'c (lb√psi)
Avg. Load/√f'c (lb/√psi)
Std. Dev. (lb.)
COV
C10
1 Day
N-C10-1
75.30
185.9
198.8 11.3 5.68%
N/A
353.9 16.0 4.51% N-C10-2 203.2 365.2
N-C10-3 207.2 342.6
8 Day
N-C10-4
89.16
173.8
191.8 29.2 15.20%
273.7
321.1 41.6 12.95% N-C10-5 176.1 338.7
N-C10-6 225.4 351.0
S10
1 Day
N-C10-1
79.56
170.9
161.7 17.1 10.55%
364.5
342.7 118.4 34.55% N-S10-2 142.0 214.9
N-S10-3 172.2 448.7
8 Day
N-S10-4
92.74
199.5
182.6 16.7 9.16%
427.0
395.7 41.0 10.35% N-S10-5 166.1 410.8
N-S10-6 182.2 349.4
Conversion: 1 in. = 25.4 mm 1 lb = 4.45 N
1 psi = 6.89 kPa
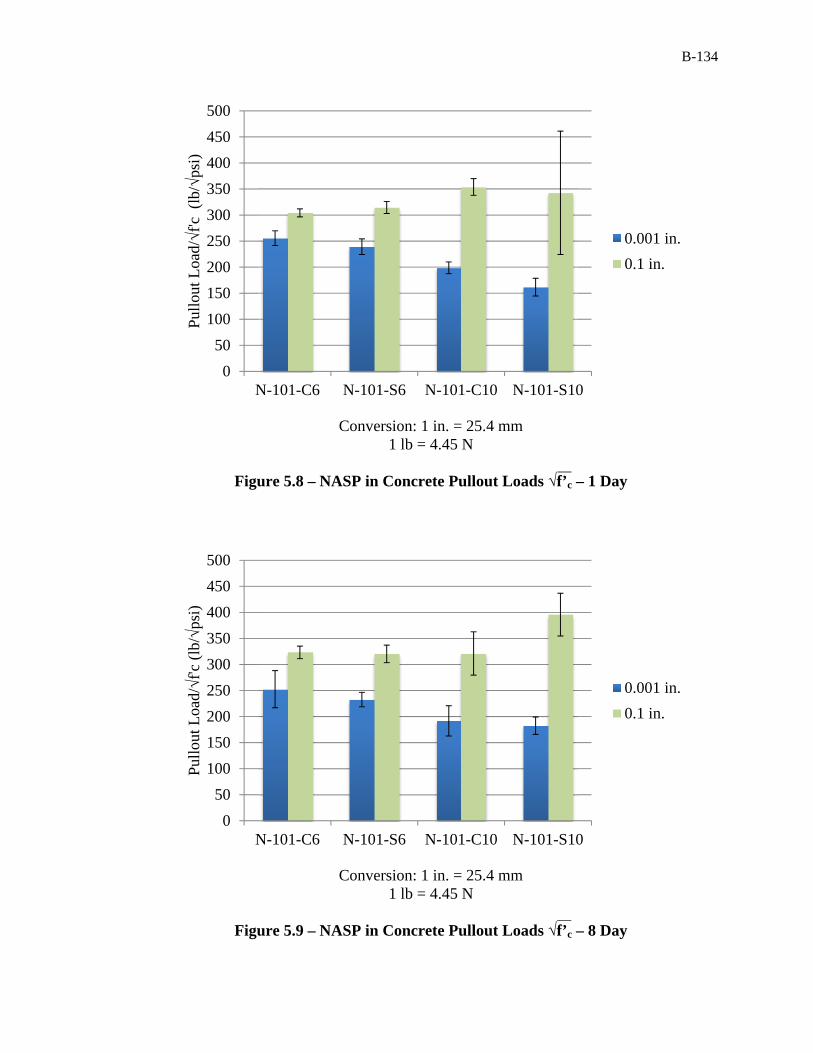
B-134
Conversion: 1 in. = 25.4 mm 1 lb = 4.45 N
Figure 5.8 – NASP in Concrete Pullout Loads √f’c – 1 Day
Conversion: 1 in. = 25.4 mm 1 lb = 4.45 N
Figure 5.9 – NASP in Concrete Pullout Loads √f’c – 8 Day
0
50
100
150
200
250
300
350
400
450
500
N-101-C6 N-101-S6 N-101-C10 N-101-S10
Pul
lout
Loa
d/√f
'c (
lb/√
psi)
0.001 in.
0.1 in.
0
50
100
150
200
250
300
350
400
450
500
N-101-C6 N-101-S6 N-101-C10 N-101-S10
Pul
lout
Loa
d/√f
'c (
lb/√
psi)
0.001 in.
0.1 in.

B-135
5.2.3. Discussion of LBPT Results. The LBPT procedure is described in
Section 3.4, and the results for all specimens can be found in Table 3.13. The average
first slip load and peak load results, along with the standard deviation and coefficient of
variation (COV), for each strand type are presented in this section in Table 5.5.
Table 5.5 – LBPT Results Statistical Summary
Strand ID
First Slip Load Peak Load Avg. Load
(k) Std. Dev.
(k) COV
Avg. Load (k)
Std. Dev. (k)
COV
101 19.1 2.3 12.27% 36.6 2.1 5.76% 102 12.7 1.7 13.53% 27.8 2.9 10.40%103 19.3 3.3 17.16% 34.5 4.6 13.30%
Conversion: 1 kip = 4.45 kN
The average load values were compared to the limits set forth by Logan (Logan,
personal communication, October 20, 2011). Logan recommends that in order for a
strand to have acceptable bond quality, the average first slip load must exceed 16 kips
(71.1 kN), and the average peak load value must be greater than 36 kips (160.1 kN).
Additionally, Logan set the maximum allowable coefficient of variation for the peak
loads at 10%. The average first slip load and peak load for each strand type as well as the
first slip and peak minimum limits are presented graphically in Figure 5.10. The error
bars represent one standard deviation from either side of the mean.
As seen in Figure 5.10, strand type 101 was the only strand type that passed the
LBPT with the requirements proposed by Logan. The average first slip load and average
peak load exceeded the limits by 19.1% and 1.76%, respectively, and the coefficient of
variation for the peak load values was 5.76%, falling well below the 10% coefficient of
variation limit. Meanwhile, strand type 103 passed the load at first slip limit, but the
average peak load fell short of the 36 kip (160.1 kN) minimum limit. Strand type 102 did
not pass either limit. Strand types 102 and 103 also had coefficient of variation values for
the peak loads exceeding 10%.

B-136
Conversion: 1 kip = 4.45 kN
Figure 5.10 – LBPT Average First Slip and Peak Pullout Loads
Visual observations and results from the towel wipe test, which were presented in
Table 3.13, were also compared to the final results to determine if qualitative data could
be any indication of the bond performance of the strand. Some researchers have found
that rust improves bond quality, yet strand type 102 had the most observed rust and the
heaviest residue, but also the lowest average pullout values. However, strand L-102-4
was the only strand that ruptured in the concrete, and this strand was noted to have the
highest number of rust spots and heaviest residue out of all the strand samples. Strand
types 101 and 103 had very comparable pullout values, and both strands were noted to
have light to moderate residue and very little rust. In this project, it appeared that lighter
residue led to higher pullout values, but only three strand samples were tested, and due to
limited data and the subjective nature of the visual tests, it was determined that no clear
correlation existed between amount of rust and residue and strand bond performance.
5.2.4. Comparison of NASP Test in Mortar Results to LBPT Results. One of
the purposes of this research program was to compare the NASP test in mortar to the
LBPT to determine if one test can be deemed as better or more consistent than the other.
0.0
5.0
10.0
15.0
20.0
25.0
30.0
35.0
40.0
45.0
L-101 L-102 L-103
Loa
d (k
ip)
SlipLoad
PeakLoad
SlipLimit
PeakLimit

B-137
The results from both tests were evaluated to see if the overall results from the different
strand types were consistent from test to test.
The pullout results from the NASP in mortar and the LBPT are presented for
comparison in Table 5.6. The values presented from the NASP tests are the loads at 0.1
in (2.54 mm) slip from the tests completed in mortar Mix B, while the values presented
from the LBPT are the peak pullout loads. Table 5.6 displays the six individual results
for each strand and each test as well as the average value, standard deviation, and
coefficient of variation for each strand and test.
One observation that can be made from examination of Table 5.6 is that for a
given strand type, the coefficient of variation determined from the NASP test and LBPT
was remarkably similar (within 1-2%). This would indicate that both the NASP test and
LBPT seem to be more or less equal in terms of consistency of results.
In order to determine if a correlation existed between the LBPT and NASP test in
mortar performed in this study, the LBPT peak pullout loads and NASP pullout loads at
0.1 in (2.54 mm) slip were plotted against each other. The data was manipulated so that
for the results for each strand type, the six NASP pullout loads and six LBPT pullout
loads were sorted from lowest to highest within their respective tests. Then, within each
strand type, the lowest NASP pullout value was plotted against the lowest LBPT pullout
value, and the second lowest values from each test were plotted against each other, and so
on. The plot of LBPT pullout loads vs. NASP in mortar pullout loads is presented in
Figure 5.11.
The linear trend line through the points in Figure 5.11 yielded an R2 value of
0.77, which shows there was a somewhat strong correlation between the NASP in mortar
pullout loads and LBPT pullout loads in this study. Based on this comparison as well as
the previous observation with respect to comparing coefficients of variation for each test
method, it appears that either the LBPT or NASP test are equally valid approaches to
evaluating bond performance of prestressing strand. However, the limits set on passing
may need some refinement, as two of the strand sources passed the proposed NASP
standard but did not pass the LBPT requirements.

B-138
Table 5.6 – NASP in Mortar and LBPT Pullout Loads
Strand Type
Specimen No. or Statistic
NASP (Mix B) 0.1 in Pullout Load (lb)
LBPT Peak Pullout Load (k)
101
1 19,100 34.3 2 17,300 34.2 3 17,800 35.9 4 19,100 38.8 5 18,200 38.5 6 17,800 38.1
Avg. 18,200 36.6 Std. Dev. 741 2.1
COV 4.07% 5.76%
102
1 11,000 27.1 2 12,400 27.1 3 12,600 31.0* 4 9,300 40.1** 5 12,400 25.1 6 12,300 31.9
Avg. 11,700 27.8 Std. Dev. 1,296 2.9
COV 11.07% 10.40%
103
1 15,800 33.5 2 20,500 33.5 3 18,600 38.7 4 16,000 35.6 5 19,700 26.6 6 21,300 39.2
Avg. 18,700 34.5 Std. Dev. 2,311 4.6
COV 12.36% 13.30% * - Data collection accidently stopped early, so value determined by observation. ** - Strand fractured, value not included in average or standard deviation.
Conversion: 1 in. = 25.4 mm 1 lb = 4.45 N
1 kip = 4.45 kN
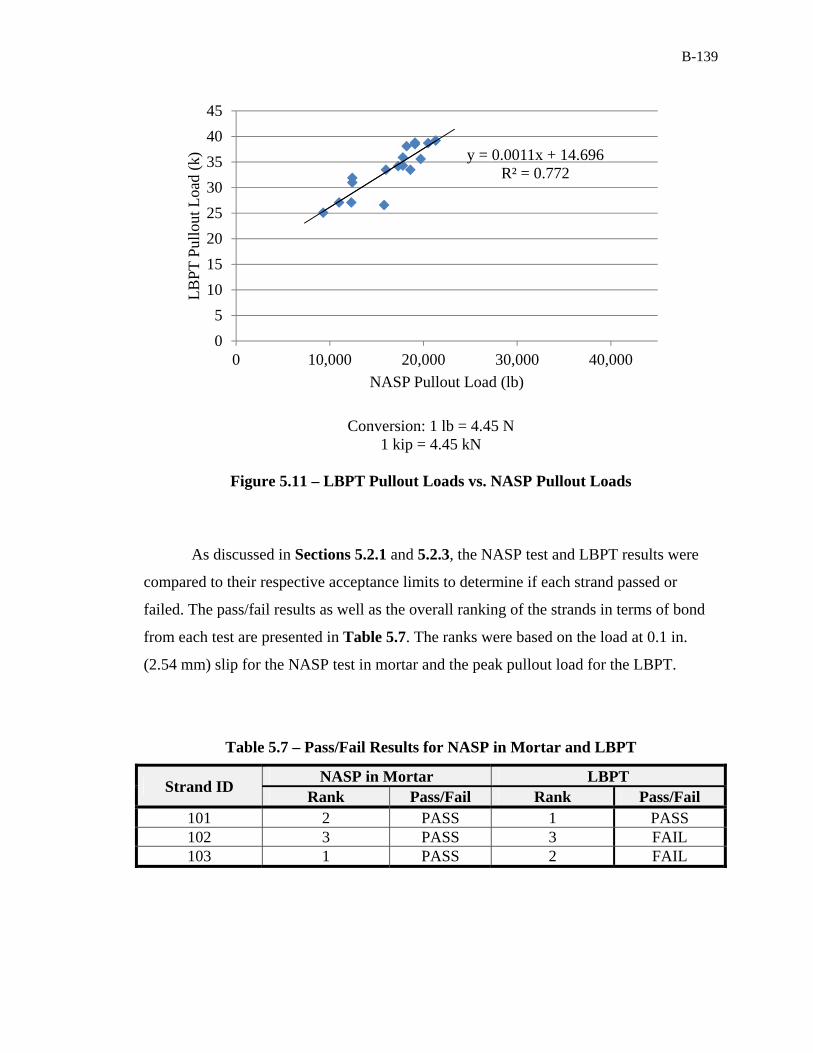
B-139
Conversion: 1 lb = 4.45 N 1 kip = 4.45 kN
Figure 5.11 – LBPT Pullout Loads vs. NASP Pullout Loads
As discussed in Sections 5.2.1 and 5.2.3, the NASP test and LBPT results were
compared to their respective acceptance limits to determine if each strand passed or
failed. The pass/fail results as well as the overall ranking of the strands in terms of bond
from each test are presented in Table 5.7. The ranks were based on the load at 0.1 in.
(2.54 mm) slip for the NASP test in mortar and the peak pullout load for the LBPT.
Table 5.7 – Pass/Fail Results for NASP in Mortar and LBPT
Strand ID NASP in Mortar LBPT
Rank Pass/Fail Rank Pass/Fail 101 2 PASS 1 PASS 102 3 PASS 3 FAIL 103 1 PASS 2 FAIL
y = 0.0011x + 14.696R² = 0.772
0
5
10
15
20
25
30
35
40
45
0 10,000 20,000 30,000 40,000
LB
PT
Pul
lout
Loa
d (k
)
NASP Pullout Load (lb)

B-140
The correlation between tests was not consistent. As seen in Table 5.7, strand
type 101 was the only type that was considered to have acceptable bond performance by
both tests. Strand types 102 and 103 both passed the NASP test in mortar but failed the
LBPT. The relative bond between strands was also not the same between tests. Strand
type 102 had the worst bond performance in both the NASP and LBPT, but strand type
103 had the best performance in the NASP test, while strand type 101 had the best
performance in the LBPT. However, strand types 101 and 103 were extremely
comparable, and average pullout values between the two types were within 2.7% for the
NASP test and 6.0% for the LBPT. Also, error bars show the standard deviations for the
two types overlapped significantly for the NASP Test (Figure 5.1) as well as the LBPT
(Figure 5.10). Therefore, the differences in rank are not statistically significant for types
101 and 103. The two test methods can be considered fairly accurate with respect to
relative bond between strands, but in terms of absolute bond and rejecting or accepting
strand based on set limits, the NASP test passed all three types while the LBPT only
passed one out of the three.
5.3. TRANSFER LENGTH TEST RESULTS
The transfer lengths determined from DEMEC data and the 95% Average Mean
Strain Method, as well as values determined from the end slip values measured by the
Synergy data acquisition and steel ruler, are evaluated and discussed in this subsection.
5.3.1. Discussion of 95% Average Mean Strain Transfer Length Results. The
primary method used for determining transfer lengths was the 95% Average Mean Strain
Method. The process of developing strain profiles based on DEMEC readings and
determining the transfer lengths is described in Section 4.4.1. The final individual
transfer lengths at 1, 4, 8, 14, 28, and approximately 56 days as determined by the 95%
Average Mean Strain Method are presented in Tables 4.3 and 4.4, and the average
transfer lengths and the standard deviations for each mix for the top and bottom strands
are summarized in Tables 4.5 and 4.6. The averages and standard deviations are based on
all of the individual results from each mix, but additional analysis in this section revealed
individual measurements that could potentially be removed when comparing averages to

B-141
each other to determine if differences between measured transfer lengths from mix to mix
are statistically significant.
As discussed in Section 2.4.5, previous research has indicated that a transfer
length at a “live end,” or end directly adjacent to where the strand is first released, is
typically longer than a transfer length at a “dead end,” or end not adjacent to the place
where the strand is first cut. In this research, the live and dead ends of the strands were
not directly monitored. In this research program, for release of each strand, one person
was positioned at each location where the strand would need to be cut to separate all the
beams in the line, and all locations were attempted to be cut at the same time using bolt
cutters, as described in Section 4.3. However, it was very hard for the workers to sever
all locations at exactly the same time, and typically one or two locations on one strand
were severed before others. It was not noted at the site which location on each strand was
cut first, but it was surmised that the linear potentiometer data would be able to indicate
which ends were severed first. However, due to the proven unreliability of the
potentiometers, the electronically collected data could not reliably indicate the sequence
of strand release.
Although there is no hard evidence as to the sequence of release, analysis of the
transfer length data does potentially indicate where some of the live ends could have
occurred. Figures 5.12 and 5.13 show the casting layouts and initial (1 day) transfer
lengths determined by the 95% Average Mean Strain Method at each individual location.
The circles indicate locations that have comparatively higher measured transfer lengths,
which could possibly indicate the live end locations.
In Figure 5.12, C6-4-1_SE is the only location that appears unusually high, but
no definite conclusion could be made regarding a live end because only two transfer
lengths out of four were able to be determined for the top strands in the C6 mix. The
transfer lengths at C6-4-1_NE and C6-4-1_NW were not established because there were
no defined plateaus on the strain profiles. This could be due to faulty DEMEC readings,
or the strains were in fact still increasing, which could indicate that those locations were
live ends. However, there was no way to come to definite conclusions, so averages were
not adjusted for either of the normal strength mixes for two strands or four strands.

142
Conversion: 1 in. = 25.4 mm
Figure 5.12 – C6 and S6 Transfer Length Locations
Conversion: 1 in. = 25.4 mm
Figure 5.13 – C10 and S10 Transfer Length Locations

B-143
Some more refined conclusions could be made regarding the high strength mixes,
based on observations of Figure 5.13. Although S10-4-1_SE was not statistically an
outlier, the value was still comparatively high, and several different transfer length
averages were calculated for comparison. The standard average transfer length, S10-4,
was taken with all four values, and then the potential dead end transfer length average,
S10-4 (D), was calculated with the NE, NW, and SW values while the SE value was
taken as the live end transfer length, S10-4 (L).
According to Figure 5.13, the four locations that seem to definitively indicate live
ends are C10-2-1_SE, C10-2-1_SW, C10-2-2_NE, and C10-2-2_NW. Due to significant
and consistent differences in transfer lengths, it appears that the east strand in the two-
strand line of high strength beams was first severed between C10-2-1_SE and C10-2-
2_NE, and the first cut on the west strand was made between C10-2-1_SW and C10-2-
2_NW. Photographic evidence taken at the time of release seems to confirm this
determination. Figure 5.14 was taken during release of the east strand of the line of the
high strength two-strand beams, and the worker cutting the location between beams C10-
2-1 and C10-2-2 is clearly in motion, while the worker between C10-2-2 and S10-2-1 has
not started to cut the strand. The person who cut the east strand between C10-2-1 and
C10-2-2 also cut the west strand between the two beams, and if he was early on the first
strand, chances are reasonable that he was early on the second strand as well. Although
the remaining workers cannot be seen, the fact that evidence shows the location between
C10-2-1 and C10-2-2 was cut before at least one other location combined with the high
transfer length results leads to the assumption that ends C10-2-1_SE, C10-2-1_SW, C10-
2-2_NE, and C10-2-2_NW could reasonably be considered the live ends for that line.
Therefore, in addition to the standard full C10-2 average for each day, the adjusted
average C10-2 (D) was taken for the dead ends, and the adjusted average C10-2 (L) was
calculated for the live ends. The different transfer length averages for C10-2 at 1, 4, 8, 14,
and 28 days were compared to transfer lengths in the S10 mix.

B-144
Figure 5.14 – Release of C10-2 Beams
The standard and modified dead and live end averages, standard deviations, and
coefficients of variation for each mix for the bottom and top strands are shown in Tables
5.8 and 5.9, respectively. The “standard” values are the averages and standard deviations
calculated based on all reported transfer lengths, and the “modified” values are the live
end or dead end averages and standard deviations taken when applicable. C10-2 (L)
values in Table 5.8 are the averages at each day for the possible live ends for the bottom
strands and include C10-2-1_SE, C10-2-1_SW, C10-2-2_NE, and C10-2-2_NW, while
C10-2 (D) values are the dead end averages, which include the remaining ends in the
C10-2 beams. S10-4 (L) for the top strands in Table 5.9 is only the S10-4-1_SE value at
each day, and S10-4 (D) values are the averages of the remaining three ends. The
different averages were compared to determine if there was any statistical difference
between transfer lengths measured in the conventional concrete and SCC and then
compared to values calculated by AASHTO and ACI equations. Throughout the
remainder of this report, it should be noted that a mix identification with a “2” suffix
indicates bottom strand average, while a mix identification with a “4” suffix indicates a
top strand average.
C10-2-2
C10-2-1

B-145
Table 5.8 – Standard and Modified Transfer Length Averages (Bottom Strands)
Bottom Strands 1 Day(in.)
4 Day(in.)
8 Day(in.)
14 Day(in.)
28 Day (in.)
~56 Day(in.)
C6-2 Avg. 17.2 20.4 22.3 23.7 23.6 22.8
Std. Dev. 2.76 4.07 4.85 5.09 5.69 4.22 COV 16.1% 19.9% 21.8% 21.5% 24.1% 18.5%
S6-2 Avg. 14.4 18.4 18.2 18.6 19.2 19.2
Std. Dev. 2.61 3.20 1.90 2.35 2.17 2.21 COV 18.1% 17.4% 10.5% 12.7% 11.3% 11.5%
C10-2
Avg. 20.1 22.7 23.4 23.2 23.7 23.5
Std. Dev. 7.63 7.53 7.38 7.38 7.35 8.06
COV 37.9% 33.2% 31.5% 31.8% 31.0% 34.3%
C10-2 (D)* Avg. 13.7 16.3 17.2 16.9 17.2 16.4
Std. Dev. 1.70 2.41 2.31 1.92 1.78 1.90 COV 12.3% 14.8% 13.4% 11.4% 10.4% 11.6%
C10-2 (L)* Avg. 26.5 29.1 29.7 29.5 30.3 30.6
Std. Dev. 4.99 4.22 4.33 4.17 2.69 3.55 COV 18.9% 14.5% 14.6% 14.1% 8.9% 11.6%
S10-2 Avg. 13.8 16.4 16.3 16.5 16.6 15.9
Std. Dev. 1.76 2.44 2.04 2.15 2.09 1.71 COV 12.8% 14.9% 12.5% 13.0% 12.6% 10.7%
* = Modified averages, which include only the assumed dead end (D) or assumed live end (L) transfer length values
Conversion: 1 in. = 25.4 mm
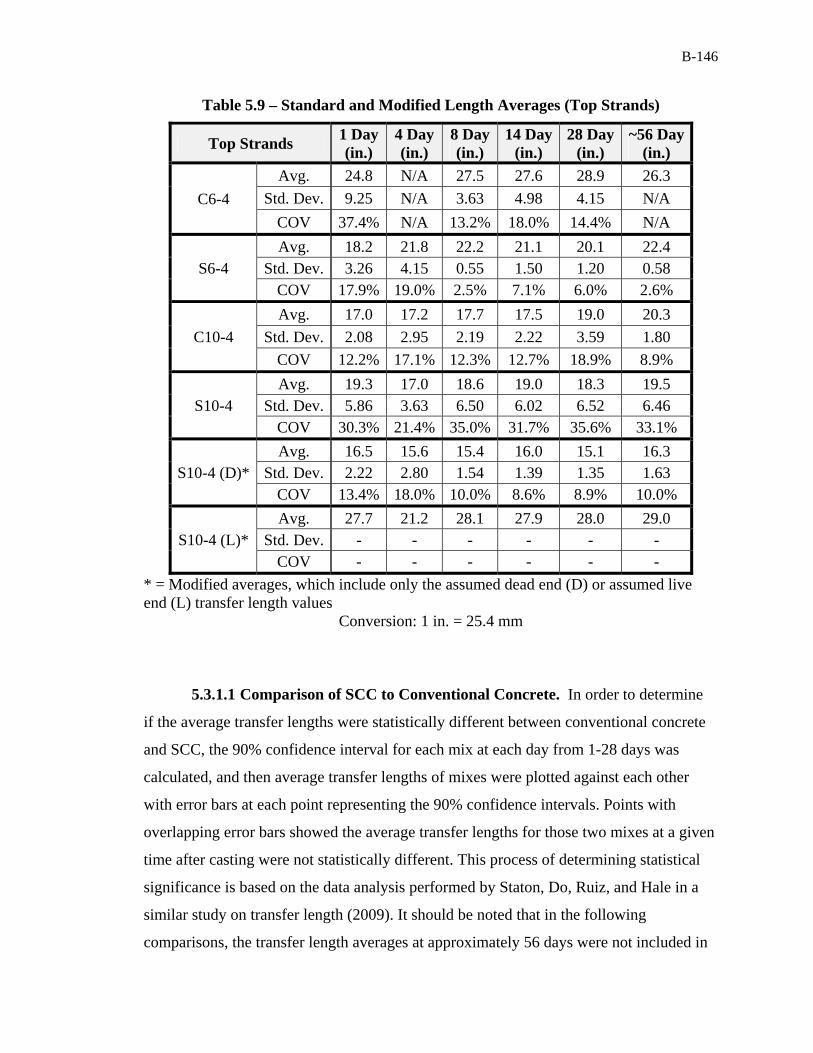
B-146
Table 5.9 – Standard and Modified Length Averages (Top Strands)
Top Strands 1 Day(in.)
4 Day(in.)
8 Day(in.)
14 Day(in.)
28 Day (in.)
~56 Day(in.)
C6-4
Avg. 24.8 N/A 27.5 27.6 28.9 26.3
Std. Dev. 9.25 N/A 3.63 4.98 4.15 N/A
COV 37.4% N/A 13.2% 18.0% 14.4% N/A
S6-4 Avg. 18.2 21.8 22.2 21.1 20.1 22.4
Std. Dev. 3.26 4.15 0.55 1.50 1.20 0.58 COV 17.9% 19.0% 2.5% 7.1% 6.0% 2.6%
C10-4
Avg. 17.0 17.2 17.7 17.5 19.0 20.3
Std. Dev. 2.08 2.95 2.19 2.22 3.59 1.80
COV 12.2% 17.1% 12.3% 12.7% 18.9% 8.9%
S10-4 Avg. 19.3 17.0 18.6 19.0 18.3 19.5
Std. Dev. 5.86 3.63 6.50 6.02 6.52 6.46 COV 30.3% 21.4% 35.0% 31.7% 35.6% 33.1%
S10-4 (D)* Avg. 16.5 15.6 15.4 16.0 15.1 16.3
Std. Dev. 2.22 2.80 1.54 1.39 1.35 1.63 COV 13.4% 18.0% 10.0% 8.6% 8.9% 10.0%
S10-4 (L)* Avg. 27.7 21.2 28.1 27.9 28.0 29.0
Std. Dev. - - - - - - COV - - - - - -
* = Modified averages, which include only the assumed dead end (D) or assumed live end (L) transfer length values
Conversion: 1 in. = 25.4 mm
5.3.1.1 Comparison of SCC to Conventional Concrete. In order to determine
if the average transfer lengths were statistically different between conventional concrete
and SCC, the 90% confidence interval for each mix at each day from 1-28 days was
calculated, and then average transfer lengths of mixes were plotted against each other
with error bars at each point representing the 90% confidence intervals. Points with
overlapping error bars showed the average transfer lengths for those two mixes at a given
time after casting were not statistically different. This process of determining statistical
significance is based on the data analysis performed by Staton, Do, Ruiz, and Hale in a
similar study on transfer length (2009). It should be noted that in the following
comparisons, the transfer length averages at approximately 56 days were not included in

B-147
the evaluation because the transfer lengths were determined between 48 and 57 days after
casting depending on when the four-point flexural testing was completed, so averages
were not directly comparable.
The bottom strands in normal strength conventional concrete and SCC mixes (C6-
2 and S6-2) are compared in Figure 5.15, and the high strength conventional and SCC
mixes (C10-2 and C10-2 (D) and S10) are compared in Figure 5.16 and 5.17. In Figure
5.15, although C6-2 appears to have had higher average transfer lengths, the 90%
confidence interval error bars overlap in all cases except at 14 days, meaning that there
was really no difference in bottom transfer lengths in normal strength conventional
concrete versus SCC. Although there is no overlap at 14 days, the gap is so narrow, that it
can be assumed there was no statistical difference at 14 days as well.
On the other hand, Figure 5.16 appears to show there was a statistical difference
between the high strength conventional concrete and SCC bottom strand transfer lengths,
with C10-2 having the longer transfer lengths. However, the 90% confidence intervals for
the C10 mix are very large due to the inclusion of the possible live end transfer lengths.
C10-2 (D) is the average of the four possible dead end transfer lengths, and when C10-2
(D) average transfer lengths are compared to the S10-2 average transfer lengths in Figure
5.17, the values are almost identical and there is no statistical difference. S10-2 average
transfer lengths were not compared to the C10-2 (L) because it can be assumed that the
S10-2 averages are based on dead end transfer lengths, so comparing the S10-2 averages
to the live end C10-2 averages would not be a valid comparison.
Overall, the statistical analysis shows that for bottom strands, there was no
statistical difference between transfer lengths in conventional concrete and SCC at both
normal strength and high strength levels up to 28 days after casting. However, this was
only true when the perceived live end transfer lengths were removed from the averages.
A summary of the bottom strand transfer lengths from this research for each conventional
concrete vs. SCC comparison is presented in Table 5.10. Shaded pairs indicate a
statistical difference between the averages.

B-148
Conversion: 1 in. = 25.4 mm
Figure 5.15 – C6-2 and S6-2 Transfer Lengths with 90% Confidence Intervals
Conversion: 1 in. = 25.4 mm
Figure 5.16 – C10-2 and S10-2 Transfer Lengths with 90% Confidence Intervals
0
5
10
15
20
25
30
0 7 14 21 28 35
Tra
nsfe
r L
engt
h (i
n.)
Days after Casting
C6-2
S6-2
0
5
10
15
20
25
30
0 7 14 21 28 35
Tra
nsfe
r L
engt
h (i
n.)
Days after Casting
S10-2
C10-2

B-149
Conversion: 1 in. = 25.4 mm
Figure 5.17 – C10-2 (D) and S10-2 Transfer Lengths with 90% Confidence Intervals
Table 5.10 – Conventional Concrete vs. SCC: Summary of Statistical Differences Between Bottom Strand Transfer Lengths
Combination1 Day(in.)
4 Day (in.)
8 Day(in.)
14 Day(in.)
28 Day (in.)
C6-2 17.2 20.4 22.3 23.7 23.6 S6-2 14.4 18.4 18.2 18.6 19.2
C10-2 20.1 22.7 23.4 23.2 23.7 S10-2 13.8 16.4 16.3 16.5 16.6
C10-2 (D) 13.7 16.3 17.2 16.9 17.2 S10-2 13.8 16.4 16.3 16.5 16.6
*Shaded pairs indicate statistical difference between values (90% CI) Conversion: 1 in. = 25.4 mm
The same statistical analysis between transfer lengths in conventional concrete
and SCC at the normal and high compressive strength levels was completed for the top
strands as well. However, since only one four strand beam was constructed per mix,
0
5
10
15
20
25
0 7 14 21 28 35
Tra
nsfe
r L
engt
h (i
n.)
Days after Casting
C10-2 (D)
S10-2

B-150
averages for top strand transfer lengths were based on only four readings, and in many
instances, the DEMEC readings resulted in unreasonable plots where transfer lengths
could not be determined. In the cases of the C6-4 and S6-4 beams, the average top strand
transfer lengths and standard deviations were only based on two readings each. The top
strands in normal strength conventional concrete and SCC mixes (C6-4 and S6-4) are
compared in Figure 5.18, and the high strength conventional and SCC mixes [C10-4 and
S10-4 and S10-4 (D)] are compared in Figures 5.19 and 5.20.
Figure 5.18 shows overlap of the 90% confidence interval error bars for all days
except 28 days for the C6 and S6 mixes. However, these averages and standard
deviations for the top strand for these mixes were only based on two readings each, so
although the plot indicates that top strand transfer lengths in the normal strength
conventional and SCC mixes were generally not statistically different, this conclusion is
based on limited data.
In terms of the transfer lengths of top strands in the high strength mixes, the C10-
4 transfer lengths are compared to the full S10-4 averages in Figure 5.19 and then
compared to the S10-4 (D) averages in Figure 5.20. The 90% confidence intervals
overlap in both cases, indicating that there was no difference in top strand transfer lengths
in high strength conventional concrete or high strength SCC.
SCC top strand transfer lengths were generally shorter than the conventional
concrete top strand transfer lengths, but only a few statistical differences were seen
between transfer lengths in the normal strength mixes, and none were seen between either
combination of the high strength conventional concrete and SCC averages. A summary of
the top strand transfer lengths for each conventional concrete vs. SCC comparison is
presented in Table 5.11. Shaded pairs indicate a statistical difference between the
averages.

B-151
Conversion: 1 in. = 25.4 mm
Figure 5.18 – C6-4 and S6-4 Transfer Lengths with 90% Confidence Intervals
Conversion: 1 in. = 25.4 mm
Figure 5.19 – C10-4 and S10-4 Transfer Lengths with 90% Confidence Intervals
0
5
10
15
20
25
30
35
40
0 7 14 21 28 35
Tra
nsfe
r L
engt
h (i
n.)
Days after Casting
C6-4
S6-4
0
5
10
15
20
25
30
0 7 14 21 28 35
Tra
nsfe
r L
engt
h (i
n.)
Days after Casting
C10-4
S10-4
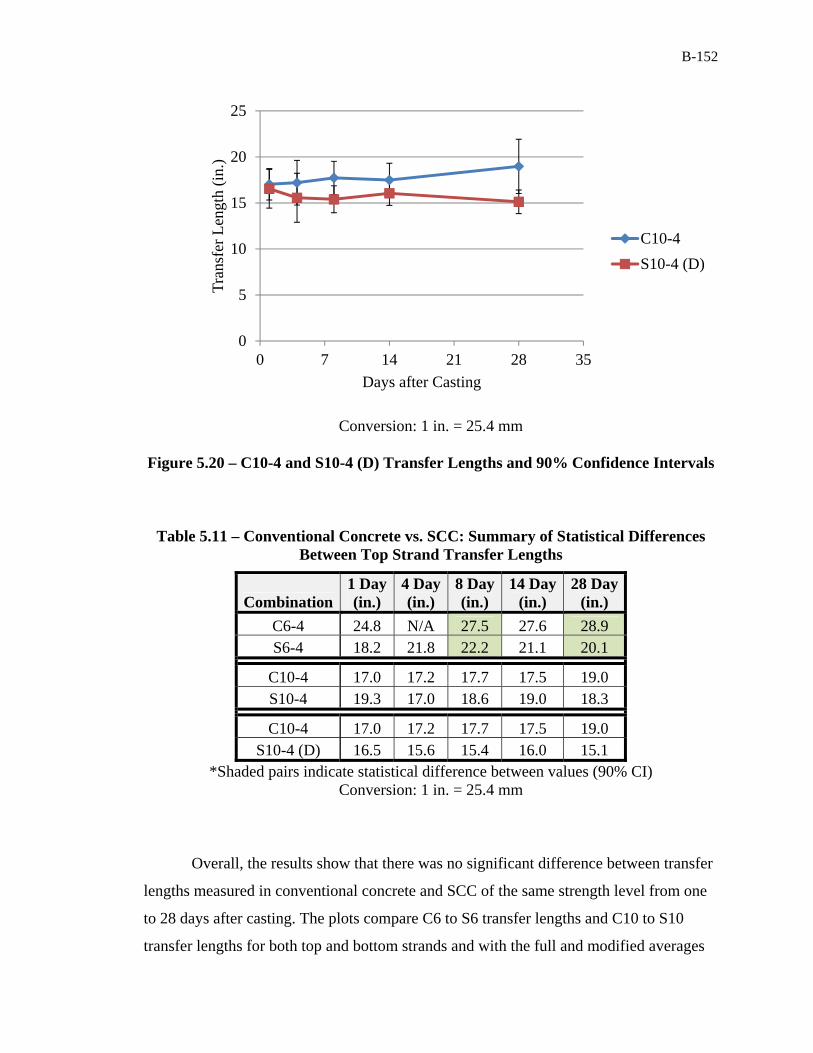
B-152
Conversion: 1 in. = 25.4 mm
Figure 5.20 – C10-4 and S10-4 (D) Transfer Lengths and 90% Confidence Intervals
Table 5.11 – Conventional Concrete vs. SCC: Summary of Statistical Differences Between Top Strand Transfer Lengths
Combination1 Day (in.)
4 Day (in.)
8 Day (in.)
14 Day (in.)
28 Day (in.)
C6-4 24.8 N/A 27.5 27.6 28.9 S6-4 18.2 21.8 22.2 21.1 20.1
C10-4 17.0 17.2 17.7 17.5 19.0 S10-4 19.3 17.0 18.6 19.0 18.3
C10-4 17.0 17.2 17.7 17.5 19.0 S10-4 (D) 16.5 15.6 15.4 16.0 15.1
*Shaded pairs indicate statistical difference between values (90% CI) Conversion: 1 in. = 25.4 mm
Overall, the results show that there was no significant difference between transfer
lengths measured in conventional concrete and SCC of the same strength level from one
to 28 days after casting. The plots compare C6 to S6 transfer lengths and C10 to S10
transfer lengths for both top and bottom strands and with the full and modified averages
0
5
10
15
20
25
0 7 14 21 28 35
Tra
nsfe
r L
engt
h (i
n.)
Days after Casting
C10-4
S10-4 (D)
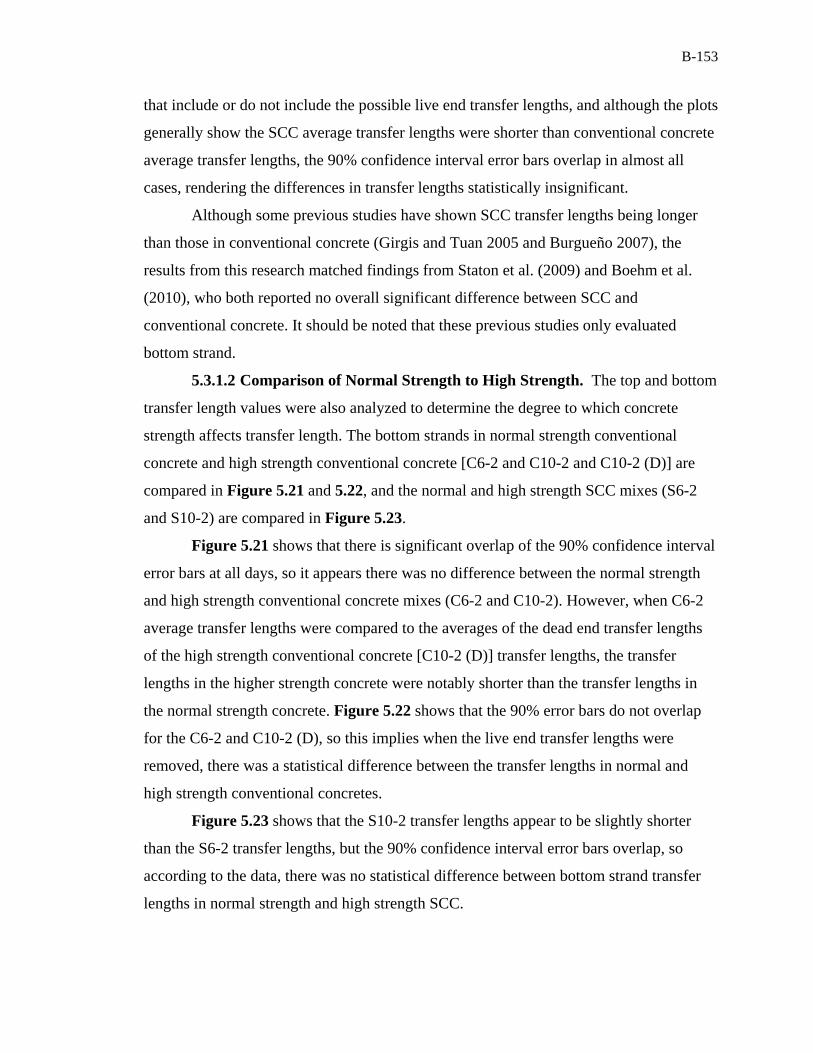
B-153
that include or do not include the possible live end transfer lengths, and although the plots
generally show the SCC average transfer lengths were shorter than conventional concrete
average transfer lengths, the 90% confidence interval error bars overlap in almost all
cases, rendering the differences in transfer lengths statistically insignificant.
Although some previous studies have shown SCC transfer lengths being longer
than those in conventional concrete (Girgis and Tuan 2005 and Burgueño 2007), the
results from this research matched findings from Staton et al. (2009) and Boehm et al.
(2010), who both reported no overall significant difference between SCC and
conventional concrete. It should be noted that these previous studies only evaluated
bottom strand.
5.3.1.2 Comparison of Normal Strength to High Strength. The top and bottom
transfer length values were also analyzed to determine the degree to which concrete
strength affects transfer length. The bottom strands in normal strength conventional
concrete and high strength conventional concrete [C6-2 and C10-2 and C10-2 (D)] are
compared in Figure 5.21 and 5.22, and the normal and high strength SCC mixes (S6-2
and S10-2) are compared in Figure 5.23.
Figure 5.21 shows that there is significant overlap of the 90% confidence interval
error bars at all days, so it appears there was no difference between the normal strength
and high strength conventional concrete mixes (C6-2 and C10-2). However, when C6-2
average transfer lengths were compared to the averages of the dead end transfer lengths
of the high strength conventional concrete [C10-2 (D)] transfer lengths, the transfer
lengths in the higher strength concrete were notably shorter than the transfer lengths in
the normal strength concrete. Figure 5.22 shows that the 90% error bars do not overlap
for the C6-2 and C10-2 (D), so this implies when the live end transfer lengths were
removed, there was a statistical difference between the transfer lengths in normal and
high strength conventional concretes.
Figure 5.23 shows that the S10-2 transfer lengths appear to be slightly shorter
than the S6-2 transfer lengths, but the 90% confidence interval error bars overlap, so
according to the data, there was no statistical difference between bottom strand transfer
lengths in normal strength and high strength SCC.

B-154
Overall, the statistical analysis shows that for bottom strands, an increase in
compressive strength resulted in shorter transfer lengths for conventional concrete,
especially when the live end transfer lengths were removed from the averages. However,
concrete strength did not appear to significantly influence transfer lengths in SCC. A
summary of the bottom strand transfer lengths for each normal strength to high strength
comparison is presented in Table 5.12. Shaded pairs indicate a statistical difference
between the averages.
Conversion: 1 in. = 25.4 mm
Figure 5.21 – C6-2 and C10-2 Transfer Lengths and 90% Confidence Intervals
0
5
10
15
20
25
30
0 7 14 21 28 35
Tra
nsfe
r L
engt
h (i
n.)
Days after Casting
C6-2
C10-2

B-155
Conversion: 1 in. = 25.4 mm
Figure 5.22 – C6-2 and C10-2 (D) Transfer Lengths and 90% Confidence Intervals
Conversion: 1 in. = 25.4 mm
Figure 5.23 – S6-2 and S10-2 Transfer Lengths and 90% Confidence Intervals
0
5
10
15
20
25
30
0 7 14 21 28 35
Tra
nsfe
r L
engt
h (i
n.)
Days after Casting
C6-2
C10-2 (D).
0
5
10
15
20
25
0 7 14 21 28 35
Tra
nsfe
r L
engt
h (i
n.)
Days after Casting
S6-2
S10-2

B-156
Table 5.12 – Normal Strength vs. High Strength: Summary of Statistical Differences Between Bottom Strand Transfer Lengths
Combination 1 Day (in.)
4 Day (in.)
8 Day (in.)
14 Day(in.)
28 Day (in.)
C6-2 17.2 20.4 22.3 23.7 23.6 C10-2 20.1 22.7 23.4 23.2 23.7
C6-2 17.2 20.4 22.3 23.7 23.6 C10-2 (D) 13.7 16.3 17.2 16.9 17.2
S6-2 14.4 18.4 18.2 18.6 19.2 S10-2 13.8 16.4 16.3 16.5 16.6
*Shaded pairs indicate statistical difference between values (90% CI) Conversion: 1 in. = 25.4 mm
In terms of the effect of concrete strength on top strand transfer lengths, the 90%
confidence interval error bars in Figure 5.24 show that the top strand transfer lengths in
the high strength conventional concrete were generally shorter than the top strand transfer
lengths in the normal strength conventional concrete. There does not appear to be a
statistical difference between the one day transfer lengths, but the 90% confidence
interval for C6-4 was fairly large, measuring 10.7 in. (272 mm) above and below the
average. Also, the C6-4 average transfer lengths were only based on two values for each
day. The transfer lengths in the normal strength conventional concrete did appear to be
consistently longer than the transfer lengths in the high strength conventional concrete;
however it should be noted that this conclusion is based on limited data.
The top strand transfer lengths in the normal strength and high strength SCC
mixes are compared in Figure 5.25 and 5.26. Figure 5.25 shows no statistical difference
between the S6-4 and full average of S10-4 transfer lengths. However, when the normal
strength SCC transfer lengths are compared to the average dead end high strength SCC
transfer lengths in Figure 5.26, this plot indicates that there was no statistical difference
at 1 and 4 days, but the S10-4 (D) transfer lengths seemed to be generally shorter than the
S6-4 transfer lengths at later ages.
For the top strands in this research program, the increase in concrete strength in
conventional concrete generally resulted in shorter transfer lengths, although it should be

B-157
noted that the C6-4 average values were only based on two readings. In SCC, when the
possible live end was removed from the S10-4 data, the increase in concrete strength also
appeared to shorten top strand transfer lengths, specifically at later ages. A summary of
the top strand transfer lengths for each normal strength to high strength comparison is
presented in Table 5.13. Shaded pairs indicate a statistical difference between the
averages.
Conversion: 1 in. = 25.4 mm
Figure 5.24 – C6-4 and C10-4 Transfer Lengths and 90% Confidence Intervals
0
5
10
15
20
25
30
35
40
0 7 14 21 28 35
Tra
nfer
Len
gth
(in.
)
Days after Casting
C6-4
C10-4

B-158
Conversion: 1 in. = 25.4 mm
Figure 5.25 – S6-4 and S10-4 Transfer Lengths and 90% Confidence Intervals
Conversion: 1 in. = 25.4 mm
Figure 5.26 – S6-4 and S10-4 (D) Transfer Lengths and 90% Confidence Intervals
0
5
10
15
20
25
30
0 7 14 21 28 35
Tra
nsfe
r L
engt
h (i
n.)
Days after Casting
S6-4
S10-4
0
5
10
15
20
25
30
0 7 14 21 28 35
Tra
nsfe
r L
engt
h (i
n.)
Days after Casting
S6-4
S10-4 (D)

B-159
Table 5.13 – Normal Strength vs. High Strength: Summary of Statistical Differences Between Top Strand Transfer Lengths
Combination1 Day(in.)
4 Day(in.)
8 Day(in.)
14 Day(in.)
28 Day (in.)
C6-4 24.8 N/A 27.5 27.6 28.9 C10-4 17.0 17.2 17.7 17.5 19.0
S6-4 18.2 21.8 22.2 21.1 20.1 S10-4 19.3 17.0 18.6 19.0 18.3
S6-4 18.2 21.8 22.2 21.1 20.1 S10-4 (D) 16.5 15.6 15.4 16.0 15.1
*Shaded pairs indicate statistical difference between values (90% CI) Conversion: 1 in. = 25.4 mm
Except for the bottom strands in SCC, all comparisons of normal to high strength
concretes showed decreased transfer lengths at higher strengths when the live end values
were removed from the averages. For the top strands, this was especially true for 8 to 28
days.
As discussed in Section 2.4.3, the idea of transfer length being inversely
proportional to concrete strength has been shown by many previous researchers. Mitchell
et al. (1993), Lane (1998), Ramirez and Russell (2008), and others have all noted the
effect of concrete strength, and except for the bottom strands in SCC, this research mostly
upheld the previous findings.
5.3.1.3 Comparison of Bottom Strand to Top Strand. For each mix, bottom
strand transfer lengths were compared to top strand transfer lengths to determine if
significant differences existed. Previous research has indicated that top strands have the
potential for longer transfer lengths than bottom strands due to bleed water and air
collecting under the top strands and reduced consolidation at the top of a member, thus
reducing bond (Peterman 2007, Wan et al. 2002). The same 90% confidence interval
approach that was used to compare conventional concrete to SCC and normal strength to
high strength was used to evaluate statistically significant differences between top and
bottom strand transfer lengths. Top and bottom strand transfer lengths for each mix from
1 to 28 days are plotted in Figures 5.27-5.32.

B-160
Figures 5.27-5.29 examine the top and bottom strands in conventional concrete.
Figure 5.27 compares the top and bottom strand transfer lengths in the normal strength
conventional concrete, while Figures 5.28 and 5.29 compare the high strength full and
dead end bottom strand averages to the top strand averages. Figures 5.27 and 5.29 show
that the top strand transfer length averages were higher than the bottom strand averages,
but the 90% confidence interval error bars overlap in all cases except when comparing
C10-2 (D) to C10-4 at one day (Figure 5.29). Although the error bars overlap in Figure
5.28 as well, Figure 5.28 actually indicates in high strength conventional concrete, the
average bottom strand transfer lengths (C10-2) were actually longer than the average top
strand transfer lengths (C10-4); however, the C10-2 averages include the possible live
ends, which would make the averages much higher. Aside from this one anomaly, the
comparison of top strand transfer lengths to bottom strand transfer lengths did not appear
to show any statistically significant differences in either normal or high strength
conventional concrete.
Conversion: 1 in. = 25.4 mm
Figure 5.27 – C6-2 and C6-4 Transfer Lengths and 90% Confidence Intervals
0.0
5.0
10.0
15.0
20.0
25.0
30.0
35.0
40.0
0 7 14 21 28 35
Tra
nsfe
r L
engt
h (i
n.)
Days after Casting
C6-2
C6-4

B-161
Conversion: 1 in. = 25.4 mm
Figure 5.28 – C10-2 and C10-4 Transfer Lengths and 90% Confidence Intervals
Conversion: 1 in. = 25.4 mm
Figure 5.29 – C10-2 (D) and C10-4 Transfer Lengths and 90% Confidence Intervals
0.0
5.0
10.0
15.0
20.0
25.0
30.0
0 7 14 21 28 35
Tra
nsfe
r L
engt
h (i
n.)
Days after Casting
C10-2
C10-4
0.0
5.0
10.0
15.0
20.0
25.0
30.0
0 7 14 21 28 35
Tra
nsfe
r L
engt
h (i
n.)
Days after Casting
C10-2 (D)
C10-4

B-162
Figures 5.30-5.32 examine the top and bottom strands in SCC. Figure 5.30
compares the top and bottom strand transfer lengths in the normal strength SCC, while
Figure 5.31 and 5.32 compare the high strength SCC bottom strand averages to the full
and dead end top strand averages. Figures 5.30 and 5.31 show the top strand transfer
length averages were higher than the bottom strand averages, but the 90% confidence
interval error bars overlap in all cases except when comparing S6-2 to S6-4 at 8 days. For
the high strength SCC, when the possible live end was removed from the average top
strand transfer length, the transfer lengths appear to be almost identical (Figure 5.32). As
was seen with the conventional concrete, aside from one anomaly, almost no statistically
significant differences were seen between top and bottom strands in either normal or high
strength SCC.
Conversion: 1 in. = 25.4 mm
Figure 5.30 – S6-2 and S6-4 Transfer Lengths and 90% Confidence Intervals
0.0
5.0
10.0
15.0
20.0
25.0
30.0
0 7 14 21 28 35
Tra
nsfe
r L
engt
h (i
n.)
Days after Casting
S6-2
S6-4
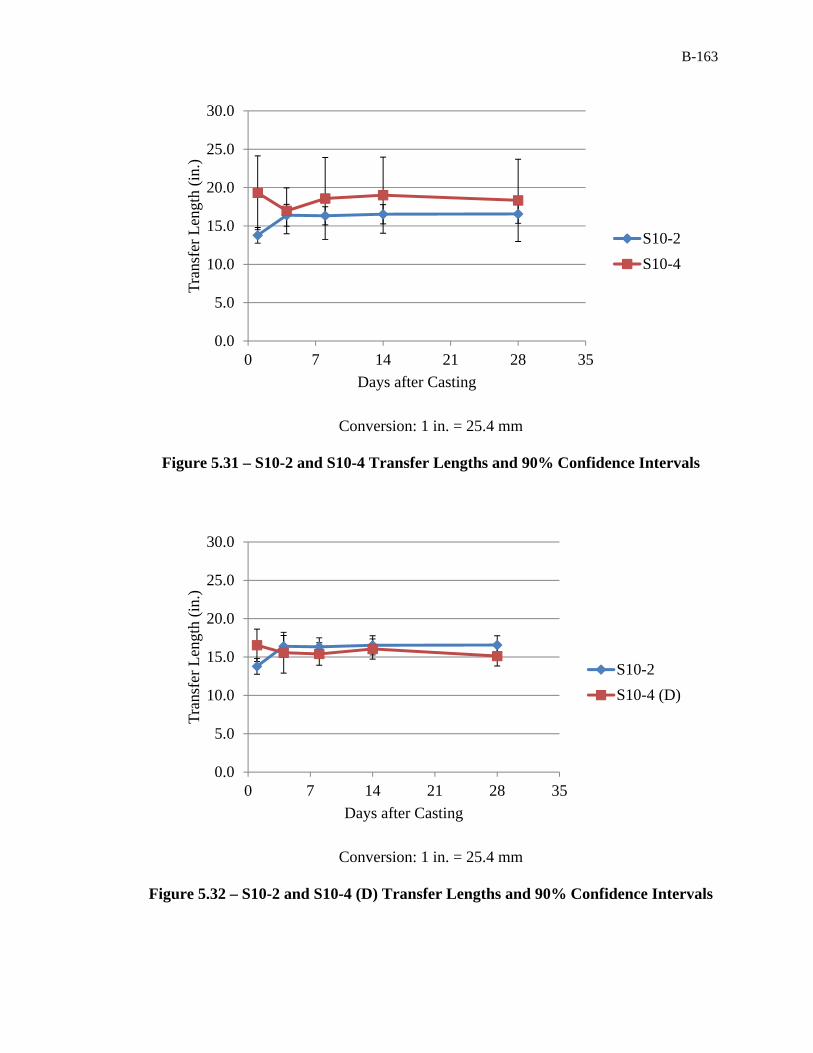
B-163
Conversion: 1 in. = 25.4 mm
Figure 5.31 – S10-2 and S10-4 Transfer Lengths and 90% Confidence Intervals
Conversion: 1 in. = 25.4 mm
Figure 5.32 – S10-2 and S10-4 (D) Transfer Lengths and 90% Confidence Intervals
0.0
5.0
10.0
15.0
20.0
25.0
30.0
0 7 14 21 28 35
Tra
nsfe
r L
engt
h (i
n.)
Days after Casting
S10-2
S10-4
0.0
5.0
10.0
15.0
20.0
25.0
30.0
0 7 14 21 28 35
Tra
nsfe
r L
engt
h (i
n.)
Days after Casting
S10-2
S10-4 (D)

B-164
Overall, the top strands generally had longer transfer lengths based on straight
averages, but analysis indicated that there were no trends showing statistically significant
differences between transfer lengths in top and bottom strands in the same concrete mix.
This does not follow previous research findings. As discussed in Section 2.4.6, Wan et al.
(2002) and Petrou et al. (2000) both found significantly more slip in top-cast strands
compared to bottom-cast strands in piles constructed from conventional concrete.
Specifically in terms of SCC, Larson et al. (2007) reported top strand transfer lengths to
be 50% longer than bottom strand transfer lengths. However, the top strand transfer
lengths in the current study were often longer than those for the bottom strands,
especially when live end values were removed from the averages for C10-2, on average 9
to 26% although still within recognized limits of statistical variability.
For this study, a summary of the transfer lengths for each top strand vs. bottom
strand comparison for all concrete mixes is presented in Table 5.14. Shaded pairs
indicate a statistical difference between the averages, and the lack of shaded pairs
indicates that in this research, there was no trend indicating top strand transfer lengths
were longer than bottom strand transfer lengths.
5.3.1.4 Change in Transfer Length over Time. As discussed in Section 2.4.4,
numerous previous research studies dating back to Kaar, LaFraugh, and Mass (1963)
have shown transfer lengths increasing over time, so the data from this study was
analyzed to see if the same trend was observed. The percent increases in transfer lengths
for top and bottom strands in each mix are presented in Table 5.15. The increases are
broken down into initial increases, or the percent increases from 1 to 4 days, and
additional increases, or the percent increases from 4 to 28 days, and total increases, or the
full percent increases from 1 to 28 days. Negative percent increases indicate the transfer
lengths actually decreased.

B-165
Table 5.14 – Top Strand vs. Bottom Strand: Summary of Statistical Differences Between Transfer Lengths
Combination1 Day(in.)
4 Day(in.)
8 Day(in.)
14 Day(in.)
28 Day (in.)
C6-2 17.2 20.4 22.3 23.7 23.6 C6-4 24.8 N/A 27.5 27.6 28.9
C10-2 20.1 22.7 23.4 23.2 23.7 C10-4 17.0 17.2 17.7 17.5 19.0
C10-2 (D) 13.7 16.3 17.2 16.9 17.2 C10-4 17.0 17.2 17.7 17.5 19.0
S6-2 14.4 18.4 18.2 18.6 19.2 S6-4 18.2 21.8 22.2 21.1 20.1
S10-2 13.8 16.4 16.3 16.5 16.6 S10-4 19.3 17.0 18.6 19.0 18.3
S10-2 13.8 16.4 16.3 16.5 16.6 S10-4 (D) 16.5 15.6 15.4 16.0 15.1
*Shaded pairs indicate statistical difference between values (90% CI) Conversion: 1 in. = 25.4 mm
Table 5.15 – Summary of Increases in Transfer Lengths
Mix ID Initial Increase (1 Day to 4 Days)
Additional Increase (4 Days to 28 Days)
Total Increase (1 Day to 28 Days)
C6-2 18.9% 15.4% 37.3% S6-2 28.0% 3.9% 32.9%
C10-2 12.8% 4.6% 18.1% C10-2 (D) 18.7% 5.2% 24.8% C10-2 (L) 9.8% 4.3% 14.5%
S10-2 19.0% 1.0% 20.2% C6-4 N/A N/A 16.5% S6-4 19.9% -8.0% 10.3%
C10-4 1.0% 10.3% 11.5% S10-4 -12.2% 8.0% -5.1%
S10-4 (D) -5.9% -2.8% -8.6% S10-4 (L) -23.4% 31.9% 1.1%

B-166
The bottom strands did show increases in transfer length over time between 1 and
28 days after casting, with total increases ranging from a minimum of 14.5% for C10-2
(L) to a maximum of 37.3% for C6-2. Generally, most of the increase occurred within the
first four days, and then the rate of increase appeared to slow significantly from 4 to 28
days. The normal strength mixes appeared to show higher percent increases than the high
strength mixes, but no definitive conclusion could be established regarding the
performance of conventional concrete to SCC.
The top strands were much more inconsistent. The SCC mixes actually showed
decreases in some cases. S6-4 had a decrease from 4 to 28 days, while all combinations
of S10-4 transfer length averages showed an initial decrease, and S10-4 and S10-4 (D)
also had overall decreases in averages. C6-4 did not have a 4-day average, so the total
increase could not be broken down into initial and additional increases. C10-4 had very
little initial increase and saw most of the increase occur between 4 and 28 days, which is
opposite of what was generally seen in the bottom strands. In conclusion, the top strand
transfer lengths did not always increase, and the increases that were seen were generally
not as large as the increases that were observed in the bottom strand transfer lengths.
When the increases in bottom strand transfer lengths from this study are compared
to results found by recent studies, the 14.5%-37.3% increases are consistent with what
has been observed by other researchers. Over 28 days, Staton et al. (2009) observed 8%
growth for SCC transfer lengths and 12% growth for high strength conventional concrete
transfer lengths. Also, Boehm et al. (2010) reported 28% increases in SCC transfer
lengths over 3 months with 38% increases in conventional concrete transfer lengths for
the same period. Finally, increases of 10-20% were seen in the bottom strands of SCC
beams 21 days after casting in the study conducted by Larson et al. (2007). The only
study that assessed increases in top strand transfer lengths was Larson et al. (2007). In
that study, increases of 40-45% were seen in the top strand transfer lengths, but the
results regarding increases in top strand transfer lengths reported in this report were
inconclusive.
5.3.1.5 Comparison to AASHTO and ACI Equations for Transfer Length.
After the transfer length averages were compared to each other to determine the effects
of concrete type, concrete strength, and strand location, the averages were then compared

B-167
to values determined by the AASHTO and ACI equations to ensure the measured values
did not exceed the calculated design values. The AASHTO and ACI transfer length
equations were presented and discussed in Section 2.5 of this report; however, they are
repeated here for clarity and convenience.
The AASHTO equation for transfer length is given by Eq. 5.1, where lt is the
transfer length in inches and db is the nominal diameter of the strand in inches. For a 0.5-
in.-diameter (12.7 mm) strand, lt as calculated by the AASHTO equation is equal to 30 in.
(762 mm).
60 (5.1)
ACI 318-11 presents two equations for transfer length: a general equation and an
equation that is used when determining whether a reduced stress in the strand needs to be
accounted for when designing for shear near the end of a member. The general ACI
transfer length equation that is given in Section 12.9 of the ACI 318-11 code is shown
here as equation Eq. 5.2, where lt is the transfer length in inches, fse is the effective stress
in the prestressing strand after losses in psi and db is the nominal diameter of the strand in
inches. Typical values for fse range from 60 – 65% of fpu depending on the conditions of
stressing and losses. In terms of comparison, it was determined that a lower fse value
(0.6fpu) should be used, so the calculated transfer length would be shorter and more
conservative for comparison. Assuming 20% final losses, the 28-day transfer length
calculated by Eq. 5.2 would equal 27 in. (686 mm).
3000
(5.2)
The transfer length equation for shear design from Section 11.3.4 of ACI 318-11
is presented in Eq. 5.3, where lt is the transfer length in inches and db is the nominal
strand diameter in inches. For a 0.5-in.-diameter (12.7 mm) strand, this transfer length
would equal 25 in. (635 mm).
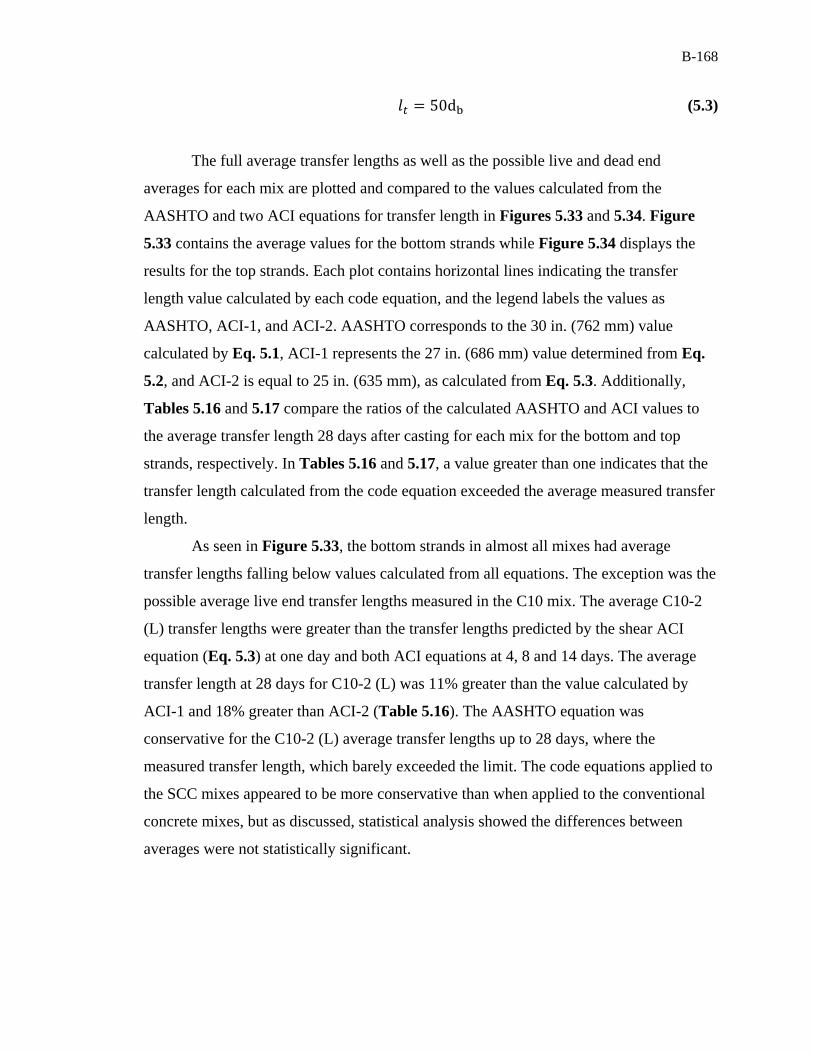
B-168
50d (5.3)
The full average transfer lengths as well as the possible live and dead end
averages for each mix are plotted and compared to the values calculated from the
AASHTO and two ACI equations for transfer length in Figures 5.33 and 5.34. Figure
5.33 contains the average values for the bottom strands while Figure 5.34 displays the
results for the top strands. Each plot contains horizontal lines indicating the transfer
length value calculated by each code equation, and the legend labels the values as
AASHTO, ACI-1, and ACI-2. AASHTO corresponds to the 30 in. (762 mm) value
calculated by Eq. 5.1, ACI-1 represents the 27 in. (686 mm) value determined from Eq.
5.2, and ACI-2 is equal to 25 in. (635 mm), as calculated from Eq. 5.3. Additionally,
Tables 5.16 and 5.17 compare the ratios of the calculated AASHTO and ACI values to
the average transfer length 28 days after casting for each mix for the bottom and top
strands, respectively. In Tables 5.16 and 5.17, a value greater than one indicates that the
transfer length calculated from the code equation exceeded the average measured transfer
length.
As seen in Figure 5.33, the bottom strands in almost all mixes had average
transfer lengths falling below values calculated from all equations. The exception was the
possible average live end transfer lengths measured in the C10 mix. The average C10-2
(L) transfer lengths were greater than the transfer lengths predicted by the shear ACI
equation (Eq. 5.3) at one day and both ACI equations at 4, 8 and 14 days. The average
transfer length at 28 days for C10-2 (L) was 11% greater than the value calculated by
ACI-1 and 18% greater than ACI-2 (Table 5.16). The AASHTO equation was
conservative for the C10-2 (L) average transfer lengths up to 28 days, where the
measured transfer length, which barely exceeded the limit. The code equations applied to
the SCC mixes appeared to be more conservative than when applied to the conventional
concrete mixes, but as discussed, statistical analysis showed the differences between
averages were not statistically significant.

B-169
Conversion: 1 in. = 25.4 mm
Figure 5.33 – Average Transfer Lengths Compared to AASHTO and ACI Equations (Bottom Strands)
Table 5.16 – Ratio of Average Transfer Lengths to AASHTO and ACI Values (Bottom Strands)
28 Day Avg.
(in.) AASHTO/Avg.
(AASHTO = 30 in.) ACI-1/Avg.
(ACI-1 = 27 in.) ACI-2/Avg.
(ACI-2 = 25 in.)
C6-2 23.6 1.27 1.14 1.06 CS6-2 19.2 1.57 1.41 1.31 C10-2 23.7 1.26 1.14 1.05
C10-2 (D) 17.2 1.75 1.57 1.46 C10-2 (L) 30.3 0.99 0.89 0.82
S10-2 16.6 1.81 1.63 1.51 Conversion: 1 in. = 25.4 mm
0.0
5.0
10.0
15.0
20.0
25.0
30.0
35.0
0 7 14 21 28
Tra
nsfe
r L
engt
h (i
n.)
Days after Casting
C6-2
S6-2
C10-2
C10-2 (D)
C10-2 (L)
S10-2
AASHTO
ACI-1
ACI-2

B-170
Conversion: 1 in. = 25.4 mm
Figure 5.34 – Average Transfer Lengths Compared to AASHTO and ACI Equations (Top Strands)
Table 5.17 – Ratio of Average Transfer Lengths to AASHTO and ACI Values (Top Strands)
28 Day Avg.
(in.) AASHTO/Avg.
(AASHTO = 30 in.) ACI-1/Avg.
(ACI-1 = 27 in.) ACI-2/Avg.
(ACI-2 = 25 in.)
C6-4 28.9 1.04 0.94 0.87 S6-4 20.1 1.49 1.34 1.25
C10-4 19.0 1.58 1.42 1.32 S10-4 18.3 1.64 1.47 1.36
S10-4 (D) 15.1 1.98 1.79 1.65 S10-4 (L) 28.0 1.07 0.97 0.89
Conversion: 1 in. = 25.4 mm
In terms of the average top strand transfer lengths, Figure 5.34 shows a similar
trend, with the equations being conservative in most cases. One exception was again the
possible live end transfer length, which was greater than the values computed by both
ACI equations at all days except day 4. However, the normal strength conventional
0.0
5.0
10.0
15.0
20.0
25.0
30.0
35.0
0 7 14 21 28
Tra
nsfe
r L
engt
h (i
n.)
Days after Casting
C6-4
S6-4
C10-4
S10-4
S10-4 (D)
S10-4 (L)
AASHTO
ACI-1
ACI-2

B-171
concrete also had average transfer lengths exceeding both ACI limits at 8, 14, and 28
days. The 28-day average for C6-4 exceeded the ACI-1 and ACI-2 limits by 3% and
11%, respectively (Table 5.17). The AASHTO equation once again proved to be
conservative for all mixes.
Other studies have also found the AASHTO and ACI transfer length equations to
be largely conservative for SCC as well as conventional concrete. Pozolo and Andrawes
(2011) found SCC bottom transfer lengths to be on average 86% below 50db, 72% lower
than 60db, and 69% under fpedb/3, while Staton et al. (2009) found SCC transfer lengths
to be 60% below fpedb/3 as well. Larson et al. (2007) and Boehm et al. (2010) also found
the equations to be conservative for bottom strands and adequate to use with SCC and
conventional concrete. However, in terms of top strands, Larson et al. (2007) found top
strand transfer lengths in SCC to be 60% longer than predicted by 50db. Here, C6-4
averages were the only top strand averages to exceed the ACI code limit.
5.3.2. Discussion of Initial End Slip Transfer Length Results. Initial transfer
lengths were determined by measuring end slips of the strands at release through both
electronic and manual means, as discussed in Sections 4.4.2.1 and 4.4.2.2. The transfer
lengths determined from the end slips measured by both methods are discussed in this
subsection, but overall, the transfer lengths determined by the initial end slips were
abandoned because they were deemed unreliable and imprecise compared to the 1 day
results determined from the DEMEC readings and the 95% Average Mean Strain
Method.
In terms of the end slips measured by the Synergy data acquisition, the gauges
that were used in this research program proved to be highly unreliable. The release
method appeared to be too violent, and the potentiometers consistently separated from the
base plates or slipped on the strands, as discussed in Section 4.4.2.1. The potentiometers
were attached to 32 bottom transfer length locations, and only 16 potentiometers yielded
what were deemed valid end slips, for a success rate of 50%. The potentiometers were
also attached to 10 top transfer length locations, and the potentiometers were unable to
yield any readable data from any of these locations. Therefore, for the 42 locations where
the potentiometers were installed to collect data, the potentiometers only registered a
valid reading 16 times, for a total success rate of only 38%. Also, for the steel rulers, the

B-172
measurements could only be taken to the nearest 1/32-in. (0.79 mm), so precision was a
limiting factor.
In light of the unreliability of the potentiometers and the imprecision of the steel
ruler measurements, the transfer lengths determined from the 95% Average Mean Strain
Method were deemed to be the most consistent and were the transfer lengths that were
used for all comparisons of the transfer lengths in the different mixes as well as all
comparisons to AASHTO and ACI predicted values. Still, for the sake of comparison, the
transfer lengths determined from the Synergy data and steel ruler end slip measurements
are compared to the transfer lengths determined from the 95% Average Mean Strain
Method in Tables 5.18 and 5.19. The tables shows the average, standard deviation and
the number of readings the average and standard deviation were based on for each
method as well as the percent difference between the transfer length from the Synergy or
steel ruler data to the transfer length determined from the DEMEC points and 95%
Average Mean Strain Method. Table 5.18 contains the comparisons for all bottom strand
data, and Table 5.19 contains the comparisons for the top strand data. Although the
mixes are labeled with “2” to denote the two strand beams, and consequently the bottom
strands, ruler and Synergy data were also taken on bottom strands of the four-strand
beams and are included in the averages and standard deviations for the bottom strands.
Table 5.18 shows that for the bottom strands, some of the average Synergy
transfer lengths were actually very similar to the DEMEC transfer lengths. The S6
transfer lengths have only a 0.36% differences between averages, but it should be noted
that the Synergy average is based on only two values. The Synergy and DEMEC transfer
lengths for C10-2 (D) were also very close for this comparison, with only 0.66%
difference. Generally all of the Synergy transfer lengths were less than the DEMEC
transfer lengths.
The percent differences between the ruler and DEMEC transfer lengths ranged
from slightly over 4% to over 76%. The precision for the method was low, which meant
that the standard deviations for the transfer lengths for all mixes was high, ranging from
around 5 in. (127 mm) to 8.5 in. (216 mm). Overall, correlation between the transfer
lengths determined by the steel ruler end slip measurements to the DEMEC transfer
lengths was very low, and although there were some isolated instances of steel ruler

B-173
transfer lengths matching up well to the DEMEC transfer lengths, large differences
generally existed between transfer lengths determined by these two methods as well.
Several studies have also measured transfer length through end slips as well as
DEMEC readings in conjunction with the 95% Average Mean Strain Method. These
studies, including Rose and Russell (1997), Ramirez and Russell (2008), and Boehm et
al. (2010), found the transfer lengths calculated from end slips to match fairly well with
the transfer lengths determined from DEMEC readings. Unlike these studies, the results
in this report did not show a correlation between transfer lengths calculated with the two
methods, but this can most likely be attributed to the shortcomings of the methods of end
slip data collection in this research program.
All transfer lengths determined by both end slip methods are reported in this
report, but all values were essentially disregarded in terms of analysis. Only the transfer
lengths determined by the 95% Average Mean Strain Method were used for comparative
analyses.

B-174
Table 5.18 – Comparison of Synergy-DEMEC and Ruler-DEMEC Transfer Lengths (Bottom Strands)
Bottom Strands Synergy-DEMEC Comparison Ruler-DEMEC Comparison
Synergy (in.)
DEMEC (in.)
% Diff. Ruler (in.)
DEMEC (in.)
% Diff.
C6-2
Avg. 7.9 17.2 73.48% 17.9 17.2 4.10%
Std. Dev. 1.08 2.76 8.01 2.76
n 4 7 11 7
S6-2
Avg. 14.5 14.4 0.36% 13.8 14.4 4.10%
Std. Dev. 0.20 2.61 7.34 2.61
n 2 7 11 7
C10-2
Avg. 13.7 20.1 38.24% 9.0 20.1 76.79%
Std. Dev. 4.60 7.63 8.17 7.63
n 3 8 10 8
C10-2 (D)
Avg. 13.7 13.7 0.66% 9.5 13.7 36.40%
Std. Dev. 4.60 1.70 8.44 1.70
n 3 4 8 4
C10-2 (L)
Avg. N/A 26.5 N/A 6.7 26.5 119.3% Std. Dev. N/A 4.99 9.49 4.99
n 0 4 2 4
S10-2
Avg. 10.2 13.8 29.57% 16.6 13.8 18.33%
Std. Dev. 6.82 1.76 5.19 1.76
n 7 8 10 8
Conversion: 1 in. = 25.4 mm
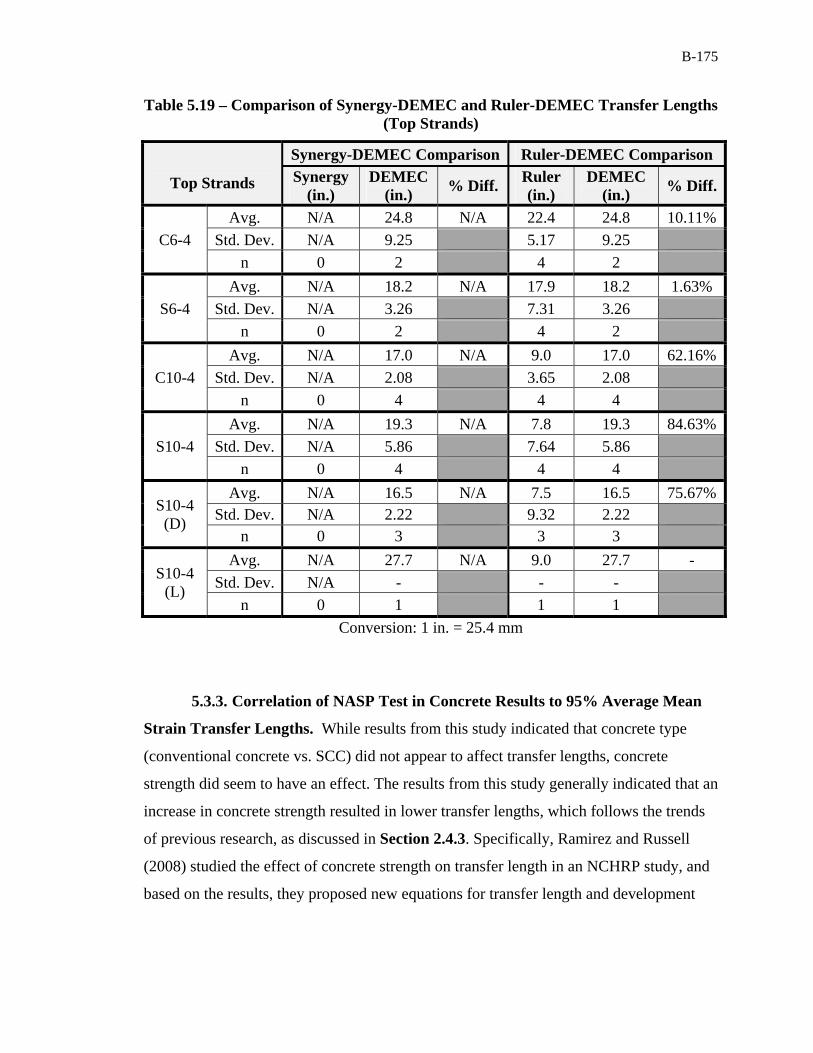
B-175
Table 5.19 – Comparison of Synergy-DEMEC and Ruler-DEMEC Transfer Lengths (Top Strands)
Top Strands
Synergy-DEMEC Comparison Ruler-DEMEC Comparison
Synergy (in.)
DEMEC (in.)
% Diff. Ruler (in.)
DEMEC (in.)
% Diff.
C6-4
Avg. N/A 24.8 N/A 22.4 24.8 10.11%
Std. Dev. N/A 9.25 5.17 9.25
n 0 2 4 2
S6-4
Avg. N/A 18.2 N/A 17.9 18.2 1.63%
Std. Dev. N/A 3.26 7.31 3.26
n 0 2 4 2
C10-4
Avg. N/A 17.0 N/A 9.0 17.0 62.16%
Std. Dev. N/A 2.08 3.65 2.08
n 0 4 4 4
S10-4
Avg. N/A 19.3 N/A 7.8 19.3 84.63%
Std. Dev. N/A 5.86 7.64 5.86
n 0 4 4 4
S10-4 (D)
Avg. N/A 16.5 N/A 7.5 16.5 75.67%Std. Dev. N/A 2.22 9.32 2.22
n 0 3 3 3
S10-4 (L)
Avg. N/A 27.7 N/A 9.0 27.7 -
Std. Dev. N/A - - -
n 0 1 1 1
Conversion: 1 in. = 25.4 mm
5.3.3. Correlation of NASP Test in Concrete Results to 95% Average Mean
Strain Transfer Lengths. While results from this study indicated that concrete type
(conventional concrete vs. SCC) did not appear to affect transfer lengths, concrete
strength did seem to have an effect. The results from this study generally indicated that an
increase in concrete strength resulted in lower transfer lengths, which follows the trends
of previous research, as discussed in Section 2.4.3. Specifically, Ramirez and Russell
(2008) studied the effect of concrete strength on transfer length in an NCHRP study, and
based on the results, they proposed new equations for transfer length and development

B-176
length, which both incorporate concrete strength as a parameter. The data from this
current independent study were compared to the results presented in NCHRP Report 603.
Ramirez and Russell (2008) analyzed pullout loads from the standard NASP test
in mortar and modified NASP test in concrete and transfer lengths measured in
rectangular and I-beams for three strand types, A, B, and D. The modified NASP in
concrete specimens and the beam specimens used for measuring transfer lengths were
constructed from conventional concrete with a range of compressive strengths. From the
NASP in concrete results, they noted that for each strand type, the pullout load increased
as concrete strength increased, and the pullout load increase was proportional to the
square root of the concrete compressive strength. The NASP in concrete values were
normalized by dividing the NASP in concrete pullout load by the appropriate standard
NASP in mortar pullout load for each strand, and then the ratios were plotted against the
concrete compressive strength (ksi), as seen in Figure 5.35. The NASP in concrete
normalized by NASP in mortar value vs. f’c confirmed the observation that the bond
performance is related to the square root of f’c, yielding a power trend line equation with
an exponent of close to 0.5 (Eq. 5.4).
0.49139x . (5.4)
Based on this result, NASP in concrete pullout load normalized by the NASP in mortar
pullout load (NASPconc/NASP) was then plotted against the square root of the
compressive strength at one day (ksi), as seen in Figure 5.36. This relationship showed a
rather strong linear correlation, with an R2 value of 0.79. From this plot, a relationship
between bond performance and concrete compressive strength was derived and is shown
in Eq. 5.5.
0.51 (5.5)

B-177
Conversion: 1 kip = 4.45 kN 1 ksi = 6.89 MPa
Figure 5.35 – NCHRP Normalized NASP Pull-out Values vs. Concrete Strength
(Ramirez and Russell 2008)
Conversion: 1 kip = 4.45 kN 1 ksi = 6.89 MPa
Figure 5.36 – NCHRP Normalized NASP Pull-out Values vs. √f’c
(Ramirez and Russell 2008)
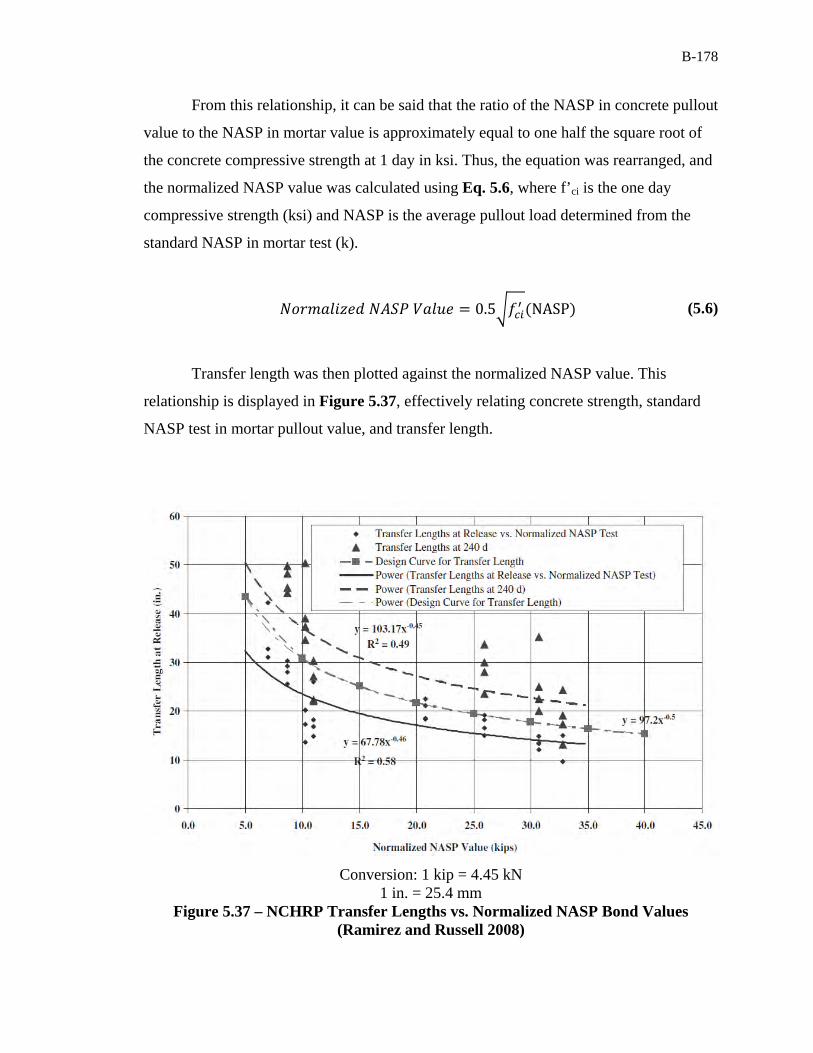
B-178
From this relationship, it can be said that the ratio of the NASP in concrete pullout
value to the NASP in mortar value is approximately equal to one half the square root of
the concrete compressive strength at 1 day in ksi. Thus, the equation was rearranged, and
the normalized NASP value was calculated using Eq. 5.6, where f’ci is the one day
compressive strength (ksi) and NASP is the average pullout load determined from the
standard NASP in mortar test (k).
0.5 NASP (5.6)
Transfer length was then plotted against the normalized NASP value. This
relationship is displayed in Figure 5.37, effectively relating concrete strength, standard
NASP test in mortar pullout value, and transfer length.
Conversion: 1 kip = 4.45 kN 1 in. = 25.4 mm
Figure 5.37 – NCHRP Transfer Lengths vs. Normalized NASP Bond Values (Ramirez and Russell 2008)

B-179
The results produced by the Missouri S&T research program were compared to
the results from the NCHRP study to see if these results followed the same trends that
were discovered during the NCHRP program. In this study, only one strand type was
used for the construction of the transfer length beams (strand type 101), but two standard
NASP tests in mortar were run on this strand type, resulting in two different NASP
pullout values. Therefore, results from this program were determined using the NASP
pullout loads from tests completed with both mortar mixes, N-101-A (NASPA) and N-
101-B (NASPB), and both sets of results were presented and compared to the NCHRP
results.
The applicable data from this research program that is used for the comparison of
Missouri S&T’s results to the NCHRP research is summarized in Table 5.20. The one
day compressive strength, square root of the one day compressive strength, and pullout
value from the modified NASP in concrete tests are presented for each mix. Also, the
standard NASP in mortar values for both the tests completed in mortar Mix A (NASPA)
and Mix B (NASPB) are presented along with the ratios of the NASP in concrete and
NASP in mortar pullout loads.
Table 5.20 – Summary of Data for Comparison with NCHRP Results
Mix f'ci
(ksi) √f'ci
(√ksi) NASPconc
(k)
NASPA [N-101-A]
(k)
NASPB [N-101-B]
(k)
NASPconc/ NASPA
NASPconc/NASPB
C6 4.81 2.19 21.1 21.6 18.2 0.977 1.159 S6 5.66 2.38 23.7 21.6 18.2 1.097 1.302
C10 5.67 2.38 26.7 21.6 18.2 1.234 1.464 S10 6.33 2.52 27.3 21.6 18.2 1.264 1.500
Conversion: 1 kip = 4.45 kN 1 ksi = 6.89 MPa
In order to compare the data from the two research programs, Figures 5.35, 5.36,
and 5.37 were recreated in order for the data from the Missouri S&T research program to
be plotted along with the NCHRP data, and these recreated plots are presented in Figures
5.38, 5.39, and 5.40. The results from this research are presented with values calculated

B-180
using the NASP in mortar pullout load from N-101-A (NASPA) and also using the NASP
in mortar pullout load from N-101-B (NASPB). Although all data is included on each
figure, it should be noted that the equations and R2 values displayed on Figures 5.38-5.40
are calculated based solely on the NCHRP data. Figure 5.38 plots the relationship of
NASPconc/NASP vs. f’c, while Figure 5.39 shows the relationship of the NASPconc/NASP
ratios and √f’c. Figure 5.40 finally relates concrete compressive strength and NASP
pullout loads to transfer length by plotting transfer lengths at release vs. normalized
NASP values, as calculated by Eq. 5.6. While the original figure in NCHRP Report 603
includes transfer lengths at release and at 240 days, only the data from release as well as
the trend line from release is plotted here to have a direct comparison to the transfer
lengths measured at release in this research program. This program did not include
measuring transfer lengths at 240 days.
For all figures, the trend line equations and R2 values for just the NCHRP data,
the NCHRP data plus the Missouri S&T data with NASPA, and the NCHRP data plus the
Missouri S&T data with NASPB are summarized in Table 5.21. This summary shows
how close the results from this research program are to the results of the NCHRP
research by showing how little the inclusion of different results change the trend line
equations and R2 values.
Figure 5.38 shows the data from this program appeared to follow the relationship
between the NASPconc/NASP ratios and concrete compressive strength that was
established in the NCHRP research. The NASPconc/NASP ratios calculated with the
NASPA values appear to match up well with the NCHRP data (R2 = 0.79), and even
though the NASPconc/NASP ratios with NASPB values are on the high end of the scatter,
the R2 value for this data combined with the NCHRP data is still 0.74 (Table 5.21). This
is lower than 0.80, which corresponds to the R2 value for just the NCHRP results, but
0.74 still indicates a fair correlation. Therefore, it can be concluded that for results
calculated with NASPA and NASPB both fall reasonably within the scatter of the NCHRP
results.

B-181
Conversion: 1 kip = 4.45 kN 1 ksi = 6.89 MPa
Figure 5.38 – Normalized NASP in Concrete Pullout Values vs. Concrete Strength
(NCHRP and Missouri S&T)
Plotting the NASPconc/NASP vs. √f’c results from this research program along
with the results from the NCHRP program also indicated the results from this program
seemed to follow the trend previously established by the NCHRP results (Figure 5.39).
The NCHRP data alone had an R2 value of 0.79, and the NCHRP data combined with the
NASPA Missouri S&T data resulted in and R2 value of 0.79 as well, while the NCHRP
data combined with the NASPB Missouri S&T data resulted in an R2 value of 0.72 (Table
5.21). The NASPconc/NASP results with the NASPA value appeared to more closely fit the
data from the NCHRP study, but the NASPconc/NASP ratios with the NASPB value were
still reasonable, even though they were on the high side of the scatter.
0
0.2
0.4
0.6
0.8
1
1.2
1.4
1.6
1.8
2
0 5 10 15
NA
SP
conc
/NA
SP
(kip
s/ki
ps)
f 'ci (ksi)
NCHRP
N-101-A
N-101-B
NCHRP
y = 0.49139x0.51702 R2 = 0.79826

B-182
Conversion: 1 kip = 4.45 kN 1 ksi = 6.89 MPa
Figure 5.39 – Normalized NASP in Concrete Pullout Values vs. Square Root of
Concrete Strength (NCHRP and Missouri S&T)
The relationship between bond behavior and the square root of compressive
strength that was established by the NCHRP research was supported by the results from
this research program. Figures 5.38 and 5.39 visually indicate that the results from this
research project generally fall within the scatter from the NCHRP research, and Table
5.21 shows that the R2 values from the NCHRP data alone compared to R2 values from
the NCHRP data combined with results from Missouri S&T are relatively close. Because
the relationship was validated, it was deemed acceptable to apply the relationship found
in Eq. 5.6 to the Missouri S&T results to calculate a normalized NASP value based on
concrete strength and the NASP in mortar values and plot the transfer lengths at release
vs. the normalized NASP values from this study along with the values from the NCHRP
research (Figure 5.40). The NCHRP data did not have an overly strong correlation to
begin with, having an R2 value of 0.58, but the inclusion of the Missouri S&T data based
on the NASPA or NASPB values did not seem to significantly alter the trend line equation
or R2 value, showing the results with either NASP test in mortar pullout load follow the
0
0.2
0.4
0.6
0.8
1
1.2
1.4
1.6
1.8
2
0 1 2 3 4
NA
SP
conc
/NA
SP
(ki
ps/k
ips)
√f 'ci (√ksi)
NCHRP
N-101-A
N-101-B
NCHRP
y = 0.5096x R2 = 0.7889

B-183
NCHRP trend. Based on the results, transfer length at release could possibly be predicted
by the trend line in Figure 5.40, where x is the value corresponding to one-half of the
square root of the concrete strength at release in ksi multiplied by the NASP in mortar
pullout load in kips.
Based on the results from the NCHRP study, those researchers proposed a new
equation for transfer length for the AASHTO code that incorporates the relationship
between concrete compressive strength and transfer length (Ramirez and Russell 2008).
The proposed transfer length equation is presented here as Eq. 5.7, where f’ci is the
concrete compressive strength at release in ksi and db is the nominal diameter of the
strand in inches. The equation results in a transfer length of 60db at a concrete strength of
4 ksi (27.6 MPa) and sets a minimum limit of 40db.
12040 (5.7)
Conversion: 1 kip = 4.45 kN 1 in = 25.4 mm
Figure 5.40 – Normalized NASP Value vs. Transfer Length at Release
0
10
20
30
40
50
60
0 5 10 15 20 25 30 35
Tra
nsfe
r L
engt
hs a
t Rel
ease
(in
.)
Normalized NASP Value (kips)
NCHRP
N-101-A
N-101-B
NCHRP
y = 66.436x-0.454 R2 = 0.5774

B-184
Table 5.21 – Summary of Trend line Equations and R2 Values for NCHRP and Missouri S&T Data
. .Transfer Length at
Release vs. Normalized NASP
(Figure 5.35) (Figure 5.36) (Figure 5.37)
NCHRP
y=0.4914x0.5170 R2 = 0.798
y=0.5096x R2 = 0.789
y=66.436x-0.454 R2 = 0.577
NCHRP and Missouri S&T Results with
NASPA
y=0.4753x0.5275 R2 = 0.790
y=0.5052x R2 = 0.786
y=65.202x-0.445
R2 = 0.574
NCHRP and Missouri S&T Results with
NASPB
y=0.5142x0.5004 R2 = 0.740
y=0.4722x R2 = 0.723
y = 66.849x-0.457 R2 = 0.577
Table 5.22 compares the measured transfer lengths for the top and bottom strands
in each mix from the current study to the transfer lengths calculated by the current
AASHTO code equation and the equation proposed in the NCHRP report. As Table 5.22
indicates, the transfer lengths calculated by the proposed equation are less than the
current 30 in. (762 mm), and most of the measured transfer lengths at 1 and 28 days were
still less than the values calculated by the proposed equation. The only measured transfer
lengths that exceeded the transfer lengths calculated from the proposed equation were the
C10-2 (L) and S10-4 (L) averages. The C10-2 (L) 1 and 28 day transfer lengths exceeded
the calculated value from the proposed equation by 4.8% and 20.2%, respectively, while
the S10-4 (L) 1 and 28 day transfer lengths were 16.4% and 17.6% higher than the value
from the proposed equation. However, it should be noted that the S10-4 (L) value is only
based on a single value. The transfer length value calculated from the current AASHTO
equation was conservative for all measured transfer lengths. In conclusion, while the
proposed equation was lower than the values calculated by the current AASHTO
equation but still adequately conservative for most of the measured transfer lengths, the
proposed equation was not conservative when compared to the live end transfer lengths.

B-185
Table 5.22 – Comparison of Measured Transfer Lengths to Values Calculated by Current and Proposed AASHTO Equations
Measured Transfer Length at 1 day (in.)
Measured Transfer
Length at 28 Days (in.)
Current AASHTO
Proposed AASHTO
C6-2 17.2 23.6 30 27.3 S6-2 14.4 19.2 30 25.2
C10-2 20.1 23.7 30 25.2 C10-2 (D) 13.7 17.2 30 25.2 C10-2 (L) 26.4 30.3 30 25.2
S10-2 13.7 16.6 30 23.8 C6-4 24.8 28.9 30 27.3 S6-4 18.2 20.1 30 25.2
C10-4 17.0 19.0 30 25.2 S10-4 19.3 18.3 30 23.8
S10-4 (D) 16.5 15.1 30 23.8 S10-4 (L) 27.7 28.0 30 23.8
Conversion: 1 in. = 25.4 mm
5.4. DEVELOPMENT LENGTH TEST RESULTS
Development length was also evaluated to determine if differences existed in SCC
and conventional concrete behavior and also to see if the AASHTO and ACI equations
are conservative. The method and procedure for the four-point loading with varying
embedment lengths that were used to investigate development length is described in
Section 4.5, and the results for each development length test, including visual
observations of failure, experimental moment capacity, and average strand slip are
presented in Table 4.12. Only bottom strand development length was evaluated, so only
the two-strand beams were tested. In each case, the specimen failed due to concrete
crushing, reached an experimental moment capacity that exceeded the calculated nominal
moment capacity, and showed negligible end slip in the strands. From these results, it
was determined that bond failure was not an issue and the strands were fully developed at
embedment lengths of both 73 in. (1,854 mm) and 58 in. (1,473 mm), or 100% and 80%
of the calculated development length, respectively. Therefore, in this research, the

B-186
AASHTO and ACI design equations for development length are conservative because
flexural failures occurred even at 80% of the calculated development length.
The calculated and experimental moment capacities are summarized in Table
5.23 and analyzed to see if SCC or conventional concrete resulted in higher increases in
actual moment capacities compared to calculated capacities. Overall, all experimental
moment capacities were 11-16% above the calculated capacities. The largest discrepancy
between SCC and conventional concrete was between C6 and S6 at 58 in. (1473 mm),
where S6 had an average moment capacity 16% higher than the calculated value, while
C6 only had an average capacity 11% higher. Otherwise, all other comparisons were
within approximately 2%.
Table 5.23 – Comparison of Experimental and Calculated Moment Capacities
Mix ID Mn (k-in)
58 in. (1,473 mm) 73 in. (1,854 mm)
Mu (k-in) Mu/Mn Mu (k-in) Mu/Mn
C6 742.7 824.2 1.110 836.2 1.126 S6 757.9 878.8 1.160 860.8 1.136
C10 773.6 877.8 1.135 883.3 1.142 S10 790.7 892.2 1.128 888.0 1.123
Conversion: 1 in. = 25.4 mm 1 k-in. = 113 N-m
As discussed in Section 5.3.3, the results of the NCHRP report showed a
correlation between increasing concrete strength and decreasing transfer length. In
addition to proposing a new transfer length equation for the AASHTO code, the NCHRP
researchers also proposed a new development length equation, which takes into account
the effect of concrete strength on development length (Ramirez and Russell 2008). The
equation is presented here as Eq. 5.8, where f’ci is the concrete compressive strength at
one day in ksi, f’c is the concrete compressive strength at 28 days in ksi, and db is the
nominal strand diameter in inches. If the db variable is multiplied through, the first term
in the equation becomes the proposed transfer length equation, while the second term
represents the flexural bond length.

B-187
120 225100 (5.8)
The NCHRP researchers graphically displayed the results of the four-point load
test by plotting concrete strength at the time of test vs. embedment length, and each point
indicated whether the given test resulted in a flexural, shear, or bond failure (Ramirez and
Russell 2008). Figure 5.41 is the NCHRP plot of concrete strength vs. embedment length
plot for strands A and B, the strands with high quality bond, in both the rectangular and I-
beams. The proposed design equation, Eq. 5.8, was also plotted with the data. For
plotting the equation, f’ci was taken as 66.7% of f’c, which according to the NCHRP
report is a reasonable assumption based on general, past experience (Ramirez and Russell
2008). The plot shows that for a given concrete strength, embedment lengths to the right
of the line would be conservative and likely result in a flexural failure, while embedment
lengths to the left of the line may not be conservative and may result in a bond failure.
Conversion: 1 psi = 6.89 kPa 1 in. = 25.4 mm
Figure 5.41 – NCHRP Distribution of Bond and Flexural Failures for Strands A/B
(Ramirez and Russell 2008)

B-188
Figure 5.41 was recreated so that the results from the Missouri S&T research
could be plotted with the NCHRP results. This recreated plot of concrete strength vs.
embedment length is shown in Figure 5.42. For the NCHRP data presented in Figure
5.42, only the data points from the tests on the rectangular beams were plotted so that the
data would be directly comparable to the Missouri S&T data, which was also for
rectangular beam sections. Also, points were not designed to differentiate between
flexural, bond, or shear failures, because for both the NCHRP and Missouri S&T data
shown, all tests failed in flexure. It was chosen to compare the data from this test to the
data from the test with strands A and B because strands A and B exhibited high bond
quality, as did strand type 101 used in the Missouri S&T research. Figure 5.42 shows
that the equation is conservative for strands with high bond quality because even tests
with embedment lengths less than the length predicted by the design equation, or points
to the left of the curve, resulted in flexural failures.
Conversion: 1 psi = 6.89 kPa 1 in. = 25.4 mm
Figure 5.42 – NCHRP and Missouri S&T Concrete Strength vs. Embedment Length
Development Test Results
0
2,000
4,000
6,000
8,000
10,000
12,000
14,000
16,000
0 20 40 60 80 100
Con
cret
e S
tren
gth
(psi
)
Embedment Length (in.)
Design Eqn.
NCHRP
Missouri S&T
Note ‐ All failures were flexural

B-189
The development lengths for each concrete mix calculated by the current
AASHTO equation and the proposed AASHTO equation are presented in Table 5.24.
The development length calculated by the proposed AASHTO equation for the C6 mix is
actually 102% of the value from the current AASHTO equation, but the other
development lengths calculated from the proposed equation range from 83% to 93% of
the value calculated by the current AASHTO equation. According to this research, the
proposed development length equation appears to be conservative because in this test
program, even the development length tests run at an embedment length of 58 in (1,473
mm), which is 80% of the development length calculated from the current AASHTO
equation and less than any of the development lengths calculated by the proposed
equation, failed in flexure, showing the strand was fully bonded.
Table 5.24 – Comparison of Development Lengths Calculated by Current and Proposed AASHTO Equations
Mix ID
Current AASHTO (in.)
Proposed AASHTO (in.)
C6 73 74.4 S6 73 67.9
C10 73 63.8 S10 73 60.8
Conversion: 1 in. = 25.4
` Overall, it was found that SCC and conventional concrete performed equally well
in terms of adequately bonding with prestressing strand to fully develop the stress in the
strand. Additionally, the AASHTO and ACI equations were determined to be
conservative. The proposed AASHTO development length equation also appeared to be
conservative, except when applied to the live end transfer length averages. Also, while
the equations proved to be mostly conservative, it should be noted that the strand used in
these specimens was shown to have exceptional bond quality through the NASP test and

B-190
LBPT, and using strand with lesser bond quality could result in less conservative, or
failing, results.

B-191
6. FINDINGS, CONCLUSIONS, AND RECOMMENDATIONS
6.1. FINDINGS
The findings from the bond testing portion of the research as well as the transfer
length and development length testing are discussed below.
6.1.1. Bond Test Results. The findings from the NASP test in mortar,
modified NASP test in concrete, and LBPT are as follows:
All three strand types were deemed to have acceptable bond based on the NASP
test minimum pullout load requirements.
The rank of bond performance of strands based on pullout loads at 0.001 in.
(0.025 mm) slip was not always the same as the rank determined based on the
loads at 0.1 in. (2.54 mm) slip.
Although strand type 102 passed the NASP test acceptance criteria, the load vs.
slip plot displayed a plateau and drop off in load at 0.1 in. (2.54 mm) slip, while
strand types 101 and 103, which had much higher pullout values, were still
showing increases in load at 0.1 in. (2.54 mm) slip.
For strand types 102 and 103, the NASP pullout loads from the Missouri S&T
testing were significantly higher than the NASP pullout loads determined during
the NCHRP testing.
The two different mortar mixes used to test strand type 101 resulted in a
statistically significant difference in average pullout loads.
Compared to the normal strength concretes, high strength concretes generally had
higher 0.1 in. (2.54 mm) pullout loads, but lower 0.001 in. (2.54 mm) pullout
loads.
When normalized to the square root of concrete compressive strength, no
statistical difference was observed between the SCC and conventional concrete
pullout loads.
Only strand type 101 passed the first slip and peak load limits of the LBPT.
Strand type 102 failed both LBPT limits, while strand type 103 passed the first
slip limit but failed the peak load limit.
B-192
No correlation was found between the visual observations and residues on the
strands and the final pullout results from the LBPT.
All three strand types passed the NASP test, while strand type 101 was the only
type to pass the LBPT.
For a given strand type, the coefficient of variation values determined from both
tests were very similar.
Plotting LBPT results vs. NASP test results indicated a linear trend line with an
R2 value of 0.77, meaning there was a fair correlation between the two tests and
each one could be an equally valid test.
Both tests predicted strand type 102 to be the worst, but the NASP test indicated
that 103 was the top performer, while the LBPT indicated strand type 101 was
the best. However the results for types 101 and 103 were extremely close for both
tests.
6.1.2. Transfer Length Test Results. The findings from the transfer lengths
determined through the 95% Average Mean Strain Method and the transfer lengths at
release calculated by initial end slips are as follows:
Live and dead ends were not noted at the time of release, but measured transfer
lengths indicated some locations where transfer lengths were significantly longer
and live ends could be reasonably assumed.
No significant differences were seen between transfer lengths in SCC and those
in conventional concrete for either top or bottom strands from 1 to 28 days when
possible live end values were removed from averages.
In terms of the effect of concrete strength on transfer length, higher strength
concrete resulted in shorter transfer lengths for bottom strands in conventional
concrete when the possible live end values were removed from the average, but
no differences were seen between the transfer lengths in normal and high strength
SCC for bottom strands. For top strands, the high strength mixes for both the
SCC and conventional concrete had shorter transfer lengths, but only from 8 to
28 days.
For all concrete mixes at all ages, no statistically significant differences were
observed between the transfer lengths of top strands vs. bottom strands.

B-193
For bottom strands, transfer lengths in normal strength concretes increased 33 to
37% over 28 days, while transfer lengths in high strength mixes increased 14 to
24%, and higher increases were observed in transfer lengths in conventional
concrete compared to SCC for a given strength level.
For top strands, no consistent increases were seen over 28 days for any mix or
strength, and the high strength SCC mix actually showed decreases in transfer
lengths over time.
For both top and bottom strands, except for the possible live end averages of both
the top and bottom strands and top strands in the normal strength conventional
concrete, measured transfer lengths were shorter than the values predicted by the
two ACI equations. All measured top and bottom transfer lengths, even the
possible live end averages, were shorter than the value predicted by AASHTO
equation.
Due to the violent release method, many of the potentiometers did not register
valid end slips because the potentiometers either became separated from the plate
attached to the strand or the wires connecting the potentiometers to the Synergy
data acquisition became disconnected. Only 38% of all potentiometers that were
installed registered what could be considered valid end slips.
The steel ruler measurements had a precision of only 1/32 in. (0.79 mm) and the
same measurements were consistently reported, rendering the steel ruler method
of determining end slips imprecise.
The percent differences between the average DEMEC and Synergy transfer
lengths for each mix ranged from 0.36 to 73%. The transfer lengths calculated
from the end slips measured by the potentiometers were generally less than the
transfer lengths determined from the DEMEC readings.
The percent differences between the average DEMEC and ruler transfer lengths
ranged from 4 to 119%. The transfer lengths calculated from the end slips
measured by the steel ruler were generally less than the transfer lengths
determined from the DEMEC readings.
When plotted with results from a similar program by Ramirez and Russell
(2008), NASP in concrete pullout loads normalized by NASP in mortar pullout
B-194
loads were shown to follow the same correlation to the square root of concrete
compressive strength, as was found by Ramirez and Russell. The correlation was
not significantly changed whether the results from the NASP test in mortar Mix
A or the results from the NASP test in mortar Mix B were used.
When NASP values normalized to the square root of concrete compressive
strength were plotted against transfer lengths at release, the scatter was found to
fall within the scatter reported in the NCHRP report, confirming the relationship
between the NASP in mortar pullout values, concrete compressive strength, and
initial transfer lengths, found by Ramirez and Russell (2008).
When Ramirez and Russell’s proposed transfer length equation was applied to
the data from this study, the equation was found to give values shorter than the
current AASHTO equation, but the calculated values were still found to generally
be conservative, except when compared to the possible live end averages.
6.1.3. Development Length Test Results. The findings from the four-point
loading tests performed to evaluate development lengths are as follows:
All development length test specimens failed in flexure due to concrete crushing.
All development length test specimens sustained an applied moment that
exceeded the calculated nominal moment.
All development length test specimens showed negligible strand end slip during
testing.
SCC and conventional concrete specimens exceeded the calculated nominal
moment capacities by similar amounts and exhibited similar flexural bond
behavior.
When Ramirez and Russell’s proposed development length equation was applied
to the data from this study, the equation was found to produce development
lengths shorter than the AASHTO equation for three of the four mixes. For the
normal strength conventional concrete mix, the proposed equation actually
resulted in a transfer length longer than the length predicted by the AASHTO
equation.

B-195
6.2. CONCLUSIONS
Based on the previously stated findings, several conclusions can be drawn
regarding the applicability of NASP test in mortar and LBPT bond tests, the bond
performance of SCC compared to conventional concrete, and the feasibility of using
concrete strength and pullout test results to predict transfer lengths.
1. Based on the linear relationship found between the LBPT and NASP pullout
values and the similar coefficients of variation between the two tests for a given
strand type, either the LBPT or NASP test are equally valid approaches to
evaluating bond performance of prestressing strand. However, the limits set on
passing may need some refinement, as two of the strand sources passed the
proposed NASP standard but did not pass the LBPT requirements.
2. Proportioning for the mortar mixes did appear to have an effect on NASP in
mortar pullout values, and it is hypothesized that a decreased amount of sand
could detrimentally affect mechanical interlocking and lead to lower pullout
values.
3. While first slips are not required to be monitored in the NASP test, strands with
high 0.1 in. (2.54 mm) pullout loads sometimes had the lowest 0.001 in. (0.025
mm) pullout loads, which could indicate a problem with adhesion of the strand.
4. The NASP test in concrete revealed that the high strength concretes had lower
first slip values than the normal strength concretes. Compared to their normal
strength counterparts, the high strength mixes generally had a lower water/cement
ratio, a decrease in coarse and fine aggregate content, an increase in total
cementitious material, and an increase in high range water reducer.
5. SCC and conventional concrete were comparable in terms of bond performance,
showing few statistical differences between measured transfer lengths or pullout
loads between the two types of concrete.
6. Increases in concrete strength generally resulted in shorter, although not always
statistically different, transfer lengths, especially if the possible live end values
were removed from the averages. Also, top strands only seemed to show
statistically significant increases in transfer length at later ages.

B-196
7. Transfer lengths of bottom strands tended to increase from 1 to 28 days, with
most of the increase occurring between 1 and 4 days. Also, the transfer lengths in
normal strength mixes appeared to increase more than those in high strength
mixes, and transfer lengths in conventional concrete increased more than transfer
lengths in SCC. However, no consistent trends were noted for change in top
strand transfer lengths over time.
8. The AASHTO transfer length equation was generally conservative for all mixes
for both top and bottom strands, even when compared to possible live end transfer
lengths. The ACI equations were generally conservative except when compared to
live end transfer lengths or the top strands in the normal strength conventional
concrete.
9. The linear potentiometers used in this study were found to be unreliable, and the
steel ruler measurements were determined to be imprecise; the transfer lengths
determined from the DEMEC readings and 95% Average Mean Strain Method
were found to be the most consistent and reliable.
10. Due to the fact that increased concrete strength resulted in decreased transfer
lengths and increased NASP in concrete pullout loads, concrete strength does
have an effect on bond and the equation for transfer length should be a function of
concrete strength.
11. In this study, transfer length did appear to be related to the square root of concrete
compressive strength, which follows the trend noted by Ramirez and Russell
(2008) and others.
12. The proposed transfer length equation from Ramirez and Russell (2008) was
slightly less conservative than the AASHTO equation, but still mostly
conservative when compared to the measured transfer lengths, although the
proposed equation was not conservative when compared to the live end transfer
lengths.
13. Development length specimens tested at embedment lengths of 80% of the
development length calculated from the AASHTO and ACI equations still failed
in flexure, so the current AASHTO and ACI equations for development length are
conservative.

B-197
14. SCC and conventional concrete appeared to exhibit comparable flexural behavior.
15. Ramirez and Russell’s proposed development length equation (2008) appeared to
be less conservative than the AASHTO and ACI equation, but still conservative in
three out of the four cases. In this test program, even the development length tests
completed at an embedment length of 58 in (1,473 mm), which is 80% of the
development length calculated from the current AASHTO equation and shorter
than any of the development lengths calculated by the proposed equation, failed in
flexure, showing the strand stress could be fully developed. However, the
proposed equation did predict one development length greater than the AASHTO
and ACI value for one mix, showing the proposed development length equation
may be over-conservative in some cases.
6.3. RECOMMENDATIONS
From the conclusions, the following recommendations for future work and for
implementation of tests are listed below:
1. Because differences in bond quality have been shown to vary greatly depending
on the source of strand, a standard bond test should be recommended and
implemented by MoDOT to ensure strand bond quality before the strand is used
in production. Missouri S&T recommends that the NASP Bond test as described
in NCHRP Report 603 be prescribed; however, the minimum acceptance criteria
loads should be increased to 16,000 lb (71.2 kN) for the average of six specimens
and 14,000 lb (62.3 kN) for an individual specimen.
2. The NASP test in concrete should not necessarily be a required test for strand
bond because the tests showed pullout strength is mostly a function of concrete
compressive strength; however the NASP test in concrete still could be useful for
identifying possible effects of mix additions or proportioning on bond.
3. The pullout limits for both the NASP test in mortar and LBPT need refinement.
Additional research should be conducted with NASP and LBPT specimens and
corresponding transfer length specimens to see if the NASP minimum value
should be raised and the LBPT minimum value should be lowered. Specifically,
strands with NASP pullout values between 12,000 and 18,000 lb (53 and 80 kN)
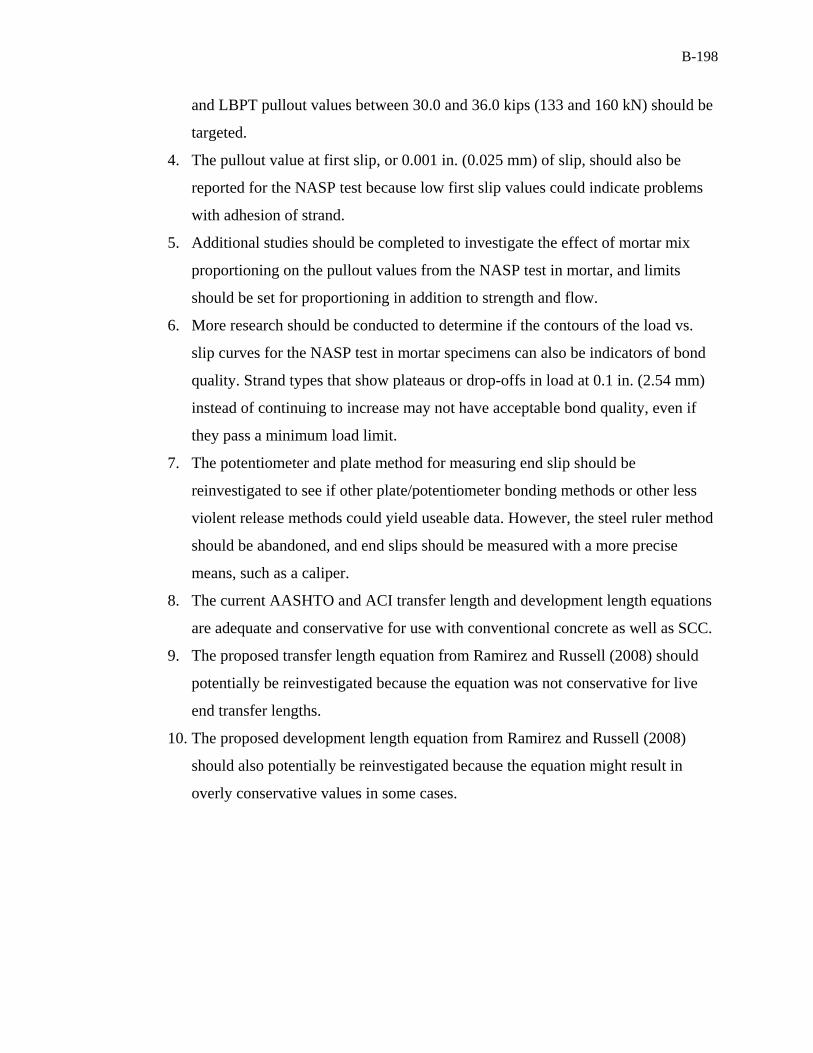
B-198
and LBPT pullout values between 30.0 and 36.0 kips (133 and 160 kN) should be
targeted.
4. The pullout value at first slip, or 0.001 in. (0.025 mm) of slip, should also be
reported for the NASP test because low first slip values could indicate problems
with adhesion of strand.
5. Additional studies should be completed to investigate the effect of mortar mix
proportioning on the pullout values from the NASP test in mortar, and limits
should be set for proportioning in addition to strength and flow.
6. More research should be conducted to determine if the contours of the load vs.
slip curves for the NASP test in mortar specimens can also be indicators of bond
quality. Strand types that show plateaus or drop-offs in load at 0.1 in. (2.54 mm)
instead of continuing to increase may not have acceptable bond quality, even if
they pass a minimum load limit.
7. The potentiometer and plate method for measuring end slip should be
reinvestigated to see if other plate/potentiometer bonding methods or other less
violent release methods could yield useable data. However, the steel ruler method
should be abandoned, and end slips should be measured with a more precise
means, such as a caliper.
8. The current AASHTO and ACI transfer length and development length equations
are adequate and conservative for use with conventional concrete as well as SCC.
9. The proposed transfer length equation from Ramirez and Russell (2008) should
potentially be reinvestigated because the equation was not conservative for live
end transfer lengths.
10. The proposed development length equation from Ramirez and Russell (2008)
should also potentially be reinvestigated because the equation might result in
overly conservative values in some cases.

B-199
APPENDIX A
Concrete Compressive Strength Summary

B-200
Table A.1 – Summary of Concrete Compressive Strengths
Figure A.1 – Concrete Compressive Strength over Time
0
1,000
2,000
3,000
4,000
5,000
6,000
7,000
8,000
9,000
10,000
0 7 14 21 28
Com
pres
sive
Str
engt
h (p
si)
Days
C6
S6
C10
S10
Mix ID Concrete Compressive Strength
1 Day (psi) 4 Day (psi) 8 Day (psi) 14 Day (psi) 28 Day (psi)C6 4,810 5,380 5,620 5,630 5,730 S6 5,660 6,440 6,690 6,910 6,950
C10 5,670 7,890 7,950 8,350 8,480 S10 6,330 8,300 8,600 9,100 9,250

B-201
APPENDIX B
NASP in Concrete Load vs. Slip Plots

B-202
Conversion: 1 in. = 25.4 mm 1 lb = 4.45 N
Figure B.1 – C6 NASP in Concrete – 1 Day
Conversion: 1 in. = 25.4 mm 1 lb = 4.45 N
Figure B.2 – C6 NASP in Concrete – 8 Day
0
5,000
10,000
15,000
20,000
25,000
30,000
35,000
40,000
45,000
0.00 0.02 0.04 0.06 0.08 0.10 0.12
Loa
d (l
b)
Displacement (in.)
N-101-C6-1
N-101-C6-2
N-101-C6-3
0
5,000
10,000
15,000
20,000
25,000
30,000
35,000
40,000
45,000
0 0.02 0.04 0.06 0.08 0.1 0.12
Loa
d (l
b)
Displacement (in.)
N-101-C6-4
N-101-C6-5
N-101-C6-6

B-203
Conversion: 1 in. = 25.4 mm 1 lb = 4.45 N
Figure B.3 – S6 NASP in Concrete – 1 Day
Conversion: 1 in. = 25.4 mm 1 lb = 4.45 N
Figure B.4 – S6 NASP in Concrete – 8 Day
0
5,000
10,000
15,000
20,000
25,000
30,000
35,000
40,000
45,000
0 0.02 0.04 0.06 0.08 0.1 0.12
Loa
d (l
b)
Displacement (in.)
N-101-S6-1
N-101-S6-2
N-101-S6-3
0
5,000
10,000
15,000
20,000
25,000
30,000
35,000
40,000
45,000
0.00 0.02 0.04 0.06 0.08 0.10 0.12
Loa
d (l
b)
Displacement (in.)
N-101-S6-4
N-101-S6-5
N-101-S6-6

B-204
Conversion: 1 in. = 25.4 mm 1 lb = 4.45 N
Figure B.5 – C10 NASP in Concrete – 1 Day
Conversion: 1 in. = 25.4 mm 1 lb = 4.45 N
Figure B.6 – C10 NASP in Concrete – 8 Day
0
5,000
10,000
15,000
20,000
25,000
30,000
35,000
40,000
45,000
0 0.02 0.04 0.06 0.08 0.1 0.12
Loa
d (l
b)
Displacement (in.)
N-101-C10-1
N-101-C10-2
N-101-C10-3
0
5,000
10,000
15,000
20,000
25,000
30,000
35,000
40,000
45,000
0 0.02 0.04 0.06 0.08 0.1 0.12
Loa
d (l
b)
Displacement (in.)
N-101-C10-4
N-101-C10-5
N-101-C10-6
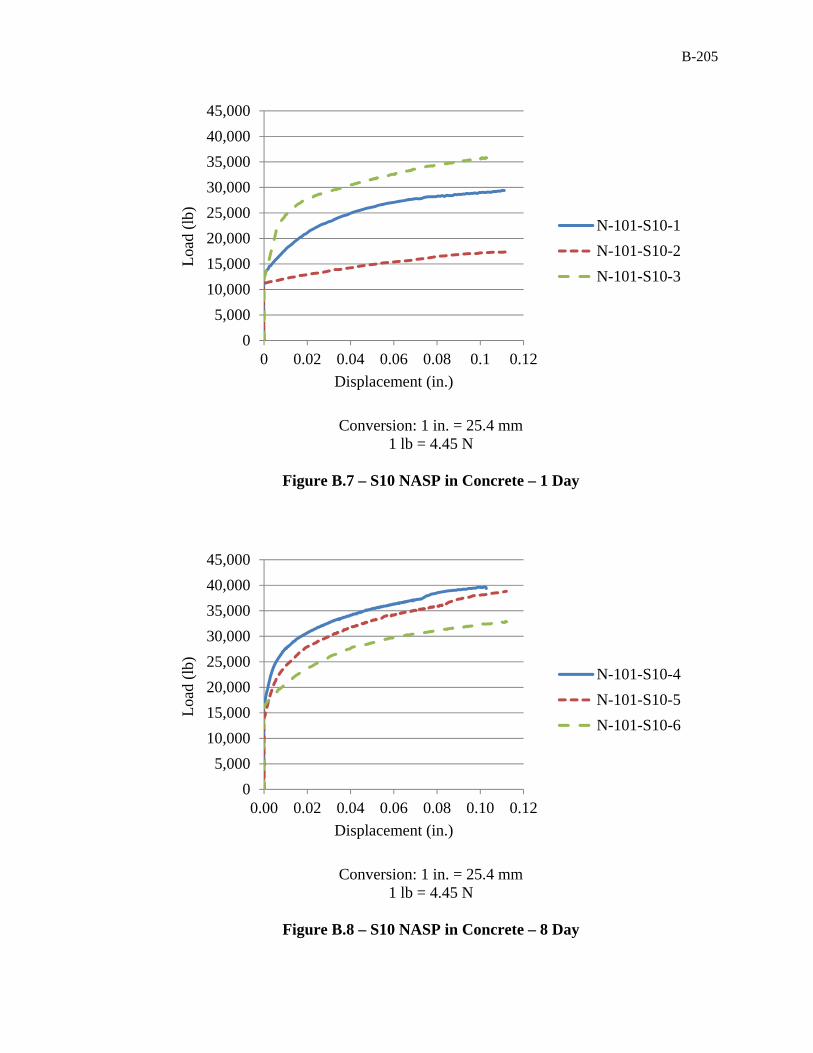
B-205
Conversion: 1 in. = 25.4 mm 1 lb = 4.45 N
Figure B.7 – S10 NASP in Concrete – 1 Day
Conversion: 1 in. = 25.4 mm 1 lb = 4.45 N
Figure B.8 – S10 NASP in Concrete – 8 Day
0
5,000
10,000
15,000
20,000
25,000
30,000
35,000
40,000
45,000
0 0.02 0.04 0.06 0.08 0.1 0.12
Loa
d (l
b)
Displacement (in.)
N-101-S10-1
N-101-S10-2
N-101-S10-3
0
5,000
10,000
15,000
20,000
25,000
30,000
35,000
40,000
45,000
0.00 0.02 0.04 0.06 0.08 0.10 0.12
Loa
d (l
b)
Displacement (in.)
N-101-S10-4
N-101-S10-5
N-101-S10-6

B-206
APPENDIX C
LBPT Load vs. Time Plots

B-207
Conversion: 1 kip = 4.45 kN
Figure C.1 – LBPT Results for Strand Type 101
Conversion: 1 kip = 4.45 kN
Figure C.2 – LBPT Results for Strand Type 102
0
5
10
15
20
25
30
35
40
45
0 50 100 150 200
Loa
d (k
ips)
Time (seconds)
L-101-1
L-101-2
L-101-3
L-101-4
L-101-5
L-101-6
0
5
10
15
20
25
30
35
40
45
0 50 100 150 200 250
Loa
d (k
ips)
Time (seconds)
L-102-1
L-102-2
L-102-3
L-102-4
L-102-5
L-102-6
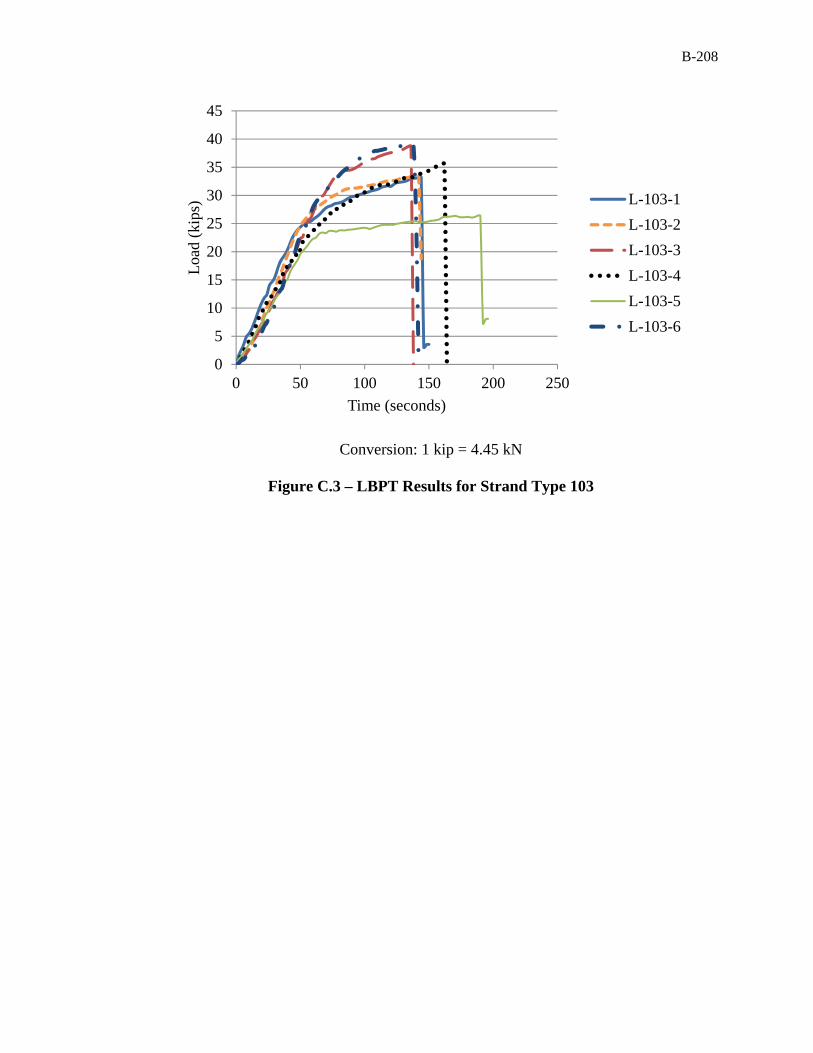
B-208
Conversion: 1 kip = 4.45 kN
Figure C.3 – LBPT Results for Strand Type 103
0
5
10
15
20
25
30
35
40
45
0 50 100 150 200 250
Loa
d (k
ips)
Time (seconds)
L-103-1
L-103-2
L-103-3
L-103-4
L-103-5
L-103-6

B-209
APPENDIX D
95% Average Mean Strain Plots

B-210
Conversion: 1 in. = 25.4 mm
Figure D.1 – C6-2-1_NE and C6-2-1_SE Average Mean Strains
Conversion: 1 in = 25.4 mm
Figure D.2 – C6-2-1_NW and C6-2-1_SW Average Mean Strains
0
200
400
600
800
1,000
1,200
1,400
0 24 48 72 96 120 144 168 192
Mic
rost
rain
Distance from North End of Beam (in.)
1 Day
4 Day
8 Day
14 Day
28 Day
48 Day
0
200
400
600
800
1,000
1,200
1,400
0 24 48 72 96 120 144 168 192
Mic
rost
rain
Distance from North End of Beam (in.)
1 Day
4 Day
8 Day
14 Day
28 Day
48 Day

B-211
Conversion: 1 in = 25.4 mm
Figure D.3 – C6-2-2_NE and C6-2-2_SE Average Mean Strains
Conversion: 1 in = 25.4 mm
Figure D.4 – C6-2-2_NW and C6-2-2_SW Average Mean Strains
0
200
400
600
800
1,000
1,200
1,400
0 24 48 72 96 120 144 168 192
Mic
rost
rain
Distance from North End of Beam (in.)
1 Day
4 Day
8 Day
14 Day
28 Day
53 Day
0
200
400
600
800
1,000
1,200
1,400
1,600
0 24 48 72 96 120 144 168 192
Mic
rost
rain
Distance from North End of Beam (in.)
1 Day
4 Day
8 Day
14 Day
28 Day
53 Day

B-212
Conversion: 1 in = 25.4 mm
Figure D.5 – C6-4-1_NE and C6-2-1_SE Average Mean Strains
Conversion: 1 in = 25.4 mm
Figure D.6 – C6-4-1_NW and C6-4-1_SW Average Mean Strains
-200
0
200
400
600
800
1,000
0 24 48 72 96 120 144 168 192
Mic
rost
rain
Distance from North End of Beam (in.)
1 Day
4 Day
8 Day
14 Day
28 Day
56 Day
0
200
400
600
800
1,000
1,200
0 24 48 72 96 120 144 168 192
Mic
rost
rain
Distance from North End of Beam (in.)
1 Day
4 Day
8 Day
14 Day
28 Day
56 Day

B-213
Conversion: 1 in = 25.4 mm
Figure D.7 – S6-2-1_NE and S6-2-1_SE Average Mean Strains
Conversion: 1 in = 25.4 mm
Figure D.8 – S6-2-1_NW and S6-2-1_SW Average Mean Strains
0
200
400
600
800
1,000
1,200
1,400
1,600
0 24 48 72 96 120 144 168 192
Mic
rost
rain
Distance from North End of Beam (in.)
1 Day
4 Day
8 Day
14 Day
28 Day
54 Day
0
200
400
600
800
1,000
1,200
0 24 48 72 96 120 144 168 192
Mic
rost
rain
Distance from North End of Beam (in.)
1 Day
4 Day
8 Day
14 Day
28 Day
54 Day

B-214
Conversion: 1 in = 25.4 mm
Figure D.9 – S6-2-2_NE and S6-2-2_SE Average Mean Strains
Conversion: 1 in = 25.4 mm
Figure D.10 – S6-2-2_NW and S6-2-2_SW Average Mean Strains
0
200
400
600
800
1,000
1,200
0 24 48 72 96 120 144 168 192
Mic
rost
ain
Distance from North End of Beam (in.)
1 Day
4 Day
8 Day
14 Day
28 Day
50 Day
0
200
400
600
800
1,000
1,200
0 24 48 72 96 120 144 168 192
Mic
rost
ain
Distance from North End of Beam (in.)
1 Day
4 Day
8 Day
14 Day
28 Day
50 Day

B-215
Conversion: 1 in = 25.4 mm
Figure D.11 – S6-4-1_NE and S6-4-1_SE Average Mean Strains
Conversion: 1 in = 25.4 mm
Figure D.12 – S6-4-1_NW and S6-4-1_SW Average Mean Strains
0
100
200
300
400
500
600
700
800
900
1,000
0 24 48 72 96 120 144 168 192
Mic
rost
rain
Distance from North End of Beam (in.)
1 Day
4 Day
8 Day
14 Day
28 Day
56 Day
0
200
400
600
800
1,000
1,200
1,400
0 24 48 72 96 120 144 168 192
Mic
rost
rain
Distance from North End of Beam (in.)
1 Day
4 Day
8 Day
14 Day
28 Day
56 Day
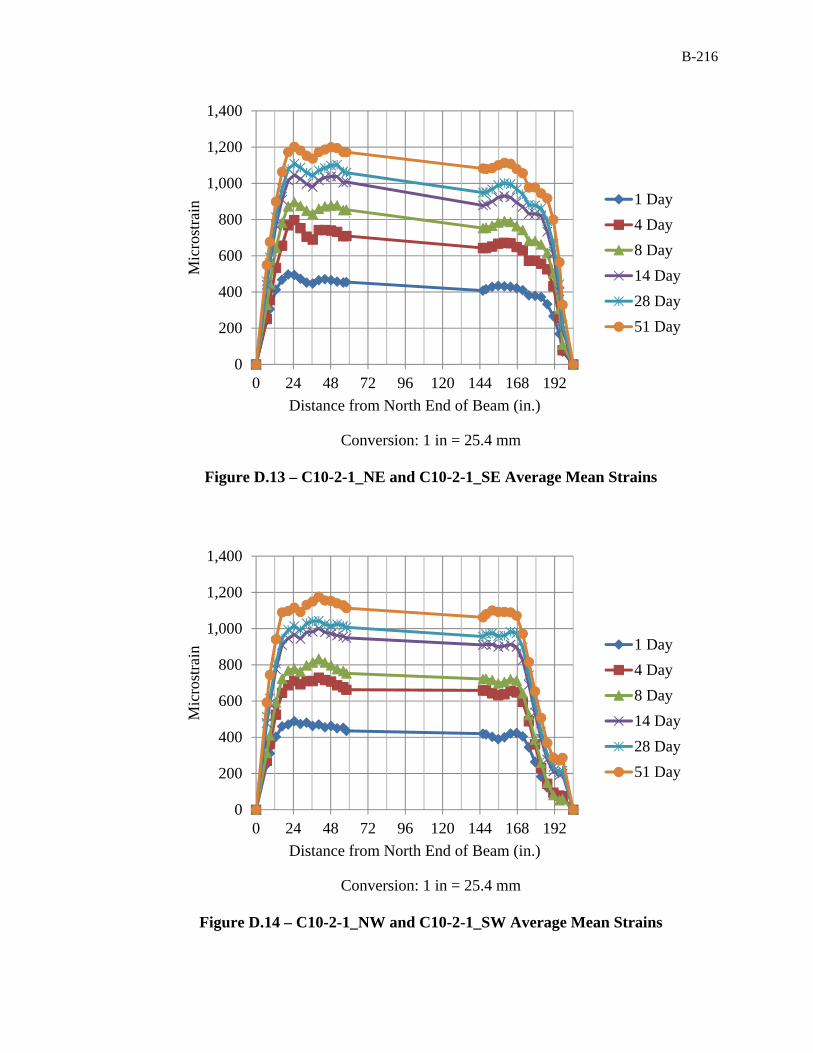
B-216
Conversion: 1 in = 25.4 mm
Figure D.13 – C10-2-1_NE and C10-2-1_SE Average Mean Strains
Conversion: 1 in = 25.4 mm
Figure D.14 – C10-2-1_NW and C10-2-1_SW Average Mean Strains
0
200
400
600
800
1,000
1,200
1,400
0 24 48 72 96 120 144 168 192
Mic
rost
rain
Distance from North End of Beam (in.)
1 Day
4 Day
8 Day
14 Day
28 Day
51 Day
0
200
400
600
800
1,000
1,200
1,400
0 24 48 72 96 120 144 168 192
Mic
rost
rain
Distance from North End of Beam (in.)
1 Day
4 Day
8 Day
14 Day
28 Day
51 Day

B-217
Conversion: 1 in = 25.4 mm
Figure D.15 – C10-2-2_NE and C10-2-2_SE Average Mean Strains
Conversion: 1 in = 25.4 mm
Figure D.16 – C10-2-2_NW and C10-2-2_SW Average Mean Strains
0
200
400
600
800
1,000
1,200
1,400
0 24 48 72 96 120 144 168 192
Mic
rost
rain
Distance from North End of Beam (in.)
1 Day
4 Day
8 Day
14 Day
28 Day
51 Day
0
200
400
600
800
1,000
1,200
1,400
0 24 48 72 96 120 144 168 192
Mic
rost
rain
Distance from North End of Beam (in.)
1 Day
4 Day
8 Day
14 Day
28 Day
51 Day

B-218
Conversion: 1 in = 25.4 mm
Figure D.17 – C10-4-1_NE and C10-4-1_SE Average Mean Strains
Conversion: 1 in = 25.4 mm
Figure D.18 – C10-4-1_NW and C10-4-1_SW Average Mean Strains
0
100
200
300
400
500
600
700
800
900
0 24 48 72 96 120 144 168 192
Mic
rost
rain
Distance from North End of Beam (in.)
1 Day
4 Day
8 Day
14 Day
28 Day
51 Day
0
100
200
300
400
500
600
700
800
900
1,000
0 24 48 72 96 120 144 168 192
Mic
rost
rain
Distance from North End of Beam (in.)
1 Day
4 Day
8 Day
14 Day
28 Day
51 Day

B-219
Conversion: 1 in = 25.4 mm
Figure D.19 – S10-2-1_NE and S10-2-1_SE Average Mean Strains
Conversion: 1 in = 25.4 mm
Figure D.20 – S10-2-1_NW and S10-2-1_SW Average Mean Strains
0
200
400
600
800
1,000
1,200
1,400
0 24 48 72 96 120 144 168 192
Mic
rost
rain
Distance from North End of Beam (in.)
1 Day
4 Days
8 Day
14 Day
28 Day
56 Day
0
200
400
600
800
1,000
1,200
1,400
0 24 48 72 96 120 144 168 192
Mic
rost
rain
Distance from North End of Beam (in.)
1 Day
4 Days
8 Day
14 Day
28 Day
56 Day

B-220
Conversion: 1 in = 25.4 mm
Figure D.21 – S10-2-2_NE and S10-2-2_SE Average Mean Strains
Conversion: 1 in = 25.4 mm
Figure D.22 – S10-2-2_NW and S10-2-2_SW Average Mean Strains
0
200
400
600
800
1,000
1,200
1,400
0 24 48 72 96 120 144 168 192
Mic
rost
rain
Distance from North End of Beam (in.)
1 Day
4 Day
8 Day
14 Day
28 Day
57 Day
0
200
400
600
800
1,000
1,200
1,400
0 24 48 72 96 120 144 168 192
Mic
rost
rain
Distance from North End of Beam (in.)
1 Day
4 Day
8 Day
14 Day
28 Day
57 Day

B-221
Conversion: 1 in = 25.4 mm
Figure D.23 – S10-4-1_NE and S10-4-1_SE Average Mean Strains
Conversion: 1 in = 25.4 mm
Figure D.24 – S10-4-1_NW and S10-4-1_SW Average Mean Strains
0
100
200
300
400
500
600
700
800
0 24 48 72 96 120 144 168 192
Mic
rost
rain
Distance from North End of Beam (in.)
1 Day
4 Day
8 Day
14 Day
28 Day
56 Day
0
100
200
300
400
500
600
700
800
900
0 24 48 72 96 120 144 168 192
Mic
rost
rain
Distance from North End of Beam (in.)
1 Day
4 Day
8 Day
14 Day
28 Day
56 Day

B-222
APPENDIX E
Linear Potentiometer End Slip Plots

B-223
Conversion: 1 in. = 25.4 mm
Figure E.1 – C6-2-1 and C6-2-2 Strands
Conversion: 1 in. = 25.4 mm
Figure E.2 – S6-2-1 and S6-2-2 Strands
0
0.05
0.1
0.15
0.2
0.25
0.3
0.35
0.4
0.45
0.5
0 20 40 60
Pot
enti
omet
er R
eadi
ng (
in.)
Time Elapsed (seconds)
2-1_NE 2-1_SE 2-2_NE 2-1_NW 2-1_SW 2-2_NW
0
0.05
0.1
0.15
0.2
0.25
0.3
0.35
0.4
0.45
0.5
0 20 40 60
Pot
enti
omet
er R
eadi
ng (
in.)
Time Elapsed (seconds)
2-1_SE 2-2_NE 2-2_SE 2-1_SW 2-2_NW 2-2_SW
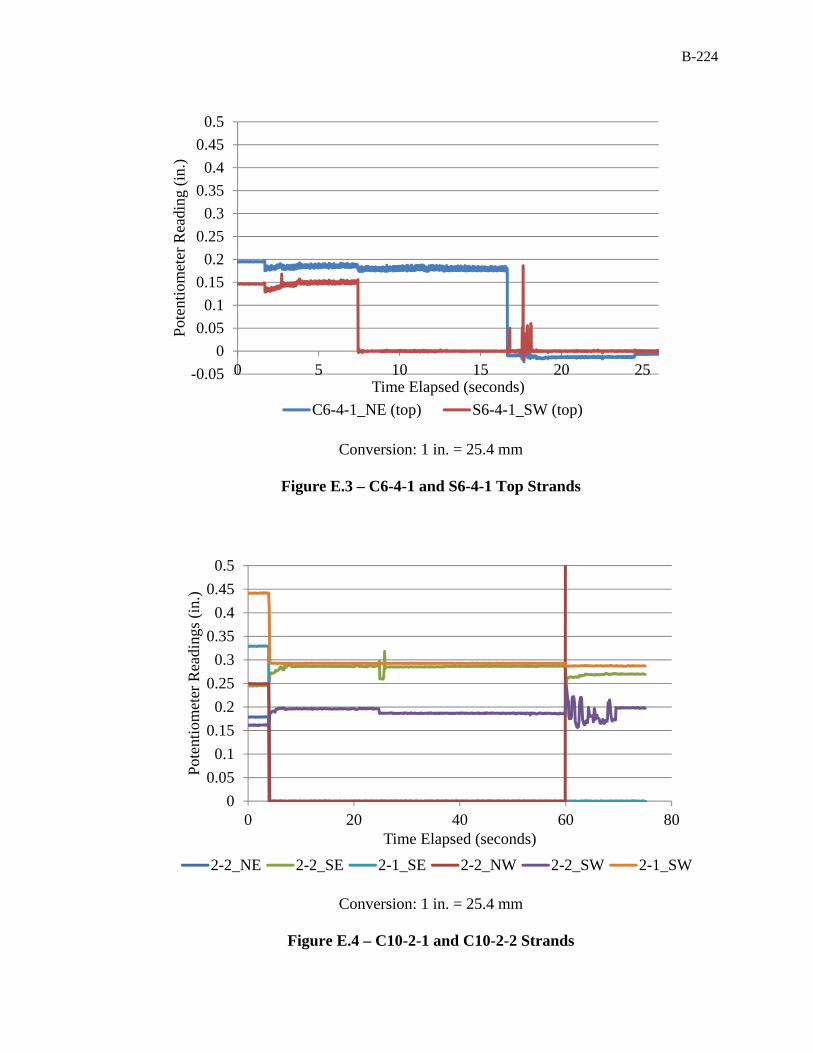
B-224
Conversion: 1 in. = 25.4 mm
Figure E.3 – C6-4-1 and S6-4-1 Top Strands
Conversion: 1 in. = 25.4 mm
Figure E.4 – C10-2-1 and C10-2-2 Strands
-0.05
0
0.05
0.1
0.15
0.2
0.25
0.3
0.35
0.4
0.45
0.5
0 5 10 15 20 25
Pot
enti
omet
er R
eadi
ng (
in.)
Time Elapsed (seconds)
C6-4-1_NE (top) S6-4-1_SW (top)
0
0.05
0.1
0.15
0.2
0.25
0.3
0.35
0.4
0.45
0.5
0 20 40 60 80
Pot
enti
omet
er R
eadi
ngs
(in.
)
Time Elapsed (seconds)
2-2_NE 2-2_SE 2-1_SE 2-2_NW 2-2_SW 2-1_SW

B-225
Conversion: 1 in. = 25.4 mm
Figure E.5 – S10-2-1 and S10-2-2 Strands
Conversion: 1 in. = 25.4 mm
Figure E.6 – C10-4-1 Top Strands
0
0.05
0.1
0.15
0.2
0.25
0.3
0.35
0.4
0.45
0.5
0 20 40 60
Pot
enti
omet
er R
eadi
ngs
(in.
)
Time Elapsed (seconds)
2-1_NE 2-1_SE 2-2_NE 2-1_NW 2-1_SW 2-2_NW
-0.15
-0.05
0.05
0.15
0.25
0.35
0.45
0.55
0.65
0.75
0 20 40 60 80 100
Pot
enti
omet
er R
eadi
ng (
in.)
Time Elapsed (seconds)
4-1_NE 4-1_SE 4-1_NW 4-1_SW

B-226
Conversion: 1 in. = 25.4 mm
Figure E.7 – C10-4-1 Bottom strands
Conversion: 1 in. = 25.4 mm
Figure E.8 – S10-4-1 Top Strands
-0.15
-0.05
0.05
0.15
0.25
0.35
0.45
0.55
0.65
0.75
0 20 40 60 80 100
Pot
enti
omet
er R
eadi
ng (
in.)
Time Elapsed (seconds)
4-1_NE 4-1_SE 4-1_NW 4-1_SW
-0.15
-0.05
0.05
0.15
0.25
0.35
0.45
0.55
0.65
0.75
0 20 40 60 80 100
Pot
enti
omet
er R
eadi
ng (
in.)
Time Elapsed (seconds)
4-1_NE 4-1_SE 4-1_NW 4-1_SW

B-227
Conversion: 1 in. = 25.4 mm
Figure E.9 – S10-4-1 Bottom Strands
-0.15
-0.05
0.05
0.15
0.25
0.35
0.45
0.55
0.65
0.75
0 20 40 60 80 100
Pot
enti
omet
er R
eadi
ng (
in.)
Time Elapsed (seconds)
4-1_NE 4-1_SE 4-1_NW 4-1_SW

B-228
APPENDIX F
Development Length Test Summaries

B-229
BEAM ID: C6-2-1_58
DATE OF TESTING: 9/7/2011
DAYS AFTER CASTING: 48
Test Summary Embedment Length 58 in. Failure Mode (Flexural or Bond) Flexural Beam End SE/SW Span Length 132 in. Deflection at Failure 1.2 in. Concrete Compressive Strength 5730 psi Maximum Moment Capacity
Expected Actual
742.7 k-in. 811.8 k-in.
Average Transfer Length At Release
At Time of Testing
17.2 in. 24.2 in.
Average 0.1 in. NASP Load for Strand 101Standard NASP(Mix B)
NASP in Concrete (1 Day)
18200 lb 21100 lb
The test was set up as deflection-controlled, and the beam was initially deflected
in increments of 0.02 in. (0.508 mm). Once deflection reached 1.00 in. (2.54 mm), the
increments were increased to 0.05 in. (1.27 mm) until failure because at this point, the
beam was taking on increasingly less load per deflection increment. At each deflection
increment, the load was noted and then the beam was checked for cracks, which were
marked with permanent marker.
The first flexural crack was observed directly under the right support at a
deflection of 0.30 in. (7.62 mm) and load of about 15.1 kips (67.2 kN). Subsequent
flexural cracks in the middle and under the left support appeared at a deflection of 0.32
in. (8.13 mm) and load of 15.9 kips (70.7 kN). These cracks as well as subsequent cracks
propagated vertically and then began angling towards the supports. The beam failed due
to concrete crushing within the compression zone at a load of 27.8 kips (124 kN) and
reached a deflection of 1.2 in. (30.5 mm) at failure. Negligible end slip was observed on
both the SE and SW strands.

B-230
Figure F.1 – C6-2-1_58 at Failure with Detail of Concrete Crushing
Conversion: 1 in. = 25.4 mm 1 k-in. = 113 N-m
Figure F.2 – C6-2-1_58 Moment vs. Deflection and Strand End Slip vs. Deflection
0
0.1
0.2
0.3
0.4
0.5
0.6
0.7
0.8
0.9
1
0
100
200
300
400
500
600
700
800
900
1000
0 0.5 1 1.5 2
End
Sli
p (i
n.)
Mom
ent (
k-in
.)
Deflection (in.)
Mn Moment Avg. SE/SW Strands
Mn = 742.7 k-in.

B-231
BEAM ID: C6-2-1_73
DATE OF TESTING: 9/7/2011
DAYS AFTER CASTING: 48
Test Summary Embedment Length 73 in. Failure Mode (Flexural or Bond) Flexural Beam End NE/NW Span Length 162 in. Deflection at Failure 1.9 in. Concrete Compressive Strength 5730 psi Maximum Moment Capacity
Expected Actual
742.7 k-in. 834.8 k-in.
Average Transfer Length (DEMEC) At Release
At Time of Testing
17.2 in. 24.2 in.
Average 0.1 in. NASP Load for Strand 101Standard NASP (Mix B)
NASP in Concrete (1 Day)
18200 lb 21100 lb
Conversion: 1 in. = 25.4 mm 1 lb = 4.45 N
1 psi = 6.89 kPa
The test was set up as deflection-controlled, and the beam was initially deflected
in increments of 0.02 in. (0.508 mm). Once deflection reached 1.00 in. (25.4 mm), the
increments were increased to 0.05 in. (1.27 mm) until failure because at this point, the
beam was taking on increasingly less load per deflection increment. At each deflection
increment, the load was noted and then the beam was checked for cracks, which were
marked with permanent marker.
The first flexural cracks were observed under the right support and middle at a
deflection of 0.48 in. (12.2 mm) and load of about 12.8 kips (56.9 kN). Subsequent
cracks propagated vertically inside and outside the maximum moment zone and then
began angling towards the supports. The beam failed due to concrete crushing within the
compression zone at a load of 21.6 kips (96.1 kN) and reached a deflection of 1.9 in.
(48.3 mm) at failure. Negligible end slip was observed on both the NE and NW strands.
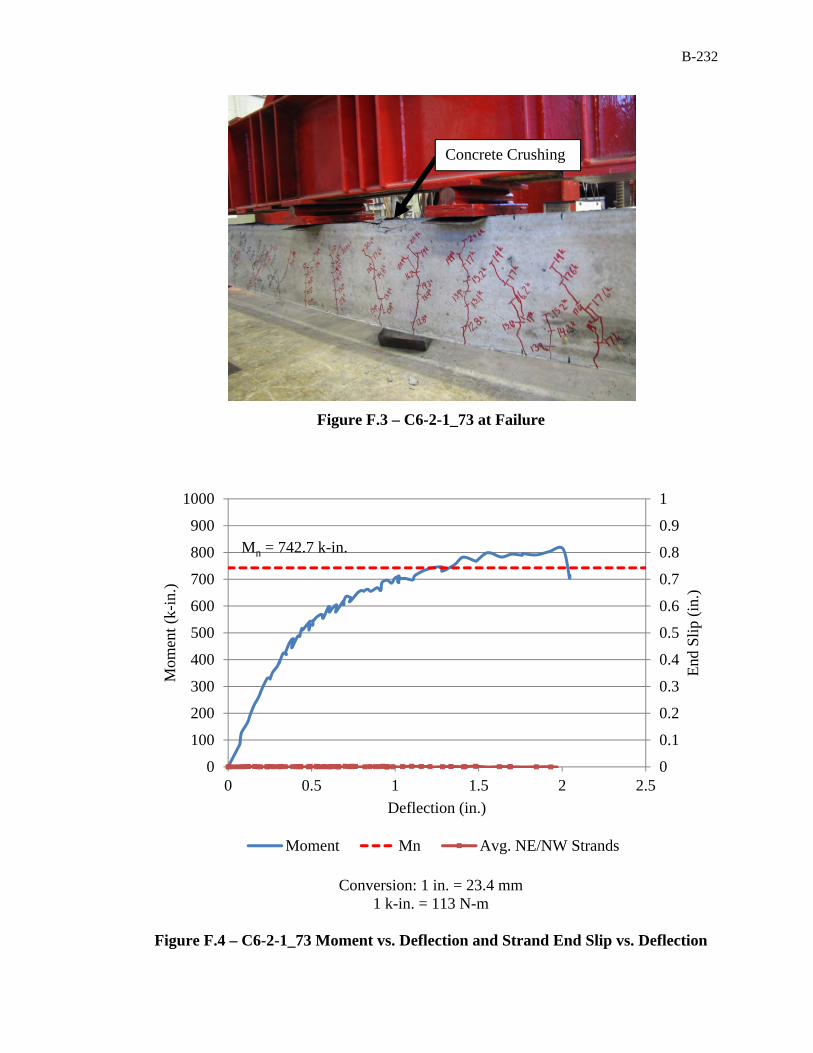
B-232
Figure F.3 – C6-2-1_73 at Failure
Conversion: 1 in. = 23.4 mm 1 k-in. = 113 N-m
Figure F.4 – C6-2-1_73 Moment vs. Deflection and Strand End Slip vs. Deflection
0
0.1
0.2
0.3
0.4
0.5
0.6
0.7
0.8
0.9
1
0
100
200
300
400
500
600
700
800
900
1000
0 0.5 1 1.5 2 2.5
End
Sli
p (i
n.)
Mom
ent (
k-in
.)
Deflection (in.)
Moment Mn Avg. NE/NW Strands
Mn = 742.7 k-in.
Concrete Crushing

B-233
BEAM ID: C6-2-2_58
DATE OF TESTING: 9/12/2011
DAYS AFTER CASTING: 53
Test Summary Embedment Length 58 in. Failure Mode (Flexural or Bond) Flexural Beam End SE/SW Span Length 132 in. Deflection at Failure 1.2 in. Concrete Compressive Strength 5730 psi Maximum Moment Capacity
Expected Actual
742.7 k-in. 836.6 k-in.
Average Transfer Length At Release
At Time of Testing
17.2 in. 24.2 in.
Average 0.1 in. NASP Load for Strand 101Standard NASP (Mix B)
NASP in Concrete (1 Day)
18200 lb 21100 lb
Conversion: 1 in. = 25.4 mm 1 lb = 4.45 N
1 psi = 6.89 kPa
The test was set up as deflection-controlled, and the beam was deflected in
increments of 0.05 in. (1.27 mm) until failure. The deflection increment was increased to
0.05 in. (1.27 mm) from 0.02 in. (0.508 mm) because it was deemed that 0.02 in (0.508
mm). increments was too slow. At each deflection increment, the load was noted and then
the beam was checked for cracks, which were marked with permanent marker.
The first flexural cracks were observed under the supports and middle at a
deflection of 0.25 in. (6.35 mm) and load of about 15.6 kips (69.4 kN). Subsequent
cracks propagated vertically inside and outside the maximum moment zone and then
began angling towards the supports. The beam failed due to concrete crushing within the
compression zone at a load of 28.7 kips (128 kN) and reached a deflection of 1.21 in.
(30.7 mm) at failure. Negligible end slip was observed on both the SE and SW strands.

B-234
Figure F.5 – C6-2-2_58 at Failure
Conversion: 1 in. = 25.4 mm 1 k-in. = 113 N-m
Figure F.6 – C6-2-2_58 Moment vs. Deflection and Strand End Slip vs. Deflection
0
0.1
0.2
0.3
0.4
0.5
0.6
0.7
0.8
0.9
1
0
100
200
300
400
500
600
700
800
900
1000
0 0.5 1 1.5 2
End
Sli
p (i
n.)
Mom
ent (
k-in
.)
Deflection (in.)
Moment Mn Avg. SE/SW Strands
Mn = 742.7 k-in.
Concrete Crushing

B-235
BEAM ID: C6-2-2_73
DATE OF TESTING: 9/13/2011
DAYS AFTER CASTING: 54
Test Summary Embedment Length 73 in. Failure Mode (Flexural or Bond) Flexural Beam End NE/NW Span Length 162 in. Deflection at Failure 1.7 in. Concrete Compressive Strength 5730 psi Maximum Moment Capacity
Expected Actual
742.7 k-in. 837.6 k-in.
Average Transfer Length At Release
At Time of Testing
17.2 in. 24.2 in.
Average 0.1 in. NASP Load for Strand 101Standard NASP (Mix B)
NASP in Concrete (1 Day)
18200 lb 21100 lb
Conversion: 1 in. = 25.4 mm 1 lb = 4.45 N
1 psi = 6.89 kPa
The test was set up as deflection-controlled, and the beam was deflected in
increments of 0.05 in. (1.27 mm) until failure. The deflection increment was increased to
0.05 in. (1.27 mm) from 0.02 in. (0.508 mm) because it was deemed that 0.02 in. (0.508
mm) increments were too slow. At each deflection increment, the load was noted and
then the beam was checked for cracks, which were marked with permanent marker.
The first flexural crack was observed under the right support at a deflection of
0.40 in. (10.2 mm) and load of about 11.9 kips (52.9 kN). Subsequent cracks propagated
vertically inside and outside the maximum moment zone and then began angling towards
the supports. The beam failed due to concrete crushing within the compression zone at a
load of 21.7 kips (96.5 kN) and reached a deflection of 1.73 in. (43.9 mm) at failure.
Negligible end slip was observed on both the NE and NW strands.

B-236
Figure F.7 – C6-2-2_73 at Failure
Conversion: 1 in. = 25.4 mm 1 k-in. = 113 N-m
Figure F.8 – C6-2-2_73 Moment vs. Deflection and Strand End Slip vs. Deflection
0
0.1
0.2
0.3
0.4
0.5
0.6
0.7
0.8
0.9
1
0
100
200
300
400
500
600
700
800
900
1000
0 0.5 1 1.5 2 2.5
En
d S
lip
(in
.)
Mom
ent
(k-i
n.)
Deflection (in.)
Moment Mn Avg. NE/NW Strands
Mn = 742.7 k-in.
Concrete Crushing

B-237
BEAM ID: S6-2-1_58
DATE OF TESTING: 9/14/2011
DAYS AFTER CASTING: 55
Test Summary Embedment Length 58 in. Failure Mode (Flexural or Bond) Flexural Beam End SE/SW Span Length 132 in. Deflection at Failure 1.5 in. Concrete Compressive Strength 6950 psi Maximum Moment Capacity
Expected Actual
757.9 k-in. 867.7 k-in.
Average Transfer Length At Release
At Time of Testing
14.4 in. 19.2 in.
Average 0.1 in. NASP Load for Strand 101Standard NASP (Mix B)
NASP in Concrete (1 Day)
18200 lb 23700 lb
Conversion: 1 in. = 25.4 mm 1 lb = 4.45 N
1 psi = 6.89 kPa
The test was set up as deflection-controlled, and the beam was deflected in
increments of 0.05 in. (1.27 mm) until failure. The deflection increment was increased to
0.05 in. (1.27 mm) from 0.02 in. (0.508 mm) because it was deemed that 0.02 in. (0.508
mm) increments were too slow. At each deflection increment, the load was noted and
then the beam was checked for cracks, which were marked with permanent marker.
The first flexural crack was observed under the right support at a deflection of
0.25 in. (6.35 mm) and load of about 17.1 kips (76.1 kN). Subsequent cracks propagated
vertically inside and outside the maximum moment zone and then began angling towards
the supports. The beam failed due to concrete crushing within the compression zone at a
load of 29.9 kips (133 kN) and reached a deflection of 1.49 in. (37.8 mm) at failure.
Negligible end slip was observed on both the SE and SW strands.

B-238
Figure F.9 – S6-2-1_58 at Failure
Conversion: 1 in. = 25.4 mm 1 k-in. = 113 N-m
Figure F.10 – S6-2-1_58 Moment vs. Deflection and Strand End Slip vs. Deflection
0
0.1
0.2
0.3
0.4
0.5
0.6
0.7
0.8
0.9
1
0
100
200
300
400
500
600
700
800
900
1000
0 0.5 1 1.5 2
End
Sli
p (i
n.)
Mom
ent (
k-in
.)
Deflection (in.)
Moment Mn Avg. SE/SW Strands
Mn = 757.9 k-in.
Concrete Crushing

B-239
BEAM ID: S6-2-1_73
DATE OF TESTING: 9/14/2011
DAYS AFTER CASTING: 55
Test Summary Embedment Length 73 in. Failure Mode (Flexural or Bond) Flexural Beam End NE/NW Span Length 162 in. Deflection at Failure 2.2 in. Concrete Compressive Strength 6950 psi Maximum Moment Capacity
Expected Actual
757.9 k-in. 878.4 k-in.
Average Transfer Length At Release
At Time of Testing
14.4 in. 19.2 in.
Average 0.1 in. NASP Load for Strand 101Standard NASP (Mix B)
NASP in Concrete (1 Day)
18200 lb 23700 lb
Conversion: 1 in. = 25.4 mm 1 lb = 4.45 N
1 psi = 6.89 kPa
The test was set up as deflection-controlled, and the beam was deflected in
increments of 0.05 in. (1.27 mm) until failure. The deflection increment was increased to
0.05 in. (1.27 mm) from 0.02 in. (0.508 mm) because it was deemed that 0.02 in. (0.508
mm) increments were too slow. At each deflection increment, the load was noted and
then the beam was checked for cracks, which were marked with permanent marker.
The first flexural crack was observed under the midspan and right support at a
deflection of 0.45 in. (11.4 mm) and load of about 12.1 kips (53.8 kN). Subsequent
cracks propagated vertically inside and outside the maximum moment zone and then
began angling towards the supports. Horizontal cracks near midspan at the level of
prestressing strand were noted at a deflection of 1.30 in. (33.0 mm) and a load of 19.8
kips (88.1 kN). The beam failed due to concrete crushing within the compression zone at
a load of 22.9 kips (102 kN) and reached a deflection of 2.20 in. (55.9 mm) at failure.
Negligible end slip was observed on both the NE and NW strands.

B-240
Figure F.11 – S6-2-1_73 at Failure
Conversion: 1 in. = 25.4 mm 1 k-in. = 113 N-m
Figure F.12 – S6-2-1_73 Moment vs. Deflection and Strand End Slip vs. Deflection
0
0.1
0.2
0.3
0.4
0.5
0.6
0.7
0.8
0.9
1
0
100
200
300
400
500
600
700
800
900
1000
0 0.5 1 1.5 2 2.5
End
Sli
p (i
n.)
Mom
ent (
k-in
.)
Deflection (in.)
Mn Moment Avg. NE/NW Strands
Mn = 757.9 k-in.
Concrete Crushing

B-241
BEAM ID: S6-2-2_58
DATE OF TESTING: 9/9/2011
DAYS AFTER CASTING: 50
Test Summary Embedment Length 58 in. Failure Mode (Flexural or Bond) Flexural Beam End SE/SW Span Length 132 in. Deflection at Failure 1.5 in. Concrete Compressive Strength 6950 psi Maximum Moment Capacity
Expected Actual
757.9 k-in. 889.9 k-in.
Average Transfer Length At Release
At Time of Testing
14.4 in. 19.2 in.
Average 0.1 in. NASP Load for Strand 101Standard NASP (Mix B)
NASP in Concrete (1 Day)
18200 lb 23700 lb
Conversion: 1 in. = 25.4 mm 1 lb = 4.45 N
1 psi = 6.89 kPa
The test was set up as deflection-controlled, and the beam was deflected in
increments of 0.05 in. (1.27 mm) until failure. The deflection increment was increased to
0.05 in. (1.27 mm) from 0.02 in. (0.508 mm) because it was deemed that 0.02 in. (0.508
mm) increments were too slow. At each deflection increment, the load was noted and
then the beam was checked for cracks, which were marked with permanent marker.
The first flexural crack was observed under the right support at a deflection of
0.25 in. (6.35 mm) and load of about 16.3 kips (72.5 kN). Subsequent cracks propagated
vertically inside and outside the maximum moment zone and then began angling towards
the supports. Horizontal cracks near midspan at the level of prestressing strand were
noted at a deflection of 0.75 in. (19.1 mm) and a load of 25.9 kips (115 kN). The beam
failed due to concrete crushing within the compression zone at a load of 30.7 kips (137
kN) and reached a deflection of 1.52 in. (38.6 mm) at failure. Negligible end slip was
observed on both the SE and SW strands.

B-242
Figure F.13 – S6-2-2_58 at Failure
Conversion: 1 in. = 25.4 mm 1 k-in. = 113 N-m
Figure F.14 – S6-2-2_58 Moment vs. Deflection and Strand End Slip vs. Deflection
0
0.1
0.2
0.3
0.4
0.5
0.6
0.7
0.8
0.9
1
0
100
200
300
400
500
600
700
800
900
1000
0 0.5 1 1.5 2
End
Sli
p (i
n.)
Mom
ent (
k-in
.)
Deflection (in.)
Moment Mn Avg. SE/SW Strands
Mn = 757.9 k-in.
Concrete Crushing

B-243
BEAM ID: S6-2-2_73
DATE OF TESTING: 9/9/2011
DAYS AFTER CASTING: 50
Test Summary Embedment Length 73 in. Failure Mode (Flexural or Bond) Flexural Beam End NE/NW Span Length 162 in. Deflection at Failure 1.8 in. Concrete Compressive Strength 6950 psi Maximum Moment Capacity
Expected Actual
757.9 k-in. 843.1 k-in.
Average Transfer Length At Release
At Time of Testing
14.4 in. 19.2 in.
Average 0.1 in. NASP Load for Strand 101Standard NASP (Mix B)
NASP in Concrete (1 Day)
18200 lb 23700 lb
Conversion: 1 in. = 25.4 mm 1 lb = 4.45 N
1 psi = 6.89 kPa
The test was set up as deflection-controlled, and the beam was deflected in
increments of 0.05 in. (1.27 mm) until failure. The deflection increment was increased to
0.05 in. (1.27 mm) from 0.02 in. (0.508 mm) because it was deemed that 0.02 in. (0.508
mm) increments were too slow. At each deflection increment, the load was noted and
then the beam was checked for cracks, which were marked with permanent marker.
The first flexural crack was observed under the left support at a deflection of 0.40
in. (10.2 mm) and load of about 10.8 kips (48.0 kN). Subsequent cracks propagated
vertically inside and outside the maximum moment zone and then began angling towards
the supports. The beam failed due to concrete crushing outside the compression zone at a
load of 21.9 kips (97.4 kN) and reached a deflection of 1.78 in. (45.2 mm) at failure. The
failure occurred in the area that had already failed during the 58 in. (1,473 mm)
embedment length test, however, it was still deemed a flexural failure by concrete
crushing. Negligible end slip was observed on both the NE and NW strands.

B-244
Figure F.15 – S6-2-2_73 at Failure
Conversion: 1 in. = 25.4 mm 1 k-in. = 113 N-m
Figure F.16 – S6-2-2_73 Moment vs. Deflection and Strand End Slip vs. Deflection
0
0.1
0.2
0.3
0.4
0.5
0.6
0.7
0.8
0.9
1
0
100
200
300
400
500
600
700
800
900
1000
0 0.5 1 1.5 2 2.5
End
Sli
p (i
n.)
Mom
ent (
k-in
.)
Deflection (in.)
Moment Mn Avg. NE/NW Strands
Mn = 757.9 k-in.
Concrete Crushing Outside Maximum Moment Zone

B-245
BEAM ID: C10-2-1_58
DATE OF TESTING: 9/15/2011
DAYS AFTER CASTING: 52
Test Summary Embedment Length 58 in. Failure Mode (Flexural or Bond) Flexural Beam End SE/SW Span Length 132 in. Deflection at Failure 1.5 in. Concrete Compressive Strength 8480 psi Maximum Moment Capacity
Expected Actual
773.6 k-in. 880.3 k-in.
Average Transfer Length At Release
At Time of Testing
20.1 in. 23.5 in.
Average 0.1 in. NASP Load for Strand 101Standard NASP (Mix B)
NASP in Concrete (1 Day)
18200 lb 26700 lb
Conversion: 1 in. = 25.4 mm 1 lb = 4.45 N
1 psi = 6.89 kPa
The test was set up as deflection-controlled, and the beam was deflected in
increments of 0.05 in. (1.27 mm) until failure. The deflection increment was increased to
0.05 in. (1.27 mm) from 0.02 in. (0.508 mm) because it was deemed that 0.02 in. (0.508
mm) increments were too slow. At each deflection increment, the load was noted and
then the beam was checked for cracks, which were marked with permanent marker.
The first flexural crack was observed under the midspan and right support at a
deflection of 0.30 in. (7.62 mm) and load of about 17.5 kips (77.8 kN). Subsequent
cracks propagated vertically inside and outside the maximum moment zone and then
began angling towards the supports. Horizontal cracks near midspan at the level of
prestressing strand were noted at a deflection of 0.65 in. (16.5 mm) and a load of 24.8
kips (110 kN). The beam failed due to concrete crushing within the compression zone at a
load of 30.3 kips (135 kN) and reached a deflection of 1.48 in. (37.6 mm) at failure.
Negligible end slip was observed on both the SE and SW strands.
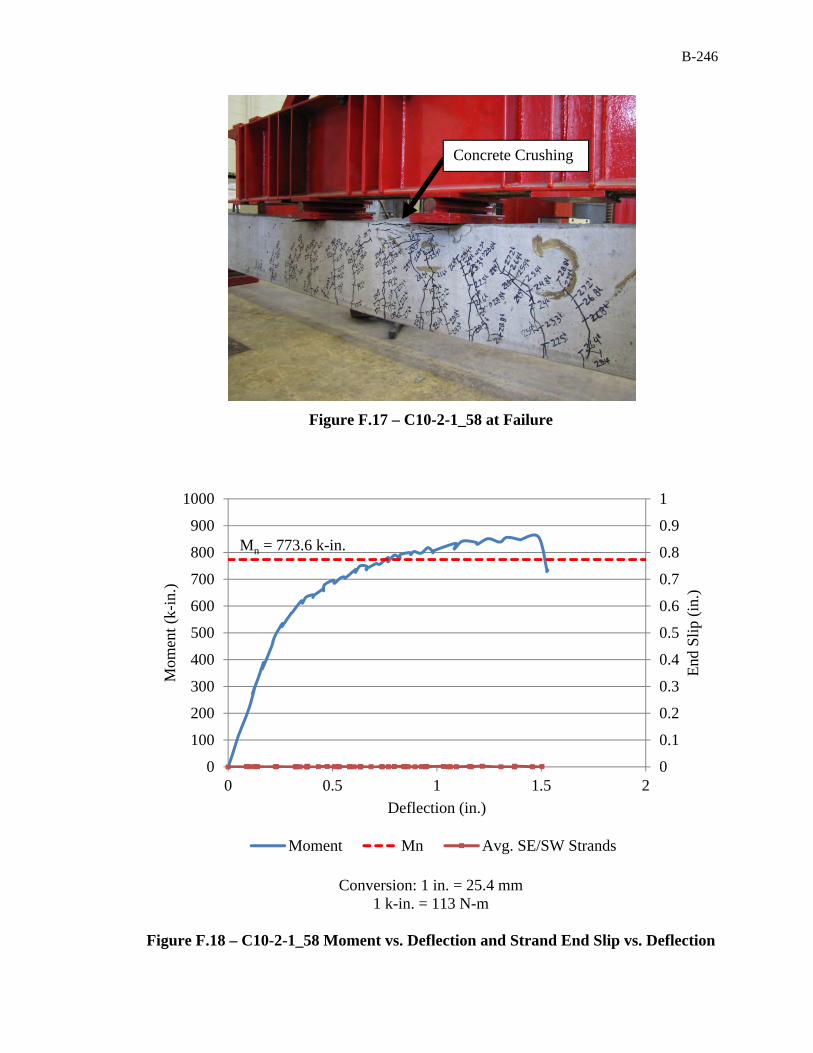
B-246
Figure F.17 – C10-2-1_58 at Failure
Conversion: 1 in. = 25.4 mm 1 k-in. = 113 N-m
Figure F.18 – C10-2-1_58 Moment vs. Deflection and Strand End Slip vs. Deflection
0
0.1
0.2
0.3
0.4
0.5
0.6
0.7
0.8
0.9
1
0
100
200
300
400
500
600
700
800
900
1000
0 0.5 1 1.5 2
End
Sli
p (i
n.)
Mom
ent (
k-in
.)
Deflection (in.)
Moment Mn Avg. SE/SW Strands
Mn = 773.6 k-in.
Concrete Crushing

B-247
BEAM ID: C10-2-1_73
DATE OF TESTING: 9/16/2011
DAYS AFTER CASTING: 53
Test Summary Embedment Length 73 in. Failure Mode (Flexural or Bond) Flexural Beam End NE/NW Span Length 162 in. Deflection at Failure 2.0 in. Concrete Compressive Strength 8480 psi Maximum Moment Capacity
Expected Actual
773.6 k-in. 880.7 k-in.
Average Transfer Length At Release
At Time of Testing
20.1 in. 23.5 in.
Average 0.1 in. NASP Load for Strand 101Standard NASP (Mix B)
NASP in Concrete (1 Day)
18200 lb 26700 lb
Conversion: 1 in. = 25.4 mm 1 lb = 4.45 N
1 psi = 6.89 kPa
The test was set up as deflection-controlled, and the beam was deflected in
increments of 0.05 in. (1.27 mm) until failure. The deflection increment was increased to
0.05 in. (1.27 mm) from 0.02 in. (0.508 mm) because it was deemed that 0.02 in. (0.508
mm) increments were too slow. At each deflection increment, the load was noted and
then the beam was checked for cracks, which were marked with permanent marker.
The first flexural crack was observed under the midspan and right support at a
deflection of 0.40 in. (10.2 mm) and load of about 11.8 kips (52.5 kN). Subsequent
cracks propagated vertically inside and outside the maximum moment zone and then
began angling towards the supports. Horizontal cracks near midspan at the level of
prestressing strand were noted at a deflection of 1.20 in. (30.5 mm) and a load of 19.5
kips (86.7 kN). The beam failed due to concrete crushing within the compression zone at
a load of 23.0 kips (102 kN) and reached a deflection of 1.97 in. (50.0 mm) at failure.
Negligible end slip was observed on both the NE and NW strands.

B-248
Figure F.19 – C10-2-1_73 at Failure
Conversion: 1 in. = 25.4 mm 1 k-in. = 113 N-m
Figure F.20 – C10-2-1_73 Moment vs. Deflection and Strand End Slip vs. Deflection
0
0.1
0.2
0.3
0.4
0.5
0.6
0.7
0.8
0.9
1
0
100
200
300
400
500
600
700
800
900
1000
0 0.5 1 1.5 2 2.5
End
Sli
p (i
n.)
Mom
ent (
k-in
.)
Deflection (in.)
Moment Mn Avg. NE/NW Strands
Mn = 773.6 k-in.
Concrete Crushing

B-249
BEAM ID: C10-2-2_58
DATE OF TESTING: 9/16/2011
DAYS AFTER CASTING: 53
Test Summary Embedment Length 58 in. Failure Mode (Flexural or Bond) Flexural Beam End SE/SW Span Length 132 in. Deflection at Failure 1.5 in. Concrete Compressive Strength 8480 psi Maximum Moment Capacity
Expected Actual
875.3 k-in. 813.6 k-in.
Average Transfer Length At Release
At Time of Testing
20.1 in. 23.5 in.
Average 0.1 in. NASP Load for Strand 101Standard NASP (Mix B)
NASP in Concrete (1 Day)
18200 lb 26700 lb
Conversion: 1 in. = 25.4 mm 1 lb = 4.45 N
1 psi = 6.89 kPa
The test was set up as deflection-controlled, and the beam was deflected in
increments of 0.05 in. (1.27 mm) until failure. The deflection increment was increased to
0.05 in. (1.27 mm) from 0.02 in. (0.508 mm) because it was deemed that 0.02 in. (0.508
mm) increments were too slow. At each deflection increment, the load was noted and
then the beam was checked for cracks, which were marked with permanent marker.
The first flexural crack was observed under midspan at a deflection of 0.25 in.
(6.35 mm) and load of about 15.0 kips (66.7 kN). Subsequent cracks propagated
vertically inside and outside the maximum moment zone and then began angling towards
the supports. Horizontal cracks near midspan at the level of prestressing strand were
noted at a deflection of 0.85 in. (21.6 mm) and a load of 26.5 kips (118 kN). The beam
failed due to concrete crushing within the compression zone at a load of 30.1 kips (134
kN) and reached a deflection of 1.51 in. (38.4 mm) at failure. Negligible end slip was
observed on both the SE and SW strands.

B-250
Figure F.21 – C10-2-2_58 at Failure
Conversion: 1 in. = 25.4 mm 1 k-in. = 113 N-m
Figure F.22 – C10-2-2_58 Moment vs. Deflection and Strand End Slip vs. Deflection
0
0.1
0.2
0.3
0.4
0.5
0.6
0.7
0.8
0.9
1
0
100
200
300
400
500
600
700
800
900
1000
0 0.5 1 1.5 2
End
Sli
p (i
n.)
Mom
ent (
k-in
.)
Deflection (in.)
Moment Mn Avg. SE/SW Strands
Mn = 773.6 k-in.
Concrete Crushing

B-251
BEAM ID: C10-2-2_73
DATE OF TESTING: 9/16/2011
DAYS AFTER CASTING: 53
Test Summary Embedment Length 73 in. Failure Mode (Flexural or Bond) Flexural Beam End NE/NW Span Length 162 in. Deflection at Failure 2.0 in. Concrete Compressive Strength 8480 psi Maximum Moment Capacity
Expected Actual
773.6 k-in. 885.8 k-in.
Average Transfer Length At Release
At Time of Testing
20.1 in. 23.5 in.
Average 0.1 in. NASP Load for Strand 101Standard NASP(Mix B)
NASP in Concrete (1 Day)
18200 lb 26700 lb
Conversion: 1 in. = 25.4 mm 1 lb = 4.45 N
1 psi = 6.89 kPa
The test was set up as deflection-controlled, and the beam was deflected in
increments of 0.05 in. (1.27 mm) until failure. The deflection increment was increased to
0.05 in. (1.27 mm) from 0.02 in. (0.508 mm) because it was deemed that 0.02 in. (0.508
mm) increments were too slow. At each deflection increment, the load was noted and
then the beam was checked for cracks, which were marked with permanent marker.
The first flexural crack was observed under the midspan at a deflection of 0.45 in.
(11.4 mm) and load of about 11.7 kips (52.0 kN). Subsequent cracks propagated
vertically inside and outside the maximum moment zone and then began angling towards
the supports. Horizontal cracks near midspan at the level of prestressing strand were
noted at a deflection of 1.20 in. (30.5 mm) and a load of 18.8 kips (83.6 kN). The beam
failed due to concrete crushing within the compression zone at a load of 23.1 kips (103
kN) and reached a deflection of 1.97 in. (50.0 mm) at failure. Negligible end slip was
observed on both the NE and NW strands.

B-252
Figure F.23 – C10-2-2_73 at Failure
Conversion: 1 in. = 25.4 mm 1 k-in. = 113 N-m
Figure F.24 – C10-2-2_73 Moment vs. Deflection and Strand End Slip vs. Deflection
0
0.1
0.2
0.3
0.4
0.5
0.6
0.7
0.8
0.9
1
0
100
200
300
400
500
600
700
800
900
1000
0 0.5 1 1.5 2 2.5
End
Sli
p (i
n.)
Mom
ent (
k-in
.)
Deflection (in.)
Moment Mn Avg. NE/NW Strand
Mn = 773.6 k-in.
Concrete Crushing
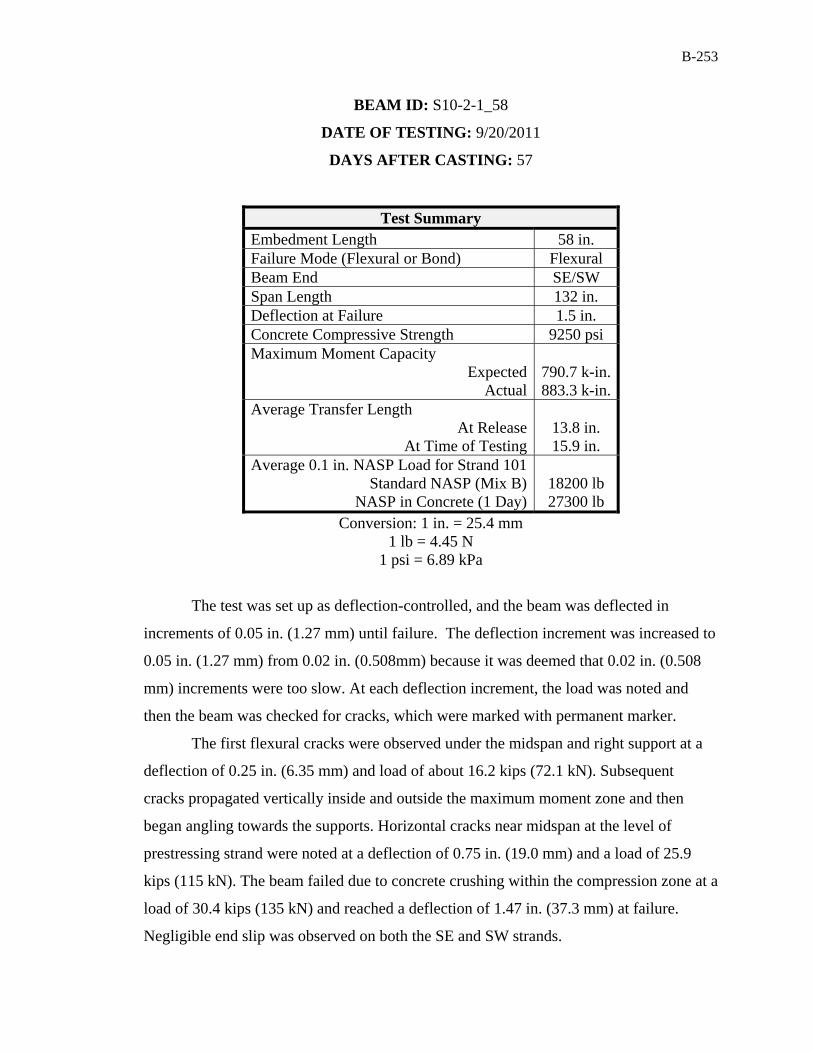
B-253
BEAM ID: S10-2-1_58
DATE OF TESTING: 9/20/2011
DAYS AFTER CASTING: 57
Test Summary Embedment Length 58 in. Failure Mode (Flexural or Bond) Flexural Beam End SE/SW Span Length 132 in. Deflection at Failure 1.5 in. Concrete Compressive Strength 9250 psi Maximum Moment Capacity
Expected Actual
790.7 k-in. 883.3 k-in.
Average Transfer Length At Release
At Time of Testing
13.8 in. 15.9 in.
Average 0.1 in. NASP Load for Strand 101Standard NASP (Mix B)
NASP in Concrete (1 Day)
18200 lb 27300 lb
Conversion: 1 in. = 25.4 mm 1 lb = 4.45 N
1 psi = 6.89 kPa
The test was set up as deflection-controlled, and the beam was deflected in
increments of 0.05 in. (1.27 mm) until failure. The deflection increment was increased to
0.05 in. (1.27 mm) from 0.02 in. (0.508mm) because it was deemed that 0.02 in. (0.508
mm) increments were too slow. At each deflection increment, the load was noted and
then the beam was checked for cracks, which were marked with permanent marker.
The first flexural cracks were observed under the midspan and right support at a
deflection of 0.25 in. (6.35 mm) and load of about 16.2 kips (72.1 kN). Subsequent
cracks propagated vertically inside and outside the maximum moment zone and then
began angling towards the supports. Horizontal cracks near midspan at the level of
prestressing strand were noted at a deflection of 0.75 in. (19.0 mm) and a load of 25.9
kips (115 kN). The beam failed due to concrete crushing within the compression zone at a
load of 30.4 kips (135 kN) and reached a deflection of 1.47 in. (37.3 mm) at failure.
Negligible end slip was observed on both the SE and SW strands.

B-254
Figure F.25 – S10-2-1_58 at Failure
Conversion: 1 in. = 25.4 mm 1 k-in. = 113 N-m
Figure F.26 – S10-2-1_58 Moment vs. Deflection and Strand End Slip vs. Deflection
0
0.1
0.2
0.3
0.4
0.5
0.6
0.7
0.8
0.9
1
0
100
200
300
400
500
600
700
800
900
1000
0 0.5 1 1.5 2
End
Sli
p (i
n.)
Mom
ent (
k-in
.)
Deflection (in.)
Moment Mn Avg. SE/SW Strands
Mn = 790.7 k-in.
Concrete Crushing

B-255
BEAM ID: S10-2-1_73
DATE OF TESTING: 9/21/2011
DAYS AFTER CASTING: 58
Test Summary Embedment Length 73 in. Failure Mode (Flexural or Bond) Flexural Beam End NE/NW Span Length 162 in. Deflection at Failure 2.3 in. Concrete Compressive Strength 9250 psi Maximum Moment Capacity
Expected Actual
790.7 k-in. 904.2 k-in.
Average Transfer Length At Release
At Time of Testing
13.8 in. 15.9 in.
Average 0.1 in. NASP Load for Strand 101Standard NASP (Mix B)
NASP in Concrete (1 Day)
18200 lb 27300 lb
Conversion: 1 in. = 25.4 mm 1 lb = 4.45 N
1 psi = 6.89 kPa
The test was set up as deflection-controlled, and the beam was deflected in
increments of 0.05 in. (1.27 mm) until failure. The deflection increment was increased to
0.05 in. (1.27 mm) from 0.02 in. (0.508 mm) because it was deemed that 0.02 in. (0.508
mm) increments were too slow. At each deflection increment, the load was noted and
then the beam was checked for cracks, which were marked with permanent marker.
The first flexural crack was observed under the midspan at a deflection of 0.40 in.
(10.2 mm) and load of about 12.5 kips (55.6 kN). Subsequent cracks propagated
vertically inside and outside the maximum moment zone and then began angling towards
the supports. Horizontal cracks near midspan at the level of prestressing strand were
noted at a deflection of 1.00 in. (25.4 mm) and a load of 18.7 kips (83.2 kN). The beam
failed due to concrete crushing within the compression zone at a load of 23.6 kips (105
kN) and reached a deflection of 2.29 in. (58.2 mm) at failure. Negligible end slip was
observed on both the NE and NW strands.

B-256
Figure F.27 – S10-2-1_73 at Failure
Conversion: 1 in. = 25.4 mm 1 k-in. = 113 N-m
Figure F.28 – S10-2-1_73 Moment vs. Deflection and Strand End Slip vs. Deflection
0
0.1
0.2
0.3
0.4
0.5
0.6
0.7
0.8
0.9
1
0
100
200
300
400
500
600
700
800
900
1000
0 0.5 1 1.5 2 2.5
End
Sli
p (i
n.)
Mom
ent (
k-in
.)
Deflection (in.)
Moment Mn Avg. NE/NW Strands
Mn = 790.7 k-in.
Concrete Crushing

B-257
BEAM ID: S10-2-2_58
DATE OF TESTING: 9/21/2011
DAYS AFTER CASTING: 58
Test Summary Embedment Length 58 in. Failure Mode (Flexural or Bond) Flexural Beam End SE/SW Span Length 132 in. Deflection at Failure 1.2 in. Concrete Compressive Strength 9250 psi Maximum Moment Capacity
Expected Actual
790.7 k-in. 901.2 k-in.
Average Transfer Length At Release
At Time of Testing
13.8 in. 15.9 in.
Average 0.1 in. NASP Load for Strand 101Standard NASP (Mix B)
NASP in Concrete (1 Day)
18200 lb 27300 lb
Conversion: 1 in. = 25.4 mm 1 lb = 4.45 N
1 psi = 6.89 kPa
The test was set up as deflection-controlled, and the beam was deflected in
increments of 0.05 in. (1.27 mm) until failure. The deflection increment was increased to
0.05 in. (1.27 mm) from 0.02 in. (0.508 mm) because it was deemed that 0.02 in. (0.508
mm) increments were too slow. At each deflection increment, the load was noted and
then the beam was checked for cracks, which were marked with permanent marker.
The first flexural cracks were observed under the midspan and both supports at a
deflection of 0.35 in. (8.89 mm) and load of about 18.2 kips (81.0 kN). Subsequent
cracks propagated vertically inside and outside the maximum moment zone and then
began angling towards the supports. Horizontal cracks near midspan at the level of
prestressing strand were noted at a deflection of 0.80 in. (20.3 mm) and a load of 26.3
kips (117 kN). The beam failed due to concrete crushing within the compression zone at a
load of 31.1 kips (138 kN) and reached a deflection of 1.20 in. (30.5 mm) at failure.
Negligible end slip was observed on both the SE and SW strands.

B-258
Figure F.29 – S10-2-2_58 at Failure
Conversion: 1 in. = 25.4 mm 1 k-in. = 113 N-m
Figure F.30 – S10-2-2_58 Moment vs. Deflection and Strand End Slip vs. Deflection
0
0.1
0.2
0.3
0.4
0.5
0.6
0.7
0.8
0.9
1
0
100
200
300
400
500
600
700
800
900
1000
0 0.5 1 1.5 2
End
Sli
p (i
n.)
Mom
ent (
k-in
.)
Deflection (in.)
Moment Mn Avg. SE/SW Strands
Mn = 790.7 k-in.
Concrete Crushing

B-259
BEAM ID: S10-2-2_73
DATE: 9/22/2011
DAYS AFTER CASTING: 59
Test Summary Embedment Length 73 in. Failure Mode (Flexural or Bond) Flexural Beam End NE/NW Span Length 162 in. Deflection at Failure 2.0 in. Concrete Compressive Strength 9250 psi Maximum Moment Capacity
Expected Actual
790.7 k-in. 871.7 k-in.
Average Transfer Length At Release
At Time of Testing
13.8 in. 15.9 in.
Average 0.1 in. NASP Load for Strand 101Standard NASP (Mix B)
NASP in Concrete (1 Day)
18200 lb 27300 lb
Conversion: 1 in. = 25.4 mm 1 lb = 4.45 N
1 psi = 6.89 kPa
The test was set up as deflection-controlled, and the beam was deflected in
increments of 0.05 in. (1.27 mm) until failure. The deflection increment was increased to
0.05 in. (1.27 mm) from 0.02 in. (0.508 mm) because it was deemed that 0.02 in. (0.508
mm) increments were too slow. At each deflection increment, the load was noted and
then the beam was checked for cracks, which were marked with permanent marker.
The first flexural crack was observed under the midspan at a deflection of 0.40 in.
(10.2 mm) and load of about 12.8 kips (56.9 kN). Subsequent cracks propagated
vertically inside and outside the maximum moment zone and then began angling towards
the supports. Horizontal cracks near midspan at the level of prestressing strand were
noted at a deflection of 0.65 in. (16.5 mm) and a load of 16.2 kips (72.1 kN). The beam
failed due to concrete crushing within the compression zone at a load of 22.7 kips (101
kN) and reached a deflection of 1.97 in. (50.0 mm) at failure. Negligible end slip was
observed on both the NE and NW strands.

B-260
Figure F.31 – S10-2-2_73 at Failure
Conversion: 1 in. = 25. 4 mm 1 k-in. = 113 N-m
Figure F.32 – S10-2-2_73 Moment vs. Deflection and Strand End Slip vs. Deflection
0
0.1
0.2
0.3
0.4
0.5
0.6
0.7
0.8
0.9
1
0
100
200
300
400
500
600
700
800
900
1000
0 0.5 1 1.5 2 2.5
End
Sli
p (i
n.)
Mom
ent (
k-in
.)
Deflection (in.)
Moment Mn Avg. NE/NW Strands
Mn = 790.7 k-in.
Concrete Crushing

B-261
BIBLIOGRAPHY
AASHTO (2008). AASHTO LRFD Bridge Design Specifications: Customary U.S. Units. 4th ed. Washington D.C.: American Association of State Highway Transportation Officials (AASHTO).
ACI 318 (2011). “Building Code Requirements for Structural Concrete (ACI 318-11) and Commentary (ACI 318R-11).” Farmington Hills, Michigan: American Concrete Institute (ACI).
Anderson, A. R. and Anderson, R. G. (1976). An Assurance Criterion for Flexural Bond in Pretensioned Hollow Core Units.” ACI Journal, 73 (8), 457-464.
ASTM A 370 (2011). “Standard Test Methods and Definitions for Mechanical Testing of Steel Products.” American Society of Testing and Materials, West Conshohocken, PA.
ASTM A 416 (2010). “Standard Specification for Steel Strand, Uncoated Seven-Wire for Prestressed Concrete.” American Society of Testing and Materials, West Conshohocken, PA.
ASTM A 1061 (2009). “Standard Test Methods for Testing Multi-Wire Steel Strand.” American Society of Testing and Materials, West Conshohocken, PA.
ASTM C 33 (2011). “Standard Specification for Concrete Aggregates.” American Society of Testing and Materials, West Conshohocken, PA.
ASTM C 39 (2011). “Standard Test Method for Compressive Strength of Cylindrical Concrete Specimens.” American Society of Testing and Materials, West Conshohocken, PA.
ASTM C 109 (2011). “Standard Test Method for Compressive Strength of Hydraulic Cement Mortars (Using 2-in. or [50 mm] Cube Specimens).” American Society of Testing and Materials, West Conshohocken, PA.
ASTM C 138 (2010). “Standard Test Method for Density (Unit Weight), Yield, and Air Content (Gravimetric) of Concrete.” American Society of Testing and Materials, West Conshohocken, PA.
ASTM C 143 (2010). “Standard Test Method for Slump of Hydraulic Cement Concrete.” American Society of Testing and Materials, West Conshohocken, PA.
ASTM C 192 (2007). “Standard Practice for Making and Curing Concrete Test Specimens in the Laboratory.” American Society of Testing and Materials, West Conshohocken, PA.

B-262
ASTM C 231 (2010). “Standard Test Method for Air Content of Freshly Mixed Concrete by the Pressure Method.” American Society of Testing and Materials, West Conshohocken, PA.
ASTM C 469 (2010). “Standard Test Method for Static Modulus of Elasticity and Poisson’s Ratio of Concrete in Compression.” American Society of Testing and Materials, West Conshohocken, PA.
ASTM C 1437 (2007). “Standard Test Method for Flow of Hydraulic Cement Mortar.” American Society of Testing and Materials, West Conshohocken, PA.
ASTM C 1611 (2009). “Standard Test Method for Slump Flow of Self-Consolidating Concrete.” American Society of Testing and Materials, West Conshohocken, PA.
ASTM C 1621 (2009). “Standard Test Method for Passing Ability of Self-Consolidating Concrete by J-Ring.” American Society of Testing and Materials, West Conshohocken, PA.
Barnes, R. W., Grove, J. W., and Burns, N. H. (2003). “Experimental Assessment of Factors Affecting Transfer Length.” ACI Structural Journal, 100 (6), 740-748.
Boehm, K. M., Barnes, R. W., and Schindler, A. K. (2010). Performance of Self-Consolidating Concrete in Prestressed Girders. Auburn University, AL: Highway Research Center and Department of Civil Engineering at Auburn University.
Buckner, C. D. (1995). “A Review of Strand Development Length of Pretensioned Concrete Members.” PCI Journal, 40 (2), 84-105.
Burgueño, R. and Haq, M. (2007). “Effect of SCC Mixture Proportioning on Transfer and Development Length of Prestressing Strand.” ACI Special Publication, 247, 105-116.
Cousins, T. E., Johnston, D. W., and Zia, P. (1990). “Transfer Length of Epoxy-Coated Prestressing Strand.” ACI Materials Journal, 87 (3), 193-203.
Floyd, R. W., Ruiz, E. D., Do, N. H., Staton, B. W., and Hale, W. M. (2011). “Development Lengths of High-Strength Self-Consolidating Concrete Beams.” PCI Journal, 56 (1), 36-53.
Girgis, A. F. M. and Tuan, C. Y. (2005). “Bond Strength and Transfer Length of Pretensioned Bridge Girders Cast with Self-Consolidating Concrete.” PCI Journal, 50 (6), 72-87.
Hawkins, N. M. and Ramirez, J. A. (2010). Due Diligence Review of NASP Strand Bond Test Method. Champaign, IL: University of Illinois at Urbana-Champaign, and West Lafayette, IN: Purdue University.

B-263
Janney, J. R. (1954). “Nature of Bond in Pre-Tensioned Prestressed Concrete.” Journal of the American Concrete Institute, 25 (9), 717-736.
Kaar, P. H., LaFraugh, R. W., and Mass, M. A. (1963). “Influence of Concrete Strength on Strand Transfer Length.” PCI Journal, 8 (5), 47-67.
Lane, S.N. (1998). A New Development Length Equation for Pretensioned Strands in Bridge Beams and Piles. McLean, Virginia: Federal Highway Administration (FHWA).
Larson, K. H., Peterman, R. J., and Esmaeily, A. (2007). “Bond Characteristics of Self-Consolidating Concrete for Prestressed Bridge Girders.” PCI Journal, 52 (4), 44-57.
Levy, K. (2007). “Bond Behavior of Prestressed Reinforcement in Beams Constructed with Self-Consolidating Concrete.” M.S. Report, Auburn University, Auburn, AL.
Logan, D. R. (1997). “Acceptance Criteria for Bond Quality of Strand for Pretensioned Prestressed Concrete Applications.” PCI Journal, 42 (2), 52-90.
Mitchell, D., Cook, W. D., Khan, A. A., and Tham, T. (1993). “Influence of High Strength Concrete on Transfer and Development Length of Pretensioning Strand.” PCI Journal, 38 (3), 52-66.
Peterman, R. J. (2007). “The Effects of As-Cast Depth and Concrete Fluidity on Strand Bond.” PCI Journal, 52 (3), 72-101.
Petrou, M. F., Wan, B., Joiner, W. S., Trezos, C. G., and Harries, K. A. (2000). “Excessive Strand End Slip in Prestressed Piles.” ACI Structural Journal, 97 (5), 774-782.
Pozolo, A. M. and Andrawes, B. (2011). “Transfer Length in Prestressed Self-Consolidating Concrete Box and I-Girders.” ACI Structural Journal, 108 (3), 341-349.
Precast/Prestressed Concrete Institute (PCI). (2003). Interim Guidelines for the Use of Self-Consolidating Concrete in Precast/Prestressed Concrete Institute Member Plants. 1st. Ed. Chicago, IL: Precast/Prestressed Concrete Institute (PCI).
Ramirez, J. A. and Russell, B. W. (2008). Transfer, Development, and Splice Length for Strand/Reinforcement in High-Strength Concrete. Washington D.C.: Transportation Research Board.
Rose, D. R. and Russell, B. W. (1997). “Investigation of Standardized Tests to Measure the Bond Performance of Prestressing Strand.” PCI Journal, 42 (4), 56-80.
Russell, B.W. (2006). Final Report NASP Round IV Strand Bond Testing. Stillwater, OK: Oklahoma State University.

B-264
Russell, B.W. and Burns, N.H. (1993). Design Guidelines for Transfer, Development and Debonding of Large Diameter Seven Wire Strands in Pretensioned Concrete Girders. Austin, TX: Center for Transportation Research at the University of Texas at Austin.
Russell, B. W. and Burns, N. H. (1997). “Measurement of Transfer Lengths in Pretensioned Concrete Elements.” Journal of Structural Engineering, 123 (5), 541-549.
Russell, B. W. and Paulsgrove, G. A. (1999a). NASP Strand Bond Testing Round One Pull-out Tests and Friction Bond Tests of Untensioned Strand. Norman, OK: Fears Structural Engineering Laboratory at the University of Oklahoma.
Russell, B. W. and Paulsgrove, G. A. (1999b). NASP Strand Bond Testing Round Two Assessing Repeatability and Reproducibility of the Moustafa Test, the PTI Bond Test, and the NASP Bond Test. Norman, OK: Fears Structural Engineering Laboratory at the University of Oklahoma.
Shahawy, M. (2001). “A Critical Evaluation of the AASHTO Provisions for Strand Development Length of Prestressed Concrete Members.” PCI Journal, 46 (4), 94-117.
Staton, B. W., Do, N. H., Ruiz, E. D., and Hale, W. M. (2009). “Transfer Lengths of Prestressed Beams Cast with Self-Consolidating Concrete.” PCI Journal, 54 (2), 64-83.
Tabatabai, H. and Dickson, T. J. (1993). “The History of the Prestressing Strand Development Length Equation.” PCI Journal, 38 (6), 64-75.
Wan, B., Petrou, M. F., Harries, K. A., and Hussein, A. A. (2002). “Top Bar Effects in Prestressed Concrete Piles.” ACI Structural Journal, 99 (2), 208-214.