for local roof tiles development of...
TRANSCRIPT

DEVELOPMENT OF ENGOBE COMPOSITIONS
FOR LOCAL ROOF TILES
A Thesis Submitted to the
Graduate School of Engineering and Sciences of
Izmir Institute of Technology
In Partial Fullfilment of the Requirements for the Degree of
MASTER OF SCIENCE
in Mechanical Engineering
by
Hilal BODUR
June 2010
İZMİR
We approve the thesis of Hilal BODUR
Prof. Dr. Sedat AKKURT
Supervisor
Prof. Dr. Mustafa GÜDEN
Committee Member
Prof. Dr. Muhsin ÇİFTÇİOĞLU Committee Member
24 June 2010
Prof. Dr. Metin TANOĞLU Assoc. Prof. Dr. Talat YALÇIN Head of the Department of Dean of the Graduate School of
Mechanical Engineering Engineering and Sciences

ACKNOWLEDGEMENTS
I am greatly indebted to my supervisor Prof. Sedat Akkurt for his guidance,
support and liberality in sharing his experience.
Besides my supervisor, I have to thanks Deniz Şimşek, the staff of Center of
Materials Research and İZTECH workshop for their helps to complete this thesis. I am
also bound to Mücahit Sütçü, Erdem Şahin and Selçuk Özcan who showed me different
ways to cope with any problems I came across during this research.
In addition, I would like to thank Mr.Kadir Başoğlu and Yüksel Toprak A.Ş. for
providing roof tile samples that were used in this thesis.
Finally I want to express my gratitude to my parents whose support and
encouragement helped me to accomplish all difficulties during my work.
iv
ABSTRACT
DEVELOPMENT OF ENGOBE COMPOSITIONS FOR LOCAL ROOF
TILES
Engobes can be described as a coating layer on ceramic surfaces to produce the
desired color. In this thesis a commercial roof tile, which was taken from a company,
was used. For good fitting between the engobe and the roof tile their coefficients of
thermal expansion (CTE) should be almost the same. One way of adjusting the CTE
values, the chemical analysis of the roof tile was analyzed and based on these different
engobe recipes with high purity raw materials and frit that was made in the laboratory
with high purity raw material were prepared. The roof tiles were rich in SiO2, Al2O3,
(Na+K)2O. Therefore, by changing the percentage of these oxides new engobe recipes
were prepared to find the most suitable composition for roof tiles. After application on
surfaces of roof tiles, the samples were fired at 1000oC for 75 min. 70% SiO2, 20%
Al2O3, 10% (Na+K)2O with 10% laboratory frit and 70% SiO2, 20% Al2O3, 10%
(Na+K)2O with 30% laboratory frit were found to be two of the most proper engobe
compositions for the roof tile. Later these engobe recipes were prepared with lower
purity industrial grade raw materials and industrial frit because the cost of producing frit
is high for a roof tile manufacturer. The low purity engobes were applied successfully
on the surface. However, lower purity raw materials containing little Fe and Ti led to a
slightly darker color compared to higher purity engobes. The life cycle of the products
were tested with different kinds of acids and temperature tests. And the results showed
that the engobe samples were durable against the environmental effects. Finally, metal
oxides were used up to 5% in the engobe compositions to give different colors to the
roof tiles.

v
ÖZET
YEREL KİREMİTLER İÇİN ENGOB KOMPOSİZYONLARININ
GELİŞTİRİLMESİ
Son günlerde inşaat sektörünün gelişmesi ile renkli kiremitler kullanılmaya
başlanmıştır. Doğal kil esaslı hammaddeleri kullanan ticari bir üreticiden alınan yarı
mamül kiremitlere uygun ve düşük maliyetli engob kompozisyonları bu çalışmada
geliştirilmiştir. Kiremite en uygun engob komposizyonunun hazırlanması için kiremit
bünyesi analiz edilmiştir. Engob ile bünyenin ısıl genleşmelerinin benzer olması
amacıyla uygun engob reçeteleri geliştirilmiştir. Kimyasal olarak benzeyen bu iki
malzemenin pişirme esnasında benzer davranışlara sahip olması engob - yüzey
etkileşimleri sırasında hataların oluşmaması için önemlidir. Bu çalışmada engob
uygulanacak kiremitin XRD ile analizleri yapıldıktan sonra yüksek saflıktaki
malzemeler kullanılarak engob komposizyonları oluşturulmuştur. Analizlere göre
kiremitlerin yapılarında bol miktarda silika, alümina, sodyum oksit ve potasyum oksit
içerdikleri saptanmıştır. Bu doğrultuda engob numunelerinin SiO2, Al2O3, (Na+K)2O
oranları değiştirilerek en etkili kompozisyon bulunmaya çalışılmıştır. Yüksek saflıktaki
malzemelerden ve özel olarak laboratuarda üretilen yüksek saflıktaki frit ile yapılmış en
uygun engobun başarıyla kiremit yüzeyine kaplanmasının ardından düşük saflıktaki ve
endüstriyel frit ile benzer engob kompozisyonları hazırlanmıştır. Hazırlanan yeni engob
kompozisyonlarıyla da başarıya ulaşılmış ve değişik asit baz gibi kimyasal malzemelere
maruz bırakılarak performans deneyleri yapılarak bunlardan da olumlu sonuçlar
alınmıştır. Hazırlanan engob reçetesine farklı miktarda renklendiriciler katılarak
renklendirilmesi sağlanmıştır. İstenilen renkler renklendirici oranları değiştirilerek elde
edilebilmektedir.
vi
TABLE OF CONTENTS
LIST OF FIGURES ....................................................................................................viii
LIST OF TABLES ...................................................................................................... xii
CHAPTER 1. INTRODUCTION .................................................................................. 1
CHAPTER 2. ENGOBE AND ROOF TILES ................................................................ 3
2.1. Roof Tile .............................................................................................. 3
2.2. Engobe ................................................................................................. 5
2.3. Properties for Matching Engobe and Roof Tile ..................................... 6
2.3.1. Thermal Expansion ........................................................................ 6
2.3.2. Particle Size Distribution ................................................................ 8
2.3.3. Viscosity......................................................................................... 9
2.4. Oxides ................................................................................................ 10
2.5. Colorant (Metal oxides) ...................................................................... 12
2.6. Application Methods .......................................................................... 13
2.7. Defects ............................................................................................... 15
CHAPTER 3. EXPERIMENTAL ................................................................................ 17
3.1. Raw Materials .................................................................................... 17
3.1.1. Roof Tile Body ............................................................................. 17
3.1.2. Engobe ......................................................................................... 18
3.2. Method .............................................................................................. 20
3.2.1. Drying and Firing ......................................................................... 31
3.2.2. Characterization ............................................................................ 32
CHAPTER 4. RESULTS AND DISCUSSION ............................................................ 35
4.1. Roof Tile ............................................................................................ 35
4.2. Characterization of the Raw Materials Used in Engobe....................... 38
4.3. Results of Studies with Engobe........................................................... 47

vii
4.3.1. Development of Engobe by Using Higher Purity Chemicals
and Different Types of Laboratory Frit ........................................ 47
4.3.2. HP Engobes (EHP) ....................................................................... 48
4.3.3. Low Purity Engobe (ELP)............................................................. 59
4.3.4. Color Analysis .............................................................................. 77
4.3.5. Working on Industrial-size Roof Tile ............................................ 83
CHAPTER 5. CONCLUSIONS .................................................................................. 84
REFERENCES............................................................................................................ 86

viii
LIST OF FIGURES
Figure Page
Figure 2.1. Distribution of the usage of the roof tile (700-650 B.C triangle, 650-
600 B.C round) ....................................................................................... 3
Figure 2.2. Formation of clay according to environmental effects ............................ 4
Figure 2.3. Cross section of the engobe and clayed body ......................................... 6
Schematic of a dilatometer
Figure 2.5. Laboratory sieve device ......................................................................... 8
Figure 2.6. Different types of flow behavior of fluids as a function of shear
rate ........................................................................................................ 9
Figure 2.7. Color system diagram in the CIE L – b – a system ............................... 13
Figure 2.8. Application methods of the engobe: a) dipping b) spraying c)
waterfall and d) brushing ..................................................................... 14
Figure 2.9. Typical defects of the engobe a) crazing defect, b) peeling defect,
c) bubble defect and d) crawling and tearing defect ............................. 16
Figure 3.1. Manufacturing of roof tiles .................................................................. 21
Figure 3.2. Green roof tile samples that were wire-cut ........................................... 21
Figure 3.3. Flow chart for engobe production ........................................................ 22
Figure 3.4. Making of frit a) melting in box kiln and b) quenching in water .......... 24
Figure 3.5. Fritsch Pulverisette 6 planetary ball mill for dry grinding .................... 24
Figure 3.6. The use of raw materials for different frit and engobe production ........ 25
Figure 3.7. Application of engobe with a spray gun ............................................... 26
Figure 3.8. Lab type tumbling ball mill ................................................................. 26
Figure 3.9. Engobe samples according to SiO2-Al2O3-(Na2O+K2O) triangle
design for 10%wt lab frit. B2O3 content of the lab frit was 18% for
this design ........................................................................................... 28
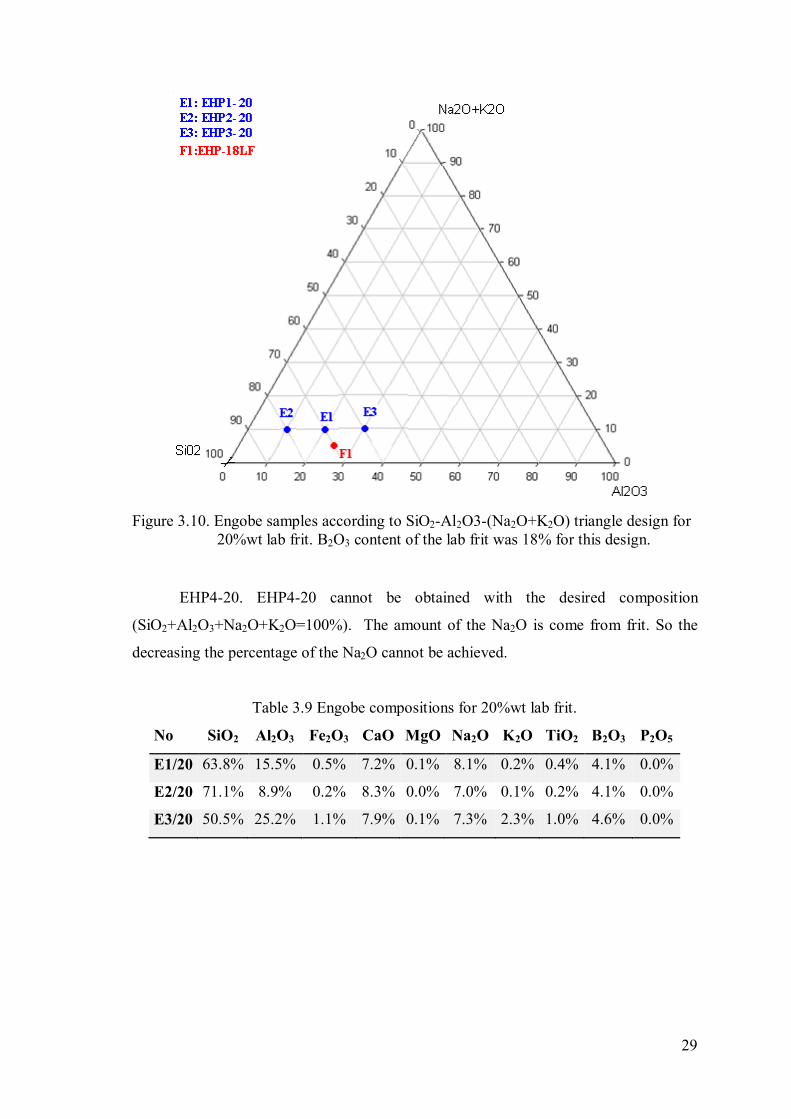
Figure 3.10. Engobe samples according to SiO2-Al2O3-(Na2O+K2O) triangle
design for 20%wt lab frit. B2O3 content of the lab frit was 18% for
this design ........................................................................................... 29
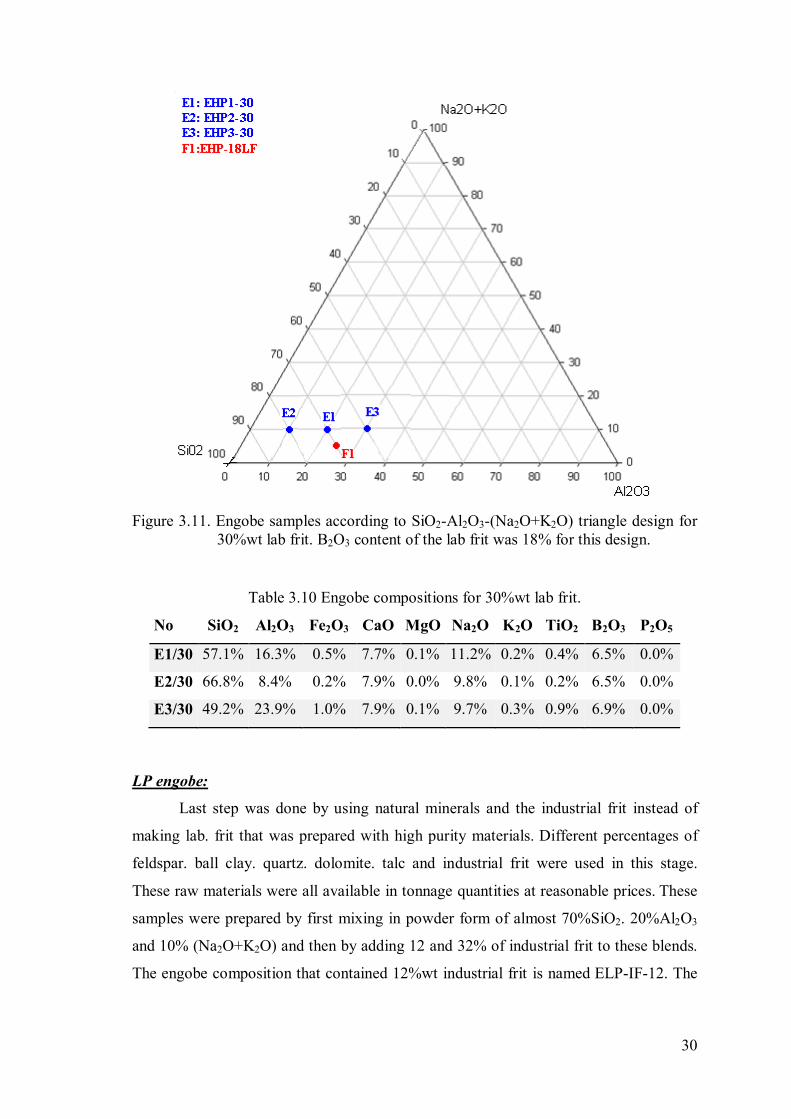
Figure 3.11. Engobe samples according to SiO2-Al2O3-(Na2O+K2O) triangle
design for 30%wt lab frit. B2O3 content of the lab frit was 18% for
this design ............................................................................................ 30
ix
Figure 4.1. Particle size distribution (PSD) analysis as measured by Laser
Scattering technique ............................................................................. 36
Figure 4.2. Thermal expansion behavior of the roof tile as measured by
dilatometer .......................................................................................... 36
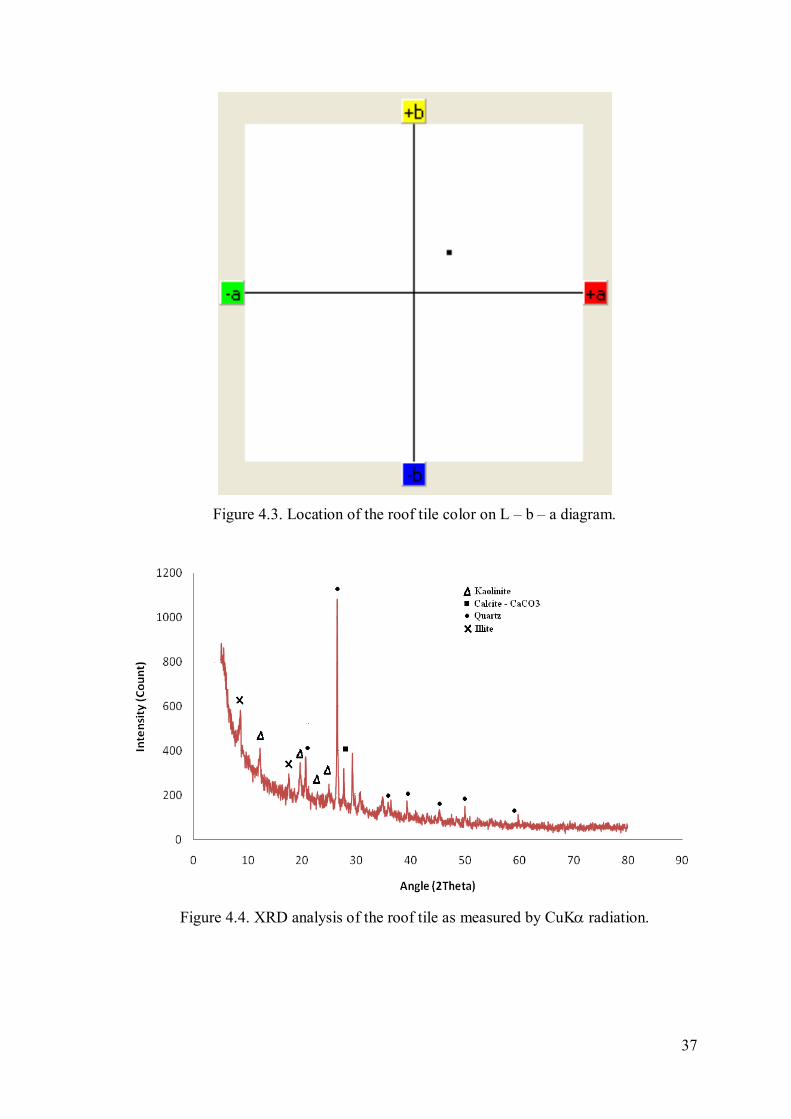
Figure 4.3. Location of the roof tile color on L - b – a diagram .............................. 37
Figure 4.4. XRD analysis of the roof tile as measured by CuKα radiation .............. 37
Figure 4.5. TGA analysis of the roof tile ............................................................... 38
Figure 4.6. SEM image of the Quartz .................................................................... 39
Figure 4.7. SEM image of the Sodium Feldspar 1005 ............................................ 39
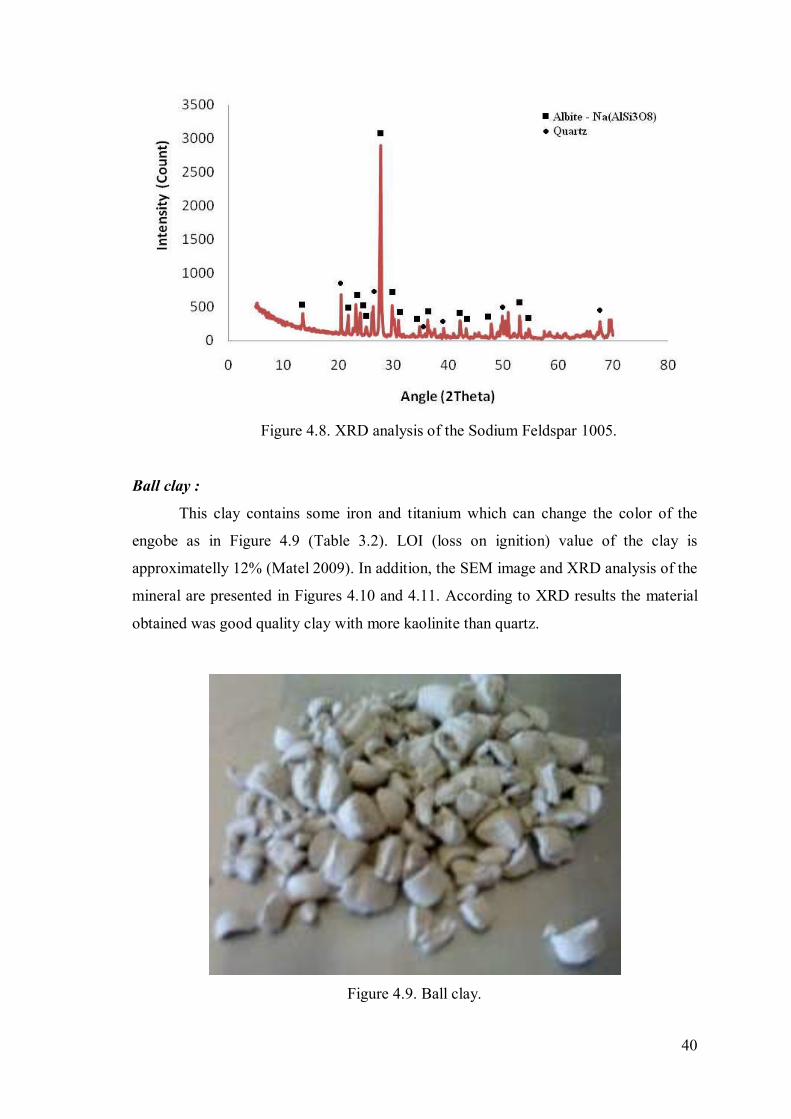
Figure 4.8. XRD analysis of the Sodium Feldspar 1005 ......................................... 40
Figure 4.9. Ball clay. ............................................................................................. 40
Figure 4.10. SEM image of the ball clay.................................................................. 41
Figure 4.11. XRD analysis of ball clay .................................................................... 41
Figure 4.12. SEM image of Egyptian talc ................................................................ 42
Figure 4.13. Published particle size distribution of Egyptian talc ............................. 42
Figure 4.14. XRD analysis of Egyptian talc ............................................................. 43
Figure 4.15. SEM image of Dolomite ...................................................................... 43
Figure 4.16. XRD analysis of Dolomite................................................................... 44
Figure 4.17. SEM image of Borax powder. ............................................................. 44
Figure 4.18. The Industrial Frit – 6116 .................................................................... 45
Figure 4.19. Sieve Analysis of industrial frit 6116 ................................................... 45
Figure 4.20. SEM image of industrial frit 6116 ....................................................... 46
Figure 4.21. The Laboratory Frit (18% B2O3) removed from water was glassy ........ 46
Figure 4.22. Sieve Analysis of Laboratory Frit (18% B2O3)..................................... 47
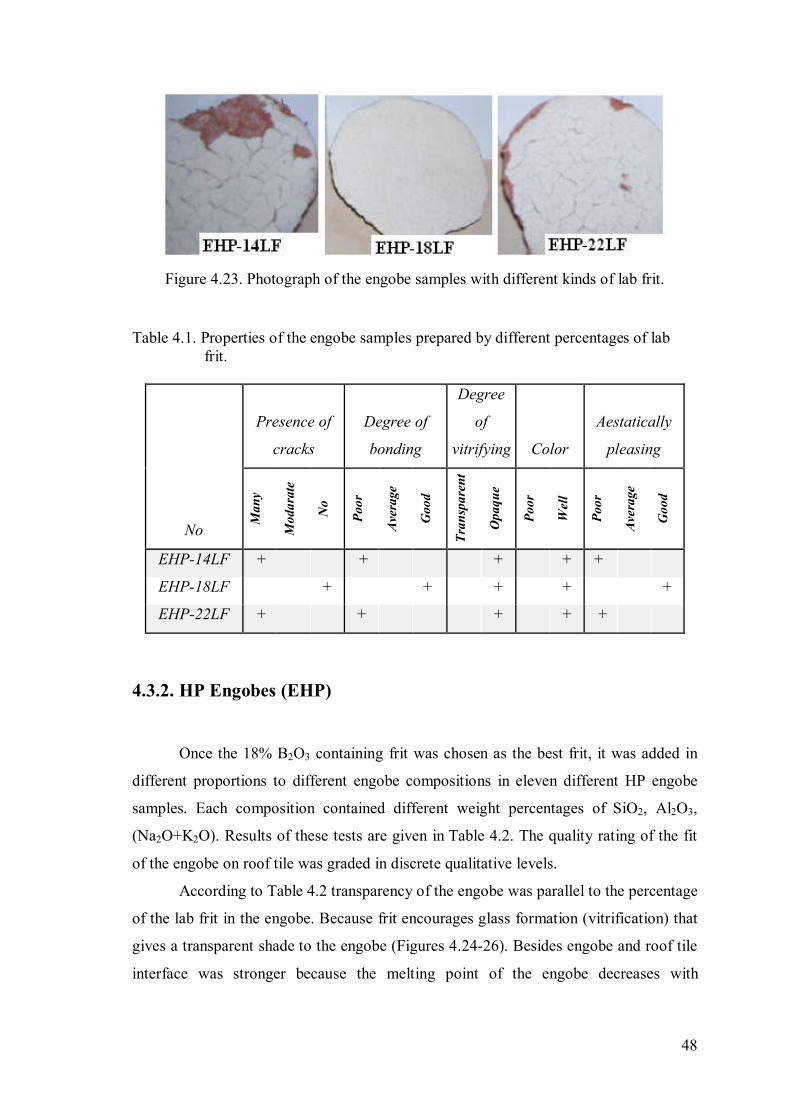
Figure 4.23. Photograph of the engobe samples with different kinds of lab frit. ....... 48
Figure 4.24. Images of the EHP engobe samples prepared with 10%w lab frit.
These results are to be compared to Figure 3.9. a) EHP1-10,
b) EHP2-10, c) EHP3-10, d) EHP4-10 and e) EHP5-10 ...................... 50
Figure 4.25. Image of the HP engobe samples prepared with 20%w lab frit.
These results are to be compared to Figure 3.10. a)EHP1-20,
b) EHP2-20 and c) EHP3-20 ............................................................... 52
Figure 4.26. Image of the HP engobe samples prepared with 30%w lab frit.
These results are to be compared to Figure 3.11. a)EHP1-30,
b) EHP2-30, c) EHP3-30 ..................................................................... 54

x
Figure 4.27. All EHP samples laid out on a triangular plot for comparison. The
effects of the oxides and frit to the HP engobe can be seen here ........... 55
Figure 4.28. Thermal expansion graph of EHP1-10 ................................................. 56
Figure 4.29. Thermal expansion graph of EHP1-30 ................................................. 56
Figure 4.30. The OM image of the EHP1-10 ........................................................... 57
Figure 4.31. The OM image of the EHP1-30 ........................................................... 57
Figure 4.32. The SEM image of the EHP1-30. Roof tile body was well bonded to
the engobe layer which was glassy....................................................... 58
Figure 4.33. XRD analysis of EHP1-10 ................................................................... 58
Figure 4.34. XRD analysis of EHP1-30 ................................................................... 59
Figure 4.35. Particle size distribution of the ELP-IF-12 engobe sample
a) Histogram and b) Cummulative Percentage ..................................... 60
Figure 4.36. Particle size distribution of the ELP-IF-32engobe sample
a) Histogram and b) Cummulative Percentage ..................................... 61
Figure 4.37. Photographs of LP engobe samples coded ELP-IF-12 (a) and
ELP-IF-32(b)....................................................................................... 62
Figure 4.38. Thermal expansion graph of ELP-IF-12 ............................................... 64
Figure 4.39. Thermal expansion graph of ELP-IF-32 ............................................... 64
Figure 4.40. The OM image of the ELP-IF-12
The OM image of the ELP-IF-32
The SEM image of the ELP-IF-12
The SEM image of the ELP-IF-32
Figure 4.44. XRD analysis of the ELP-IF-12 ........................................................... 67
45. XRD analysis of the ELP-IF-32 ........................................................... 67
Figure 4.46. Particle size distribution of the ELP-IF-12-200 engobe sample
a) Histogram and b) Cummulative Percentage ..................................... 68
Figure 4.47. Particle size distribution of the ELP-IF-32-200 engobe sample
a) Histogram and b) Cummulative Percentage. .................................... 69
Figure 4.48. Image of the LP engobe samples ground at different speeds
a) ELP-IF-12-200, b) ELP-IF-32-200 .................................................. 70
Figure 4.49. Images of the LP engobe samples fired at different temperatures
a) ELP-IF-12-970, b) ELP-IF-32-970, c) ELP-IF-12-1030,
d) ELP-IF-32-1030, e) ELP-IF-12-150 and f) ELP-IF-32-150 .............. 72
xi
Figure 4.50. The SEM images of the 5% HCl - water solution applied engobe
surfaces a) ELP-IF-12 and b) ELP-IF-32
The SEM images of the 5% HNO3 - water solution applied engobe
surfaces a) ELP-IF-12 and b) ELP-IF-32
The SEM images of the 5% NaOH - water solution applied engobe
surfaces a) ELP-IF-12 and b) ELP-IF-32 ............................................. 76
The SEM images of the 5% H2SO4 - water solution applied engobe
surfaces a) ELP-IF-12 and b) ELP-IF-32
Figure 4.54. The SEM images of the engobe surfaces after heating test
a) ELP-IF-12 and b) ELP-IF-32 ........................................................... 77
Figure 4.55. Image of the LP engobe samples with different colorant
a) ELP-IF-12-Cr1, b) ELP-IF-32-Cr1, c) ELP-IF-32-Cr5,
d) ELP-IF-32-Cr5, e) ELP-IF-32-Mn5, f) ELP-IF-32-Ti5,
g) ELP-IF-32-Fe5 and h) ELP-IF-32-Co5, i) ELP-IF-32-Cu5 .............. 78
Figure 4.56. Location of color on the L - b – a diagram
ELP-IF-32-Cr5 on industrial - size roof tile
xii
LIST OF TABLES
Table Page
Table 1.1 Oxide types ......................................................................................... 10
Table 1.2 Melting temperature of the oxides and their source .............................. 12
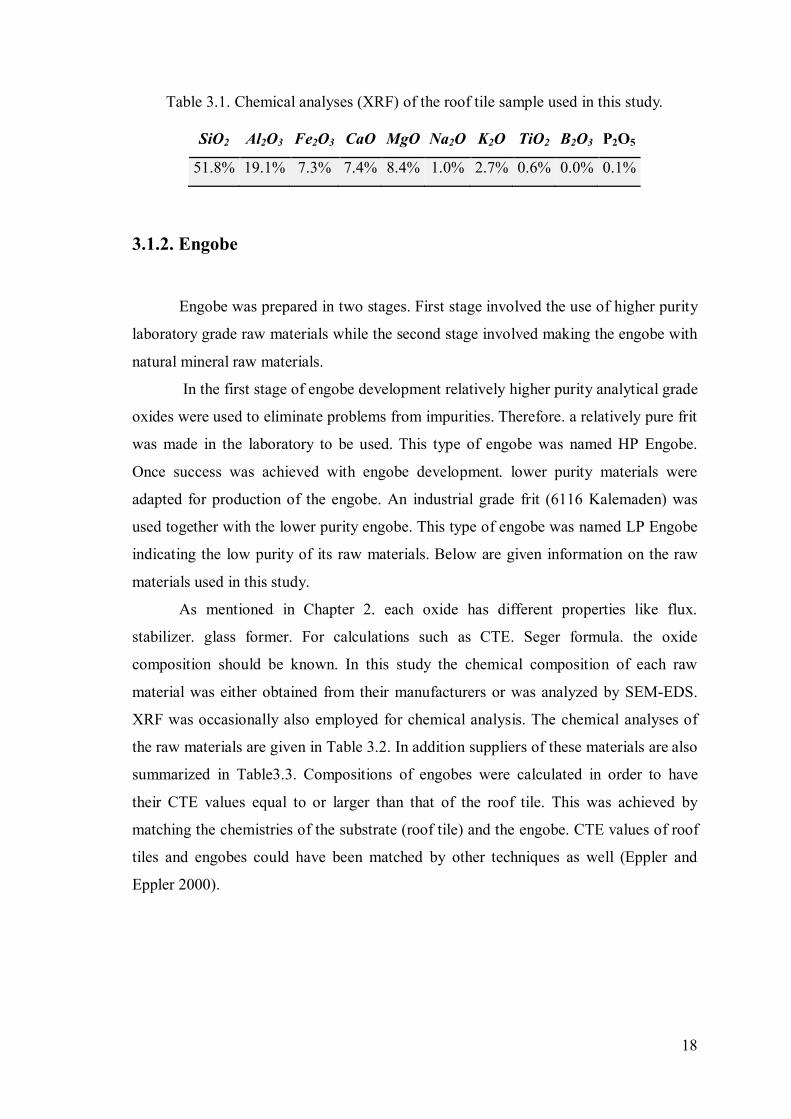
Table 3.1. Chemical analyses (XRF) of the roof tile sample used in this
study ................................................................................................... 18
Table 3.2. Chemical analysis of the raw materials ................................................ 19
Table 3.3. Supplier product codes of the raw materials ......................................... 19
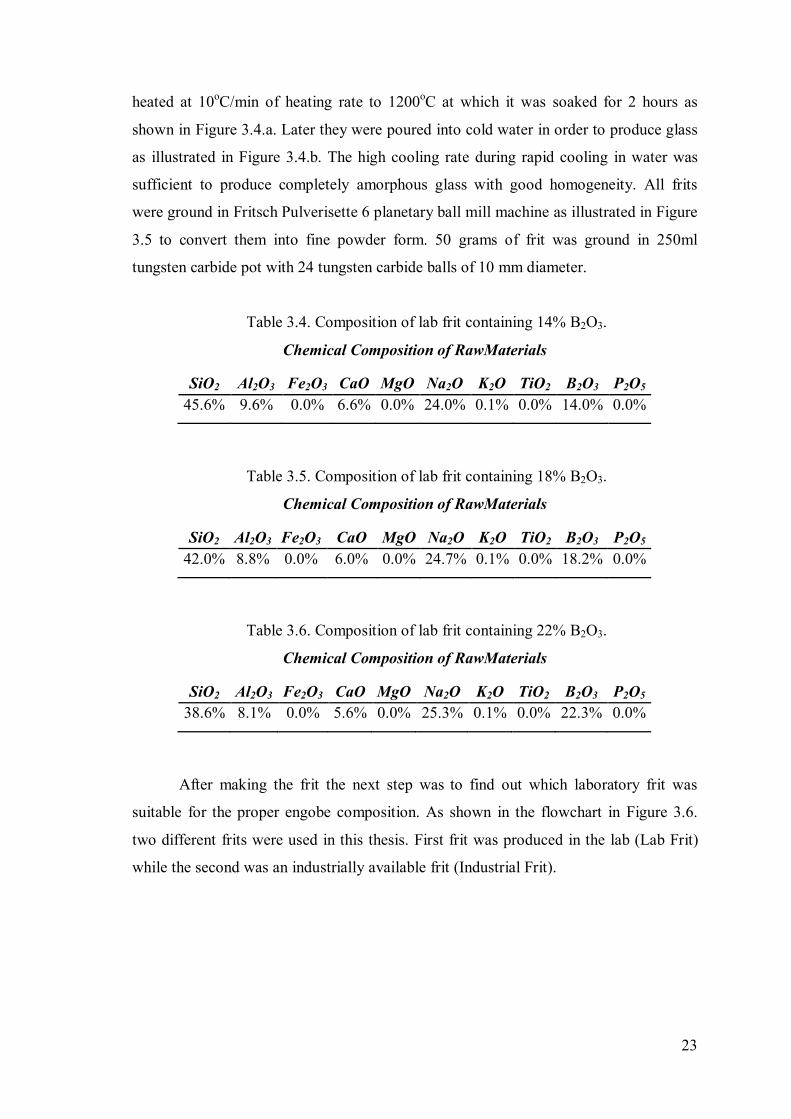
Table 3.4. Composition of lab frit containing 14% B2O3 ...................................... 23
Table 3.5. Composition of lab frit containing 18% B2O3 ...................................... 23
Table 3.6. Composition of lab frit containing 22% B2O3 ...................................... 23
Table 3.7. Chemical compositions of the HP engobe samples .............................. 27
Table 3.8. Engobe compositions for 10%wt lab frit .............................................. 28
Table 3.9. Engobe compositions for 20%wt lab frit .............................................. 29
Table 3.10. Engobe compositions for 30%wt lab frit .............................................. 30
Table 3.11. Oxide compositions of LP engobe ....................................................... 31
Table 3.12. Experiments for different grinding RPM and time ............................... 31
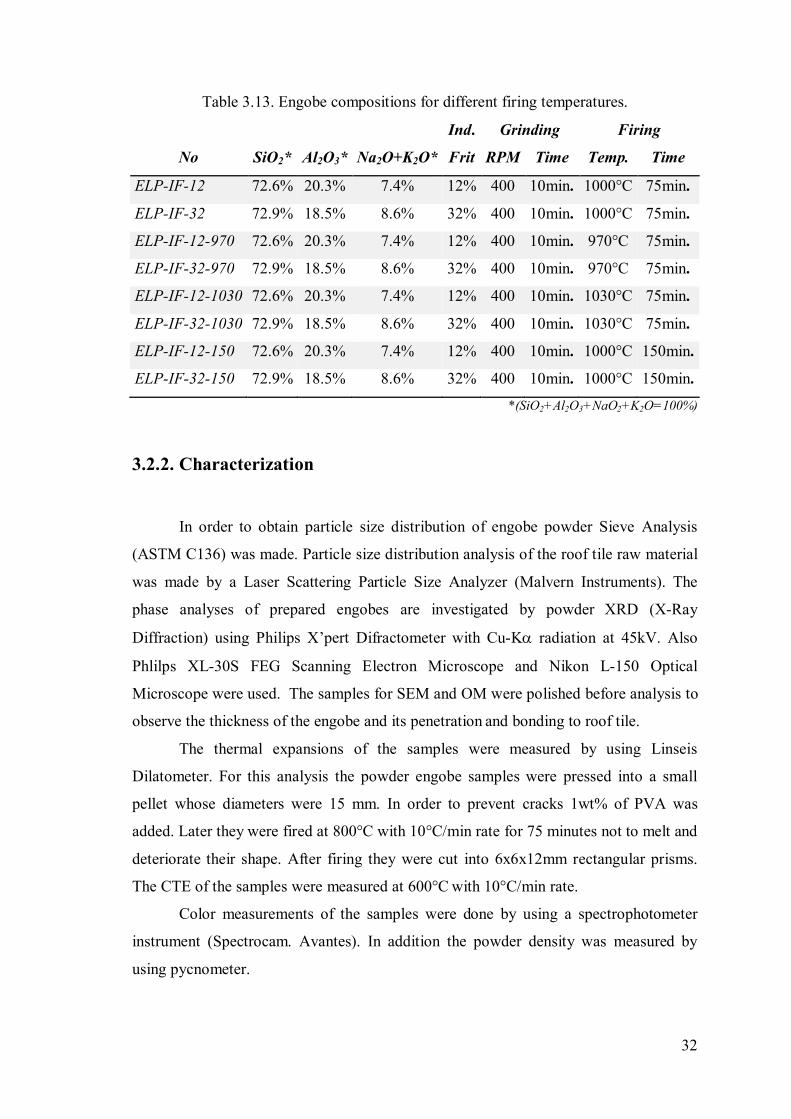
Table 3.13. Engobe compositions for different firing temperatures......................... 32
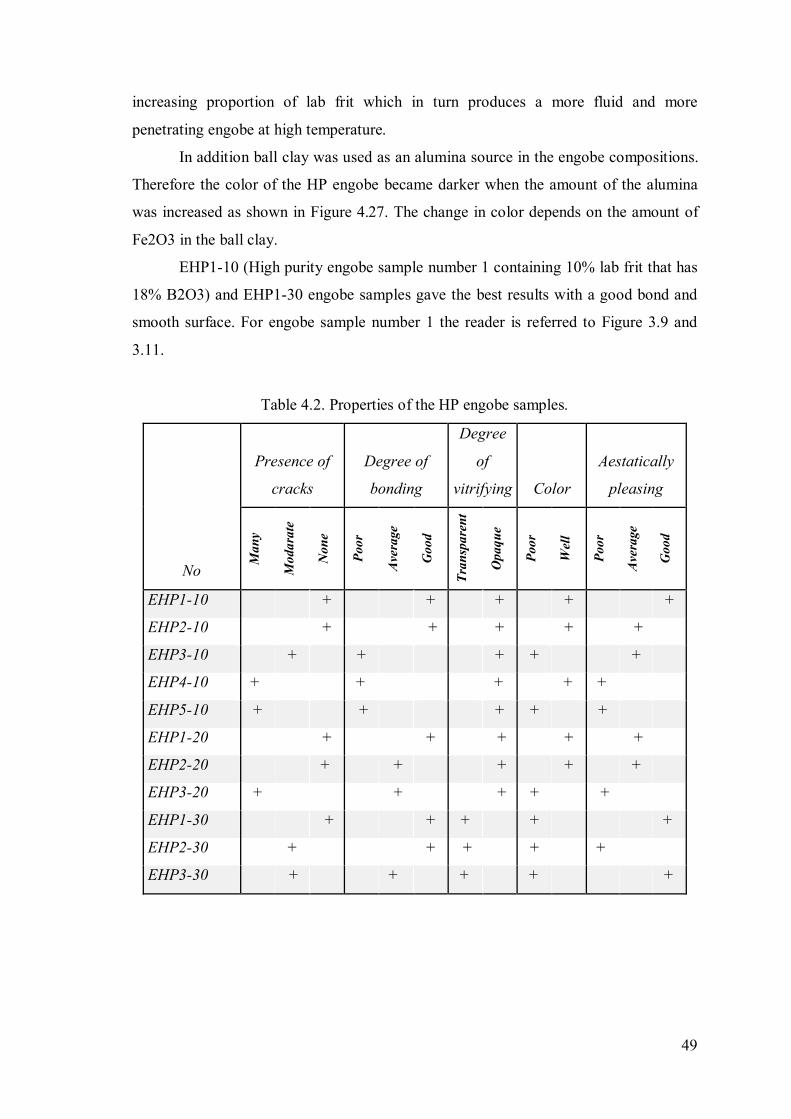
Table 4.1. Properties of the engobe samples prepared by different
percentages of lab frit ......................................................................... 48
Table 4.2. Properties of the HP engobe samples ................................................... 49
Table 4.3. Properties of the ELP-IF-12 and ELP-IF-32 engobe samples .............. 63
Properties of the ELP samples that ground at 200 RPM
......................................... 82

1
CHAPTER 1
INTRODUCTION
Since centuries, the roof tiles have protected their important place as the roof
cover for buildings. The Romans were the first to make and use the roof tiles. Other
people also used roof tiles because of the convenience, low cost and aesthetic
properties. When the population growth is concerned, it is understood that there is a
huge potential in the roof tile industry worldwide. The main reason roof tiles have such
popularity is because of their physical, thermal and hydrous properties (Genç and
Başkıran 2001, Kornmann 2007). Roof tiles are sometimes exposed to hard weathering
conditions like freeze-thaw cycles, rain, snow, wind, UV radiation from sunlight. In
order to produce roof tiles of sufficient strength, low porosity, and resistance to
weathering the manufacturers are nowadays more technical and sophisticated. Besides
the research on improving the technical quality of roof tiles a new aspect has emerged;
appearance of the roof tiles. With increasing variety of architectural techniques, artistic
affects and customer choices, many more alternative roof covering materials appeared
in the market. Examples are steel panels, aluminum panels, concrete panels, mineral
pressed covers, shingle. In addition, different colors for roof tiles are increasingly
sought for in the market (Karasu, Kaya and Özkaya 2002, Poyraz, Erginel and Ay
2006). Especially in Japan, EU, USA there is a big demand for colored roof tiles. In the
last decade Turkey too has been affected by this variation and some manufacturers have
tried to find new engobe compositions (Karasu and Kara 2001). Roof tiles are colored
by applying a thin layer of coloring material on the surface of green roof tile before
drying and firing at high temperatures to mature the product. A colored and partially
glassy surface layer of ceramic quality which is quite resistant to frosting and
weathering effects is obtained. This layer is known as engobe or slip. Sometimes
another layer is applied on top of engobe to give bright appearance. This final layer is
known as glaze which is completely vitreous (glassy). If there is a final glaze layer then
the engobe acts as an intermediate layer to hide the color of the substrate. For roof tiles
glaze coating is generally not applied as a final coating, only a 100-500 micrometer
thick layer of engobe is used.

2
The best coloring method of roof tiles is engobe because it is a ceramic layer
fired at high temperatures and well-integrates with the substrate. Other techniques like
painting and silicone have long term durability problems under UV radiation of sunlight
and freeze/thaw cycles.
The fit of engobe is the most important point for ceramic coating. The substrate
and engobe must bond together very well and must not be damaged easily. A good fit is
obtained when the two materials of substrate and the engobe have similar coefficients of
thermal expansion (CTE). Ceramic bond between substrate and engobe develops during
firing around 1000oC. Engobe layer is partially vitrified and a chemically durable and
mechanically strong product is obtained (Kornmann 2007, Eppler 2000).
The goal of this work was to develop the most suitable engobe composition for a
commercial roof tile to provide different colors for more pleasing appearance. The use
of natural minerals and industrial frit to produce engobe by manufacturer easily was
also investigated. Because making frit is both expensive and difficult for a roof tile
company.
This thesis consists of five chapters. Information obtained from the literature is
summarized in Chapter II, experimental procedure and materials are presented in
Chapter III, results and discussions are given in Chapter IV and conclusions are
explained in Chapter V.
3
CHAPTER 2
ENGOBE AND ROOF TILES
In this chapter roof tiles, engobes, their chemistry, coating properties for
matching engobe and roof tile, colorants (metal oxides), application methods and
defects are explained.
2.1. Roof Tile
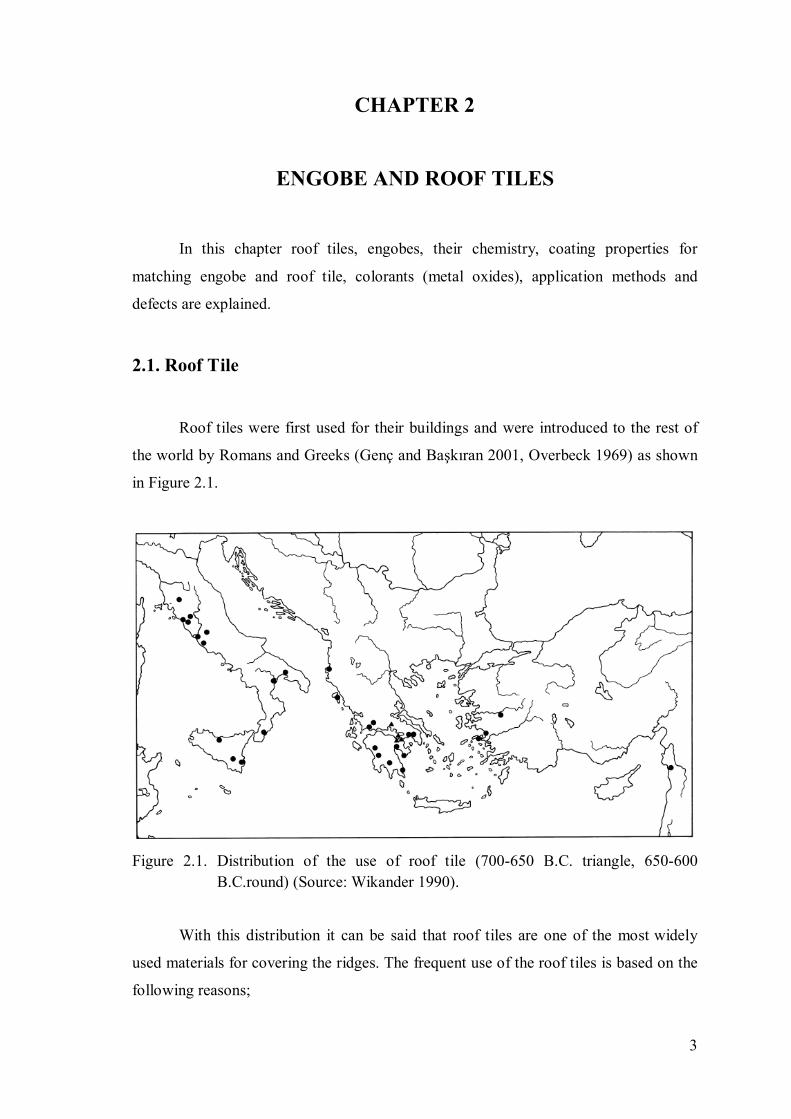
Roof tiles were first used for their buildings and were introduced to the rest of
the world by Romans and Greeks (Genç and Başkıran 2001, Overbeck 1969) as shown
in Figure 2.1.
Figure 2.1. Distribution of the use of roof tile (700-650 B.C. triangle, 650-600
B.C.round) (Source: Wikander 1990).
With this distribution it can be said that roof tiles are one of the most widely
used materials for covering the ridges. The frequent use of the roof tiles is based on the
following reasons;

4
They have an aesthetic view- both historical and modern.
They are light and waterproof.
They have good frost resistance.
As most ceramics, roof tiles are made from oxides that can be found in large
quantities in nature. Clay is the base material of roof tile. Clays are removed from the
upper top layer of the earth. They are formed in a long period by weather effects and by
physical erosion. The minerals in roof tile clay can be estimated by three components of
its environmental conditions as illustrated in Figure 2.2 (Kornmann 2007). Generally
clays consist of between 40-65% SiO2 (silica), 1-25% Al2O3 (alumina) and 3-9% Fe2O3
(iron oxide). Apart from these, K2O (potassium oxide), Na2O (sodium oxide) and
CaCO3 (calcium carbonate) are also found in the roof tile in different ratios. Iron gives
the roof tile its natural red color. According to the amount of iron the color can be
changed from orange to pale brown. Also the color is derived from the minerals
contained in the tile (Eppler and Eppler 2000). Alumina and silica increase the firing
temperature but they also increase the strength of the roof tile. Therefore, they are the
basic materials of the roof tiles (Yanık 2003).
Figure 2.2. Formation of clay according to environmental effects
(Source: Kornmann 2007).
For producing a roof tile, clay that is taken from the earth is ground to decrease
its particle size which is one of the important properties for the roof tile. If the particle
size of the roof tile is large, cracks can form on the product. Also the characteristic
properties of the roof tiles affect the firing temperature of the clay. Especially the
5
strength and color maturation of the tile occurs during the firing process. A typical roof
tile is fired between 900 to 1000 oC (Genç and Başkıran 2001, Lyons 2006). Fired
earthenware products have a traditional red color. Sometimes a thin layer of clayey
paste (slip or engobe) is applied on the surface to impart lighter colors to the ware. This
clayey paste contains much lower percentages of iron than the base material which
generally has 4-9% Fe.
2.2. Engobe
Engobe is a layer for covering the surface of the clay bodies with a different
color. It gives a smooth surface to the tile after application. The color is provided to the
engobe composition by addition of small amounts of metal oxides. Therefore the tile
can have an aesthetic appearance with different colors. Engobes are sometimes also
called as slip or as an intermediate layer between clay body and glaze (Grimshaw 1971).
Glaze layer is applied on the engobe layer as a final coating layer to impart a shiny
appearance to the clay body. A low-melting additive of frit is often incorporated into the
engobe mixture to assist earlier vitrification upon firing. There is often less proportion
of frit in engobe than in glaze. The latter is more glassy than the former. The amount of
frit adjusts the hue of the engobe color and the surface brightness. This is the reason
why the engobes are less shiny than glazes. This property of the engobes also provides
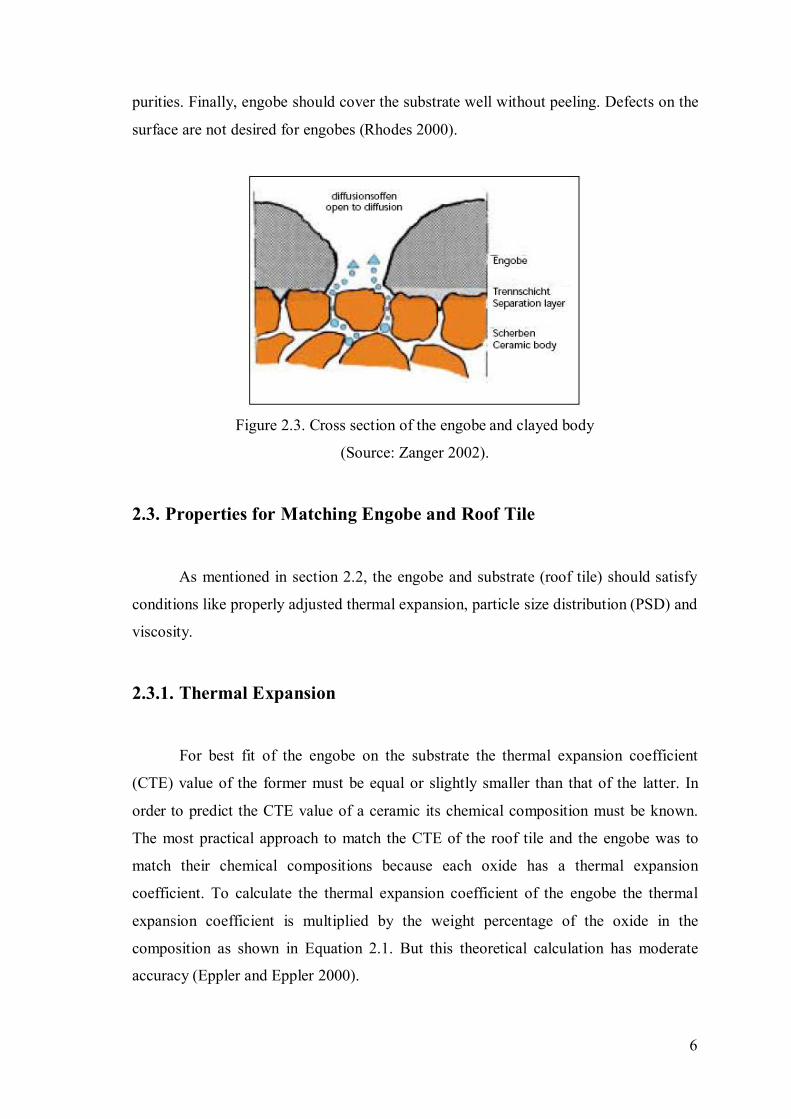
the diffusion of the gas. In other words engobes have a porous structure as shown in
Figure 2.3. Since the melting of the engobe eventuates locally during the firing process
(Zanger 2002). Porous structure of the engobe allows passage of gases that may form
during firing of the ware. If the engobe layer is completely vitreous then gases cannot
escape and blowholes can from, marring the surface of the ceramic.
For a good covering of the substrate, engobe composition should be carefully
designed. First the body and the engobe should be compatible together during both
drying and firing. This shows the quality of the engobe. In addition, the firing
temperature of engobe should be near the firing temperature of the substrate. The roof
tiles have a low firing temperature. Therefore this condition is very important for
making an engobe for roof tile. Secondly, the color of the substrate should be covered
completely. The color of the engobe is affected mainly by the amount of the iron in the
engobe. So, the raw material for making an engobe should be chosen according to their
6
purities. Finally, engobe should cover the substrate well without peeling. Defects on the
surface are not desired for engobes (Rhodes 2000).
Figure 2.3. Cross section of the engobe and clayed body
(Source: Zanger 2002).
2.3. Properties for Matching Engobe and Roof Tile
As mentioned in section 2.2, the engobe and substrate (roof tile) should satisfy
conditions like properly adjusted thermal expansion, particle size distribution (PSD) and
viscosity.
2.3.1. Thermal Expansion
For best fit of the engobe on the substrate the thermal expansion coefficient
(CTE) value of the former must be equal or slightly smaller than that of the latter. In
order to predict the CTE value of a ceramic its chemical composition must be known.
The most practical approach to match the CTE of the roof tile and the engobe was to
match their chemical compositions because each oxide has a thermal expansion
coefficient. To calculate the thermal expansion coefficient of the engobe the thermal
expansion coefficient is multiplied by the weight percentage of the oxide in the
composition as shown in Equation 2.1. But this theoretical calculation has moderate
accuracy (Eppler and Eppler 2000).

7
)()()( (%)* oxideoxideengobe wCTECTE (2.1)
The exact coefficient of thermal expansion can be measured by dilatometer as
shown in Figure 2.4. The device measures the expansion of the sample length during
desired heating temperature range. For finding CTE of a sample reversible thermal
expansion measurement should be done. That means the fired sample is measured not
unfired (Dinger 2005).
Figure 2.4. Schematic of a dilatometer
(Source: Free patents online 2010).
After measurement the elongation of the sample and temperature graph is drawn
to calculate CTE value. This calculation is based on linear expansion of the material.
The coefficient of thermal expansion (CTE) on a graph can be calculated with Equation
2.2 (Brown 2001).
1LdT
dL
T
L
(2.2)
where;
α: the slope of the curve (CTE)
L1: initial length
dL/dT: elongation in unit temperature

8
2.3.2. Particle Size Distribution
Particle size is important for a smooth surface. Especially it is effective for
preventing the crawling defect because the uniform particle size produces a
homogeneous engobe layer. In addition for a good compositional homogeneity of the
mixture, a well distributed particle size is needed. When the particle size of the engobe
decreases the reaction during the heat treatment is accelerated. Also the amount of water
for preparing the engobe mixture is adjusted according to the particle size
(Wattanasiriwech and Wattanasiriwech 2006, Bernardin 2009). Moreover it is an
important control parameter for viscosity of the engobe. Particle size distribution can be
measured by many methods. One of the most accurate ways is sedimentation. Although
this is an automatic PSD (particle size distribution) analysis it has an analysis range.
The size of the particle should be between 300 µm and 0,1 µm for using this analysis.
Another way for finding the PSD is sieve analysis as in the Figure 2.5. The mechanism
has a simple system. There are many sieves that are placed from coarse to fine mesh.
For illustration, distribution histograms are used. In this graph the mass percentage of
particle is used as data according to their size class (Dinger 2005).
Figure 2.5. Laboratory sieve device.
9
2.3.3. Viscosity
As explained in chapter 2.3.2 the particle size affects viscosity. The viscosity
increases with decreasing particle size because the specific surface of the power
increases in fine particle. In addition they need more water to bind. The viscosity is the
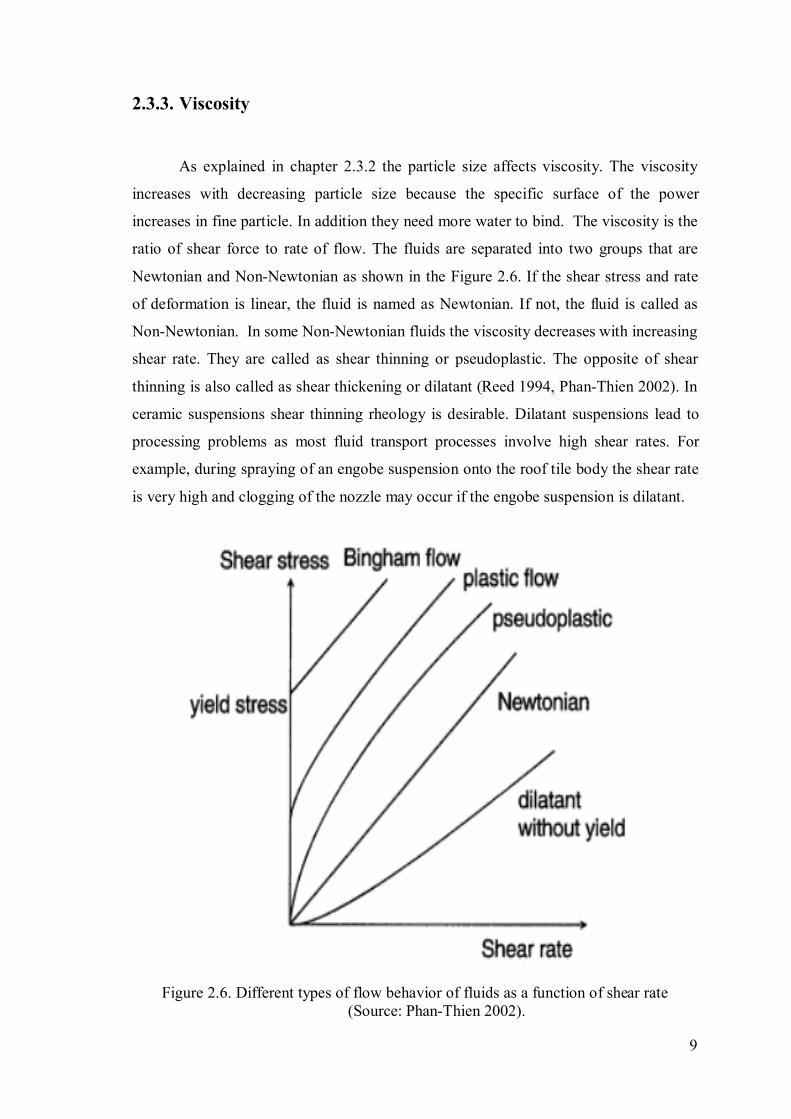
ratio of shear force to rate of flow. The fluids are separated into two groups that are
Newtonian and Non-Newtonian as shown in the Figure 2.6. If the shear stress and rate
of deformation is linear, the fluid is named as Newtonian. If not, the fluid is called as
Non-Newtonian. In some Non-Newtonian fluids the viscosity decreases with increasing
shear rate. They are called as shear thinning or pseudoplastic. The opposite of shear
thinning is also called as shear thickening or dilatant (Reed 1994, Phan-Thien 2002). In
ceramic suspensions shear thinning rheology is desirable. Dilatant suspensions lead to
processing problems as most fluid transport processes involve high shear rates. For
example, during spraying of an engobe suspension onto the roof tile body the shear rate
is very high and clogging of the nozzle may occur if the engobe suspension is dilatant.
Figure 2.6. Different types of flow behavior of fluids as a function of shear rate
(Source: Phan-Thien 2002).

10
The surface of the roof tile is not flat. When the viscosity of the engobe is too
small the engobe may run off the uneven surface and the thickness of the engobe would
be uneven. So, defects can occur on the surface which is an unwanted situation for the
engobe (Britt 2004).
2.4. Oxides
Roof tiles and engobes are all made of oxides which are naturally occurring
materials available at reasonable cost at large quantities. In order to properly design an
engobe composition one has to understand the properties that these oxides can provide.
The oxides are separated into three groups; stabilizer, glass former and fluxes as
illustrated in the Table 1.1. The stabilizers prevent the engobe from being water soluble
and also not to flow on the surface. Furthermore it helps to increase opacity and the
durability of the engobe. The glass former provides a glass structure. The fluxes are
used to reduce the firing temperature (Bailey 2004)
Table 1.1. Oxide types.
Stabilizers Glass former Flux
Al2O3 SiO2 K2O
B2O3 Na2O
P2O5 MgO
CaO
Silica, which is the major oxide for engobes, forms the skeleton of the engobe
structure. In addition the percentage of the silica is more than the other oxides in an
engobe composition. It is glass former at high temperatures. Although they have high
melting temperatures (approximately 1700oC) they decrease thermal expansion, fluidity
and the shrinkage of the engobe. Because of low thermal expansion coefficients they
reduce surface defects. In addition they help increase hardness. Furthermore they have a
good resistance to water and chemical effects. With increasing SiO2 the transparency of
engobe increases. It has a good resistance to thermal shock. SiO2 can be obtained from
silica, feldspar, talc and ball clay (Eppler and Eppler 2000, Çetin 2005).
11
Alumina is added to the composition through ball clay and feldspar. It reduces
crazing defect while increasing the melting temperature of the engobe. Therefore, the
amount of the alumina is adjusted according to the desired firing temperature of the
engobe. It reduces the thermal expansion of the engobe. Moreover it helps to increase
the hardness, viscosity, opacity and the resistance to acid and water (Grimshaw 1971).
Calcium oxide (CaO) is used in the form of calcium carbonate, dolomite.
Calcium carbonate (CaCO3) is affective to get white color in the engobe. It provides a
matte appearance when used too much in the engobe composition because of increasing
the refractory inclination. It decreases the viscosity and increases hardness and
durability.
Contrary to calcium oxide, magnesium oxide (MgO) helps to give a shiny
appearance. It is effective to decrease the thermal expansion and to prevent crazing.
Magnesium hydroxide (Mg(OH)2) and talc are the sources of magnesium oxide (Çetin
2005).
Alkali oxides and B2O3 are needed to vitrify the engobe and to act as a flux to
reduce the melting point of the engobe. Some of the raw materials used for making
engobe are water soluble. Examples are Na2O, B2O3, and K2O. These materials need to
be transformed into a water-insoluble form because engobe is coated on the surface of
the roof tile by spraying which involves a water based suspension. They quickly
dissolve in water but a little of them positively affects the suspension. It helps the
recrystallization in the suspension during drying. Therefore, surface of the engobe
prevents the damage because of its hardness (Rhodes 2000). A frit, which is a water-
insoluble glassy material, needs to be made from engobe raw materials. The frit, which
is usually quite rich in B2O3, is a strong flux and helps vitrify the engobe. Borax is used
as a source of B2O3. Na2O, B2O3, and K2O which are used for lowering the melting
temperature of the engobe affect negatively the engobe because of high thermal
expansion. The properties of the Na2O and K2O are almost the same. Na2O is added as a
form of feldspar, Na2CO3 and K2O are obtained from K2CO3 (Britt 2004).
Fe2O3 is not used due to staining which is the coating of red or black depending
on the firing atmosphere (McVay and Parmelee 1937). They are also called as impurity
of the raw materials to change the color of the engobe which is undesirable situation.
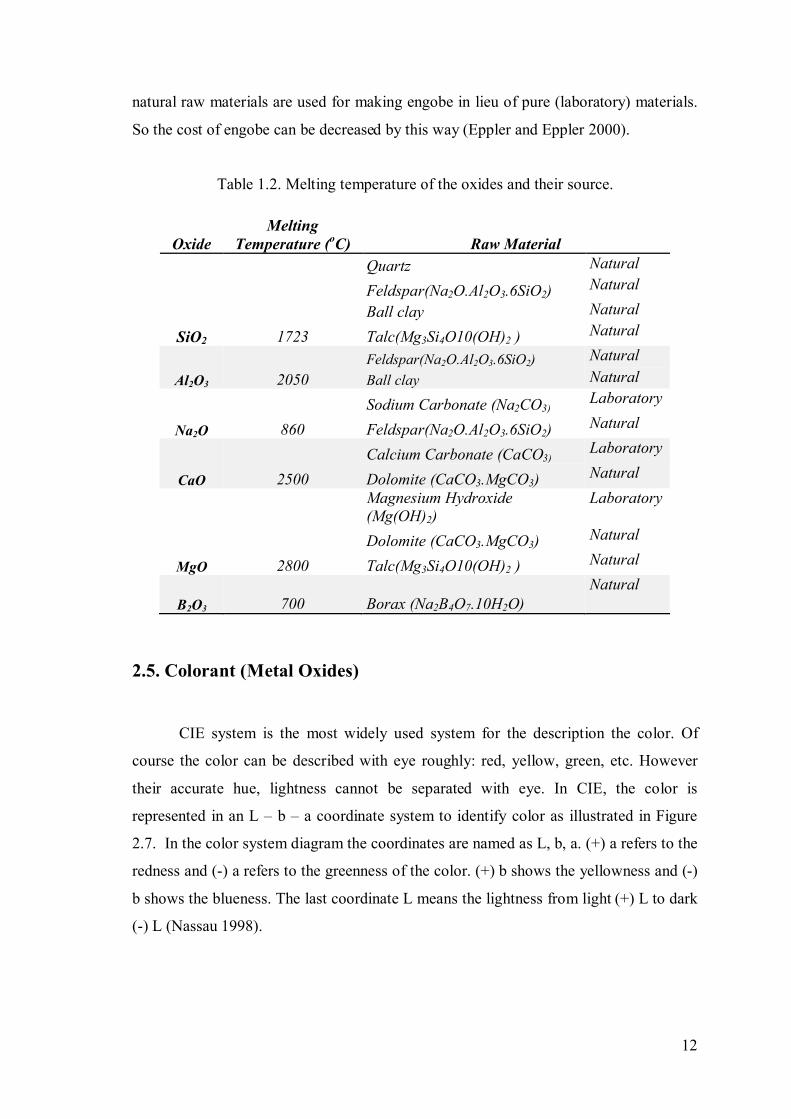
The oxide combination with laboratory frit and with industrial frit to get desired
oxide is two of important reason for preparing engobe as in the Table 1.2. Generally the
12
natural raw materials are used for making engobe in lieu of pure (laboratory) materials.
So the cost of engobe can be decreased by this way (Eppler and Eppler 2000).
Table 1.2. Melting temperature of the oxides and their source.
Oxide
Melting
Temperature (oC) Raw Material
SiO2 1723
Quartz Natural
Feldspar(Na2O.Al2O3.6SiO2) Natural
Ball clay Natural
Talc(Mg3Si4O10(OH)2 ) Natural
Al2O3 2050
Feldspar(Na2O.Al2O3.6SiO2) Natural
Ball clay Natural
Na2O 860
Sodium Carbonate (Na2CO3) Laboratory
Feldspar(Na2O.Al2O3.6SiO2) Natural
CaO 2500
Calcium Carbonate (CaCO3) Laboratory
Dolomite (CaCO3.MgCO3) Natural
MgO 2800
Magnesium Hydroxide
(Mg(OH)2)
Laboratory
Dolomite (CaCO3.MgCO3) Natural
Talc(Mg3Si4O10(OH)2 ) Natural
B2O3 700 Borax (Na2B4O7.10H2O)
Natural
2.5. Colorant (Metal Oxides)
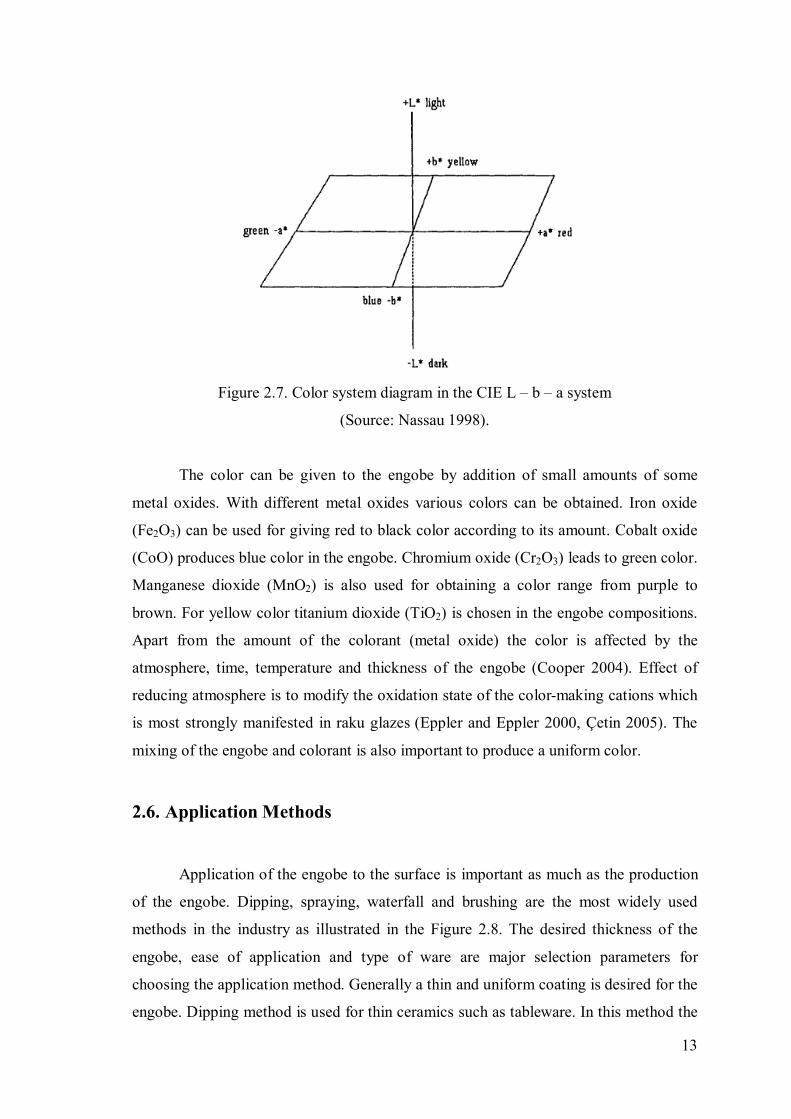
CIE system is the most widely used system for the description the color. Of
course the color can be described with eye roughly: red, yellow, green, etc. However
their accurate hue, lightness cannot be separated with eye. In CIE, the color is
represented in an L – b – a coordinate system to identify color as illustrated in Figure
2.7. In the color system diagram the coordinates are named as L, b, a. (+) a refers to the
redness and (-) a refers to the greenness of the color. (+) b shows the yellowness and (-)
b shows the blueness. The last coordinate L means the lightness from light (+) L to dark
(-) L (Nassau 1998).
13
Figure 2.7. Color system diagram in the CIE L – b – a system
(Source: Nassau 1998).
The color can be given to the engobe by addition of small amounts of some
metal oxides. With different metal oxides various colors can be obtained. Iron oxide
(Fe2O3) can be used for giving red to black color according to its amount. Cobalt oxide
(CoO) produces blue color in the engobe. Chromium oxide (Cr2O3) leads to green color.
Manganese dioxide (MnO2) is also used for obtaining a color range from purple to
brown. For yellow color titanium dioxide (TiO2) is chosen in the engobe compositions.
Apart from the amount of the colorant (metal oxide) the color is affected by the
atmosphere, time, temperature and thickness of the engobe (Cooper 2004). Effect of
reducing atmosphere is to modify the oxidation state of the color-making cations which
is most strongly manifested in raku glazes (Eppler and Eppler 2000, Çetin 2005). The
mixing of the engobe and colorant is also important to produce a uniform color.
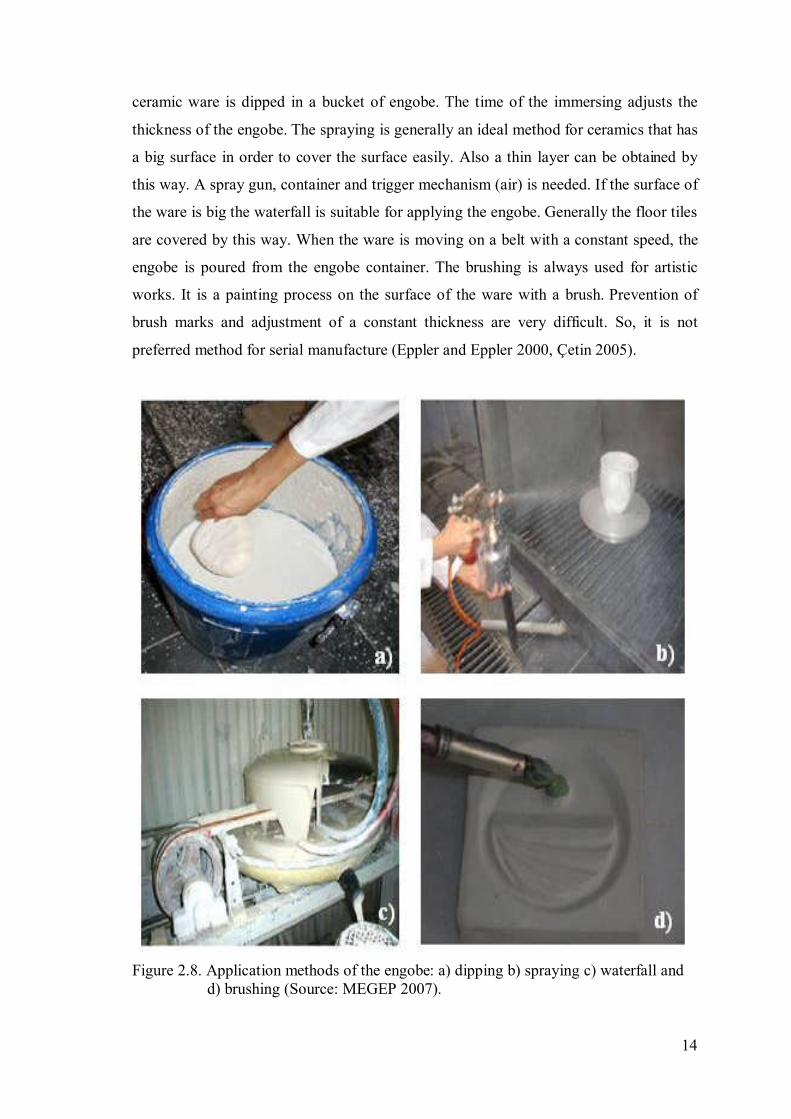
2.6. Application Methods
Application of the engobe to the surface is important as much as the production
of the engobe. Dipping, spraying, waterfall and brushing are the most widely used
methods in the industry as illustrated in the Figure 2.8. The desired thickness of the
engobe, ease of application and type of ware are major selection parameters for
choosing the application method. Generally a thin and uniform coating is desired for the
engobe. Dipping method is used for thin ceramics such as tableware. In this method the
14
ceramic ware is dipped in a bucket of engobe. The time of the immersing adjusts the
thickness of the engobe. The spraying is generally an ideal method for ceramics that has
a big surface in order to cover the surface easily. Also a thin layer can be obtained by
this way. A spray gun, container and trigger mechanism (air) is needed. If the surface of
the ware is big the waterfall is suitable for applying the engobe. Generally the floor tiles
are covered by this way. When the ware is moving on a belt with a constant speed, the
engobe is poured from the engobe container. The brushing is always used for artistic
works. It is a painting process on the surface of the ware with a brush. Prevention of
brush marks and adjustment of a constant thickness are very difficult. So, it is not
preferred method for serial manufacture (Eppler and Eppler 2000, Çetin 2005).
Figure 2.8. Application methods of the engobe: a) dipping b) spraying c) waterfall and
d) brushing (Source: MEGEP 2007).
15
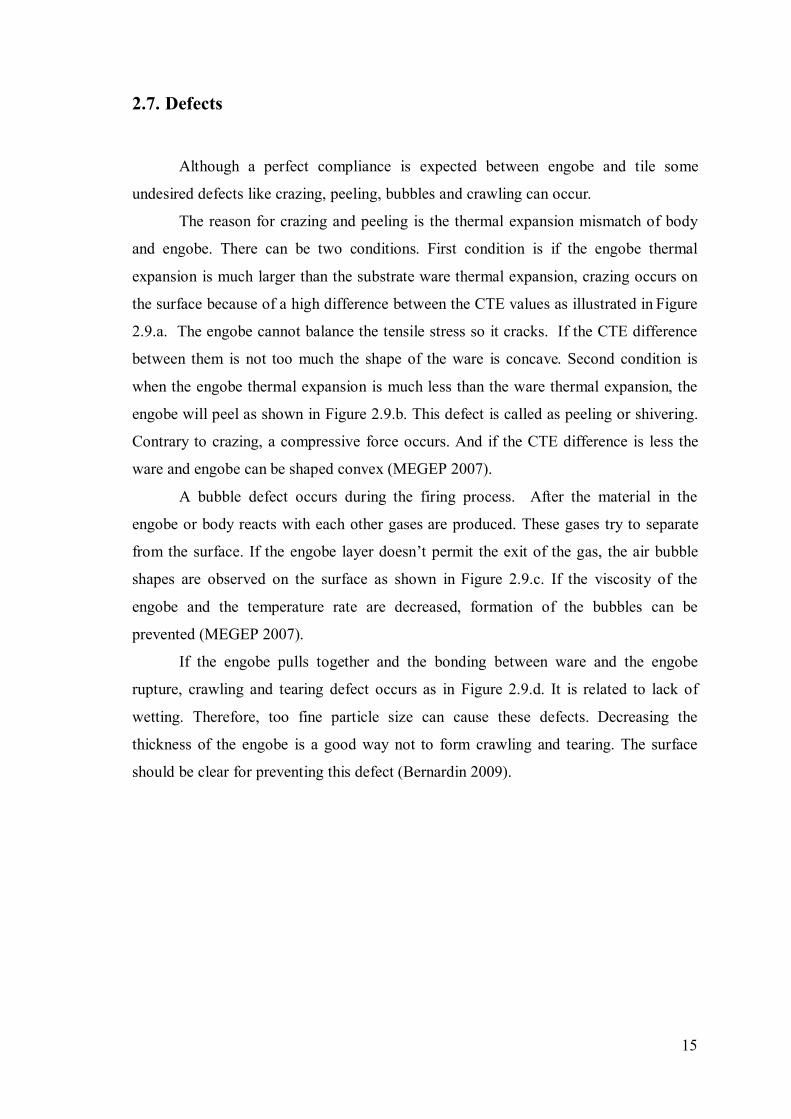
2.7. Defects
Although a perfect compliance is expected between engobe and tile some
undesired defects like crazing, peeling, bubbles and crawling can occur.
The reason for crazing and peeling is the thermal expansion mismatch of body
and engobe. There can be two conditions. First condition is if the engobe thermal
expansion is much larger than the substrate ware thermal expansion, crazing occurs on
the surface because of a high difference between the CTE values as illustrated in Figure
2.9.a. The engobe cannot balance the tensile stress so it cracks. If the CTE difference
between them is not too much the shape of the ware is concave. Second condition is
when the engobe thermal expansion is much less than the ware thermal expansion, the
engobe will peel as shown in Figure 2.9.b. This defect is called as peeling or shivering.
Contrary to crazing, a compressive force occurs. And if the CTE difference is less the
ware and engobe can be shaped convex (MEGEP 2007).
A bubble defect occurs during the firing process. After the material in the
engobe or body reacts with each other gases are produced. These gases try to separate
from the surface. If the engobe layer doesn’t permit the exit of the gas, the air bubble
shapes are observed on the surface as shown in Figure 2.9.c. If the viscosity of the
engobe and the temperature rate are decreased, formation of the bubbles can be
prevented (MEGEP 2007).
If the engobe pulls together and the bonding between ware and the engobe
rupture, crawling and tearing defect occurs as in Figure 2.9.d. It is related to lack of
wetting. Therefore, too fine particle size can cause these defects. Decreasing the
thickness of the engobe is a good way not to form crawling and tearing. The surface
should be clear for preventing this defect (Bernardin 2009).

16
Figure 2.9. Typical defects of the engobe a) crazing defect, b) peeling defect, c) bubble
defect and d) crawling and tearing defect (Source: Ceramic art daily 2010).
17
CHAPTER 3
EXPERIMENTAL
In this chapter, the chemical and physical characteristics of raw materials,
methods for making engobes, frit and techniques for characterization of products are
explained. In this thesis a glaze layer was not applied on any of the samples.
3.1. Raw Materials
In this section information on chemical and physical characteristics of the raw
materials are given. The substrate material, which is a commercial roof tile body, was
analyzed for its chemical and physical characteristics in order to collect information to
be used for identifying the composition of the engobe. Because the engobe and the
substrate must fit together during drying and firing processes their CTE values must be
matched.
3.1.1. Roof Tile Body
In this study a commercial roof tile which was in the green state was used as a
substrate for coating with the engobe. Supplier of the green roof tile samples was
Yüksel Toprak A.Ş., Turgutlu, Manisa. Details of the production of these shaped roof
tiles are given in section 3.2. The chemical composition of the roof tile raw material as
measured by XRF (X-Ray Fluorescence, Spectro IQII) is given in Table 3.1. The
measurement was performed on pellets of the raw material prepared by fusion in
platinum crucibles. Particle size distribution, thermal expansion behavior, thermal
gravimetric behavior (TGA) of the raw material along with the color measurement of
the fired roof tiles are given in Chapter IV. The raw material was an aluminosilicate
composition with about 8% Fe which gives the well-known red color to the roof tile.
18
Table 3.1. Chemical analyses (XRF) of the roof tile sample used in this study.
SiO2 Al2O3 Fe2O3 CaO MgO Na2O K2O TiO2 B2O3 P2O5
51.8% 19.1% 7.3% 7.4% 8.4% 1.0% 2.7% 0.6% 0.0% 0.1%
3.1.2. Engobe
Engobe was prepared in two stages. First stage involved the use of higher purity
laboratory grade raw materials while the second stage involved making the engobe with
natural mineral raw materials.
In the first stage of engobe development relatively higher purity analytical grade
oxides were used to eliminate problems from impurities. Therefore. a relatively pure frit
was made in the laboratory to be used. This type of engobe was named HP Engobe.
Once success was achieved with engobe development. lower purity materials were
adapted for production of the engobe. An industrial grade frit (6116 Kalemaden) was
used together with the lower purity engobe. This type of engobe was named LP Engobe
indicating the low purity of its raw materials. Below are given information on the raw
materials used in this study.
As mentioned in Chapter 2. each oxide has different properties like flux.
stabilizer. glass former. For calculations such as CTE. Seger formula. the oxide
composition should be known. In this study the chemical composition of each raw
material was either obtained from their manufacturers or was analyzed by SEM-EDS.
XRF was occasionally also employed for chemical analysis. The chemical analyses of
the raw materials are given in Table 3.2. In addition suppliers of these materials are also
summarized in Table3.3. Compositions of engobes were calculated in order to have
their CTE values equal to or larger than that of the roof tile. This was achieved by
matching the chemistries of the substrate (roof tile) and the engobe. CTE values of roof
tiles and engobes could have been matched by other techniques as well (Eppler and
Eppler 2000).

19
Table 3.2. Chemical analysis of the raw materials.
Raw
Material SiO2 Al2O3 Fe2O3 CaO MgO Na2O K2O TiO2 B2O3 P2O5
Mg(OH) 2* NA NA NA NA 63.6% NA NA NA NA NA
Na2CO3* NA NA NA NA NA 57.5% NA NA NA NA
CaCO3* NA NA NA 55.3% NA NA NA NA NA NA
Borax* 0.0% 0.0% 0.0% 2.4% 0.0% 16.0% 0.0% 0.0% 33.3% 0.0%
Quartz** 99.4% 0.2% NA NA NA 0.1% NA NA NA NA
Feldspar* 70.3% 18.3% NA 0.3% 0.1% 10.5% 0.2% NA NA NA
B. Clay** 51.5% 33.0% 1.7% 0.2% 0.2% 0.1% 0.5% 1.5% 0.0% 0.0%
Dolomite* 7.0% 2.4% 12.3% 30.2% 13.3% 0.0% 0.0% 0.0% 0.0% 0.0%
E. Talc* 54.1% 0.0% 17.2% 5.3% 23.5% 0.0% 0.0% 0.0% 0.0% 0.0%
Ind. Frit** 25.3% 5.3% 0.0% 3.6% 0.0% 9.6% 0.0% 0.0% 56.1% 0.0%
NA: Not Analysed
* Published chemical analysis
** Measured chemical analysis
Table 3.3. Supplier product codes of the raw materials.
Raw material
Product
code No. Supplier
Mg(OH)2 M-8511 Sigma
Na2CO3 106.398.500 Merck (Eksper)
CaCO3 C-3174 Sigma
Borax
(Na2B4O7.10H2O)
Boraks
Dekahidrat
Eti Maden İşletmeleri. Turkey
Quartz Q.75 Kaltun madencilik A.Ş. Çine. Turkey
Feldspar 1005 Akmaden Madencilik A.Ş.. Çine.
Turkey
Ball Clay Mask-I Matel Maden Hammadde A.Ş. Turkey
Dolomite - Boğaziçi A.Ş. Tire. Turkey
Egyptian Talc ET 5 Omya Madencilik. İzmit. Turkey
Ind. Frit 6116 Kale Maden. Turkey
20
3.2. Method
In this thesis an engobe composition in the form of a suspension was prepared
from oxide raw materials and frit. The engobe was applied on the surface of the green
roof tile using a high pressure spray system. Details are provided below. This type of
coating system is the most widely adapted technique in the industry.
Roof tile samples used in this study were made by Yüksel Toprak A.Ş.
Therefore. more information about the manufacture of roof tiles is given in this section.
Turgutlu is very rich in clayey raw material for roof tile which are brought to the factory
by trucks (Yanık 2003). Conveyor belts carry the raw material within the factory
through a number of machines that either sort out large pieces of rock or compress large
chunks of earth to reduce the particle size to less than 3 mm. Some homogenization is
also achieved in the process. Before being fed to the extruder (a.k.a. vacuum press)
some moisture is added to the raw material to adjust the moisture to roughly 18-24%.
The mud should be vacuumed before extrusion or else air packets in the product will
explode during firing. harming the product. Once the roof tile is extruded out and
shaped in presses into molds they are stacked in racks to dry them for extended periods
of time depending on the humidity in the air. A major portion of the total shrinkage of
the product occurs during drying while little shrinkage occurs during firing. Drying
process must be slow to allow shrinkage without cracking. In Figure 3.1 the processing
details are illustrated step by step.
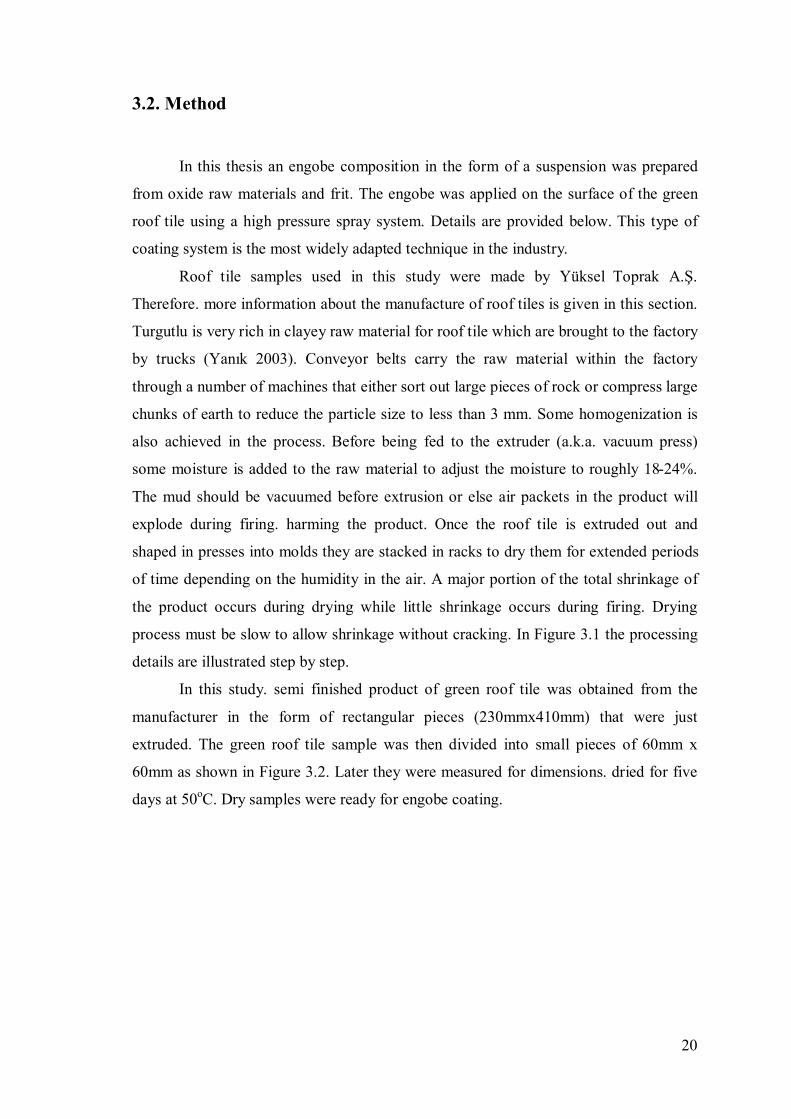
In this study. semi finished product of green roof tile was obtained from the
manufacturer in the form of rectangular pieces (230mmx410mm) that were just
extruded. The green roof tile sample was then divided into small pieces of 60mm x
60mm as shown in Figure 3.2. Later they were measured for dimensions. dried for five
days at 50oC. Dry samples were ready for engobe coating.

21
Figure 3.1. Manufacturing of roof tiles
(Source: Wienerberger 2009).
Figure 3.2. Green roof tile samples that were wire-cut.
Engobe Mixture Preparation:
In Figure 3.3 the processing of engobe in İYTE Mechanical Engineering.
ceramic laboratory is shown. For calculation of a proper engobe composition a MS
Excel worksheet was formulated. The oxide percentage of each raw material was fed to
this worksheet. Engobe compositions were prepared by adding 10-30wt% frit to the
engobe. The frit supplied low-melting and water insoluble components to the engobe.
The production of frit and engobe in the laboratory are explained step by step below.

22
Figure 3.3. Flow chart for engobe production.
First step was making the lab frit. The most important mineral for frit was borax
because it has low melting temperature. For this reason three different trials were done
by changing the percentage of the B2O3 in the frit composition. Three different frit
samples were prepared with 14%. 18% and 22% B2O3 as shown in Tables 3.4-6.
Chemical compositions of these frits were almost identical apart from their B2O3
contents. Frit mixtures were weighed into a high density alumina crucible before being
23
heated at 10oC/min of heating rate to 1200
oC at which it was soaked for 2 hours as
shown in Figure 3.4.a. Later they were poured into cold water in order to produce glass
as illustrated in Figure 3.4.b. The high cooling rate during rapid cooling in water was
sufficient to produce completely amorphous glass with good homogeneity. All frits
were ground in Fritsch Pulverisette 6 planetary ball mill machine as illustrated in Figure
3.5 to convert them into fine powder form. 50 grams of frit was ground in 250ml
tungsten carbide pot with 24 tungsten carbide balls of 10 mm diameter.
Table 3.4. Composition of lab frit containing 14% B2O3.
Chemical Composition of RawMaterials
SiO2 Al2O3 Fe2O3 CaO MgO Na2O K2O TiO2 B2O3 P2O5
45.6% 9.6% 0.0% 6.6% 0.0% 24.0% 0.1% 0.0% 14.0% 0.0%
Table 3.5. Composition of lab frit containing 18% B2O3.
Chemical Composition of RawMaterials
SiO2 Al2O3 Fe2O3 CaO MgO Na2O K2O TiO2 B2O3 P2O5
42.0% 8.8% 0.0% 6.0% 0.0% 24.7% 0.1% 0.0% 18.2% 0.0%
Table 3.6. Composition of lab frit containing 22% B2O3.
Chemical Composition of RawMaterials
SiO2 Al2O3 Fe2O3 CaO MgO Na2O K2O TiO2 B2O3 P2O5
38.6% 8.1% 0.0% 5.6% 0.0% 25.3% 0.1% 0.0% 22.3% 0.0%
After making the frit the next step was to find out which laboratory frit was
suitable for the proper engobe composition. As shown in the flowchart in Figure 3.6.
two different frits were used in this thesis. First frit was produced in the lab (Lab Frit)
while the second was an industrially available frit (Industrial Frit).

24
Figure 3.4. Making of frit a) melting in box kiln and b) quenching in water.
Figure 3.5. Fritsch Pulverisette 6 planetary ball mill for dry grinding.

25
The grinding process of the engobe was the same for all samples and the same
procedure with frit was used for size reduction. After grinding. a 50wt% suspension of
engobe and the colorant oxides was prepared in water. The purpose was to produce a
stable and homogenous aqueous suspension of engobe that could be sprayed onto the
roof tile surface effectively. A compressor was used to deliver pressurized air for
spraying the engobe through a nozzle. The pressure was adjusted at about 3-4 bars. As
shown in Figure 3.7. the distance between the gun and the sample was about 50 cm to
avoid uneven surface coating.
Figure 3.6. The use of raw materials for different frit and engobe production.

26
Figure 3.7. Application of engobe with a spray gun.
Variable amounts of colorants (metal oxides) were used in order to get different
hues and colors. Before spraying onto the roof tile surface. the engobe suspensions were
blended in the low speed lab type tumbling ball mill in a cylindrical plastic container for
one hour at 30 rpm (Figure 3.8). There were a total of 8 pieces of balls with 12mm of
diameter in the container to help with blending. The ball mill was not used for size
reduction of the powder but was rather used for homogenization of the powder.
Figure 3.8. Lab type tumbling ball mill.

27
HP engobe:
High purity (HP) engobe was made by using high purity raw materials in order
to adjust the oxide percentages easily. The percentages of quartz. feldspar. ball clay. lab
frit. CaCO3 used in the HP engobes were calculated. Therefore the engobe trials that
contained 5%wt frit were made according to the chemical analysis of the substrate.
Only the percentage of B2O3 was changed for each HP engobe as shown in Table 3.7.
The following sample coding system was used in this thesis: EHP-14LF indicates a
High Purity Engobe prepared with 14% B2O3 Lab Frit. Another example would be
EHP-18LF meaning that High Purity Engobe prepared with 18% B2O3 Lab Frit.
Table 3.7. Chemical compositions of the HP engobe samples.
No SiO2 Al2O3 Fe2O3 CaO MgO Na2O K2O TiO2 B2O3 P2O5
EHP-14LF 61.0% 22.5% 0.8% 8.7% 0.1% 4.9% 0.3% 0.7% 0.9% 0.0%
EHP-18LF 60.9% 22.6% 0.8% 8.7% 0.1% 4.6% 0.3% 0.7% 1.2% 0.0%
EHP-22LF 60.8% 22.4% 0.8% 8.7% 0.1% 4.6% 0.3% 0.7% 1.5% 0.0%
In the third stage a number of sample sets of different engobe compositions with
different percentages of SiO2. Al2O3 and (Na2O+K2O) were prepared as shown below.
These tests were designed in a triangular plot to investigate the most suitable engobe
composition (Figures 3.9-11). This triangular plot was created by neglecting all
components except SiO2. Al2O3 and (Na2O+K2O) because these three are already the
most abundant of all. A small amount of error is expected in these compositions since
only these three are taken into consideration in setting up the different compositions.
Such plots are useful in locating the best compositions for such studies. In addition. the
experiments were done by changing the percentages of the lab frit to observe its effect
on engobe formation. In all these tests the lab frit that was added to the engobe
contained 18% B2O3. Samples are coded in such a way to indicate their lab frit contents.
For example. sample coded EHP1-10 was prepared by mixing approximately 70%SiO2
+ 20%Al2O3 + 10% (Na2O+K2O). The meaning of the EHP1-10 code is the first sample
of high purity engobe with 10%w lab frit which contains 18% B2O3. In Tables 3.8-10
the overall chemical compositions of the final engobe including the frit are given.

28
Figure 3.9. Engobe samples according to SiO2-Al2O3-(Na2O+K2O) triangle design for
10%wt lab frit. B2O3 content of the lab frit was 18% for this design.
Table 3.8 Engobe compositions for 10%wt lab frit
No SiO2 Al2O3 Fe2O3 CaO MgO Na2O K2O TiO2 B2O3 P2O5
E1/10 62.9% 17.9% 0.5% 8.1% 0.1% 7.5% 0.2% 0.4% 2.3% 0.0%
E2/10 72.7% 9.1% 0.0% 8.2% 0.0% 7.6% 0.1% 0.0% 2.2% 0.0%
E3/10 54.0% 27.2% 1.2% 8.4% 0.1% 5.3% 0.4% 1.0% 2.4% 0.0%
E4/10 67.7% 17.0% 0.8% 7.9% 0.1% 3.2% 0.3% 0.7% 2.3% 0.0%
E5/10 51.5% 30.5% 1.5% 8.4% 0.2% 3.5% 0.5% 1.3% 2.5% 0.0%
29
Figure 3.10. Engobe samples according to SiO2-Al2O3-(Na2O+K2O) triangle design for
20%wt lab frit. B2O3 content of the lab frit was 18% for this design.
EHP4-20. EHP4-20 cannot be obtained with the desired composition
(SiO2+Al2O3+Na2O+K2O=100%). The amount of the Na2O is come from frit. So the
decreasing the percentage of the Na2O cannot be achieved.
Table 3.9 Engobe compositions for 20%wt lab frit.
No SiO2 Al2O3 Fe2O3 CaO MgO Na2O K2O TiO2 B2O3 P2O5
E1/20 63.8% 15.5% 0.5% 7.2% 0.1% 8.1% 0.2% 0.4% 4.1% 0.0%
E2/20 71.1% 8.9% 0.2% 8.3% 0.0% 7.0% 0.1% 0.2% 4.1% 0.0%
E3/20 50.5% 25.2% 1.1% 7.9% 0.1% 7.3% 2.3% 1.0% 4.6% 0.0%
30
Figure 3.11. Engobe samples according to SiO2-Al2O3-(Na2O+K2O) triangle design for
30%wt lab frit. B2O3 content of the lab frit was 18% for this design.
Table 3.10 Engobe compositions for 30%wt lab frit.
No SiO2 Al2O3 Fe2O3 CaO MgO Na2O K2O TiO2 B2O3 P2O5
E1/30 57.1% 16.3% 0.5% 7.7% 0.1% 11.2% 0.2% 0.4% 6.5% 0.0%
E2/30 66.8% 8.4% 0.2% 7.9% 0.0% 9.8% 0.1% 0.2% 6.5% 0.0%
E3/30 49.2% 23.9% 1.0% 7.9% 0.1% 9.7% 0.3% 0.9% 6.9% 0.0%
LP engobe:
Last step was done by using natural minerals and the industrial frit instead of
making lab. frit that was prepared with high purity materials. Different percentages of
feldspar. ball clay. quartz. dolomite. talc and industrial frit were used in this stage.
These raw materials were all available in tonnage quantities at reasonable prices. These
samples were prepared by first mixing in powder form of almost 70%SiO2. 20%Al2O3
and 10% (Na2O+K2O) and then by adding 12 and 32% of industrial frit to these blends.
The engobe composition that contained 12%wt industrial frit is named ELP-IF-12. The

31
other one is named ELP-IF-32. Compositions of mixtures using low purity raw
materials and industrial frit are given in Table 3.11.
Table 3.11. Oxide compositions of LP engobe.
No SiO2 Al2O3 Fe2O3 CaO MgO Na2O K2O TiO2 B2O3 P2O5
ELP-IF-12 51.5% 14.4% 6.2% 7.3% 7.4% 5.0% 0.2% 0.3% 7.6% 0.0%
ELP-IF-32 43.4% 11.0% 6.3% 7.0% 7.7% 5.0% 0.1% 0.3% 19.1% 0.0%
For investigating the effect of grinding speed and frit addition on final product
quality some experiments were done as given in Table 3.12.
Table 3.12. Experiments for different grinding RPM and time.
No
Ind.
Frit
Grinding
SiO2* Al2O3* Na2O+K2O* RPM Time (min.)
ELP-IF-12 72.6% 20.3% 7.4% 12.0% 400 10
ELP-IF-32 72.9% 18.5% 8.6% 32.0% 400 10
ELP-IF-12-G200 72.6% 20.3% 7.4% 12.0% 200 10
ELP-IF-32-G200 72.9% 18.5% 8.6% 32.0% 200 10
*(SiO2+Al2O3+NaO2+K2O=100%)
The effect of 5wt% addition of colorant oxides to an engobe sample (see sample
ELP-IF-12. ELP-IF-32) were also studied. Cr. Mn. Ti. Fe. Co and Cu oxides were used
as colorants.
3.2.1. Drying and Firing
After applying the engobe. the products were dried at ambient conditions for 3
days. If they were not dried well. cracks could occur during firing. Firing time and
temperature affect the formation and maturation of the engobe. Many chemical
reactions occur at this stage. Therefore. a great deal of defects results from these
chemical reactions. The products were fired in a Protherm PLF160/5 laboratory furnace.
The firing conditions are given in Table 3.13.
32
Table 3.13. Engobe compositions for different firing temperatures.
Ind. Grinding Firing
No SiO2* Al2O3* Na2O+K2O* Frit RPM Time Temp. Time
ELP-IF-12 72.6% 20.3% 7.4% 12% 400 10min. 1000°C 75min.
ELP-IF-32 72.9% 18.5% 8.6% 32% 400 10min. 1000°C 75min.
ELP-IF-12-970 72.6% 20.3% 7.4% 12% 400 10min. 970°C 75min.
ELP-IF-32-970 72.9% 18.5% 8.6% 32% 400 10min. 970°C 75min.
ELP-IF-12-1030 72.6% 20.3% 7.4% 12% 400 10min. 1030°C 75min.
ELP-IF-32-1030 72.9% 18.5% 8.6% 32% 400 10min. 1030°C 75min.
ELP-IF-12-150 72.6% 20.3% 7.4% 12% 400 10min. 1000°C 150min.
ELP-IF-32-150 72.9% 18.5% 8.6% 32% 400 10min. 1000°C 150min.
*(SiO2+Al2O3+NaO2+K2O=100%)
3.2.2. Characterization
In order to obtain particle size distribution of engobe powder Sieve Analysis
(ASTM C136) was made. Particle size distribution analysis of the roof tile raw material
was made by a Laser Scattering Particle Size Analyzer (Malvern Instruments). The
phase analyses of prepared engobes are investigated by powder XRD (X-Ray
Diffraction) using Philips X’pert Difractometer with Cu-K radiation at 45kV. Also
Phlilps XL-30S FEG Scanning Electron Microscope and Nikon L-150 Optical
Microscope were used. The samples for SEM and OM were polished before analysis to
observe the thickness of the engobe and its penetration and bonding to roof tile.
The thermal expansions of the samples were measured by using Linseis
Dilatometer. For this analysis the powder engobe samples were pressed into a small
pellet whose diameters were 15 mm. In order to prevent cracks 1wt% of PVA was
added. Later they were fired at 800°C with 10°C/min rate for 75 minutes not to melt and
deteriorate their shape. After firing they were cut into 6x6x12mm rectangular prisms.
The CTE of the samples were measured at 600°C with 10°C/min rate.
Color measurements of the samples were done by using a spectrophotometer
instrument (Spectrocam. Avantes). In addition the powder density was measured by
using pycnometer.

33
Besides these analyses. temperature cycling resistance test was applied. The
soaked products were heated to 185oC for 4 hours. Later they were quenched in 20oC
water (B. Karasu & E. Gerede). This process was made to observe how the response of
product against climate changes would be. Later the cracks on the surface were
investigated.
For the acid resistance 5% NaOH. 5% H2SO4. 5% HCl. 5% HNO3 solutions
were applied on the surface of the engobes for a week. Later the surfaces were
investigated.
Qualitative scale:
A qualitative scale was proposed and used in this thesis to evaluate the success
of the engobe coating on the roof tile samples. The following basic quality criteria were
used: cracks. degree of bonding. degree of vitrification. color and aesthetically pleasing.
Each of these criteria was issued different levels.
The crack. for example. was identified as many. moderate or no. depending on
the frequency of observation of the cracks. as well as their sizes.
o Many: If there are large cracks or if the cracks are small but count more than
10 per 4 cm2. it is in the many group.
o Moderate: If the number of cracks is between five and ten per 4 cm2. the
engobe is placed in the moderate group.
o No: Engobe has no crack at all.
For estimating the degree of bonding of the engobe. the surface was scratched
with a sharp tool about 1 cm.
o Good: If the engobe is not scraped from the surface or the length of the
scratch is less than 3 mm. it is labeled as good.
o Average: If the length of the scratch is between 3 and 6 mm. it is named as
average.
o Poor: If the surface is significantly affected more than 6 mm by the sharp
steel tool. it is located in the poor group.
The degree of vitrification is classified in two groups.
o Transparent: If the surface of the roof tile (red color) can be seen the engobe
is transparent.
o Opaque: If not it is opaque.

34
The color is determined according to the whiteness of the surface such as well or
poor. It was defined according to percentage of the Fe2O in the composition.
o Well: If the percentage of the Fe2O is smaller than 1%. the color of the
engobe is well.
o Poor: If not. the color of the engobe is specified as poor.
The aesthetic appearance is used as a general criteria to name the quality of the
coating by comparing the samples according to the bubbles on the surface.
o Good: If the number of the bubbles on the surface doesn’t exceed 2 per 4
cm2. the aesthetic appearance of engobe is determined as good.
o Average: If the number is between 2 and 6 per 4 cm2. it is labeled as average.
o Poor: In other cases the engobe is named as poor.

35
CHAPTER 4
RESULTS AND DISCUSSION
In this chapter results of experimental studies on the production and application
of engobe on roof tile are given. First the findings on the roof tile are given and then
those for the engobe and frit are presented and discussed.
4.1. Roof Tile
The roof tile was a commercial product with the composition (Table 3.1) which
was presented in section 3.1. In this section particle size distribution (PSD) analysis
(Figure 4.1), the thermal expansion (dilatometric) behavior (Figure 4.2), color analysis
(Figure 4.3), XRD analysis (Figure 4.4), and TGA analysis (Figure 4.5) results are
given. The average particle size (D50) of the roof tile was 16 µm. Thermal expansion
coefficient of the roof tile was found to be 8 x10⁻⁶
1/oC according to the Figure 4.2.
Color data of the roof tile are L = 42.72, a = 21.00, b = 24.07. Location of the roof tile
color is also shown in Figure 4.3. The color of the roof tile was red because of the Fe in
the roof tile. According to XRF data (Table 3.1) the roof tile was very rich in SiO2 and
Al2O3. When the roof tile was heated up to 1000oC the weight loss of the roof tile was
about 18% according to TGA analysis. The reason of the weight loss can be the removal
of physical water from the tile up to 100oC, oxidation / burning of the organic
compounds, loss of CO2 from calcite and loss of chemically bound water from clay
minerals like illite and kaolinite (Yanık 2003).

36
Figure 4.1. Particle size distribution (PSD) analysis as measured by Laser Scattering
technique.
Figure 4.2. Thermal expansion behavior of the roof tile as measured by dilatometer.
37
Figure 4.3. Location of the roof tile color on L – b – a diagram.
Figure 4.4. XRD analysis of the roof tile as measured by CuK radiation.

38
Figure 4.5. TGA analysis of the roof tile.
4.2. Characterization of the Raw Materials Used in Engobe
Results of characterization of each material which was used for making engobes
and frit are given below. The chemical analysis of the raw materials was given in
Chapter 3.1 so they are not given in this part.
Quartz (SiO2):
Quartz, which is a source of highly pure SiO2, is abundantly available on earth at
low cost. It was used as the major component of the engobe and frit compositions. The
SEM image of the quartz is also given in Figure 4.6.

39
Figure 4.6. SEM image of the Quartz.
The sodium feldspar (Akmaden code 1005):
The color of the feldspar is an indication of its impurity content. The higher the
amount of impurities like Fe and Ti, the darker is the color from white to pale or darker
brown. Sodium feldspar with a code number 1005 was white due to its high purity. The
published average particle size of the powder was 30 µm (Çine Akmaden Catalog
2009). SEM image and XRD analysis pattern are illustrated in Figures 4.7-8. As the
name implies, it consists of mainly sodium feldspar and XRD results also confirmed
this.
Figure 4.7. SEM image of the Sodium Feldspar 1005.
40
Figure 4.8. XRD analysis of the Sodium Feldspar 1005.
Ball clay :
This clay contains some iron and titanium which can change the color of the
engobe as in Figure 4.9 (Table 3.2). LOI (loss on ignition) value of the clay is
approximatelly 12% (Matel 2009). In addition, the SEM image and XRD analysis of the
mineral are presented in Figures 4.10 and 4.11. According to XRD results the material
obtained was good quality clay with more kaolinite than quartz.
Figure 4.9. Ball clay.

41
Figure 4.10. SEM image of the ball clay.
Figure 4.11. XRD analysis of ball clay.
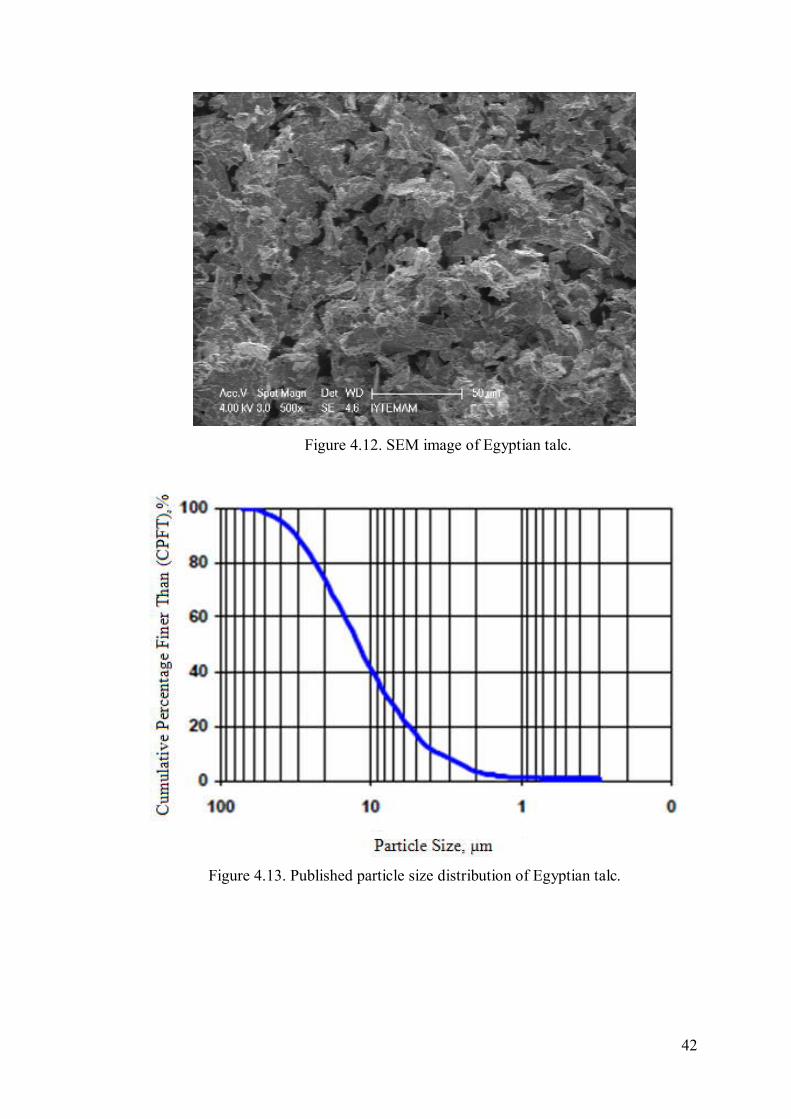
Egyptian Talc:
The published average particle size of the Egyptian talc (Omya A.Ş., İzmir) was
13 µm. Also the percentage of powder finer than 2 µm was 3.2%. SEM image, the
particle size distribution and XRD analysis are given in Figures 4.12-14.
42
Figure 4.12. SEM image of Egyptian talc.
Figure 4.13. Published particle size distribution of Egyptian talc.

43
Figure 4.14. XRD analysis of Egyptian talc.
Dolomite:
Dolomite is named as double carbonate mineral of calcium and magnesium
therefore it is one of the most widely used mineral for making engobe (Eppler 2000).
Figure 4.15 shows SEM image and Figure 4.16 illustrates XRD analysis of the mineral.
Figure 4.15. SEM image of Dolomite.
44
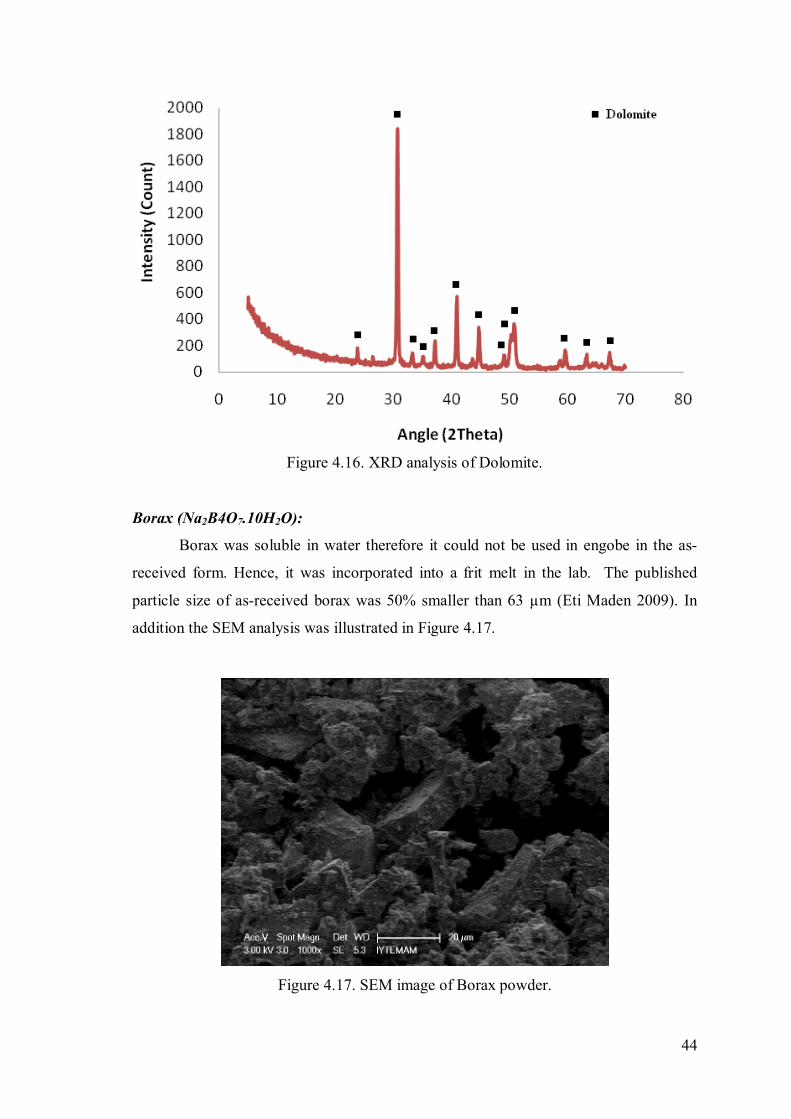
Figure 4.16. XRD analysis of Dolomite.
Borax (Na2B4O7.10H2O):
Borax was soluble in water therefore it could not be used in engobe in the as-
received form. Hence, it was incorporated into a frit melt in the lab. The published
particle size of as-received borax was 50% smaller than 63 µm (Eti Maden 2009). In
addition the SEM analysis was illustrated in Figure 4.17.
Figure 4.17. SEM image of Borax powder.
45
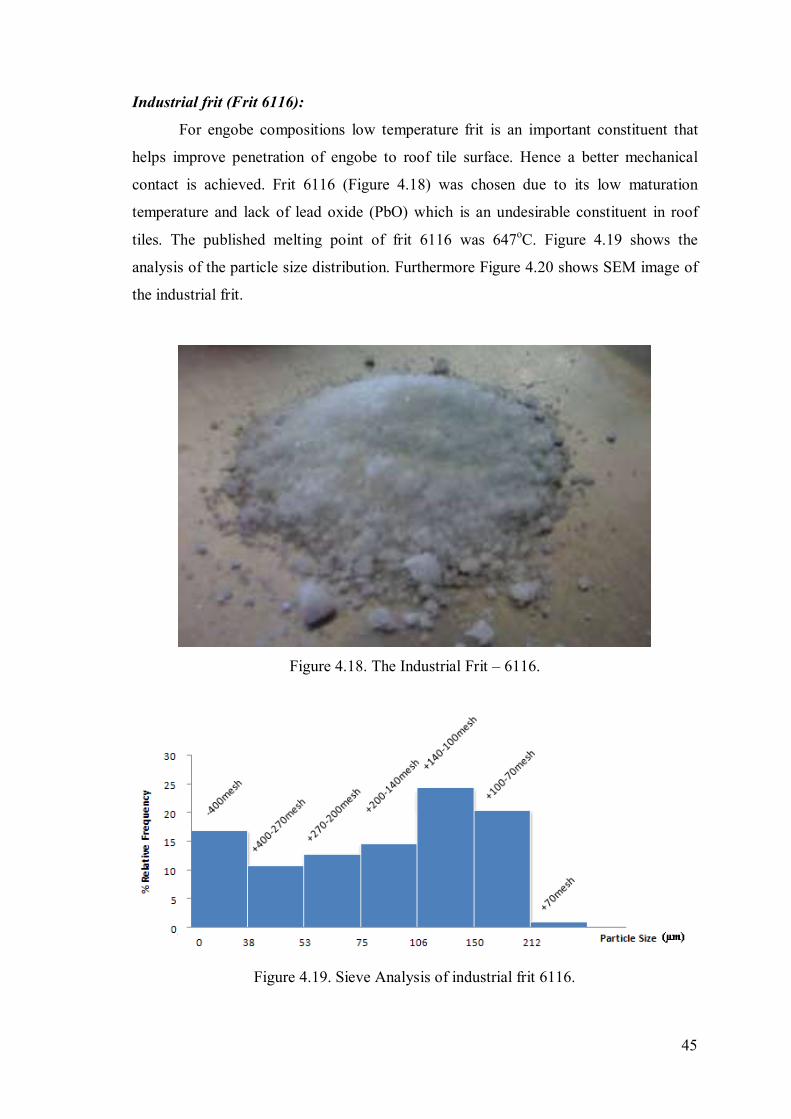
Industrial frit (Frit 6116):
For engobe compositions low temperature frit is an important constituent that
helps improve penetration of engobe to roof tile surface. Hence a better mechanical
contact is achieved. Frit 6116 (Figure 4.18) was chosen due to its low maturation
temperature and lack of lead oxide (PbO) which is an undesirable constituent in roof
tiles. The published melting point of frit 6116 was 647oC. Figure 4.19 shows the
analysis of the particle size distribution. Furthermore Figure 4.20 shows SEM image of
the industrial frit.
Figure 4.18. The Industrial Frit – 6116.
Figure 4.19. Sieve Analysis of industrial frit 6116.

46
Figure 4.20. SEM image of industrial frit 6116.
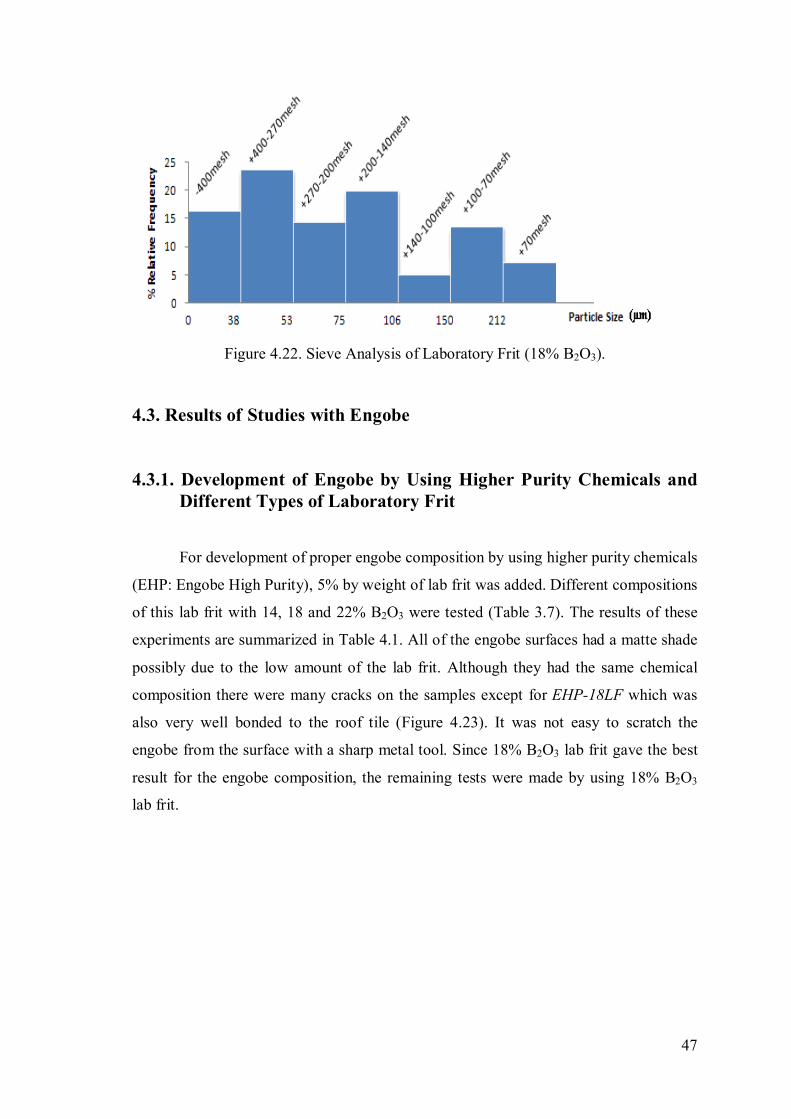
Lab frit:
Three different frits were made in the lab. They contained 14, 18 and 22% B2O3.
All three of them were used in engobe compositions but the lab frit with 18% B2O3 was
the most suitable for the engobe as illustrated in Figure 4.21. Therefore the sieve
analysis of the lab frit with 18% B2O3 is given in Figure 4.22.
Figure 4.21. The Laboratory Frit (18% B2O3) removed from water was glassy.
47
Figure 4.22. Sieve Analysis of Laboratory Frit (18% B2O3).
4.3. Results of Studies with Engobe
4.3.1. Development of Engobe by Using Higher Purity Chemicals and
Different Types of Laboratory Frit
For development of proper engobe composition by using higher purity chemicals
(EHP: Engobe High Purity), 5% by weight of lab frit was added. Different compositions
of this lab frit with 14, 18 and 22% B2O3 were tested (Table 3.7). The results of these
experiments are summarized in Table 4.1. All of the engobe surfaces had a matte shade
possibly due to the low amount of the lab frit. Although they had the same chemical
composition there were many cracks on the samples except for EHP-18LF which was
also very well bonded to the roof tile (Figure 4.23). It was not easy to scratch the
engobe from the surface with a sharp metal tool. Since 18% B2O3 lab frit gave the best
result for the engobe composition, the remaining tests were made by using 18% B2O3
lab frit.
48
Figure 4.23. Photograph of the engobe samples with different kinds of lab frit.
Table 4.1. Properties of the engobe samples prepared by different percentages of lab
frit.
No
Presence of
cracks
Degree of
bonding
Degree
of
vitrifying Color
Aestatically
pleasing
Ma
ny
Mo
da
rate
No
Po
or
Ave
rage
Goo
d
Tra
nsp
are
nt
Opa
qu
e
Po
or
Wel
l
Po
or
Ave
rage
Goo
d
EHP-14LF + + + + +
EHP-18LF + + + + +
EHP-22LF + + + + +
4.3.2. HP Engobes (EHP)
Once the 18% B2O3 containing frit was chosen as the best frit, it was added in
different proportions to different engobe compositions in eleven different HP engobe
samples. Each composition contained different weight percentages of SiO2, Al2O3,
(Na2O+K2O). Results of these tests are given in Table 4.2. The quality rating of the fit
of the engobe on roof tile was graded in discrete qualitative levels.
According to Table 4.2 transparency of the engobe was parallel to the percentage
of the lab frit in the engobe. Because frit encourages glass formation (vitrification) that
gives a transparent shade to the engobe (Figures 4.24-26). Besides engobe and roof tile
interface was stronger because the melting point of the engobe decreases with
49
increasing proportion of lab frit which in turn produces a more fluid and more
penetrating engobe at high temperature.
In addition ball clay was used as an alumina source in the engobe compositions.
Therefore the color of the HP engobe became darker when the amount of the alumina
was increased as shown in Figure 4.27. The change in color depends on the amount of
Fe2O3 in the ball clay.
EHP1-10 (High purity engobe sample number 1 containing 10% lab frit that has
18% B2O3) and EHP1-30 engobe samples gave the best results with a good bond and
smooth surface. For engobe sample number 1 the reader is referred to Figure 3.9 and
3.11.
Table 4.2. Properties of the HP engobe samples.
No
Presence of
cracks
Degree of
bonding
Degree
of
vitrifying Color
Aestatically
pleasing
Ma
ny
Mo
da
rate
Non
e
Po
or
Ave
rage
Goo
d
Tra
nsp
are
nt
Op
aq
ue
Po
or
Wel
l
Po
or
Ave
rage
Goo
d
EHP1-10 + + + + +
EHP2-10 +
+ + + +
EHP3-10 + + + +
+
EHP4-10 +
+ + + +
EHP5-10 + +
+ + +
EHP1-20 + + + + +
EHP2-20
+ +
+ + +
EHP3-20 + +
+ +
+
EHP1-30 + + + +
+
EHP2-30 + + + +
+
EHP3-30 +
+
+ +
+
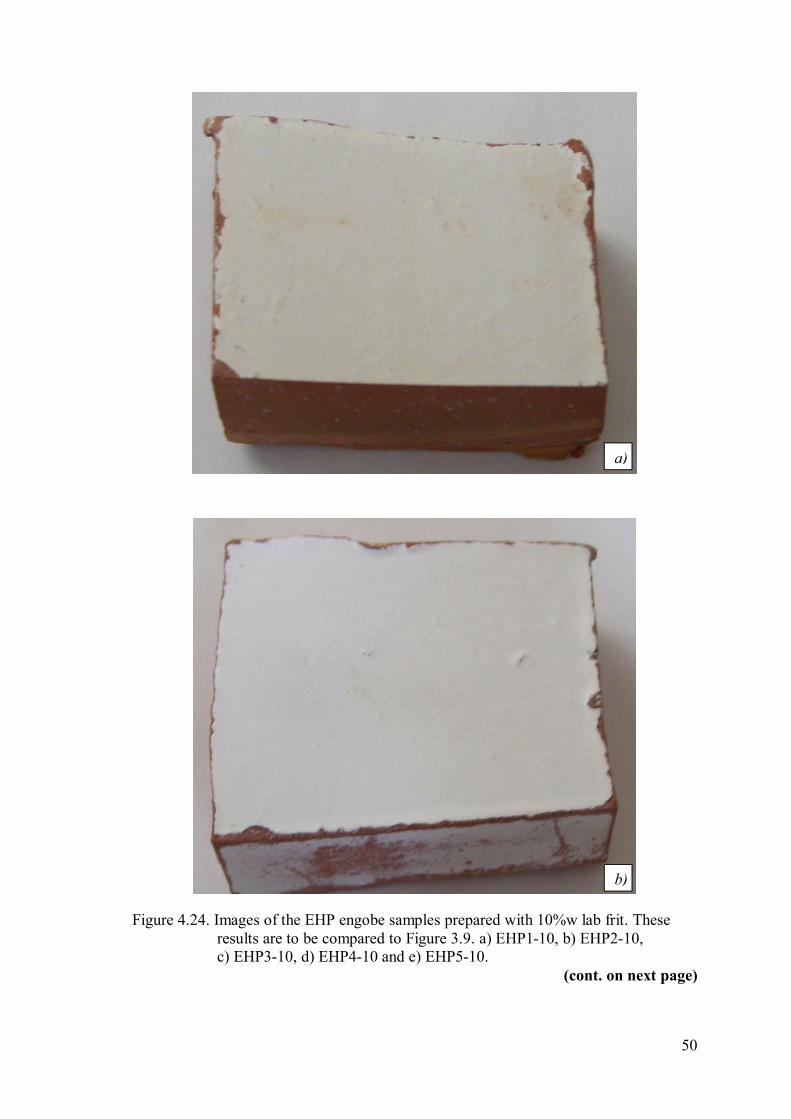
50
Figure 4.24. Images of the EHP engobe samples prepared with 10%w lab frit. These
results are to be compared to Figure 3.9. a) EHP1-10, b) EHP2-10,
c) EHP3-10, d) EHP4-10 and e) EHP5-10.
(cont. on next page)
a)
b)
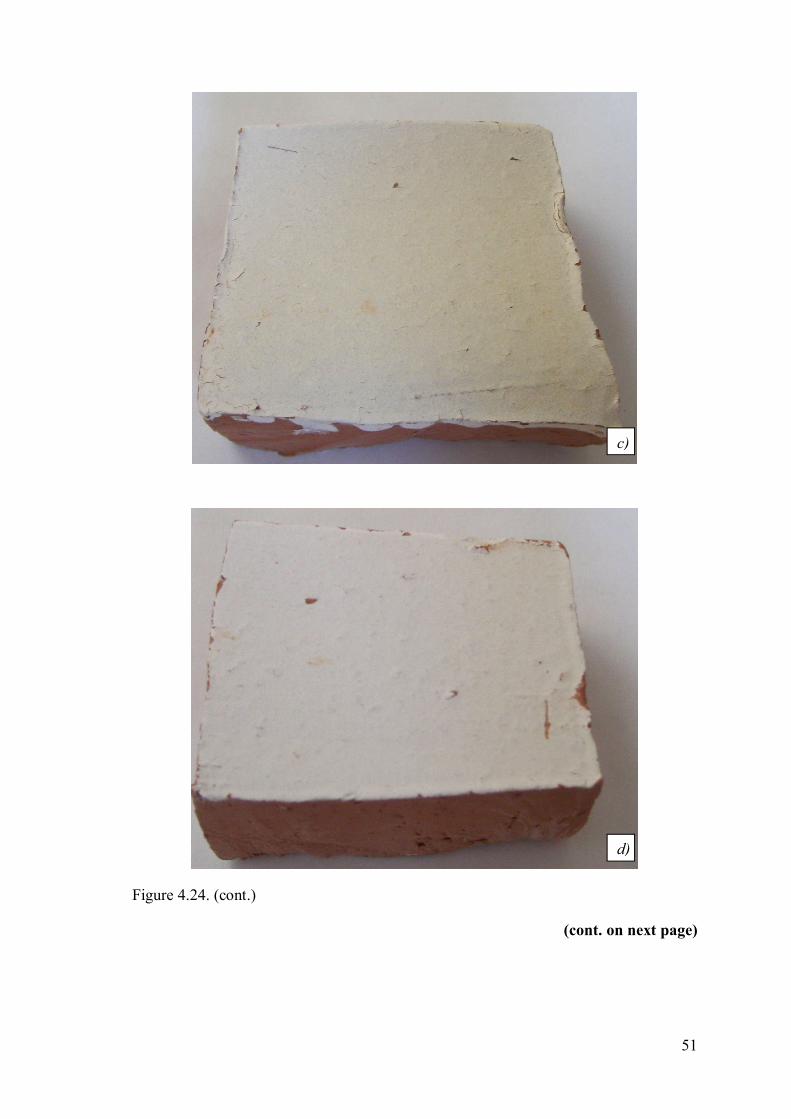
51
Figure 4.24. (cont.)
(cont. on next page)
c)
d)

52
Figure 4.24. (cont.)
Figure 4.25. Image of the HP engobe samples prepared with 20%w lab frit. These
results are to be compared to Figure 3.10. a)EHP1-20, b) EHP2-20 and
c) EHP3-20
(cont. on next page)
a
)
e)
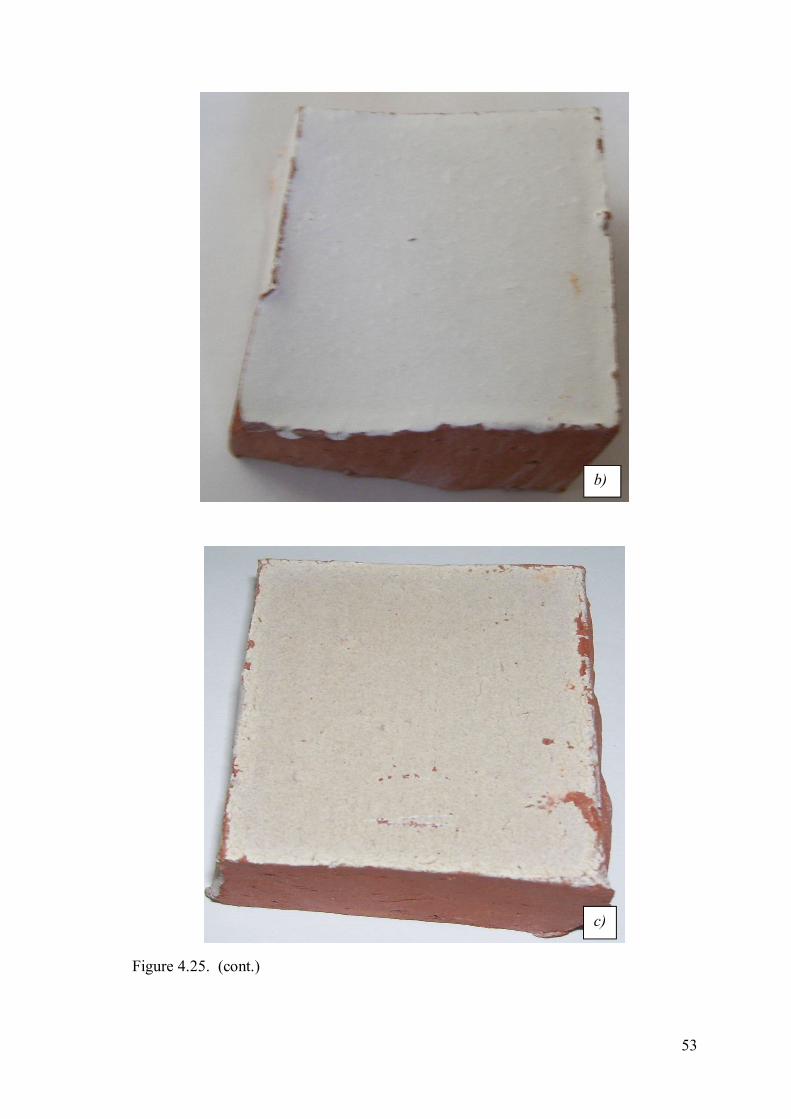
53
Figure 4.25. (cont.)
b)
c)

54
Figure 4.26. Image of the HP engobe samples prepared with 30%w lab frit. These
results are to be compared to Figure 3.11. a)EHP1-30, b) EHP2-30,
c) EHP3-30
(cont. on next page)
a)
b)

55
Figure 4.26. (cont.)
Figure 4.27. All EHP samples laid out on a triangular plot for comparison. The effects
of the oxides and frit to the HP engobe can be seen here.
Thermal expansion of each engobe was calculated to analyze the fitting of the
engobe and roof tile because thermal expansion is one of the most effective properties
for elimination of defects. So, the CTE values of EHP1-10 (Figure 4.28) and EHP1-30
(Figure 4.29) were measured. The slope of the curve shows the CTE of the material.
c)
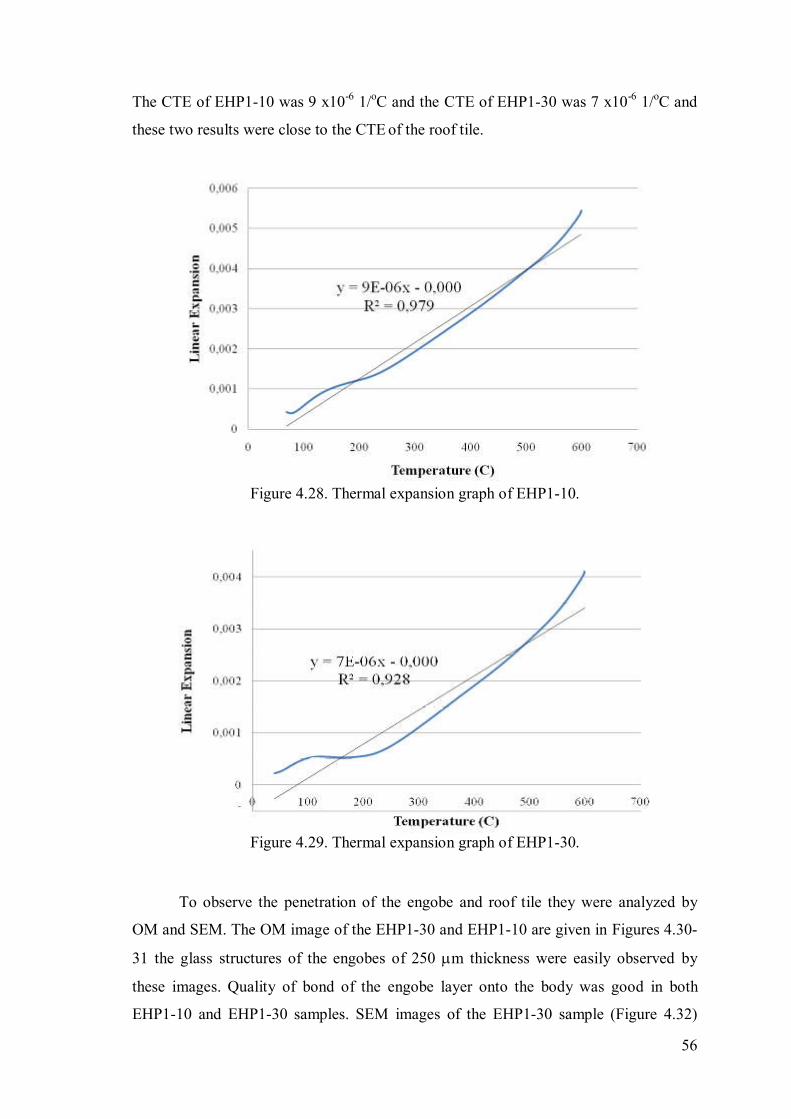
56
The CTE of EHP1-10 was 9 x10⁻⁶
1/oC and the CTE of EHP1-30 was 7 x10
-6 1/
oC and
these two results were close to the CTE of the roof tile.
Figure 4.28. Thermal expansion graph of EHP1-10.
Figure 4.29. Thermal expansion graph of EHP1-30.
To observe the penetration of the engobe and roof tile they were analyzed by
OM and SEM. The OM image of the EHP1-30 and EHP1-10 are given in Figures 4.30-
31 the glass structures of the engobes of 250 m thickness were easily observed by
these images. Quality of bond of the engobe layer onto the body was good in both
EHP1-10 and EHP1-30 samples. SEM images of the EHP1-30 sample (Figure 4.32)

57
showed that engobe was glassy and well attached to the roof tile body. The roof tile
part was horizontal due to the extrusion effect of the shaping.
Figure 4.30. The OM image of the EHP1-10.
Figure 4.31. The OM image of the EHP1-30.

58
Figure 4.32. The SEM image of the EHP1-30. Roof tile body was well bonded to the
engobe layer which was glassy.
The XRD results of the EHP1-10 and EHP1-30 are given in Figures 4.33-34.
Figure 4.33. XRD analysis of EHP1-10.

59
Figure.4.34. XRD analysis of EHP1-30.
4.3.3. Low Purity Engobe (ELP)
Two EHP samples were identified as the best engobe samples above. These
same engobe compositions were this time tried to be made from low purity raw
materials and industrial frit to produce a reasonably low cost product that may have
potential for marketing in roof tile industry. ELP engobe samples were prepared from
compositions with 12% and 32% of industrial frit (IF). ELP-IF-12 was the low purity
engobe equivalent of EHP1-10 and ELP-IF-32 was the low purity version of EHP1-30.
The average density of the ELP-IF-12 sample in powder form was 2.62 g/cm3 and for
the ELP-IF-32 sample it was 2.65 g/cm3 these measurements were done with a
pycnometer. Weights of 1 liter 50% solids suspensions of the ELP-IF-12 and ELP-IF-32
were 1370 and 1400g, respectively.
Viscosity of the fluid was also analysed. The engobe suspensions were non-
newtonian because they did not have a constant viscosity independent of the shear rate.
Viscosity of the engobe suspension decreased with increasing shear rate. So, both ELP-
IF-12 and ELP-IF-32 had shear thinning rheologies which was desirable during spray
coating process.
The particle size and its distribution are important because they affect the
rheological behavior of the engobe suspension and the firing behavior of the engobe.
This latter factor helps improve penetration of the engobe to the roof tile during firing.
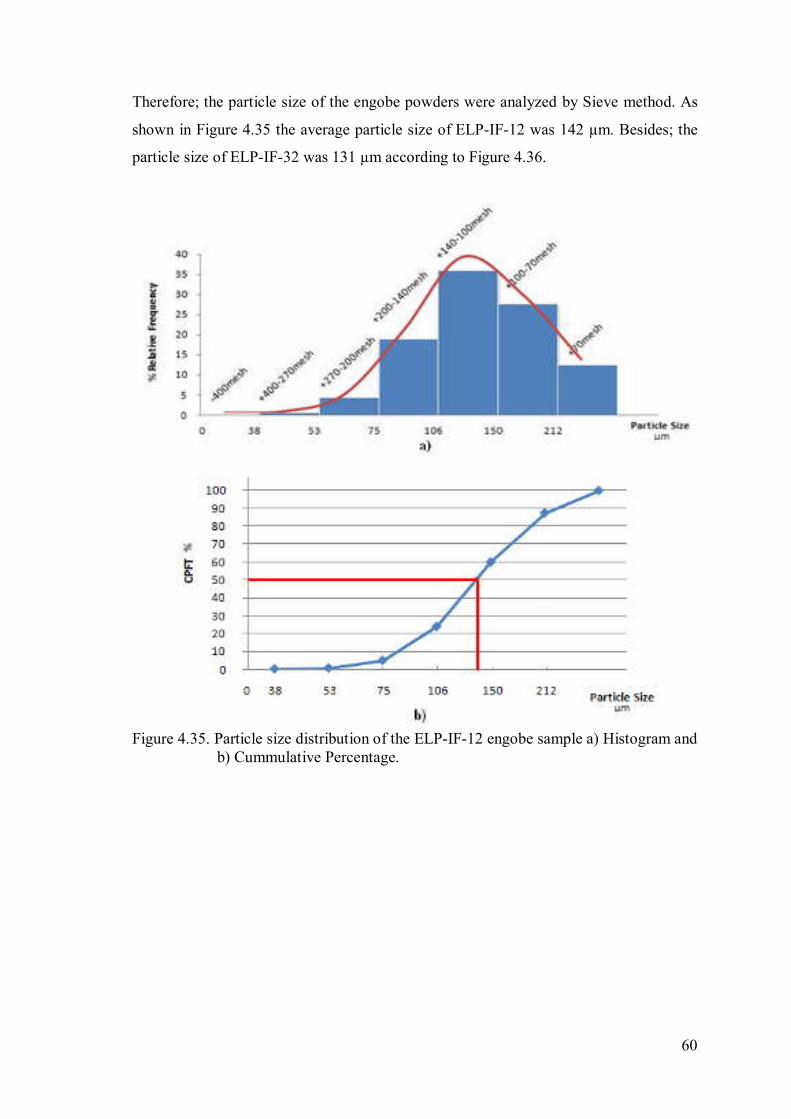
60
Therefore; the particle size of the engobe powders were analyzed by Sieve method. As
shown in Figure 4.35 the average particle size of ELP-IF-12 was 142 µm. Besides; the
particle size of ELP-IF-32 was 131 µm according to Figure 4.36.
Figure 4.35. Particle size distribution of the ELP-IF-12 engobe sample a) Histogram and
b) Cummulative Percentage.

61
Figure 4.36. Particle size distribution of the ELP-IF-32engobe sample a) Histogram and
b) Cummulative Percentage.
Application of both engobes was achieved without any defect on the surface. As
illustrated in Figure 4.37, ELP-IF-32 had more transparent shade than ELP-IF-12 as a
result of the high amount of the B2O3 in the LP engobe composition (Table 3.8, 10).
Properties of the samples were very good for all criteria (Table 4.3). The colors of the
LP engobes were a little darker than HP engobes because of the impurity of the raw
materials.
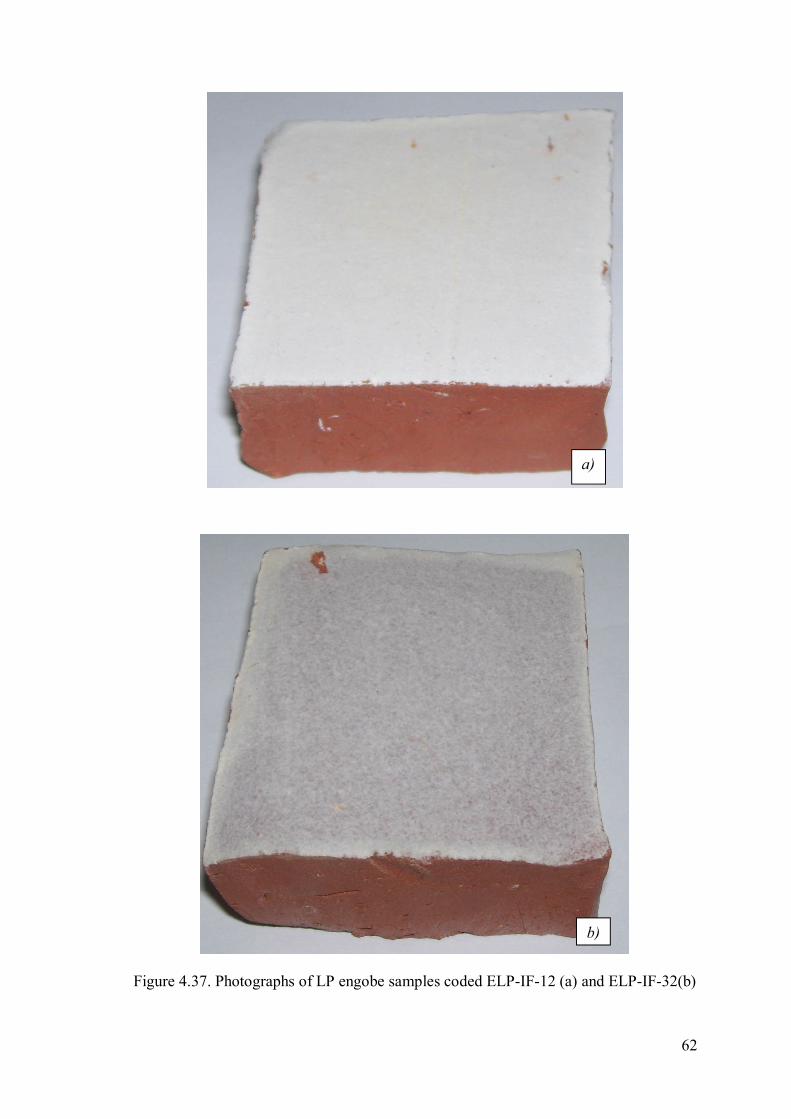
62
Figure 4.37. Photographs of LP engobe samples coded ELP-IF-12 (a) and ELP-IF-32(b)
a)
b)
)
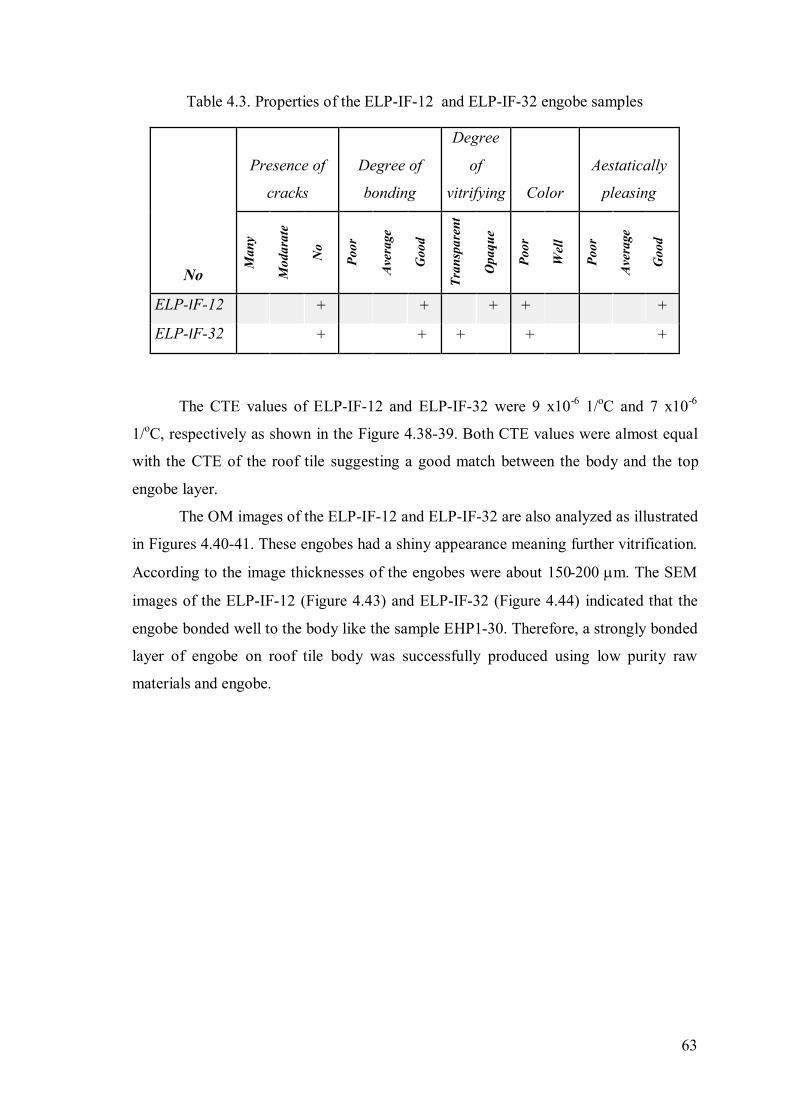
63
Table 4.3. Properties of the ELP-IF-12 and ELP-IF-32 engobe samples
No
Presence of
cracks
Degree of
bonding
Degree
of
vitrifying Color
Aestatically
pleasing
Man
y
Mod
ara
te
No
Poo
r
Ave
rage
Goo
d
Tra
nsp
are
nt
Opa
qu
e
Poo
r
Wel
l
Poo
r
Ave
rage
Goo
d
ELP-IF-12 + + + +
+
ELP-IF-32 + + + +
+
The CTE values of ELP-IF-12 and ELP-IF-32 were 9 x10⁻⁶
1/oC and 7 x10
-6
1/oC, respectively as shown in the Figure 4.38-39. Both CTE values were almost equal
with the CTE of the roof tile suggesting a good match between the body and the top
engobe layer.
The OM images of the ELP-IF-12 and ELP-IF-32 are also analyzed as illustrated
in Figures 4.40-41. These engobes had a shiny appearance meaning further vitrification.
According to the image thicknesses of the engobes were about 150-200 m. The SEM
images of the ELP-IF-12 (Figure 4.43) and ELP-IF-32 (Figure 4.44) indicated that the
engobe bonded well to the body like the sample EHP1-30. Therefore, a strongly bonded
layer of engobe on roof tile body was successfully produced using low purity raw
materials and engobe.
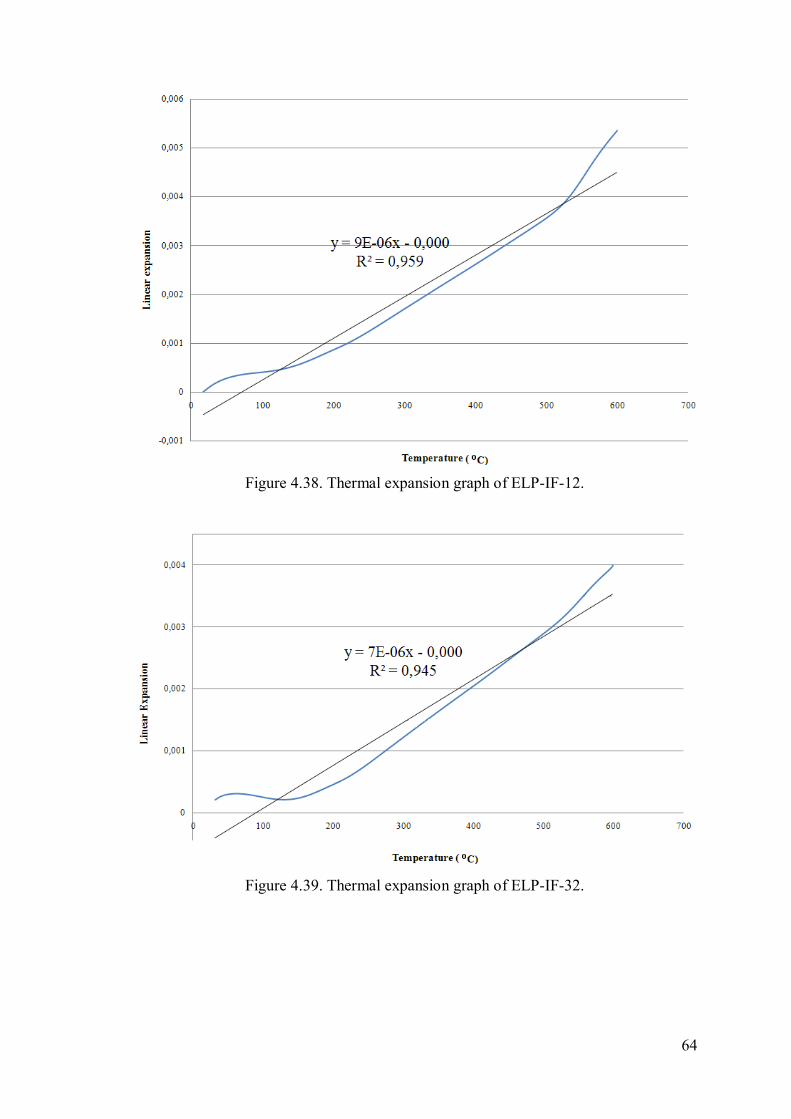
64
Figure 4.38. Thermal expansion graph of ELP-IF-12.
Figure 4.39. Thermal expansion graph of ELP-IF-32.

65
Figure 4.40. The OM image of the ELP-IF-12.
Figure 4.41. The OM image of the ELP-IF-32.

66
Figure 4.42. The SEM image of the ELP-IF-12.
Figure 4.43. The SEM image of the ELP-IF-32.

67
XRD results of the ELP-IF-12 and ELP-IF-32 are given in Figures 4.44-45.
Albite and SiO2 phases were observed in both ELP samples.
Figure 4.44. XRD analysis of the ELP-IF-12.
Figure.4.45. XRD analysis of the ELP-IF-32.
The particle size of the engobe samples was also investigated. ELP-IF-12 and
ELP-IF-32 samples were ground at different speeds and times as given in Table 3.12
and were named as ELP-IF-12-G200 and ELP-IF-32-G200. The results which are given
in Figures 4.46-47 showed that the particle sizes of ELP-IF-12-200 and ELP-IF-32-200
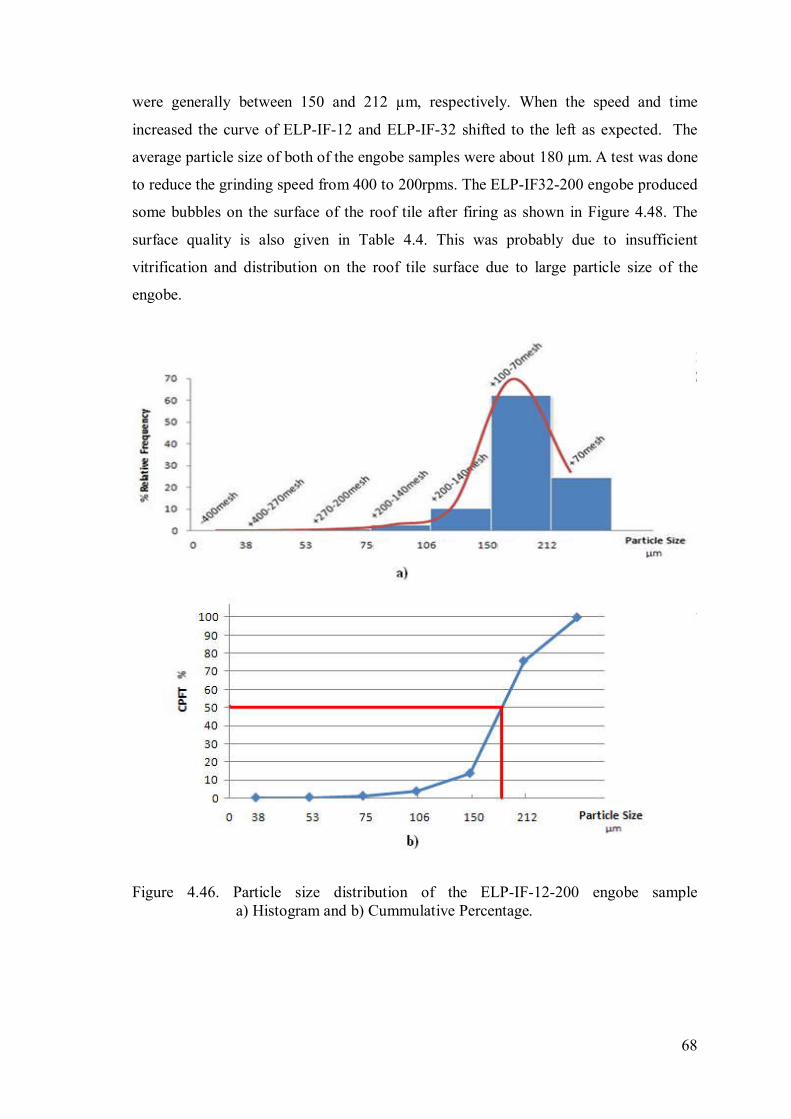
68
were generally between 150 and 212 µm, respectively. When the speed and time
increased the curve of ELP-IF-12 and ELP-IF-32 shifted to the left as expected. The
average particle size of both of the engobe samples were about 180 µm. A test was done
to reduce the grinding speed from 400 to 200rpms. The ELP-IF32-200 engobe produced
some bubbles on the surface of the roof tile after firing as shown in Figure 4.48. The
surface quality is also given in Table 4.4. This was probably due to insufficient
vitrification and distribution on the roof tile surface due to large particle size of the
engobe.
Figure 4.46. Particle size distribution of the ELP-IF-12-200 engobe sample
a) Histogram and b) Cummulative Percentage.

69
Figure 4.47. Particle size distribution of the ELP-IF-32-200 engobe sample
a) Histogram and b) Cummulative Percentage.

70
Figure 4.48. Image of the LP engobe samples ground at different speeds
a) ELP-IF-12-200, b) ELP-IF-32-200.
a
)
b
)

71
Table 4.4. Properties of the ELP samples that ground at 200 RPM.
No
Presence of
cracks
Degree of
bonding
Degree
of
vitrifying Color
Aestatically
pleasing
Man
y
Mod
ara
te
Non
e
Poo
r
Ave
rage
Goo
d
Tra
nsp
are
nt
Opa
qu
e
Poo
r
Wel
l
Poo
r
Ave
rage
Goo
d
ELP-IF-12-G200 +
+ + +
+
ELP-IF-32-G200 + + + +
+
Maturation of the engobe is effected by its chemistry as well as firing time and
temperature. But the firing temperature of the roof tile is fixed at 1000oC due to
manufacturer requirements. In this thesis, the firing temperature of engobe was matched
with the firing temperature of the roof tile so that the engobe-coated roof tiles can be
produced in a single step firing schedule. A second step firing process for engobe would
not be economically feasible. Roof tile industry is already suffering from poor profit
margins due to significant energy bills. The firing conditions for engobe are given in
Table 3.13. Specks on the surface of the engobe were observed after firing at the high
temperature (1030 oC) as shown in Figure 4.49. According to Table 4.5 when the
temperature and time of the firing increased the quality of the surface became worse.
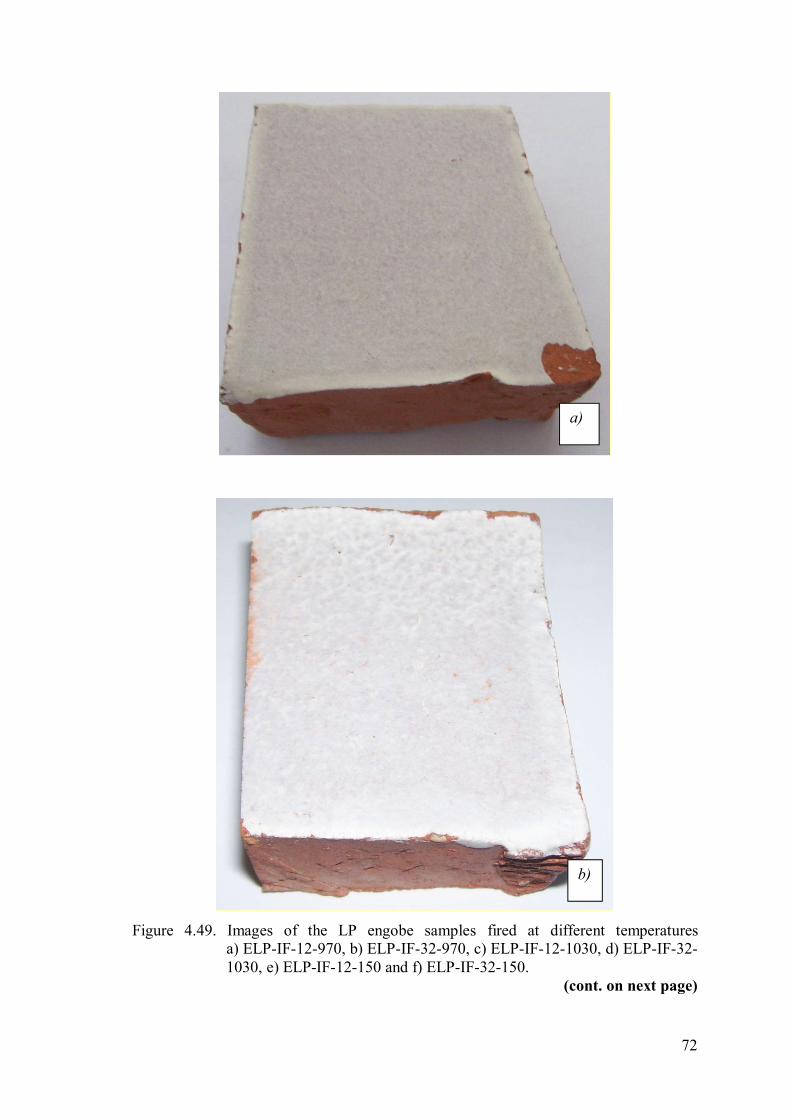
72
Figure 4.49. Images of the LP engobe samples fired at different temperatures
a) ELP-IF-12-970, b) ELP-IF-32-970, c) ELP-IF-12-1030, d) ELP-IF-32-
1030, e) ELP-IF-12-150 and f) ELP-IF-32-150.
(cont. on next page)
a)
b)

73
Figure 4.49. (cont.)
(cont. on next page)
d)
c)

74
Figure 4.49. (cont.)
e)
f)

75
Table 4.5. Properties of the ELP samples fired at different temperatures and durations.
No
Presence of
cracks
Degree of
bonding
Degree
of
vitrifying Color
Aestatically
pleasing
Man
y
Mod
ara
te
Non
e
Poo
r
Ave
rage
Goo
d
Tra
nsp
are
nt
Opa
qu
e
Poo
r
Wel
l
Poo
r
Ave
rage
Goo
d
ELP-IF-12-970 +
+ + +
+
ELP-IF-32-970 +
+
+ +
+
ELP-IF-12-1030 +
+ + +
+
ELP-IF-32-1030 +
+ + +
+
ELP-IF-12-150 +
+ + +
+
ELP-IF-32-150 +
+ + +
+
The life of the engobe is an important point for usage of roof tiles. So the acid
resistance was investigated with 5% HCl, 5% HNO3, 5% NaOH, and 5% H2SO4
solutions for ELP-IF-12 and ELP-IF-32. Few milliliters of acid were dropped onto the
surfaces of engobe coated roof tiles. No significant degradation was observed on the
surfaces after application of the acid-water solution on the surface for a week. SEM
images of the samples ELP-IF-12 and ELP-IF-32 confirmed this observation. (Figure
4.50-54) Temperature change is one of the other effects for the life of the engobe so the
samples were heated to 185oC. Later they were quenched in cold water in order to
inflict thermal shock. But the samples survived the test without observable damage.

76
Figure 4.50. The SEM images of the 5% HCl - water solution applied engobe surfaces
a) ELP-IF-12 and b) ELP-IF-32.
Figure 4.51. The SEM images of the 5% HNO3 - water solution applied engobe surfaces
a) ELP-IF-12 and b) ELP-IF-32.
Figure 4.52. The SEM images of the 5% NaOH - water solution applied engobe
surfaces a) ELP-IF-12 and b) ELP-IF-32.
a b
a b
a b
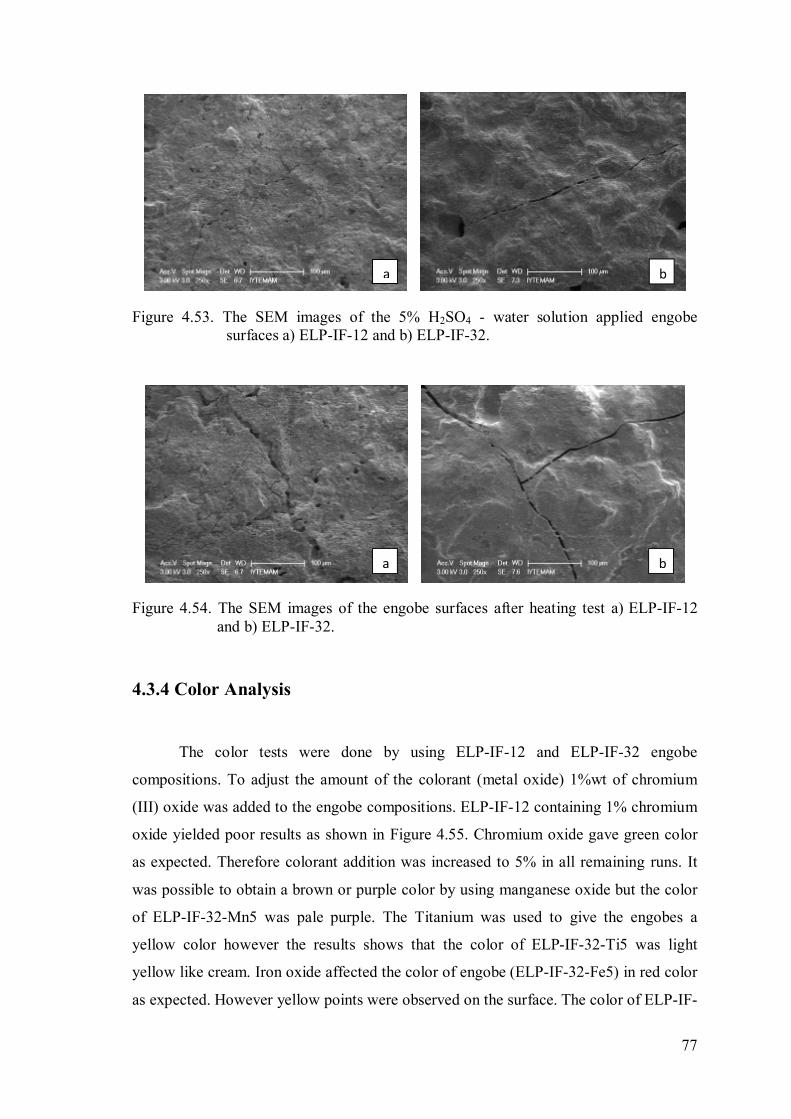
77
Figure 4.53. The SEM images of the 5% H2SO4 - water solution applied engobe
surfaces a) ELP-IF-12 and b) ELP-IF-32.
Figure 4.54. The SEM images of the engobe surfaces after heating test a) ELP-IF-12
and b) ELP-IF-32.
4.3.4 Color Analysis
The color tests were done by using ELP-IF-12 and ELP-IF-32 engobe
compositions. To adjust the amount of the colorant (metal oxide) 1%wt of chromium
(III) oxide was added to the engobe compositions. ELP-IF-12 containing 1% chromium
oxide yielded poor results as shown in Figure 4.55. Chromium oxide gave green color
as expected. Therefore colorant addition was increased to 5% in all remaining runs. It
was possible to obtain a brown or purple color by using manganese oxide but the color
of ELP-IF-32-Mn5 was pale purple. The Titanium was used to give the engobes a
yellow color however the results shows that the color of ELP-IF-32-Ti5 was light
yellow like cream. Iron oxide affected the color of engobe (ELP-IF-32-Fe5) in red color
as expected. However yellow points were observed on the surface. The color of ELP-IF-
a b
a b

78
32-Co5 was green. Copper oxide (ELP-IF-32-Cu5) also was used as a blue or green
pigment and a green color was obtained. L – b – a values of each colored engobe
samples is given in Table 4.6. Also their L – b – a diagrams are shown in Figure 4.56.
Figure 4.55. Image of the LP engobe samples with different colorant a) ELP-IF-12-Cr1,
b) ELP-IF-32-Cr1, c) ELP-IF-32-Cr5, d) ELP-IF-32-Cr5, e) ELP-IF-32-
Mn5, f) ELP-IF-32-Ti5, g) ELP-IF-32-Fe5 and h) ELP-IF-32-Co5, i) ELP-
IF-32-Cu5.
(cont. on next page)
a)
b)

79
Figure 4.55. (cont.)
(cont. on next page)
c)
d)
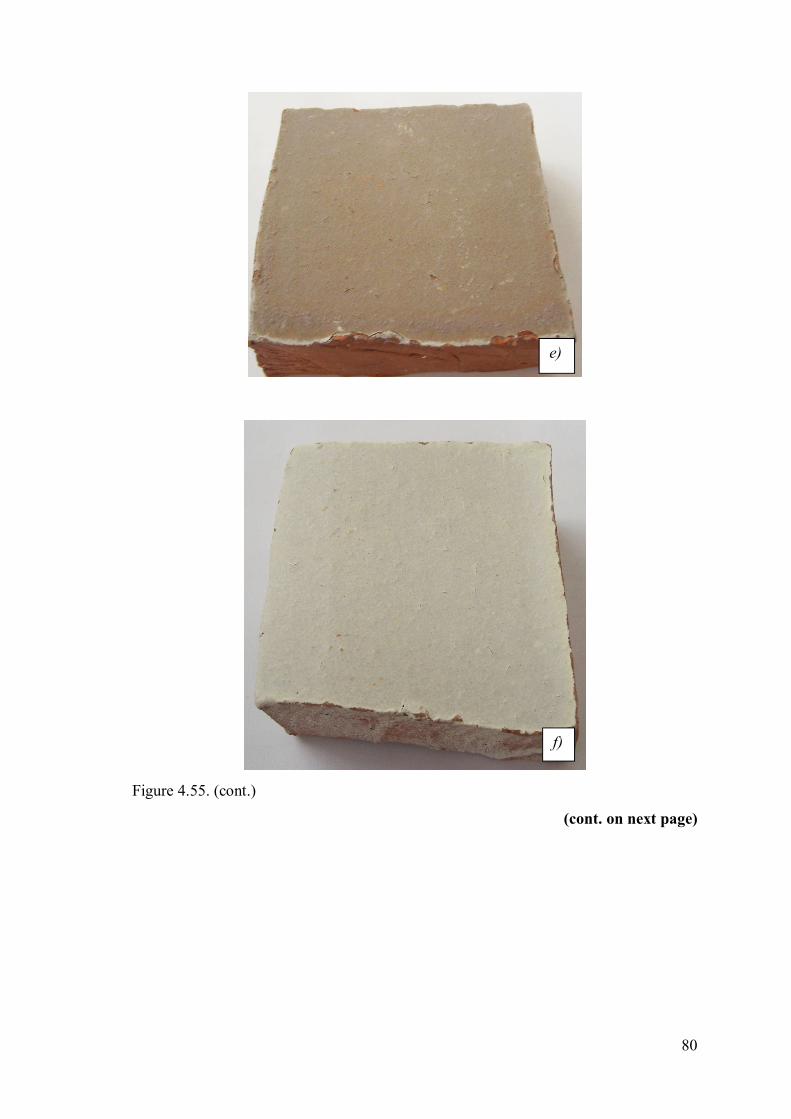
80
Figure 4.55. (cont.)
(cont. on next page)
e)
f)

81
Figure 4.55. (cont.)
(cont. on next page)
g)
h)

82
Figure 4.55. (cont.)
Table 4.6. Color measurement for the engobe samples.
No Colorant
Frit (%) L b a Amount Type
ELP-IF-12-Cr1 1% Chromium(III) Oxide 12 77.23 13.04 -0.37
ELP-IF-12-Cr5 5% Chromium(III) Oxide 12 71.56 12.68 -1.37
ELP-IF-32-Cr1 1% Chromium(III) Oxide 32 68.69 17.43 -11.35
ELP-IF-32-Cr5 5% Chromium(III) Oxide 32 48.5 17.16 -9.88
ELP-IF-32-Mn5 5% Manganese(IV) Oxide 32 52.88 11.2 4.37
ELP-IF-32-Ti5 5% Titanium(IV) Oxide 32 76.96 7.7 -0.47
ELP-IF-32-Fe5 5% Iron(III) Oxide 32 45.74 21.88 18.36
ELP-IF-32-Co5 5% Cobalt(III) Oxide 32 58.93 -0.62 5.42
ELP-IF-32-Cu5 5% Copper(III) Oxide 32 50.37 5.37 -6.09
i
)

83
Figure 4.56. Location of color on the L - b – a diagram.
4.3.5. Working on Industrial-size Roof Tile
The ELP-IF-32-Cr5 was also applied to industrial size roof tile. After firing the
cracks were observed on the surface as in the Figure 4.57. The roof tiles were fired in
the manufacturer furnace. The temperature of the furnace is not stable and the
temperature was not measured. These can be the reason of the crack on the surface.
Figure 4.57. ELP-IF-32-Cr5 on industrial - size roof tile.
84
CHAPTER 5
CONCLUSIONS
Development of an engobe composition for a commercial roof tile was
successfully achieved. For developing a proper HP (high purity) engobe composition
the commercial roof tile was analyzed. According to the roof tile chemical analysis a
number of HP engobe compositions were prepared with different weight percentages of
lab frit containing 18% B2O3. Two of the HP engobe compositions for the roof tile were
identified as the most suitable: EHP1-10 and EHP1-30. EHP1-30 was more transparent
than EHP1-10 because of the higher amount of frit. The high purity materials are very
expensive to be used by industry. In addition, making a lab frit can be difficult for a roof
tile company. Therefore, two new engobe compositions were prepared which had
almost the same compositions with EHP1-10 and EHP1-30 by using low purity
materials and an industrial frit. The ELP-IF-12 which had similar chemical composition
with EHP1-10 and the ELP-IF-32 which had similar chemical composition with EHP1-
30 were also successful. The most important difference between the HP engobes and LP
engobes was that LP engobe samples were a little bit darker than HP engobe samples.
The reason was probably the higher amount of Fe2O3 in the LP engobe samples.
However, it is not expected to be a big problem for coloring of the engobe as low iron
raw materials are also available in the industry. There was no defect on the surface of
the engobe as might be expected form CTE values of the engobes and roof tile. Small
differences in CTE values were therefore not effective. The grinding speed was also
decreased to observe the effect of the PSD for engobe compositions. When the speed of
grinding was reduced the surfaces became less smooth and some bubbles formed.
Formation of bubbles was also observed when the firing temperature was increased.
Slurries containing 50 weight percent solids showed shear thinning rheology which
enabled easy application on surfaces by spraying thorough a nozzle. The life of the
engobe coated roof tile was another important point. So, for testing the environmental
effects on the engobe coated roof tile, acid and base tests and quenching tests were
applied on the surface of the engobes. They were tested to be durable against the

85
climate change or natural events. Industrial scale tests showed some cracks on the
engobe coating probably as a result of furnace atmosphere fluctuations.
The following are recommended for future study on this topic:
Sintering and densification behavior of co-pressed clay and engobe can
be measured using a vertical dilatometer.
Effect of different additives for reducing the viscosity of the engobe at
high temperature can be studied.
Production of low purity engobe can be done with better color by using
industrial grade raw materials containing a lower amount of iron.
Different engobe suspension application techniques like waterfall and
dipping can be tested against spraying.

86
REFERENCES
Bailey Michael. Oriental glazes. A & C Black Publishers Limited, 2004: 9-11.
Bernardin Adriano Michae. “The influence of particle size distribution on the surface
appearance of glazed tiles”. Dyes and Pigments, Volume 80 (January 2009):
121-124
Brown Michael E. Introduction to Thermal Analysis: Techniques and Applications. 2nd
Edition, Secaucus, NJ, USA, Kluwer Academic Publishers, 2001: 123.
Ceramic art daily, How to Correct Five Common Ceramic Glaze Defects
http://ceramicartsdaily.org/daily/how-to-correct-five-common-ceramic-glaze-
defects/ (accessed 12.01.2010).
Cooper Emmanuel. The Potter's Book of Glaze Recipes. A & C Black Publishers
Limited, 2004: 17-20.
Çetin Suna. Bazalt Tüfü Kullanılarak Yapılan Firitlein Endüstriyel ve Sanatsal Sırlarda
Kullanımı Fiziksel ve Kimyasal Özelliklerin Araştırılması. Çukurova
Üniversitesi Sosyal Bilimler Enstitüsü, Seramik Anasanat Dalı. Yüksek Lisans
Tezi. Adana, 2005.
Çine Akmaden Catalog, Çine Akmaden Madencilik Tic. A.Ş.
http://www.cineakmaden.com/urun.aspx?relid=1 (accessed 12.09.2009)
Daniel Rhodes. Clay and Glaze for Potter. Third Edition, Krause Publications,
November 2000: 117-121.
Dinger Dennis R. Characterization Techniques for Ceramist. United States by Morris
Publishing, 2005: 3-8, 79-84.
Eppler Richard A. and Eppler Douglas R. Glazes and Glass Coatings. John Wiley &
Sons Inc, 2000: 15-77, 187-194, 215-227, 239-252.

87
Eti Maden, Eti Maden İşletmeleri Genel Müdürlüğü,
http://www.etimaden.gov.tr/tr/0_sayfa_ortakSayfa.asp?hangisayfa=4_sayfa_a_4
(accessed 02.09.2009).
Free patents online, Optical dilatometer,
http://www.freepatentsonline.com/6767127-0-large.jpg (accessed 01.03.2010).
Genç S., Başkıran H., “ Kiremit Üretiminde Renkli Sır Uygulamaları”. 1. International
TerraCotta Symposium, Eskişehir, Turkey, August-September 2001: 138-143.
Grimshaw Rex W. The Chemistry and Physics of Clays and Allied Ceramic Materials.
Benn (London), 1971: 342-357.
Britt John. The Complete Guide to High-Fire Glazes: Glazing & Firing at Cone 10.
Lark Books, First Edition, 2004: 15-24.
Karasu B., Kaya G. and Özkaya Ö. “Tuğla ve Çatı Kiremitlerinin Fosfor Işıldamalı
Sırlarla Kaplanması”. 2. International Terra Cotta Symposium, Eskişehir
Turkey (June 2002) 108-113.
Karasu B. and Kara A. “Çatı Kiremitlerine Uygun Renkli Sırların Geliştirilmesi ve
Karakterizasyonu”. 1. International Terra Cotta Symposium. Eskişehir, August
– September 2001: 102-109.
Kornmann Michel, Clay. Bricks and Roof Tiles - Manufacturing and Process. Geneva,
Paris, 2007: 26-32.
Lyons Arthur. Materials for Architects and Builders. Elsesier Butterworth-Heinemann
Third Edition 2006: 242-253.
Matel, Matel Hammadde Sanyi ve Ticaret A.Ş.
http://www.matel.com.tr/wps/portal/matel_ana?changeLocale=tr (accessed
27.08. 2009).
88
McVay T.N. and Parmelee C.W. “Effect of Iron and Its Compounds and The Color and
Properties of Ceramic Engobes and Materials”. American Ceramic Society,
New York (March, 1937): 336-344.
MEGEP (Mesleki Eğitim ve Öğretim Sisteminin Güçlendirilmesi Projesi). “Seramik ve
Cam Teknolojisi Sırrlama ve Pişirim”. Ankara, 2007: 27-31.
MEGEP (Mesleki Eğitim ve Öğretim Sisteminin Güçlendirilmesi Projesi). “Seramik ve
Cam Teknolojisi”. Ankara, 2007: 1-36.
Nassau Kurt. Color for Science, Art and Technology. Elsevier Science B.V., 1998: 56-
57.
Overbeck John C.” Greek Towns of the Early Bronze Age”. The Classical Journal,
Vol. 65, No. 1, The Classical Association of the Middle West and South, Inc.,
1969: 1-7.
Phan-Thien Nhan, Understanding Viscoelasticity. Spinger, 2002: 85-86.
Poyraz H. Bogac, Erginel Nihal and Ay Nuran,. “The use of pumice (pumicite) in
transparent roof tile glaze composition”. Journal of the European Ceramic
Society 26, Eskişehir (2006): 741-746.
Reed James, Principles of Ceramics Processing. John Wiley & Sons Inc. New York,
1994:154-185.
Wattanasiriwech Darunee and Wattanasiriwech Suthee, “Effects of Particle Size of
Glaze Powder and Thickness of Glaze Layer on Glaze Crawling for Dolomite
Wares”. Chiang Mai J. Sci., 2006: 35-44.
Wikander Örjan. “Archaic Roof Tiles the First Generations”. American School of
Classical Studies at Athens Vol. 59, No. 1 (Jan. - Mar. 1990): 285-290.

89
Wienerberger, Products and Brands, http://www.wienerberger.com (accessed
10.11.2009).
Yanık G. Turgutlu (Manisa) yöresi Neojen çökellerinin jeolojisi. Jeoloji Mühendisliği
Bölümü Doktora tezi. İstanbul Teknik Üniversitesi 2005.
Zanger Heinz. “Clay Roofing Tiles – Colours and Surface Finishes”. Brick and tile
Industry International 2002: 12-18.