for more information, contact: cbga - cbga india - centre ... · for more information, contact:...
TRANSCRIPT

By
SIBA SANKAR MOHANTY
CBGA
2004
FOR MORE INFORMATION, CONTACT:
Centre for Budget and Governance Accountability(A programme of NCAS) B 64, Second Floor, Sarvodaya Enclave, New Delhi – 110 017, IndiaTelefax: 91-11-26537603 Email: [email protected]
cbgaNational Centre for Advocacy StudiesSerenity Complex, Ramnagar Colony, Pune – 411 021, Maharashtra, IndiaTelefax: 91-20-22952003 / 4 Email: [email protected] Website: www.ncasindia.org
(for
priv
ate
circ
ulat
ion
only
)

By
SIBA SANKAR MOHANTY
CBGA
2004
Rhetoric and Reality
of
MPLADS

Series Editors : John Samuel, Praveen Jha
Editorial Coordination : Uma Ramesh
Editorial Assistance : Deepak L. Xavier
Research Assistance : Vineet Kohli, Nesar Ahmed
Design & Printing : Kriti Creative Studio
Cell : 9891549374
Published by : Centre for Budget and Governance Accountability
(A programme of NCAS)
B 64, Second Floor, Sarvodaya Enclave,
New Delhi – 110 017, India
Tel: 91-11-26537603
Email: [email protected]
© CBGA, 2004
The contents of this book may be reproduced by voluntary organisations, social action groups, people’sorganisations, public interest professionals and citizens for non-commercial purposes with dueacknowledgement of the source. Any other form of reproduction, storage in retrieval system or transmissionby any means requires prior permission from the publisher.
(for private circulation only)

i
Since December 1993, Members of Parliament have been allotted funds annually to pursue developmental
works in their constituencies – today each one of them gets Rs. 2 crore under MPLADS (Members of Parliament
Local Area Development Scheme). The MPLADS study was conceptualised to look into the following aspects of
the scheme –
� Budgetary Provisions as regards the Scheme
� Guidelines of selection and its processes
� Benefits/Drawbacks of Public expenditure by this method
� Benefits accrued to the common people with specific focus on the marginalized sections of the society
� Role of elected representatives in implementation of the scheme
� Effectiveness of the scheme in eradicating poverty and creating durable assets
� Mechanism and pattern of expenditure
� Role of bureaucracy
� People’s perception of the scheme
To understand the various facets we chose to study the ground realities in a few sample constituencies in the
States of Rajasthan, Orissa, Uttar Pradesh, Madhya Pradesh, Jharkand and Gujarat. Some questions that arose
were –How much of impact has it made in addressing the local development needs? What is the
awareness level of the scheme among common people? How have MPs utilised this fund? Should
such a scheme exist?
Our report tries to find answers to these and it highlights other aspects of the scheme.
CBGA through its research seeks to draw attention to the public expenditure process and the governance issues
that arise. MPLADS Report is the first of such endeavours – and through the CBGA Manual Series we aspire to
continue such efforts.
P reface

ii
We would like to express our thanks to all those people who provided help in bringing out this research study
on a very important aspect of financing local area development. This study and report could not have been
possible without Dr. Praveen Jha’s continuous guidance and support. We are extremely thankful to him.
We are indebted to all the MPs, District Collectors, Planning Officers, Activists, and civil society organisations
who assisted us. In particular, we are thankful to NBJK and Prerna Resource Centre in Jharkhand, Samarthan
in Bhopal, Upvan in UP, HHSS and Upkar Sansthan in Rajasthan, SEWA-Patan in Gujarat for their crucial role
in providing information and assisting in the fieldwork.
We are all indebted to Vineet Kohli for his active participation in the field service and significant contributions in
analysing secondary information.
We express special thanks to Abhijit Mukhopadhyay for his assistance in data analysis. We are thankful to
Dr. Gnanaprakasam, Dr Vinod Vyasulu and Mr. Suryaprakash and all Core Committee members of CBGA for
providing extremely important inputs on the draft report, helping us to make it a more reader-friendly one.
For all errors or flaws, omissions and limitations, CBGA shall remain completely responsible.
CBGA Team
A cknowledgement

iii
Table No Title of the Table Page No.
1 Reduction in Allocation by Ministry of Rural Development to Accommodate MPLADS 15
2 Budgetary Allocations for MPLADS 16
3 Level of Utilisation Among Lok Sabha MPs till July 2003 20
4 Level of Utilisation Among Rajya Sabha MPs till July 2003 20
5 Political Party wise Utilisation by Lok Sabha MPs till July 2003 21
6 Political Party wise Utilisation by Rajya Sabha MPs till July 2003 23
7 List of Some Rajya Sabha MPs having Lowest Utilisation Rates 24
8 Regional Stratification of the use of MPLADS Funds 25
9 State wise Summary Statement for Release/ 26
Expenditure of Lok Sabha MPs Cumulative Release/ Expenditure (Since 1993)
10 State wise Summary Statement for Release/ 27
Expenditure of Rajya Sabha MPs Cumulative Release/ Expenditure (Since 1993)
11 Patterns of Expenditure in Kanara During 2000-2003 28
12 Patterns of Expenditure in Sivalkhas During 2000-2003 29
13 Pattern of Expenditure by Rajya Sabha MP N. K. Premachandran 30
14 Patterns in the Expenditure by Rajya Sabha MP S. Ramamuni Reddy During 2000-2003 30
15 Patterns in the Expenditure by Rajya Sabha Me 31
16 Patterns in the Expenditure in Indore Lok Sabha Constituency During 2002-2003 31
17 Patterns of Expenditure in Amreli During 2001-2003 32
18 Patterns in the Expenditure in Vellore During 33
19 Caste and Sexwise Distribution of Sample Respondents 38
20 Level of awareness about MPLADS in Sample Constituencies 39
21 Peoples’ Perception on Role of Public Expenditure 40
22 Major Problems faced by the Respondents in Alwar Constituency (Rajasthan) 41
23 Major Problems faced by Respondents in Bhopal Constituency (Madhya Pradesh) 41
24 Major Problems faced by Respondents in Ghazipur Constituency (Uttar Pradesh) 42
25 Major Problems faced by the Respondents in Hazaribagh Constituency (Jharkhand) 42
26 Major Problems faced by Respondents in Jagatsinghpur Constituency (Orissa) 43
27 Major Problems faced by the Respondents in Kota Constituency (Rajasthan) 43
28 Major Problems faced by the Respondents in Patan Constituency (Gujarat) 44
29 Perception about the way Decisions on Selection of Works are taken 44
30 Perceptions Regarding the Shortcomings About the Scheme in Local Areas 45
31 Peoples’ Perception on Quality of Assets Created 47
under the scheme in Sample Constituencies
32 Perception Regarding Performance of MP, DC and Implementing Agencies 48
33 Availability of Public Amenities in the Sample Constituencies 49
34 Things Which are Required by Common People and 50
Possible to create Under MPLADS (Rank Wise)
35 Perception Regarding Whether the Scheme should exist 51
L ist of Tables

iv
L ist of Boxes
Box-1 : Excerpts from First Report, MPLADS Committee, Rajya Sabha 1
Box-2 : Excerpts from First Report, MPLADS Committee, Rajya Sabha 2
Box-3 : Median Voter Hypothesis: A Hypothetical Example 4
Box-4 : Salient Features of the Scheme 5
Box-5 : Recommendation of the MPLADS Committee on Relaxing the Limit 9
Box-6 : Seeking ex-post facto approval for purchase of literary books for 10
distribution in schools and public libraries under MPLADS in Sikkim.
Box-7 : Suggestions regarding contribution of Rs.25 lakh under the quota of MPLADS 10
to meet the part cost of the construction work of 3rd Floor building in the
Faculty of Pharmacy of Hamdard University.
Box-8 : Relaxation in the upper limit of Rs. 25 lakh for construction of two bridges. 11
Box-9 : Suggestion regarding construction of First Floor building of the 12
Friend-in-need-Society, an old age home in Chennai
Box-10 : Clarification on limit of Rs.25 lakh per work under MPLADS 12
Box-11 : Section 3.1 - A Summary 25
Box-12 : Excerpts from MP’s interview MP: Prof A. K. Premajam (Badagara, Kerala) 46
Box-13 : Case Study - Mohonapari Bridge 46

v
A&N - Andaman and Nicobar Islands
ABLTC - Akhil Bharatiya Lok Tantrik Congress
AGP - Asom Gana Parishad
AIADMK - All India Anna Dravida Munnetra Kazhagam
AIFB - All India Forward Bloc
AITC - All India Trinamool Congress
ANM - Auxiliary Nurse Midwife
BDO - Block Development Officer
BJD - Biju Janata Dal
BJP - Bharatiya Janata Party
BSP - Bahujan Samaj Party
CAG - Comptroller and Auditor General
CPI - Communist Party of India
CPI (M) - Communist Party of India (Marxist)
CPI (ML) - Communist Party of India (Marxist, Leninist)
CRF - Calamity Relief Fund
D&N - Dadra and Nagar Haveli
DC - District Collector
DMK - Dravida Munnetra Kazhagam
DRDA - District Rural Development Agency
EAS - Employment Assurance Scheme
G.O.I. - Government of India
HVC - Himachal Vikas Party
IGNOU - Indira Gandhi National Open University
INC - Indian National Congress
INLD - Indian National Lok Dal
ISRO - Indian Space Research Organisation
J&K - Jammu and Kashmir
JD (JP) - Janata Dal (JP)
JD (S) - Janata Dal (Secular)
JD (Samata) - Janata Dal (Samata)
JD (U) - Janata Dal (United)
JKNC - Jammu and Kashmir National Conference
JMM - Jaharkand Mukti Morcha
JRY - Jawahar Rojgar Yojana
KC - Kerala Congress
A bbreviations

vi
Km - Kilometre
LJSP - Lok Jan Shakti Party
LS - Lok Sabha
LS - Lok Shakti
MDMK - Marumalarchi Dravida Munnetra Kazhagam
MGRADMK - M G Ramachandran Anna Dravida Munnetra Kazhagam
ML - Muslim League
MLA - Member of Legislative Assembly
MLKSC - Muslim League Kerala State Committee
MNF - Mizo National Front
MNP - Minimum Needs Programme
MP - Member of Parliament
MPLADS - Members of Parliament Local Area Development Scheme
MSCP - Manipur State Congress Party
MWS - Million Well Scheme
NA - Not Applicable
NCP - Nationalist Congress Party
NDA - National Democratic Alliance
NGO - Non-Governmental Organisation
PMK - Pattali Makkal Katchi
POTA - Prevention of Terrorism Act
PRIs - Panchayat Raj Institutions
PWD - Public Works Department
RJD - Rashtria Janata Dal
RPI - Republican Party of India
RS - Rajya Sabha
RSP - Revolutionary Socialist Party
SAD - Siromani Akali Dal
SC - Scheduled Caste
SDF - Sikkim Democratic Front
SJP - Samajwadi Janata Party
SJP-R - Samajwadi Janata Party - Rashtriya
SP - Samajwadi Party
SS - Shiv Sena
ST - Scheduled Tribe
TDP - Telugu Desam Party
TMC - Tamil Maanila Congress
UT - Union Territory

vii
Preface
Acknowledgement
List of Tables
List of Boxes
List of Abbreviations
Overview i-vi
Introduction 1
Chapter–1 : Theoretical Underpinnings Behind The Scheme
1.1 The Role of Public Expenditure in Economic Development 2
1.2 Factors Influencing Public Expenditure Strategy 3
1.3 Public Expenditure in the Hands of Elected Representatives (MPLADS) 4
1.4 Working of MPLADS: CAG View 6
1.5 Evaluation by the Planning Commission 7
1.6 Assessment by Others 7
Chapter–2 : MPLADS in India: An Assessment 9
2.1 Provisions under the Scheme 9
2.2 Union Budget and MPLADS 15
2.3 Parliament and MPLADS 16
Chapter–3 : Utilisation and Pattern of Expenditure under MPLADS 19
3.1 Level of Utilisation 19
3.2 Pattern in the Expenditure Incurred For the Works Undertaken 27
Under MPLADS in Selected Sample Constituencies
3.3 Level of Utilisation of MPLADS Funds till 31-12-2003 34
Chapter–4: A Study of People’s Perception About MPLADS 37
4.1 Methodology, Database and Sampling 37
4.2 Analysis of Primary Information 38
(a) Level of awareness about the scheme 38
(b) Role of Public Expenditure in Asset Creation and employment generation 39
C ontents

Series Editors : John Samuel, Praveen Jha
Editorial Coordination : Uma Ramesh
Editorial Assistance : Deepak L. Xavier
Research Assistance : Vineet Kohli, Nesar Ahmed
Design & Printing : Kriti Creative Studio
Cell : 9891549374
Published by : Centre for Budget and Governance Accountability
(A programme of NCAS)
B 64, Second Floor, Sarvodaya Enclave,
New Delhi – 110 017, India
Tel: 91-11-26537603
Email: [email protected]
© CBGA, 2004
The contents of this book may be reproduced by voluntary organisations, social action groups, people’sorganisations, public interest professionals and citizens for non-commercial purposes with dueacknowledgement of the source. Any other form of reproduction, storage in retrieval system or transmissionby any means requires prior permission from the publisher.
(for private circulation only)

i
Basic Features of the Scheme
� Members of Parliament Local Area Development Scheme (MPLADS) was announced in the Parliament on
23rd December 1993, owing to the long-standing demand of the Members of Parliament that they should
be able to recommend developmental works of capital nature in their respective constituencies.
� Initially, a token amount of Rs. 5 lakhs per MP was released. Later on, the amount stood at Rs. 1 crore
per year per MP during 1994-95 till 1997-98. It was further increased to Rs. 2 crores from the year 1998-
99 and there has been a demand to increase it to Rs 4 –5 crores per year in recent times.
� Under the scheme, each MP gives a choice of works, to be undertaken in his/her constituency, to the
concerned District Heads who get them implemented by following the established procedures laid down in
the guidelines for the implementation of MPLADS. The MPs of Rajya Sabha and nominated MPs can
recommend works in a wide range of constituencies.
� The MPLADS guideline provides a list of works, which are permissible and not permissible under the
scheme. To decide if a particular work recommended by an MP falls under the permissible category or not,
there are two committees for MPs from both Rajya Sabha and Lok Sabha.
� Implementing agencies can be either Government or Panchayati Raj institutions or any other reputed NGO
who is capable of implementing the works satisfactorily.
� At present the Ministry of Statistics and Programme Implementation administers the Scheme at the Centre
and Office of the District Collector/ DRDA/ District Planning Officer at the Constituency level.
� Till 31st July 2002, i.e., from 1993-2002, a total amount of Rs. 9780 crores had been released out of
which Rs. 7253 crores were spent. Out of the 6.8 lakh works recommended by the MPs under the scheme,
about 4.6 lakh works were completed by July 2002.
Assessment of the Scheme by Different Agencies
� CAG Report-2001 mentions the low rate of utilisation (around 64 %)of funds under the scheme. The
release of funds is not linked to their end-use, utilisation certificate could be obtained for only 29.78 % of
the total works, reporting of inflated and fake expenditure to the Ministry, use of MPLAD funds for
inadmissible purposes, tinkering with labour material ratios, appropriation of money meant for labour
expenses by obtaining fake muster rolls and large scale evidence of incomplete works were some of the
major drawbacks of the scheme.
� Evaluation report of the Planning Commission highlighted overlapping of works in certain specific
constituency/ district by several MPs leading to a regional imbalance as well as overburdening of the district
administration as far as the scheme is concerned. Over-emphasis on electoral benefits while recommending
works led to a concentration on works like lower quality roads and bridges as the decisions were driven by
the motive to lay foundation stones for more works in more locations ignoring the question whether the
money sanctioned is sufficient for the work or not. This is not in conformity with the stated objective of the
scheme, which is to create durable assets. In some cases, insufficient appropriation in individual projects,
lead to funds being supplemented from other sources, in spite of the fact that a large proportion of MPLADS
funds are remaining idle with the ministry.
O verview
ii
Our Findings
Budgetary Provisions
� In order to incorporate the scheme in 1994-95, the Ministry of Rural Development proposed a massive cut
in the budgetary allocation in items meant for rural development. There has been a reduction up to 21.55
per cent in case of central employment generation programme (JRY), 5 per cent in employment assurance
schemes, 29.25 per cent in total allocations for agricultural marketing, up to 25 per cent in case of land
reforms and 29.6 per cent in case of land reforms.
� The inclusion of MPLADS in the plan expenditure as a part of central assistance for state plans is unjustifiable
in a sense that the money does not go to the state exchequer but directly to the District Collectors who
spend it on the projects recommended by the MPs. The state planning authority does not make any
intervention as far as planning of usage of funds are concerned.
� The budgetary allocation for MPLADS is made under major head number 2553 as revenue expenditure
under Special Area Programme of Economic Services. However, the money is strictly for the creation of
durable capital assets in the constituencies. This is an anomaly as far as allocation of funds are concerned.
Parliamentary Debates
� In answer to the questions raised by MPs on the slow pace of work the Minister of Statistics and Programme
Implementation admitted that these arise due to delay in release of funds, processing recommendations as
well as estimates, issue of technical and administrative sanctions, non-compliance of time frame and
acquisition of land.
� The MPs do not keep track of the details of works undertaken in their own constituencies and also the
Ministry does not have a convincing mechanism to update the MPs regarding MPLADS. While most of the
questions raised by the parliamentarians are repetitive the answers were also stereotype.
Utilisation of Funds by Lok Sabha MPs
� The members of Lok Sabha (till 2003) have used only 77 per cent of their total entitlement as per the
latest information available. Interestingly, around 4 per cent (23) of the total MPs have actually
registered a more than 100 per cent utilisation rate. Though the information is quite confusing
as in the accounting sense this is untenable, there is no mention of it by the Ministry when it
provides the information on overall release and utilisation.
Utilisation of Funds by Rajya Sabha MPs
� Around 48 per cent of total Rajya Sabha MPs have spent on an average, less than 50 per cent total funds
released for the works recommended by them. The average utilisation rate over release is only 54 per
cent, which is substantially lower than the utilisation rate of the Lok Sabha MPs.
� This confirms that there is an element of electoralism in expenditure pattern in a sense that, a Lok Sabha
MP is compelled to spend more than a Rajya Sabha MP as the latter is not directly elected by the people.
31 MPs have not utilised a single rupee from their MPLADS entitlements till March 2003.
Utilisation of MPLADS Funds by MPs Across Political Parties
� Many regional and small political parties have performed better than the parties having a national character
like the BJP and the Congress. One of the possible reasons behind such a phenomenon may be that the
members of the regional political parties due to their miniscule representation in the parliament could not
mobilise large-scale capital investment for their constituencies/localities through their own initiative. Therefore,
it has become imperative for them to utilise their MPLADS allocations to the largest extent possible so that
the popular demands for local public amenities and facilities and corresponding necessary capital investment
could be met as far as possible. Another reason for such high utilisation by the MPs of regional parties
may be that such MPs probably have better cohesion with the common people in the grass root level
through which they could actually collect correct information about locally felt needs.

iii
� Around 50 per cent of those MPs who have not spent anything through MPLADS are either from the BJP
or its National Democratic Alliance (NDA). Around 17 per cent are from the Congress and its allies, around
20 per cent from the third front and around 13 per cent of these MPs are either nominated or independent.
Some prominent personalities among these MPs who have not spent anything from MPLADS are Jana
Krishnamurthy of the BJP from Gujarat, Kesubhai Patel of the BJP from Gujarat, Farooq Abdullah of the
JKNC from Jammu and Kashmir and Laloo Prasad Yadav of the RJD from Bihar.
Utilisation of MPLADS Funds Across Different States
� Among Lok Sabha MPs, states like Mizoram and Meghalaya have registered highest utilisation of MPLADS
funds whereas states like West Bengal, Jammu and Kashmir and Delhi have lowest utilisation rates.
� Among Rajya Sabha MPs smaller states like Arunachal Pradesh, Mizoram, Haryana, Maghalaya, Manipur
and Nagaland have highest utilisation rates whereas comparatively bigger states have lower utilisation rates.
Out of all MPs in Rajya Sabha, MPs from Mizoram have registered highest (96 per cent) utilisation rates
whereas MPs from Jharkhand have utilised only 49.1 per cent of total cumulative release since 1993
Pattern in the Expenditure in Some Selected Constituencies
� In order to collect information on the types of works on which MPLADS funds were used, we requested
each and every MP to provide information for at least the recent years. However, only 17 MPs from Lok
Sabha and 15 MPs from Rajya Sabha had actually responded.
� In the sample constituencies, the expenditure pattern has a definite bias towards roads, bridges and
construction works- while development indicators like health, education, etc, get low priority. As could be
said generally about most of the government projects, the expenditure under the scheme has been largely
concentrated on projects, which inherently involve elements of corruption and misuse.
� The pattern of expenditure under the scheme shows that rather than spending on localised development,
money had been spent on projects, for which funds could be arranged from other different sources.
Perception on the Level of awareness about the scheme
� Around 29 per cent among male respondents and around 31 per cent among female respondents have
never heard about the MP Local Area Development Scheme.
� In the constituencies selected for fieldwork, the male respondents of Jagatsinghpur and female respondents
of Hazaribagh and Ghazipur are most ignorant about the scheme.
Major problems faced by people in our sample constituencies
� In spite of being from a single constituency, different groups perceive different problems as their prime issues.
� In Alwar constituency, health was the most important concern for the male respondents whereas drinking
water was the most important concern for the female respondents. Interestingly, among scheduled tribes
and scheduled castes, unemployment was not cited as a problem. This is a testimony to the fact that even
basic needs like provision of water and health facilities are unresolved in Alwar constituency for people
from socially deprived groups.
� In Bhopal, shortage of drinking water seems to be a problem faced by more than half of the respondents
in all the categories. Around 57 per cent of both male and female respondents, around 50 per cent of the
respondents from the general and scheduled tribes category and around 75 per cent of the respondents
from the scheduled caste category viewed water as the major problem faced by them in Bhopal.
� In Ghajipur constituency, the respondents raised a number of issues having prime importance as being
problems faced by common people. While respondents from scheduled tribe population viewed lack of all
season roads to be a major problem followed by health, the respondents from all other categories have
cited a number of other issues in their constituency. In Ghajipur, around 44 per cent of the male respondents
view unemployment and poverty as a major problem in their locality and for the female respondents,
availability of all season roads and toilet are the most significant issues.

iv
� In Hazaribagh, the issues that matter for the male respondents are roads and irrigation facilities. For the
female respondents, the major problems are unemployment and water.
� For the male respondents, of Jagatsinghpur constituency, drinking water, unemployment and electricity
were the major concerns whereas for female respondents unemployment, drinking water and flood got
prime importance. For the respondents of general category, poverty & unemployment, drinking water and
electricity were of prime concern whereas for those from the scheduled castes, drinking water and flood
were major concerns.
� In Kota, the major problem faced by the male respondents and those from scheduled castes was
unemployment and for other groups, water was a major concern.
� In Patan, among the male respondents, water and electricity seems to be the major concerns. Around 28
per cent of the male respondents have viewed water and around 21 per cent of the same have viewed as
the major problems faced by them in their locality.
� Our observation makes it imperative that for an effective public expenditure policy, it is essential that the
authority should have a proper knowledge about the development needs of the potential beneficiaries and
works should not be undertaken on the basis of the suggestions made by local party workers, politicians
and interest groups who do not constitute the group of beneficiaries.
Perception on Shortcomings of the Scheme
� A large number of respondents highlighted inordinate delay in completion of projects as the most pertinent
shortcoming of the scheme. Around 80 per cent respondents in Bhopal, 55 per cent in Ghazipur, 69 per
cent in Jagatsinghpur and Kota and 75 per cent in Patan said that delay is the major problem.
� Around 25 per cent respondents in Alwar, 30 per cent in Bhopal, 60 per cent in Ghazipur, 20 per cent in
Hazaribagh, around 50 per cent in both Jagatsinghpur and Kota, and 37 per cent in Patan constituencies
revealed that less than minimum wages were paid to the labourers who got employment in the scheme.
Most of these respondents were involved as construction labourers in the creation of assets under MPLADS
and said that since many works under MPLADS start during summer and non agricultural seasons, they
agree to work as this provides them some income in the off season.
� The respondents in Jagatsinghpur and Kota also revealed that since a lot of works are clubbed with
calamity relief, and since they get employment under food for work programmes, they agree to work
in order to get atleast some staple food like rice in Orissa and wheat in Rajasthan, though they
usually get less cash than what was promised to them by the employers and that too in many cases
as deferred payments only.
� Around 30 per cent respondents in Alwar, 40 per cent in Bhopal, 5 per cent in Ghazipur, 30 per cent in
Hazaribagh and Jagatsinghpur, 24 per cent in Kota and 37 per cent in Patan constituencies revealed other
shortcomings of the scheme. Such shortcomings include bad quality of work, inadequate employment
generation, corruption and lack of interest by the elected representatives.
Perception on the Quality of Works under MPLADS
� More than 62 per cent of the respondents in all the constituencies reported bad or very bad quality of
assets created under MPLADS.
� Around 8 per cent of the respondents reported excellent quality of the works and around 30 per cent
reported good quality.
� The highest proportion of around 80 per cent respondents in Hazaribagh and Ghazipur constituencies
reported bad or very bad quality of works.
� Our analysis shows that in Kota and Alwar (both the constituencies are from Rajasthan), the respondents
are more or less satisfied with the quality of works undertaken there.
� In all other constituencies the respondents were grossly dissatisfied with the quality of assets created under
MPLADS.

v
Whether the Scheme should Exist?
� Very few respondents (around 18 per cent) have opted that the scheme should be scrapped. 50 per cent
respondents in Alwar, all the respondents in Bhopal, 40 per cent in Ghajipur, 20 per cent in Hazaribagh,
61 per cent in Jagatsinghpur, 65 per cent in Kota and 75 per cent in Patan constituency said that the
scheme should exist in its present form.
� Around 70 per cent respondents in Hazaribagh, 50 per cent in Alwar, 15 per cent in Ghajipur, 12.5 per
cent in Patan and 7 per cent each in Jagatsinghpur and Kota constituencies revealed that the scheme
should exist but modifications in the scheme is needed.
� People do expect benefits from the scheme and want their local problems to be addressed through the
scheme. Since in other schemes, there is a lack of local perspectives, it is necessary that a scheme like
MPLADS continue until some alternative form of asset creation is evolved.
Guidelines for an Effective MPLADS
At the Level of Administration
� At the level of administration, some mechanism should be evolved so that starting from financial sanction
to the administration of technical sanction can be done at one place. This will not only ensure administrative
control over accounts but shall also lead to speedy implementation of the projects.
� There should be consistency in the provisions, as contradictions will lead to ambiguity in understanding,
and also result in mismanagement of the scheme.
� The Ministry should insist on obtaining utilisation certificates for the previous release before releasing next
instalment. This may act as an essential check on the flawed financial administration of the scheme and
can ensure fruitful end use of funds released.
� Prompt action should be taken against District Collectors who fail to obtain utilisation certificates, mis-
report to the Ministry on financial progress of works by inflating expenditures by reckoning the amount
released to the implementing agencies as the final expenditures. Such actions will act as a deterrent against
providing wrong information.
� There is no harm if the funds from MPLADS are dovetailed with other schemes if the prupose for that is
genuine. There is no harm if in a particular project meant for calamity preparedness is constructed from
MPLADS funds and the labour/ salary component of the project can be provided from CRF or any other
scheme. This may provide enough funds to create durable assets without compromising with quality.
At the level of Selection of Projects
� There is no precise machinery provided under the scheme to gather correct information on different aspects
of locally felt needs. A provision for undertaking research on the need of the project and cost calculation
should be there for the MP to have better judgement on selection of works. The MP must have a list of
works to be undertaken with all financial and technical details much before s/he actually recommends
works to the DC.
� This research should be the information base for all the MPs interested in that district. The money
needed for such research should also be provided from MPLADS and some specific proportion; say
0.5 per cent, of the annual entitlement of an MP can be made available to undertake such research
in each constituency.
� As mentioned by the Planning Commission, the PRIs may also be asked to provide a list of works to be
recommended by the MP.with such a list in hand, it will be easier for the MP to prioritise locally felt needs
of various groups of people in order of significance.
� Constitution of a research unit at the grass root level will also help in addressing some of the main problems
associated with MPLADS in our sample constituencies. For example, the problem of controversial projects
can be overcome through this effort.

vi
At the level of Execution and Monitoring of the Scheme
� The provisions should be made flexible to include private contractors in case of need and stringent action
should be taken in case of anomalies. The engagement of private contractors cannot be eliminated
completely. But a beneficiary monitoring committee can be constructed to have a check on the misuse of
funds so that there will be less scope for corruption.
� As far as possible, the actual execution of the works should be handed over to those committees instead of
engaging private contractors.
� The MP should do random and surprise visits to the work places personally while construction is going on.
This should be made mandatory as this not only builds a pressure on the executing agencies but also
provides a forum to the common beneficiaries to open up their reservations regarding the work under
construction.
� The recommendation of the MPLADS Committee on purchasing a vehicle with the interest accrued from
MPLADS funds could be implemented also, in order to facilitate the MPs travel the worksites for monitoring
the progress of works recommended by them.
� Once a work is executed, it should be entrusted with the beneficiaries. If the case is genuine and number
of potential beneficiaries is large enough, the problems of maintenance will be less.

1
In a country like India, where developmental issues vary on local and regional perspective, it is almost impossible
for the planning authorities to address all matters relating to local development. This is mainly because of the
variety and the range of different developmental needs, many of which by their very nature, are difficult to
incorporate in the centralised plans and to some extent, this is also due to the lack of adequate knowledge on
the part of the planning authorities. Therefore, long-standing demand of the members of Parliament was that
they should be able to recommend developmental works of capital nature to be carried out in their respective
constituencies. Owing to this demand, the then Prime Minister P. V. Narasimha Rao announced the Members of
Parliament Local Area Development Scheme (MPLADS) in Parliament on 23rd December 1993. Initially, during
1993-94, a token amount of Rs. 5 lakh per MP was released. Later on, the amount stood at Rs. 1 crore per
year per MP during 1994-95 till 1997-98. It was further increased to Rs. 2 crore from the year 1998-99 and
there has been a demand to increase it to Rs 4 crore per year in recent times.
Under MPLADS scheme, each MP gives a choice of works to the concerned district collectors, who in turn get
them implemented by following the established procedures laid down in the implementation guidelines.
Implementation agencies can be either Government, Panchayati Raj institutions or any other reputed NGO
capable of implementing the works satisfactorily. For purposes of execution of works through Public Works
Department (PWD), wings not necessarily exclusively dealing with civil construction, but having competence in
civil construction can be engaged, like for example - Public Health Engineering, Rural Housing Departments/
wings, Housing Boards, Electricity Boards, Urban Development Authorities etc. The District Collector identifies
the agency, which executes a particular work recommended by the MP. The MPs of the Rajya Sabha and also
the nominated MPs can select one or more districts from the state or union from which he/ she has been
elected/ nominated.
The scheme is administered as per the guidelines of the scheme issued from time to time, which give salient
features of the scheme, illustrated list of works that can be taken up and list of works that are not permissible
under the scheme, and procedural aspects for sanction, execution, monitoring of works and release of funds.
There are two committees for monitoring the same.
I ntroduction
“Members of Parliament, being the true representatives of the people are more conversant with the
realities and intricacies of the structural requirements of their constituency, particularly with reference
to the economic and social bottlenecks, more so in the remote and tribal areas, which are the most
backward areas plagued by abject poverty and grim pictures of underdevelopment and wherein the
people are being denied the social and economic advantages of basic infrastructure even after 50
years of independence.
The Members of Parliament are often approached by their Constituencies for executing implementa-
tion of small works mainly capital in nature to be undertaken in their individual Constituency. Prior
to the formation of Members of Parliament Local Area Development Scheme, the Members of Parlia-
ment had to recommend such works either to local bodies, municipalities or State Government.
During those times, the member did not have direct involvement either in the administrative imple-
mentation of such works or in the financial aspect involved in undertaking the works. He had to
remain merely a silent spectator and any element of corruption which generally creeps in the entire
system of implementation of projects and financing of the same, the Member could not interfere due
to some unavoidable limitations inherited in the entire scenario of the system.”
- Excerpts from First Report, MPLADS Committee, Rajya Sabha
Box 1

2
1.1 The Role of Public Expenditure in Economic Development
Immediately after the attainment of political sovereignty, the central five-year plans came into being with the
objective to initiate a development process, in order to raise the living standard of the people and could open
out new opportunities for a richer and more varied life with the accepted ideas and norms of production
maximisation, full employment, economic equality and social justice. The process of centralised planning and
decentralised implementation was accepted as the key to achieving a balanced growth with fulfilment of immediate
needs of common citizens being given priority. Removal of poverty and creation of sufficient infrastructure
became the primary objective of planned development.
The concrete measures taken under this policy were :
� The provisions for subsidised electricity, fertilizer, food, public distribution system,
� Health programme,
� Housing for the weaker sections,
� Spread of education
� And a more or less successful management of distress situation such as those created by drought, wars,
influx of refugees etc.
During the post independence era, a major emphasis of our policy makers has been on the provision of public
goods. Public goods can be pure public goods like defense; quasi-public goods like irrigation and transport or
merit good like education and health needs of the society. Public goods or social goods are those :
� That are indivisible
� Each user has an access to the entire amount of the good without reducing its availability to others,
� Public goods cannot be priced according to the rules of market or to the principles of exclusion.
With the development of market mechanism, the need and intensity of public goods and thereby public expenditure
also grew. The factors, which consistently push up public expenditure in India, are as follows:
� Rapid growth of population,
� Increase in defense expenditure,
� Urbanisation,
Theoretical Underpinnings Behind The
Scheme1
“….. the ghastly countenance of the mechanics of mal- implementation/ non-implementation or delayed-
implementation of projects coupled by improper channelisation of funds for projects and absence of
close monitoring of schemes contributed negatively to the entire scenario which gradually assumed a
pernicious aberration from a normal state of affairs.
Hence, there was a persistent demand from the Members of Parliament that some method should be
evolved under which he or she should be able to recommend works directly in their Constituency and
could also involve himself/herself in the entire system of implementation and completion of project works.”
- Excerpts from First Report, MPLADS Committee, Rajya Sabha
Box 2

3
� Inflation,
� Failure of market mechanism to pull the economy from the vicious circle of poverty and its contribution to
economic instability,
� Growth of large-scale income and wealth inequalities,
� Defective consumption pattern,
� Rising unemployment etc.
These factors urged the government sector to make provisions for those who cannot pay. With the increase in
public expenditure, the need to make an accounting classification to categorize various types of public expenditure
emerged. These could enable the Executive to maintain an effective control and check over public expenditure
and possible leakages and wastages, diversions and misappropriations. Such a classification was made under
the heads of productive or unproductive expenditures.
There are several complexities associated with public expenditures.
� Firstly, there is an all time need for extra care and a scientific approach towards the need for assessing
requirement of expenditures. In India to achieve this, techniques like zero-base and programme &
performance budgeting have been used.
� Secondly, faulty planning and execution process and delays cause the authorities to spend more and thus
lead to a loss of benefits.
� Third in a democratic set-up like India, it is the legislature who sanctions the expenditure demanded by the
executive - so the spending unit has to have the sanction and approval of the appropriate authorities.
� Lastly, on the lines of the principle of maximum social advantage, there is a need to allocate public
expenditure between different items in a manner, which increases the social benefit.
1.2 Factors Influencing Public Expenditure Strategy
Ideally, the government should determine allocation of resources, distribution of income-consumption, levels of
saving-investment and also the relative prices of commodities and services. For this, it is essential that the public
expenditure should occupy very important place in the government’s fiscal scenario. It is rather important to
know the different factors which influences or try to influence the pattern of public expenditure in a democratic
set up where the real legislatures or executive are representatives of people elected either directly or indirectly by
the people themselves. It is a situation where power relations and hegemony rests on vote and support of the
people, mobilised through public expenditures.
However, it is very rare that common voters do vote directly on the levels of expenditure; in the reality, they
support politicians who represent their viewpoints on government spending. Therefore, the viewpoint of the
median income level voters is announced in the manifestos of political parties (See Box –3 for a hypothetical
example). However, several other issues may come in to picture along with public expenditure. For example,
� If political beliefs are ranked along any single dimension, then the median voter logic does not work. The
median voter on the issue of Ayodhya Ram Mandir may be different from median voter on public spending
on social sectors.
� Multi-dimensional political beliefs may also lead to preferences that are not single peaked; leading to unstable
voting.
� The politician himself may be inclined to a particular ideology and they may also benefit from adhering to
their ideologies whether or not they align with the median voters.
� Personality and leadership quality may also in some way or other affect the decision of the voters.
� Some special interest groups may also have influence on public expenditure, as they are able to divert
large voting segments which politicians view as valuable (for example, the groups of fundamentalist clergies

4
all over the South Asia); or they may be able to make sizable campaign for or against the ruling class. In
the similar fashion, the journalists, intellectuals and experts in different fields have influence on government
spending.
� Public expenditure can also be actuated by chance events such as, Kargil War, Gujarat earthquake etc,
Once expenditure is incurred in such events, for a certain time the inertia is maintained because, the
voters expect the representatives to do so.
However, keeping all these superficial, random and parameters given, the public expenditure strategy announced
by the politicians influence the pattern of voting in a significant manner.
Median Voter Hypothesis: A Hypothetical Example
Let us assume that in a democracy there are five individual voters A, B, C, D and E having annual
income level of Rs. 5000/-, Rs. 10,000/-, Rs. 15,000/-, Rs. 25,000/-, and Rs.40, 000/- respectively. Here,
the per capita income is Rs. 19,000/- and the median income is Rs. 15,000/- (i.e., income of voter C). In
the economies where there are some elements of capitalism, it is generally true that the median income
is much lower than the per capita income (i.e., more than half of the population remain below the
national per capita level). Under such situation, a politician who proposes a public expenditure that can
bring some facilities (which are hitherto being used only by the rich) to those earning less than Rs.
25,000/- will win a majority. The greater the difference between the median and mean of income (i. e.
the more the level of inequality), the more the government will act to redistribute and the more effectively
it can stay in power if it can show to the voters that more and more facilities are being provided to the
lower strata through public expenditure strategies. In fact, during recent times, due to the implementation
of the universal adult franchise, it is the will of the voters and electoral motivations, which have a lot of
influence on the pattern of public expenditure rather than anything else.
Box 3
Due to the above-mentioned factors, one can always argue that rising government expenditure are inherent to
the political economic systems. The entire process works in the following manner :
� The inflation accompanied with rising unemployment (called stagflation in economic terminology) in the
economy puts pressure on the government for enhancing expenditure in order to provide employment as
well as purchasing power to the lower strata of the population, especially through expansion of social
services in order to appease public discontent.
� The lower segment of the population also demands that the income redistribution in favour of the poor.
� Knowing the above task almost next to impossible, the pressure groups representing lower strata of population
demand that at least they should be able to avail some facilities free of cost (or at affordable prices) which
are used by the rich who can pay.
Under such conditions, the politicians can attract voters at or below the median income range by offering them
benefits than impose a net cost on those above the median income or can create an illusion of satisfying the
demonstration effect of the lower strata.
1.3 Public Expenditure in the Hands of Elected Representatives (MPLADS)
Given the list of pressures for the government, the growth of public expenditure simply reflects the success of
the government at reflecting the will of the median income voter (that caters the need of majority of the
population). What if the government fails to do that?
In a vast country like India, where people’s representatives most rightly meet to discuss on big issues like POTA,
Women’s Reservation Bill, Ram Mandir at Ayodhya etc., but issues of public expenditures in local areas are
neglected. Again, such expenditures in specific localities have use and impact those localities only. They do not
get any national significance or national attention unless media highlights its seriousness. Therefore, it becomes

5
the responsibility of the politicians who represent those localities to raise the issues and solve them. Indian
democracy is a multi-party democracy, so each locality does not necessarily have representative in the ruling
party (i.e., the government). Since, public expenditure is a medium to mobilise public opinion, the ruling party
would not like to initiate public expenditure in places where it does not have a representative. Again, the
members of the non-ruling party would be very happy to have some expenditure in their constituencies. Finally,
it’s a matter of taking credit from the expenditure incurred for the electoral benefits
Due to political considerations, places where the representatives are not from the ruling party for a long time,
remained under developed. Therefore, a demand arose that some autonomy should be the there in the hands a
public representative for undertaking key development works in their localities regardless of party affiliation. To
meet this demand, Members of Parliament Local Area Development Scheme (MPLADS) was announced on
23rd December 1993.
The idea behind the MPLADS was to ensure that local developmental issues of each and every constituency in
the country are addressed through a budgetary allocation for every MP (both Lok Sabha and Rajya Sabha).
The scheme is flexible enough to give space for peoples’ representatives to identify key issues in his/ her
constituency. The emphasis of the scheme is on creation of durable assets. Funds provided under the scheme
are not supposed to be used for incurring revenue expenditure. The guidelines stress that the funds can be used
for purposes such as provision of service support facilities. However, they will not include any recurring expenditure
like on staff to maintain such facilities.
The scheme provides for the allocation of funds not only for small community oriented projects like construction
of village roads, bridges, hospital buildings and community halls, but also works like purchase of computers for
government/ aided schools and educational institutions and equipment like x-ray machines etc for government
hospitals etc.
The salient features of the scheme in a nutshell are given in Box -4 below.
Salient Features of the Scheme
� MPLADS funds to be used for creating durable capital assets.
� Entitlement of Rs. 2 crore per annum per MP.
� Funds cannot be used for incurring revenue expenditure.
� Funds can be used for provision of service support facilities, not for staff/ maintenance costs.
� For works, where execution goes beyond a year –payments can be made in advance or in course
of the work.
� Assets created under the scheme are for public use and the ownership vests with the government.
� Maintenance of Assets is by the beneficiary organization subject to audit and inspection by the
government.
� Assets creation can be on government land.
� Prohibition on using Private contractors.
� At present the Ministry of Statistics and Programme Implementation administers the Scheme at the
Centre and Office of the District Collector/ DRDA/ District Planning Officer at the Constituency
level.
Till 31st July 2002, i.e., from 1993-2002, a total amount of Rs. 9780 crore had been released out of
which Rs. 7253 crore were spent. About 6.8 lakh works had been recommended by the MPs under the
scheme of which about 4.6 lakh works were completed by July 2002.
Box 4

6
1.4 Working of MPLADS: CAG View
The scheme design may have a very broad vision and objective. But as is the case with many of the other
enthusiastic schemes, the problems of MPLADS are with its actual implementation. The reports by the Comptroller
and Auditor General (CAG) tabled for discussion in Lok Sabha on 17th April 2001 pointed out persistent
irregularities in MPLADS and that the situation worsened from 1998, when the first audit on MPLADS was
submitted to the Parliament. The working of MPLADS in the last 10 years has been marred by all kinds of
irregularities.
With our objectives of this study in the background, CAG report is a useful guide since it points out the
irregularities observed in the scheme. But while the CAG reports are extremely informative they do not pin
down the exact reasons for the kind of irregularities observed, as it’s an audit report.
A very brief analysis of the issues highlighted by CAG of India in this regard is given below. CAG Report-
2001 enumerates the issues on the working of MPLADS at various levels;
� Problems of administration at the level of Ministry of Statistics and Programme Implementation,
� Irregularities at the level of recommendation of works by MPs,
� Sanction of funds by the District Heads,
� Execution of schemes by implementing agencies and
� Monitoring by MPs, District Heads etc.
� CAG Report-2001 mentions the low rate of utilisation of funds under the scheme. For the period 1993-
2000, Ministry released Rs 5018 crore for the scheme out of which only Rs. 3221 crore were utilised, i.e. a
mere 64% rate of utilisation.
� The Ministry itself is confused about the release procedure of funds .One provision in the guidelines of the
Ministry relates release of funds to utilisation of funds and execution of works, whereas another provision
relates it to the amount sanctioned by the DC. At the same time release of funds is not linked to the end
use for which the funds are put.
� The Ministry has failed to obtain utilisation certificates in most cases from the District Heads. The District
Heads also have failed to obtain the utilisation certificate after the completion of works from the implementing
agencies. In the audit sample of 111 constituencies, The District Heads obtained utilisation certificates for
only 29.78 % of the total works. The Ministry continued to release funds without any confirmation of their
end use.
� District Heads reported inflated expenditure to the Ministry by reckoning the amount released to the
implementing agency as final expenditure.
� All this points to the fact that various authorities which are supposed to administer the scheme have very
mechanically assumed the role of releasing funds without any concern for the way funds are being used.
� CAG found instances of MPLAD funds being used for inadmissible purposes; such as building of government
offices, construction of temples and other places of worship, renovation and beautification of District Head’s
residence, works belonging to commercial and private organisations etc.
� The proportion of works taken up and completed by implementing agency is declining. In the period
1993-97, 89% of total value of works sanctioned by the DC was taken up and only 56.13% of them were
completed which declined to 86.41% and 39.42% respectively during the period 1997-2000.
� Around 30 percent of the total recorded expenses had been misreported, i.e., there never was any expenditure
actually incurred corresponding to what has been reported by the District Collectors.
� There are references of purchase of over billing, fake muster rolls, under payment of wages to the labourers
and appropriation of the difference after securing thumb impression and signatures, tinkering with labour
material ratio etc are some serious offences committed by agencies actually implementing the projects.

7
1.5 Evaluation by the Planning Commission
Evaluation report of the Planning Commission is based on the data and information gathered for the reference
period 1994-95 to 1998-99 from the interviews with a sample of MPs, State nodal departments, other development
functionaries and local people. Some of the findings of the study are given as below.
� Works recommended by a number of nominated and Rajya Sabha MPs in a single district has resulted in
the uneven distribution of funds apart from increasing the workload of District Heads and other officials
leading to weak monitoring and supervision.
� The largest proportion of works recommended are roads and bridges (29%) and community works (24%)
followed by education, drinking water and sanitation.
� In spite of huge unspent balances, MPs seemed to be thrifty while allocating funds for individual works. In
the sample of constituencies surveyed 46.4% of the works got an allocation of less than Rs 50,000/-, while
works with an allocation of Rs 5 lakh or more constitute 3.6% of the works.
� A large number of these petty works come under the head “Roads and Bridges”. The roads thus constructed
are often kutcha, short length and fail to connect effectively. This is not in conformity with the stated
objective of the scheme, which is to create durable assets.
� In some cases, insufficient appropriation in individual projects, lead to funds being supplemented from
other sources, in spite of the fact that a large proportion of funds are remaining idle with the ministry.
� Guidelines need to be changed so that funds are not thinly distributed over a large number of projects.
� As a result of small amounts being allocated for individual projects, a large amount of unspent balances
have accumulated over the years. In this regard some people, including the MPs interviewed, suggest that
funds under the scheme should be made lapsable. This provision if made in the guidelines is likely to
motivate the MPs to allocate larger amounts for individual projects.
� In majority of the cases, allocation of the fund is done simultaneously with recommendation of works. Cost
estimates are prepared afterwards and made to conform to the amount allocated by the MP.
� In the Guidelines, there is absolutely no provision preventing MPs from allocating their funds before the
cost estimates have been prepared.
� There is large-scale involvement of private contractors in the implementation of works.
� The DCs instead of selecting an implementing agency themselves, have sought advice from the MP. In
many cases MPs have themselves recommended the executing agency to be involved. In fact pressure from
MP might be an important reason why private contractors are engaged.
1.6 Assessment by Others
Besides these important reports by the CAG and the Planning Commission, there are reports by the Rajya
Sabha and Lok Sabha committees on the MPLADS. These reports basically look into the requests of the MPs to
spend their MPLAD funds for purposes, which are ambiguous and inadmissible under the rules. For example,
third report of the Rajya Sabha Committee deliberated on and finally suggested that each MP can spend up to
Rs 10 lakh from his or her MPLAD funds towards reconstruction in Orissa after the super cyclone. Similarly the
second report of the same committee suggested amendments to the guidelines.
Also available are a number of news items, and articles have been written by different scholars and activists in
recent times. However, most of these articles are based on two reports of the Comptroller and Auditor General
of India and reiterated the findings of CAG. These articles do provide useful insights and valuable suggestions
on the issue and valuable suggestions. A few of such suggestions are given below.
� The scheme has become an instrument of corruption as is evident from the recently hyped Uttar Pradesh
Chief Minister’s case of alleged bribery
� The actual implementation have been against the spirit of the Guidelines as seen from the alleged cases of
building temples in the name of development

8
� The concept of MPLADS is fundamentally flawed.
� It has changed the role of an MP who is primarily responsible to look after legislative work and to ensure
accountability of the administration.
� Now, the MPs have to involve themselves in the entire system of implementation and completion of the
project, become a part of the administrative system of the government and therefore lose their moral right
to scrutinise the faithfulness, wisdom and economy of the expenses incurred in the administrative
implementation of the works initiated by them under the scheme.
� It has diverted the attention of the Members of Parliament from the failures of planning and administrative
performance at broader levels and confined their attention to some small schemes restricted to individual
constituencies.
� It has been suggested that proper awareness on the issue should be created so that people know how
much money is being allotted to their constituency and a forum for the people should be created so that
they can question the concerned MLA/MP when they see that things are not proper.
� The MPs and MLAs should be put through some kind of training in project management and basic ethics.
� District collectors should not be given any money only on the basis of MPs’ recommendations but should
be made to write proposals with substantial data/ argument to get any money.
� Even when the MPs are vested with financial powers to do something in their constituencies, they hardly
do anything tangible for the betterment of farmers and for rural development.
� They are in the habit of politicising these issues only to meet their narrow political goals while farmer in
different corners of the country are committing suicides and are likely to face the adverse impacts owing to
the removal of quantitative restrictions on imports of farm produce.
In this chapter, we discussed the theoretical framework under which elected representatives opt for having more
financial powers for development works and how public expenditure for the provisions of goods for the use of
common mass are motivated by the electoral motives. In the subsequent sections of this chapter we presented
different opinions on problems and prospects surrounding MPLADS from the perspective of those who have
dealt with the Scheme; like the CAG, the Planning Commission and newspapers. In the next chapter, we shall
make an attempt to study in detail the pros and cons of the rules governing the scheme, the budgetary allocations
and the Parliamentary questions on the scheme.

9
2.1 Provisions under the Scheme
2.1.1 Introduction
The common people frequently approach the elected representatives frequently (during their visits to the
constituencies) for taking up small developmental works of capital nature. Since the issues and problems
related to development are varied and it is not always possible nor is it justified to work on whatever
popular demand is. There is also an apprehension of misuse of funds (as a pertinent feature of welfare
schemes under capitalism). Therefore the requirement arises that each and every scheme for development to
be directed through a well-defined and specific set of guidelines. However, it is also true that such
guidelines should never be a watertight compartment so that exceptional situations cannot be incorporated.
In case of MPLADS also there were sets of guidelines issued by the Ministry Rural Development in 1994
February who initially who initially nodded the scheme. These guidelines were eventually revised in
December 1994. Based on the suggestions of MPs and evaluation committees circulars were released from
the Ministry on operational details of the scheme from time to time. Revision of guidelines took place in
1997 February, 1999 September, and the latest in 2002 April by the Ministry of Planning and programme
Implementation of the Central Government.
Under the guidelines of MPLADS, each Lok Sabha MP has the choice to suggest to the District Head
works up to Rs. 2 crore per year to be taken up in his/ her constituency. MPs of Rajya Sabha can do so
in any district of the state from which they are elected and in case of Nominated Members, they can select
and recommend works for implementation in one or more districts anywhere in the country. However,
under conditions of natural calamities of rare severity MPs are permitted to recommend works outside their
constituencies for the rehabilitation measures of capital nature for an amount not exceeding Rs.10 lakh, for
each calamity. However, in certain cases, this amount has been enhanced up to Rs. 25 lakh with the
recommendation of the MPLADS Committee. For instance, the Eighth Report of MPLADS Committee in
Lok Sabha addressed a request from certain MP Shri Ramdas Aggarwal (RS) on 30th July 2001 regarding
permission for spending Rs. 25 lakh for relief works in flood affected Orissa. The recommendation of the
Committee is given in Box-5.
MPLADS in India:
An Assessment2
Recommendation of the MPLADS Committee on Relaxing the Limit
“…. The committee consider the proposal of Shri Ramdas Aggarwal, MP (RS) regarding giving permission
to contribute Rs. 25 lakh towards Orissa flood relief from his quota of MPLADS Funds. The committee
note that under Para 1.3 of the Guidelines on MPLADS, MPs can recommend works outside their
constituencies, states for construction of assets that are permissible in the Guidelines for rehabilitation
measures in the event of a natural calamity of rare severity in any parts of the country for an amount
not exceeding Rs. 10 lakh for each calamity. However, keeping in view that the amount being given is
for rehabilitation measures for the people affected by floods in Orissa recently, the committee permits the
honourable members to contribute an amount of Rs. 25 lakh towards Orissa flood relief as a special
case.”
Source: Eighth Report, MPLADS Committee, Lok Sabha
Box 5

10
2.1.2 Features of the Scheme
� The MP recommends the works to the concerned district head and the latter gets them implemented
following the established norms. Implementation of works in urban areas can be done through the
commissioners, chief executive officers of the municipalities etc or through the district head as per the wish
of the MP. The agencies may be the government, PRIs or any capable NGOs. Any PWD wings having
competence in civil construction (for example, public health, Engineering, the rural housing wings, electricity
board, urban development authorities etc) can be engaged. Engagement of private contractor or advance
to contractors or suppliers is prohibited under the scheme.
� There should be emphasis on the creation of durable capital assets to capture the locally felt needs. No
revenue expenditure is permissible under the scheme. However, there have been exceptional cases when
the committee have given permission to the concerned MP to even purchase books for libraries from
MPLADS funds. One such case, with the recommendation of the committee is cited in Box-6.
Seeking ex-post facto approval for purchase of literary books for distribution in
schools and public libraries under MPLADS in Sikkim.
“Shri Pawan Chamling, hon’ble Chief Minister, Sikkim addressed a letter dated 28th December 2001 to
hon’ble Chairman, Committee on MPLADS regarding seeking ex-post facto approval for purchase of
literary books for distribution in schools and public libraries under MPLADS for consideration of the
Committee on MPLADS.——————————The Committee consider the proposal regarding giving
ex-post facto approval for purchase of books for distribution in schools and public libraries under MPLADS
in Sikkim. The Committee are of the view that the books, which were purchased from the MPLADS
funds of hon’ble member, Shri Bhim Dahal, were of eminent authors like Parijat and contended the
theme of women’s emancipation and social reawakening. Further, the books were meant to be distributed
among the school children. Keeping in view the foregoing, the committee approve the proposal of hon’ble
member for giving ex-post facto approval and one time exception in the case relating to the purchase of
books made during the year 1997-98 and 1998-99 amounting to Rs. 20 lakh under MPLADS in Sikkim.
The committee also feel that it should be treated as a special case and not to be quoted as a precedent in
future.”
Source: Tenth report, MPLADS Committee Lok Sabha
Box 6
Suggestions regarding contribution of Rs.25 lakh under the quota of MPLADS to
meet the part cost of the construction work of 3rd
Floor building in the Faculty of
Pharmacy of Hamdard University.
“The Ministry of Statistics and Programme Implementation addressed a communication dated 19th
December, 2001 to the Lok Sabha Secretariat enclosing therewith a copy of letter dated 29th November,
2001 from the chief Engineer, Municipal Corporation of Delhi containing there with the Proposal of Dr.
A. R. Kidwai, MP (RS) regarding contribution of Rs. 25 lakh under the quota of MPLADS to meet the
part cost of construction work of the 3rd Floor in the Faculty of Pharmacy of Hamdard University.
Recommendation:
6.3: The committee consider the proposal of hon’ble member regarding contribution of Rs. 25 Lakh
under the quota of MPLADS to meet the part cost of the construction of 3rd floor and approve it as it
relates to giving a relaxation in the limit of Rs 25 lakh for construction of a building in the faculty of
Pharmacy in the Hamdard University under MPLAD Scheme.”
Source: Tenth report, MPLADS Committee Lok Sabha
Box 7

11
� For completion of some big works, there can be spending for such part works. For instance, a 25 percent
of the total budget for the construction of a bridge can be made from MPLADS if and only if there is
guarantee for the other 75 percent guaranteed or is already completed. As illustrated in Box-7.
� In cases where execution of work spans to more than a year, the money may be given to the executing
agencies in advance or by phasing into different projects.
� The ownership of the assets created under MPLADS vests with the government and maintenance of such
assets is to be handed over to beneficiary organisations under a formal agreement, which should be made
before spending the funds. The District Heads are to ensure formation of such beneficiary organisations or
the maintenance through the government aided institutions, registered society etc.
2.1.3 Sanction and Execution of Works
� The MP should identify the project, and s/he should also recommend it to the District Head. If for any
technical reason (which includes the issues like whether the land selected is suitable for execution of the
works)the execution cannot be done in concurrence with the MP’s recommendation, then the District Head
should send a comprehensive report with reasons to the MP as well as to the Ministry of Statistics and
Programme Implementation within 45 days from the date of receipt of proposal from the MP. The final
powers to provide technical and administrative sanction rests with the district functionaries only.
Relaxation in the upper limit of Rs. 25 lakh for construction of two bridges.
“7.1: The Ministry of Statistics and Programme Implementation addressed a communication dated 22
January, 2002 to Lok Sabha Secretariat enclosing therewith a copy of letter dated 15th January, 2002
from Shri Rajesh Ranjan alias Pappu Yadav, MP (LS) regarding relaxation in the upper limit of Rs. 25
Lakh for construction of two bridges at an estimated cost of Rs. 37 lakh and Rs. 67 lakh respectively
under MPLADS in Purnea Parliamentary Constituency.
Recommendation:
7.4: The Committee note the proposal of Shri Rajesh Ranjan alias Pappu Yadav, MP (LS) regarding
relaxation in the upper limit of Rs 25 lakh for the construction of two bridges under MPLADS in Purnea
Parliamentary Constituency and approves it as a specific case.”
Source: Para 7.1, Tenth report, MPLADS Committee Lok Sabha
Box 8
� The District Head is responsible for the coordination and overall supervision of the works at the district
level and the Ministry has the nodal responsibilities at the centre. The financial and audit procedures are
relevant for all the actions taken by district functionaries involved in the scheme.
� In case, the concerned MP changes within a year, the District Head will act as a coordinator between the
past and present MP as well as implementing agencies. All incomplete works recommended by the
predecessor MP should be completed and all works sanctioned but not started can be executed subject to
the confirmation of the successor MP. If such a case happens for Rajya Sabha MPs, then the unspent
balance left by the predecessor MPs in the State is to be distributed among all successor Rajya Sabha MPs
in that State. The same procedure applies to nominated MPs as well.
2.1.4 Release of Funds
� As a directive, MPs can suggest works costing up to Rs. 25 lakh per work. However for works of capital
nature requiring more than Rs. 25 lakh, such spending can be if the cost calculation is legitimate. A
number of such cases have been explained and recommendations were made in the 10th report of the
committee on MPLADS in 13th Lok Sabha. (See Box -3, 4 and 5)
� However, the Ministry has also issued a clarification on the limit of Rs. 25 lakh per work under MPLADS
as there has been cases of misunderstanding the guidelines and discrepancies of opinion regarding this
issue of Rs. 25 lakh (See Box-9)

12
� These non-lapsable funds under MPLADS shall be released to the concerned districts each year immediately
after the Union Budget is passed. The release however shall be made (in accordance with the actual
progress achieved in expenditure and execution of works), two times a year. However, instalment of Rs. 1
crore in respect of an MP would be used once the District Heads provide information that the balance
amount comes too less than Rs. 50 lakhs.
Suggestion regarding construction of First Floor building of the Friend-in-need-Society,
an old age home in Chennai
“ 9.1: The Ministry of Statistics and Programme Implementation addressed a letter dated 24 December,
2001 to Lok Sabha Secretariat enclosing therewith a copy of letter dated 20th December 2001 from
Dr. Smt. Beatrix D’Souza, MP (LS) regarding construction of First Floor building of Friend-in-need-Society,
an old age home in Chennai, Tamil Nadu at an estimated cost of Rs. 35 lakh under MPLADS.
Recommendation:
9.4: The Committee note the proposal of Dr. Smt. Beatrix D’Souza, MP (LS) regarding giving relaxation
beyond the limit of Rs. 25 lakh for construction of First Floor building of Friend-in-need-Society, an old
age home in Chennai under MPLADS and approve it as it relates to a philanthropist work proposed
under the scheme.
Source: Tenth report, MPLADS Committee Lok Sabha
Box 9
Clarification on limit of Rs.25 lakh per work under MPLADS
“The Ministry of Statistics and Programme Implementation have addressed letters dated 28th November
and 26th December, 2001 to Lok Sabha Secretariat enclosing therewith a copy each of letter from Dr.
Akhtar Hassan Rizvi, MP(RS) respectively regarding clarification on limit of Rs 25 lakh per work under
MPLADS.————————
Recommendation:
10.6: The Committee consider the proposal of Dr. Akhtar Hassan Rizvi, and Shri Vijay Darda MPs (RS)
regarding clarification sought by them on limit of Rs. 25 lakh per work under MPLADS. The Committee
recommend allowing as follows.
(1) The cost limit of Rs. 25 lakh stipulated in Para 4.1 of the guidelines of MPLADS is to be made
applicable to each work. project of an institution under the scheme.
(2) The works relating to the genuine cases of Trusts/ Societies would be considered by the committee
after having got them verified from the Ministry/ State Governments under the MPLADS.
(3) The benefits of MPLADS would not be given to a registered society/trust, if the member who has
forwarded such proposal was the president/ chairman or the member of the managing committee
etc, or trustee of the registered society/ trust in question, and,
(4) Each case costing more than Rs. 25 lakh would be examined by the committee on MPLADS.”
Source: Tenth report, MPLADS Committee Lok Sabha
Box 1
0
� Release of funds for individual works should be through the administration authority available nearest to
the work spot, like a block development officer (BDO) at the rate of up to 75 percent of the cost of the
work in the first instalment and the rest 25 percent after watching the progress. However, if the concerned
MP is not satisfied with the utilisation of funds or interested in continuing with the works, s/he should write
to the Ministry, so that the release of funds can be withdrawn.
� Funds released under the scheme is to be deposited in a nationalised commercial bank and the interest
accrued may be used for the works approved under the scheme.

13
2.1.5 Monitoring of the Scheme
� The District Heads are to personally visit and inspect at least 10 percent of the works every year involving
MPs as far as possible. The MPs and the Ministry are to be informed about the progress through ministry
reports once in two months so that a complete and updated picture of the works under implementations is
always there with the Ministry. The District Heads also need to communicate information on the progress
of works via Internet to the ministry.
� A yearly meeting of all the district heads, MPs and the chief secretaries of the state to be conducted for
assessing the progress of works under the scheme.
� With the help of IGNOU, and ISRO, the Ministry shall organise periodic teleconferences to establish contact
with the District Heads, MPs and other local functionaries to clarify the doubts and to remove the bottlenecks.
2.1.6 Other General Provisions
� A board displaying the amount spent, name of the MP, year as well as an inscription “MPLAD Work”
should be permanently and prominently erected at the work site.
� The MPs can ask the Ministry for clarifications on some special problems and situations not envisaged and
covered under the guidelines on MPLADS.
� MPs can recommend funds towards contributions of the state government in any centrally sponsored scheme
in their constituencies.
2.1.7 List of Works that can be Covered under MPLADS
1. Construction of buildings for schools, hostels, libraries and other buildings of educational institutions belonging
to Government or local bodies. Such buildings belonging to aided institutions and unaided but recognised
institutions can also be constructed provided, however, that the institution be in existence for not less than
two years.
2. Construction of tube-wells and water tanks for providing water to the people in villages, towns or cities, or
execution of other works, which may help in this respect. Water tankers can also be purchased for providing
drinking water.
3. Construction of roads including part roads, approach roads, link roads etc. in villages and towns and cities.
Very selectively kutcha roads can also be constructed where the MP concerned and the District Head agree
to meet the locally felt need.
4. Construction of culverts/bridges on the roads of above description and of open cut or tube wells.
5. Construction of common shelters for the old or handicapped.
6. Construction of buildings for local bodies for recognised District or State Sports Associations and for cultural
and sports activities or for hospitals. Provision of multi-gym facilities in gymnastic centres, sports associations,
physical education training institutions etc. is also permissible.
7. Special forestry, farm forestry, horticulture, pastures, parks and gardens in Government and community
lands or other surrendered lands.
8. De-silting of ponds in villages, towns and cities.
9. Construction of public irrigation and public drainage facilities.
10. Construction of common gobar gas plants, non-conventional energy systems/devices for community use
and related activities.
11. Construction of irrigation embankments, or lift irrigation or water table recharging facilities.
12. Construction of public libraries and reading rooms.
13. Construction of creches and anganwadis.
14. Construction of public health care buildings, including family welfare sub-centres together with the ANM
residential quarters. Such buildings belonging to aided institutions also can be constructed.

14
15. Construction of crematoriums and structures on burial/cremation grounds.
16. Construction of public toilets and bathrooms.
17. Construction of drains and gutters.
18. Construction of footpaths, pathways and footbridges.
19. Provision of civic amenities like electricity, water, pathways, public toilets etc. in slum areas of cities, town
and villages and in SC/ST habitations, provision of common work-sheds in slums and for artisans.
20. Construction of residential schools in tribal areas.
21. Construction of bus-sheds/stops for public transport passengers.
22. Construction of veterinary aid centres, artificial insemination centres and breeding centres.
23. Procurement of hospital equipment like X-Ray machines, ambulances for Government Hospitals and setting
up of mobile dispensaries in rural areas by Government Panchayati Institutions. Ambulances can be provided
to reputed service organisations like Red Cross, Ramakrishna Mission etc.
24. Electronic Projects:
i) Computer in education project of High school/College
ii) Information footpath
iii) Ham Club in high schools
iv) Citizen band radio
v) Bibliographic database projects.
25. Construction of Level Crossing at unmanned Railway crossing.
26. Purchase of Audio-Visual Aids of educational nature for Government, Government-aided and also unaided
but Government recognised educational institutions provided there is proper place and proper provision
for safe custody of these aids.
27. Purchase of Night Soil Disposal System for local bodies.
28. Purchase of motorboats for flood and cyclone affected areas.
29. “Works related to animal care/ welfare like construction of buildings / shelters, provision of ambulances,
medical equipment and development of infrastructure facilities like provision of drinking water, drainage etc.”
30. Purchase of motorboats for flood and cyclone affected areas.
31. “Works related to animal care/ welfare like construction of buildings / shelters, provision of ambulances,
medical equipment and development of infrastructure facilities like provision of drinking water, drainage etc.”
2.1.8 List of Works not Permissible Under MPLADS
1. Office buildings, residential buildings, and other buildings relating to Central or State Governments,
Departments, Agencies or Organisations.
2. Works belonging to commercial organisations, private institutions or co-operative institutions.
3. Repair and maintenance works of any type other than special repairs for restoration/up-gradation of any
durable asset.
4. Grant and loans.
5. Memorials or memorial buildings.
6. Purchase of inventory or stock of any type.
7. Acquisition of land or any compensation for land acquired.
8. Assets for all individual benefit except those, which are part of, approved schemes.
9. Places for religious worship.

15
2.2 Union Budget and MPLADS
MPLADS started on 23rd December 1993, but only three months of the financial year 1993-94 were remaining.
Obviously, this scheme had no budgetary provision. However, for the remaining part of the financial year, the
then Prime Minister Mr. P. V. Narasimha Rao announced a token amount of Rs. 5 lakh per MP which were
released immediately after the announcement of the scheme. It is interesting, that there was no allocation for
the scheme even in Budget 1994-95. It figured as an item for the 1994-95 Revised Estimates (see table-2), in
the demand for grants of Ministry of Rural Development with a major head number 2553. As there was no
provision for MPLADS in the Budget Estimates of 1994-95, in order to incorporate it in the revised estimates
for 1994-95, the Ministry of Rural Development proposed a massive cut in the budgetary allocations in items
meant for rural development. Table–1 illustrates the reduction in the allocation made in order to incorporate
MPLADS. There has been a reduction up to 21. 55 percent in central employment generation programme JRY
and around 5 percent in Employment Assurance Schemes. Similarly, there had been a reduction in the total
allocations for agricultural marketing up to 29.25 percent, for total housing up to 25 percent and for land
reforms up to 29.6 percent. This may reflect the callousness on the part of the government as far as allocations
for newly introduced schemes are concerned. Interestingly, the Finance Minister in his budget speeches did not
mention a word about this newly introduced scheme. In the Consolidated Fund of India, the allocations for
MPLADS are included in the revenue disbursements under Special Area Programme of Economic Services with
a Major Head number 2553.
Table - 1
Reduction in Allocation by Ministry of Rural Development to Accommodate MPLADS
(In crore of Rupees)
Items 1994-95 1994-95
Budget Estimate Revised Estimate
Rural Water Supply and Sanitation 950.63 870.73
○ ○ ○ ○ ○ ○ ○ ○ ○ ○ ○ ○ ○ ○ ○ ○ ○ ○ ○ ○ ○ ○ ○ ○ ○ ○ ○ ○ ○ ○ ○ ○ ○ ○ ○ ○ ○ ○ ○ ○ ○ ○ ○ ○ ○ ○ ○ ○ ○ ○ ○ ○ ○ ○ ○ ○ ○ ○ ○ ○ ○
(8.40)
Total Special Programme for Rural Development 859.00 855.00
○ ○ ○ ○ ○ ○ ○ ○ ○ ○ ○ ○ ○ ○ ○ ○ ○ ○ ○ ○ ○ ○ ○ ○ ○ ○ ○ ○ ○ ○ ○ ○ ○ ○ ○ ○ ○ ○ ○ ○ ○ ○ ○ ○ ○ ○ ○ ○ ○ ○ ○ ○ ○ ○ ○ ○ ○ ○ ○ ○ ○
(0.50)
Jawahar Rojgar Yojana 1477.90 1165.25
○ ○ ○ ○ ○ ○ ○ ○ ○ ○ ○ ○ ○ ○ ○ ○ ○ ○ ○ ○ ○ ○ ○ ○ ○ ○ ○ ○ ○ ○ ○ ○ ○ ○ ○ ○ ○ ○ ○ ○ ○ ○ ○ ○ ○ ○ ○ ○ ○ ○ ○ ○ ○ ○ ○ ○ ○ ○ ○ ○ ○
(21.55)
Employment Assurance Scheme 1200.00 1140.00
○ ○ ○ ○ ○ ○ ○ ○ ○ ○ ○ ○ ○ ○ ○ ○ ○ ○ ○ ○ ○ ○ ○ ○ ○ ○ ○ ○ ○ ○ ○ ○ ○ ○ ○ ○ ○ ○ ○ ○ ○ ○ ○ ○ ○ ○ ○ ○ ○ ○ ○ ○ ○ ○ ○ ○ ○ ○ ○ ○ ○
(5.00)
Agricultural Marketing 17.57 12.43
○ ○ ○ ○ ○ ○ ○ ○ ○ ○ ○ ○ ○ ○ ○ ○ ○ ○ ○ ○ ○ ○ ○ ○ ○ ○ ○ ○ ○ ○ ○ ○ ○ ○ ○ ○ ○ ○ ○ ○ ○ ○ ○ ○ ○ ○ ○ ○ ○ ○ ○ ○ ○ ○ ○ ○ ○ ○ ○ ○ ○
(29.25)
Total Housing 30.00 22.50
○ ○ ○ ○ ○ ○ ○ ○ ○ ○ ○ ○ ○ ○ ○ ○ ○ ○ ○ ○ ○ ○ ○ ○ ○ ○ ○ ○ ○ ○ ○ ○ ○ ○ ○ ○ ○ ○ ○ ○ ○ ○ ○ ○ ○ ○ ○ ○ ○ ○ ○ ○ ○ ○ ○ ○ ○ ○ ○ ○ ○
(25.00)
Land Reforms 39.50 27.82
(29.56)
Figures in the parentheses indicates the percentage of reduction from the initial allocation
Source: Expenditure Budget Volume –II, 1995-96
What is interesting is that the provision for MPLADS is the inclusion in the plan expenditure as a part of central
assistance for state plans. There is no justification for such a classification, as the money does not go to
the state exchequer but directly to the District Collectors who spend it on the projects recommended by MPs.
Neither can it be a part of assistance to the state governments, as the state planning authority does not have a
say/intervene as far as planning of usage of MPLADS funds.
Another important point here is, that right from inception, the Ministry of Statistics and Programme Implementation
(who took over MPLADS in 1995-96 as the Central nodal agency), stating in the Guidelines of MPLADS that
the money will be utilised for creation of capital assets only. The guidelines assert that the ownership of such

16
assets of MPLADS will be entrusted to the government only. The guideline in subsections under Para-2 clearly
mentions that no revenue expenditure should be incurred from the scheme. Under such conditions, why is
MPLADS allocation made under revenue disbursements in the Union Budget?
Table 2 shows that though there is a uniformity in budget estimates for the allocations under MPLADS, there
have been discrepancies as far as actual expenditure and revised estimates are concerned. For example, in the
year 1997-98, the actual expenditure was Rs 488.5 crore as against Rs 790 crore in budget and revised estimates.
This is because the ministry could not release the funds due to lack of recommendation by the MPs. But the
irony is, in the very next year the Prime Minister announced to double the amount of allotment from Rs 1 crore
per MP per year to Rs. 2 crore per MP per year. Due to this reason, the total budget estimate in the year 1999-
2000 jumped to Rs. 1580.00 crore from Rs. 790 crore in the previous year.
Table-2
Budgetary Allocations for MPLADS
Year Budget Estimates Revised Estimates Actual Allocation
○ ○ ○ ○ ○ ○ ○ ○ ○ ○ ○ ○ ○ ○ ○ ○ ○ ○ ○ ○ ○ ○ ○ ○ ○ ○ ○ ○ ○ ○ ○ ○ ○ ○ ○ ○ ○ ○ ○ ○ ○ ○ ○ ○ ○ ○ ○ ○ ○ ○ ○ ○ ○ ○ ○ ○ ○ ○ ○ ○ ○
1993-94 0 0 —
○ ○ ○ ○ ○ ○ ○ ○ ○ ○ ○ ○ ○ ○ ○ ○ ○ ○ ○ ○ ○ ○ ○ ○ ○ ○ ○ ○ ○ ○ ○ ○ ○ ○ ○ ○ ○ ○ ○ ○ ○ ○ ○ ○ ○ ○ ○ ○ ○ ○ ○ ○ ○ ○ ○ ○ ○ ○ ○ ○ ○
1994-95 0 790 775.00
○ ○ ○ ○ ○ ○ ○ ○ ○ ○ ○ ○ ○ ○ ○ ○ ○ ○ ○ ○ ○ ○ ○ ○ ○ ○ ○ ○ ○ ○ ○ ○ ○ ○ ○ ○ ○ ○ ○ ○ ○ ○ ○ ○ ○ ○ ○ ○ ○ ○ ○ ○ ○ ○ ○ ○ ○ ○ ○ ○ ○
1995-96 790 772 763.50
○ ○ ○ ○ ○ ○ ○ ○ ○ ○ ○ ○ ○ ○ ○ ○ ○ ○ ○ ○ ○ ○ ○ ○ ○ ○ ○ ○ ○ ○ ○ ○ ○ ○ ○ ○ ○ ○ ○ ○ ○ ○ ○ ○ ○ ○ ○ ○ ○ ○ ○ ○ ○ ○ ○ ○ ○ ○ ○ ○ ○
1996-97 790 778 776.38
○ ○ ○ ○ ○ ○ ○ ○ ○ ○ ○ ○ ○ ○ ○ ○ ○ ○ ○ ○ ○ ○ ○ ○ ○ ○ ○ ○ ○ ○ ○ ○ ○ ○ ○ ○ ○ ○ ○ ○ ○ ○ ○ ○ ○ ○ ○ ○ ○ ○ ○ ○ ○ ○ ○ ○ ○ ○ ○ ○ ○
1997-98 790 790 488.50
○ ○ ○ ○ ○ ○ ○ ○ ○ ○ ○ ○ ○ ○ ○ ○ ○ ○ ○ ○ ○ ○ ○ ○ ○ ○ ○ ○ ○ ○ ○ ○ ○ ○ ○ ○ ○ ○ ○ ○ ○ ○ ○ ○ ○ ○ ○ ○ ○ ○ ○ ○ ○ ○ ○ ○ ○ ○ ○ ○ ○
1998-99 790 790 789.59
○ ○ ○ ○ ○ ○ ○ ○ ○ ○ ○ ○ ○ ○ ○ ○ ○ ○ ○ ○ ○ ○ ○ ○ ○ ○ ○ ○ ○ ○ ○ ○ ○ ○ ○ ○ ○ ○ ○ ○ ○ ○ ○ ○ ○ ○ ○ ○ ○ ○ ○ ○ ○ ○ ○ ○ ○ ○ ○ ○ ○
1999-00 1580 1580 1390.24
○ ○ ○ ○ ○ ○ ○ ○ ○ ○ ○ ○ ○ ○ ○ ○ ○ ○ ○ ○ ○ ○ ○ ○ ○ ○ ○ ○ ○ ○ ○ ○ ○ ○ ○ ○ ○ ○ ○ ○ ○ ○ ○ ○ ○ ○ ○ ○ ○ ○ ○ ○ ○ ○ ○ ○ ○ ○ ○ ○ ○
2000-01 1580 1830 2080.00
○ ○ ○ ○ ○ ○ ○ ○ ○ ○ ○ ○ ○ ○ ○ ○ ○ ○ ○ ○ ○ ○ ○ ○ ○ ○ ○ ○ ○ ○ ○ ○ ○ ○ ○ ○ ○ ○ ○ ○ ○ ○ ○ ○ ○ ○ ○ ○ ○ ○ ○ ○ ○ ○ ○ ○ ○ ○ ○ ○ ○
2001-02 4080 * 1730 1800.00
○ ○ ○ ○ ○ ○ ○ ○ ○ ○ ○ ○ ○ ○ ○ ○ ○ ○ ○ ○ ○ ○ ○ ○ ○ ○ ○ ○ ○ ○ ○ ○ ○ ○ ○ ○ ○ ○ ○ ○ ○ ○ ○ ○ ○ ○ ○ ○ ○ ○ ○ ○ ○ ○ ○ ○ ○ ○ ○ ○ ○
2002-30 1580 1580 1600.00
○ ○ ○ ○ ○ ○ ○ ○ ○ ○ ○ ○ ○ ○ ○ ○ ○ ○ ○ ○ ○ ○ ○ ○ ○ ○ ○ ○ ○ ○ ○ ○ ○ ○ ○ ○ ○ ○ ○ ○ ○ ○ ○ ○ ○ ○ ○ ○ ○ ○ ○ ○ ○ ○ ○ ○ ○ ○ ○ ○ ○
2003-04 1580 1580 —
2004-05 Interim 1580
Source: Annual Financial Statements for Different Years
* In spite of the fact that the Ministry of Statistics and Programme Implementation in its Demand for Grants had asked for only
1580 Crore for the budget year 2001-02.
2.3. Parliament and MPLADS
There are instances where the views of the Members of Parliaments do not coincide with district functionaries.
To resolve these problems, the Ministry of Statistics and Programme Implementation has formulated two different
committees on MPLADS. Apart from the reports published by the MPLADS committees for Lok Sabha as well
as Rajya Sabha MPs, time and again, the issue has been raised in the question hour sessions in the Parliament.
[0In due course, the Minister of Statistics and Programme Implementation had addressed the issues]. We found
that in a number of cases the questions were repeated by various members and the stereo type answers were
reiterated, and analysis reflects the level of concern of our respectable MPs have. In this section of our study, we
have highlighted some of these issues through the questions raised in the Parliament.
2.3.1 Slow Pace of Work
Number of Parliament questions has been raised regarding slow pace of works undertaken through MPLADS.
These include:
� Delay in release of funds,
� Delay in processing recommendations received from MPs by district authorities,
� Delay in the preparation of estimates by the concerned agencies,

17
� Delay in the issue of financial sanction by the district heads,
� Noncompliance of time frame by the implementing agencies,
� Delay in transfer of funds from one district to another,
� Non-submission of expenditure statement by District Heads to the Central Government,
� Delay in acquisition of land.
2.3.2 Rate of Utilisation
It is interesting to note that several MPs, in different times have raised questions regarding information on the
level of utilization of MPLADS funds in their respective constituencies. The Ministry of Statistics and Programme
Implementation frequently updates the constituency wise information on MPLADS and during question hour
sessions, the Minister provides the same information only. Periodically, the MPs are provided with the information.
Still, the members don’t refrain from asking questions on rate of utilization and waste the precious time of the
parliament.
2.3.3 Norms on MPLADS
The Ministry on the norms of MPLADS has constituted detailed guidelines. There are two different committees
one each for each House of the Parliament. However, during Parliamentary sessions, the MPs seek clarification
on several procedural aspects on MPLADS.
To cite a few of those question, the one raised by member Shri Ravindra Kumar Pandey sought clarification on
the norms laid down to ensure quality of construction work (See Lok Sabha Unstarred Question no 3185,
answered on 12.03.2003). In answer to this query, the Minister said that the MPLADS works are executed
following the established work procedures of the state governments concerned and the reported cases of low
quality works are taken care of by the district heads and State Governments only. Member Shri Ram Tahal
Chaudhary sought clarification (See Lok Sabha Unstarred Question no 3724, answered on 21.03.2001) on
whether Sulabh International (an NGO in the field of sanitation) could be entrusted various works under MPLADS.
The Minister citing Para 2.1 of the Guidelines said that implementing agencies can be either government or
PRIs or any other reputed NGO and it is the District head to decide whether an NGO is of sufficient reputation
to be entrusted for MPLADS works. Questions were raised on whether the governments were contemplating to
allow MPs to purchase informative and valuable books for the libraries? (See Unstarred question No 3796.
answered on 13.12.2000) The answer of the Minister was ‘no’ and he stressed that whenever any such case is
brought to the notice of the government, the concerned district head is advised to reimburse the amount to
MPLADS fund. However, there have been instances when the MPs got permission to purchase books. Member
Shri Vishnudeo Sai sought clarification on the maintenance and upkeep of assets created under MPLADS (See
Unstarred Question No. 4415, answered on 22.04.2002). Answering this question the Minister said that the
assets created under MPLADS required to be included in the asset books as per the established procedure of
the concerned state governments and the district collectors shall ensure that provision for maintenance and
upkeep of the work to be taken up is forthcoming from the concerned beneficiary organization. There were
several other questions on clarifications on the norms of the scheme. With questions being repetitive, the same
answers were provided again and again.
2.3.4 Interest Accrued on MPLADS Fund
Questions were raised regarding use of interests (See for Example, Starred Question No. 364, answered on
19.04.2000) accrued on the funds released under MPLADS. Member Shri Uttamrao Dhikale raised this issue
that whether the interests accrued on the funds released under the MPLADS is for use in development work.
The honorable minister remarked that the interest accrued on the MPLADS funds deposited with nationalised
banks may be used at the recommendation of the MP concerned for the same purpose for which the basic
amount has been allocated. Information were also sought regarding whether some of the Collectors kept the
funds under MPLADS in Current Accounts with banks resulting in loss of interest to the exchequer? The answer
to this question was that all the District Heads have been advised to keep funds of the scheme in savings bank

18
accounts only in a nationalised bank. It is observed that the Minister often answered these questions very
mechanically, and there seems to be a lack of interest among the MPs as well as the Ministry in the operation of
the scheme.
2.3.5 Increasing Entitlement Amount from Two Crore
Time and again, members have demanded for increase in entitlement. The issue got attention in both the
committees of MPLADS and even the committee of Lok Sabha in its First Report have considered to raise this
amount to more than Rs.4 crore per year though the same committee was against revising the amount of
entitlement on the basis of population in proportion to the population of the constituency (See for example,
Para 5.7 and 5.8 of the First Report of the MPLADS Committee Lok Sabha). This is implicit from the questions
raised in the Parliament from time to time. We have incorporated here a few of those questions and their
answers. In answer to the question raised by Shri Satyavrat Chaturvedi, on whether the government proposes
any increase in the amount under MPLADS, the minister said that there is no such proposal by the government
to increase the entitlement. The minister gave the following reasons for not raising the amount (See for example,
Starred Question No. 551, answered on 25-04-2001).
� Since the funds are non lapsable, there was a carry forward liability of Rs. 786.5 crore as on 25th April
2001. This burdens the exchequer.
� Only around 65 percent of the total amount released could be spent and the rest are lying idle. At one
hand the government is borrowing funds at higher cost, but on the other hand, funds are lying idle in the
districts.
� The shortfall in utilisation has been adversely commented upon by the CAG in their reports laid in the
Parliament on 11th June 1998 and on 17th April 2001 on the grounds that funds were released without
any correlation with their end use, and the implementing agencies did not refund the unspent balance in
1/3rd of the sample cases audited by CAG. Irregular diversion of funds to inadmissible purposes, sanction
of works for commercial and private organizations, sanction of repair and maintenance costs, purchase of
stores, expenditure on places of religious worship, irregular sanction of loans, grants and donations, suspected
cases of fraud and a large number of incomplete or abandoned works were observed in the reports.
� Due to these reasons, the CAG had concluded that the scheme has failed in meeting its objectives.
The minister informed the members that the proposal of the MPLADS committee for raising the fund was
considered carefully, and it was not found feasible to accede to the same.
In the present chapter, we have discussed the various provisions under MPLADS by taking a tour through the
guidelines of the scheme, discussing budgetary provisions relating to MPLADS and how it has been funded in
the budget through the decade. There is also analysis of some of the important issues raised in the Parliament
in the question hour session. The following chapter discusses the secondary information collected by us on the
pattern and direction of the MPLADS funds in the sample constituencies.

19
3.1 Level of Utilisation
As discussed in the introductory chapter, a number of disturbing issues are associated with MPLADS scheme.
These issues have been frequently raised by statutory bodies like CAG of India as well as several other
academicians and activists. In this Chapter, we have made an attempt to analyse all those issues in the perspective
of the objective behind the implementation of this scheme. In addition to our effort to incorporate the most
recent information available from the Ministry of Statistics and Programme Implementation and several other
sources, we have tried to collect information regarding utilisation of MPLADS funds in several constituencies
across the country. We have attempted at analysing from a different angle, keeping in mind the overall political
dynamics prevailing behind the scheme.
The idea behind MPLADS lay in ensuring that no development issue, having a local perspective, should be
left un-addressed. Budgetary provisions are made in a manner that each member of the parliament gets an
opportunity to address the locally felt pressing needs of his/her constituency by spending a sum of Rs. 2
crore per annum. The motive was to substitute a mechanism for the centrally sponsored schemes. The aim
was - on one hand the locally needed projects get highlighted and there is a possibility of constructing a
structure for the local development expenditure, while on the other the excessive bureaucratic structure
associated with capital investment by the government, as prevailing in other schemes, can be avoided to a
great extent.
For the time being, we leave the issues highlighted by the CAG and others regarding misappropriation of funds
and corruption; and instead start with discussing the level of utilisation of the fund by the MPs.
3.1.1 Utilisation of Funds by Lok Sabha MPs
The members of Lok Sabha had used only 77 per cent of their total entitlement till July 2003. However, by the
end of January 2004, the level of utilisation increased to 81.29 percent over the released amount. Table 3
provides an overview of utilisation of MPLADS funds by members of Lok Sabha as on July 2003. The information
shows that out of the total entitlement of Rs. 7549.2 crore, only Rs. 7292.7 crore could be released to the
District Collectors on the basis of their request, of works, sent to the Ministry. However, only Rs. 7084.67 crore
could be sanctioned to the implementing agencies on administrative and technical grounds. Of this total sanctioned
amount, only Rs. 5879.37 crore was actually spent for development works. As is evident, this accounts for huge
amount of unspent balances of Rs. 1669.83 crore over entitlement, Rs. 1413.33 crore over release and Rs.
1205.3 crore over sanctioned amount respectively.
As far as rate of utilisation of Lok Sabha MPs are concerned, it is quite satisfactory to note that more than
92 per cent (503) of total (547) Lok Sabha MPs have actually spent more than 60 per cent of the amount
released for the development works prescribed by them. However, an interesting point to note here is that
around 4 per cent (23) of the total MPs have actually registered a more than 100 per cent
utilisation rate. This means that 23 MPs in Lok Sabha have spent around Rs. 329.41 crore against Rs.
317.1 crore entitlements, Rs. 315.1 crore releases and Rs. 318.61 crore sanctioned. Though the
information is quite confusing as in the accounting sense this is untenable, there is no
mention of it by the ministry when it provides the information on overall release and
utilisation. As far as accumulated amount of unspent balance by Lok Sabha MPs of different states since
1993 are concerned, around 95 per cent of the total release could get administrative and technical sanction
and 80 per cent of the total release amount could be spent.
UUUUUtilisation and PPPPPattern of EEEEExpenditure
under MPLADS3

20
Table - 3
Level of Utilisation Among Lok Sabha MPs till July 2003
(in Rs Lakhs)
Range Number Entitle- Release Sanction Expendi- Average Unspent Unspent Unspent
of of MPs ment ture % Balance Balance Balance
Uti- incurred Utilisation over over over
lisation over entitle- Release Sanction
Release ment
1 2 3 4 5 6 7 8=6-3 9=6-4 10=6-5
○ ○ ○ ○ ○ ○ ○ ○ ○ ○ ○ ○ ○ ○ ○ ○ ○ ○ ○ ○ ○ ○ ○ ○ ○ ○ ○ ○ ○ ○ ○ ○ ○ ○ ○ ○ ○ ○ ○ ○ ○ ○ ○ ○ ○ ○ ○ ○ ○ ○ ○ ○ ○ ○ ○ ○ ○ ○ ○ ○ ○
0-20% 5 4215 4415 4168.2 411.6 9.3 3803.4 4003.4 3756.6
○ ○ ○ ○ ○ ○ ○ ○ ○ ○ ○ ○ ○ ○ ○ ○ ○ ○ ○ ○ ○ ○ ○ ○ ○ ○ ○ ○ ○ ○ ○ ○ ○ ○ ○ ○ ○ ○ ○ ○ ○ ○ ○ ○ ○ ○ ○ ○ ○ ○ ○ ○ ○ ○ ○ ○ ○ ○ ○ ○ ○
20-40% 2 1200 1300 1134.5 503.5 38.7 696.5 796.5 631.0
○ ○ ○ ○ ○ ○ ○ ○ ○ ○ ○ ○ ○ ○ ○ ○ ○ ○ ○ ○ ○ ○ ○ ○ ○ ○ ○ ○ ○ ○ ○ ○ ○ ○ ○ ○ ○ ○ ○ ○ ○ ○ ○ ○ ○ ○ ○ ○ ○ ○ ○ ○ ○ ○ ○ ○ ○ ○ ○ ○ ○
40-60% 36 48970 44170 41981.3 23603.6 53.4 25366.4 20566.4 18377.7
○ ○ ○ ○ ○ ○ ○ ○ ○ ○ ○ ○ ○ ○ ○ ○ ○ ○ ○ ○ ○ ○ ○ ○ ○ ○ ○ ○ ○ ○ ○ ○ ○ ○ ○ ○ ○ ○ ○ ○ ○ ○ ○ ○ ○ ○ ○ ○ ○ ○ ○ ○ ○ ○ ○ ○ ○ ○ ○ ○ ○
60-80% 204 284935 273235 261366.7 198226.8 72.5 86708.2 75008.2 63139.9
○ ○ ○ ○ ○ ○ ○ ○ ○ ○ ○ ○ ○ ○ ○ ○ ○ ○ ○ ○ ○ ○ ○ ○ ○ ○ ○ ○ ○ ○ ○ ○ ○ ○ ○ ○ ○ ○ ○ ○ ○ ○ ○ ○ ○ ○ ○ ○ ○ ○ ○ ○ ○ ○ ○ ○ ○ ○ ○ ○ ○
80-100% 276 383890 374640 367954.6 332249.9 88.7 51640.1 42390.1 35704.7
More than 23 31710 31510 31861.7 32941.6 104.5 -1231.6 -1431.6 -1079.9
100%
TOTAL 546 754920 729270 708467 587937 80.6 166983 141333 120530
Source: Compiled from information of Ministry of Statistics and Programme Implementation
Table - 4
Level of Utilisation Among Rajya Sabha MPs till July 2003
(in Rs Lakhs)
Range Number Entitle- Release Sanction Expendi- Average Amount Amount Amount
of of MPs ment ture % Unspent Unspent Unspent
Uti- incurred Utilisation over over over
lisation over entitle- Release Sanction
Release ment
1 2 3 4 5 6 7 8=6-3 9=6-4 10=6-5
○ ○ ○ ○ ○ ○ ○ ○ ○ ○ ○ ○ ○ ○ ○ ○ ○ ○ ○ ○ ○ ○ ○ ○ ○ ○ ○ ○ ○ ○ ○ ○ ○ ○ ○ ○ ○ ○ ○ ○ ○ ○ ○ ○ ○ ○ ○ ○ ○ ○ ○ ○ ○ ○ ○ ○ ○ ○ ○ ○ ○
0-20% 55 14350 9750 4967.7 610.2 4.4 13739.8 9139.8 4357.5
○ ○ ○ ○ ○ ○ ○ ○ ○ ○ ○ ○ ○ ○ ○ ○ ○ ○ ○ ○ ○ ○ ○ ○ ○ ○ ○ ○ ○ ○ ○ ○ ○ ○ ○ ○ ○ ○ ○ ○ ○ ○ ○ ○ ○ ○ ○ ○ ○ ○ ○ ○ ○ ○ ○ ○ ○ ○ ○ ○ ○
20-40% 19 9900 8100 6004.1 2530.2 29.9 7369.8 5569.8 3473.9
○ ○ ○ ○ ○ ○ ○ ○ ○ ○ ○ ○ ○ ○ ○ ○ ○ ○ ○ ○ ○ ○ ○ ○ ○ ○ ○ ○ ○ ○ ○ ○ ○ ○ ○ ○ ○ ○ ○ ○ ○ ○ ○ ○ ○ ○ ○ ○ ○ ○ ○ ○ ○ ○ ○ ○ ○ ○ ○ ○ ○
40-60% 44 31170 28468 25094.5 14409.7 50.0 16760.3 14058.3 10684.8
○ ○ ○ ○ ○ ○ ○ ○ ○ ○ ○ ○ ○ ○ ○ ○ ○ ○ ○ ○ ○ ○ ○ ○ ○ ○ ○ ○ ○ ○ ○ ○ ○ ○ ○ ○ ○ ○ ○ ○ ○ ○ ○ ○ ○ ○ ○ ○ ○ ○ ○ ○ ○ ○ ○ ○ ○ ○ ○ ○ ○
60-80% 65 58245 53945 50222.8 37996.0 70.5 20249.0 15949.0 12226.8
○ ○ ○ ○ ○ ○ ○ ○ ○ ○ ○ ○ ○ ○ ○ ○ ○ ○ ○ ○ ○ ○ ○ ○ ○ ○ ○ ○ ○ ○ ○ ○ ○ ○ ○ ○ ○ ○ ○ ○ ○ ○ ○ ○ ○ ○ ○ ○ ○ ○ ○ ○ ○ ○ ○ ○ ○ ○ ○ ○ ○
80-100% 53 53135 49535 48482.6 45634.0 89.3 7501.0 3901.0 2848.6
> 100% 9 7055 7055 7251.5 7119.3 100.9 -64.3 -64.3 132.2
TOTAL 245 173855 156853 142023.2 108299.4 54.0 65555.6 48553.6 33723.8
Source: Compiled from information of Ministry of Statistics and Programme Implementation
3.1.2 Utilisation of Funds by Rajya Sabha MPs
As far as utilisation of MPLADS funds by Rajya Sabha MPs is concerned, the situation is worse than that of the
Lok Sabha. Table 4 illustrates the fact that more than 22 per cent (55) of the total Rajya Sabha MPs (245) have
spent less than 20 per cent of the funds released to them under the scheme. Around 8 per cent (19) MPs have
utilised around 30 per cent of MPLADS funds released to them. In total, around 48 per cent of total Rajya
Sabha MPs have spent on an average, less than 50 per cent total funds released for the works recommended by
them. If we analyse columns 8, 9, and 10 of Table-4, we found that there are around Rs. 378.7 crore unspent
balance over entitlement, Rs. 287.7 crore unspent balance over release and Rs. 185.2 crore unspent balance
over money sanctioned for the works by them. Taking the total endowment of all Rajya Sabha MPs, the average
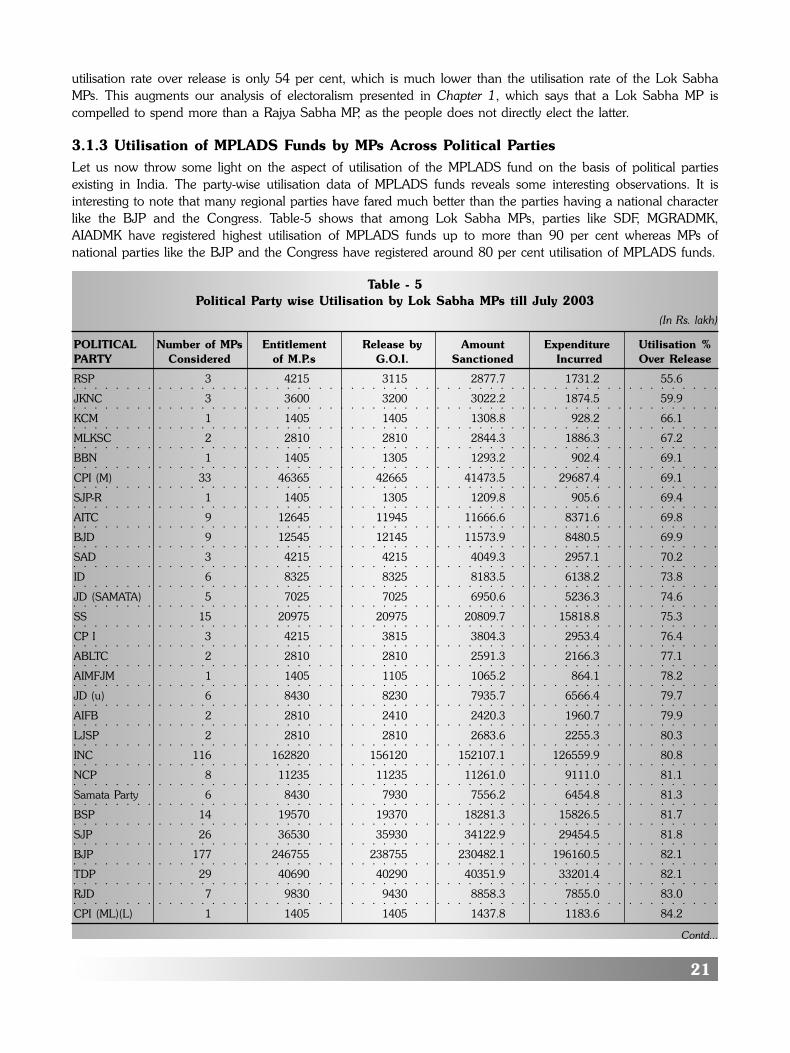
21
utilisation rate over release is only 54 per cent, which is much lower than the utilisation rate of the Lok Sabha
MPs. This augments our analysis of electoralism presented in Chapter 1, which says that a Lok Sabha MP is
compelled to spend more than a Rajya Sabha MP, as the people does not directly elect the latter.
3.1.3 Utilisation of MPLADS Funds by MPs Across Political Parties
Let us now throw some light on the aspect of utilisation of the MPLADS fund on the basis of political parties
existing in India. The party-wise utilisation data of MPLADS funds reveals some interesting observations. It is
interesting to note that many regional parties have fared much better than the parties having a national character
like the BJP and the Congress. Table-5 shows that among Lok Sabha MPs, parties like SDF, MGRADMK,
AIADMK have registered highest utilisation of MPLADS funds up to more than 90 per cent whereas MPs of
national parties like the BJP and the Congress have registered around 80 per cent utilisation of MPLADS funds.
Table - 5
Political Party wise Utilisation by Lok Sabha MPs till July 2003
(In Rs. lakh)
POLITICAL Number of MPs Entitlement Release by Amount Expenditure Utilisation %
PARTY Considered of M.P.s G.O.I. Sanctioned Incurred Over Release
○ ○ ○ ○ ○ ○ ○ ○ ○ ○ ○ ○ ○ ○ ○ ○ ○ ○ ○ ○ ○ ○ ○ ○ ○ ○ ○ ○ ○ ○ ○ ○ ○ ○ ○ ○ ○ ○ ○ ○ ○ ○ ○ ○ ○ ○ ○ ○ ○ ○ ○ ○ ○ ○ ○ ○ ○ ○ ○ ○ ○
RSP 3 4215 3115 2877.7 1731.2 55.6
○ ○ ○ ○ ○ ○ ○ ○ ○ ○ ○ ○ ○ ○ ○ ○ ○ ○ ○ ○ ○ ○ ○ ○ ○ ○ ○ ○ ○ ○ ○ ○ ○ ○ ○ ○ ○ ○ ○ ○ ○ ○ ○ ○ ○ ○ ○ ○ ○ ○ ○ ○ ○ ○ ○ ○ ○ ○ ○ ○ ○
JKNC 3 3600 3200 3022.2 1874.5 59.9
○ ○ ○ ○ ○ ○ ○ ○ ○ ○ ○ ○ ○ ○ ○ ○ ○ ○ ○ ○ ○ ○ ○ ○ ○ ○ ○ ○ ○ ○ ○ ○ ○ ○ ○ ○ ○ ○ ○ ○ ○ ○ ○ ○ ○ ○ ○ ○ ○ ○ ○ ○ ○ ○ ○ ○ ○ ○ ○ ○ ○
KCM 1 1405 1405 1308.8 928.2 66.1
○ ○ ○ ○ ○ ○ ○ ○ ○ ○ ○ ○ ○ ○ ○ ○ ○ ○ ○ ○ ○ ○ ○ ○ ○ ○ ○ ○ ○ ○ ○ ○ ○ ○ ○ ○ ○ ○ ○ ○ ○ ○ ○ ○ ○ ○ ○ ○ ○ ○ ○ ○ ○ ○ ○ ○ ○ ○ ○ ○ ○
MLKSC 2 2810 2810 2844.3 1886.3 67.2
○ ○ ○ ○ ○ ○ ○ ○ ○ ○ ○ ○ ○ ○ ○ ○ ○ ○ ○ ○ ○ ○ ○ ○ ○ ○ ○ ○ ○ ○ ○ ○ ○ ○ ○ ○ ○ ○ ○ ○ ○ ○ ○ ○ ○ ○ ○ ○ ○ ○ ○ ○ ○ ○ ○ ○ ○ ○ ○ ○ ○
BBN 1 1405 1305 1293.2 902.4 69.1
○ ○ ○ ○ ○ ○ ○ ○ ○ ○ ○ ○ ○ ○ ○ ○ ○ ○ ○ ○ ○ ○ ○ ○ ○ ○ ○ ○ ○ ○ ○ ○ ○ ○ ○ ○ ○ ○ ○ ○ ○ ○ ○ ○ ○ ○ ○ ○ ○ ○ ○ ○ ○ ○ ○ ○ ○ ○ ○ ○ ○
CPI (M) 33 46365 42665 41473.5 29687.4 69.1
○ ○ ○ ○ ○ ○ ○ ○ ○ ○ ○ ○ ○ ○ ○ ○ ○ ○ ○ ○ ○ ○ ○ ○ ○ ○ ○ ○ ○ ○ ○ ○ ○ ○ ○ ○ ○ ○ ○ ○ ○ ○ ○ ○ ○ ○ ○ ○ ○ ○ ○ ○ ○ ○ ○ ○ ○ ○ ○ ○ ○
SJP-R 1 1405 1305 1209.8 905.6 69.4
○ ○ ○ ○ ○ ○ ○ ○ ○ ○ ○ ○ ○ ○ ○ ○ ○ ○ ○ ○ ○ ○ ○ ○ ○ ○ ○ ○ ○ ○ ○ ○ ○ ○ ○ ○ ○ ○ ○ ○ ○ ○ ○ ○ ○ ○ ○ ○ ○ ○ ○ ○ ○ ○ ○ ○ ○ ○ ○ ○ ○
AITC 9 12645 11945 11666.6 8371.6 69.8
○ ○ ○ ○ ○ ○ ○ ○ ○ ○ ○ ○ ○ ○ ○ ○ ○ ○ ○ ○ ○ ○ ○ ○ ○ ○ ○ ○ ○ ○ ○ ○ ○ ○ ○ ○ ○ ○ ○ ○ ○ ○ ○ ○ ○ ○ ○ ○ ○ ○ ○ ○ ○ ○ ○ ○ ○ ○ ○ ○ ○
BJD 9 12545 12145 11573.9 8480.5 69.9
○ ○ ○ ○ ○ ○ ○ ○ ○ ○ ○ ○ ○ ○ ○ ○ ○ ○ ○ ○ ○ ○ ○ ○ ○ ○ ○ ○ ○ ○ ○ ○ ○ ○ ○ ○ ○ ○ ○ ○ ○ ○ ○ ○ ○ ○ ○ ○ ○ ○ ○ ○ ○ ○ ○ ○ ○ ○ ○ ○ ○
SAD 3 4215 4215 4049.3 2957.1 70.2
○ ○ ○ ○ ○ ○ ○ ○ ○ ○ ○ ○ ○ ○ ○ ○ ○ ○ ○ ○ ○ ○ ○ ○ ○ ○ ○ ○ ○ ○ ○ ○ ○ ○ ○ ○ ○ ○ ○ ○ ○ ○ ○ ○ ○ ○ ○ ○ ○ ○ ○ ○ ○ ○ ○ ○ ○ ○ ○ ○ ○
ID 6 8325 8325 8183.5 6138.2 73.8
○ ○ ○ ○ ○ ○ ○ ○ ○ ○ ○ ○ ○ ○ ○ ○ ○ ○ ○ ○ ○ ○ ○ ○ ○ ○ ○ ○ ○ ○ ○ ○ ○ ○ ○ ○ ○ ○ ○ ○ ○ ○ ○ ○ ○ ○ ○ ○ ○ ○ ○ ○ ○ ○ ○ ○ ○ ○ ○ ○ ○
JD (SAMATA) 5 7025 7025 6950.6 5236.3 74.6
○ ○ ○ ○ ○ ○ ○ ○ ○ ○ ○ ○ ○ ○ ○ ○ ○ ○ ○ ○ ○ ○ ○ ○ ○ ○ ○ ○ ○ ○ ○ ○ ○ ○ ○ ○ ○ ○ ○ ○ ○ ○ ○ ○ ○ ○ ○ ○ ○ ○ ○ ○ ○ ○ ○ ○ ○ ○ ○ ○ ○
SS 15 20975 20975 20809.7 15818.8 75.3
○ ○ ○ ○ ○ ○ ○ ○ ○ ○ ○ ○ ○ ○ ○ ○ ○ ○ ○ ○ ○ ○ ○ ○ ○ ○ ○ ○ ○ ○ ○ ○ ○ ○ ○ ○ ○ ○ ○ ○ ○ ○ ○ ○ ○ ○ ○ ○ ○ ○ ○ ○ ○ ○ ○ ○ ○ ○ ○ ○ ○
CP I 3 4215 3815 3804.3 2953.4 76.4
○ ○ ○ ○ ○ ○ ○ ○ ○ ○ ○ ○ ○ ○ ○ ○ ○ ○ ○ ○ ○ ○ ○ ○ ○ ○ ○ ○ ○ ○ ○ ○ ○ ○ ○ ○ ○ ○ ○ ○ ○ ○ ○ ○ ○ ○ ○ ○ ○ ○ ○ ○ ○ ○ ○ ○ ○ ○ ○ ○ ○
ABLTC 2 2810 2810 2591.3 2166.3 77.1
○ ○ ○ ○ ○ ○ ○ ○ ○ ○ ○ ○ ○ ○ ○ ○ ○ ○ ○ ○ ○ ○ ○ ○ ○ ○ ○ ○ ○ ○ ○ ○ ○ ○ ○ ○ ○ ○ ○ ○ ○ ○ ○ ○ ○ ○ ○ ○ ○ ○ ○ ○ ○ ○ ○ ○ ○ ○ ○ ○ ○
AIMFJM 1 1405 1105 1065.2 864.1 78.2
○ ○ ○ ○ ○ ○ ○ ○ ○ ○ ○ ○ ○ ○ ○ ○ ○ ○ ○ ○ ○ ○ ○ ○ ○ ○ ○ ○ ○ ○ ○ ○ ○ ○ ○ ○ ○ ○ ○ ○ ○ ○ ○ ○ ○ ○ ○ ○ ○ ○ ○ ○ ○ ○ ○ ○ ○ ○ ○ ○ ○
JD (u) 6 8430 8230 7935.7 6566.4 79.7
○ ○ ○ ○ ○ ○ ○ ○ ○ ○ ○ ○ ○ ○ ○ ○ ○ ○ ○ ○ ○ ○ ○ ○ ○ ○ ○ ○ ○ ○ ○ ○ ○ ○ ○ ○ ○ ○ ○ ○ ○ ○ ○ ○ ○ ○ ○ ○ ○ ○ ○ ○ ○ ○ ○ ○ ○ ○ ○ ○ ○
AIFB 2 2810 2410 2420.3 1960.7 79.9
○ ○ ○ ○ ○ ○ ○ ○ ○ ○ ○ ○ ○ ○ ○ ○ ○ ○ ○ ○ ○ ○ ○ ○ ○ ○ ○ ○ ○ ○ ○ ○ ○ ○ ○ ○ ○ ○ ○ ○ ○ ○ ○ ○ ○ ○ ○ ○ ○ ○ ○ ○ ○ ○ ○ ○ ○ ○ ○ ○ ○
LJSP 2 2810 2810 2683.6 2255.3 80.3
○ ○ ○ ○ ○ ○ ○ ○ ○ ○ ○ ○ ○ ○ ○ ○ ○ ○ ○ ○ ○ ○ ○ ○ ○ ○ ○ ○ ○ ○ ○ ○ ○ ○ ○ ○ ○ ○ ○ ○ ○ ○ ○ ○ ○ ○ ○ ○ ○ ○ ○ ○ ○ ○ ○ ○ ○ ○ ○ ○ ○
INC 116 162820 156120 152107.1 126559.9 80.8
○ ○ ○ ○ ○ ○ ○ ○ ○ ○ ○ ○ ○ ○ ○ ○ ○ ○ ○ ○ ○ ○ ○ ○ ○ ○ ○ ○ ○ ○ ○ ○ ○ ○ ○ ○ ○ ○ ○ ○ ○ ○ ○ ○ ○ ○ ○ ○ ○ ○ ○ ○ ○ ○ ○ ○ ○ ○ ○ ○ ○
NCP 8 11235 11235 11261.0 9111.0 81.1
○ ○ ○ ○ ○ ○ ○ ○ ○ ○ ○ ○ ○ ○ ○ ○ ○ ○ ○ ○ ○ ○ ○ ○ ○ ○ ○ ○ ○ ○ ○ ○ ○ ○ ○ ○ ○ ○ ○ ○ ○ ○ ○ ○ ○ ○ ○ ○ ○ ○ ○ ○ ○ ○ ○ ○ ○ ○ ○ ○ ○
Samata Party 6 8430 7930 7556.2 6454.8 81.3
○ ○ ○ ○ ○ ○ ○ ○ ○ ○ ○ ○ ○ ○ ○ ○ ○ ○ ○ ○ ○ ○ ○ ○ ○ ○ ○ ○ ○ ○ ○ ○ ○ ○ ○ ○ ○ ○ ○ ○ ○ ○ ○ ○ ○ ○ ○ ○ ○ ○ ○ ○ ○ ○ ○ ○ ○ ○ ○ ○ ○
BSP 14 19570 19370 18281.3 15826.5 81.7
○ ○ ○ ○ ○ ○ ○ ○ ○ ○ ○ ○ ○ ○ ○ ○ ○ ○ ○ ○ ○ ○ ○ ○ ○ ○ ○ ○ ○ ○ ○ ○ ○ ○ ○ ○ ○ ○ ○ ○ ○ ○ ○ ○ ○ ○ ○ ○ ○ ○ ○ ○ ○ ○ ○ ○ ○ ○ ○ ○ ○
SJP 26 36530 35930 34122.9 29454.5 81.8
○ ○ ○ ○ ○ ○ ○ ○ ○ ○ ○ ○ ○ ○ ○ ○ ○ ○ ○ ○ ○ ○ ○ ○ ○ ○ ○ ○ ○ ○ ○ ○ ○ ○ ○ ○ ○ ○ ○ ○ ○ ○ ○ ○ ○ ○ ○ ○ ○ ○ ○ ○ ○ ○ ○ ○ ○ ○ ○ ○ ○
BJP 177 246755 238755 230482.1 196160.5 82.1
○ ○ ○ ○ ○ ○ ○ ○ ○ ○ ○ ○ ○ ○ ○ ○ ○ ○ ○ ○ ○ ○ ○ ○ ○ ○ ○ ○ ○ ○ ○ ○ ○ ○ ○ ○ ○ ○ ○ ○ ○ ○ ○ ○ ○ ○ ○ ○ ○ ○ ○ ○ ○ ○ ○ ○ ○ ○ ○ ○ ○
TDP 29 40690 40290 40351.9 33201.4 82.1
○ ○ ○ ○ ○ ○ ○ ○ ○ ○ ○ ○ ○ ○ ○ ○ ○ ○ ○ ○ ○ ○ ○ ○ ○ ○ ○ ○ ○ ○ ○ ○ ○ ○ ○ ○ ○ ○ ○ ○ ○ ○ ○ ○ ○ ○ ○ ○ ○ ○ ○ ○ ○ ○ ○ ○ ○ ○ ○ ○ ○
RJD 7 9830 9430 8858.3 7855.0 83.0
CPI (ML)(L) 1 1405 1405 1437.8 1183.6 84.2
Contd...

22
As far as MPLADS funds utilisation by Rajya Sabha MPs is concerned, once again regional parties like AGP
and DMK show more than 80 per cent utilisation rates whereas MPs from the national parties (the BJP and the
Congress) show utlisation of their MPLADS quota to around 50 per cent only (see Table-6). A possible reason
behind such a phenomenon may be that the members of the regional political parties due to their miniscule
representation in the parliament could not mobilise large-scale capital investment for their constituencies/localities
through their own initiative. Therefore, it becomes imperative for them to utilise their MPLADS allocations to
the largest extent possible so that the popular demands for local public amenities and facilities and corresponding
necessary capital investment could be met. Another reason for such high utilisation by the MPs of regional
parties may be due to –
� These MPs probably have better cohesion with the common people at the grass root level through which
they could get correct information about locally felt needs
� A proper monitoring system by the common people themselves might have led to a rise in the level of
utilisation.
Another important feature to note here is that 31 MPs of Rajya Sabha have not at all utilised a single rupee
from their MPLADS entitlements. Figures presented in Table -7 show that around 50 per cent of these MPs who
have not spent anything through MPLADS are either from the BJP or its National Democratic Alliance (NDA).
Around 17 per cent are from the Congress and its allies, around 20 per cent from the third front and around 13
per cent of these MPs are either nominated or independent.
Some prominent personalities among these MPs who have not spent anything from MPLADS are Jana
Krishnamurthy of the BJP from Gujarat, Kesubhai Patel of the BJP from Gujarat, Farooq Abdullah of the JKNC
from Jammu and Kashmir and Laloo Prasad Yadav of the RJD from Bihar (see Table -7).
○ ○ ○ ○ ○ ○ ○ ○ ○ ○ ○ ○ ○ ○ ○ ○ ○ ○ ○ ○ ○ ○ ○ ○ ○ ○ ○ ○ ○ ○ ○ ○ ○ ○ ○ ○ ○ ○ ○ ○ ○ ○ ○ ○ ○ ○ ○ ○ ○ ○ ○ ○ ○ ○ ○ ○ ○ ○ ○ ○ ○
HVC 1 1405 1305 1208.5 1105.8 84.7
○ ○ ○ ○ ○ ○ ○ ○ ○ ○ ○ ○ ○ ○ ○ ○ ○ ○ ○ ○ ○ ○ ○ ○ ○ ○ ○ ○ ○ ○ ○ ○ ○ ○ ○ ○ ○ ○ ○ ○ ○ ○ ○ ○ ○ ○ ○ ○ ○ ○ ○ ○ ○ ○ ○ ○ ○ ○ ○ ○ ○
JD (S) 2 2810 2510 2449.2 2119.2 85.2
KERALA 1 1405 1405 1348.0 1199.5 85.4
○ ○ ○ ○ ○ ○ ○ ○ ○ ○ ○ ○ ○ ○ ○ ○ ○ ○ ○ ○ ○ ○ ○ ○ ○ ○ ○ ○ ○ ○ ○ ○ ○ ○ ○ ○ ○ ○ ○ ○ ○ ○ ○ ○ ○ ○ ○ ○ ○ ○ ○ ○ ○ ○ ○ ○ ○ ○ ○ ○ ○
CONGRESS
○ ○ ○ ○ ○ ○ ○ ○ ○ ○ ○ ○ ○ ○ ○ ○ ○ ○ ○ ○ ○ ○ ○ ○ ○ ○ ○ ○ ○ ○ ○ ○ ○ ○ ○ ○ ○ ○ ○ ○ ○ ○ ○ ○ ○ ○ ○ ○ ○ ○ ○ ○ ○ ○ ○ ○ ○ ○ ○ ○ ○
JMM 1 1405 905 805.0 778.8 86.1
○ ○ ○ ○ ○ ○ ○ ○ ○ ○ ○ ○ ○ ○ ○ ○ ○ ○ ○ ○ ○ ○ ○ ○ ○ ○ ○ ○ ○ ○ ○ ○ ○ ○ ○ ○ ○ ○ ○ ○ ○ ○ ○ ○ ○ ○ ○ ○ ○ ○ ○ ○ ○ ○ ○ ○ ○ ○ ○ ○ ○
MSCP 1 1405 1405 1419.0 1227.8 87.4
○ ○ ○ ○ ○ ○ ○ ○ ○ ○ ○ ○ ○ ○ ○ ○ ○ ○ ○ ○ ○ ○ ○ ○ ○ ○ ○ ○ ○ ○ ○ ○ ○ ○ ○ ○ ○ ○ ○ ○ ○ ○ ○ ○ ○ ○ ○ ○ ○ ○ ○ ○ ○ ○ ○ ○ ○ ○ ○ ○ ○
RLD 2 2810 2810 2747.8 2482.4 88.3
○ ○ ○ ○ ○ ○ ○ ○ ○ ○ ○ ○ ○ ○ ○ ○ ○ ○ ○ ○ ○ ○ ○ ○ ○ ○ ○ ○ ○ ○ ○ ○ ○ ○ ○ ○ ○ ○ ○ ○ ○ ○ ○ ○ ○ ○ ○ ○ ○ ○ ○ ○ ○ ○ ○ ○ ○ ○ ○ ○ ○
DMK 13 18265 17665 17349.1 15743.8 88.5
○ ○ ○ ○ ○ ○ ○ ○ ○ ○ ○ ○ ○ ○ ○ ○ ○ ○ ○ ○ ○ ○ ○ ○ ○ ○ ○ ○ ○ ○ ○ ○ ○ ○ ○ ○ ○ ○ ○ ○ ○ ○ ○ ○ ○ ○ ○ ○ ○ ○ ○ ○ ○ ○ ○ ○ ○ ○ ○ ○ ○
MDMK 3 4215 4215 4139.1 3797.4 90.1
○ ○ ○ ○ ○ ○ ○ ○ ○ ○ ○ ○ ○ ○ ○ ○ ○ ○ ○ ○ ○ ○ ○ ○ ○ ○ ○ ○ ○ ○ ○ ○ ○ ○ ○ ○ ○ ○ ○ ○ ○ ○ ○ ○ ○ ○ ○ ○ ○ ○ ○ ○ ○ ○ ○ ○ ○ ○ ○ ○ ○
INLD 5 7025 7025 6884.6 6391.5 91.0
○ ○ ○ ○ ○ ○ ○ ○ ○ ○ ○ ○ ○ ○ ○ ○ ○ ○ ○ ○ ○ ○ ○ ○ ○ ○ ○ ○ ○ ○ ○ ○ ○ ○ ○ ○ ○ ○ ○ ○ ○ ○ ○ ○ ○ ○ ○ ○ ○ ○ ○ ○ ○ ○ ○ ○ ○ ○ ○ ○ ○
PMK 4 5620 5520 5476.9 5041.7 91.4
○ ○ ○ ○ ○ ○ ○ ○ ○ ○ ○ ○ ○ ○ ○ ○ ○ ○ ○ ○ ○ ○ ○ ○ ○ ○ ○ ○ ○ ○ ○ ○ ○ ○ ○ ○ ○ ○ ○ ○ ○ ○ ○ ○ ○ ○ ○ ○ ○ ○ ○ ○ ○ ○ ○ ○ ○ ○ ○ ○ ○
PWP 1 1405 1405 1440.0 1285.6 91.5
○ ○ ○ ○ ○ ○ ○ ○ ○ ○ ○ ○ ○ ○ ○ ○ ○ ○ ○ ○ ○ ○ ○ ○ ○ ○ ○ ○ ○ ○ ○ ○ ○ ○ ○ ○ ○ ○ ○ ○ ○ ○ ○ ○ ○ ○ ○ ○ ○ ○ ○ ○ ○ ○ ○ ○ ○ ○ ○ ○ ○
JD (JP) 1 1405 1405 1442.0 1290.3 91.8
○ ○ ○ ○ ○ ○ ○ ○ ○ ○ ○ ○ ○ ○ ○ ○ ○ ○ ○ ○ ○ ○ ○ ○ ○ ○ ○ ○ ○ ○ ○ ○ ○ ○ ○ ○ ○ ○ ○ ○ ○ ○ ○ ○ ○ ○ ○ ○ ○ ○ ○ ○ ○ ○ ○ ○ ○ ○ ○ ○ ○
AIADMK 11 15455 15255 15302.5 14101.6 92.4
○ ○ ○ ○ ○ ○ ○ ○ ○ ○ ○ ○ ○ ○ ○ ○ ○ ○ ○ ○ ○ ○ ○ ○ ○ ○ ○ ○ ○ ○ ○ ○ ○ ○ ○ ○ ○ ○ ○ ○ ○ ○ ○ ○ ○ ○ ○ ○ ○ ○ ○ ○ ○ ○ ○ ○ ○ ○ ○ ○ ○
SDF 1 1405 1405 1432.3 1330.8 94.7
MGRADMK 1 1205 1205 1221.9 1150.0 95.4
Source: Compiled from Ministry of Statistics and programme Implementation and Directory of MPs
POLITICAL Number of MPs Entitlement Release by Amount Expenditure Utilisation %
PARTY Considered of M.P.s G.O.I. Sanctioned Incurred Over Release
Table-5 contd...

23
Table - 6
Political Party wise Utilisation by Rajya Sabha MPs till July 2003
(In Rs. lakh)
POLITICAL Number of MPs Entitlement Release by Amount Expenditure Utilisation %
PARTY taken into of M.P.s G.O.I. Sanctioned Incurred Over Release
Account
○ ○ ○ ○ ○ ○ ○ ○ ○ ○ ○ ○ ○ ○ ○ ○ ○ ○ ○ ○ ○ ○ ○ ○ ○ ○ ○ ○ ○ ○ ○ ○ ○ ○ ○ ○ ○ ○ ○ ○ ○ ○ ○ ○ ○ ○ ○ ○ ○ ○ ○ ○ ○ ○ ○ ○ ○ ○ ○ ○ ○
JKNC 1 100 100 0.0 0.0 0.0
○ ○ ○ ○ ○ ○ ○ ○ ○ ○ ○ ○ ○ ○ ○ ○ ○ ○ ○ ○ ○ ○ ○ ○ ○ ○ ○ ○ ○ ○ ○ ○ ○ ○ ○ ○ ○ ○ ○ ○ ○ ○ ○ ○ ○ ○ ○ ○ ○ ○ ○ ○ ○ ○ ○ ○ ○ ○ ○ ○ ○
BJD 4 1600 1500 1003.9 455.0 19.3
○ ○ ○ ○ ○ ○ ○ ○ ○ ○ ○ ○ ○ ○ ○ ○ ○ ○ ○ ○ ○ ○ ○ ○ ○ ○ ○ ○ ○ ○ ○ ○ ○ ○ ○ ○ ○ ○ ○ ○ ○ ○ ○ ○ ○ ○ ○ ○ ○ ○ ○ ○ ○ ○ ○ ○ ○ ○ ○ ○ ○
NCP 3 1000 800 503.7 303.7 20.5
○ ○ ○ ○ ○ ○ ○ ○ ○ ○ ○ ○ ○ ○ ○ ○ ○ ○ ○ ○ ○ ○ ○ ○ ○ ○ ○ ○ ○ ○ ○ ○ ○ ○ ○ ○ ○ ○ ○ ○ ○ ○ ○ ○ ○ ○ ○ ○ ○ ○ ○ ○ ○ ○ ○ ○ ○ ○ ○ ○ ○
JMM 1 600 400 285.1 105.0 26.3
○ ○ ○ ○ ○ ○ ○ ○ ○ ○ ○ ○ ○ ○ ○ ○ ○ ○ ○ ○ ○ ○ ○ ○ ○ ○ ○ ○ ○ ○ ○ ○ ○ ○ ○ ○ ○ ○ ○ ○ ○ ○ ○ ○ ○ ○ ○ ○ ○ ○ ○ ○ ○ ○ ○ ○ ○ ○ ○ ○ ○
SS 5 3900 3200 2820.2 1823.3 32.1
○ ○ ○ ○ ○ ○ ○ ○ ○ ○ ○ ○ ○ ○ ○ ○ ○ ○ ○ ○ ○ ○ ○ ○ ○ ○ ○ ○ ○ ○ ○ ○ ○ ○ ○ ○ ○ ○ ○ ○ ○ ○ ○ ○ ○ ○ ○ ○ ○ ○ ○ ○ ○ ○ ○ ○ ○ ○ ○ ○ ○
Samata Party 2 800 700 521.4 460.7 38.4
○ ○ ○ ○ ○ ○ ○ ○ ○ ○ ○ ○ ○ ○ ○ ○ ○ ○ ○ ○ ○ ○ ○ ○ ○ ○ ○ ○ ○ ○ ○ ○ ○ ○ ○ ○ ○ ○ ○ ○ ○ ○ ○ ○ ○ ○ ○ ○ ○ ○ ○ ○ ○ ○ ○ ○ ○ ○ ○ ○ ○
TMC 1 300 300 279.3 121.2 40.4
○ ○ ○ ○ ○ ○ ○ ○ ○ ○ ○ ○ ○ ○ ○ ○ ○ ○ ○ ○ ○ ○ ○ ○ ○ ○ ○ ○ ○ ○ ○ ○ ○ ○ ○ ○ ○ ○ ○ ○ ○ ○ ○ ○ ○ ○ ○ ○ ○ ○ ○ ○ ○ ○ ○ ○ ○ ○ ○ ○ ○
INLD 3 1200 1200 1108.8 650.2 42.4
○ ○ ○ ○ ○ ○ ○ ○ ○ ○ ○ ○ ○ ○ ○ ○ ○ ○ ○ ○ ○ ○ ○ ○ ○ ○ ○ ○ ○ ○ ○ ○ ○ ○ ○ ○ ○ ○ ○ ○ ○ ○ ○ ○ ○ ○ ○ ○ ○ ○ ○ ○ ○ ○ ○ ○ ○ ○ ○ ○ ○
SP 11 8805 8605 7673.7 5486.0 46.4
○ ○ ○ ○ ○ ○ ○ ○ ○ ○ ○ ○ ○ ○ ○ ○ ○ ○ ○ ○ ○ ○ ○ ○ ○ ○ ○ ○ ○ ○ ○ ○ ○ ○ ○ ○ ○ ○ ○ ○ ○ ○ ○ ○ ○ ○ ○ ○ ○ ○ ○ ○ ○ ○ ○ ○ ○ ○ ○ ○ ○
BSP 5 2900 2900 2775.8 2148.3 46.6
○ ○ ○ ○ ○ ○ ○ ○ ○ ○ ○ ○ ○ ○ ○ ○ ○ ○ ○ ○ ○ ○ ○ ○ ○ ○ ○ ○ ○ ○ ○ ○ ○ ○ ○ ○ ○ ○ ○ ○ ○ ○ ○ ○ ○ ○ ○ ○ ○ ○ ○ ○ ○ ○ ○ ○ ○ ○ ○ ○ ○
ABLC 1 600 400 328.7 188.2 47.0
○ ○ ○ ○ ○ ○ ○ ○ ○ ○ ○ ○ ○ ○ ○ ○ ○ ○ ○ ○ ○ ○ ○ ○ ○ ○ ○ ○ ○ ○ ○ ○ ○ ○ ○ ○ ○ ○ ○ ○ ○ ○ ○ ○ ○ ○ ○ ○ ○ ○ ○ ○ ○ ○ ○ ○ ○ ○ ○ ○ ○
BJP 45 29865 25565 23683.9 17867.4 48.4
○ ○ ○ ○ ○ ○ ○ ○ ○ ○ ○ ○ ○ ○ ○ ○ ○ ○ ○ ○ ○ ○ ○ ○ ○ ○ ○ ○ ○ ○ ○ ○ ○ ○ ○ ○ ○ ○ ○ ○ ○ ○ ○ ○ ○ ○ ○ ○ ○ ○ ○ ○ ○ ○ ○ ○ ○ ○ ○ ○ ○
AITC 1 200 200 196.0 100.0 50.0
○ ○ ○ ○ ○ ○ ○ ○ ○ ○ ○ ○ ○ ○ ○ ○ ○ ○ ○ ○ ○ ○ ○ ○ ○ ○ ○ ○ ○ ○ ○ ○ ○ ○ ○ ○ ○ ○ ○ ○ ○ ○ ○ ○ ○ ○ ○ ○ ○ ○ ○ ○ ○ ○ ○ ○ ○ ○ ○ ○ ○
JD (S) 2 2000 2000 1711.0 1028.7 51.5
○ ○ ○ ○ ○ ○ ○ ○ ○ ○ ○ ○ ○ ○ ○ ○ ○ ○ ○ ○ ○ ○ ○ ○ ○ ○ ○ ○ ○ ○ ○ ○ ○ ○ ○ ○ ○ ○ ○ ○ ○ ○ ○ ○ ○ ○ ○ ○ ○ ○ ○ ○ ○ ○ ○ ○ ○ ○ ○ ○ ○
ID 13 9005 8505 7647.4 5162.1 52.1
○ ○ ○ ○ ○ ○ ○ ○ ○ ○ ○ ○ ○ ○ ○ ○ ○ ○ ○ ○ ○ ○ ○ ○ ○ ○ ○ ○ ○ ○ ○ ○ ○ ○ ○ ○ ○ ○ ○ ○ ○ ○ ○ ○ ○ ○ ○ ○ ○ ○ ○ ○ ○ ○ ○ ○ ○ ○ ○ ○ ○
RPI 1 600 600 556.6 316.0 52.7
○ ○ ○ ○ ○ ○ ○ ○ ○ ○ ○ ○ ○ ○ ○ ○ ○ ○ ○ ○ ○ ○ ○ ○ ○ ○ ○ ○ ○ ○ ○ ○ ○ ○ ○ ○ ○ ○ ○ ○ ○ ○ ○ ○ ○ ○ ○ ○ ○ ○ ○ ○ ○ ○ ○ ○ ○ ○ ○ ○ ○
INC 59 41435 36835 32264.2 25404.1 54.3
○ ○ ○ ○ ○ ○ ○ ○ ○ ○ ○ ○ ○ ○ ○ ○ ○ ○ ○ ○ ○ ○ ○ ○ ○ ○ ○ ○ ○ ○ ○ ○ ○ ○ ○ ○ ○ ○ ○ ○ ○ ○ ○ ○ ○ ○ ○ ○ ○ ○ ○ ○ ○ ○ ○ ○ ○ ○ ○ ○ ○
ML 2 2405 2103 2016.8 1147.1 54.6
○ ○ ○ ○ ○ ○ ○ ○ ○ ○ ○ ○ ○ ○ ○ ○ ○ ○ ○ ○ ○ ○ ○ ○ ○ ○ ○ ○ ○ ○ ○ ○ ○ ○ ○ ○ ○ ○ ○ ○ ○ ○ ○ ○ ○ ○ ○ ○ ○ ○ ○ ○ ○ ○ ○ ○ ○ ○ ○ ○ ○
RSP 3 2100 1500 1151.5 828.9 54.6
○ ○ ○ ○ ○ ○ ○ ○ ○ ○ ○ ○ ○ ○ ○ ○ ○ ○ ○ ○ ○ ○ ○ ○ ○ ○ ○ ○ ○ ○ ○ ○ ○ ○ ○ ○ ○ ○ ○ ○ ○ ○ ○ ○ ○ ○ ○ ○ ○ ○ ○ ○ ○ ○ ○ ○ ○ ○ ○ ○ ○
CPI (M) 13 11965 11065 10279.2 7791.2 58.4
○ ○ ○ ○ ○ ○ ○ ○ ○ ○ ○ ○ ○ ○ ○ ○ ○ ○ ○ ○ ○ ○ ○ ○ ○ ○ ○ ○ ○ ○ ○ ○ ○ ○ ○ ○ ○ ○ ○ ○ ○ ○ ○ ○ ○ ○ ○ ○ ○ ○ ○ ○ ○ ○ ○ ○ ○ ○ ○ ○ ○
CPI 5 5005 5005 4627.7 3163.2 58.4
○ ○ ○ ○ ○ ○ ○ ○ ○ ○ ○ ○ ○ ○ ○ ○ ○ ○ ○ ○ ○ ○ ○ ○ ○ ○ ○ ○ ○ ○ ○ ○ ○ ○ ○ ○ ○ ○ ○ ○ ○ ○ ○ ○ ○ ○ ○ ○ ○ ○ ○ ○ ○ ○ ○ ○ ○ ○ ○ ○ ○
RJD 9 8315 7615 7108.0 5803.6 60.0
○ ○ ○ ○ ○ ○ ○ ○ ○ ○ ○ ○ ○ ○ ○ ○ ○ ○ ○ ○ ○ ○ ○ ○ ○ ○ ○ ○ ○ ○ ○ ○ ○ ○ ○ ○ ○ ○ ○ ○ ○ ○ ○ ○ ○ ○ ○ ○ ○ ○ ○ ○ ○ ○ ○ ○ ○ ○ ○ ○ ○
TDP 14 9200 9200 8536.2 6989.7 62.2
○ ○ ○ ○ ○ ○ ○ ○ ○ ○ ○ ○ ○ ○ ○ ○ ○ ○ ○ ○ ○ ○ ○ ○ ○ ○ ○ ○ ○ ○ ○ ○ ○ ○ ○ ○ ○ ○ ○ ○ ○ ○ ○ ○ ○ ○ ○ ○ ○ ○ ○ ○ ○ ○ ○ ○ ○ ○ ○ ○ ○
AIADMK 9 2500 2400 2275.9 1704.1 63.1
○ ○ ○ ○ ○ ○ ○ ○ ○ ○ ○ ○ ○ ○ ○ ○ ○ ○ ○ ○ ○ ○ ○ ○ ○ ○ ○ ○ ○ ○ ○ ○ ○ ○ ○ ○ ○ ○ ○ ○ ○ ○ ○ ○ ○ ○ ○ ○ ○ ○ ○ ○ ○ ○ ○ ○ ○ ○ ○ ○ ○
AIFB 1 1405 905 856.8 644.3 71.2
○ ○ ○ ○ ○ ○ ○ ○ ○ ○ ○ ○ ○ ○ ○ ○ ○ ○ ○ ○ ○ ○ ○ ○ ○ ○ ○ ○ ○ ○ ○ ○ ○ ○ ○ ○ ○ ○ ○ ○ ○ ○ ○ ○ ○ ○ ○ ○ ○ ○ ○ ○ ○ ○ ○ ○ ○ ○ ○ ○ ○
SDF 1 600 600 591.4 433.4 72.2
○ ○ ○ ○ ○ ○ ○ ○ ○ ○ ○ ○ ○ ○ ○ ○ ○ ○ ○ ○ ○ ○ ○ ○ ○ ○ ○ ○ ○ ○ ○ ○ ○ ○ ○ ○ ○ ○ ○ ○ ○ ○ ○ ○ ○ ○ ○ ○ ○ ○ ○ ○ ○ ○ ○ ○ ○ ○ ○ ○ ○
KC 1 1000 1000 1051.4 753.3 75.3
○ ○ ○ ○ ○ ○ ○ ○ ○ ○ ○ ○ ○ ○ ○ ○ ○ ○ ○ ○ ○ ○ ○ ○ ○ ○ ○ ○ ○ ○ ○ ○ ○ ○ ○ ○ ○ ○ ○ ○ ○ ○ ○ ○ ○ ○ ○ ○ ○ ○ ○ ○ ○ ○ ○ ○ ○ ○ ○ ○ ○
SAD 4 3550 3450 3441.9 2615.5 75.6
○ ○ ○ ○ ○ ○ ○ ○ ○ ○ ○ ○ ○ ○ ○ ○ ○ ○ ○ ○ ○ ○ ○ ○ ○ ○ ○ ○ ○ ○ ○ ○ ○ ○ ○ ○ ○ ○ ○ ○ ○ ○ ○ ○ ○ ○ ○ ○ ○ ○ ○ ○ ○ ○ ○ ○ ○ ○ ○ ○ ○
HBC 1 1050 750 586.0 585.7 78.1
○ ○ ○ ○ ○ ○ ○ ○ ○ ○ ○ ○ ○ ○ ○ ○ ○ ○ ○ ○ ○ ○ ○ ○ ○ ○ ○ ○ ○ ○ ○ ○ ○ ○ ○ ○ ○ ○ ○ ○ ○ ○ ○ ○ ○ ○ ○ ○ ○ ○ ○ ○ ○ ○ ○ ○ ○ ○ ○ ○ ○
MNF 1 100 100 79.1 79.1 79.1
○ ○ ○ ○ ○ ○ ○ ○ ○ ○ ○ ○ ○ ○ ○ ○ ○ ○ ○ ○ ○ ○ ○ ○ ○ ○ ○ ○ ○ ○ ○ ○ ○ ○ ○ ○ ○ ○ ○ ○ ○ ○ ○ ○ ○ ○ ○ ○ ○ ○ ○ ○ ○ ○ ○ ○ ○ ○ ○ ○ ○
HBP 1 900 800 700.0 652.9 81.6
○ ○ ○ ○ ○ ○ ○ ○ ○ ○ ○ ○ ○ ○ ○ ○ ○ ○ ○ ○ ○ ○ ○ ○ ○ ○ ○ ○ ○ ○ ○ ○ ○ ○ ○ ○ ○ ○ ○ ○ ○ ○ ○ ○ ○ ○ ○ ○ ○ ○ ○ ○ ○ ○ ○ ○ ○ ○ ○ ○ ○
DMK 8 6550 6550 6395.2 5868.8 82.1
AGP 1 1000 1000 942.6 866.2 86.6
TOTAL 232 162555 147853 133999.4 101546.9 54.0
Source: Compiled from Ministry of Statistics and programme Implementation and Directory of MPs
3.1.4 Utilisation of MPLADS Funds Across Different States
Till July 2003, states like Mizoram and Meghalaya have registered highest utilisation of MPLADS funds whereas

24
Table - 7
List of Some Rajya Sabha MPs having Lowest Utilisation Rates
(Value in Rs lakh)
No. Entitlement Release by Amount Expenditure % NAME OF THE MP Political STATE
of the MP the Ministry Sanctioned Incurred Utilisation Party
○ ○ ○ ○ ○ ○ ○ ○ ○ ○ ○ ○ ○ ○ ○ ○ ○ ○ ○ ○ ○ ○ ○ ○ ○ ○ ○ ○ ○ ○ ○ ○ ○ ○ ○ ○ ○ ○ ○ ○ ○ ○ ○ ○ ○ ○ ○ ○ ○ ○ ○ ○ ○ ○ ○ ○ ○ ○ ○ ○ ○
1 200 0 0.0 0.0 0 JANA KRISHNAMURTHY BJP GUJARAT
○ ○ ○ ○ ○ ○ ○ ○ ○ ○ ○ ○ ○ ○ ○ ○ ○ ○ ○ ○ ○ ○ ○ ○ ○ ○ ○ ○ ○ ○ ○ ○ ○ ○ ○ ○ ○ ○ ○ ○ ○ ○ ○ ○ ○ ○ ○ ○ ○ ○ ○ ○ ○ ○ ○ ○ ○ ○ ○ ○ ○
2 100 0 0.0 0.0 0 SAIF-UD-DIN SOZ INC KASMIR
○ ○ ○ ○ ○ ○ ○ ○ ○ ○ ○ ○ ○ ○ ○ ○ ○ ○ ○ ○ ○ ○ ○ ○ ○ ○ ○ ○ ○ ○ ○ ○ ○ ○ ○ ○ ○ ○ ○ ○ ○ ○ ○ ○ ○ ○ ○ ○ ○ ○ ○ ○ ○ ○ ○ ○ ○ ○ ○ ○ ○
3 100 0 0.0 0.0 0 ABHAY KANT PRASAD BJP JHARKHAND
○ ○ ○ ○ ○ ○ ○ ○ ○ ○ ○ ○ ○ ○ ○ ○ ○ ○ ○ ○ ○ ○ ○ ○ ○ ○ ○ ○ ○ ○ ○ ○ ○ ○ ○ ○ ○ ○ ○ ○ ○ ○ ○ ○ ○ ○ ○ ○ ○ ○ ○ ○ ○ ○ ○ ○ ○ ○ ○ ○ ○
4 100 0 0.0 0.0 0 DEVDAS APTE BJP JHARKHAND
○ ○ ○ ○ ○ ○ ○ ○ ○ ○ ○ ○ ○ ○ ○ ○ ○ ○ ○ ○ ○ ○ ○ ○ ○ ○ ○ ○ ○ ○ ○ ○ ○ ○ ○ ○ ○ ○ ○ ○ ○ ○ ○ ○ ○ ○ ○ ○ ○ ○ ○ ○ ○ ○ ○ ○ ○ ○ ○ ○ ○
5 200 100 35.0 0.0 0 KESUBHAI SAVDASBHAI PATEL BJP GUJARAT
○ ○ ○ ○ ○ ○ ○ ○ ○ ○ ○ ○ ○ ○ ○ ○ ○ ○ ○ ○ ○ ○ ○ ○ ○ ○ ○ ○ ○ ○ ○ ○ ○ ○ ○ ○ ○ ○ ○ ○ ○ ○ ○ ○ ○ ○ ○ ○ ○ ○ ○ ○ ○ ○ ○ ○ ○ ○ ○ ○ ○
6 200 100 0.0 0.0 0 ALKABEN B. KSHATRIYA INC GUJARAT
○ ○ ○ ○ ○ ○ ○ ○ ○ ○ ○ ○ ○ ○ ○ ○ ○ ○ ○ ○ ○ ○ ○ ○ ○ ○ ○ ○ ○ ○ ○ ○ ○ ○ ○ ○ ○ ○ ○ ○ ○ ○ ○ ○ ○ ○ ○ ○ ○ ○ ○ ○ ○ ○ ○ ○ ○ ○ ○ ○ ○
7 100 100 0.0 0.0 0 FAROOQ ABDULLA JKNC KASMIR
○ ○ ○ ○ ○ ○ ○ ○ ○ ○ ○ ○ ○ ○ ○ ○ ○ ○ ○ ○ ○ ○ ○ ○ ○ ○ ○ ○ ○ ○ ○ ○ ○ ○ ○ ○ ○ ○ ○ ○ ○ ○ ○ ○ ○ ○ ○ ○ ○ ○ ○ ○ ○ ○ ○ ○ ○ ○ ○ ○ ○
8 100 100 0.0 0.0 0 S. TARLOK SINGH KASMIR
○ ○ ○ ○ ○ ○ ○ ○ ○ ○ ○ ○ ○ ○ ○ ○ ○ ○ ○ ○ ○ ○ ○ ○ ○ ○ ○ ○ ○ ○ ○ ○ ○ ○ ○ ○ ○ ○ ○ ○ ○ ○ ○ ○ ○ ○ ○ ○ ○ ○ ○ ○ ○ ○ ○ ○ ○ ○ ○ ○ ○
9 200 100 0.0 0.0 0 ROBERT KHARSHING NCP MEGHALAYA
○ ○ ○ ○ ○ ○ ○ ○ ○ ○ ○ ○ ○ ○ ○ ○ ○ ○ ○ ○ ○ ○ ○ ○ ○ ○ ○ ○ ○ ○ ○ ○ ○ ○ ○ ○ ○ ○ ○ ○ ○ ○ ○ ○ ○ ○ ○ ○ ○ ○ ○ ○ ○ ○ ○ ○ ○ ○ ○ ○ ○
10 200 100 0.0 0.0 0 PRAMILA BOHIDAR BJD ORISSA
○ ○ ○ ○ ○ ○ ○ ○ ○ ○ ○ ○ ○ ○ ○ ○ ○ ○ ○ ○ ○ ○ ○ ○ ○ ○ ○ ○ ○ ○ ○ ○ ○ ○ ○ ○ ○ ○ ○ ○ ○ ○ ○ ○ ○ ○ ○ ○ ○ ○ ○ ○ ○ ○ ○ ○ ○ ○ ○ ○ ○
11 200 100 0.0 0.0 0 SURENDRA LATH BJP ORISSA
○ ○ ○ ○ ○ ○ ○ ○ ○ ○ ○ ○ ○ ○ ○ ○ ○ ○ ○ ○ ○ ○ ○ ○ ○ ○ ○ ○ ○ ○ ○ ○ ○ ○ ○ ○ ○ ○ ○ ○ ○ ○ ○ ○ ○ ○ ○ ○ ○ ○ ○ ○ ○ ○ ○ ○ ○ ○ ○ ○ ○
12 100 100 0.0 0.0 0 ABU ASIM AZMI SP U.P.
○ ○ ○ ○ ○ ○ ○ ○ ○ ○ ○ ○ ○ ○ ○ ○ ○ ○ ○ ○ ○ ○ ○ ○ ○ ○ ○ ○ ○ ○ ○ ○ ○ ○ ○ ○ ○ ○ ○ ○ ○ ○ ○ ○ ○ ○ ○ ○ ○ ○ ○ ○ ○ ○ ○ ○ ○ ○ ○ ○ ○
13 100 100 0.0 0.0 0 RAJNATH SINGH BJP U.P.
○ ○ ○ ○ ○ ○ ○ ○ ○ ○ ○ ○ ○ ○ ○ ○ ○ ○ ○ ○ ○ ○ ○ ○ ○ ○ ○ ○ ○ ○ ○ ○ ○ ○ ○ ○ ○ ○ ○ ○ ○ ○ ○ ○ ○ ○ ○ ○ ○ ○ ○ ○ ○ ○ ○ ○ ○ ○ ○ ○ ○
14 100 100 53.2 0.0 0 MUKHTAR ABBAS NAQVI BJP U.P.
○ ○ ○ ○ ○ ○ ○ ○ ○ ○ ○ ○ ○ ○ ○ ○ ○ ○ ○ ○ ○ ○ ○ ○ ○ ○ ○ ○ ○ ○ ○ ○ ○ ○ ○ ○ ○ ○ ○ ○ ○ ○ ○ ○ ○ ○ ○ ○ ○ ○ ○ ○ ○ ○ ○ ○ ○ ○ ○ ○ ○
15 100 100 98.7 0.0 0 ISAM SINGH BSP U.P.
○ ○ ○ ○ ○ ○ ○ ○ ○ ○ ○ ○ ○ ○ ○ ○ ○ ○ ○ ○ ○ ○ ○ ○ ○ ○ ○ ○ ○ ○ ○ ○ ○ ○ ○ ○ ○ ○ ○ ○ ○ ○ ○ ○ ○ ○ ○ ○ ○ ○ ○ ○ ○ ○ ○ ○ ○ ○ ○ ○ ○
16 100 100 0.0 0.0 0 UDAY PRATAP SINGH SP U.P.
○ ○ ○ ○ ○ ○ ○ ○ ○ ○ ○ ○ ○ ○ ○ ○ ○ ○ ○ ○ ○ ○ ○ ○ ○ ○ ○ ○ ○ ○ ○ ○ ○ ○ ○ ○ ○ ○ ○ ○ ○ ○ ○ ○ ○ ○ ○ ○ ○ ○ ○ ○ ○ ○ ○ ○ ○ ○ ○ ○ ○
17 100 100 28.4 0.0 0 SHAHID SIDDIQUI SP U.P.
○ ○ ○ ○ ○ ○ ○ ○ ○ ○ ○ ○ ○ ○ ○ ○ ○ ○ ○ ○ ○ ○ ○ ○ ○ ○ ○ ○ ○ ○ ○ ○ ○ ○ ○ ○ ○ ○ ○ ○ ○ ○ ○ ○ ○ ○ ○ ○ ○ ○ ○ ○ ○ ○ ○ ○ ○ ○ ○ ○ ○
18 100 100 0.0 0.0 0 LALIT SURI ID U.P.
○ ○ ○ ○ ○ ○ ○ ○ ○ ○ ○ ○ ○ ○ ○ ○ ○ ○ ○ ○ ○ ○ ○ ○ ○ ○ ○ ○ ○ ○ ○ ○ ○ ○ ○ ○ ○ ○ ○ ○ ○ ○ ○ ○ ○ ○ ○ ○ ○ ○ ○ ○ ○ ○ ○ ○ ○ ○ ○ ○ ○
19 100 100 0.0 0.0 0 VEER SINGH BSP U.P.
○ ○ ○ ○ ○ ○ ○ ○ ○ ○ ○ ○ ○ ○ ○ ○ ○ ○ ○ ○ ○ ○ ○ ○ ○ ○ ○ ○ ○ ○ ○ ○ ○ ○ ○ ○ ○ ○ ○ ○ ○ ○ ○ ○ ○ ○ ○ ○ ○ ○ ○ ○ ○ ○ ○ ○ ○ ○ ○ ○ ○
20 200 200 65.0 0.1 0 AJAY MAROO BJP JHARKHAND
○ ○ ○ ○ ○ ○ ○ ○ ○ ○ ○ ○ ○ ○ ○ ○ ○ ○ ○ ○ ○ ○ ○ ○ ○ ○ ○ ○ ○ ○ ○ ○ ○ ○ ○ ○ ○ ○ ○ ○ ○ ○ ○ ○ ○ ○ ○ ○ ○ ○ ○ ○ ○ ○ ○ ○ ○ ○ ○ ○ ○
21 700 300 220.0 0.0 0 FALI SAM NARIMAN (N) NOMINATED
○ ○ ○ ○ ○ ○ ○ ○ ○ ○ ○ ○ ○ ○ ○ ○ ○ ○ ○ ○ ○ ○ ○ ○ ○ ○ ○ ○ ○ ○ ○ ○ ○ ○ ○ ○ ○ ○ ○ ○ ○ ○ ○ ○ ○ ○ ○ ○ ○ ○ ○ ○ ○ ○ ○ ○ ○ ○ ○ ○ ○
22 200 200 118.9 0.0 0 LAL JAN BASHA S.M. TDP A.P.
○ ○ ○ ○ ○ ○ ○ ○ ○ ○ ○ ○ ○ ○ ○ ○ ○ ○ ○ ○ ○ ○ ○ ○ ○ ○ ○ ○ ○ ○ ○ ○ ○ ○ ○ ○ ○ ○ ○ ○ ○ ○ ○ ○ ○ ○ ○ ○ ○ ○ ○ ○ ○ ○ ○ ○ ○ ○ ○ ○ ○
23 200 100 0.0 0.0 0 VASHIST NARAIN SINGH SAMATA BIHAR
○ ○ ○ ○ ○ ○ ○ ○ ○ ○ ○ ○ ○ ○ ○ ○ ○ ○ ○ ○ ○ ○ ○ ○ ○ ○ ○ ○ ○ ○ ○ ○ ○ ○ ○ ○ ○ ○ ○ ○ ○ ○ ○ ○ ○ ○ ○ ○ ○ ○ ○ ○ ○ ○ ○ ○ ○ ○ ○ ○ ○
24 200 200 55.0 0.0 0 LALU PRASAD RJD BIHAR
○ ○ ○ ○ ○ ○ ○ ○ ○ ○ ○ ○ ○ ○ ○ ○ ○ ○ ○ ○ ○ ○ ○ ○ ○ ○ ○ ○ ○ ○ ○ ○ ○ ○ ○ ○ ○ ○ ○ ○ ○ ○ ○ ○ ○ ○ ○ ○ ○ ○ ○ ○ ○ ○ ○ ○ ○ ○ ○ ○ ○
25 200 200 102.6 0.0 0 HARENDRA SINGH MALIK INLD HARYANA
○ ○ ○ ○ ○ ○ ○ ○ ○ ○ ○ ○ ○ ○ ○ ○ ○ ○ ○ ○ ○ ○ ○ ○ ○ ○ ○ ○ ○ ○ ○ ○ ○ ○ ○ ○ ○ ○ ○ ○ ○ ○ ○ ○ ○ ○ ○ ○ ○ ○ ○ ○ ○ ○ ○ ○ ○ ○ ○ ○ ○
26 100 100 59.0 0.0 0 P.C. ALEXANDER ID MAHARASHTRA
○ ○ ○ ○ ○ ○ ○ ○ ○ ○ ○ ○ ○ ○ ○ ○ ○ ○ ○ ○ ○ ○ ○ ○ ○ ○ ○ ○ ○ ○ ○ ○ ○ ○ ○ ○ ○ ○ ○ ○ ○ ○ ○ ○ ○ ○ ○ ○ ○ ○ ○ ○ ○ ○ ○ ○ ○ ○ ○ ○ ○
27 200 200 50.8 0.0 0 PRITHVIRAJ DAJISAHEB INC MAHARASHTRA
○ ○ ○ ○ ○ ○ ○ ○ ○ ○ ○ ○ ○ ○ ○ ○ ○ ○ ○ ○ ○ ○ ○ ○ ○ ○ ○ ○ ○ ○ ○ ○ ○ ○ ○ ○ ○ ○ ○ ○ ○ ○ ○ ○ ○ ○ ○ ○ ○ ○ ○ ○ ○ ○ ○ ○ ○ ○ ○ ○ ○
28 200 200 59.4 0.0 0 TARINI KANTA ROY CPI (M) WEST BENGAL
○ ○ ○ ○ ○ ○ ○ ○ ○ ○ ○ ○ ○ ○ ○ ○ ○ ○ ○ ○ ○ ○ ○ ○ ○ ○ ○ ○ ○ ○ ○ ○ ○ ○ ○ ○ ○ ○ ○ ○ ○ ○ ○ ○ ○ ○ ○ ○ ○ ○ ○ ○ ○ ○ ○ ○ ○ ○ ○ ○ ○
29 200 100 84.9 0.0 0 S.K. KHABIR UDDIN AHMED CPI (M) WEST BENGAL
○ ○ ○ ○ ○ ○ ○ ○ ○ ○ ○ ○ ○ ○ ○ ○ ○ ○ ○ ○ ○ ○ ○ ○ ○ ○ ○ ○ ○ ○ ○ ○ ○ ○ ○ ○ ○ ○ ○ ○ ○ ○ ○ ○ ○ ○ ○ ○ ○ ○ ○ ○ ○ ○ ○ ○ ○ ○ ○ ○ ○
30 100 100 0.0 0.0 0 HARISH CHANDER SINGH INC UTTARANCHAL
31 200 200 170.4 0.0 0 MATILAL SARKAR CPI (M) TRIPURA
Source: Ministry of Statistics and Programme Implementation
states like West Bengal, Jammu and Kashmir and Delhi have lowest utilisation rates. Taking union territories
into account, the lowest utilisation of MPLADS funds have been in Andaman and Nicobar islands (see Table-9).
Similarly, Rajya Sabha MPs from smaller states like Arunachal Pradesh, Mizoram, Haryana, Meghalaya, Manipur
and Nagaland have highest utilisation rates whereas comparatively bigger states have lower utilisation rates. Out
of all MPs in Rajya Sabha, MPs from Mizoram have registered highest (96 per cent) utilisation rates whereas
MPs from Jharkhand have utilised only 49.1 per cent of total cumulative release since 1993 (see Table-10).
Table- 8 shows this regional stratification of the use of MPLADS funds.

25
However, the situation changed drastically by January 2004. The latest available information shows that even
some bigger states like Uttar Pradesh, West Bengal and Bihar have registered higher utilisation rates. This might
have been influenced by the urgency of spending more in the wake of forthcoming general elections (see
Annexure-1 to Annexure-3 for details).
All the analysis of secondary information available from the Ministry of Statistics and Programme Implementation
have been summarised in Box-11).
Table - 8
Regional Stratification of the use of MPLADS Funds
% Number of States /UTs Name of the States /UTs
UtilisationRajya Sabha Lok Sabha Rajya Sabha Lok Sabha
Over 8 20
80 Percent
60 -80% 17 14
Less than 5 1
60 %
Source: Compiled from Ministry of Statistics and Programme Implementation.
Arunachal Pradesh, Haryana, Manipur,
Meghalaya, Mizoram, Nagaland,
Pondichery, Chhatishgarh
Andhra Pradesh, Assam, Bihar, Goa,
Gujarat, Himachal Pradesh, J&K,
Karnataka, Maharashtra, Punjab, Rajasthan,
Sikkim, Tamil Nadu, Tripura, Uttar Pradesh,
Jharkhand, West Bengal
Kerala, Orissa, Delhi, Uttarakhand,
Jharkhand
Andhra Pradesh, Arunachal Pradesh, Assam,
Bihar, Haryana, Himachal Pradesh,
Karnataka, Madhya Pradesh, Meghalaya,
Mizoram, Nagaland, Rajasthan, Sikkim,
Tamil Nadu, Uttar Pradesh, Chandigarh,
Dadra & N. Haveli, Daman &Diu
Goa, Gujarat, J & K, Kerala, Maharashtra,
Manipur, Orissa, Punjab, Tripura, West
Bengal, Delhi, Lakshadweep, Pondichery,
Jharkhand.
Andaman & Nicobar Islands
○ ○ ○ ○ ○ ○ ○ ○ ○ ○ ○ ○ ○ ○ ○ ○ ○ ○ ○ ○ ○ ○ ○ ○ ○ ○ ○ ○ ○ ○ ○ ○ ○ ○ ○ ○ ○ ○ ○ ○ ○ ○ ○ ○ ○ ○ ○ ○ ○ ○ ○ ○ ○ ○ ○ ○ ○ ○ ○ ○ ○
○ ○ ○ ○ ○ ○ ○ ○ ○ ○ ○ ○ ○ ○ ○ ○ ○ ○ ○ ○ ○ ○ ○ ○ ○ ○ ○ ○ ○ ○ ○ ○ ○ ○ ○ ○ ○ ○ ○ ○ ○ ○ ○ ○ ○ ○ ○ ○ ○ ○ ○ ○ ○ ○ ○ ○ ○ ○ ○ ○ ○
Section 3.1 - A Summary
� MPs of Lok Sabha have Better Utilisation rates than MPs of Rajya Sabha
� MPs of many regional parties have better utilisation rates than MPs of parties with national existence.
� MPs from smaller States (especially from the North East) have registered higher utilisation rates than
MPs from larger states.
Box 1
1

26
Table - 9
State wise Summary Statement for Release / Expenditure of Lok Sabha MPs
Cumulative Release / Expenditure (Since 1993)
(In Rs. lakh)
S. Name of the Released Sanctioned % Sanction Expenditure % Utilisation
No. State/UT Amount Amount over Release Incurred over Release
○ ○ ○ ○ ○ ○ ○ ○ ○ ○ ○ ○ ○ ○ ○ ○ ○ ○ ○ ○ ○ ○ ○ ○ ○ ○ ○ ○ ○ ○ ○ ○ ○ ○ ○ ○ ○ ○ ○ ○ ○ ○ ○ ○ ○ ○ ○ ○ ○ ○ ○ ○ ○ ○ ○ ○ ○ ○ ○ ○ ○
1 Nominated 2750 2576.2 93.7 2369.9 86.2
○ ○ ○ ○ ○ ○ ○ ○ ○ ○ ○ ○ ○ ○ ○ ○ ○ ○ ○ ○ ○ ○ ○ ○ ○ ○ ○ ○ ○ ○ ○ ○ ○ ○ ○ ○ ○ ○ ○ ○ ○ ○ ○ ○ ○ ○ ○ ○ ○ ○ ○ ○ ○ ○ ○ ○ ○ ○ ○ ○ ○
2 Andhra Pr. 63455 61191.8 96.4 50971.3 80.3
○ ○ ○ ○ ○ ○ ○ ○ ○ ○ ○ ○ ○ ○ ○ ○ ○ ○ ○ ○ ○ ○ ○ ○ ○ ○ ○ ○ ○ ○ ○ ○ ○ ○ ○ ○ ○ ○ ○ ○ ○ ○ ○ ○ ○ ○ ○ ○ ○ ○ ○ ○ ○ ○ ○ ○ ○ ○ ○ ○ ○
3 Arunachal Pr. 3010 2811.2 93.4 2564.1 85.2
○ ○ ○ ○ ○ ○ ○ ○ ○ ○ ○ ○ ○ ○ ○ ○ ○ ○ ○ ○ ○ ○ ○ ○ ○ ○ ○ ○ ○ ○ ○ ○ ○ ○ ○ ○ ○ ○ ○ ○ ○ ○ ○ ○ ○ ○ ○ ○ ○ ○ ○ ○ ○ ○ ○ ○ ○ ○ ○ ○ ○
4 Assam 20870 19630.8 94.1 17591.2 84.3
○ ○ ○ ○ ○ ○ ○ ○ ○ ○ ○ ○ ○ ○ ○ ○ ○ ○ ○ ○ ○ ○ ○ ○ ○ ○ ○ ○ ○ ○ ○ ○ ○ ○ ○ ○ ○ ○ ○ ○ ○ ○ ○ ○ ○ ○ ○ ○ ○ ○ ○ ○ ○ ○ ○ ○ ○ ○ ○ ○ ○
5 Bihar 59190 55872.0 94.4 47975.5 81.1
○ ○ ○ ○ ○ ○ ○ ○ ○ ○ ○ ○ ○ ○ ○ ○ ○ ○ ○ ○ ○ ○ ○ ○ ○ ○ ○ ○ ○ ○ ○ ○ ○ ○ ○ ○ ○ ○ ○ ○ ○ ○ ○ ○ ○ ○ ○ ○ ○ ○ ○ ○ ○ ○ ○ ○ ○ ○ ○ ○ ○
6 Goa 3010 2853.4 94.8 2311.8 76.8
○ ○ ○ ○ ○ ○ ○ ○ ○ ○ ○ ○ ○ ○ ○ ○ ○ ○ ○ ○ ○ ○ ○ ○ ○ ○ ○ ○ ○ ○ ○ ○ ○ ○ ○ ○ ○ ○ ○ ○ ○ ○ ○ ○ ○ ○ ○ ○ ○ ○ ○ ○ ○ ○ ○ ○ ○ ○ ○ ○ ○
7 Gujarat 37330 35669.3 95.6 29669.9 79.5
○ ○ ○ ○ ○ ○ ○ ○ ○ ○ ○ ○ ○ ○ ○ ○ ○ ○ ○ ○ ○ ○ ○ ○ ○ ○ ○ ○ ○ ○ ○ ○ ○ ○ ○ ○ ○ ○ ○ ○ ○ ○ ○ ○ ○ ○ ○ ○ ○ ○ ○ ○ ○ ○ ○ ○ ○ ○ ○ ○ ○
8 Haryana 15050 14189.2 94.3 13155.5 87.4
○ ○ ○ ○ ○ ○ ○ ○ ○ ○ ○ ○ ○ ○ ○ ○ ○ ○ ○ ○ ○ ○ ○ ○ ○ ○ ○ ○ ○ ○ ○ ○ ○ ○ ○ ○ ○ ○ ○ ○ ○ ○ ○ ○ ○ ○ ○ ○ ○ ○ ○ ○ ○ ○ ○ ○ ○ ○ ○ ○ ○
9 Himachal Pr. 5520 5128.2 92.9 4925.5 89.2
○ ○ ○ ○ ○ ○ ○ ○ ○ ○ ○ ○ ○ ○ ○ ○ ○ ○ ○ ○ ○ ○ ○ ○ ○ ○ ○ ○ ○ ○ ○ ○ ○ ○ ○ ○ ○ ○ ○ ○ ○ ○ ○ ○ ○ ○ ○ ○ ○ ○ ○ ○ ○ ○ ○ ○ ○ ○ ○ ○ ○
10 J & K 7500 6855.8 91.4 4842.9 64.6
○ ○ ○ ○ ○ ○ ○ ○ ○ ○ ○ ○ ○ ○ ○ ○ ○ ○ ○ ○ ○ ○ ○ ○ ○ ○ ○ ○ ○ ○ ○ ○ ○ ○ ○ ○ ○ ○ ○ ○ ○ ○ ○ ○ ○ ○ ○ ○ ○ ○ ○ ○ ○ ○ ○ ○ ○ ○ ○ ○ ○
11 Karnataka 42040 40143.3 95.5 35052.0 83.4
○ ○ ○ ○ ○ ○ ○ ○ ○ ○ ○ ○ ○ ○ ○ ○ ○ ○ ○ ○ ○ ○ ○ ○ ○ ○ ○ ○ ○ ○ ○ ○ ○ ○ ○ ○ ○ ○ ○ ○ ○ ○ ○ ○ ○ ○ ○ ○ ○ ○ ○ ○ ○ ○ ○ ○ ○ ○ ○ ○ ○
12 Kerala 29600 29048.9 98.1 21516.0 72.7
○ ○ ○ ○ ○ ○ ○ ○ ○ ○ ○ ○ ○ ○ ○ ○ ○ ○ ○ ○ ○ ○ ○ ○ ○ ○ ○ ○ ○ ○ ○ ○ ○ ○ ○ ○ ○ ○ ○ ○ ○ ○ ○ ○ ○ ○ ○ ○ ○ ○ ○ ○ ○ ○ ○ ○ ○ ○ ○ ○ ○
13 Madhya Pr. 43940 41754.8 95.0 37069.8 84.4
○ ○ ○ ○ ○ ○ ○ ○ ○ ○ ○ ○ ○ ○ ○ ○ ○ ○ ○ ○ ○ ○ ○ ○ ○ ○ ○ ○ ○ ○ ○ ○ ○ ○ ○ ○ ○ ○ ○ ○ ○ ○ ○ ○ ○ ○ ○ ○ ○ ○ ○ ○ ○ ○ ○ ○ ○ ○ ○ ○ ○
14 Maharashtra 71930 69573.5 96.7 55133.3 76.6
○ ○ ○ ○ ○ ○ ○ ○ ○ ○ ○ ○ ○ ○ ○ ○ ○ ○ ○ ○ ○ ○ ○ ○ ○ ○ ○ ○ ○ ○ ○ ○ ○ ○ ○ ○ ○ ○ ○ ○ ○ ○ ○ ○ ○ ○ ○ ○ ○ ○ ○ ○ ○ ○ ○ ○ ○ ○ ○ ○ ○
15 Manipur 3110 2891.5 93.0 2390.1 76.9
○ ○ ○ ○ ○ ○ ○ ○ ○ ○ ○ ○ ○ ○ ○ ○ ○ ○ ○ ○ ○ ○ ○ ○ ○ ○ ○ ○ ○ ○ ○ ○ ○ ○ ○ ○ ○ ○ ○ ○ ○ ○ ○ ○ ○ ○ ○ ○ ○ ○ ○ ○ ○ ○ ○ ○ ○ ○ ○ ○ ○
16 Meghalaya 2810 2619.5 93.2 2560.2 91.1
○ ○ ○ ○ ○ ○ ○ ○ ○ ○ ○ ○ ○ ○ ○ ○ ○ ○ ○ ○ ○ ○ ○ ○ ○ ○ ○ ○ ○ ○ ○ ○ ○ ○ ○ ○ ○ ○ ○ ○ ○ ○ ○ ○ ○ ○ ○ ○ ○ ○ ○ ○ ○ ○ ○ ○ ○ ○ ○ ○ ○
17 Mizoram 1505 1463.6 97.2 1463.6 97.2
○ ○ ○ ○ ○ ○ ○ ○ ○ ○ ○ ○ ○ ○ ○ ○ ○ ○ ○ ○ ○ ○ ○ ○ ○ ○ ○ ○ ○ ○ ○ ○ ○ ○ ○ ○ ○ ○ ○ ○ ○ ○ ○ ○ ○ ○ ○ ○ ○ ○ ○ ○ ○ ○ ○ ○ ○ ○ ○ ○ ○
18 Nagaland 1505 1305.0 86.7 1305.0 86.7
○ ○ ○ ○ ○ ○ ○ ○ ○ ○ ○ ○ ○ ○ ○ ○ ○ ○ ○ ○ ○ ○ ○ ○ ○ ○ ○ ○ ○ ○ ○ ○ ○ ○ ○ ○ ○ ○ ○ ○ ○ ○ ○ ○ ○ ○ ○ ○ ○ ○ ○ ○ ○ ○ ○ ○ ○ ○ ○ ○ ○
19 Orissa 31300 29050.1 92.8 22745.1 72.7
○ ○ ○ ○ ○ ○ ○ ○ ○ ○ ○ ○ ○ ○ ○ ○ ○ ○ ○ ○ ○ ○ ○ ○ ○ ○ ○ ○ ○ ○ ○ ○ ○ ○ ○ ○ ○ ○ ○ ○ ○ ○ ○ ○ ○ ○ ○ ○ ○ ○ ○ ○ ○ ○ ○ ○ ○ ○ ○ ○ ○
20 Punjab 17265 16270.5 94.2 13208.8 76.5
○ ○ ○ ○ ○ ○ ○ ○ ○ ○ ○ ○ ○ ○ ○ ○ ○ ○ ○ ○ ○ ○ ○ ○ ○ ○ ○ ○ ○ ○ ○ ○ ○ ○ ○ ○ ○ ○ ○ ○ ○ ○ ○ ○ ○ ○ ○ ○ ○ ○ ○ ○ ○ ○ ○ ○ ○ ○ ○ ○ ○
21 Rajasthan 39125 37197.0 95.1 32656.2 83.5
○ ○ ○ ○ ○ ○ ○ ○ ○ ○ ○ ○ ○ ○ ○ ○ ○ ○ ○ ○ ○ ○ ○ ○ ○ ○ ○ ○ ○ ○ ○ ○ ○ ○ ○ ○ ○ ○ ○ ○ ○ ○ ○ ○ ○ ○ ○ ○ ○ ○ ○ ○ ○ ○ ○ ○ ○ ○ ○ ○ ○
22 Sikkim 1505 1432.3 95.2 1330.8 88.4
○ ○ ○ ○ ○ ○ ○ ○ ○ ○ ○ ○ ○ ○ ○ ○ ○ ○ ○ ○ ○ ○ ○ ○ ○ ○ ○ ○ ○ ○ ○ ○ ○ ○ ○ ○ ○ ○ ○ ○ ○ ○ ○ ○ ○ ○ ○ ○ ○ ○ ○ ○ ○ ○ ○ ○ ○ ○ ○ ○ ○
23 Tamil Nadu 57495 55195.8 96.0 50987.1 88.7
○ ○ ○ ○ ○ ○ ○ ○ ○ ○ ○ ○ ○ ○ ○ ○ ○ ○ ○ ○ ○ ○ ○ ○ ○ ○ ○ ○ ○ ○ ○ ○ ○ ○ ○ ○ ○ ○ ○ ○ ○ ○ ○ ○ ○ ○ ○ ○ ○ ○ ○ ○ ○ ○ ○ ○ ○ ○ ○ ○ ○
24 Tripura 3010 2821.3 93.7 2095.1 69.6
○ ○ ○ ○ ○ ○ ○ ○ ○ ○ ○ ○ ○ ○ ○ ○ ○ ○ ○ ○ ○ ○ ○ ○ ○ ○ ○ ○ ○ ○ ○ ○ ○ ○ ○ ○ ○ ○ ○ ○ ○ ○ ○ ○ ○ ○ ○ ○ ○ ○ ○ ○ ○ ○ ○ ○ ○ ○ ○ ○ ○
25 Uttar Pr. 120450 112619.4 93.5 99726.9 82.8
○ ○ ○ ○ ○ ○ ○ ○ ○ ○ ○ ○ ○ ○ ○ ○ ○ ○ ○ ○ ○ ○ ○ ○ ○ ○ ○ ○ ○ ○ ○ ○ ○ ○ ○ ○ ○ ○ ○ ○ ○ ○ ○ ○ ○ ○ ○ ○ ○ ○ ○ ○ ○ ○ ○ ○ ○ ○ ○ ○ ○
26 West Bengal 56705 53373.6 94.1 38561.2 68.0
○ ○ ○ ○ ○ ○ ○ ○ ○ ○ ○ ○ ○ ○ ○ ○ ○ ○ ○ ○ ○ ○ ○ ○ ○ ○ ○ ○ ○ ○ ○ ○ ○ ○ ○ ○ ○ ○ ○ ○ ○ ○ ○ ○ ○ ○ ○ ○ ○ ○ ○ ○ ○ ○ ○ ○ ○ ○ ○ ○ ○
27 A & N Islands 1205 1154.1 95.8 689.1 57.2
○ ○ ○ ○ ○ ○ ○ ○ ○ ○ ○ ○ ○ ○ ○ ○ ○ ○ ○ ○ ○ ○ ○ ○ ○ ○ ○ ○ ○ ○ ○ ○ ○ ○ ○ ○ ○ ○ ○ ○ ○ ○ ○ ○ ○ ○ ○ ○ ○ ○ ○ ○ ○ ○ ○ ○ ○ ○ ○ ○ ○
28 Chandigarh 1305 1220.4 93.5 1220.4 93.5
○ ○ ○ ○ ○ ○ ○ ○ ○ ○ ○ ○ ○ ○ ○ ○ ○ ○ ○ ○ ○ ○ ○ ○ ○ ○ ○ ○ ○ ○ ○ ○ ○ ○ ○ ○ ○ ○ ○ ○ ○ ○ ○ ○ ○ ○ ○ ○ ○ ○ ○ ○ ○ ○ ○ ○ ○ ○ ○ ○ ○
29 D & N Haveli 1505 1455.9 96.7 1230.2 81.7
○ ○ ○ ○ ○ ○ ○ ○ ○ ○ ○ ○ ○ ○ ○ ○ ○ ○ ○ ○ ○ ○ ○ ○ ○ ○ ○ ○ ○ ○ ○ ○ ○ ○ ○ ○ ○ ○ ○ ○ ○ ○ ○ ○ ○ ○ ○ ○ ○ ○ ○ ○ ○ ○ ○ ○ ○ ○ ○ ○ ○
30 Daman & Diu 1505 1407.3 93.5 1407.3 93.5
○ ○ ○ ○ ○ ○ ○ ○ ○ ○ ○ ○ ○ ○ ○ ○ ○ ○ ○ ○ ○ ○ ○ ○ ○ ○ ○ ○ ○ ○ ○ ○ ○ ○ ○ ○ ○ ○ ○ ○ ○ ○ ○ ○ ○ ○ ○ ○ ○ ○ ○ ○ ○ ○ ○ ○ ○ ○ ○ ○ ○
31 Delhi 9630 9044.3 93.9 6683.1 69.4
○ ○ ○ ○ ○ ○ ○ ○ ○ ○ ○ ○ ○ ○ ○ ○ ○ ○ ○ ○ ○ ○ ○ ○ ○ ○ ○ ○ ○ ○ ○ ○ ○ ○ ○ ○ ○ ○ ○ ○ ○ ○ ○ ○ ○ ○ ○ ○ ○ ○ ○ ○ ○ ○ ○ ○ ○ ○ ○ ○ ○
32 Lakshdweep 1405 1341.8 95.5 877.7 62.5
○ ○ ○ ○ ○ ○ ○ ○ ○ ○ ○ ○ ○ ○ ○ ○ ○ ○ ○ ○ ○ ○ ○ ○ ○ ○ ○ ○ ○ ○ ○ ○ ○ ○ ○ ○ ○ ○ ○ ○ ○ ○ ○ ○ ○ ○ ○ ○ ○ ○ ○ ○ ○ ○ ○ ○ ○ ○ ○ ○ ○
33 Pondichery 1505 1477.7 98.2 1118.7 74.3
○ ○ ○ ○ ○ ○ ○ ○ ○ ○ ○ ○ ○ ○ ○ ○ ○ ○ ○ ○ ○ ○ ○ ○ ○ ○ ○ ○ ○ ○ ○ ○ ○ ○ ○ ○ ○ ○ ○ ○ ○ ○ ○ ○ ○ ○ ○ ○ ○ ○ ○ ○ ○ ○ ○ ○ ○ ○ ○ ○ ○
34 Chhatishgarh 16155 15059.1 93.2 14026.2 86.8
○ ○ ○ ○ ○ ○ ○ ○ ○ ○ ○ ○ ○ ○ ○ ○ ○ ○ ○ ○ ○ ○ ○ ○ ○ ○ ○ ○ ○ ○ ○ ○ ○ ○ ○ ○ ○ ○ ○ ○ ○ ○ ○ ○ ○ ○ ○ ○ ○ ○ ○ ○ ○ ○ ○ ○ ○ ○ ○ ○ ○
35 Uttaranchal 7425 6904.1 93.0 6291.4 84.7
36 Jharkhand 18670 17180.9 92.0 14004.3 75.0
GRAND TOTAL 801290 759783.8 94.8 641727.2 80.1
Source: Government of India, Department of Statistics and Programme Implementation

27
Table - 10
State wise Summary Statement for Release / Expenditure of Rajya Sabha MPs
Cumulative Release / Expenditure (Since 1993)
(In Rs. lakh)
S. Name of the Released Sanctioned % Sanction Expenditure % Utilisation
No. State/UT Amount Amount over Release Incurred over Release
○ ○ ○ ○ ○ ○ ○ ○ ○ ○ ○ ○ ○ ○ ○ ○ ○ ○ ○ ○ ○ ○ ○ ○ ○ ○ ○ ○ ○ ○ ○ ○ ○ ○ ○ ○ ○ ○ ○ ○ ○ ○ ○ ○ ○ ○ ○ ○ ○ ○ ○ ○ ○ ○ ○ ○ ○ ○ ○ ○ ○
1 Nominated 12050 10754.1 89.2 8932.9 74.1
○ ○ ○ ○ ○ ○ ○ ○ ○ ○ ○ ○ ○ ○ ○ ○ ○ ○ ○ ○ ○ ○ ○ ○ ○ ○ ○ ○ ○ ○ ○ ○ ○ ○ ○ ○ ○ ○ ○ ○ ○ ○ ○ ○ ○ ○ ○ ○ ○ ○ ○ ○ ○ ○ ○ ○ ○ ○ ○ ○ ○
2 Andhra Pr. 27140 25602.3 94.3 19915.3 73.4
○ ○ ○ ○ ○ ○ ○ ○ ○ ○ ○ ○ ○ ○ ○ ○ ○ ○ ○ ○ ○ ○ ○ ○ ○ ○ ○ ○ ○ ○ ○ ○ ○ ○ ○ ○ ○ ○ ○ ○ ○ ○ ○ ○ ○ ○ ○ ○ ○ ○ ○ ○ ○ ○ ○ ○ ○ ○ ○ ○ ○
3 Arunachal Pr. 1505 1471.1 97.7 1299.8 86.4
○ ○ ○ ○ ○ ○ ○ ○ ○ ○ ○ ○ ○ ○ ○ ○ ○ ○ ○ ○ ○ ○ ○ ○ ○ ○ ○ ○ ○ ○ ○ ○ ○ ○ ○ ○ ○ ○ ○ ○ ○ ○ ○ ○ ○ ○ ○ ○ ○ ○ ○ ○ ○ ○ ○ ○ ○ ○ ○ ○ ○
4 Assam 10385 9292.7 89.5 8238.4 79.3
○ ○ ○ ○ ○ ○ ○ ○ ○ ○ ○ ○ ○ ○ ○ ○ ○ ○ ○ ○ ○ ○ ○ ○ ○ ○ ○ ○ ○ ○ ○ ○ ○ ○ ○ ○ ○ ○ ○ ○ ○ ○ ○ ○ ○ ○ ○ ○ ○ ○ ○ ○ ○ ○ ○ ○ ○ ○ ○ ○ ○
5 Bihar 24195 22344.8 92.4 17195.1 71.1
○ ○ ○ ○ ○ ○ ○ ○ ○ ○ ○ ○ ○ ○ ○ ○ ○ ○ ○ ○ ○ ○ ○ ○ ○ ○ ○ ○ ○ ○ ○ ○ ○ ○ ○ ○ ○ ○ ○ ○ ○ ○ ○ ○ ○ ○ ○ ○ ○ ○ ○ ○ ○ ○ ○ ○ ○ ○ ○ ○ ○
6 Goa 1105 990.4 89.6 700.4 63.4
○ ○ ○ ○ ○ ○ ○ ○ ○ ○ ○ ○ ○ ○ ○ ○ ○ ○ ○ ○ ○ ○ ○ ○ ○ ○ ○ ○ ○ ○ ○ ○ ○ ○ ○ ○ ○ ○ ○ ○ ○ ○ ○ ○ ○ ○ ○ ○ ○ ○ ○ ○ ○ ○ ○ ○ ○ ○ ○ ○ ○
7 Gujarat 15105 13715.6 90.8 10329.9 68.4
○ ○ ○ ○ ○ ○ ○ ○ ○ ○ ○ ○ ○ ○ ○ ○ ○ ○ ○ ○ ○ ○ ○ ○ ○ ○ ○ ○ ○ ○ ○ ○ ○ ○ ○ ○ ○ ○ ○ ○ ○ ○ ○ ○ ○ ○ ○ ○ ○ ○ ○ ○ ○ ○ ○ ○ ○ ○ ○ ○ ○
8 Haryana 7375 6948.3 94.2 6306.1 85.5
○ ○ ○ ○ ○ ○ ○ ○ ○ ○ ○ ○ ○ ○ ○ ○ ○ ○ ○ ○ ○ ○ ○ ○ ○ ○ ○ ○ ○ ○ ○ ○ ○ ○ ○ ○ ○ ○ ○ ○ ○ ○ ○ ○ ○ ○ ○ ○ ○ ○ ○ ○ ○ ○ ○ ○ ○ ○ ○ ○ ○
9 Himachal Pr. 4215 3670.5 87.1 3062.2 72.7
○ ○ ○ ○ ○ ○ ○ ○ ○ ○ ○ ○ ○ ○ ○ ○ ○ ○ ○ ○ ○ ○ ○ ○ ○ ○ ○ ○ ○ ○ ○ ○ ○ ○ ○ ○ ○ ○ ○ ○ ○ ○ ○ ○ ○ ○ ○ ○ ○ ○ ○ ○ ○ ○ ○ ○ ○ ○ ○ ○ ○
10 J & K 4150 3860.3 93.0 2583.6 62.3
○ ○ ○ ○ ○ ○ ○ ○ ○ ○ ○ ○ ○ ○ ○ ○ ○ ○ ○ ○ ○ ○ ○ ○ ○ ○ ○ ○ ○ ○ ○ ○ ○ ○ ○ ○ ○ ○ ○ ○ ○ ○ ○ ○ ○ ○ ○ ○ ○ ○ ○ ○ ○ ○ ○ ○ ○ ○ ○ ○ ○
11 Karnataka 17360 15768.2 90.8 14406.4 83.0
○ ○ ○ ○ ○ ○ ○ ○ ○ ○ ○ ○ ○ ○ ○ ○ ○ ○ ○ ○ ○ ○ ○ ○ ○ ○ ○ ○ ○ ○ ○ ○ ○ ○ ○ ○ ○ ○ ○ ○ ○ ○ ○ ○ ○ ○ ○ ○ ○ ○ ○ ○ ○ ○ ○ ○ ○ ○ ○ ○ ○
12 Kerala 12595 11362.5 90.2 7175.5 57.0
○ ○ ○ ○ ○ ○ ○ ○ ○ ○ ○ ○ ○ ○ ○ ○ ○ ○ ○ ○ ○ ○ ○ ○ ○ ○ ○ ○ ○ ○ ○ ○ ○ ○ ○ ○ ○ ○ ○ ○ ○ ○ ○ ○ ○ ○ ○ ○ ○ ○ ○ ○ ○ ○ ○ ○ ○ ○ ○ ○ ○
13 Madhya Pr. 17420 16148.3 92.7 13668.0 78.5
○ ○ ○ ○ ○ ○ ○ ○ ○ ○ ○ ○ ○ ○ ○ ○ ○ ○ ○ ○ ○ ○ ○ ○ ○ ○ ○ ○ ○ ○ ○ ○ ○ ○ ○ ○ ○ ○ ○ ○ ○ ○ ○ ○ ○ ○ ○ ○ ○ ○ ○ ○ ○ ○ ○ ○ ○ ○ ○ ○ ○
14 Maharashtra 25245 23260.6 92.1 16814.9 66.6
○ ○ ○ ○ ○ ○ ○ ○ ○ ○ ○ ○ ○ ○ ○ ○ ○ ○ ○ ○ ○ ○ ○ ○ ○ ○ ○ ○ ○ ○ ○ ○ ○ ○ ○ ○ ○ ○ ○ ○ ○ ○ ○ ○ ○ ○ ○ ○ ○ ○ ○ ○ ○ ○ ○ ○ ○ ○ ○ ○ ○
15 Manipur 1605 1481.5 92.3 1423.9 88.7
○ ○ ○ ○ ○ ○ ○ ○ ○ ○ ○ ○ ○ ○ ○ ○ ○ ○ ○ ○ ○ ○ ○ ○ ○ ○ ○ ○ ○ ○ ○ ○ ○ ○ ○ ○ ○ ○ ○ ○ ○ ○ ○ ○ ○ ○ ○ ○ ○ ○ ○ ○ ○ ○ ○ ○ ○ ○ ○ ○ ○
16 Meghalaya 1405 1210.5 86.2 1210.5 86.2
○ ○ ○ ○ ○ ○ ○ ○ ○ ○ ○ ○ ○ ○ ○ ○ ○ ○ ○ ○ ○ ○ ○ ○ ○ ○ ○ ○ ○ ○ ○ ○ ○ ○ ○ ○ ○ ○ ○ ○ ○ ○ ○ ○ ○ ○ ○ ○ ○ ○ ○ ○ ○ ○ ○ ○ ○ ○ ○ ○ ○
17 Mizoram 1505 1445.5 96.0 1445.4 96.0
○ ○ ○ ○ ○ ○ ○ ○ ○ ○ ○ ○ ○ ○ ○ ○ ○ ○ ○ ○ ○ ○ ○ ○ ○ ○ ○ ○ ○ ○ ○ ○ ○ ○ ○ ○ ○ ○ ○ ○ ○ ○ ○ ○ ○ ○ ○ ○ ○ ○ ○ ○ ○ ○ ○ ○ ○ ○ ○ ○ ○
18 Nagaland 1505 1405.0 93.4 1405.0 93.4
○ ○ ○ ○ ○ ○ ○ ○ ○ ○ ○ ○ ○ ○ ○ ○ ○ ○ ○ ○ ○ ○ ○ ○ ○ ○ ○ ○ ○ ○ ○ ○ ○ ○ ○ ○ ○ ○ ○ ○ ○ ○ ○ ○ ○ ○ ○ ○ ○ ○ ○ ○ ○ ○ ○ ○ ○ ○ ○ ○ ○
19 Orissa 14700 13068.1 88.9 8442.1 57.4
○ ○ ○ ○ ○ ○ ○ ○ ○ ○ ○ ○ ○ ○ ○ ○ ○ ○ ○ ○ ○ ○ ○ ○ ○ ○ ○ ○ ○ ○ ○ ○ ○ ○ ○ ○ ○ ○ ○ ○ ○ ○ ○ ○ ○ ○ ○ ○ ○ ○ ○ ○ ○ ○ ○ ○ ○ ○ ○ ○ ○
20 Punjab 10040 9340.8 93.0 7702.4 76.7
○ ○ ○ ○ ○ ○ ○ ○ ○ ○ ○ ○ ○ ○ ○ ○ ○ ○ ○ ○ ○ ○ ○ ○ ○ ○ ○ ○ ○ ○ ○ ○ ○ ○ ○ ○ ○ ○ ○ ○ ○ ○ ○ ○ ○ ○ ○ ○ ○ ○ ○ ○ ○ ○ ○ ○ ○ ○ ○ ○ ○
21 Rajasthan 14600 13773.8 94.3 11269.9 77.2
○ ○ ○ ○ ○ ○ ○ ○ ○ ○ ○ ○ ○ ○ ○ ○ ○ ○ ○ ○ ○ ○ ○ ○ ○ ○ ○ ○ ○ ○ ○ ○ ○ ○ ○ ○ ○ ○ ○ ○ ○ ○ ○ ○ ○ ○ ○ ○ ○ ○ ○ ○ ○ ○ ○ ○ ○ ○ ○ ○ ○
22 Sikkim 1505 1396.4 92.8 1181.8 78.5
○ ○ ○ ○ ○ ○ ○ ○ ○ ○ ○ ○ ○ ○ ○ ○ ○ ○ ○ ○ ○ ○ ○ ○ ○ ○ ○ ○ ○ ○ ○ ○ ○ ○ ○ ○ ○ ○ ○ ○ ○ ○ ○ ○ ○ ○ ○ ○ ○ ○ ○ ○ ○ ○ ○ ○ ○ ○ ○ ○ ○
23 Tamil Nadu 26840 25725.2 95.8 23404.5 87.2
○ ○ ○ ○ ○ ○ ○ ○ ○ ○ ○ ○ ○ ○ ○ ○ ○ ○ ○ ○ ○ ○ ○ ○ ○ ○ ○ ○ ○ ○ ○ ○ ○ ○ ○ ○ ○ ○ ○ ○ ○ ○ ○ ○ ○ ○ ○ ○ ○ ○ ○ ○ ○ ○ ○ ○ ○ ○ ○ ○ ○
24 Tripura 1405 1304.1 92.8 1039.1 74.0
○ ○ ○ ○ ○ ○ ○ ○ ○ ○ ○ ○ ○ ○ ○ ○ ○ ○ ○ ○ ○ ○ ○ ○ ○ ○ ○ ○ ○ ○ ○ ○ ○ ○ ○ ○ ○ ○ ○ ○ ○ ○ ○ ○ ○ ○ ○ ○ ○ ○ ○ ○ ○ ○ ○ ○ ○ ○ ○ ○ ○
25 Uttar Pr. 45820 42234.0 92.2 34610.9 75.5
○ ○ ○ ○ ○ ○ ○ ○ ○ ○ ○ ○ ○ ○ ○ ○ ○ ○ ○ ○ ○ ○ ○ ○ ○ ○ ○ ○ ○ ○ ○ ○ ○ ○ ○ ○ ○ ○ ○ ○ ○ ○ ○ ○ ○ ○ ○ ○ ○ ○ ○ ○ ○ ○ ○ ○ ○ ○ ○ ○ ○
26 West Bengal 20980 18172.4 87.5 14144.4 68.1
○ ○ ○ ○ ○ ○ ○ ○ ○ ○ ○ ○ ○ ○ ○ ○ ○ ○ ○ ○ ○ ○ ○ ○ ○ ○ ○ ○ ○ ○ ○ ○ ○ ○ ○ ○ ○ ○ ○ ○ ○ ○ ○ ○ ○ ○ ○ ○ ○ ○ ○ ○ ○ ○ ○ ○ ○ ○ ○ ○ ○
27 Delhi 3665 3391.9 92.5 2059.6 56.2
○ ○ ○ ○ ○ ○ ○ ○ ○ ○ ○ ○ ○ ○ ○ ○ ○ ○ ○ ○ ○ ○ ○ ○ ○ ○ ○ ○ ○ ○ ○ ○ ○ ○ ○ ○ ○ ○ ○ ○ ○ ○ ○ ○ ○ ○ ○ ○ ○ ○ ○ ○ ○ ○ ○ ○ ○ ○ ○ ○ ○
28 Pondichery 1505 1535.8 102.0 1221.1 81.1
○ ○ ○ ○ ○ ○ ○ ○ ○ ○ ○ ○ ○ ○ ○ ○ ○ ○ ○ ○ ○ ○ ○ ○ ○ ○ ○ ○ ○ ○ ○ ○ ○ ○ ○ ○ ○ ○ ○ ○ ○ ○ ○ ○ ○ ○ ○ ○ ○ ○ ○ ○ ○ ○ ○ ○ ○ ○ ○ ○ ○
29 Chhatishgarh 6010 5444.5 90.6 4898.9 81.5
○ ○ ○ ○ ○ ○ ○ ○ ○ ○ ○ ○ ○ ○ ○ ○ ○ ○ ○ ○ ○ ○ ○ ○ ○ ○ ○ ○ ○ ○ ○ ○ ○ ○ ○ ○ ○ ○ ○ ○ ○ ○ ○ ○ ○ ○ ○ ○ ○ ○ ○ ○ ○ ○ ○ ○ ○ ○ ○ ○ ○
30 Uttaranchal 2700 2316.5 85.8 1391.1 51.5
31 Jharkhand 4305 3614.6 84.0 2115.6 49.1
GRAND TOTAL 339740 312059.5 91.9 249594.7 73.5
Source: Government of India, Department of Statistics and Programme Implementation
3.2 Pattern in the Expenditure Incurred For the Works Undertaken Under MPLADS
in Selected Sample Constituencies
After the review of government data available on rate of utilisation of MPLADS funds, we now concentrate on
the pattern of expenditure in some specific constituencies, which are a part of our sample constituencies.

28
To collect information on the types of works on which MPLADS funds were used, we requested each and every
MP to provide information for at least the recent years. However, only 17 MPs from Lok Sabha and 15 MPs
from Rajya Sabha actually responded. Out of these 32 MPs, only 13 MPs had provided some information on
the pattern of expenditure in terms of works under MPLADS. In this section, we have tried to analyse this
information, compiling them into different categories, namely construction, roads and bridges, water supply,
sanitation, education, social development, electrification and health, the aim being to look at the
pattern of expenditure.
� State: Karnataka
Constituency: KANARA
Member: Margaret Alva (Lok Sabha)
� The constituency of Margaret Alva exhibits large-
scale variation in the distribution of works under
different categories (See Table-11).
� Out of total 23 works completed during 2000-01,
10 are general construction works, 6 works are for
social development, 3 for facilitating education, 2
for water supply purposes and 1 each for roads
and bridges, and sanitation purposes. Regarding
the amount of money spent on these 23 works,
more than 70 per cent of the total money was
spent on construction and roads and bridges only.
Interestingly, there has been no expenditure for
crucial items like health and electrification.
� If we take into account the use of MPLADS funds
from the perspective of setting up infrastructure for
the benefit of the poor and the marginalised
section of the society, the expenditure pattern for
Margaret Alva’s constituency shows a limited
purpose. This is not to say that spending on
general construction, and roads and bridges are
not important, but such projects require huge
investments and an MP solely based on a meagre
MPLADS allotment of Rs. 2 crore cannot
adequately create infrastructure like huge buildings, roads, bridges etc. Moreover, small local needs (like
creating small health, education facilities, sanitation, water supply) can be met with the fund in a better
and useful manner; and that is precisely the objective behind the scheme.
� Table-9 shows that a single project on roads has consumed around 25 per cent of the total expenditure for
that year. Such huge concentration of fund on a single project is undesirable when at the government level
social sector expenditure is largely ignored. Similar trend prevailed in expenditure under MPLADS in this
constituency even during 2001-02 and 2002-03.
� State: Uttar Pradesh
Constituency: Sivalkhas (Varnawa), Meerut
Member: Ajit Singh
� The information on Sivalkhas constituency under MP Ajit Singh shows similar trend in the pattern of
expenditure.
� Table -12 shows that over period 2001-03 whatever work had been there under MPLADS had been
largely done on roads and bridges.
Table - 11
Patterns of Expenditure in Kanara
During 2000-2003
Year � 2000-01 2001-2 & 2002-3
Amount in No of Amount in No of
Rs. lakh Works Rs. lakh Works
Construction 18.3 10.0 18.80 7.0
○ ○ ○ ○ ○ ○ ○ ○ ○ ○ ○ ○ ○ ○ ○ ○ ○ ○ ○ ○ ○ ○ ○ ○ ○ ○ ○ ○ ○ ○
(46.0) (43.0) (30.00) (21.2)
Roads & 8.5 1.0 14.25 6.0
○ ○ ○ ○ ○ ○ ○ ○ ○ ○ ○ ○ ○ ○ ○ ○ ○ ○ ○ ○ ○ ○ ○ ○ ○ ○ ○ ○ ○ ○
Bridges (25.0) (4.3) (23.00) (18.2)
Water Supply 0.6 2.0 13.00 7.0
○ ○ ○ ○ ○ ○ ○ ○ ○ ○ ○ ○ ○ ○ ○ ○ ○ ○ ○ ○ ○ ○ ○ ○ ○ ○ ○ ○ ○ ○
(1.5) (8.6) (21.00) (21.2)
Sanitation 0.6 1.0 1.00 1.0
○ ○ ○ ○ ○ ○ ○ ○ ○ ○ ○ ○ ○ ○ ○ ○ ○ ○ ○ ○ ○ ○ ○ ○ ○ ○ ○ ○ ○ ○
(1.5) (4.3) (1.60) (3.0)
Education 5.0 3.0 1.50 2.0
○ ○ ○ ○ ○ ○ ○ ○ ○ ○ ○ ○ ○ ○ ○ ○ ○ ○ ○ ○ ○ ○ ○ ○ ○ ○ ○ ○ ○ ○
(12.5) (13.0) (2.50) (6.0)
Social 7.0 6.0 13.00 10.0
○ ○ ○ ○ ○ ○ ○ ○ ○ ○ ○ ○ ○ ○ ○ ○ ○ ○ ○ ○ ○ ○ ○ ○ ○ ○ ○ ○ ○ ○
Development (17.5) (26.0) (21.50) (33.3)
Electrification 0.0 0.0 0.00 0.0
○ ○ ○ ○ ○ ○ ○ ○ ○ ○ ○ ○ ○ ○ ○ ○ ○ ○ ○ ○ ○ ○ ○ ○ ○ ○ ○ ○ ○ ○
(0.0) (0.0) (0.00) (0.0)
Health 0.0 0.0 0.00 0.0
(0.0) (0.0) (0.00) (0.0)
TOTAL 40.0 23.0 61.90 33.0
(100.0) (100.0) (100.00) (100.0)
Source: Calculated from the information provided by the MP
(Kanara)
Figures in the parentheses indicate the percentage of total

29
� In terms of money spent, around Rs. 49.42 lakh
was spent from MPLADS to undertake 35 works
on roads and bridges. This amount comes to
around 95 per cent of the total money spent under
MPLADS during that year.
� In 2002-03 the amount spent on roads and bridges
further increased to Rs. 51.37 lakh, accounting for
around 97 per cent of the total money spent
during that year for 22 works on roads and
bridges.
� The moot point here to note is that there has been
no attention for crucial sectors like education,
health, social development and electrification,
which could have benefited the poor and the
marginalised sections of the population in an
efficient way. Even for sanitation projects, we
notice a steady decline in the amount spent over
these 2 years from Rs. 2.74 lakh in 2001-02 to
Rs. 1.71 lakh in 2002-03.
� In this constituency, there is no uniformity in the
distribution of works across different uses. It has
often been observed that projects on roads and
bridges or general construction involve large-scale
corruption during implementation. That does not
imply that projects in other categories are insulated
from corrupt practices, but given the bigger volume
and historical builder-contractor-official nexus
almost everywhere in India, construction and roads and bridges projects are more prone to corruption than
other possible categories of projects. This is why such concentration of MPLADS fund under roads and
bridges becomes a matter of concern for the common citizens.
� State: Kerala
Rajya Sabha
Member: N. K. Premchandran
� The pattern of expenditure incurred under MPLADS in Rajya Sabha constituency of member N. K.
Premchandran is somehow satisfactory as far as its coverage of different sectors are concerned. For this
constituency, we have information of completed works for only 2002-03.
� Table -13 shows that social sectors like education and health, have been given due significance. In fact, a
substantial amount of money is spent for providing/enhancing educational facilities, though roads and
bridges still continue to enjoy the largest share in the expenditure of this constituency as well.
� Out of total Rs. 128.9 lakh spent under MPLADS on completed works during 2002-2003, around 29 per
cent (Rs. 37.28 lakh) had been spent on roads and bridges, around 27 per cent (Rs. 34.54 lakh) spent on
educational projects, around 19 per cent (Rs. 24.93 lakh) on general construction and around 8 per cent
(Rs. 10 lakh) had been spent on social development. As far as number of works is concerned, projects for
enhancing education tops the list (41 per cent) followed by roads and bridges (24 per cent) and general
construction (22 per cent).
� An interesting observation can be made here. Since expenditure pattern under MPLADS does not
directly affect the immediate political position of a Rajya Sabha MP (who is not directly elected by the
Table - 12
Patterns of Expenditure in Sivalkhas
During 2000-2003
Year � 2000-01 2001-2 & 2002-3
Amount in No of Amount in No of
Rs. lakh Works Rs. lakh Works
Construction 0.00 0 0.00 0
○ ○ ○ ○ ○ ○ ○ ○ ○ ○ ○ ○ ○ ○ ○ ○ ○ ○ ○ ○ ○ ○ ○ ○ ○ ○ ○ ○ ○ ○
(0.00) (0) (0.00) (0)
Roads & 49.42 35 51.37 22
○ ○ ○ ○ ○ ○ ○ ○ ○ ○ ○ ○ ○ ○ ○ ○ ○ ○ ○ ○ ○ ○ ○ ○ ○ ○ ○ ○ ○ ○
Bridges (95.00) (97) (97.00) (95)
Water Supply 0.00 0 0.00 0
○ ○ ○ ○ ○ ○ ○ ○ ○ ○ ○ ○ ○ ○ ○ ○ ○ ○ ○ ○ ○ ○ ○ ○ ○ ○ ○ ○ ○ ○
(0.00) (0) (0.00) (0)
Sanitation 2.74 1 1.71 1
○ ○ ○ ○ ○ ○ ○ ○ ○ ○ ○ ○ ○ ○ ○ ○ ○ ○ ○ ○ ○ ○ ○ ○ ○ ○ ○ ○ ○ ○
(5.00) (3) (3.00) (5)
Education 0.00 0 0.00 0
○ ○ ○ ○ ○ ○ ○ ○ ○ ○ ○ ○ ○ ○ ○ ○ ○ ○ ○ ○ ○ ○ ○ ○ ○ ○ ○ ○ ○ ○
(0.00) (0) (0.00) (0)
Social 0.00 0 0.00 0
○ ○ ○ ○ ○ ○ ○ ○ ○ ○ ○ ○ ○ ○ ○ ○ ○ ○ ○ ○ ○ ○ ○ ○ ○ ○ ○ ○ ○ ○
Development (0.00) (0) (0.00) (0)
Electrification 0.00 0 0.00 0
○ ○ ○ ○ ○ ○ ○ ○ ○ ○ ○ ○ ○ ○ ○ ○ ○ ○ ○ ○ ○ ○ ○ ○ ○ ○ ○ ○ ○ ○
(0.00) (0) (0.00) (0)
Health 0.00 0 0.00 0
(0.00) (0) (0.00) (0)
TOTAL 52.15 36 53.08 23
(100.00) (100) (100.00) (100)
Source: Calculated from the information provided by the MP
(Sivalkhas)
Figures in the parentheses indicate the percentage of total

30
people), so locally useful projects, (which may not attract publicity and
media attention) like small education and health facilities, social
development etc., seem to have better chance to get implemented
under MPLADS in a Rajya Sabha constituency. In case of Lok Sabha
MPs, as MPLADS becomes an instrument for popular mobilisation and
instant publicity, social sector expenditure gets ignored and heavy
concentration of expenditure is seen on construction projects, or roads
and bridges. The criteria of publicity seem to have strongly influenced
the recommendation policy of the MP rather than their actual benefit
criteria.
� State: Andhra Pradesh
Rajya Sabha
Member : S. Ramamuni Reddy
District : Cuddapah
� Figures presented in Table -14 show that even in the Cuddapah
District of Member S. Ramamuni Reddy (Rajya Sabha), there
exists a large concentration of works in construction and roads
and bridges projects; but almost all other sectors have got
coverage under the scheme.
� The most disturbing trend is the increase, both in terms of money
spent for roads and bridges projects as well as the number of works
under this head over the years.
� The amount
spent under
MPLADS for roads and bridges almost doubled
in 2001-02 to Rs. 75.8 lakh from Rs. 39.34 lakh
in 2000-01. Such a trend also might indicate an
affinity towards electoralism though the MP is from
Rajya Sabha. It does matter a lot for the popularity
of the MP concerned when one can show publicly
more number of works done or undertaken; and
the MP inaugurating the foundation stone or
projects more frequently, on the face value, creates
more impact than bothering about nature, quality
or the possible long term impacts of such works
in terms of human development.
� In this constituency, we observe that the amount
of money as well as number of works in water
supply, sanitation, social development,
electrification and health services have visibly
declined whereas the same for general construction
works and roads and bridges has increased
substantially.
� Though education did not figure at all in 2000-
01, the situation slightly improved in 2001-02 with
around 0.8 per cent of total money spent for the
year.
Table - 13
Pattern of Expenditure by Rajya
Sabha MP N. K. Premachandran
Year � 2001-03
Amount in No of
Rs. lakh Works
Construction 24.93 14.0
○ ○ ○ ○ ○ ○ ○ ○ ○ ○ ○ ○ ○ ○ ○ ○ ○ ○ ○
(19.34) (22.0)
Roads & 37.28 15.0
○ ○ ○ ○ ○ ○ ○ ○ ○ ○ ○ ○ ○ ○ ○ ○ ○ ○ ○
Bridges (28.92) (24.0)
Water Supply 0.00 0.0
○ ○ ○ ○ ○ ○ ○ ○ ○ ○ ○ ○ ○ ○ ○ ○ ○ ○ ○
(0.00) (0.0)
Sanitation 13.72 4.0
○ ○ ○ ○ ○ ○ ○ ○ ○ ○ ○ ○ ○ ○ ○ ○ ○ ○ ○
(10.60) (6.3)
Education 34.54 26.0
○ ○ ○ ○ ○ ○ ○ ○ ○ ○ ○ ○ ○ ○ ○ ○ ○ ○ ○
(26.80) (41.0)
Social 10.00 1.0
○ ○ ○ ○ ○ ○ ○ ○ ○ ○ ○ ○ ○ ○ ○ ○ ○ ○ ○
Development (7.80) (1.6)
Electrification 0.52 1.0
○ ○ ○ ○ ○ ○ ○ ○ ○ ○ ○ ○ ○ ○ ○ ○ ○ ○ ○
(0.40) (1.6)
Health 7.93 2.0
(6.15) (3.2)
TOTAL 128.92 63.0
(100.00) (100.0)
Source: Calculated from the information
provided by the MP (Sivalkhas)
Figures in the parentheses indicate the
percentage of total
Table - 14
Patterns in the Expenditure by Rajya Sabha MP
S. Ramamuni Reddy During 2000-2003
Year � 2000-01 2001-2 & 2002-3
Amount in No of Amount in No of
Rs. lakh Works Rs. lakh Works
Construction 47.82 27.0 37.99 41.0
○ ○ ○ ○ ○ ○ ○ ○ ○ ○ ○ ○ ○ ○ ○ ○ ○ ○ ○ ○ ○ ○ ○ ○ ○ ○ ○ ○ ○ ○
(28.50) (20.5) (25.50) (31.3)
Roads & 39.34 35.0 75.79 47.0
○ ○ ○ ○ ○ ○ ○ ○ ○ ○ ○ ○ ○ ○ ○ ○ ○ ○ ○ ○ ○ ○ ○ ○ ○ ○ ○ ○ ○ ○
Bridges (23.50) (26.5) (51.00) (35.9)
Water Supply 34.59 37.0 20.00 29.0
○ ○ ○ ○ ○ ○ ○ ○ ○ ○ ○ ○ ○ ○ ○ ○ ○ ○ ○ ○ ○ ○ ○ ○ ○ ○ ○ ○ ○ ○
(20.60) (28.0) (13.50) (22.1)
Sanitation 5.71 7.0 5.25 2.0
○ ○ ○ ○ ○ ○ ○ ○ ○ ○ ○ ○ ○ ○ ○ ○ ○ ○ ○ ○ ○ ○ ○ ○ ○ ○ ○ ○ ○ ○
(3.40) (5.3) (3.50) (1.5)
Education 0.00 0.0 1.22 1.0
○ ○ ○ ○ ○ ○ ○ ○ ○ ○ ○ ○ ○ ○ ○ ○ ○ ○ ○ ○ ○ ○ ○ ○ ○ ○ ○ ○ ○ ○
(0.00) (0.0) (0.80) (0.7)
Social 0.00 0.0 0.00 0.0
○ ○ ○ ○ ○ ○ ○ ○ ○ ○ ○ ○ ○ ○ ○ ○ ○ ○ ○ ○ ○ ○ ○ ○ ○ ○ ○ ○ ○ ○
Development (0.00) (0.0) (0.00) (0.0)
Electrification 27.17 23.0 8.48 11.0
○ ○ ○ ○ ○ ○ ○ ○ ○ ○ ○ ○ ○ ○ ○ ○ ○ ○ ○ ○ ○ ○ ○ ○ ○ ○ ○ ○ ○ ○
(16.20) (17.5) (5.70) (8.3)
Health 13.02 3.0 0.00 0.0
(7.80) (2.3) (0.00) (0.0)
TOTAL 167.64 132.0 148.73 131.0
(100.00) (100.0) (100.00) (100.0)
Source: Calculated from the information provided by the MP
S. Ramamuni Reddy
Figures in the parentheses indicate the percentage of total

31
� State: Karnataka
Constituency: Rajya Sabha
Member: M. V Rajasekharan
� The pattern of expenditure incurred by Rajya
Sabha member M. V. Rajasekharan provides
analogous findings.
� Out of the total expenditure (Rs. 46.05 lakh) on
completed works, around 26 per cent (Rs. 12.05
lakh) have been spent on construction and around
25 per cent (Rs. 11.5 lakh) have been spent on
roads and bridges.
� However, it is significant that a substantial
proportion of around 22 per cent (Rs. 10 lakh) of
the total expenditure on completed works have also
been on 2 projects for social development.
� During 2002-03, around 70 per cent works
remained incomplete. We see from Table -13 that,
in terms of money, 56 percent of the total funds
spent on incomplete works was on construction,
the balance on water supply and education. In
terms of number of works, out of 25 incomplete
works, 36 percent (9 works) were on educational
projects and around 33 per cent (8 works) were
on water supply.
� State: Madhya Pradesh
Constituency: Indore
Member: Sumitra Mahajan
� In Indore Lok Sabha constituency, the trend continues with around 47 per cent of the total money spent
on completed works on roads and bridges during 2001-02. However, under incomplete works for the same
year education topped the list with around 45.2 per cent of the total expenditure.
Table - 15
Patterns in the Expenditure by Rajya Sabha
Member M. V. Rajasekharan During 2002-2003
Year � Completed Works Incomplete Works
Amount in No of Amount in No of
Rs. lakh Works Rs. lakh Works
Construction 12.05 3 77.0 8
○ ○ ○ ○ ○ ○ ○ ○ ○ ○ ○ ○ ○ ○ ○ ○ ○ ○ ○ ○ ○ ○ ○ ○ ○ ○ ○ ○ ○ ○
(26.00) (25) (56.0) (33)
Roads & 11.50 4 0.0 0
○ ○ ○ ○ ○ ○ ○ ○ ○ ○ ○ ○ ○ ○ ○ ○ ○ ○ ○ ○ ○ ○ ○ ○ ○ ○ ○ ○ ○ ○
Bridges (25.00) (33) (0.0) (0)
Water Supply 2.50 1 37.4 8
○ ○ ○ ○ ○ ○ ○ ○ ○ ○ ○ ○ ○ ○ ○ ○ ○ ○ ○ ○ ○ ○ ○ ○ ○ ○ ○ ○ ○ ○
(5.50) (8) (27.0) (33)
Sanitation 0.00 0 0.0 0
○ ○ ○ ○ ○ ○ ○ ○ ○ ○ ○ ○ ○ ○ ○ ○ ○ ○ ○ ○ ○ ○ ○ ○ ○ ○ ○ ○ ○ ○
(0.00) (0) (0.0) (0)
Education 2.00 1 23.0 9
○ ○ ○ ○ ○ ○ ○ ○ ○ ○ ○ ○ ○ ○ ○ ○ ○ ○ ○ ○ ○ ○ ○ ○ ○ ○ ○ ○ ○ ○
(4.50) (8) (17.0) (36)
Social 10.00 2 0.0 0
○ ○ ○ ○ ○ ○ ○ ○ ○ ○ ○ ○ ○ ○ ○ ○ ○ ○ ○ ○ ○ ○ ○ ○ ○ ○ ○ ○ ○ ○
Development (22.00) (17) (0.0) (0)
Electrification 0.00 0 0.0 0
○ ○ ○ ○ ○ ○ ○ ○ ○ ○ ○ ○ ○ ○ ○ ○ ○ ○ ○ ○ ○ ○ ○ ○ ○ ○ ○ ○ ○ ○
(0.00) (0) (0.0) (0)
Health 8.00 1 0.0 0
(17.00) (8) (0.0) (0)
TOTAL 46.05 12 137.4 25
(100.00) (100) (100.0) (100)
Source: Calculated from the information provided by the MP M. V.
Rajasekharan
Figures in the parentheses indicate the percentage of total
Table - 16
Patterns in the Expenditure in Indore Lok Sabha Constituency During 2002-2003
Year? 2001-02 2002-03
Completed Works Incomplete Works Completed Works Incomplete Works
Amount in No of Amount in No of Amount in No of Amount in No of
Rs. lakh Works Rs. lakh Works Rs. lakh Works Rs. lakh Works
○ ○ ○ ○ ○ ○ ○ ○ ○ ○ ○ ○ ○ ○ ○ ○ ○ ○ ○ ○ ○ ○ ○ ○ ○ ○ ○ ○ ○ ○ ○ ○ ○ ○ ○ ○ ○ ○ ○ ○ ○ ○ ○ ○ ○ ○ ○ ○ ○ ○ ○ ○ ○ ○ ○ ○ ○ ○ ○ ○ ○
Construction 50.05 (28.89) 22 (26.0) 1.70 (7.69) 1 (16) 36.01 (46.0) 12.0 (31.5) 50.50 (45.5) 17 (50.0)
○ ○ ○ ○ ○ ○ ○ ○ ○ ○ ○ ○ ○ ○ ○ ○ ○ ○ ○ ○ ○ ○ ○ ○ ○ ○ ○ ○ ○ ○ ○ ○ ○ ○ ○ ○ ○ ○ ○ ○ ○ ○ ○ ○ ○ ○ ○ ○ ○ ○ ○ ○ ○ ○ ○ ○ ○ ○ ○ ○ ○
Roads & Bridges 81.66 (47.20) 26 (31.0) 0.00 (0.00) 0 (0) 30.77 (39.2) 9.0 (23.7) 28.00 (25.2) 10 (29.4)
○ ○ ○ ○ ○ ○ ○ ○ ○ ○ ○ ○ ○ ○ ○ ○ ○ ○ ○ ○ ○ ○ ○ ○ ○ ○ ○ ○ ○ ○ ○ ○ ○ ○ ○ ○ ○ ○ ○ ○ ○ ○ ○ ○ ○ ○ ○ ○ ○ ○ ○ ○ ○ ○ ○ ○ ○ ○ ○ ○ ○
Water Supply 22.37 (12.90) 25 (29.8) 0.00 (0.00) 0 (0) 11.71 (15.0) 17.0 (44.7) 19.50 (17.6) 4 (11.8)
○ ○ ○ ○ ○ ○ ○ ○ ○ ○ ○ ○ ○ ○ ○ ○ ○ ○ ○ ○ ○ ○ ○ ○ ○ ○ ○ ○ ○ ○ ○ ○ ○ ○ ○ ○ ○ ○ ○ ○ ○ ○ ○ ○ ○ ○ ○ ○ ○ ○ ○ ○ ○ ○ ○ ○ ○ ○ ○ ○ ○
Sanitation 3.50 (2.00) 2 (2.3) 5.42 (24.50) 2 (32) 0.00 (0.0) 0.0 (0.0) 1.00 (0.9) 1 (2.9)
○ ○ ○ ○ ○ ○ ○ ○ ○ ○ ○ ○ ○ ○ ○ ○ ○ ○ ○ ○ ○ ○ ○ ○ ○ ○ ○ ○ ○ ○ ○ ○ ○ ○ ○ ○ ○ ○ ○ ○ ○ ○ ○ ○ ○ ○ ○ ○ ○ ○ ○ ○ ○ ○ ○ ○ ○ ○ ○ ○ ○
Education 12.42 (7.17) 2 (2.3) 10.00 (45.20) 2 (32) 0.00 (0.0) 0.0 (0.0) 12.00 (10.8) 2 (5.8)
○ ○ ○ ○ ○ ○ ○ ○ ○ ○ ○ ○ ○ ○ ○ ○ ○ ○ ○ ○ ○ ○ ○ ○ ○ ○ ○ ○ ○ ○ ○ ○ ○ ○ ○ ○ ○ ○ ○ ○ ○ ○ ○ ○ ○ ○ ○ ○ ○ ○ ○ ○ ○ ○ ○ ○ ○ ○ ○ ○ ○
Social Development 0.00 (0.00) 0 (0.0) 5.00 (22.60) 1 (16) 0.00 (0.0) 0.0 (0.0) 0.00 (0.0) 0 (0.0)
○ ○ ○ ○ ○ ○ ○ ○ ○ ○ ○ ○ ○ ○ ○ ○ ○ ○ ○ ○ ○ ○ ○ ○ ○ ○ ○ ○ ○ ○ ○ ○ ○ ○ ○ ○ ○ ○ ○ ○ ○ ○ ○ ○ ○ ○ ○ ○ ○ ○ ○ ○ ○ ○ ○ ○ ○ ○ ○ ○ ○
Electrification 3.22 (1.80) 7 (8.3) 0.00 (0.00) 0 (0) 0.00 (0.0) 0.0 (0.0) 0.00 (0.0) 0 (0.0)
Health 0.00 (0.00) 0 (0.0) 0.00 (0.00) 0 (0) 0.00 (0.0) 0.0 (0.0) 0.00 (0.0) 0 (0.0)
TOTAL 173.20 (100.00) 84 (100.0) 22.12 (100.00) 6 (100) 78.49 (100.0) 38.0 (100.0) 111.00 (100.0) 34 (100.0)
Source: Calculated from the information provided by the MP (Indore)
Figures in the parentheses indicate the percentage of total

32
� As the MP who is a Union Government Minister as well, the member had taken interest in a number of
projects related to water supply, sanitation, education and electrification, in 2001-02, which should provide
substantial facilities for the concerned sections of the society.
� The pattern changed during 2002-03. The same old story got repeated again with around 85 per cent of
the total expenditure incurred on construction and roads and bridges projects under completed works
category and around 71 per cent of expenditure incurred under incomplete works category. However, the
performance in 2001-02 was better than 2002-03 as far as giving priority to different sectors is concerned
(see Table -16).
� State: Gujarat
Constituency: Amreli (Gujarat)
Member: Dileep Sanghani
� In Amreli Lok Sabha constituency, out of total 44
works completed in 2001-02, around 32 per cent
was done in construction work and the same
amount of works was done, interestingly, for
creating water supply assets. (See Table-17)
� In spite of being a Lok Sabha constituency, roads
and bridges constituted an insignificant proportion
of total works undertaken which accounted for 6.8
per cent of total works in 2002-03.
� An interesting point to note here is that during
both the years, water supply projects topped the
list as far as number of works are concerned. There
has been substantial expenditure on health during
2002-03, and almost all crucial sectors like water
supply, education and electrification were also
covered under MPLADS.
� On the basis of the amount of money spent on
different projects, year 2002-03 may be considered
as a year with better fund utilisation record, if
public asset and amenities created for the poor
and the marginalised are taken into account. In
2002-03, while on one hand, proportion of money
spent on projects for construction and roads and bridges have substantially declined, on the other hand
there have been a remarkable increase in the expenditure on other sectors especially water supply, health
and education.
� State: Tamil Nadu
Constituency: Vellore
Member: N. T. Shanmugam
� Among all the sample constituencies, Vellore witnessed a record amount of expenditure as well as a works
under MPLADS (See Table -18).
� However, the pattern of spending shows a bias towards projects for roads and bridges as out of total 206
works completed under MPLADS during 2001-02, 152 were for roads and bridges only, which accounted
for around 74 per cent of the total works completed and around 65 per cent of the total money spent
under MPLADS in this constituency.
Table - 17
Patterns of Expenditure in Amreli
During 2001-2003
Year � 2001-02 2002-3
Amount in No of Amount in No of
Rs. lakh Works Rs. lakh Works
Construction 29.44 14 4.14 5
○ ○ ○ ○ ○ ○ ○ ○ ○ ○ ○ ○ ○ ○ ○ ○ ○ ○ ○ ○ ○ ○ ○ ○ ○ ○ ○ ○ ○ ○
(32.26) (31.8) (8.66) (25)
Roads & 6.18 3 1.86 1
○ ○ ○ ○ ○ ○ ○ ○ ○ ○ ○ ○ ○ ○ ○ ○ ○ ○ ○ ○ ○ ○ ○ ○ ○ ○ ○ ○ ○ ○
Bridges (6.66) (6.8) (3.9) (5)
Water Supply 15.56 14 17.92 9
○ ○ ○ ○ ○ ○ ○ ○ ○ ○ ○ ○ ○ ○ ○ ○ ○ ○ ○ ○ ○ ○ ○ ○ ○ ○ ○ ○ ○ ○
(16.8) (31.8) (37.48) (45)
Sanitation 1.96 2 0 0
○ ○ ○ ○ ○ ○ ○ ○ ○ ○ ○ ○ ○ ○ ○ ○ ○ ○ ○ ○ ○ ○ ○ ○ ○ ○ ○ ○ ○ ○
(2.11) (4.5) (0) (0)
Education 21.56 7 6.29 1
○ ○ ○ ○ ○ ○ ○ ○ ○ ○ ○ ○ ○ ○ ○ ○ ○ ○ ○ ○ ○ ○ ○ ○ ○ ○ ○ ○ ○ ○
(23.23) (16) (13.17) (5)
Social 10.3 2 0 0
○ ○ ○ ○ ○ ○ ○ ○ ○ ○ ○ ○ ○ ○ ○ ○ ○ ○ ○ ○ ○ ○ ○ ○ ○ ○ ○ ○ ○ ○
Development (11.1) (4.5) (0) (0)
Electrification 7.31 2 0.03 2
○ ○ ○ ○ ○ ○ ○ ○ ○ ○ ○ ○ ○ ○ ○ ○ ○ ○ ○ ○ ○ ○ ○ ○ ○ ○ ○ ○ ○ ○
(7.87) (4.5) (0.05) (10)
Health 0 0 17.57 2
(0) (0) (36.7) (10)
TOTAL 92.8 44 47.8 20
(100) (100) (100) (100)
Source: Calculated from the information provided by the MP (Amreli)
Figures in the parentheses indicate the percentage of total
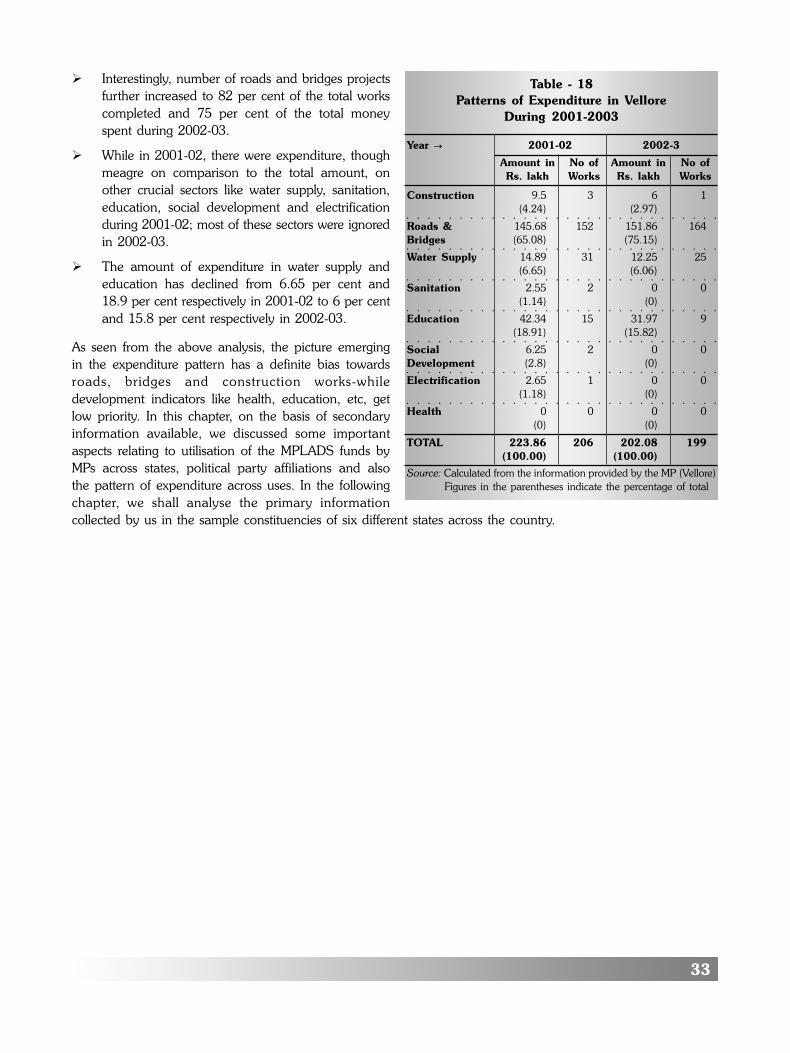
33
� Interestingly, number of roads and bridges projects
further increased to 82 per cent of the total works
completed and 75 per cent of the total money
spent during 2002-03.
� While in 2001-02, there were expenditure, though
meagre on comparison to the total amount, on
other crucial sectors like water supply, sanitation,
education, social development and electrification
during 2001-02; most of these sectors were ignored
in 2002-03.
� The amount of expenditure in water supply and
education has declined from 6.65 per cent and
18.9 per cent respectively in 2001-02 to 6 per cent
and 15.8 per cent respectively in 2002-03.
As seen from the above analysis, the picture emerging
in the expenditure pattern has a definite bias towards
roads, bridges and construction works-while
development indicators like health, education, etc, get
low priority. In this chapter, on the basis of secondary
information available, we discussed some important
aspects relating to utilisation of the MPLADS funds by
MPs across states, political party affiliations and also
the pattern of expenditure across uses. In the following
chapter, we shall analyse the primary information
collected by us in the sample constituencies of six different states across the country.
Table - 18
Patterns of Expenditure in Vellore
During 2001-2003
Year � 2001-02 2002-3
Amount in No of Amount in No of
Rs. lakh Works Rs. lakh Works
Construction 9.5 3 6 1
○ ○ ○ ○ ○ ○ ○ ○ ○ ○ ○ ○ ○ ○ ○ ○ ○ ○ ○ ○ ○ ○ ○ ○ ○ ○ ○ ○ ○ ○
(4.24) (2.97)
Roads & 145.68 152 151.86 164
○ ○ ○ ○ ○ ○ ○ ○ ○ ○ ○ ○ ○ ○ ○ ○ ○ ○ ○ ○ ○ ○ ○ ○ ○ ○ ○ ○ ○ ○
Bridges (65.08) (75.15)
Water Supply 14.89 31 12.25 25
○ ○ ○ ○ ○ ○ ○ ○ ○ ○ ○ ○ ○ ○ ○ ○ ○ ○ ○ ○ ○ ○ ○ ○ ○ ○ ○ ○ ○ ○
(6.65) (6.06)
Sanitation 2.55 2 0 0
○ ○ ○ ○ ○ ○ ○ ○ ○ ○ ○ ○ ○ ○ ○ ○ ○ ○ ○ ○ ○ ○ ○ ○ ○ ○ ○ ○ ○ ○
(1.14) (0)
Education 42.34 15 31.97 9
○ ○ ○ ○ ○ ○ ○ ○ ○ ○ ○ ○ ○ ○ ○ ○ ○ ○ ○ ○ ○ ○ ○ ○ ○ ○ ○ ○ ○ ○
(18.91) (15.82)
Social 6.25 2 0 0
○ ○ ○ ○ ○ ○ ○ ○ ○ ○ ○ ○ ○ ○ ○ ○ ○ ○ ○ ○ ○ ○ ○ ○ ○ ○ ○ ○ ○ ○
Development (2.8) (0)
Electrification 2.65 1 0 0
○ ○ ○ ○ ○ ○ ○ ○ ○ ○ ○ ○ ○ ○ ○ ○ ○ ○ ○ ○ ○ ○ ○ ○ ○ ○ ○ ○ ○ ○
(1.18) (0)
Health 0 0 0 0
(0) (0)
TOTAL 223.86 206 202.08 199
(100.00) (100.00)
Source: Calculated from the information provided by the MP (Vellore)
Figures in the parentheses indicate the percentage of total

34
(A) State wise Release of Funds/Expenditure of Members of Parliament as on 30/01/2004
No. Name of Released by Amount % Sanctioned Expenditure % UtilisationState/UT G.O.I. Sanctioned Over Released Incurred Over Released
○ ○ ○ ○ ○ ○ ○ ○ ○ ○ ○ ○ ○ ○ ○ ○ ○ ○ ○ ○ ○ ○ ○ ○ ○ ○ ○ ○ ○ ○ ○ ○ ○ ○ ○ ○ ○ ○ ○ ○ ○ ○ ○ ○ ○ ○ ○ ○ ○ ○ ○ ○ ○ ○ ○ ○ ○ ○ ○ ○ ○
1 Nominated 158.00 148.33 93.88 120.39 76.19
○ ○ ○ ○ ○ ○ ○ ○ ○ ○ ○ ○ ○ ○ ○ ○ ○ ○ ○ ○ ○ ○ ○ ○ ○ ○ ○ ○ ○ ○ ○ ○ ○ ○ ○ ○ ○ ○ ○ ○ ○ ○ ○ ○ ○ ○ ○ ○ ○ ○ ○ ○ ○ ○ ○ ○ ○ ○ ○ ○ ○
2 Andhra Pradesh 945.95 929.52 98.26 776.12 82.05
○ ○ ○ ○ ○ ○ ○ ○ ○ ○ ○ ○ ○ ○ ○ ○ ○ ○ ○ ○ ○ ○ ○ ○ ○ ○ ○ ○ ○ ○ ○ ○ ○ ○ ○ ○ ○ ○ ○ ○ ○ ○ ○ ○ ○ ○ ○ ○ ○ ○ ○ ○ ○ ○ ○ ○ ○ ○ ○ ○ ○
3 Arunachal Pr. 48.15 48.42 100.56 45.79 95.09
○ ○ ○ ○ ○ ○ ○ ○ ○ ○ ○ ○ ○ ○ ○ ○ ○ ○ ○ ○ ○ ○ ○ ○ ○ ○ ○ ○ ○ ○ ○ ○ ○ ○ ○ ○ ○ ○ ○ ○ ○ ○ ○ ○ ○ ○ ○ ○ ○ ○ ○ ○ ○ ○ ○ ○ ○ ○ ○ ○ ○
4 Assam 330.55 310.95 94.07 279.66 84.60
○ ○ ○ ○ ○ ○ ○ ○ ○ ○ ○ ○ ○ ○ ○ ○ ○ ○ ○ ○ ○ ○ ○ ○ ○ ○ ○ ○ ○ ○ ○ ○ ○ ○ ○ ○ ○ ○ ○ ○ ○ ○ ○ ○ ○ ○ ○ ○ ○ ○ ○ ○ ○ ○ ○ ○ ○ ○ ○ ○ ○
5 Bihar 877.85 840.71 95.77 704.41 80.24
○ ○ ○ ○ ○ ○ ○ ○ ○ ○ ○ ○ ○ ○ ○ ○ ○ ○ ○ ○ ○ ○ ○ ○ ○ ○ ○ ○ ○ ○ ○ ○ ○ ○ ○ ○ ○ ○ ○ ○ ○ ○ ○ ○ ○ ○ ○ ○ ○ ○ ○ ○ ○ ○ ○ ○ ○ ○ ○ ○ ○
6 Goa 44.15 42.77 96.87 32.57 73.78
○ ○ ○ ○ ○ ○ ○ ○ ○ ○ ○ ○ ○ ○ ○ ○ ○ ○ ○ ○ ○ ○ ○ ○ ○ ○ ○ ○ ○ ○ ○ ○ ○ ○ ○ ○ ○ ○ ○ ○ ○ ○ ○ ○ ○ ○ ○ ○ ○ ○ ○ ○ ○ ○ ○ ○ ○ ○ ○ ○ ○
7 Gujarat 566.35 535.40 94.54 436.23 77.03
○ ○ ○ ○ ○ ○ ○ ○ ○ ○ ○ ○ ○ ○ ○ ○ ○ ○ ○ ○ ○ ○ ○ ○ ○ ○ ○ ○ ○ ○ ○ ○ ○ ○ ○ ○ ○ ○ ○ ○ ○ ○ ○ ○ ○ ○ ○ ○ ○ ○ ○ ○ ○ ○ ○ ○ ○ ○ ○ ○ ○
8 Haryana 235.25 225.43 95.82 208.32 88.55
○ ○ ○ ○ ○ ○ ○ ○ ○ ○ ○ ○ ○ ○ ○ ○ ○ ○ ○ ○ ○ ○ ○ ○ ○ ○ ○ ○ ○ ○ ○ ○ ○ ○ ○ ○ ○ ○ ○ ○ ○ ○ ○ ○ ○ ○ ○ ○ ○ ○ ○ ○ ○ ○ ○ ○ ○ ○ ○ ○ ○
9 Himachal Pr. 104.35 97.98 93.90 91.46 87.65
○ ○ ○ ○ ○ ○ ○ ○ ○ ○ ○ ○ ○ ○ ○ ○ ○ ○ ○ ○ ○ ○ ○ ○ ○ ○ ○ ○ ○ ○ ○ ○ ○ ○ ○ ○ ○ ○ ○ ○ ○ ○ ○ ○ ○ ○ ○ ○ ○ ○ ○ ○ ○ ○ ○ ○ ○ ○ ○ ○ ○
10 J & K 127.50 122.72 96.25 86.53 67.87
○ ○ ○ ○ ○ ○ ○ ○ ○ ○ ○ ○ ○ ○ ○ ○ ○ ○ ○ ○ ○ ○ ○ ○ ○ ○ ○ ○ ○ ○ ○ ○ ○ ○ ○ ○ ○ ○ ○ ○ ○ ○ ○ ○ ○ ○ ○ ○ ○ ○ ○ ○ ○ ○ ○ ○ ○ ○ ○ ○ ○
11 Karnataka 623.00 607.94 97.58 549.07 88.13
○ ○ ○ ○ ○ ○ ○ ○ ○ ○ ○ ○ ○ ○ ○ ○ ○ ○ ○ ○ ○ ○ ○ ○ ○ ○ ○ ○ ○ ○ ○ ○ ○ ○ ○ ○ ○ ○ ○ ○ ○ ○ ○ ○ ○ ○ ○ ○ ○ ○ ○ ○ ○ ○ ○ ○ ○ ○ ○ ○ ○
12 Kerala 451.95 438.39 97.00 325.23 71.96
○ ○ ○ ○ ○ ○ ○ ○ ○ ○ ○ ○ ○ ○ ○ ○ ○ ○ ○ ○ ○ ○ ○ ○ ○ ○ ○ ○ ○ ○ ○ ○ ○ ○ ○ ○ ○ ○ ○ ○ ○ ○ ○ ○ ○ ○ ○ ○ ○ ○ ○ ○ ○ ○ ○ ○ ○ ○ ○ ○ ○
13 Madhya Pradesh 639.60 621.84 97.22 548.94 85.83
○ ○ ○ ○ ○ ○ ○ ○ ○ ○ ○ ○ ○ ○ ○ ○ ○ ○ ○ ○ ○ ○ ○ ○ ○ ○ ○ ○ ○ ○ ○ ○ ○ ○ ○ ○ ○ ○ ○ ○ ○ ○ ○ ○ ○ ○ ○ ○ ○ ○ ○ ○ ○ ○ ○ ○ ○ ○ ○ ○ ○
14 Maharashtra 1021.75 1010.50 98.90 803.49 78.64
○ ○ ○ ○ ○ ○ ○ ○ ○ ○ ○ ○ ○ ○ ○ ○ ○ ○ ○ ○ ○ ○ ○ ○ ○ ○ ○ ○ ○ ○ ○ ○ ○ ○ ○ ○ ○ ○ ○ ○ ○ ○ ○ ○ ○ ○ ○ ○ ○ ○ ○ ○ ○ ○ ○ ○ ○ ○ ○ ○ ○
15 Manipur 48.15 48.46 100.65 44.49 92.39
○ ○ ○ ○ ○ ○ ○ ○ ○ ○ ○ ○ ○ ○ ○ ○ ○ ○ ○ ○ ○ ○ ○ ○ ○ ○ ○ ○ ○ ○ ○ ○ ○ ○ ○ ○ ○ ○ ○ ○ ○ ○ ○ ○ ○ ○ ○ ○ ○ ○ ○ ○ ○ ○ ○ ○ ○ ○ ○ ○ ○
16 Meghalaya 46.15 42.05 91.11 40.76 88.32
○ ○ ○ ○ ○ ○ ○ ○ ○ ○ ○ ○ ○ ○ ○ ○ ○ ○ ○ ○ ○ ○ ○ ○ ○ ○ ○ ○ ○ ○ ○ ○ ○ ○ ○ ○ ○ ○ ○ ○ ○ ○ ○ ○ ○ ○ ○ ○ ○ ○ ○ ○ ○ ○ ○ ○ ○ ○ ○ ○ ○
17 Mizoram 32.10 31.15 97.03 31.15 97.03
○ ○ ○ ○ ○ ○ ○ ○ ○ ○ ○ ○ ○ ○ ○ ○ ○ ○ ○ ○ ○ ○ ○ ○ ○ ○ ○ ○ ○ ○ ○ ○ ○ ○ ○ ○ ○ ○ ○ ○ ○ ○ ○ ○ ○ ○ ○ ○ ○ ○ ○ ○ ○ ○ ○ ○ ○ ○ ○ ○ ○
18 Nagaland 32.10 29.65 92.37 29.65 92.37
○ ○ ○ ○ ○ ○ ○ ○ ○ ○ ○ ○ ○ ○ ○ ○ ○ ○ ○ ○ ○ ○ ○ ○ ○ ○ ○ ○ ○ ○ ○ ○ ○ ○ ○ ○ ○ ○ ○ ○ ○ ○ ○ ○ ○ ○ ○ ○ ○ ○ ○ ○ ○ ○ ○ ○ ○ ○ ○ ○ ○
19 Orissa 481.00 451.35 93.84 338.81 70.44
○ ○ ○ ○ ○ ○ ○ ○ ○ ○ ○ ○ ○ ○ ○ ○ ○ ○ ○ ○ ○ ○ ○ ○ ○ ○ ○ ○ ○ ○ ○ ○ ○ ○ ○ ○ ○ ○ ○ ○ ○ ○ ○ ○ ○ ○ ○ ○ ○ ○ ○ ○ ○ ○ ○ ○ ○ ○ ○ ○ ○
20 Punjab 301.05 291.99 96.99 232.12 77.10
○ ○ ○ ○ ○ ○ ○ ○ ○ ○ ○ ○ ○ ○ ○ ○ ○ ○ ○ ○ ○ ○ ○ ○ ○ ○ ○ ○ ○ ○ ○ ○ ○ ○ ○ ○ ○ ○ ○ ○ ○ ○ ○ ○ ○ ○ ○ ○ ○ ○ ○ ○ ○ ○ ○ ○ ○ ○ ○ ○ ○
21 Rajasthan 550.25 539.35 98.02 476.70 86.63
○ ○ ○ ○ ○ ○ ○ ○ ○ ○ ○ ○ ○ ○ ○ ○ ○ ○ ○ ○ ○ ○ ○ ○ ○ ○ ○ ○ ○ ○ ○ ○ ○ ○ ○ ○ ○ ○ ○ ○ ○ ○ ○ ○ ○ ○ ○ ○ ○ ○ ○ ○ ○ ○ ○ ○ ○ ○ ○ ○ ○
22 Sikkim 31.10 30.29 97.40 26.88 86.44
○ ○ ○ ○ ○ ○ ○ ○ ○ ○ ○ ○ ○ ○ ○ ○ ○ ○ ○ ○ ○ ○ ○ ○ ○ ○ ○ ○ ○ ○ ○ ○ ○ ○ ○ ○ ○ ○ ○ ○ ○ ○ ○ ○ ○ ○ ○ ○ ○ ○ ○ ○ ○ ○ ○ ○ ○ ○ ○ ○ ○
23 Tamil Nadu 895.35 890.37 99.44 828.05 92.48
○ ○ ○ ○ ○ ○ ○ ○ ○ ○ ○ ○ ○ ○ ○ ○ ○ ○ ○ ○ ○ ○ ○ ○ ○ ○ ○ ○ ○ ○ ○ ○ ○ ○ ○ ○ ○ ○ ○ ○ ○ ○ ○ ○ ○ ○ ○ ○ ○ ○ ○ ○ ○ ○ ○ ○ ○ ○ ○ ○ ○
24 Tripura 47.15 45.14 95.73 35.80 75.92
○ ○ ○ ○ ○ ○ ○ ○ ○ ○ ○ ○ ○ ○ ○ ○ ○ ○ ○ ○ ○ ○ ○ ○ ○ ○ ○ ○ ○ ○ ○ ○ ○ ○ ○ ○ ○ ○ ○ ○ ○ ○ ○ ○ ○ ○ ○ ○ ○ ○ ○ ○ ○ ○ ○ ○ ○ ○ ○ ○ ○
25 Uttar Pradesh 1752.70 1666.94 95.11 1461.61 83.39
○ ○ ○ ○ ○ ○ ○ ○ ○ ○ ○ ○ ○ ○ ○ ○ ○ ○ ○ ○ ○ ○ ○ ○ ○ ○ ○ ○ ○ ○ ○ ○ ○ ○ ○ ○ ○ ○ ○ ○ ○ ○ ○ ○ ○ ○ ○ ○ ○ ○ ○ ○ ○ ○ ○ ○ ○ ○ ○ ○ ○
26 West Bengal 838.85 800.29 95.40 591.01 70.45
○ ○ ○ ○ ○ ○ ○ ○ ○ ○ ○ ○ ○ ○ ○ ○ ○ ○ ○ ○ ○ ○ ○ ○ ○ ○ ○ ○ ○ ○ ○ ○ ○ ○ ○ ○ ○ ○ ○ ○ ○ ○ ○ ○ ○ ○ ○ ○ ○ ○ ○ ○ ○ ○ ○ ○ ○ ○ ○ ○ ○
27 A & N Islands 15.05 15.52 103.13 15.52 103.13
○ ○ ○ ○ ○ ○ ○ ○ ○ ○ ○ ○ ○ ○ ○ ○ ○ ○ ○ ○ ○ ○ ○ ○ ○ ○ ○ ○ ○ ○ ○ ○ ○ ○ ○ ○ ○ ○ ○ ○ ○ ○ ○ ○ ○ ○ ○ ○ ○ ○ ○ ○ ○ ○ ○ ○ ○ ○ ○ ○ ○
28 Chandigarh 14.05 13.35 95.04 13.35 95.04
○ ○ ○ ○ ○ ○ ○ ○ ○ ○ ○ ○ ○ ○ ○ ○ ○ ○ ○ ○ ○ ○ ○ ○ ○ ○ ○ ○ ○ ○ ○ ○ ○ ○ ○ ○ ○ ○ ○ ○ ○ ○ ○ ○ ○ ○ ○ ○ ○ ○ ○ ○ ○ ○ ○ ○ ○ ○ ○ ○ ○
29 D & N Haveli 16.05 16.56 103.18 14.95 93.12
○ ○ ○ ○ ○ ○ ○ ○ ○ ○ ○ ○ ○ ○ ○ ○ ○ ○ ○ ○ ○ ○ ○ ○ ○ ○ ○ ○ ○ ○ ○ ○ ○ ○ ○ ○ ○ ○ ○ ○ ○ ○ ○ ○ ○ ○ ○ ○ ○ ○ ○ ○ ○ ○ ○ ○ ○ ○ ○ ○ ○
30 Daman & Diu 16.05 14.90 92.87 14.90 92.87
○ ○ ○ ○ ○ ○ ○ ○ ○ ○ ○ ○ ○ ○ ○ ○ ○ ○ ○ ○ ○ ○ ○ ○ ○ ○ ○ ○ ○ ○ ○ ○ ○ ○ ○ ○ ○ ○ ○ ○ ○ ○ ○ ○ ○ ○ ○ ○ ○ ○ ○ ○ ○ ○ ○ ○ ○ ○ ○ ○ ○
31 Delhi 137.95 134.41 97.43 109.66 79.49
○ ○ ○ ○ ○ ○ ○ ○ ○ ○ ○ ○ ○ ○ ○ ○ ○ ○ ○ ○ ○ ○ ○ ○ ○ ○ ○ ○ ○ ○ ○ ○ ○ ○ ○ ○ ○ ○ ○ ○ ○ ○ ○ ○ ○ ○ ○ ○ ○ ○ ○ ○ ○ ○ ○ ○ ○ ○ ○ ○ ○
32 Lakshdweep 14.05 13.42 95.51 8.78 62.48
○ ○ ○ ○ ○ ○ ○ ○ ○ ○ ○ ○ ○ ○ ○ ○ ○ ○ ○ ○ ○ ○ ○ ○ ○ ○ ○ ○ ○ ○ ○ ○ ○ ○ ○ ○ ○ ○ ○ ○ ○ ○ ○ ○ ○ ○ ○ ○ ○ ○ ○ ○ ○ ○ ○ ○ ○ ○ ○ ○ ○
33 Pondicherry 31.10 31.98 102.84 24.65 79.25
○ ○ ○ ○ ○ ○ ○ ○ ○ ○ ○ ○ ○ ○ ○ ○ ○ ○ ○ ○ ○ ○ ○ ○ ○ ○ ○ ○ ○ ○ ○ ○ ○ ○ ○ ○ ○ ○ ○ ○ ○ ○ ○ ○ ○ ○ ○ ○ ○ ○ ○ ○ ○ ○ ○ ○ ○ ○ ○ ○ ○
34 Chhattisgarh 234.65 224.59 95.71 198.44 84.57
○ ○ ○ ○ ○ ○ ○ ○ ○ ○ ○ ○ ○ ○ ○ ○ ○ ○ ○ ○ ○ ○ ○ ○ ○ ○ ○ ○ ○ ○ ○ ○ ○ ○ ○ ○ ○ ○ ○ ○ ○ ○ ○ ○ ○ ○ ○ ○ ○ ○ ○ ○ ○ ○ ○ ○ ○ ○ ○ ○ ○
35 Uttaranchal 107.25 98.87 92.18 82.25 76.69
36 Jharkhand 260.75 240.26 92.14 190.40 73.02
GRAND TOTAL 12077.30 11651.78 96.48 9818.12 81.29
Source: Ministry of Statistics and Programme Implementation
3.3 Level of Utilisation of MPLADS Funds till 31-12-2003

35
(B) State wise Release of Funds/Expenditure of Rajya Sabha Members of Parliament as on 31/12/2003
No. Name of Released by Amount % Sanctioned Expenditure % Utilisation
State/UT G.O.I. Sanctioned Over Released Incurred Over Released
○ ○ ○ ○ ○ ○ ○ ○ ○ ○ ○ ○ ○ ○ ○ ○ ○ ○ ○ ○ ○ ○ ○ ○ ○ ○ ○ ○ ○ ○ ○ ○ ○ ○ ○ ○ ○ ○ ○ ○ ○ ○ ○ ○ ○ ○ ○ ○ ○ ○ ○ ○ ○ ○ ○ ○ ○ ○ ○ ○ ○
1 Nominated 125.50 119.40 95.14 93.68 74.64
○ ○ ○ ○ ○ ○ ○ ○ ○ ○ ○ ○ ○ ○ ○ ○ ○ ○ ○ ○ ○ ○ ○ ○ ○ ○ ○ ○ ○ ○ ○ ○ ○ ○ ○ ○ ○ ○ ○ ○ ○ ○ ○ ○ ○ ○ ○ ○ ○ ○ ○ ○ ○ ○ ○ ○ ○ ○ ○ ○ ○
2 Andhra Pradesh 282.40 268.60 95.11 219.26 77.64
○ ○ ○ ○ ○ ○ ○ ○ ○ ○ ○ ○ ○ ○ ○ ○ ○ ○ ○ ○ ○ ○ ○ ○ ○ ○ ○ ○ ○ ○ ○ ○ ○ ○ ○ ○ ○ ○ ○ ○ ○ ○ ○ ○ ○ ○ ○ ○ ○ ○ ○ ○ ○ ○ ○ ○ ○ ○ ○ ○ ○
3 Arunachal Pr. 16.05 16.13 100.47 15.90 99.07
○ ○ ○ ○ ○ ○ ○ ○ ○ ○ ○ ○ ○ ○ ○ ○ ○ ○ ○ ○ ○ ○ ○ ○ ○ ○ ○ ○ ○ ○ ○ ○ ○ ○ ○ ○ ○ ○ ○ ○ ○ ○ ○ ○ ○ ○ ○ ○ ○ ○ ○ ○ ○ ○ ○ ○ ○ ○ ○ ○ ○
4 Assam 109.85 98.87 90.00 88.80 80.84
○ ○ ○ ○ ○ ○ ○ ○ ○ ○ ○ ○ ○ ○ ○ ○ ○ ○ ○ ○ ○ ○ ○ ○ ○ ○ ○ ○ ○ ○ ○ ○ ○ ○ ○ ○ ○ ○ ○ ○ ○ ○ ○ ○ ○ ○ ○ ○ ○ ○ ○ ○ ○ ○ ○ ○ ○ ○ ○ ○ ○
5 Bihar 250.95 376.00 149.83 179.68 71.60
○ ○ ○ ○ ○ ○ ○ ○ ○ ○ ○ ○ ○ ○ ○ ○ ○ ○ ○ ○ ○ ○ ○ ○ ○ ○ ○ ○ ○ ○ ○ ○ ○ ○ ○ ○ ○ ○ ○ ○ ○ ○ ○ ○ ○ ○ ○ ○ ○ ○ ○ ○ ○ ○ ○ ○ ○ ○ ○ ○ ○
6 Goa 12.05 10.95 90.90 7.64 63.42
○ ○ ○ ○ ○ ○ ○ ○ ○ ○ ○ ○ ○ ○ ○ ○ ○ ○ ○ ○ ○ ○ ○ ○ ○ ○ ○ ○ ○ ○ ○ ○ ○ ○ ○ ○ ○ ○ ○ ○ ○ ○ ○ ○ ○ ○ ○ ○ ○ ○ ○ ○ ○ ○ ○ ○ ○ ○ ○ ○ ○
7 Gujarat 161.05 144.53 89.74 109.36 67.90
○ ○ ○ ○ ○ ○ ○ ○ ○ ○ ○ ○ ○ ○ ○ ○ ○ ○ ○ ○ ○ ○ ○ ○ ○ ○ ○ ○ ○ ○ ○ ○ ○ ○ ○ ○ ○ ○ ○ ○ ○ ○ ○ ○ ○ ○ ○ ○ ○ ○ ○ ○ ○ ○ ○ ○ ○ ○ ○ ○ ○
8 Haryana 76.75 72.55 94.53 65.60 85.48
○ ○ ○ ○ ○ ○ ○ ○ ○ ○ ○ ○ ○ ○ ○ ○ ○ ○ ○ ○ ○ ○ ○ ○ ○ ○ ○ ○ ○ ○ ○ ○ ○ ○ ○ ○ ○ ○ ○ ○ ○ ○ ○ ○ ○ ○ ○ ○ ○ ○ ○ ○ ○ ○ ○ ○ ○ ○ ○ ○ ○
9 Himachal Pr. 45.15 40.02 88.63 33.54 74.29
○ ○ ○ ○ ○ ○ ○ ○ ○ ○ ○ ○ ○ ○ ○ ○ ○ ○ ○ ○ ○ ○ ○ ○ ○ ○ ○ ○ ○ ○ ○ ○ ○ ○ ○ ○ ○ ○ ○ ○ ○ ○ ○ ○ ○ ○ ○ ○ ○ ○ ○ ○ ○ ○ ○ ○ ○ ○ ○ ○ ○
10 J & K 44.50 40.72 91.49 27.28 61.31
○ ○ ○ ○ ○ ○ ○ ○ ○ ○ ○ ○ ○ ○ ○ ○ ○ ○ ○ ○ ○ ○ ○ ○ ○ ○ ○ ○ ○ ○ ○ ○ ○ ○ ○ ○ ○ ○ ○ ○ ○ ○ ○ ○ ○ ○ ○ ○ ○ ○ ○ ○ ○ ○ ○ ○ ○ ○ ○ ○ ○
11 Karnataka 181.60 171.42 94.39 158.25 87.14
○ ○ ○ ○ ○ ○ ○ ○ ○ ○ ○ ○ ○ ○ ○ ○ ○ ○ ○ ○ ○ ○ ○ ○ ○ ○ ○ ○ ○ ○ ○ ○ ○ ○ ○ ○ ○ ○ ○ ○ ○ ○ ○ ○ ○ ○ ○ ○ ○ ○ ○ ○ ○ ○ ○ ○ ○ ○ ○ ○ ○
12 Kerala 132.95 120.02 90.27 79.13 59.52
○ ○ ○ ○ ○ ○ ○ ○ ○ ○ ○ ○ ○ ○ ○ ○ ○ ○ ○ ○ ○ ○ ○ ○ ○ ○ ○ ○ ○ ○ ○ ○ ○ ○ ○ ○ ○ ○ ○ ○ ○ ○ ○ ○ ○ ○ ○ ○ ○ ○ ○ ○ ○ ○ ○ ○ ○ ○ ○ ○ ○
13 Madhya Pradesh 181.20 169.90 93.77 146.24 80.70
○ ○ ○ ○ ○ ○ ○ ○ ○ ○ ○ ○ ○ ○ ○ ○ ○ ○ ○ ○ ○ ○ ○ ○ ○ ○ ○ ○ ○ ○ ○ ○ ○ ○ ○ ○ ○ ○ ○ ○ ○ ○ ○ ○ ○ ○ ○ ○ ○ ○ ○ ○ ○ ○ ○ ○ ○ ○ ○ ○ ○
14 Maharashtra 265.45 246.05 92.69 184.81 69.62
○ ○ ○ ○ ○ ○ ○ ○ ○ ○ ○ ○ ○ ○ ○ ○ ○ ○ ○ ○ ○ ○ ○ ○ ○ ○ ○ ○ ○ ○ ○ ○ ○ ○ ○ ○ ○ ○ ○ ○ ○ ○ ○ ○ ○ ○ ○ ○ ○ ○ ○ ○ ○ ○ ○ ○ ○ ○ ○ ○ ○
15 Manipur 16.05 14.81 92.30 14.25 88.77
○ ○ ○ ○ ○ ○ ○ ○ ○ ○ ○ ○ ○ ○ ○ ○ ○ ○ ○ ○ ○ ○ ○ ○ ○ ○ ○ ○ ○ ○ ○ ○ ○ ○ ○ ○ ○ ○ ○ ○ ○ ○ ○ ○ ○ ○ ○ ○ ○ ○ ○ ○ ○ ○ ○ ○ ○ ○ ○ ○ ○
16 Meghalaya 15.05 13.39 88.98 13.39 88.98
○ ○ ○ ○ ○ ○ ○ ○ ○ ○ ○ ○ ○ ○ ○ ○ ○ ○ ○ ○ ○ ○ ○ ○ ○ ○ ○ ○ ○ ○ ○ ○ ○ ○ ○ ○ ○ ○ ○ ○ ○ ○ ○ ○ ○ ○ ○ ○ ○ ○ ○ ○ ○ ○ ○ ○ ○ ○ ○ ○ ○
17 Mizoram 16.05 15.06 93.83 15.06 93.83
○ ○ ○ ○ ○ ○ ○ ○ ○ ○ ○ ○ ○ ○ ○ ○ ○ ○ ○ ○ ○ ○ ○ ○ ○ ○ ○ ○ ○ ○ ○ ○ ○ ○ ○ ○ ○ ○ ○ ○ ○ ○ ○ ○ ○ ○ ○ ○ ○ ○ ○ ○ ○ ○ ○ ○ ○ ○ ○ ○ ○
18 Nagaland 16.05 15.05 93.77 15.05 93.77
○ ○ ○ ○ ○ ○ ○ ○ ○ ○ ○ ○ ○ ○ ○ ○ ○ ○ ○ ○ ○ ○ ○ ○ ○ ○ ○ ○ ○ ○ ○ ○ ○ ○ ○ ○ ○ ○ ○ ○ ○ ○ ○ ○ ○ ○ ○ ○ ○ ○ ○ ○ ○ ○ ○ ○ ○ ○ ○ ○ ○
19 Orissa 150.00 135.71 90.48 87.38 58.25
○ ○ ○ ○ ○ ○ ○ ○ ○ ○ ○ ○ ○ ○ ○ ○ ○ ○ ○ ○ ○ ○ ○ ○ ○ ○ ○ ○ ○ ○ ○ ○ ○ ○ ○ ○ ○ ○ ○ ○ ○ ○ ○ ○ ○ ○ ○ ○ ○ ○ ○ ○ ○ ○ ○ ○ ○ ○ ○ ○ ○
20 Punjab 105.40 98.60 93.55 79.47 75.40
○ ○ ○ ○ ○ ○ ○ ○ ○ ○ ○ ○ ○ ○ ○ ○ ○ ○ ○ ○ ○ ○ ○ ○ ○ ○ ○ ○ ○ ○ ○ ○ ○ ○ ○ ○ ○ ○ ○ ○ ○ ○ ○ ○ ○ ○ ○ ○ ○ ○ ○ ○ ○ ○ ○ ○ ○ ○ ○ ○ ○
21 Rajasthan 149.00 144.54 97.00 120.29 80.73
○ ○ ○ ○ ○ ○ ○ ○ ○ ○ ○ ○ ○ ○ ○ ○ ○ ○ ○ ○ ○ ○ ○ ○ ○ ○ ○ ○ ○ ○ ○ ○ ○ ○ ○ ○ ○ ○ ○ ○ ○ ○ ○ ○ ○ ○ ○ ○ ○ ○ ○ ○ ○ ○ ○ ○ ○ ○ ○ ○ ○
22 Sikkim 15.05 13.96 92.78 11.82 78.52
○ ○ ○ ○ ○ ○ ○ ○ ○ ○ ○ ○ ○ ○ ○ ○ ○ ○ ○ ○ ○ ○ ○ ○ ○ ○ ○ ○ ○ ○ ○ ○ ○ ○ ○ ○ ○ ○ ○ ○ ○ ○ ○ ○ ○ ○ ○ ○ ○ ○ ○ ○ ○ ○ ○ ○ ○ ○ ○ ○ ○
23 Tamil Nadu 283.40 281.05 99.17 264.26 93.25
○ ○ ○ ○ ○ ○ ○ ○ ○ ○ ○ ○ ○ ○ ○ ○ ○ ○ ○ ○ ○ ○ ○ ○ ○ ○ ○ ○ ○ ○ ○ ○ ○ ○ ○ ○ ○ ○ ○ ○ ○ ○ ○ ○ ○ ○ ○ ○ ○ ○ ○ ○ ○ ○ ○ ○ ○ ○ ○ ○ ○
24 Tripura 15.05 14.05 93.34 11.59 76.99
○ ○ ○ ○ ○ ○ ○ ○ ○ ○ ○ ○ ○ ○ ○ ○ ○ ○ ○ ○ ○ ○ ○ ○ ○ ○ ○ ○ ○ ○ ○ ○ ○ ○ ○ ○ ○ ○ ○ ○ ○ ○ ○ ○ ○ ○ ○ ○ ○ ○ ○ ○ ○ ○ ○ ○ ○ ○ ○ ○ ○
25 Uttar Pradesh 479.20 449.49 93.80 379.14 79.12
○ ○ ○ ○ ○ ○ ○ ○ ○ ○ ○ ○ ○ ○ ○ ○ ○ ○ ○ ○ ○ ○ ○ ○ ○ ○ ○ ○ ○ ○ ○ ○ ○ ○ ○ ○ ○ ○ ○ ○ ○ ○ ○ ○ ○ ○ ○ ○ ○ ○ ○ ○ ○ ○ ○ ○ ○ ○ ○ ○ ○
26 West Bengal 218.80 200.12 91.46 158.89 72.62
○ ○ ○ ○ ○ ○ ○ ○ ○ ○ ○ ○ ○ ○ ○ ○ ○ ○ ○ ○ ○ ○ ○ ○ ○ ○ ○ ○ ○ ○ ○ ○ ○ ○ ○ ○ ○ ○ ○ ○ ○ ○ ○ ○ ○ ○ ○ ○ ○ ○ ○ ○ ○ ○ ○ ○ ○ ○ ○ ○ ○
27 Delhi 39.65 36.26 91.46 28.11 70.90
○ ○ ○ ○ ○ ○ ○ ○ ○ ○ ○ ○ ○ ○ ○ ○ ○ ○ ○ ○ ○ ○ ○ ○ ○ ○ ○ ○ ○ ○ ○ ○ ○ ○ ○ ○ ○ ○ ○ ○ ○ ○ ○ ○ ○ ○ ○ ○ ○ ○ ○ ○ ○ ○ ○ ○ ○ ○ ○ ○ ○
28 Pondicherry 16.05 16.18 100.83 12.71 79.21
○ ○ ○ ○ ○ ○ ○ ○ ○ ○ ○ ○ ○ ○ ○ ○ ○ ○ ○ ○ ○ ○ ○ ○ ○ ○ ○ ○ ○ ○ ○ ○ ○ ○ ○ ○ ○ ○ ○ ○ ○ ○ ○ ○ ○ ○ ○ ○ ○ ○ ○ ○ ○ ○ ○ ○ ○ ○ ○ ○ ○
29 Chhattisgarh 62.10 59.00 95.01 51.88 83.55
○ ○ ○ ○ ○ ○ ○ ○ ○ ○ ○ ○ ○ ○ ○ ○ ○ ○ ○ ○ ○ ○ ○ ○ ○ ○ ○ ○ ○ ○ ○ ○ ○ ○ ○ ○ ○ ○ ○ ○ ○ ○ ○ ○ ○ ○ ○ ○ ○ ○ ○ ○ ○ ○ ○ ○ ○ ○ ○ ○ ○
30 Uttaranchal 28.00 24.24 86.58 14.14 50.49
31 Jharkhand 47.05 39.95 84.90 27.92 59.35
GRAND TOTAL 3557.40 3466.61 97.45 2714.54 76.31
Source: Ministry of Statistics and Programme Implementation

36
(C) State wise Release of Funds/Expenditure of Lok Sabha Members of Parliament as on 31/12/2003
No. Name of Released by Amount % Sanctioned Expenditure % Utilisation
State/UT G.O.I. Sanctioned Over Released Incurred Over Released
○ ○ ○ ○ ○ ○ ○ ○ ○ ○ ○ ○ ○ ○ ○ ○ ○ ○ ○ ○ ○ ○ ○ ○ ○ ○ ○ ○ ○ ○ ○ ○ ○ ○ ○ ○ ○ ○ ○ ○ ○ ○ ○ ○ ○ ○ ○ ○ ○ ○ ○ ○ ○ ○ ○ ○ ○ ○ ○ ○ ○
1 Nominated 29.50 27.97 94.80 25.40 86.10
○ ○ ○ ○ ○ ○ ○ ○ ○ ○ ○ ○ ○ ○ ○ ○ ○ ○ ○ ○ ○ ○ ○ ○ ○ ○ ○ ○ ○ ○ ○ ○ ○ ○ ○ ○ ○ ○ ○ ○ ○ ○ ○ ○ ○ ○ ○ ○ ○ ○ ○ ○ ○ ○ ○ ○ ○ ○ ○ ○ ○
2 Andhra Pradesh 659.55 648.74 98.36 550.89 83.52
○ ○ ○ ○ ○ ○ ○ ○ ○ ○ ○ ○ ○ ○ ○ ○ ○ ○ ○ ○ ○ ○ ○ ○ ○ ○ ○ ○ ○ ○ ○ ○ ○ ○ ○ ○ ○ ○ ○ ○ ○ ○ ○ ○ ○ ○ ○ ○ ○ ○ ○ ○ ○ ○ ○ ○ ○ ○ ○ ○ ○
3 Arunachal Pr. 32.10 31.38 97.75 28.51 88.81
○ ○ ○ ○ ○ ○ ○ ○ ○ ○ ○ ○ ○ ○ ○ ○ ○ ○ ○ ○ ○ ○ ○ ○ ○ ○ ○ ○ ○ ○ ○ ○ ○ ○ ○ ○ ○ ○ ○ ○ ○ ○ ○ ○ ○ ○ ○ ○ ○ ○ ○ ○ ○ ○ ○ ○ ○ ○ ○ ○ ○
4 Assam 217.70 209.11 96.05 188.26 86.48
○ ○ ○ ○ ○ ○ ○ ○ ○ ○ ○ ○ ○ ○ ○ ○ ○ ○ ○ ○ ○ ○ ○ ○ ○ ○ ○ ○ ○ ○ ○ ○ ○ ○ ○ ○ ○ ○ ○ ○ ○ ○ ○ ○ ○ ○ ○ ○ ○ ○ ○ ○ ○ ○ ○ ○ ○ ○ ○ ○ ○
5 Bihar 616.90 590.24 95.68 512.53 83.08
○ ○ ○ ○ ○ ○ ○ ○ ○ ○ ○ ○ ○ ○ ○ ○ ○ ○ ○ ○ ○ ○ ○ ○ ○ ○ ○ ○ ○ ○ ○ ○ ○ ○ ○ ○ ○ ○ ○ ○ ○ ○ ○ ○ ○ ○ ○ ○ ○ ○ ○ ○ ○ ○ ○ ○ ○ ○ ○ ○ ○
6 Goa 31.10 31.24 100.45 24.61 79.12
○ ○ ○ ○ ○ ○ ○ ○ ○ ○ ○ ○ ○ ○ ○ ○ ○ ○ ○ ○ ○ ○ ○ ○ ○ ○ ○ ○ ○ ○ ○ ○ ○ ○ ○ ○ ○ ○ ○ ○ ○ ○ ○ ○ ○ ○ ○ ○ ○ ○ ○ ○ ○ ○ ○ ○ ○ ○ ○ ○ ○
7 Gujarat 400.30 384.45 96.04 322.20 80.49
○ ○ ○ ○ ○ ○ ○ ○ ○ ○ ○ ○ ○ ○ ○ ○ ○ ○ ○ ○ ○ ○ ○ ○ ○ ○ ○ ○ ○ ○ ○ ○ ○ ○ ○ ○ ○ ○ ○ ○ ○ ○ ○ ○ ○ ○ ○ ○ ○ ○ ○ ○ ○ ○ ○ ○ ○ ○ ○ ○ ○
8 Haryana 156.50 149.01 95.22 141.11 90.16
○ ○ ○ ○ ○ ○ ○ ○ ○ ○ ○ ○ ○ ○ ○ ○ ○ ○ ○ ○ ○ ○ ○ ○ ○ ○ ○ ○ ○ ○ ○ ○ ○ ○ ○ ○ ○ ○ ○ ○ ○ ○ ○ ○ ○ ○ ○ ○ ○ ○ ○ ○ ○ ○ ○ ○ ○ ○ ○ ○ ○
9 Himachal Pr. 58.20 53.51 91.94 53.47 91.87
○ ○ ○ ○ ○ ○ ○ ○ ○ ○ ○ ○ ○ ○ ○ ○ ○ ○ ○ ○ ○ ○ ○ ○ ○ ○ ○ ○ ○ ○ ○ ○ ○ ○ ○ ○ ○ ○ ○ ○ ○ ○ ○ ○ ○ ○ ○ ○ ○ ○ ○ ○ ○ ○ ○ ○ ○ ○ ○ ○ ○
10 J & K 80.00 75.83 94.79 53.80 67.25
○ ○ ○ ○ ○ ○ ○ ○ ○ ○ ○ ○ ○ ○ ○ ○ ○ ○ ○ ○ ○ ○ ○ ○ ○ ○ ○ ○ ○ ○ ○ ○ ○ ○ ○ ○ ○ ○ ○ ○ ○ ○ ○ ○ ○ ○ ○ ○ ○ ○ ○ ○ ○ ○ ○ ○ ○ ○ ○ ○ ○
11 Karnataka 438.40 430.52 98.20 386.01 88.05
○ ○ ○ ○ ○ ○ ○ ○ ○ ○ ○ ○ ○ ○ ○ ○ ○ ○ ○ ○ ○ ○ ○ ○ ○ ○ ○ ○ ○ ○ ○ ○ ○ ○ ○ ○ ○ ○ ○ ○ ○ ○ ○ ○ ○ ○ ○ ○ ○ ○ ○ ○ ○ ○ ○ ○ ○ ○ ○ ○ ○
12 Kerala 315.00 311.99 99.05 242.68 77.04
○ ○ ○ ○ ○ ○ ○ ○ ○ ○ ○ ○ ○ ○ ○ ○ ○ ○ ○ ○ ○ ○ ○ ○ ○ ○ ○ ○ ○ ○ ○ ○ ○ ○ ○ ○ ○ ○ ○ ○ ○ ○ ○ ○ ○ ○ ○ ○ ○ ○ ○ ○ ○ ○ ○ ○ ○ ○ ○ ○ ○
13 Madhya Pradesh 456.40 447.07 97.96 395.17 86.58
○ ○ ○ ○ ○ ○ ○ ○ ○ ○ ○ ○ ○ ○ ○ ○ ○ ○ ○ ○ ○ ○ ○ ○ ○ ○ ○ ○ ○ ○ ○ ○ ○ ○ ○ ○ ○ ○ ○ ○ ○ ○ ○ ○ ○ ○ ○ ○ ○ ○ ○ ○ ○ ○ ○ ○ ○ ○ ○ ○ ○
14 Maharashtra 753.30 746.29 99.07 596.12 79.13
○ ○ ○ ○ ○ ○ ○ ○ ○ ○ ○ ○ ○ ○ ○ ○ ○ ○ ○ ○ ○ ○ ○ ○ ○ ○ ○ ○ ○ ○ ○ ○ ○ ○ ○ ○ ○ ○ ○ ○ ○ ○ ○ ○ ○ ○ ○ ○ ○ ○ ○ ○ ○ ○ ○ ○ ○ ○ ○ ○ ○
15 Manipur 32.10 30.33 94.47 25.33 78.90
○ ○ ○ ○ ○ ○ ○ ○ ○ ○ ○ ○ ○ ○ ○ ○ ○ ○ ○ ○ ○ ○ ○ ○ ○ ○ ○ ○ ○ ○ ○ ○ ○ ○ ○ ○ ○ ○ ○ ○ ○ ○ ○ ○ ○ ○ ○ ○ ○ ○ ○ ○ ○ ○ ○ ○ ○ ○ ○ ○ ○
16 Meghalaya 30.10 28.01 93.04 26.72 88.77
○ ○ ○ ○ ○ ○ ○ ○ ○ ○ ○ ○ ○ ○ ○ ○ ○ ○ ○ ○ ○ ○ ○ ○ ○ ○ ○ ○ ○ ○ ○ ○ ○ ○ ○ ○ ○ ○ ○ ○ ○ ○ ○ ○ ○ ○ ○ ○ ○ ○ ○ ○ ○ ○ ○ ○ ○ ○ ○ ○ ○
17 Mizoram 16.05 15.47 96.39 15.47 96.39
○ ○ ○ ○ ○ ○ ○ ○ ○ ○ ○ ○ ○ ○ ○ ○ ○ ○ ○ ○ ○ ○ ○ ○ ○ ○ ○ ○ ○ ○ ○ ○ ○ ○ ○ ○ ○ ○ ○ ○ ○ ○ ○ ○ ○ ○ ○ ○ ○ ○ ○ ○ ○ ○ ○ ○ ○ ○ ○ ○ ○
18 Nagaland 15.05 13.05 86.71 13.05 86.71
○ ○ ○ ○ ○ ○ ○ ○ ○ ○ ○ ○ ○ ○ ○ ○ ○ ○ ○ ○ ○ ○ ○ ○ ○ ○ ○ ○ ○ ○ ○ ○ ○ ○ ○ ○ ○ ○ ○ ○ ○ ○ ○ ○ ○ ○ ○ ○ ○ ○ ○ ○ ○ ○ ○ ○ ○ ○ ○ ○ ○
19 Orissa 325.00 306.20 94.22 244.66 75.28
○ ○ ○ ○ ○ ○ ○ ○ ○ ○ ○ ○ ○ ○ ○ ○ ○ ○ ○ ○ ○ ○ ○ ○ ○ ○ ○ ○ ○ ○ ○ ○ ○ ○ ○ ○ ○ ○ ○ ○ ○ ○ ○ ○ ○ ○ ○ ○ ○ ○ ○ ○ ○ ○ ○ ○ ○ ○ ○ ○ ○
20 Punjab 187.65 178.22 94.98 144.45 76.98
○ ○ ○ ○ ○ ○ ○ ○ ○ ○ ○ ○ ○ ○ ○ ○ ○ ○ ○ ○ ○ ○ ○ ○ ○ ○ ○ ○ ○ ○ ○ ○ ○ ○ ○ ○ ○ ○ ○ ○ ○ ○ ○ ○ ○ ○ ○ ○ ○ ○ ○ ○ ○ ○ ○ ○ ○ ○ ○ ○ ○
21 Rajasthan 398.25 393.05 98.69 350.49 88.01
○ ○ ○ ○ ○ ○ ○ ○ ○ ○ ○ ○ ○ ○ ○ ○ ○ ○ ○ ○ ○ ○ ○ ○ ○ ○ ○ ○ ○ ○ ○ ○ ○ ○ ○ ○ ○ ○ ○ ○ ○ ○ ○ ○ ○ ○ ○ ○ ○ ○ ○ ○ ○ ○ ○ ○ ○ ○ ○ ○ ○
22 Sikkim 16.05 16.33 101.72 15.07 93.87
○ ○ ○ ○ ○ ○ ○ ○ ○ ○ ○ ○ ○ ○ ○ ○ ○ ○ ○ ○ ○ ○ ○ ○ ○ ○ ○ ○ ○ ○ ○ ○ ○ ○ ○ ○ ○ ○ ○ ○ ○ ○ ○ ○ ○ ○ ○ ○ ○ ○ ○ ○ ○ ○ ○ ○ ○ ○ ○ ○ ○
23 Tamil Nadu 607.95 595.45 97.94 552.91 90.95
○ ○ ○ ○ ○ ○ ○ ○ ○ ○ ○ ○ ○ ○ ○ ○ ○ ○ ○ ○ ○ ○ ○ ○ ○ ○ ○ ○ ○ ○ ○ ○ ○ ○ ○ ○ ○ ○ ○ ○ ○ ○ ○ ○ ○ ○ ○ ○ ○ ○ ○ ○ ○ ○ ○ ○ ○ ○ ○ ○ ○
24 Tripura 32.10 31.09 96.84 24.21 75.41
○ ○ ○ ○ ○ ○ ○ ○ ○ ○ ○ ○ ○ ○ ○ ○ ○ ○ ○ ○ ○ ○ ○ ○ ○ ○ ○ ○ ○ ○ ○ ○ ○ ○ ○ ○ ○ ○ ○ ○ ○ ○ ○ ○ ○ ○ ○ ○ ○ ○ ○ ○ ○ ○ ○ ○ ○ ○ ○ ○ ○
25 Uttar Pradesh 1264.50 1201.24 95.00 1064.32 84.17
○ ○ ○ ○ ○ ○ ○ ○ ○ ○ ○ ○ ○ ○ ○ ○ ○ ○ ○ ○ ○ ○ ○ ○ ○ ○ ○ ○ ○ ○ ○ ○ ○ ○ ○ ○ ○ ○ ○ ○ ○ ○ ○ ○ ○ ○ ○ ○ ○ ○ ○ ○ ○ ○ ○ ○ ○ ○ ○ ○ ○
26 West Bengal 612.05 585.22 95.62 417.28 68.18
○ ○ ○ ○ ○ ○ ○ ○ ○ ○ ○ ○ ○ ○ ○ ○ ○ ○ ○ ○ ○ ○ ○ ○ ○ ○ ○ ○ ○ ○ ○ ○ ○ ○ ○ ○ ○ ○ ○ ○ ○ ○ ○ ○ ○ ○ ○ ○ ○ ○ ○ ○ ○ ○ ○ ○ ○ ○ ○ ○ ○
27 A & N Islands 14.05 13.39 95.29 13.49 96.00
○ ○ ○ ○ ○ ○ ○ ○ ○ ○ ○ ○ ○ ○ ○ ○ ○ ○ ○ ○ ○ ○ ○ ○ ○ ○ ○ ○ ○ ○ ○ ○ ○ ○ ○ ○ ○ ○ ○ ○ ○ ○ ○ ○ ○ ○ ○ ○ ○ ○ ○ ○ ○ ○ ○ ○ ○ ○ ○ ○ ○
28 Chandigarh 14.05 13.35 95.04 13.35 95.04
○ ○ ○ ○ ○ ○ ○ ○ ○ ○ ○ ○ ○ ○ ○ ○ ○ ○ ○ ○ ○ ○ ○ ○ ○ ○ ○ ○ ○ ○ ○ ○ ○ ○ ○ ○ ○ ○ ○ ○ ○ ○ ○ ○ ○ ○ ○ ○ ○ ○ ○ ○ ○ ○ ○ ○ ○ ○ ○ ○ ○
29 D & N Haveli 16.05 16.56 103.18 14.60 90.98
○ ○ ○ ○ ○ ○ ○ ○ ○ ○ ○ ○ ○ ○ ○ ○ ○ ○ ○ ○ ○ ○ ○ ○ ○ ○ ○ ○ ○ ○ ○ ○ ○ ○ ○ ○ ○ ○ ○ ○ ○ ○ ○ ○ ○ ○ ○ ○ ○ ○ ○ ○ ○ ○ ○ ○ ○ ○ ○ ○ ○
30 Daman & Diu 16.05 14.90 92.87 14.90 92.87
○ ○ ○ ○ ○ ○ ○ ○ ○ ○ ○ ○ ○ ○ ○ ○ ○ ○ ○ ○ ○ ○ ○ ○ ○ ○ ○ ○ ○ ○ ○ ○ ○ ○ ○ ○ ○ ○ ○ ○ ○ ○ ○ ○ ○ ○ ○ ○ ○ ○ ○ ○ ○ ○ ○ ○ ○ ○ ○ ○ ○
31 Delhi 98.30 94.93 96.57 77.10 78.44
○ ○ ○ ○ ○ ○ ○ ○ ○ ○ ○ ○ ○ ○ ○ ○ ○ ○ ○ ○ ○ ○ ○ ○ ○ ○ ○ ○ ○ ○ ○ ○ ○ ○ ○ ○ ○ ○ ○ ○ ○ ○ ○ ○ ○ ○ ○ ○ ○ ○ ○ ○ ○ ○ ○ ○ ○ ○ ○ ○ ○
32 Lakshdweep 14.05 13.42 95.51 8.78 62.48
○ ○ ○ ○ ○ ○ ○ ○ ○ ○ ○ ○ ○ ○ ○ ○ ○ ○ ○ ○ ○ ○ ○ ○ ○ ○ ○ ○ ○ ○ ○ ○ ○ ○ ○ ○ ○ ○ ○ ○ ○ ○ ○ ○ ○ ○ ○ ○ ○ ○ ○ ○ ○ ○ ○ ○ ○ ○ ○ ○ ○
33 Pondicherry 15.05 15.21 101.04 11.93 79.30
○ ○ ○ ○ ○ ○ ○ ○ ○ ○ ○ ○ ○ ○ ○ ○ ○ ○ ○ ○ ○ ○ ○ ○ ○ ○ ○ ○ ○ ○ ○ ○ ○ ○ ○ ○ ○ ○ ○ ○ ○ ○ ○ ○ ○ ○ ○ ○ ○ ○ ○ ○ ○ ○ ○ ○ ○ ○ ○ ○ ○
34 Chhattisgarh 168.55 162.57 96.45 147.46 87.49
○ ○ ○ ○ ○ ○ ○ ○ ○ ○ ○ ○ ○ ○ ○ ○ ○ ○ ○ ○ ○ ○ ○ ○ ○ ○ ○ ○ ○ ○ ○ ○ ○ ○ ○ ○ ○ ○ ○ ○ ○ ○ ○ ○ ○ ○ ○ ○ ○ ○ ○ ○ ○ ○ ○ ○ ○ ○ ○ ○ ○
35 Uttaranchal 78.25 73.88 94.42 68.03 86.94
36 Jharkhand 207.70 193.84 93.33 159.12 76.61
GRAND TOTAL 8423.90 8143.06 96.67 6943.47 82.43
Source: Ministry of Statistics and Programme Implementation

37
The earlier chapters have looked at various aspects of MPLADS on a wide range of concerns. Starting from the
level of utilisation of the fund to the pattern and composition of expenditure, issues have been discussed based
on the secondary information and all available sources. The major findings of our analysis of secondary information
are as follows.
� Electoral considerations play a major role in the pattern of expenditure under the scheme.
� Like many other governmental works, in a large number of projects under the MPLADS the pace of work
is sluggish, and this is despite repeated suggestive instructions from the ministers to speed up the process.
� The members of the parliament of both the houses are not aware of the updated norms and provisions
though the Ministry of Statistics and Programme Implementation have provided them with all the latest
information.
� There has been a consistent pressure on government by the MPs to raise the amount under MPLADS from
Rs. 2 crore per annum to more than Rs. 4 crore per annum, although a large amount of fund remains
unspent with a substantial balance lying idle with the district collectorates.
� The members of parliament of Lok Sabha, from regional parties and particularly from many smaller states,
have better utilised the funds under MPLADS compared to other groups of MPs.
� The scheme’s pattern of expenditure shows that rather than spending on localised development, money
has been spent on projects, which could be get funding from other sources.
� As could be said generally about most of the government projects, the expenditure under the scheme has
been largely concentrated on projects, which inherently involve elements of corruption and misuse.
� Social sectors like health, education and sanitation, which could boost development of future human capital
are ignored during recommendation and implementation of works under the MPLADS. Initiatives in these
areas could improve the living condition of people at local level and in rural areas, and help the marginalised
sections of our society.
� After broadly classifying the secondary information, our next task was to find out the opinion of common
people on the scheme. In order to have a better understanding of the scheme from the perspective of the
common people at the grassroots level, we undertook an exercise to collect primary information from
seven different parliamentary constituencies from six different states across the country. These states include
Rajasthan, Gujarat, Orissa, Uttar Pradesh, Madhya Pradesh and Jharkhand. In the following section we
discuss the database and explain the methodology for collection of such primary information.
4.1 Methodology, Database and Sampling
The collection of the required primary information was through “direct personal interview method” using a set
of structured questionnaires. Copies of the questionnaire are attached in the appendix of this report. We divided
the entire set of respondents into four different categories.
� The common beneficiary for whose benefit the scheme was initiated. This category constituted the largest
proportion of our sample.
� Government officials, at the district and block level, who are responsible for the sanction and administration
of the scheme. The government officials interviewed include Deputy Collectors, Planning Officers, Executive
Engineers and Block Development Officers in different constituencies.
� People related to the implementing agencies like PWD of different districts and NGOs.
People’s Perception
About MPLADS4

38
� Elected representatives like Sarpanchs, Ward Members etc., who in fact do not have any say either in the
sanctions or in the implementation of the projects undertaken. Nevertheless they constitute a pressure
group in the selection of the projects and probably act like watchdogs in monitoring the scheme at the
grassroots level.
Table - 19
Caste and Sexwise Distribution of Sample Respondents
Constituency MALE FEMALE
General SC ST Total General SC ST Total
○ ○ ○ ○ ○ ○ ○ ○ ○ ○ ○ ○ ○ ○ ○ ○ ○ ○ ○ ○ ○ ○ ○ ○ ○ ○ ○ ○ ○ ○ ○ ○ ○ ○ ○ ○ ○ ○ ○ ○ ○ ○ ○ ○ ○ ○ ○ ○ ○ ○ ○ ○ ○ ○ ○ ○ ○ ○ ○ ○ ○
Alwar 11 5 2 18 0 1 1 2
○ ○ ○ ○ ○ ○ ○ ○ ○ ○ ○ ○ ○ ○ ○ ○ ○ ○ ○ ○ ○ ○ ○ ○ ○ ○ ○ ○ ○ ○ ○ ○ ○ ○ ○ ○ ○ ○ ○ ○ ○ ○ ○ ○ ○ ○ ○ ○ ○ ○ ○ ○ ○ ○ ○ ○ ○ ○ ○ ○ ○
Bhopal 7 4 2 13 3 1 3 7
○ ○ ○ ○ ○ ○ ○ ○ ○ ○ ○ ○ ○ ○ ○ ○ ○ ○ ○ ○ ○ ○ ○ ○ ○ ○ ○ ○ ○ ○ ○ ○ ○ ○ ○ ○ ○ ○ ○ ○ ○ ○ ○ ○ ○ ○ ○ ○ ○ ○ ○ ○ ○ ○ ○ ○ ○ ○ ○ ○ ○
Ghazipur 13 1 0 14 3 2 1 6
○ ○ ○ ○ ○ ○ ○ ○ ○ ○ ○ ○ ○ ○ ○ ○ ○ ○ ○ ○ ○ ○ ○ ○ ○ ○ ○ ○ ○ ○ ○ ○ ○ ○ ○ ○ ○ ○ ○ ○ ○ ○ ○ ○ ○ ○ ○ ○ ○ ○ ○ ○ ○ ○ ○ ○ ○ ○ ○ ○ ○
Hazaribagh 3 4 2 9 0 0 1 1
○ ○ ○ ○ ○ ○ ○ ○ ○ ○ ○ ○ ○ ○ ○ ○ ○ ○ ○ ○ ○ ○ ○ ○ ○ ○ ○ ○ ○ ○ ○ ○ ○ ○ ○ ○ ○ ○ ○ ○ ○ ○ ○ ○ ○ ○ ○ ○ ○ ○ ○ ○ ○ ○ ○ ○ ○ ○ ○ ○ ○
Jagatsinghpur 7 6 0 13 10 3 0 13
○ ○ ○ ○ ○ ○ ○ ○ ○ ○ ○ ○ ○ ○ ○ ○ ○ ○ ○ ○ ○ ○ ○ ○ ○ ○ ○ ○ ○ ○ ○ ○ ○ ○ ○ ○ ○ ○ ○ ○ ○ ○ ○ ○ ○ ○ ○ ○ ○ ○ ○ ○ ○ ○ ○ ○ ○ ○ ○ ○ ○
Kota 9 4 3 16 5 3 5 13
Patan 8 2 0 10 5 1 0 6
GRAND 58 26 9 93 26 11 11 48
TOTAL (62.4) (27.9) (9.7) (100) (54.2) (22.9) (22.9) (100)
Table-19 provides the distribution of our sample beneficiaries under different categories, according to two different
sexes and various social groups.
Gender Distribution: Out of a total 141 sample respondents 93 were male and 48 were female. As far as the
constituencies are concerned, we have collected primary information from 16 beneficiaries in Patan (Gujarat) of
which 6 are female, from 29 beneficiaries in Kota (Rajasthan) of which 13 are female, from 26 beneficiaries in
Jagatsinghpur (Orissa) of which 13 are female, from 10 beneficiaries in Hazaribagh (Jharkhand) of which only 1
was female, from 20 beneficiaries in Ghazipur (Uttar Pradesh) of which 6 were female, from 20 beneficiaries in
Bhopal (Madhya Pradesh) of which 7 were female and from 20 beneficiaries in Alwar (Rajasthan) of which 2
are female.
Caste-wise Distribution: A social group wise classification of our sample beneficiaries show that of the total
93 male respondents, around 28 per cent are from scheduled caste category and around 10 per cent are from
scheduled tribe category. Of the total 48 female respondents around 23 per cent each are from scheduled caste
and scheduled tribe categories.
Since our research project was time bound and the task of primary data collection was very exhaustive, our
own research team did the sample survey in four constituencies viz., Hazaribagh, Jagatsinghpur, Kota and Patan.
We were ably aided by our partner organisations in three other constituencies’ viz., Alwar, Bhopal and Ghazipur.
Based on all information received and collected, the analysis was done by using simple statistical tools. This is
presented in the subsequent sections.
4.2 Analysis of Primary Information
(a) Level of awareness about the scheme
Our analysis shows that around 29 per cent among male respondents and around 31 per cent among
female respondents have never heard about the MP Local Area Development Scheme. Though a majority
of them vaguely knows about the projects undertaken, implemented or completed at the local level by the
influence of the MP of their constituency, they do not know that there is a scheme called Members of

39
Parliament Local Area Development Scheme under which their MP recommends such works. Table -20
shows that the male respondents of Jagatsinghpur and female respondents of Hazaribagh and Ghazipur
are most ignorant about the scheme.
Table - 20
Level of awareness about MPLADS in Sample Constituencies
(In % of Total)
Constituency MALE FEMALE
Awareness about Never Heard About Awareness about Never Heard About
MPLADS MPLADS MPLADS MPLADS
○ ○ ○ ○ ○ ○ ○ ○ ○ ○ ○ ○ ○ ○ ○ ○ ○ ○ ○ ○ ○ ○ ○ ○ ○ ○ ○ ○ ○ ○ ○ ○ ○ ○ ○ ○ ○ ○ ○ ○ ○ ○ ○ ○ ○ ○ ○ ○ ○ ○ ○ ○ ○ ○ ○ ○ ○ ○ ○ ○ ○
Alwar 83.3 16.7 100.0 0.0
○ ○ ○ ○ ○ ○ ○ ○ ○ ○ ○ ○ ○ ○ ○ ○ ○ ○ ○ ○ ○ ○ ○ ○ ○ ○ ○ ○ ○ ○ ○ ○ ○ ○ ○ ○ ○ ○ ○ ○ ○ ○ ○ ○ ○ ○ ○ ○ ○ ○ ○ ○ ○ ○ ○ ○ ○ ○ ○ ○ ○
Bhopal 69.2 30.8 100.0 0.0
○ ○ ○ ○ ○ ○ ○ ○ ○ ○ ○ ○ ○ ○ ○ ○ ○ ○ ○ ○ ○ ○ ○ ○ ○ ○ ○ ○ ○ ○ ○ ○ ○ ○ ○ ○ ○ ○ ○ ○ ○ ○ ○ ○ ○ ○ ○ ○ ○ ○ ○ ○ ○ ○ ○ ○ ○ ○ ○ ○ ○
Ghazipur 71.4 28.6 0.0 100.0
○ ○ ○ ○ ○ ○ ○ ○ ○ ○ ○ ○ ○ ○ ○ ○ ○ ○ ○ ○ ○ ○ ○ ○ ○ ○ ○ ○ ○ ○ ○ ○ ○ ○ ○ ○ ○ ○ ○ ○ ○ ○ ○ ○ ○ ○ ○ ○ ○ ○ ○ ○ ○ ○ ○ ○ ○ ○ ○ ○ ○
Hazaribagh 88.9 11.1 0.0 100.0
○ ○ ○ ○ ○ ○ ○ ○ ○ ○ ○ ○ ○ ○ ○ ○ ○ ○ ○ ○ ○ ○ ○ ○ ○ ○ ○ ○ ○ ○ ○ ○ ○ ○ ○ ○ ○ ○ ○ ○ ○ ○ ○ ○ ○ ○ ○ ○ ○ ○ ○ ○ ○ ○ ○ ○ ○ ○ ○ ○ ○
Jagatsinghpur 53.8 46.2 15.4 84.6
○ ○ ○ ○ ○ ○ ○ ○ ○ ○ ○ ○ ○ ○ ○ ○ ○ ○ ○ ○ ○ ○ ○ ○ ○ ○ ○ ○ ○ ○ ○ ○ ○ ○ ○ ○ ○ ○ ○ ○ ○ ○ ○ ○ ○ ○ ○ ○ ○ ○ ○ ○ ○ ○ ○ ○ ○ ○ ○ ○ ○
Kota 68.8 31.3 61.5 38.5
Patan 60.0 40.0 83.3 16.7
GRAND TOTAL 71.0 29.0 68.8 31.3
� In Patan constituency around 40 per cent of our sample male respondents and around 17 per cent of
the female respondents do not know anything about MPLADS.
� In Kota constituency, around 31 per cent of the male respondents and around 38 per cent of the
female respondents are ignorant about the scheme.
� In Jagatsinghpur constituency, around 46 per cent of the male respondents and 85 per cent of the
female respondents do no know about the scheme.
� The sample size of female respondents was very small in Hazaribagh and Alwar constituency. Therefore,
we take the opinion expressed in these places as statistically irrelevant.
� Among male respondents, Hazaribagh exhibits the highest level of awareness and among female
respondents Bhopal exhibits the same.
(b) Role of Public Expenditure in Asset Creation and employment generation
Information about people’s perception on the role of public expenditure in employment generation and
asset creation reveal interesting findings. Table –21 shows the figures in percentage regarding such perception.
� As far as employment generation is concerned, around 35 per cent of the entire sample respondents
revealed that public expenditure have significant role in employment generation whereas around 36
per cent told that it has a marginal impact only.
� In Alwar constituency around 80 per cent of the respondents revealed that public expenditure definitely
has a role in employment generation.
� Perhaps the most satisfied lot of respondents are from Ghazipur constituency where 95 percent
subscribed that public expenditure has at least some impact on employment generation.
� The respondents from Bhopal and Hazaribagh constituencies are the most dissatisfied lot as far as
employment generation is concerned. They believe that there is insignificant relationship between
public expenditure and creation of employment opportunities.
� As far as creation of social overhead capital (assets) is concerned, around 42 per cent of the entire
sample respondents take a view that there is a significant role of public expenditure and around 48

40
per cent viewed marginal role of public expenditure. Only 11 per cent of the entire sample did not
recognise the role of public expenditure in creation of assets.
� Almost all the sample respondents from Alwar and Ghazipur constituency recognised the role of public
expenditure in creation of assets.
� Hazaribagh and Bhopal again are the constituencies where comparatively more number of respondents
was not satisfied with the role of public expenditure in creation of assets.
(c) Major problems faced by people in our sample constituencies
After a general understanding, our next task was to locate the major problems faced by the people in our
sample constituencies. In other words, we set out to list out some of the “locally felt needs” in these
constituencies. The questions are asked regarding this to different sections of our sample in order to have a
better understanding on how the locally felt needs differ for different socio-economic groups of people.
Tables-21 to 27 show how different groups of people in our sample constituencies perceive different problems
though they live in same geographical locations.
ALWAR (Rajasthan)
� In Alwar constituency, health was the most important concern for the male respondents whereas drinking
water was the most important concern for the female respondents. From the table it is clear that the
female respondents have cited only water and health as the problems faced by them and ignored any
other problem. There might be several reasons for such phenomenon. Firstly, it is mostly the women in the
economically deprived sections who are entrusted with collection of drinking water. Since, women spent
most of their working time in collection of drinking water, cooking and other household chores; they could
view those problems only which they encountered in their day-to-day life. Of such problems, collection as
well as management of water for household purposes and health problems being the mot prominent ones,
around 75 percent of the female respondents viewed water as the most pressing need in their respective
localities. Around 25 percent of the female respondents viewed lack of health facilities as the most pressing
problems in their locality.
� Since the male respondents have exposure to a broader set of worlds, they revealed several other problems
like roads, transport facilities, lack of employment opportunities and lack of amenities like availability of
electricity for domestic use as the locally felt needs.
� The major problems faced by the respondents from general category are lack of health facilities and problem
of unemployment whereas, in case of respondents from scheduled castes, the problems are roads, electricity
Table - 21
Peoples’ Perception on Role of Public Expenditure
(In % of Total)
Constituency Role of Public Expenditure Role of Public Expenditure
in Employment Generation in Asset Creation
○ ○ ○ ○ ○ ○ ○ ○ ○ ○ ○ ○ ○ ○ ○ ○ ○ ○ ○ ○ ○ ○ ○ ○ ○ ○ ○ ○ ○ ○ ○ ○ ○ ○ ○ ○ ○ ○ ○ ○ ○ ○ ○ ○ ○ ○ ○ ○ ○ ○ ○ ○ ○ ○ ○ ○ ○ ○ ○ ○ ○
Significant Marginal Insignificant Significant Marginal Insignificant
○ ○ ○ ○ ○ ○ ○ ○ ○ ○ ○ ○ ○ ○ ○ ○ ○ ○ ○ ○ ○ ○ ○ ○ ○ ○ ○ ○ ○ ○ ○ ○ ○ ○ ○ ○ ○ ○ ○ ○ ○ ○ ○ ○ ○ ○ ○ ○ ○ ○ ○ ○ ○ ○ ○ ○ ○ ○ ○ ○ ○
Alwar 50 30 20 65 35 0
○ ○ ○ ○ ○ ○ ○ ○ ○ ○ ○ ○ ○ ○ ○ ○ ○ ○ ○ ○ ○ ○ ○ ○ ○ ○ ○ ○ ○ ○ ○ ○ ○ ○ ○ ○ ○ ○ ○ ○ ○ ○ ○ ○ ○ ○ ○ ○ ○ ○ ○ ○ ○ ○ ○ ○ ○ ○ ○ ○ ○
Bhopal 0 45 55 0 80 20
○ ○ ○ ○ ○ ○ ○ ○ ○ ○ ○ ○ ○ ○ ○ ○ ○ ○ ○ ○ ○ ○ ○ ○ ○ ○ ○ ○ ○ ○ ○ ○ ○ ○ ○ ○ ○ ○ ○ ○ ○ ○ ○ ○ ○ ○ ○ ○ ○ ○ ○ ○ ○ ○ ○ ○ ○ ○ ○ ○ ○
Ghazipur 65 30 5 85 15 0
○ ○ ○ ○ ○ ○ ○ ○ ○ ○ ○ ○ ○ ○ ○ ○ ○ ○ ○ ○ ○ ○ ○ ○ ○ ○ ○ ○ ○ ○ ○ ○ ○ ○ ○ ○ ○ ○ ○ ○ ○ ○ ○ ○ ○ ○ ○ ○ ○ ○ ○ ○ ○ ○ ○ ○ ○ ○ ○ ○ ○
Hazaribagh 0 70 30 0 50 50
○ ○ ○ ○ ○ ○ ○ ○ ○ ○ ○ ○ ○ ○ ○ ○ ○ ○ ○ ○ ○ ○ ○ ○ ○ ○ ○ ○ ○ ○ ○ ○ ○ ○ ○ ○ ○ ○ ○ ○ ○ ○ ○ ○ ○ ○ ○ ○ ○ ○ ○ ○ ○ ○ ○ ○ ○ ○ ○ ○ ○
Jagatsinghpur 38 35 27 42 50 8
○ ○ ○ ○ ○ ○ ○ ○ ○ ○ ○ ○ ○ ○ ○ ○ ○ ○ ○ ○ ○ ○ ○ ○ ○ ○ ○ ○ ○ ○ ○ ○ ○ ○ ○ ○ ○ ○ ○ ○ ○ ○ ○ ○ ○ ○ ○ ○ ○ ○ ○ ○ ○ ○ ○ ○ ○ ○ ○ ○ ○
Kota 45 31 24 48 45 7
Patan 25 31 44 25 63 13
TOTAL 35 36 28 42 48 11

41
and water. In case of respondents from the scheduled tribes, the major problems are water and health
again. (See Table -22)
� It is interesting to note that among scheduled tribes and scheduled castes; unemployment was not cited as
a problem. This itself is a testimony to the fact that even basic needs like provision of water and health
facilities are unresolved in Alwar constituency for people from socially deprived groups.
BHOPAL (Madhya Pradesh)
� The table shows the major problems faced by the respondents from different sections of population in
Bhopal. Here, in reaction to the open ended question, the respondents revealed only four problems namely,
drinking water, drainage, electricity and road.
� Shortage of drinking water seems to be a problem faced by more than half of the respondents in all the
categories. (See Table 23). Around 57 percent of both male and female respondents, around 50 percent of
the respondents from the general and scheduled tribes category and around 75 percent of the respondents
from the scheduled caste category viewed water as the major problem faced by them in Bhopal.
Table - 22
Major Problems faced by the Respondents in Alwar Constituency (Rajasthan)
Problems Male Respondents Female Respondents General Category Scheduled Castes Scheduled Tribes
○ ○ ○ ○ ○ ○ ○ ○ ○ ○ ○ ○ ○ ○ ○ ○ ○ ○ ○ ○ ○ ○ ○ ○ ○ ○ ○ ○ ○ ○ ○ ○ ○ ○ ○ ○ ○ ○ ○ ○ ○ ○ ○ ○ ○ ○ ○ ○ ○ ○ ○ ○ ○ ○ ○ ○ ○ ○ ○ ○ ○
Water 15.9 75.0 4.2 22.7 50.0
○ ○ ○ ○ ○ ○ ○ ○ ○ ○ ○ ○ ○ ○ ○ ○ ○ ○ ○ ○ ○ ○ ○ ○ ○ ○ ○ ○ ○ ○ ○ ○ ○ ○ ○ ○ ○ ○ ○ ○ ○ ○ ○ ○ ○ ○ ○ ○ ○ ○ ○ ○ ○ ○ ○ ○ ○ ○ ○ ○ ○
Electricity 14.6 0.0 14.6 22.7 0.0
○ ○ ○ ○ ○ ○ ○ ○ ○ ○ ○ ○ ○ ○ ○ ○ ○ ○ ○ ○ ○ ○ ○ ○ ○ ○ ○ ○ ○ ○ ○ ○ ○ ○ ○ ○ ○ ○ ○ ○ ○ ○ ○ ○ ○ ○ ○ ○ ○ ○ ○ ○ ○ ○ ○ ○ ○ ○ ○ ○ ○
Road 17.1 0.0 8.3 31.8 25.0
○ ○ ○ ○ ○ ○ ○ ○ ○ ○ ○ ○ ○ ○ ○ ○ ○ ○ ○ ○ ○ ○ ○ ○ ○ ○ ○ ○ ○ ○ ○ ○ ○ ○ ○ ○ ○ ○ ○ ○ ○ ○ ○ ○ ○ ○ ○ ○ ○ ○ ○ ○ ○ ○ ○ ○ ○ ○ ○ ○ ○
Transport 9.8 0.0 10.4 13.6 0.0
○ ○ ○ ○ ○ ○ ○ ○ ○ ○ ○ ○ ○ ○ ○ ○ ○ ○ ○ ○ ○ ○ ○ ○ ○ ○ ○ ○ ○ ○ ○ ○ ○ ○ ○ ○ ○ ○ ○ ○ ○ ○ ○ ○ ○ ○ ○ ○ ○ ○ ○ ○ ○ ○ ○ ○ ○ ○ ○ ○ ○
Health 26.8 25.0 35.4 9.1 25.0
Employment 15.9 0.0 27.1 0.0 0.0
Table - 23
Major Problems faced by the Respondents in Bhopal (Madhya Pradesh)
Problems Male Respondents Female Respondents General Category Scheduled Castes Scheduled Tribes
○ ○ ○ ○ ○ ○ ○ ○ ○ ○ ○ ○ ○ ○ ○ ○ ○ ○ ○ ○ ○ ○ ○ ○ ○ ○ ○ ○ ○ ○ ○ ○ ○ ○ ○ ○ ○ ○ ○ ○ ○ ○ ○ ○ ○ ○ ○ ○ ○ ○ ○ ○ ○ ○ ○ ○ ○ ○ ○ ○ ○
Water 56.8 56.5 50.0 75.0 50.0
○ ○ ○ ○ ○ ○ ○ ○ ○ ○ ○ ○ ○ ○ ○ ○ ○ ○ ○ ○ ○ ○ ○ ○ ○ ○ ○ ○ ○ ○ ○ ○ ○ ○ ○ ○ ○ ○ ○ ○ ○ ○ ○ ○ ○ ○ ○ ○ ○ ○ ○ ○ ○ ○ ○ ○ ○ ○ ○ ○ ○
Drainage 0.0 13.0 0.0 0.0 15.0
○ ○ ○ ○ ○ ○ ○ ○ ○ ○ ○ ○ ○ ○ ○ ○ ○ ○ ○ ○ ○ ○ ○ ○ ○ ○ ○ ○ ○ ○ ○ ○ ○ ○ ○ ○ ○ ○ ○ ○ ○ ○ ○ ○ ○ ○ ○ ○ ○ ○ ○ ○ ○ ○ ○ ○ ○ ○ ○ ○ ○
Electricity 34.1 26.1 37.5 18.8 30.0
Road 9.1 4.3 12.5 6.3 5.0
� A large number of respondents have also viewed electricity as the most pressing problem in the constituency.
Around 34 percent of the male and 26 percent of the female respondents, around 37 percent of the
respondents from the general category, 19 percent from the scheduled castes and 30 percent from the
scheduled tribes category have revealed that electricity is the most urgent locally felt need in their constituency.
� Lack of proper drainage system was viewed as a major problem among 13 percent of the female respondents
(all from the scheduled tribes) in Bhopal.
GHAZIPUR (Uttar Pradesh)
� In Ghazipur constituency, the respondents raised a number of issues having prime importance as being
problems faced by common people. While respondents from scheduled tribe population viewed lack of all
season roads to be a major problem followed by health, the respondents from all other categories have
cited a number of other issues in their constituency.

42
� An interesting finding in Ghazipur is that around 44 percent of the male respondents view unemployment
and poverty as a major problem in their locality.
� For female respondents, availability of all season roads and toilet are the most significant issues.
� For the other groups, unemployment, roads, hospitals and toilet for women have almost equal significance.
HAZARIBAGH (Jharkhand)
� In Hazaribagh, the issues that matter for the male respondents are roads and irrigation facilities. For the
female respondents, the major problems are unemployment and water. It is an interesting observation in a
sense that only in Hazaribagh and Jagatsinghpur constituency, female respondents viewed unemployment
as a problem. This might be because of the fact that women who were traditionally employed in gainful
activities have lost their jobs in recent times and therefore they view unemployment such significantly.
Table - 24
Major Problems faced by Respondents in Ghazipur Constituency (Uttar Pradesh)
Problems Male Female General Scheduled Scheduled
Respondents Respondents Category Castes Tribes
○ ○ ○ ○ ○ ○ ○ ○ ○ ○ ○ ○ ○ ○ ○ ○ ○ ○ ○ ○ ○ ○ ○ ○ ○ ○ ○ ○ ○ ○ ○ ○ ○ ○ ○ ○ ○ ○ ○ ○ ○ ○ ○ ○ ○ ○ ○ ○ ○ ○ ○ ○ ○ ○ ○ ○ ○ ○ ○ ○ ○
All Season Road 6.3 26.3 7.9 18.8 71.4
○ ○ ○ ○ ○ ○ ○ ○ ○ ○ ○ ○ ○ ○ ○ ○ ○ ○ ○ ○ ○ ○ ○ ○ ○ ○ ○ ○ ○ ○ ○ ○ ○ ○ ○ ○ ○ ○ ○ ○ ○ ○ ○ ○ ○ ○ ○ ○ ○ ○ ○ ○ ○ ○ ○ ○ ○ ○ ○ ○ ○
Fertiliser 4.2 5.3 3.2 12.5 0.0
○ ○ ○ ○ ○ ○ ○ ○ ○ ○ ○ ○ ○ ○ ○ ○ ○ ○ ○ ○ ○ ○ ○ ○ ○ ○ ○ ○ ○ ○ ○ ○ ○ ○ ○ ○ ○ ○ ○ ○ ○ ○ ○ ○ ○ ○ ○ ○ ○ ○ ○ ○ ○ ○ ○ ○ ○ ○ ○ ○ ○
Drainage 2.1 15.8 11.1 0.0 0.0
○ ○ ○ ○ ○ ○ ○ ○ ○ ○ ○ ○ ○ ○ ○ ○ ○ ○ ○ ○ ○ ○ ○ ○ ○ ○ ○ ○ ○ ○ ○ ○ ○ ○ ○ ○ ○ ○ ○ ○ ○ ○ ○ ○ ○ ○ ○ ○ ○ ○ ○ ○ ○ ○ ○ ○ ○ ○ ○ ○ ○
Hospital 12.5 15.8 11.1 18.8 28.6
○ ○ ○ ○ ○ ○ ○ ○ ○ ○ ○ ○ ○ ○ ○ ○ ○ ○ ○ ○ ○ ○ ○ ○ ○ ○ ○ ○ ○ ○ ○ ○ ○ ○ ○ ○ ○ ○ ○ ○ ○ ○ ○ ○ ○ ○ ○ ○ ○ ○ ○ ○ ○ ○ ○ ○ ○ ○ ○ ○ ○
Toilet for Women 6.3 23.7 14.3 18.8 0.0
○ ○ ○ ○ ○ ○ ○ ○ ○ ○ ○ ○ ○ ○ ○ ○ ○ ○ ○ ○ ○ ○ ○ ○ ○ ○ ○ ○ ○ ○ ○ ○ ○ ○ ○ ○ ○ ○ ○ ○ ○ ○ ○ ○ ○ ○ ○ ○ ○ ○ ○ ○ ○ ○ ○ ○ ○ ○ ○ ○ ○
Electricity 12.5 0.0 9.5 0.0 0.0
○ ○ ○ ○ ○ ○ ○ ○ ○ ○ ○ ○ ○ ○ ○ ○ ○ ○ ○ ○ ○ ○ ○ ○ ○ ○ ○ ○ ○ ○ ○ ○ ○ ○ ○ ○ ○ ○ ○ ○ ○ ○ ○ ○ ○ ○ ○ ○ ○ ○ ○ ○ ○ ○ ○ ○ ○ ○ ○ ○ ○
Unemployment / Poverty 43.8 7.9 33.3 18.8 0.0
○ ○ ○ ○ ○ ○ ○ ○ ○ ○ ○ ○ ○ ○ ○ ○ ○ ○ ○ ○ ○ ○ ○ ○ ○ ○ ○ ○ ○ ○ ○ ○ ○ ○ ○ ○ ○ ○ ○ ○ ○ ○ ○ ○ ○ ○ ○ ○ ○ ○ ○ ○ ○ ○ ○ ○ ○ ○ ○ ○ ○
Water 6.3 5.3 4.8 12.5 0.0
Education 6.3 0.0 4.8 0.0 0.0
Table - 25
Major Problems faced by the Respondents in Hazaribagh Constituency (Jharkhand)
Problems Male Respondents Female Respondents General Category Scheduled Castes Scheduled Tribes
○ ○ ○ ○ ○ ○ ○ ○ ○ ○ ○ ○ ○ ○ ○ ○ ○ ○ ○ ○ ○ ○ ○ ○ ○ ○ ○ ○ ○ ○ ○ ○ ○ ○ ○ ○ ○ ○ ○ ○ ○ ○ ○ ○ ○ ○ ○ ○ ○ ○ ○ ○ ○ ○ ○ ○ ○ ○ ○ ○ ○
Health 15.2 16.7 15.0 36.4 4.8
○ ○ ○ ○ ○ ○ ○ ○ ○ ○ ○ ○ ○ ○ ○ ○ ○ ○ ○ ○ ○ ○ ○ ○ ○ ○ ○ ○ ○ ○ ○ ○ ○ ○ ○ ○ ○ ○ ○ ○ ○ ○ ○ ○ ○ ○ ○ ○ ○ ○ ○ ○ ○ ○ ○ ○ ○ ○ ○ ○ ○
Irrigation 21.7 0.0 20.0 36.4 9.5
○ ○ ○ ○ ○ ○ ○ ○ ○ ○ ○ ○ ○ ○ ○ ○ ○ ○ ○ ○ ○ ○ ○ ○ ○ ○ ○ ○ ○ ○ ○ ○ ○ ○ ○ ○ ○ ○ ○ ○ ○ ○ ○ ○ ○ ○ ○ ○ ○ ○ ○ ○ ○ ○ ○ ○ ○ ○ ○ ○ ○
Unemployment 19.6 50.0 15.0 27.3 28.6
○ ○ ○ ○ ○ ○ ○ ○ ○ ○ ○ ○ ○ ○ ○ ○ ○ ○ ○ ○ ○ ○ ○ ○ ○ ○ ○ ○ ○ ○ ○ ○ ○ ○ ○ ○ ○ ○ ○ ○ ○ ○ ○ ○ ○ ○ ○ ○ ○ ○ ○ ○ ○ ○ ○ ○ ○ ○ ○ ○ ○
Road 26.1 0.0 35.0 0.0 23.8
○ ○ ○ ○ ○ ○ ○ ○ ○ ○ ○ ○ ○ ○ ○ ○ ○ ○ ○ ○ ○ ○ ○ ○ ○ ○ ○ ○ ○ ○ ○ ○ ○ ○ ○ ○ ○ ○ ○ ○ ○ ○ ○ ○ ○ ○ ○ ○ ○ ○ ○ ○ ○ ○ ○ ○ ○ ○ ○ ○ ○
Water 10.9 33.3 15.0 0.0 19.0
School 6.5 0.0 0.0 0.0 14.3
� For the respondents of the general category, availability of an all season road is a major problem where as
for those from scheduled tribe category both roads and unemployment are major factors.
� In case of the respondents from the scheduled castes, the major problems are health and irrigation issues.
JAGATSINGHPUR (Orissa)
� We did not have respondents from scheduled tribe community in Jagatsinghpur. For other groups, though
the issues varied the weightage was distributed across different issues. (See Table -26)
� For the male respondents, drinking water, unemployment and electricity were the major concerns whereas
for female respondents unemployment, drinking water and flood got prime importance.

43
� For the respondents of general category, poverty & unemployment, drinking water and electricity were of
prime concern whereas for those from the scheduled castes, drinking water and flood were major concerns.
� After the Super Cyclone in 1999, the soil of coastal Jagatsinghpur got salinated and agricultural operations
got a setback. In such a situation, the male members managed to switch over to other occupations bit the
female members could not. This might be the reason for unemployment being a major concern among the
female respondents in Jagatsinghpur.
KOTA (Rajasthan)
� In Kota, the major problems faced by the male respondents and those from scheduled castes were
unemployment and water was a major concern in almost all other groups.
Table - 26
Major Problems faced by Respondents in Jagatsinghpur Constituency (Orissa)
Problems Male Respondents Female Respondents General Category Scheduled Castes
○ ○ ○ ○ ○ ○ ○ ○ ○ ○ ○ ○ ○ ○ ○ ○ ○ ○ ○ ○ ○ ○ ○ ○ ○ ○ ○ ○ ○ ○ ○ ○ ○ ○ ○ ○ ○ ○ ○ ○ ○ ○ ○ ○ ○ ○ ○ ○ ○ ○ ○ ○ ○ ○ ○ ○ ○ ○ ○ ○ ○
Electricity 16.9 12.3 16.3 11.5
○ ○ ○ ○ ○ ○ ○ ○ ○ ○ ○ ○ ○ ○ ○ ○ ○ ○ ○ ○ ○ ○ ○ ○ ○ ○ ○ ○ ○ ○ ○ ○ ○ ○ ○ ○ ○ ○ ○ ○ ○ ○ ○ ○ ○ ○ ○ ○ ○ ○ ○ ○ ○ ○ ○ ○ ○ ○ ○ ○ ○
Drinking Water 19.5 20.5 17.3 25.0
○ ○ ○ ○ ○ ○ ○ ○ ○ ○ ○ ○ ○ ○ ○ ○ ○ ○ ○ ○ ○ ○ ○ ○ ○ ○ ○ ○ ○ ○ ○ ○ ○ ○ ○ ○ ○ ○ ○ ○ ○ ○ ○ ○ ○ ○ ○ ○ ○ ○ ○ ○ ○ ○ ○ ○ ○ ○ ○ ○ ○
Hospital and Public Health 14.3 13.7 11.2 19.2
○ ○ ○ ○ ○ ○ ○ ○ ○ ○ ○ ○ ○ ○ ○ ○ ○ ○ ○ ○ ○ ○ ○ ○ ○ ○ ○ ○ ○ ○ ○ ○ ○ ○ ○ ○ ○ ○ ○ ○ ○ ○ ○ ○ ○ ○ ○ ○ ○ ○ ○ ○ ○ ○ ○ ○ ○ ○ ○ ○ ○
Poverty and Unemployment 18.2 24.7 26.5 11.5
○ ○ ○ ○ ○ ○ ○ ○ ○ ○ ○ ○ ○ ○ ○ ○ ○ ○ ○ ○ ○ ○ ○ ○ ○ ○ ○ ○ ○ ○ ○ ○ ○ ○ ○ ○ ○ ○ ○ ○ ○ ○ ○ ○ ○ ○ ○ ○ ○ ○ ○ ○ ○ ○ ○ ○ ○ ○ ○ ○ ○
Road 9.1 6.8 10.2 3.8
○ ○ ○ ○ ○ ○ ○ ○ ○ ○ ○ ○ ○ ○ ○ ○ ○ ○ ○ ○ ○ ○ ○ ○ ○ ○ ○ ○ ○ ○ ○ ○ ○ ○ ○ ○ ○ ○ ○ ○ ○ ○ ○ ○ ○ ○ ○ ○ ○ ○ ○ ○ ○ ○ ○ ○ ○ ○ ○ ○ ○
Flood 14.3 17.8 12.2 23.1
Drainage 7.8 4.1 6.1 5.8
Table - 27
Major Problems faced by the Respondents in Kota Constituency (Rajasthan)
Problems Male Female General Scheduled Scheduled
Respondents Respondents Category Castes Tribes
○ ○ ○ ○ ○ ○ ○ ○ ○ ○ ○ ○ ○ ○ ○ ○ ○ ○ ○ ○ ○ ○ ○ ○ ○ ○ ○ ○ ○ ○ ○ ○ ○ ○ ○ ○ ○ ○ ○ ○ ○ ○ ○ ○ ○ ○ ○ ○ ○ ○ ○ ○ ○ ○ ○ ○ ○ ○ ○ ○ ○
Unemployment 32.9 12.3 15.2 45.7 20.0
○ ○ ○ ○ ○ ○ ○ ○ ○ ○ ○ ○ ○ ○ ○ ○ ○ ○ ○ ○ ○ ○ ○ ○ ○ ○ ○ ○ ○ ○ ○ ○ ○ ○ ○ ○ ○ ○ ○ ○ ○ ○ ○ ○ ○ ○ ○ ○ ○ ○ ○ ○ ○ ○ ○ ○ ○ ○ ○ ○ ○
Water 20.3 41.5 25.3 34.3 36.7
○ ○ ○ ○ ○ ○ ○ ○ ○ ○ ○ ○ ○ ○ ○ ○ ○ ○ ○ ○ ○ ○ ○ ○ ○ ○ ○ ○ ○ ○ ○ ○ ○ ○ ○ ○ ○ ○ ○ ○ ○ ○ ○ ○ ○ ○ ○ ○ ○ ○ ○ ○ ○ ○ ○ ○ ○ ○ ○ ○ ○
Road 8.9 4.6 12.7 0.0 0.0
○ ○ ○ ○ ○ ○ ○ ○ ○ ○ ○ ○ ○ ○ ○ ○ ○ ○ ○ ○ ○ ○ ○ ○ ○ ○ ○ ○ ○ ○ ○ ○ ○ ○ ○ ○ ○ ○ ○ ○ ○ ○ ○ ○ ○ ○ ○ ○ ○ ○ ○ ○ ○ ○ ○ ○ ○ ○ ○ ○ ○
Drainage 3.8 10.8 3.8 0.0 23.3
○ ○ ○ ○ ○ ○ ○ ○ ○ ○ ○ ○ ○ ○ ○ ○ ○ ○ ○ ○ ○ ○ ○ ○ ○ ○ ○ ○ ○ ○ ○ ○ ○ ○ ○ ○ ○ ○ ○ ○ ○ ○ ○ ○ ○ ○ ○ ○ ○ ○ ○ ○ ○ ○ ○ ○ ○ ○ ○ ○ ○
Electricity 10.1 6.2 11.4 0.0 10.0
○ ○ ○ ○ ○ ○ ○ ○ ○ ○ ○ ○ ○ ○ ○ ○ ○ ○ ○ ○ ○ ○ ○ ○ ○ ○ ○ ○ ○ ○ ○ ○ ○ ○ ○ ○ ○ ○ ○ ○ ○ ○ ○ ○ ○ ○ ○ ○ ○ ○ ○ ○ ○ ○ ○ ○ ○ ○ ○ ○ ○
Toilet for Women 0.0 9.2 7.6 0.0 0.0
○ ○ ○ ○ ○ ○ ○ ○ ○ ○ ○ ○ ○ ○ ○ ○ ○ ○ ○ ○ ○ ○ ○ ○ ○ ○ ○ ○ ○ ○ ○ ○ ○ ○ ○ ○ ○ ○ ○ ○ ○ ○ ○ ○ ○ ○ ○ ○ ○ ○ ○ ○ ○ ○ ○ ○ ○ ○ ○ ○ ○
School 12.7 15.4 20.3 11.4 0.0
Hospital 11.4 0.0 3.8 8.6 10.0
� Problems of road communication were a major problem mainly for the male respondents that too from the
general category.
� For the respondents from the scheduled tribes, drainage at colonies is a major concern.
� Interestingly, among all the constituencies surveyed, Kota is the only constituency where the respondents
have shown some concern for education and lack of schools as a development problem.
PATAN (Gujarat)
� In Patan, we do not have respondents from Scheduled Tribe communities.
� In Patan, among the male respondents, water and electricity seems to be the major concerns. Around 28
percent of the male respondents have viewed water and around 21 percent of the same have viewed as
the major problems faced by them in their locality.

44
� For all other groups water was the most important problem so far as around 58 percent of the female
respondents and around 38 percent of both general and scheduled caste category respondents viewed it as
the major problem faced by them.
� Issues like hospital and roads got comparatively less weightage among the respondents of Patan. Interestingly,
unemployment was a low priority concern for the male respondents of general category only.
The above analysis shows that in spite of being from a single constituency, different groups perceive different
problems as their prime issues. Such an exercise was necessary to understand why in spite of a large amount of
money spent so far on development projects through MPLADS; benefits do not accrue to the common people.
Our observation makes it imperative that for an effective public expenditure policy, it is essential that the authority
should have a proper knowledge about the development needs of the potential beneficiaries and works should
not be undertaken on the basis of the suggestions made by local party workers, politicians and interest groups
who do not constitute the group of beneficiaries.
(d) Selection Process of Works under MPLADS
Contrary to the ideal situations, nowhere in our sample constituencies, the selections of works were need
based and nowhere, proper research was done to assess the needs before the MPs recommended works to
the DCs. The respondents were asked to select the answer from four obvious choices about how the
decisions regarding selection of works were taken. In most of the constituencies the majority of the
respondents opined that the decisions on what works to be taken up were made by the MPs arbitrarily.
Even in those cases where the MP has taken decisions on popular demand this was not based on any
investigation of the locally felt needs (See Table -29).
It is important to note how popular demands significantly
differ from the locally felt needs. While the later is genuine
need, the vocal sections can easily construct the former.
In our subsequent analysis where we asked the
respondents to rank the items, which they think, should
be constructed from MPLADS in a priority basis, their
pattern of ranking went in a complete different direction
than what they revealed in section 4.3 (c).
� In Alwar constituency, around 55 percent of the
respondents revealed that regarding selection of
works, the MP takes decisions arbitrarily, 30 percent
revealed that the MP recommends works on the
basis of popular demand and 15 percent of the
total respondents said that the MP takes decisions
biased by pressure groups.
Table - 28
Major Problems faced by the Respondents in Patan Constituency (Gujarat)
Problems Male Respondents Female Respondents General Category Scheduled Castes
○ ○ ○ ○ ○ ○ ○ ○ ○ ○ ○ ○ ○ ○ ○ ○ ○ ○ ○ ○ ○ ○ ○ ○ ○ ○ ○ ○ ○ ○ ○ ○ ○ ○ ○ ○ ○ ○ ○ ○ ○ ○ ○ ○ ○ ○ ○ ○ ○ ○ ○ ○ ○ ○ ○ ○ ○ ○ ○ ○ ○
Water 27.7 57.7 38.6 37.5
○ ○ ○ ○ ○ ○ ○ ○ ○ ○ ○ ○ ○ ○ ○ ○ ○ ○ ○ ○ ○ ○ ○ ○ ○ ○ ○ ○ ○ ○ ○ ○ ○ ○ ○ ○ ○ ○ ○ ○ ○ ○ ○ ○ ○ ○ ○ ○ ○ ○ ○ ○ ○ ○ ○ ○ ○ ○ ○ ○ ○
Hospital 17.0 11.5 15.8 12.5
○ ○ ○ ○ ○ ○ ○ ○ ○ ○ ○ ○ ○ ○ ○ ○ ○ ○ ○ ○ ○ ○ ○ ○ ○ ○ ○ ○ ○ ○ ○ ○ ○ ○ ○ ○ ○ ○ ○ ○ ○ ○ ○ ○ ○ ○ ○ ○ ○ ○ ○ ○ ○ ○ ○ ○ ○ ○ ○ ○ ○
Electricity 21.3 7.7 15.8 18.8
○ ○ ○ ○ ○ ○ ○ ○ ○ ○ ○ ○ ○ ○ ○ ○ ○ ○ ○ ○ ○ ○ ○ ○ ○ ○ ○ ○ ○ ○ ○ ○ ○ ○ ○ ○ ○ ○ ○ ○ ○ ○ ○ ○ ○ ○ ○ ○ ○ ○ ○ ○ ○ ○ ○ ○ ○ ○ ○ ○ ○
Road 14.9 15.4 15.8 12.5
○ ○ ○ ○ ○ ○ ○ ○ ○ ○ ○ ○ ○ ○ ○ ○ ○ ○ ○ ○ ○ ○ ○ ○ ○ ○ ○ ○ ○ ○ ○ ○ ○ ○ ○ ○ ○ ○ ○ ○ ○ ○ ○ ○ ○ ○ ○ ○ ○ ○ ○ ○ ○ ○ ○ ○ ○ ○ ○ ○ ○
Housing 6.4 3.8 1.8 18.8
○ ○ ○ ○ ○ ○ ○ ○ ○ ○ ○ ○ ○ ○ ○ ○ ○ ○ ○ ○ ○ ○ ○ ○ ○ ○ ○ ○ ○ ○ ○ ○ ○ ○ ○ ○ ○ ○ ○ ○ ○ ○ ○ ○ ○ ○ ○ ○ ○ ○ ○ ○ ○ ○ ○ ○ ○ ○ ○ ○ ○
Unemployment 12.8 3.8 12.3 0.0
TOTAL 100.0 100.0 100.0 100.0
Table - 29
Perception about the way Decisions on
Selection of Works are taken
Constituency MP Takes Decision on Decision under
Decisions Popular Influence of
Arbitrarily Demand Pressure Groups
○ ○ ○ ○ ○ ○ ○ ○ ○ ○ ○ ○ ○ ○ ○ ○ ○ ○ ○ ○ ○ ○ ○ ○ ○ ○ ○ ○ ○ ○
Alwar 55.0 30.0 15.0
○ ○ ○ ○ ○ ○ ○ ○ ○ ○ ○ ○ ○ ○ ○ ○ ○ ○ ○ ○ ○ ○ ○ ○ ○ ○ ○ ○ ○ ○
Bhopal 35.0 55.0 10.0
○ ○ ○ ○ ○ ○ ○ ○ ○ ○ ○ ○ ○ ○ ○ ○ ○ ○ ○ ○ ○ ○ ○ ○ ○ ○ ○ ○ ○ ○
Ghazipur 65.0 30.0 5.0
○ ○ ○ ○ ○ ○ ○ ○ ○ ○ ○ ○ ○ ○ ○ ○ ○ ○ ○ ○ ○ ○ ○ ○ ○ ○ ○ ○ ○ ○
Hazaribagh 50.0 10.0 40.0
○ ○ ○ ○ ○ ○ ○ ○ ○ ○ ○ ○ ○ ○ ○ ○ ○ ○ ○ ○ ○ ○ ○ ○ ○ ○ ○ ○ ○ ○
Jagatsinghpur 50.0 46.2 15.4
○ ○ ○ ○ ○ ○ ○ ○ ○ ○ ○ ○ ○ ○ ○ ○ ○ ○ ○ ○ ○ ○ ○ ○ ○ ○ ○ ○ ○ ○
Kota 24.1 51.7 24.1
Patan 25.0 50.0 25.0

45
� In Bhopal, 35 percent revealed that the MP takes decisions arbitrarily, 55 percent said that he takes
decisions on the basis of popular demand and for 10 percent respondents, he takes decisions under
the influence of pressure groups.
� In Ghazipur constituency, 65 percent of the sample respondents revealed that the MP takes decisions
arbitrarily and 30 percent said that he takes decisions on the basis of popular demand.
� 50 percent of the respondents in Hazaribagh constituency said that the MP takes decisions arbitrarily
and around 40 percent said the pressure groups influence the decisions.
� In Jagatsinghpur constituency, around 50 percent respondents revealed arbitrary decisions, around 46
percent revealed that decisions are based on popular demand and the rest told that the decisions
were taken under the influence of pressure groups.
� In Kota and Patan constituencies, around 50 percent respondents said that the decisions were taken
on popular demand. Of the rest, around equal number of the respondents told that the decisions
were either arbitrary or were taken under the influence of pressure groups.
(e) Shortcomings of the Scheme
In order to assess the shortcomings of the scheme from the peoples’ perspective, we asked the respondents
to choose from some of the well-known shortcomings highlighted by CAG and others. We wanted to know
what common people perceive as the problems associated with the scheme from the inception of projects
till their completion. Table 30 shows the way people reacted on these shortcomings. Since our sample
respondents were especially from those who are either beneficiaries or both beneficiaries as well as persons
having involvement in the construction of assets as labourers or otherwise, their response is very important
to judge the lacunae in the scheme.
Table - 30
Perceptions Regarding the Shortcomings About the Scheme in Local Areas
Constituency Project Selection Inordinate Delay Manipulation in Less than Other
was Controversial in Completion Employment Minimum Wages Shortcomings*
Register Paid
○ ○ ○ ○ ○ ○ ○ ○ ○ ○ ○ ○ ○ ○ ○ ○ ○ ○ ○ ○ ○ ○ ○ ○ ○ ○ ○ ○ ○ ○ ○ ○ ○ ○ ○ ○ ○ ○ ○ ○ ○ ○ ○ ○ ○ ○ ○ ○ ○ ○ ○ ○ ○ ○ ○ ○ ○ ○ ○ ○ ○
Alwar 55.0 35.0 35.0 25.0 30.0
○ ○ ○ ○ ○ ○ ○ ○ ○ ○ ○ ○ ○ ○ ○ ○ ○ ○ ○ ○ ○ ○ ○ ○ ○ ○ ○ ○ ○ ○ ○ ○ ○ ○ ○ ○ ○ ○ ○ ○ ○ ○ ○ ○ ○ ○ ○ ○ ○ ○ ○ ○ ○ ○ ○ ○ ○ ○ ○ ○ ○
Bhopal 5.0 80.0 10.0 30.0 40.0
○ ○ ○ ○ ○ ○ ○ ○ ○ ○ ○ ○ ○ ○ ○ ○ ○ ○ ○ ○ ○ ○ ○ ○ ○ ○ ○ ○ ○ ○ ○ ○ ○ ○ ○ ○ ○ ○ ○ ○ ○ ○ ○ ○ ○ ○ ○ ○ ○ ○ ○ ○ ○ ○ ○ ○ ○ ○ ○ ○ ○
Ghazipur 25.0 55.0 10.0 60.0 5.0
○ ○ ○ ○ ○ ○ ○ ○ ○ ○ ○ ○ ○ ○ ○ ○ ○ ○ ○ ○ ○ ○ ○ ○ ○ ○ ○ ○ ○ ○ ○ ○ ○ ○ ○ ○ ○ ○ ○ ○ ○ ○ ○ ○ ○ ○ ○ ○ ○ ○ ○ ○ ○ ○ ○ ○ ○ ○ ○ ○ ○
Hazaribagh 10.0 40.0 0.0 20.0 30.0
○ ○ ○ ○ ○ ○ ○ ○ ○ ○ ○ ○ ○ ○ ○ ○ ○ ○ ○ ○ ○ ○ ○ ○ ○ ○ ○ ○ ○ ○ ○ ○ ○ ○ ○ ○ ○ ○ ○ ○ ○ ○ ○ ○ ○ ○ ○ ○ ○ ○ ○ ○ ○ ○ ○ ○ ○ ○ ○ ○ ○
Jagatsinghpur 30.8 69.2 26.9 50.0 30.8
○ ○ ○ ○ ○ ○ ○ ○ ○ ○ ○ ○ ○ ○ ○ ○ ○ ○ ○ ○ ○ ○ ○ ○ ○ ○ ○ ○ ○ ○ ○ ○ ○ ○ ○ ○ ○ ○ ○ ○ ○ ○ ○ ○ ○ ○ ○ ○ ○ ○ ○ ○ ○ ○ ○ ○ ○ ○ ○ ○ ○
Kota 34.5 69.0 24.1 48.3 24.1
Patan 18.8 75.0 25.0 37.5 37.5
* These Other Shortcomings include
(1) Bad Quality of Work, (2) Inadequate Employment, (3) Corruption, (4) Lack of interest by Elected Representatives
� Fifty five percent of the respondents in Alwar, 5 percent in Bhopal, 25 percent in Ghazipur, 10 percent
in Hazaribagh, 31 percent in Jagatsinghpur, 35 percent in Kota and 19 percent in Patan constituencies
revealed that the project selection was controversial. This observation is quite crucial in a sense that
in all these constituencies there were differences of opinion among different players about the project
itself and the worst thing is that the common people could smell such controversy. A classic example
of such controversy was an illustration by the member of Lok Sabha Prof. A. K. Premajam of Badagara
Constituency in Kerala from her own experience (See Box -12). While undertaking primary data
collection we came across several other stories where due to controversy in selection of projects the
potential benefits could not be accrued to the common people. For example, in Jagatsinghpur
constituency, the bridge near Mohanapari, which accounted for Rs. 14.59 thousand for construction is
of little use to the villagers (See Box-13).

46
Excerpts from MP’s interview
MP: Prof A. K. Premajam (Badagara, Kerala)
“…………..There are instances when the MPs get cheated by implementing agencies and even by
government machinery. To cite such a case, in a village, there was already a concrete well built by
the Gram Panchayat for drinking water purpose. However, the panchayat did not have enough
money for building overhead tank; pump house and the necessary pipelines. They requested me to
provide funds from MPLADS for the purpose. The villagers only made the estimates and according
to their suggestions I recommended to DC, a work of Rs. 4 lakh to build a pump house and
connecting lines. However, the executive engineer did not give technical sanction as well as
administrative sanction. They initially reported me that the well is kuchha and should be stoned or
concretised for the project. Therefore they wanted a sanction of Rs. 8 Lakhs for the purpose. Smelling
vested interests in their approach I enquired about the matter and reported them that the well is
already concretised and there is no need for more money and I asked them to go ahead with the
initial recommendation. After a month or so, the executive engineer in writing informed me that the
well belonged to the irrigation department and cannot be used for the purpose of providing drinking
water. So a new well needs to be dug and the total cost of the project would be Rs. 13 lakh. Then I
thought of visiting the place myself. I asked an irrigation department official, the executive engineer
and the DC to accompany me. In front of all the villagers the story got open. The said well belonged
to the villagers only and was built for the purpose of drinking water only. Finally I got the project
sanctioned for Rs. 4 lakh only. But by the time it got cleared, monsoon arrived and the construction
of the pump house got delayed. But I am happy that I could prevent a corruption case in my
constituency.”
Box 1
2
Mohonapari Bridge
Block: Balikuda
District: Jagatsinghpur, Orissa
Cost incurred: Rs. 14,59,000/-
The need of a bridge became imminent when the wooden bridge, which was there since British Raj, got
washed away in 1980 flood. 1982, the then Minister in the State Mr. Basudev Mohapatra (Congress)
raised this issue during his election campaign arranged the makeshift bridge, which collapsed completely
in Super Cyclone of 1999. Then the local MLA Mr. Jyotiranjan Das (Congress) pursued for the construction
of a concrete bridge, which could connect more than 100 villages on the other side to the Machhagaon
–Paradweep road that is crucial for freight transport of agricultural output of these villagers. The issue
finally got technical and administrative sanction in 2001. The problem emerged on the placement of the
bridge. It would have been in the advantage of the local Congress leaders who have been pursuing the
issue for a long time, if the bridge were built at the same place where the earlier wooden bridge was
there. But the present MP who has built the bridge is from Biju Janata Dal and probably was reluctant to
give any credit to the congressmen. Therefore the actual construction site of the bridge changed from
the earlier one and was built at a place where there is no road to connect the bridge with the main road.
However, this is not a big issue as the main road is only around 250 meter away from the bridge and a
connecting road could be easily built from the MPLADS. But the Government does not own the land
required for the connecting road and the owners of the land at both the sides of the bridge are reluctant
to give up for political rivalry. The people of Dabar Village are predominantly Congress supporters and
those of Mohanapari are supporters of BJD. Because of such controversy, the bridge is of no use for the
people of both sides and no one can say when this issue is going to be settled.
Information Provided by
Shri Magu Parida (35), Villager from Dabar, Balikuda
Shri Durga Charan Lenka (59), Naib Sarpanch, Mohanapari, Balikuda
Box 1
3

47
� Around 35 percent of the respondents in Alwar, 80 percent in Bhopal, 55 percent in Ghazipur, 40
percent in Hazaribagh, 69 percent in both Jagatsinghpur and Kota and 75 percent in Patan revealed
that there was an inordinate delay in the completion of work.
� Around 35 percent respondents in Alwar, 10 percent each in Bhopal and Ghazipur and around 25
percent each in Jagatsinghpur, Kota and Patan constituencies said that he employment register were
manipulated.
� Around 25 percent respondents in Alwar, 30 percent in Bhopal, 60 percent in Ghazipur, 20 percent in
Hazaribagh, around 50 percent in both Jagatsinghpur and Kota, and 37 percent in Patan constituencies
revealed that less than minimum wages were paid to the labourers who got employment in the
scheme. Most of these respondents were involved as construction labourers in the creation of assets
under MPLADS and said that since many works under MPLADS start during summer and non
agricultural seasons, they agree to work as this provides them some income in the off season. The
respondents in Jagatsinghpur and Kota also revealed that since a lot of works are clubbed with calamity
relief, and since they get employment under food for work programmes, they agree to work in order
to get atleast some staple food like rice in Orissa and wheat in Rajasthan, though they usually get less
cash than what was promised to them by the employers and that too in many cases as deferred
payments only. Again, since most of these works were undertaken during agricultural off-seasons
only, there is an inherent over supply of workers, which provides the contractors/ employers to bargain
and succeed in lowering wages.
� Around 30 percent respondents in Alwar, 40 percent in Bhopal, 5 percent in Ghazipur, 30 percent in
Hazaribagh and Jagatsinghpur, 24 percent in Kota and 37 percent in Patan constituencies revealed
other shortcomings of the scheme. Such shortcomings include bad quality of work, inadequate
employment generation, corruption and lack of interest by the elected representatives.
(f) Perception on the Quality of Works under MPLADS
CAG and others have referred to the bad quality of works created under MPLADS. Such lapses in quality
may be due to lack of a proper monitoring system as well as over ambitious projects with limited financial
provision. The concept of quality being a relative term only depicts the observer’s view of the assets, its
durability, etc vis-à-vis the amount spent on its creation. However there might be a different angle of
quality altogether. In the present study we have tried to judge the quality of assets in terms of the purpose
of its creation and the benefits they provide compared to the ideal situation. It was very difficult for us to
judge the technical quality as we did not observe the creation of the assets from the beginning and only
depended on the perception of the people on the technical maters. Such perception on the quality of
assets is shown for different constituencies in Table -31.
Table - 31
Peoples’ Perception on Quality of Assets Created under the scheme in Sample Constituencies
Constituencies Excellent Good Quality Bad Quality Very Bad Quality
○ ○ ○ ○ ○ ○ ○ ○ ○ ○ ○ ○ ○ ○ ○ ○ ○ ○ ○ ○ ○ ○ ○ ○ ○ ○ ○ ○ ○ ○ ○ ○ ○ ○ ○ ○ ○ ○ ○ ○ ○ ○ ○ ○ ○ ○ ○ ○ ○ ○ ○ ○ ○ ○ ○ ○ ○ ○ ○ ○ ○
Alwar 15.0 40.0 30.0 15.0
○ ○ ○ ○ ○ ○ ○ ○ ○ ○ ○ ○ ○ ○ ○ ○ ○ ○ ○ ○ ○ ○ ○ ○ ○ ○ ○ ○ ○ ○ ○ ○ ○ ○ ○ ○ ○ ○ ○ ○ ○ ○ ○ ○ ○ ○ ○ ○ ○ ○ ○ ○ ○ ○ ○ ○ ○ ○ ○ ○ ○
Bhopal 0.0 35.0 40.0 25.0
○ ○ ○ ○ ○ ○ ○ ○ ○ ○ ○ ○ ○ ○ ○ ○ ○ ○ ○ ○ ○ ○ ○ ○ ○ ○ ○ ○ ○ ○ ○ ○ ○ ○ ○ ○ ○ ○ ○ ○ ○ ○ ○ ○ ○ ○ ○ ○ ○ ○ ○ ○ ○ ○ ○ ○ ○ ○ ○ ○ ○
Ghazipur 0.0 20.0 65.0 15.0
○ ○ ○ ○ ○ ○ ○ ○ ○ ○ ○ ○ ○ ○ ○ ○ ○ ○ ○ ○ ○ ○ ○ ○ ○ ○ ○ ○ ○ ○ ○ ○ ○ ○ ○ ○ ○ ○ ○ ○ ○ ○ ○ ○ ○ ○ ○ ○ ○ ○ ○ ○ ○ ○ ○ ○ ○ ○ ○ ○ ○
Hazaribagh 0.0 20.0 80.0 0.0
○ ○ ○ ○ ○ ○ ○ ○ ○ ○ ○ ○ ○ ○ ○ ○ ○ ○ ○ ○ ○ ○ ○ ○ ○ ○ ○ ○ ○ ○ ○ ○ ○ ○ ○ ○ ○ ○ ○ ○ ○ ○ ○ ○ ○ ○ ○ ○ ○ ○ ○ ○ ○ ○ ○ ○ ○ ○ ○ ○ ○
Jagatsinghpur 7.7 23.1 42.3 26.9
○ ○ ○ ○ ○ ○ ○ ○ ○ ○ ○ ○ ○ ○ ○ ○ ○ ○ ○ ○ ○ ○ ○ ○ ○ ○ ○ ○ ○ ○ ○ ○ ○ ○ ○ ○ ○ ○ ○ ○ ○ ○ ○ ○ ○ ○ ○ ○ ○ ○ ○ ○ ○ ○ ○ ○ ○ ○ ○ ○ ○
Kota 13.8 37.9 31.0 17.2
Patan 6.3 31.3 43.8 18.8
TOTAL 7.1 30.5 44.0 18.4

48
� More than 62 percent of the respondents in all the constituencies reported bad or very bad quality of
assets created under MPLADS. Around 8 percent of the respondents reported excellent quality of the
works and around 30 percent reported good quality.
� The highest proportion of around 80 percent respondents in Hazaribagh and Ghazipur constituencies
reported bad or very bad quality of works.
� Our analysis shows that in Kota and Alwar (both the constituencies are from Rajasthan), the respondents
are more or less satisfied with the quality of works undertaken there.
� In all other constituencies the respondents were grossly dissatisfied with the quality of assets created
under MPLADS.
(g) Performance of MP, District Collector and the Implementing Agencies
So far we have discussed the various aspects related to the scheme in the sample constituencies based on
the perceptions of the common people. In this context it is also essential to know how people view the key
players involved in the scheme. In our sample constituencies we collected information on people’s perception
on the performance of the MPs, the district collectors and the implementing agencies. Our observations as
shown in Table –32 reveal that the respondents in the sample constituencies are more or less happy with
the MP than any body else.
� Only except Ghazipur and Hazaribagh, in all
other constituencies, a substantial proportion
of respondents satisfied with the performance
of the MP. In Alwar, around 90 percent
respondents were satisfied with the MP’s
performance whereas, in Ghazipur and
Hazaribagh constituencies, less than 25
percent of the respondents are satisfied with
the people’s representative.
� Only in Alwar constituency around 80 percent
respondents were satisfied with the
performance of the District Collector. In all
other constituencies, the respondents viewed
the performance very poorly. In Jagatsinghpur
constituency, only 11.5 percent respondents
were satisfied with the performance of the district collectors.
� In the sample constituencies, the respondents are least satisfied with the implementing agencies. Except
in Alwar where around 75 percent respondents were satisfied with the implementing agencies, in all
other places less than 50 percent respondents were satisfied with them. As an extreme case, only 17
percent respondents are satisfied with the implementing agencies in Kota.
(h) Availability of Public Amenities
In an effort to know the availability of basic public amenities, which are primary for any civilised human
settlement, we asked about the density, distance, time taken for commuting and accessibility of several
services. In many cases we found that these services are effectively inaccessible to the common people
even if they are ready to pay a price for those services (See Table -33. There is a gross unavailability of
basic services in our sample constituencies. However, it was disappointing to note that funds from MPLADS
were not used to create services even though it has the necessary provisions. The members of parliament
did not bother to provide solutions to these basic problems, even when these are so obvious
� In our sample constituencies, primary schools are most easily accessible service. In a radius of around
0.49 Kms, there is a primary school. However, around 65 percent of these primary schools are private
Table - 32
Perception Regarding Performance of MP,
DC and Implementing Agencies
Constituency Satisfied Satisfied Satisfied with
with MP with DC Implementing
Agencies
○ ○ ○ ○ ○ ○ ○ ○ ○ ○ ○ ○ ○ ○ ○ ○ ○ ○ ○ ○ ○ ○ ○ ○ ○ ○ ○ ○ ○ ○
Alwar 90.0 80.0 75.0
○ ○ ○ ○ ○ ○ ○ ○ ○ ○ ○ ○ ○ ○ ○ ○ ○ ○ ○ ○ ○ ○ ○ ○ ○ ○ ○ ○ ○ ○
Bhopal 65.0 35.0 25.0
○ ○ ○ ○ ○ ○ ○ ○ ○ ○ ○ ○ ○ ○ ○ ○ ○ ○ ○ ○ ○ ○ ○ ○ ○ ○ ○ ○ ○ ○
Ghazipur 25.0 35.0 50.0
○ ○ ○ ○ ○ ○ ○ ○ ○ ○ ○ ○ ○ ○ ○ ○ ○ ○ ○ ○ ○ ○ ○ ○ ○ ○ ○ ○ ○ ○
Hazaribagh 20.0 30.0 30.0
○ ○ ○ ○ ○ ○ ○ ○ ○ ○ ○ ○ ○ ○ ○ ○ ○ ○ ○ ○ ○ ○ ○ ○ ○ ○ ○ ○ ○ ○
Jagatsinghpur 65.4 11.5 34.6
○ ○ ○ ○ ○ ○ ○ ○ ○ ○ ○ ○ ○ ○ ○ ○ ○ ○ ○ ○ ○ ○ ○ ○ ○ ○ ○ ○ ○ ○
Kota 62.1 41.4 17.2
Patan 56.3 31.3 43.8

49
schools and therefore bears a cost to the beneficiaries. The Members of Parliaments should have
spent some money for building more primary schools keeping in mind the affordability of the larger
sections of the society, in those areas where the facility provided by the government sector is less.
� In a majority of cases, the government provides the middle schools, High Schools and the Girls
Schools only. However, for students from poor communities the schools are so far that it takes around
70 minutes and more than that to commute from their residences. For around 13 percent of the
respondents girls’ schools are not accessible at all.
� There was no community school in our sample constituencies. Community schools are important in
those places where the social barriers are very strong and children from deprived social groups are
denied of education along with children from the upper castes. Though there is a provision that such
schools can be built through MPLADS, our sample respondents did not have community school
facilities.
� 90 percent of the total respondents reported their inaccessibility to public libraries in the sample
constituencies and almost all reported inaccessibility to sports complexes, though these facilities too
are possible to provide under MPLADS.
� The respondents revealed that they have to travel around 18 Km one-way on the average and to
spend around 1.5 hours to avail health facilities in a hospital. 20 percent respondents revealed that
they do not have effective access to hospitals and diagnostic facilities.
� As far as drinking water is concerned, in 25 percent cases the respondents reported inaccessibility to
wells/ tube wells/ or municipality taps. They usually collect water from remote and unsafe sources like
ponds and streams for drinking purposes.
� Respondents have to walk for around 2.93 Km. with their animals to visit a veterinary doctor wasting
more than 90 minutes to commute. To avail animal breeding and artificial insemination facilities, they
Table - 33
Availability of Public Amenities in the Sample Constituencies
Density within Nearest Time Taken Proportion of Proportion of Reported
one Km Distance to Commute Government Private Inaccessibility
AMENITIES Distance Facilities Facilities
○ ○ ○ ○ ○ ○ ○ ○ ○ ○ ○ ○ ○ ○ ○ ○ ○ ○ ○ ○ ○ ○ ○ ○ ○ ○ ○ ○ ○ ○ ○ ○ ○ ○ ○ ○ ○ ○ ○ ○ ○ ○ ○ ○ ○ ○ ○ ○ ○ ○ ○ ○ ○ ○ ○ ○ ○ ○ ○ ○ ○
Primary school 1.00 0.49 20.37 35.00 65.00 0.00
○ ○ ○ ○ ○ ○ ○ ○ ○ ○ ○ ○ ○ ○ ○ ○ ○ ○ ○ ○ ○ ○ ○ ○ ○ ○ ○ ○ ○ ○ ○ ○ ○ ○ ○ ○ ○ ○ ○ ○ ○ ○ ○ ○ ○ ○ ○ ○ ○ ○ ○ ○ ○ ○ ○ ○ ○ ○ ○ ○ ○
ME school 0.43 2.49 70.14 67.00 10.00 23.00
○ ○ ○ ○ ○ ○ ○ ○ ○ ○ ○ ○ ○ ○ ○ ○ ○ ○ ○ ○ ○ ○ ○ ○ ○ ○ ○ ○ ○ ○ ○ ○ ○ ○ ○ ○ ○ ○ ○ ○ ○ ○ ○ ○ ○ ○ ○ ○ ○ ○ ○ ○ ○ ○ ○ ○ ○ ○ ○ ○ ○
High school 0.30 2.95 69.93 100.00 0.00 0.00
○ ○ ○ ○ ○ ○ ○ ○ ○ ○ ○ ○ ○ ○ ○ ○ ○ ○ ○ ○ ○ ○ ○ ○ ○ ○ ○ ○ ○ ○ ○ ○ ○ ○ ○ ○ ○ ○ ○ ○ ○ ○ ○ ○ ○ ○ ○ ○ ○ ○ ○ ○ ○ ○ ○ ○ ○ ○ ○ ○ ○
Girls school 0.17 3.24 77.61 87.00 0.00 13.00
○ ○ ○ ○ ○ ○ ○ ○ ○ ○ ○ ○ ○ ○ ○ ○ ○ ○ ○ ○ ○ ○ ○ ○ ○ ○ ○ ○ ○ ○ ○ ○ ○ ○ ○ ○ ○ ○ ○ ○ ○ ○ ○ ○ ○ ○ ○ ○ ○ ○ ○ ○ ○ ○ ○ ○ ○ ○ ○ ○ ○
Community school 0.00 NA NA 0.00 0.00 100.00
○ ○ ○ ○ ○ ○ ○ ○ ○ ○ ○ ○ ○ ○ ○ ○ ○ ○ ○ ○ ○ ○ ○ ○ ○ ○ ○ ○ ○ ○ ○ ○ ○ ○ ○ ○ ○ ○ ○ ○ ○ ○ ○ ○ ○ ○ ○ ○ ○ ○ ○ ○ ○ ○ ○ ○ ○ ○ ○ ○ ○
Public library 0.10 0.10 20.00 10.00 0.00 90.00
○ ○ ○ ○ ○ ○ ○ ○ ○ ○ ○ ○ ○ ○ ○ ○ ○ ○ ○ ○ ○ ○ ○ ○ ○ ○ ○ ○ ○ ○ ○ ○ ○ ○ ○ ○ ○ ○ ○ ○ ○ ○ ○ ○ ○ ○ ○ ○ ○ ○ ○ ○ ○ ○ ○ ○ ○ ○ ○ ○ ○
Sports complexes 0.00 NA NA 0.00 0.00 100.00
○ ○ ○ ○ ○ ○ ○ ○ ○ ○ ○ ○ ○ ○ ○ ○ ○ ○ ○ ○ ○ ○ ○ ○ ○ ○ ○ ○ ○ ○ ○ ○ ○ ○ ○ ○ ○ ○ ○ ○ ○ ○ ○ ○ ○ ○ ○ ○ ○ ○ ○ ○ ○ ○ ○ ○ ○ ○ ○ ○ ○
Primary health centre 0.65 2.11 51.13 100.00 0.00 0.00
○ ○ ○ ○ ○ ○ ○ ○ ○ ○ ○ ○ ○ ○ ○ ○ ○ ○ ○ ○ ○ ○ ○ ○ ○ ○ ○ ○ ○ ○ ○ ○ ○ ○ ○ ○ ○ ○ ○ ○ ○ ○ ○ ○ ○ ○ ○ ○ ○ ○ ○ ○ ○ ○ ○ ○ ○ ○ ○ ○ ○
Hospitals 0.13 17.88 83.68 80.00 0.00 20.00
○ ○ ○ ○ ○ ○ ○ ○ ○ ○ ○ ○ ○ ○ ○ ○ ○ ○ ○ ○ ○ ○ ○ ○ ○ ○ ○ ○ ○ ○ ○ ○ ○ ○ ○ ○ ○ ○ ○ ○ ○ ○ ○ ○ ○ ○ ○ ○ ○ ○ ○ ○ ○ ○ ○ ○ ○ ○ ○ ○ ○
Diagnostic facilities 0.13 17.88 83.68 80.00 0.00 20.00
Wells/tube wells/ 1.58 0.57 51.50 75.00 0.00 25.00
○ ○ ○ ○ ○ ○ ○ ○ ○ ○ ○ ○ ○ ○ ○ ○ ○ ○ ○ ○ ○ ○ ○ ○ ○ ○ ○ ○ ○ ○ ○ ○ ○ ○ ○ ○ ○ ○ ○ ○ ○ ○ ○ ○ ○ ○ ○ ○ ○ ○ ○ ○ ○ ○ ○ ○ ○ ○ ○ ○ ○
municipality tap
○ ○ ○ ○ ○ ○ ○ ○ ○ ○ ○ ○ ○ ○ ○ ○ ○ ○ ○ ○ ○ ○ ○ ○ ○ ○ ○ ○ ○ ○ ○ ○ ○ ○ ○ ○ ○ ○ ○ ○ ○ ○ ○ ○ ○ ○ ○ ○ ○ ○ ○ ○ ○ ○ ○ ○ ○ ○ ○ ○ ○
Veterinary hospital 0.20 2.93 90.96 75.00 0.00 25.00
Artificial insemination 0.00 5.05 101.75 31.70 0.00 68.30
○ ○ ○ ○ ○ ○ ○ ○ ○ ○ ○ ○ ○ ○ ○ ○ ○ ○ ○ ○ ○ ○ ○ ○ ○ ○ ○ ○ ○ ○ ○ ○ ○ ○ ○ ○ ○ ○ ○ ○ ○ ○ ○ ○ ○ ○ ○ ○ ○ ○ ○ ○ ○ ○ ○ ○ ○ ○ ○ ○ ○
centre
○ ○ ○ ○ ○ ○ ○ ○ ○ ○ ○ ○ ○ ○ ○ ○ ○ ○ ○ ○ ○ ○ ○ ○ ○ ○ ○ ○ ○ ○ ○ ○ ○ ○ ○ ○ ○ ○ ○ ○ ○ ○ ○ ○ ○ ○ ○ ○ ○ ○ ○ ○ ○ ○ ○ ○ ○ ○ ○ ○ ○
Bus stop 0.32 2.52 31.72 NA NA NA
Crèche 0.00 NA NA 0.00 0.00 100.00

50
have to commute more than 5 Kms. More than that, 25 percent respondents do not have access to
animal breeding centres and more than 68 percent respondents do not have artificial insemination
facilities.
� The average distance for the nearest bus stop is around 2.5 Km for the respondents and all the
respondents said that they do not have facilities like crèche in the vicinity.
(i) Popular Demand in the Sample Area
From the above analysis we can easily visualise how poor the living condition of the common people is in
the average countryside and among marginalised sections. Their demands have remained unresolved for
decades though we have witnessed 55 years of political independence and we have come across 53 years
of planned economy. Yet after 53 years of apparently hard and earnest efforts we find that we have not
gone far from where we had started. People still have to compromise with their basic needs. There is really
something lacking . The common people are very vocal on Kashmir issue and other political planks, but
they are mysteriously silent when it comes to their own problems and the quality of life they are living in.
Our policy makers have very successfully diverted the attention of the common people from the issues of
common interest to the issues concerning macro level political dynamics. Even the perception of the common
people regarding their major problems is different from their notion of popular demand as we have described
earlier in sub section- d while discussing the dynamics behind the selection of works. To understand this
issue properly we asked the respondents to rank the listed needs in the order of priority if the want that
money from MPLADS should be spent on those needs. The list provided to the respondents included
some of the items, which are permissible under MPLADS as per the latest guidelines. The response to this
exercise has been compiled in Table -34.
� For the male respondents, the top five requirements to be settled in a priority basis are; Common
Pastures, Anganwadis, computers in the schools, bridges, roads and culverts, and drains and gutters.
Computers in the schools might be necessary but it quite difficult to assert why a common man from
a definite deprived economic class is giving such high priority to the issue, when there is a lack of
basic facilities.
Table - 34
Things Which are Required by Common People and Possible to create Under MPLADS (Rank Wise)
ITEMS MALE FEMALE TOTAL
○ ○ ○ ○ ○ ○ ○ ○ ○ ○ ○ ○ ○ ○ ○ ○ ○ ○ ○ ○ ○ ○ ○ ○ ○ ○ ○ ○ ○ ○ ○ ○ ○ ○ ○ ○ ○ ○ ○ ○ ○ ○ ○ ○ ○ ○ ○ ○ ○ ○ ○ ○ ○ ○ ○ ○ ○ ○ ○ ○ ○
a. AnganWadis 2 2 2
○ ○ ○ ○ ○ ○ ○ ○ ○ ○ ○ ○ ○ ○ ○ ○ ○ ○ ○ ○ ○ ○ ○ ○ ○ ○ ○ ○ ○ ○ ○ ○ ○ ○ ○ ○ ○ ○ ○ ○ ○ ○ ○ ○ ○ ○ ○ ○ ○ ○ ○ ○ ○ ○ ○ ○ ○ ○ ○ ○ ○
b. Common Gobar Gas Plant 13 14 12
○ ○ ○ ○ ○ ○ ○ ○ ○ ○ ○ ○ ○ ○ ○ ○ ○ ○ ○ ○ ○ ○ ○ ○ ○ ○ ○ ○ ○ ○ ○ ○ ○ ○ ○ ○ ○ ○ ○ ○ ○ ○ ○ ○ ○ ○ ○ ○ ○ ○ ○ ○ ○ ○ ○ ○ ○ ○ ○ ○ ○
c. Bridges, Roads and Culverts 4 12 7
○ ○ ○ ○ ○ ○ ○ ○ ○ ○ ○ ○ ○ ○ ○ ○ ○ ○ ○ ○ ○ ○ ○ ○ ○ ○ ○ ○ ○ ○ ○ ○ ○ ○ ○ ○ ○ ○ ○ ○ ○ ○ ○ ○ ○ ○ ○ ○ ○ ○ ○ ○ ○ ○ ○ ○ ○ ○ ○ ○ ○
d. Solar Street Light System 7 7 9
○ ○ ○ ○ ○ ○ ○ ○ ○ ○ ○ ○ ○ ○ ○ ○ ○ ○ ○ ○ ○ ○ ○ ○ ○ ○ ○ ○ ○ ○ ○ ○ ○ ○ ○ ○ ○ ○ ○ ○ ○ ○ ○ ○ ○ ○ ○ ○ ○ ○ ○ ○ ○ ○ ○ ○ ○ ○ ○ ○ ○
e. Lift Irrigation Systems 6 8 8
○ ○ ○ ○ ○ ○ ○ ○ ○ ○ ○ ○ ○ ○ ○ ○ ○ ○ ○ ○ ○ ○ ○ ○ ○ ○ ○ ○ ○ ○ ○ ○ ○ ○ ○ ○ ○ ○ ○ ○ ○ ○ ○ ○ ○ ○ ○ ○ ○ ○ ○ ○ ○ ○ ○ ○ ○ ○ ○ ○ ○
f. Drains and Gutters 5 6 3
○ ○ ○ ○ ○ ○ ○ ○ ○ ○ ○ ○ ○ ○ ○ ○ ○ ○ ○ ○ ○ ○ ○ ○ ○ ○ ○ ○ ○ ○ ○ ○ ○ ○ ○ ○ ○ ○ ○ ○ ○ ○ ○ ○ ○ ○ ○ ○ ○ ○ ○ ○ ○ ○ ○ ○ ○ ○ ○ ○ ○
g. Old Age Homes 10 5 10
○ ○ ○ ○ ○ ○ ○ ○ ○ ○ ○ ○ ○ ○ ○ ○ ○ ○ ○ ○ ○ ○ ○ ○ ○ ○ ○ ○ ○ ○ ○ ○ ○ ○ ○ ○ ○ ○ ○ ○ ○ ○ ○ ○ ○ ○ ○ ○ ○ ○ ○ ○ ○ ○ ○ ○ ○ ○ ○ ○ ○
h. Common Shelter for the Handicapped 8 3 6
○ ○ ○ ○ ○ ○ ○ ○ ○ ○ ○ ○ ○ ○ ○ ○ ○ ○ ○ ○ ○ ○ ○ ○ ○ ○ ○ ○ ○ ○ ○ ○ ○ ○ ○ ○ ○ ○ ○ ○ ○ ○ ○ ○ ○ ○ ○ ○ ○ ○ ○ ○ ○ ○ ○ ○ ○ ○ ○ ○ ○
i. Common Shelter during Natural Calamities 11 9 11
○ ○ ○ ○ ○ ○ ○ ○ ○ ○ ○ ○ ○ ○ ○ ○ ○ ○ ○ ○ ○ ○ ○ ○ ○ ○ ○ ○ ○ ○ ○ ○ ○ ○ ○ ○ ○ ○ ○ ○ ○ ○ ○ ○ ○ ○ ○ ○ ○ ○ ○ ○ ○ ○ ○ ○ ○ ○ ○ ○ ○
j. Common Pastures 1 10 1
○ ○ ○ ○ ○ ○ ○ ○ ○ ○ ○ ○ ○ ○ ○ ○ ○ ○ ○ ○ ○ ○ ○ ○ ○ ○ ○ ○ ○ ○ ○ ○ ○ ○ ○ ○ ○ ○ ○ ○ ○ ○ ○ ○ ○ ○ ○ ○ ○ ○ ○ ○ ○ ○ ○ ○ ○ ○ ○ ○ ○
k. Parks and Gardens 9 1 4
○ ○ ○ ○ ○ ○ ○ ○ ○ ○ ○ ○ ○ ○ ○ ○ ○ ○ ○ ○ ○ ○ ○ ○ ○ ○ ○ ○ ○ ○ ○ ○ ○ ○ ○ ○ ○ ○ ○ ○ ○ ○ ○ ○ ○ ○ ○ ○ ○ ○ ○ ○ ○ ○ ○ ○ ○ ○ ○ ○ ○
l. Residential Schools for Tribals and Harijans 12 15 13
○ ○ ○ ○ ○ ○ ○ ○ ○ ○ ○ ○ ○ ○ ○ ○ ○ ○ ○ ○ ○ ○ ○ ○ ○ ○ ○ ○ ○ ○ ○ ○ ○ ○ ○ ○ ○ ○ ○ ○ ○ ○ ○ ○ ○ ○ ○ ○ ○ ○ ○ ○ ○ ○ ○ ○ ○ ○ ○ ○ ○
m. Common Work shed for the artisans 15 13 15
○ ○ ○ ○ ○ ○ ○ ○ ○ ○ ○ ○ ○ ○ ○ ○ ○ ○ ○ ○ ○ ○ ○ ○ ○ ○ ○ ○ ○ ○ ○ ○ ○ ○ ○ ○ ○ ○ ○ ○ ○ ○ ○ ○ ○ ○ ○ ○ ○ ○ ○ ○ ○ ○ ○ ○ ○ ○ ○ ○ ○
n. Level crossing at unmanned railway Crossings 14 4 14
○ ○ ○ ○ ○ ○ ○ ○ ○ ○ ○ ○ ○ ○ ○ ○ ○ ○ ○ ○ ○ ○ ○ ○ ○ ○ ○ ○ ○ ○ ○ ○ ○ ○ ○ ○ ○ ○ ○ ○ ○ ○ ○ ○ ○ ○ ○ ○ ○ ○ ○ ○ ○ ○ ○ ○ ○ ○ ○ ○ ○
o. Computers in Schools and Colleges 3 11 5
p. Night Soil Disposal System 16 16 16

51
� In case of the female respondents, the top five ranked priorities are parks and gardens, Anganwadis,
common shelter for the handicapped, level crossing at unmanned level crossings and old age homes.
This sounds quite abnormal. The same woman, who cried for water, electricity, health services etc,
when she was asked to cite the major problems faced by her, now wants parks and gardens in top
priority when given an option to choose from the list. Such a response might have come not because
of the locally felt need but because of the campaign going on in the localities by different groups
which are not necessarily the poor and the marginalised sections.
� The overall perception on the priorities also shows the above-mentioned trend. While the highest
rank went for common pastures, followed by anganwadis drains and gutters, and parks; important
issues like irrigation systems, residential schools for tribals and harijans and night soil disposal systems
got lower ranks. Such peculiar characteristic of the behaviour of common people actually puts the
peoples’ representatives in a trade off between the commitment towards larger benefit of the society
and popular pursuits.
(j) Whether the Scheme should exist?
After all these analysis our next task was to ask the respondents a very simple but pertinent question that
whether the scheme should exist in its present form? The responses had three options to choose from.
(a) it should exist in its present form,
(b) should exist but modifications should be carried out and
(c) the scheme should be scrapped.
Our findings are depicted in Table -35, which
shows that very few respondents have opted for
the last option.
� 50 percent respondents in Alwar, all the
respondents in Bhopal, 40 percent in
Ghazipur, 20 percent in Hazaribagh, 61
percent in Jagatsinghpur, 65 percent in Kota
and 75 percent in Patan constituency said that
the scheme should exist in its present form.
� 70 percent respondents in Hazaribagh, 50
percent in Alwar, 15 percent in Ghazipur, 12.5
percent in Patan and around 7 percent each
in Jagatsinghpur and Kota constituencies
revealed that the scheme should exist but
modifications in the scheme is needed.
� 45 percent respondents in Ghazipur and around 31 percent in Jagatsinghpur constituencies said that
the scheme should be scrapped. In all other constituencies a very few respondents gave such negative
remark.
� In total, around 82 percent respondents said that the scheme should either exist as it is or with
modifications and only 18 percent said that the scheme should be scrapped.
The mandate is clear. People do expect benefits from the scheme and want their local problems to be addressed
through the scheme. Since in other schemes, there is a lack of local perspectives it is necessary that a scheme
like MPLADS should exist until some alternative form of asset creation is evolved. The point however is to
make the scheme more vibrant and effective so that the developmental goals set through the scheme can be
achieved. In the following section, which is based on our interviews with some experts, government officials,
elected representatives, implementing agencies and some members of parliament, we have suggested some
guidelines for an effective MPLADS.
Table - 35
Perception Regarding Whether the
Scheme should exist
Constituency Yes, Should exist Should
Should with be
Exist modifications scrapped
○ ○ ○ ○ ○ ○ ○ ○ ○ ○ ○ ○ ○ ○ ○ ○ ○ ○ ○ ○ ○ ○ ○ ○ ○ ○ ○ ○ ○ ○
Alwar 50.0 50.0 0.0
○ ○ ○ ○ ○ ○ ○ ○ ○ ○ ○ ○ ○ ○ ○ ○ ○ ○ ○ ○ ○ ○ ○ ○ ○ ○ ○ ○ ○ ○
Bhopal 100.0 0.0 0.0
○ ○ ○ ○ ○ ○ ○ ○ ○ ○ ○ ○ ○ ○ ○ ○ ○ ○ ○ ○ ○ ○ ○ ○ ○ ○ ○ ○ ○ ○
Ghazipur 40.0 15.0 45.0
○ ○ ○ ○ ○ ○ ○ ○ ○ ○ ○ ○ ○ ○ ○ ○ ○ ○ ○ ○ ○ ○ ○ ○ ○ ○ ○ ○ ○ ○
Hazaribagh 20.0 70.0 10.0
○ ○ ○ ○ ○ ○ ○ ○ ○ ○ ○ ○ ○ ○ ○ ○ ○ ○ ○ ○ ○ ○ ○ ○ ○ ○ ○ ○ ○ ○
Jagatsinghpur 61.5 7.7 30.8
○ ○ ○ ○ ○ ○ ○ ○ ○ ○ ○ ○ ○ ○ ○ ○ ○ ○ ○ ○ ○ ○ ○ ○ ○ ○ ○ ○ ○ ○
Kota 65.5 6.9 27.6
Patan 75.0 12.5 12.5
TOTAL 58.9 23.2 18.0

52
The most crucial part of this study is to provide a set of guidelines so that the scheme may achieve the needful
goals. A number of studies on the scheme have been conducted to formulate different mechanisms for its
effective utilisation. The report by CAG (2001) have even summarised that the scheme in its present form has
hardly served its main objectives. The Audit findings suggested that besides the fact that a significant proportion
of released money remained unspent, the works that were carried out in a large number of cases did not qualify
for the definition of durable assets, a large number of them remained incomplete, several others were either
inadmissible or were not even recommended by the MPs and were arbitrarily taken up by the District Heads.
The report of the evaluation committee of the Planning Commission have made several recommendations like
making the funds lapsable, involving local bodies like PRIs in the execution and monitoring of the scheme,
raising funds for maintenance through user charges and creating awareness on the scheme among the common
people. In this chapter of the study, we have tried to analyse all such suggestions and provide alternatives
keeping the perception of the common people in the background. It may however be emphasised that the
knowledge of the common people on the scheme is very limited and their perception about the usefulness and
drawbacks of the scheme can not be used as the sole yardstick to infer the overall performance of the scheme.
Therefore we met various experts in the field of public expenditure, analysing the recommendations and suggestions
made by them on the scheme through articles and news items in media, interacting with MPs and other elected
representatives directly to assess their perception on the scheme and seeking suggestions from a number of
government officials as well as implementing agencies for the improvement. We have tried to provide a set of
alternatives for the existing form of MPLADS, so as to make it more approachable and comprehensive for the
development needs of our country.
Since a proportionately large number of our respondents wanted that such a scheme should be there to cater
the locally felt needs of the common people, we at present are not in favour of suggesting the closure of the
scheme. Rather, we are interested in finding out solutions to those inherent problems as observed by us and
cited by others on the basis of both primary and secondary information available.
5.1 At the Level of Administration
� At the level of administration, one of the major problems cited by different quarters is the absence of
accounting controls. Since the Central Government transfers the non-lapsable funds directly to the District
Heads, the usual checks and balances do not apply in the administration of the scheme. When CAG first
pointed out this problem in 1998, the Ministry of Statistics and Programme Implementation constituted an
interdepartmental committee in 2000 for the purpose. But since the accounting rules were not finalised by
the CGA, poor financial administration continued to remain. However, even with the rules specified the
problem might not disappear if the same procedure of sending money directly to the DCs remains. The
MPs do not see administration a problem as far as finances are concerned. More or less they are happy
with the Ministry (see Boxes). Rather their problems are with the specified rules made by different state
government in administering the sanction of projects. For example in Kerala, each and every project,
which costs more that Rs. 15 Lakhs, need to get technical sanction from the state capital. The district
authorities cannot give technical sanction for such projects. There is mo point in having different bodies at
different levels for a single project. It is therefore suggested that some mechanism should be evolved so
that starting from financial sanction to the administration of technical sanction can be done at one place.
This will not only ensure administrative control over accounts but shall also lead to speedy implementation
of the projects.
� There should be consistency in the provisions. Contradictory provisions will not only lead to ambiguity
Guidelines For an Effective MPLADS5

53
in understanding but shall also result in mismanagement of the scheme. The 2001 report by CAG highlighted
a very crucial point regarding the release of funds. At one hand, the guidelines provided that the release of
funds will be made with reference to the actual progress achieved in expenditure as well as execution of
works, and thereby linking the release of funds to actual progress. On the other hand, the same guidelines
provided that the quarterly limit of Rs, 50 lakh instalment per MP would be released once the balance
amount with the DC comes to less than Rs. 50 lakh thereby linking it to the cost of all works sanctioned.
Such ambiguity might have been a major factor in accumulation of huge unspent balance with the DCs.
There are several other contradictory provisions also, for example, though the guidelines do not permit
expenditures of revenue type, the Committee on MPLADS have permitted to purchase books for distribution
in the libraries (See Chapter-2). Though there is no provision for executing repair and maintenance of
assets, permissions are given for the purpose in the name of improvement of assets. In fact, there is no
harm in spending for maintenance and repair of some existing asset, which can provide more services with
small additional investment rather than spending money in creating substandard new asset. The guidelines
should provide scopes in this direction.
� The Ministry should insist on obtaining utilisation certificates for the previous release before releasing
next instalment. This may act as an essential check on the flawed financial administration of the scheme
and can ensure fruitful end use of funds released. Similarly, prompt action should be taken against District
Collectors who fail to obtain utilisation certificates, mis-report to the Ministry on financial progress of works
by inflating expenditures by reckoning the amount released to the implementing agencies as the final
expenditures. Such actions will act as a deterrent against providing wrong information.
� The report by CAG (2001) shed concern over clubbing MPLADS funds with the funds of other
schemes. On different occasions, it has been shared with EAS, MNP, MWS, Social Welfare Department of
State Government, DRDA, JRY and MLALADS. The report states that in 18 constituencies of 10 different
states, works to the tune of Rs 635.39 lakh were done of which Rs. 321.15 lakhs were shared from
MPLADS. The guidelines prescribes that the funds can not be spent for other schemes except for partially
meeting the cost of a larger work only in case where it results in completion of the work and the part of
work requiring such resource application is clearly identifiable. A point to be noted here is that for better
utilisation of the scheme there should be no barrier in spending for part works and clubbing funds of
MPLADS with other schemes. During our field visits, we witnessed several cases in Kota constituency of
Rajasthan where assets were built by clubbing the funds with Calamity Relief Fund. There is no harm if in
a particular project meant for calamity preparedness is constructed from MPLADS funds and the labour/
salary component of the project comes from CRF or any other scheme. This may provide enough funds to
create durable assets without compromising with quality.
5.2 At the level of Selection of Projects
� One of the major problems faced by MPs is the selection of works and assessing their usefulness/
costs. MPs receive a number of memorandums and petitions from the common people, groups, village
panchayats etc, during their visits in the constituencies. Some MPs also take the trouble of assessing the
usefulness and cost of the projects requested in those petitions through their own party machinery. But there
is no precise machinery provided under the scheme to gather correct information on different aspects of locally
felt needs. A provision for undertaking research on the need of the project and cost calculation should be
there for the MP to have better judgement on selection of works. The MP must have a list of works to be
undertaken with all financial and technical details much before s/he actually recommends works to the DC.
� The evaluation study by Planning Commission found that there are quite a few districts where several
MPs have recommended works in addition to the original MP leading to a disproportionately larger
amount of money flowing into these districts out of MPLADS, a disproportionate increase in the workload
for the collector and a weak monitoring system. In addition, many of these districts are not among the less
developed and most of the works suggested are not targeted towards poorest of the poor sections of the
society. The study recommended for greater co-ordination between the MPs of a state and the nodal
agencies to check this problem. Our observations, however, reveal that the solution is not in a proper

54
coordination alone but in a proper arrangement for making the relevant information available to the MPs.
Most MPs quite obviously, keeping in mind their commitments towards legislature, do not have full
information even about the works they themselves recommend. There is a need to have proper research at
the district/ constituency level on the pattern of expenditure through MPLADS and this research should be
the information base for all the MPs interested in that district. The money needed for such research should
also be provided from MPLADS and some specific proportion; say 0.5 percent, of the annual entitlement
of an MP can be made available to undertake such research in each constituency.
� Our observation of the secondary information reveal that in most of the constituencies, roads and bridges
as well as general construction occupied the lion’s share of the total expenditure under MPLADS.
Regarding such nature and pattern of expenditure, the Planning Commission also revealed that during
1993-99, works classified under roads and bridges and community works dominated constituting 29 and
24 percent respectively of the total works recommended and sanctioned. Again, around 8.5 percent of
the works were not found to be in use for the intended purpose. Such concentration of works in specific
uses and indiscriminate building of assets which turn useless after a point of time can be effectively
checked if a proper information network can be built through grass root level research (as mentioned
above) on the actual locally felt needs of the constituencies. As mentioned by the Planning Commission,
the PRIs may also be asked to provide a list of works to be recommended by the MP. With such a list
in hand, it will be easier for the MP to prioritise locally felt needs of various groups of people in order
of significance.
� Constitution of a research/information unit at the grass root level will also help in addressing some of the
main problems associated with MPLADS in our sample constituencies. For example, the problem of
controversial projects can be overcome through this effort.
5.3 At the level of Execution and Monitoring of the Scheme
� The Evaluation Report of the Planning Commission concerns over the issue of engaging private contractors
for execution of the projects as it is not permissible under MPLADS. The report through a perception
survey observed that around 46 percent of development functionaries surveyed conceded the use of private
contractors. During our field survey we found the reasons for this. The fact that in different projects the
actual money sanctioned and the nature of work is small and that in case of Government agencies like
PWD (where per hour running cost of huge dredgers and cranes is more than Rs. 1000/-) necessary
infrastructure for small works are lacking, the district authorities could not help using private contractors.
MP Prof. A. K. Premajam in an interview with our research staff revealed that the use of private contractors
is unavoidable. However, steps should be taken to ensure accountability and a proper monitoring system
(See Box). The report of CAG highlighted that in many cases where works were abandoned the contractors
and implementing agencies did not refund the sanctioned amount. Such problems arise only because the
guidelines are strict on not using private contractors. Since it is not permitted, the DCs cannot officially
show that private contractors are used and therefore the implementing agency does not have accountability
over the money or the quality of the works. The provisions should be made flexible to include private
contractors in case of need and stringent action should be taken in case of anomalies. As rightly suggested
by Prof. Premajam (See Box), efforts should be made to hand over execution of works to such agencies
that are true representatives of the beneficiaries. There are organisations like Oralingal Labour Contract
Cooperative Society in Kerala, which is being managed by construction labourers themselves and have a
credibility of almost 75 years of existence. Such societies can be considered as implementing agencies to
ensure better quality of works. The engagement of private contractors cannot be eliminated completely. But
a beneficiary monitoring committee can be constructed to have a check on the misuse of funds so that
there will be less scope for corruption. Prof. Premajam opines that as far as possible, the actual execution
of the works should be handed over to those committees instead of engaging private contractors.
� In a number of cases, works were either abandoned or left incomplete midway due to dispute over
title of land, insufficient provision of funds, objections raised by local people / government department or
unsatisfactory progress. Such things happen only due to lack of information about the feasibility of the

55
projects. With a kind of research at the constituency level (as discussed earlier), such anomalies can be
prevented.
� Probably, one of the major reasons behind low quality of assets created under MPLADS is the lack of a
proper monitoring system. The MP should do random and surprise visits to the work places personally
while construction is going on. This should be made mandatory as this not only builds a pressure on the
executing agencies but also provides a forum to the common beneficiaries to open up their reservations
regarding the work under construction. However, the constituency travel allowance of Rs. 8000/- per annum
which is given to the MPs (not from the MPLADS) is not at all sufficient for them to personally visit the
worksites to ensure better monitoring of the works. Though there is a provision of vehicle exclusively for
monitoring MPLAD works, in many constituencies, the DCs do not make them available for the member.
The recommendation of the MPLADS Committee on purchasing a vehicle with the interest accrued from
MPLADS funds should be implemented as soon as possible in all the constituencies in order to facilitate
the MPs travel the worksites for monitoring the progress of works recommended by them.
� One of the major reasons behind the failure of all plans in India is the failure to involve the common
people who are the real stakeholders. In case of MPLADS, which has been instituted to cater the locally
felt needs, common people should be taken into confidence regarding monitoring and supervision of the
cases. Once a work is executed, it should be entrusted with the beneficiaries. If the case is genuine and
number of potential beneficiaries is large enough, the problems of maintenance will be less. After all the
assets created under MPLADS are public goods and the people themselves are probably the best caretakers
than any NGO or private interest group.
In the present chapter we have tried to evolve a set of mechanisms for the effective implementation of MPLADS.
However, some of these have already been recommended by the MPLADS committees in several instances, a
need is there to implement these recommendation through a sincere effort for making the scheme both a
popular as well as effective government programme to cater the locally felt needs of the common citizens.

56
Deccan Herald News Service, Action against officials blocking MPLADS funds promised, NEW DELHI, Dec 20
Government of India, Guidelines on Member of Parliament Local Area Development Scheme, Ministry of Planning &
Programme Implementation April, 2002
http://cag.nic.in/reports/jk/rep_2000/civil_overview.pdf
http://ideas.repec.org/p/wpa/wuwphe/0305001.html
http://rajyasabha.nic.in/admreport/2001/mplads.htm
http://www.indian-express.com/ie20010419/nat17.html)
Planning Commission (2000) Evaluation Report on Member of Parliament Local Area Development Scheme,Executive
Summary,
http://planningcommission.nic.in/reports/peoreport/peo/peo_mpladexe.pdf
Prem (2001), “Wastage by our Representatives”, The Indian Express, April –19
Report of the Comptroller and Auditor General of India, Members of Parliament Local Area Development Scheme, 1998
Report of the Comptroller and Auditor General of India, Members of Parliament Local Area Development Scheme, 2001
Reports of the MPLADS Committee, Lok Sabha
Reports of the MPLADS Committee, Rajya Sabha
Sezhiyan Era (2002), “Development Directions”, Frontline, Vol-19, Issue -05, March 02-15
Sezhiyan Era, Working of the MPLADS The Hindu, Online edition of India’s National Newspaper, Thursday, Apr 24, 2003
Sharma, Ashok B, (2001), “CAG Reports Improper Use of MPs’ Fund for Rural Development”, The Financial Express, May,
2003
Viz Bhavana (1998), “In MPs’ Dictionary, Development Means Building Temples”, The Indian Express, July 20
Vyas Neena (2003), “A Fund for the Needy… or the Greedy”, The Hindu, March 16, 2003
R eferences

57
All the appendices given below are the questionnaire used for the collection of primary data in the fields. These
may be used as advocacy tools for the CSOs engaged in field based research.
APPENDIX-I
Questionnaire for Beneficiaries
Schedule No :
State :
District :
Constituency :
IDENTIFICATION PARTICULARS
Name of the Respondent :
Age : Sex : Caste/ Religion :
Educational Qualification:
Address:
Part-A
1. Have you ever heard about MPLADS? Yes No
2. Do you think that expenditure by the government is of any significance to meet the needs of
common people, in terms of
a) Providing Employment Opportunities
b) Providing Infrastructural Facilities
(Such as Schools, Hospitals, Roads etc.)
Code: Significant –1, Marginal –2, Insignificant –3
Why do you think so?
3. Do you think that the expenditure incurred under MPLADS is going to benefit common people?
Yes No
Please elaborate your answer.
4. Do you know about the works that can be undertaken under this scheme? Yes No
If Yes, Please list a few.
A ppendices

58
5. Please mention some of the works that have been undertaken under the scheme in your
locality.
6. What are the most pressing problems faced by the common people in your locality?
7. Do you think that these works conform to the needs of common people? Yes No
8. What in your perception were the shortcomings of the works taken under the scheme beginning
from their selection to their final execution?
(a) The scheme selection was controversial.
(b) Inordinate delay in completion
(c) Employment register was manipulated
(d) Less than minimum wages were paid
(e) Any other. (Please Specify)
9. Do you think that the quality of assets created under the MPLADS in your locality is
(a) Excellent (b) Good (c) Bad (d) Very Bad
10. Who do you think takes decisions regarding works to be undertaken under the MPLADS?
(a) MP takes decisions arbitrarily
(b) MP takes decisions on popular demand
(c) MP takes decisions under the influence of pressure groups (Specify)
(d) Any other factor. (Specify)
11. Are you satisfied with the role played by following people for the implementation of works
under MPLADS?
(a) MP Yes No
(b) District Collector Yes No
(c) Implementing Agency (Specify) Yes No
Please justify your answers.
12. Do you believe that a scheme like MPLADS should at all exist?
(a) Yes (b) No (c) Yes, but with modifications (Please Suggest modifications)

59
Part–B
1. Availability of Public Amenities
Items Density in Nearest Time taken Whether Govt./
1 KM Radius Distance to Commute Pvt./Aided
○ ○ ○ ○ ○ ○ ○ ○ ○ ○ ○ ○ ○ ○ ○ ○ ○ ○ ○ ○ ○ ○ ○ ○ ○ ○ ○ ○ ○ ○ ○ ○ ○ ○ ○ ○ ○ ○ ○ ○ ○ ○ ○ ○ ○ ○ ○ ○ ○ ○ ○ ○ ○ ○ ○ ○ ○ ○
Primary School
○ ○ ○ ○ ○ ○ ○ ○ ○ ○ ○ ○ ○ ○ ○ ○ ○ ○ ○ ○ ○ ○ ○ ○ ○ ○ ○ ○ ○ ○ ○ ○ ○ ○ ○ ○ ○ ○ ○ ○ ○ ○ ○ ○ ○ ○ ○ ○ ○ ○ ○ ○ ○ ○ ○ ○ ○ ○
M.E. School
○ ○ ○ ○ ○ ○ ○ ○ ○ ○ ○ ○ ○ ○ ○ ○ ○ ○ ○ ○ ○ ○ ○ ○ ○ ○ ○ ○ ○ ○ ○ ○ ○ ○ ○ ○ ○ ○ ○ ○ ○ ○ ○ ○ ○ ○ ○ ○ ○ ○ ○ ○ ○ ○ ○ ○ ○ ○
High School
○ ○ ○ ○ ○ ○ ○ ○ ○ ○ ○ ○ ○ ○ ○ ○ ○ ○ ○ ○ ○ ○ ○ ○ ○ ○ ○ ○ ○ ○ ○ ○ ○ ○ ○ ○ ○ ○ ○ ○ ○ ○ ○ ○ ○ ○ ○ ○ ○ ○ ○ ○ ○ ○ ○ ○ ○ ○
Girls’ School
○ ○ ○ ○ ○ ○ ○ ○ ○ ○ ○ ○ ○ ○ ○ ○ ○ ○ ○ ○ ○ ○ ○ ○ ○ ○ ○ ○ ○ ○ ○ ○ ○ ○ ○ ○ ○ ○ ○ ○ ○ ○ ○ ○ ○ ○ ○ ○ ○ ○ ○ ○ ○ ○ ○ ○ ○ ○
Community Schools
○ ○ ○ ○ ○ ○ ○ ○ ○ ○ ○ ○ ○ ○ ○ ○ ○ ○ ○ ○ ○ ○ ○ ○ ○ ○ ○ ○ ○ ○ ○ ○ ○ ○ ○ ○ ○ ○ ○ ○ ○ ○ ○ ○ ○ ○ ○ ○ ○ ○ ○ ○ ○ ○ ○ ○ ○ ○
Public Libraries
○ ○ ○ ○ ○ ○ ○ ○ ○ ○ ○ ○ ○ ○ ○ ○ ○ ○ ○ ○ ○ ○ ○ ○ ○ ○ ○ ○ ○ ○ ○ ○ ○ ○ ○ ○ ○ ○ ○ ○ ○ ○ ○ ○ ○ ○ ○ ○ ○ ○ ○ ○ ○ ○ ○ ○ ○ ○
Sports Complexes
○ ○ ○ ○ ○ ○ ○ ○ ○ ○ ○ ○ ○ ○ ○ ○ ○ ○ ○ ○ ○ ○ ○ ○ ○ ○ ○ ○ ○ ○ ○ ○ ○ ○ ○ ○ ○ ○ ○ ○ ○ ○ ○ ○ ○ ○ ○ ○ ○ ○ ○ ○ ○ ○ ○ ○ ○ ○
Primary Health Centre
○ ○ ○ ○ ○ ○ ○ ○ ○ ○ ○ ○ ○ ○ ○ ○ ○ ○ ○ ○ ○ ○ ○ ○ ○ ○ ○ ○ ○ ○ ○ ○ ○ ○ ○ ○ ○ ○ ○ ○ ○ ○ ○ ○ ○ ○ ○ ○ ○ ○ ○ ○ ○ ○ ○ ○ ○ ○
Hospitals
○ ○ ○ ○ ○ ○ ○ ○ ○ ○ ○ ○ ○ ○ ○ ○ ○ ○ ○ ○ ○ ○ ○ ○ ○ ○ ○ ○ ○ ○ ○ ○ ○ ○ ○ ○ ○ ○ ○ ○ ○ ○ ○ ○ ○ ○ ○ ○ ○ ○ ○ ○ ○ ○ ○ ○ ○ ○
Diagnostic Facilities like X-ray
○ ○ ○ ○ ○ ○ ○ ○ ○ ○ ○ ○ ○ ○ ○ ○ ○ ○ ○ ○ ○ ○ ○ ○ ○ ○ ○ ○ ○ ○ ○ ○ ○ ○ ○ ○ ○ ○ ○ ○ ○ ○ ○ ○ ○ ○ ○ ○ ○ ○ ○ ○ ○ ○ ○ ○ ○ ○
Wells
○ ○ ○ ○ ○ ○ ○ ○ ○ ○ ○ ○ ○ ○ ○ ○ ○ ○ ○ ○ ○ ○ ○ ○ ○ ○ ○ ○ ○ ○ ○ ○ ○ ○ ○ ○ ○ ○ ○ ○ ○ ○ ○ ○ ○ ○ ○ ○ ○ ○ ○ ○ ○ ○ ○ ○ ○ ○
Tubewells
○ ○ ○ ○ ○ ○ ○ ○ ○ ○ ○ ○ ○ ○ ○ ○ ○ ○ ○ ○ ○ ○ ○ ○ ○ ○ ○ ○ ○ ○ ○ ○ ○ ○ ○ ○ ○ ○ ○ ○ ○ ○ ○ ○ ○ ○ ○ ○ ○ ○ ○ ○ ○ ○ ○ ○ ○ ○
Municipality Tap
○ ○ ○ ○ ○ ○ ○ ○ ○ ○ ○ ○ ○ ○ ○ ○ ○ ○ ○ ○ ○ ○ ○ ○ ○ ○ ○ ○ ○ ○ ○ ○ ○ ○ ○ ○ ○ ○ ○ ○ ○ ○ ○ ○ ○ ○ ○ ○ ○ ○ ○ ○ ○ ○ ○ ○ ○ ○
Public Toilet
○ ○ ○ ○ ○ ○ ○ ○ ○ ○ ○ ○ ○ ○ ○ ○ ○ ○ ○ ○ ○ ○ ○ ○ ○ ○ ○ ○ ○ ○ ○ ○ ○ ○ ○ ○ ○ ○ ○ ○ ○ ○ ○ ○ ○ ○ ○ ○ ○ ○ ○ ○ ○ ○ ○ ○ ○ ○
Veterinary Hospital
○ ○ ○ ○ ○ ○ ○ ○ ○ ○ ○ ○ ○ ○ ○ ○ ○ ○ ○ ○ ○ ○ ○ ○ ○ ○ ○ ○ ○ ○ ○ ○ ○ ○ ○ ○ ○ ○ ○ ○ ○ ○ ○ ○ ○ ○ ○ ○ ○ ○ ○ ○ ○ ○ ○ ○ ○ ○
Artificial Insemination Centre
○ ○ ○ ○ ○ ○ ○ ○ ○ ○ ○ ○ ○ ○ ○ ○ ○ ○ ○ ○ ○ ○ ○ ○ ○ ○ ○ ○ ○ ○ ○ ○ ○ ○ ○ ○ ○ ○ ○ ○ ○ ○ ○ ○ ○ ○ ○ ○ ○ ○ ○ ○ ○ ○ ○ ○ ○ ○
Breeding Centre
○ ○ ○ ○ ○ ○ ○ ○ ○ ○ ○ ○ ○ ○ ○ ○ ○ ○ ○ ○ ○ ○ ○ ○ ○ ○ ○ ○ ○ ○ ○ ○ ○ ○ ○ ○ ○ ○ ○ ○ ○ ○ ○ ○ ○ ○ ○ ○ ○ ○ ○ ○ ○ ○ ○ ○ ○ ○
Bus Stop
Creche
1. During summer, do water tankers provide drinking water?
If yes, how frequently?
2. What is the quality of public drainage system in this locality?
3. Is there a provision of ambulance for common people?
4. Is there a proper crematorium/burial ground in this locality? How far is it from your
residence?
5. Is there a mobile dispensary in your locality? How often does it come?
6. Is there an all-season road connecting your village?
7. What is the most common transport system for passengers and goods?
8. What are the modes of irrigation most commonly used in your village? Are they affordable
for common farmer?
9. Is there equal access to irrigation water? If not, Why?
10. Is there a common motor boat (Owned by Panchayat or any other public body) to tackle
the situations like flood and cyclone?
11. What other amenities are required urgently in this locality? Please rank in order of urgency
(a) Anganwadis
(b) Common Gobar Gas Plants

60
(c) Bridges, roads and culverts
(d) Solar street light systems
(e) Lift irrigation systems
(f) Drains and gutters
(g) Old age homes
(h) Common shelters for the handicapped
(i) Common shelters during natural calamities
(j) Common pastures
(k) Parks and gardens
(l) Residential schools for tribals and harijans
(m) Common work-sheds for artisans
(n) Level crossing at unmanned railway crossing
(o) Computers in schools and colleges
(p) Night soil disposal system for local bodies.
Name of the Investigator :

61
APPENDIX-II
Questionnaire for Government Officials
Name of the Officer :
Post Held :
District /Locality :
1. Please mention in what ways are you associated with the MPLADS.
2. Do you think that a scheme like MPLADS benefits common people?
3. Please mention the works undertaken under MPLADS in your locality in past few years.
4. Do you think that guidelines have been properly followed at every stage from the recommendation of
works by the MP to their final execution by the implementing agency?
5. What are the various problems you have identified in (a) formulation of the scheme and (b) its
implementation?
6. How, in your opinion, are decisions regarding specific projects to be undertaken in MPLADS made?
7. Do you think that the above-mentioned process is democratic enough? If not, what measures do you
suggest to make it more democratic?
Date of Interview :
Name of the investigator :
APPENDIX-III
Questionnaire for Elected Representatives
Name of the Representative :
Post Held :
Political Party :
District /Constituency/Locality/Village :
1. What steps have you taken to monitor the works undertaken in MPLADS?
2. Do you think that a scheme like MPLADS benefits common people?
3. Please mention the works undertaken under MPLADS in your locality in past few years.
4. Do you think that guidelines have been properly followed at every stage from the recommendation of
works by the MP to their final execution by the implementing agency?
5. What are the various problems you have identified in (a) formulation of the scheme and (b) its
implementation?
6. How, in your opinion, are decisions regarding specific projects to be undertaken in MPLADS made?
7. Do you think that the above-mentioned process is democratic enough? If not, what measures do you
suggest to make it more democratic?
Date of Interview :
Name of the investigator :

62
APPENDIX-IV
Questionnaire for Implementing Agency
Name of the Agency :
Type of the Agency :
Works Undertaken :
District /Constituency/Locality/Village :
Name of the Respondent :
Designation :
1. Describe the process through which your organisation got the responsibility of implementing the
aforementioned scheme?
2. Did you get adequate funds for the implementation of the project?
3. Was there any inordinate delay in the sanction of funds?
4. How many times did the DC and MP visit the site?
5. Do you think that a scheme like MPLADS benefits common people?
6. Do you think that guidelines have been properly followed at every stage from the recommendation of
works by the MP to their final execution by the implementing agency?
7. What are the various problems you have identified in (a) formulation of the scheme and (b) its
implementation?
8. What solutions do you suggest for the above mentioned problems?
Date of Interview :
Name of the investigator :

53
Annexure-1State wise Release of Funds/Expenditure of Members of Parliament as on 30/01/2004
No. Name of Released by Amount % Sanctioned Expenditure % UtilisationState/UT G.O.I. Sanctioned Over Released Incurred Over Released
○ ○ ○ ○ ○ ○ ○ ○ ○ ○ ○ ○ ○ ○ ○ ○ ○ ○ ○ ○ ○ ○ ○ ○ ○ ○ ○ ○ ○ ○ ○ ○ ○ ○ ○ ○ ○ ○ ○ ○ ○ ○ ○ ○ ○ ○ ○ ○ ○ ○ ○ ○ ○ ○ ○ ○ ○ ○ ○ ○ ○
1 Nominated 158.00 148.33 93.88 120.39 76.19
○ ○ ○ ○ ○ ○ ○ ○ ○ ○ ○ ○ ○ ○ ○ ○ ○ ○ ○ ○ ○ ○ ○ ○ ○ ○ ○ ○ ○ ○ ○ ○ ○ ○ ○ ○ ○ ○ ○ ○ ○ ○ ○ ○ ○ ○ ○ ○ ○ ○ ○ ○ ○ ○ ○ ○ ○ ○ ○ ○ ○
2 Andhra Pradesh 945.95 929.52 98.26 776.12 82.05
○ ○ ○ ○ ○ ○ ○ ○ ○ ○ ○ ○ ○ ○ ○ ○ ○ ○ ○ ○ ○ ○ ○ ○ ○ ○ ○ ○ ○ ○ ○ ○ ○ ○ ○ ○ ○ ○ ○ ○ ○ ○ ○ ○ ○ ○ ○ ○ ○ ○ ○ ○ ○ ○ ○ ○ ○ ○ ○ ○ ○
3 Arunachal Pr. 48.15 48.42 100.56 45.79 95.09
○ ○ ○ ○ ○ ○ ○ ○ ○ ○ ○ ○ ○ ○ ○ ○ ○ ○ ○ ○ ○ ○ ○ ○ ○ ○ ○ ○ ○ ○ ○ ○ ○ ○ ○ ○ ○ ○ ○ ○ ○ ○ ○ ○ ○ ○ ○ ○ ○ ○ ○ ○ ○ ○ ○ ○ ○ ○ ○ ○ ○
4 Assam 330.55 310.95 94.07 279.66 84.60
○ ○ ○ ○ ○ ○ ○ ○ ○ ○ ○ ○ ○ ○ ○ ○ ○ ○ ○ ○ ○ ○ ○ ○ ○ ○ ○ ○ ○ ○ ○ ○ ○ ○ ○ ○ ○ ○ ○ ○ ○ ○ ○ ○ ○ ○ ○ ○ ○ ○ ○ ○ ○ ○ ○ ○ ○ ○ ○ ○ ○
5 Bihar 877.85 840.71 95.77 704.41 80.24
○ ○ ○ ○ ○ ○ ○ ○ ○ ○ ○ ○ ○ ○ ○ ○ ○ ○ ○ ○ ○ ○ ○ ○ ○ ○ ○ ○ ○ ○ ○ ○ ○ ○ ○ ○ ○ ○ ○ ○ ○ ○ ○ ○ ○ ○ ○ ○ ○ ○ ○ ○ ○ ○ ○ ○ ○ ○ ○ ○ ○
6 Goa 44.15 42.77 96.87 32.57 73.78
○ ○ ○ ○ ○ ○ ○ ○ ○ ○ ○ ○ ○ ○ ○ ○ ○ ○ ○ ○ ○ ○ ○ ○ ○ ○ ○ ○ ○ ○ ○ ○ ○ ○ ○ ○ ○ ○ ○ ○ ○ ○ ○ ○ ○ ○ ○ ○ ○ ○ ○ ○ ○ ○ ○ ○ ○ ○ ○ ○ ○
7 Gujarat 566.35 535.40 94.54 436.23 77.03
○ ○ ○ ○ ○ ○ ○ ○ ○ ○ ○ ○ ○ ○ ○ ○ ○ ○ ○ ○ ○ ○ ○ ○ ○ ○ ○ ○ ○ ○ ○ ○ ○ ○ ○ ○ ○ ○ ○ ○ ○ ○ ○ ○ ○ ○ ○ ○ ○ ○ ○ ○ ○ ○ ○ ○ ○ ○ ○ ○ ○
8 Haryana 235.25 225.43 95.82 208.32 88.55
○ ○ ○ ○ ○ ○ ○ ○ ○ ○ ○ ○ ○ ○ ○ ○ ○ ○ ○ ○ ○ ○ ○ ○ ○ ○ ○ ○ ○ ○ ○ ○ ○ ○ ○ ○ ○ ○ ○ ○ ○ ○ ○ ○ ○ ○ ○ ○ ○ ○ ○ ○ ○ ○ ○ ○ ○ ○ ○ ○ ○
9 Himachal Pr. 104.35 97.98 93.90 91.46 87.65
○ ○ ○ ○ ○ ○ ○ ○ ○ ○ ○ ○ ○ ○ ○ ○ ○ ○ ○ ○ ○ ○ ○ ○ ○ ○ ○ ○ ○ ○ ○ ○ ○ ○ ○ ○ ○ ○ ○ ○ ○ ○ ○ ○ ○ ○ ○ ○ ○ ○ ○ ○ ○ ○ ○ ○ ○ ○ ○ ○ ○
10 J & K 127.50 122.72 96.25 86.53 67.87
○ ○ ○ ○ ○ ○ ○ ○ ○ ○ ○ ○ ○ ○ ○ ○ ○ ○ ○ ○ ○ ○ ○ ○ ○ ○ ○ ○ ○ ○ ○ ○ ○ ○ ○ ○ ○ ○ ○ ○ ○ ○ ○ ○ ○ ○ ○ ○ ○ ○ ○ ○ ○ ○ ○ ○ ○ ○ ○ ○ ○
11 Karnataka 623.00 607.94 97.58 549.07 88.13
○ ○ ○ ○ ○ ○ ○ ○ ○ ○ ○ ○ ○ ○ ○ ○ ○ ○ ○ ○ ○ ○ ○ ○ ○ ○ ○ ○ ○ ○ ○ ○ ○ ○ ○ ○ ○ ○ ○ ○ ○ ○ ○ ○ ○ ○ ○ ○ ○ ○ ○ ○ ○ ○ ○ ○ ○ ○ ○ ○ ○
12 Kerala 451.95 438.39 97.00 325.23 71.96
○ ○ ○ ○ ○ ○ ○ ○ ○ ○ ○ ○ ○ ○ ○ ○ ○ ○ ○ ○ ○ ○ ○ ○ ○ ○ ○ ○ ○ ○ ○ ○ ○ ○ ○ ○ ○ ○ ○ ○ ○ ○ ○ ○ ○ ○ ○ ○ ○ ○ ○ ○ ○ ○ ○ ○ ○ ○ ○ ○ ○
13 Madhya Pradesh 639.60 621.84 97.22 548.94 85.83
○ ○ ○ ○ ○ ○ ○ ○ ○ ○ ○ ○ ○ ○ ○ ○ ○ ○ ○ ○ ○ ○ ○ ○ ○ ○ ○ ○ ○ ○ ○ ○ ○ ○ ○ ○ ○ ○ ○ ○ ○ ○ ○ ○ ○ ○ ○ ○ ○ ○ ○ ○ ○ ○ ○ ○ ○ ○ ○ ○ ○
14 Maharashtra 1021.75 1010.50 98.90 803.49 78.64
○ ○ ○ ○ ○ ○ ○ ○ ○ ○ ○ ○ ○ ○ ○ ○ ○ ○ ○ ○ ○ ○ ○ ○ ○ ○ ○ ○ ○ ○ ○ ○ ○ ○ ○ ○ ○ ○ ○ ○ ○ ○ ○ ○ ○ ○ ○ ○ ○ ○ ○ ○ ○ ○ ○ ○ ○ ○ ○ ○ ○
15 Manipur 48.15 48.46 100.65 44.49 92.39
○ ○ ○ ○ ○ ○ ○ ○ ○ ○ ○ ○ ○ ○ ○ ○ ○ ○ ○ ○ ○ ○ ○ ○ ○ ○ ○ ○ ○ ○ ○ ○ ○ ○ ○ ○ ○ ○ ○ ○ ○ ○ ○ ○ ○ ○ ○ ○ ○ ○ ○ ○ ○ ○ ○ ○ ○ ○ ○ ○ ○
16 Meghalaya 46.15 42.05 91.11 40.76 88.32
○ ○ ○ ○ ○ ○ ○ ○ ○ ○ ○ ○ ○ ○ ○ ○ ○ ○ ○ ○ ○ ○ ○ ○ ○ ○ ○ ○ ○ ○ ○ ○ ○ ○ ○ ○ ○ ○ ○ ○ ○ ○ ○ ○ ○ ○ ○ ○ ○ ○ ○ ○ ○ ○ ○ ○ ○ ○ ○ ○ ○
17 Mizoram 32.10 31.15 97.03 31.15 97.03
○ ○ ○ ○ ○ ○ ○ ○ ○ ○ ○ ○ ○ ○ ○ ○ ○ ○ ○ ○ ○ ○ ○ ○ ○ ○ ○ ○ ○ ○ ○ ○ ○ ○ ○ ○ ○ ○ ○ ○ ○ ○ ○ ○ ○ ○ ○ ○ ○ ○ ○ ○ ○ ○ ○ ○ ○ ○ ○ ○ ○
18 Nagaland 32.10 29.65 92.37 29.65 92.37
○ ○ ○ ○ ○ ○ ○ ○ ○ ○ ○ ○ ○ ○ ○ ○ ○ ○ ○ ○ ○ ○ ○ ○ ○ ○ ○ ○ ○ ○ ○ ○ ○ ○ ○ ○ ○ ○ ○ ○ ○ ○ ○ ○ ○ ○ ○ ○ ○ ○ ○ ○ ○ ○ ○ ○ ○ ○ ○ ○ ○
19 Orissa 481.00 451.35 93.84 338.81 70.44
○ ○ ○ ○ ○ ○ ○ ○ ○ ○ ○ ○ ○ ○ ○ ○ ○ ○ ○ ○ ○ ○ ○ ○ ○ ○ ○ ○ ○ ○ ○ ○ ○ ○ ○ ○ ○ ○ ○ ○ ○ ○ ○ ○ ○ ○ ○ ○ ○ ○ ○ ○ ○ ○ ○ ○ ○ ○ ○ ○ ○
20 Punjab 301.05 291.99 96.99 232.12 77.10
○ ○ ○ ○ ○ ○ ○ ○ ○ ○ ○ ○ ○ ○ ○ ○ ○ ○ ○ ○ ○ ○ ○ ○ ○ ○ ○ ○ ○ ○ ○ ○ ○ ○ ○ ○ ○ ○ ○ ○ ○ ○ ○ ○ ○ ○ ○ ○ ○ ○ ○ ○ ○ ○ ○ ○ ○ ○ ○ ○ ○
21 Rajasthan 550.25 539.35 98.02 476.70 86.63
○ ○ ○ ○ ○ ○ ○ ○ ○ ○ ○ ○ ○ ○ ○ ○ ○ ○ ○ ○ ○ ○ ○ ○ ○ ○ ○ ○ ○ ○ ○ ○ ○ ○ ○ ○ ○ ○ ○ ○ ○ ○ ○ ○ ○ ○ ○ ○ ○ ○ ○ ○ ○ ○ ○ ○ ○ ○ ○ ○ ○
22 Sikkim 31.10 30.29 97.40 26.88 86.44
○ ○ ○ ○ ○ ○ ○ ○ ○ ○ ○ ○ ○ ○ ○ ○ ○ ○ ○ ○ ○ ○ ○ ○ ○ ○ ○ ○ ○ ○ ○ ○ ○ ○ ○ ○ ○ ○ ○ ○ ○ ○ ○ ○ ○ ○ ○ ○ ○ ○ ○ ○ ○ ○ ○ ○ ○ ○ ○ ○ ○
23 Tamil Nadu 895.35 890.37 99.44 828.05 92.48
○ ○ ○ ○ ○ ○ ○ ○ ○ ○ ○ ○ ○ ○ ○ ○ ○ ○ ○ ○ ○ ○ ○ ○ ○ ○ ○ ○ ○ ○ ○ ○ ○ ○ ○ ○ ○ ○ ○ ○ ○ ○ ○ ○ ○ ○ ○ ○ ○ ○ ○ ○ ○ ○ ○ ○ ○ ○ ○ ○ ○
24 Tripura 47.15 45.14 95.73 35.80 75.92
○ ○ ○ ○ ○ ○ ○ ○ ○ ○ ○ ○ ○ ○ ○ ○ ○ ○ ○ ○ ○ ○ ○ ○ ○ ○ ○ ○ ○ ○ ○ ○ ○ ○ ○ ○ ○ ○ ○ ○ ○ ○ ○ ○ ○ ○ ○ ○ ○ ○ ○ ○ ○ ○ ○ ○ ○ ○ ○ ○ ○
25 Uttar Pradesh 1752.70 1666.94 95.11 1461.61 83.39
○ ○ ○ ○ ○ ○ ○ ○ ○ ○ ○ ○ ○ ○ ○ ○ ○ ○ ○ ○ ○ ○ ○ ○ ○ ○ ○ ○ ○ ○ ○ ○ ○ ○ ○ ○ ○ ○ ○ ○ ○ ○ ○ ○ ○ ○ ○ ○ ○ ○ ○ ○ ○ ○ ○ ○ ○ ○ ○ ○ ○
26 West Bengal 838.85 800.29 95.40 591.01 70.45
○ ○ ○ ○ ○ ○ ○ ○ ○ ○ ○ ○ ○ ○ ○ ○ ○ ○ ○ ○ ○ ○ ○ ○ ○ ○ ○ ○ ○ ○ ○ ○ ○ ○ ○ ○ ○ ○ ○ ○ ○ ○ ○ ○ ○ ○ ○ ○ ○ ○ ○ ○ ○ ○ ○ ○ ○ ○ ○ ○ ○
27 A & N Islands 15.05 15.52 103.13 15.52 103.13
○ ○ ○ ○ ○ ○ ○ ○ ○ ○ ○ ○ ○ ○ ○ ○ ○ ○ ○ ○ ○ ○ ○ ○ ○ ○ ○ ○ ○ ○ ○ ○ ○ ○ ○ ○ ○ ○ ○ ○ ○ ○ ○ ○ ○ ○ ○ ○ ○ ○ ○ ○ ○ ○ ○ ○ ○ ○ ○ ○ ○
28 Chandigarh 14.05 13.35 95.04 13.35 95.04
○ ○ ○ ○ ○ ○ ○ ○ ○ ○ ○ ○ ○ ○ ○ ○ ○ ○ ○ ○ ○ ○ ○ ○ ○ ○ ○ ○ ○ ○ ○ ○ ○ ○ ○ ○ ○ ○ ○ ○ ○ ○ ○ ○ ○ ○ ○ ○ ○ ○ ○ ○ ○ ○ ○ ○ ○ ○ ○ ○ ○
29 D & N Haveli 16.05 16.56 103.18 14.95 93.12
○ ○ ○ ○ ○ ○ ○ ○ ○ ○ ○ ○ ○ ○ ○ ○ ○ ○ ○ ○ ○ ○ ○ ○ ○ ○ ○ ○ ○ ○ ○ ○ ○ ○ ○ ○ ○ ○ ○ ○ ○ ○ ○ ○ ○ ○ ○ ○ ○ ○ ○ ○ ○ ○ ○ ○ ○ ○ ○ ○ ○
30 Daman & Diu 16.05 14.90 92.87 14.90 92.87
○ ○ ○ ○ ○ ○ ○ ○ ○ ○ ○ ○ ○ ○ ○ ○ ○ ○ ○ ○ ○ ○ ○ ○ ○ ○ ○ ○ ○ ○ ○ ○ ○ ○ ○ ○ ○ ○ ○ ○ ○ ○ ○ ○ ○ ○ ○ ○ ○ ○ ○ ○ ○ ○ ○ ○ ○ ○ ○ ○ ○
31 Delhi 137.95 134.41 97.43 109.66 79.49
○ ○ ○ ○ ○ ○ ○ ○ ○ ○ ○ ○ ○ ○ ○ ○ ○ ○ ○ ○ ○ ○ ○ ○ ○ ○ ○ ○ ○ ○ ○ ○ ○ ○ ○ ○ ○ ○ ○ ○ ○ ○ ○ ○ ○ ○ ○ ○ ○ ○ ○ ○ ○ ○ ○ ○ ○ ○ ○ ○ ○
32 Lakshdweep 14.05 13.42 95.51 8.78 62.48
○ ○ ○ ○ ○ ○ ○ ○ ○ ○ ○ ○ ○ ○ ○ ○ ○ ○ ○ ○ ○ ○ ○ ○ ○ ○ ○ ○ ○ ○ ○ ○ ○ ○ ○ ○ ○ ○ ○ ○ ○ ○ ○ ○ ○ ○ ○ ○ ○ ○ ○ ○ ○ ○ ○ ○ ○ ○ ○ ○ ○
33 Pondicherry 31.10 31.98 102.84 24.65 79.25
○ ○ ○ ○ ○ ○ ○ ○ ○ ○ ○ ○ ○ ○ ○ ○ ○ ○ ○ ○ ○ ○ ○ ○ ○ ○ ○ ○ ○ ○ ○ ○ ○ ○ ○ ○ ○ ○ ○ ○ ○ ○ ○ ○ ○ ○ ○ ○ ○ ○ ○ ○ ○ ○ ○ ○ ○ ○ ○ ○ ○
34 Chhattisgarh 234.65 224.59 95.71 198.44 84.57
○ ○ ○ ○ ○ ○ ○ ○ ○ ○ ○ ○ ○ ○ ○ ○ ○ ○ ○ ○ ○ ○ ○ ○ ○ ○ ○ ○ ○ ○ ○ ○ ○ ○ ○ ○ ○ ○ ○ ○ ○ ○ ○ ○ ○ ○ ○ ○ ○ ○ ○ ○ ○ ○ ○ ○ ○ ○ ○ ○ ○
35 Uttaranchal 107.25 98.87 92.18 82.25 76.69
36 Jharkhand 260.75 240.26 92.14 190.40 73.02
GRAND TOTAL 12077.30 11651.78 96.48 9818.12 81.29
Source: Ministry of Statistics and Programme Implementation
A nnexures

54
Annexure-2
State wise Release of Funds/Expenditure of Rajya Sabha Members of Parliament as on 31/12/2003
No. Name of Released by Amount % Sanctioned Expenditure % Utilisation
State/UT G.O.I. Sanctioned Over Released Incurred Over Released
○ ○ ○ ○ ○ ○ ○ ○ ○ ○ ○ ○ ○ ○ ○ ○ ○ ○ ○ ○ ○ ○ ○ ○ ○ ○ ○ ○ ○ ○ ○ ○ ○ ○ ○ ○ ○ ○ ○ ○ ○ ○ ○ ○ ○ ○ ○ ○ ○ ○ ○ ○ ○ ○ ○ ○ ○ ○ ○ ○ ○
1 Nominated 125.50 119.40 95.14 93.68 74.64
○ ○ ○ ○ ○ ○ ○ ○ ○ ○ ○ ○ ○ ○ ○ ○ ○ ○ ○ ○ ○ ○ ○ ○ ○ ○ ○ ○ ○ ○ ○ ○ ○ ○ ○ ○ ○ ○ ○ ○ ○ ○ ○ ○ ○ ○ ○ ○ ○ ○ ○ ○ ○ ○ ○ ○ ○ ○ ○ ○ ○
2 Andhra Pradesh 282.40 268.60 95.11 219.26 77.64
○ ○ ○ ○ ○ ○ ○ ○ ○ ○ ○ ○ ○ ○ ○ ○ ○ ○ ○ ○ ○ ○ ○ ○ ○ ○ ○ ○ ○ ○ ○ ○ ○ ○ ○ ○ ○ ○ ○ ○ ○ ○ ○ ○ ○ ○ ○ ○ ○ ○ ○ ○ ○ ○ ○ ○ ○ ○ ○ ○ ○
3 Arunachal Pr. 16.05 16.13 100.47 15.90 99.07
○ ○ ○ ○ ○ ○ ○ ○ ○ ○ ○ ○ ○ ○ ○ ○ ○ ○ ○ ○ ○ ○ ○ ○ ○ ○ ○ ○ ○ ○ ○ ○ ○ ○ ○ ○ ○ ○ ○ ○ ○ ○ ○ ○ ○ ○ ○ ○ ○ ○ ○ ○ ○ ○ ○ ○ ○ ○ ○ ○ ○
4 Assam 109.85 98.87 90.00 88.80 80.84
○ ○ ○ ○ ○ ○ ○ ○ ○ ○ ○ ○ ○ ○ ○ ○ ○ ○ ○ ○ ○ ○ ○ ○ ○ ○ ○ ○ ○ ○ ○ ○ ○ ○ ○ ○ ○ ○ ○ ○ ○ ○ ○ ○ ○ ○ ○ ○ ○ ○ ○ ○ ○ ○ ○ ○ ○ ○ ○ ○ ○
5 Bihar 250.95 376.00 149.83 179.68 71.60
○ ○ ○ ○ ○ ○ ○ ○ ○ ○ ○ ○ ○ ○ ○ ○ ○ ○ ○ ○ ○ ○ ○ ○ ○ ○ ○ ○ ○ ○ ○ ○ ○ ○ ○ ○ ○ ○ ○ ○ ○ ○ ○ ○ ○ ○ ○ ○ ○ ○ ○ ○ ○ ○ ○ ○ ○ ○ ○ ○ ○
6 Goa 12.05 10.95 90.90 7.64 63.42
○ ○ ○ ○ ○ ○ ○ ○ ○ ○ ○ ○ ○ ○ ○ ○ ○ ○ ○ ○ ○ ○ ○ ○ ○ ○ ○ ○ ○ ○ ○ ○ ○ ○ ○ ○ ○ ○ ○ ○ ○ ○ ○ ○ ○ ○ ○ ○ ○ ○ ○ ○ ○ ○ ○ ○ ○ ○ ○ ○ ○
7 Gujarat 161.05 144.53 89.74 109.36 67.90
○ ○ ○ ○ ○ ○ ○ ○ ○ ○ ○ ○ ○ ○ ○ ○ ○ ○ ○ ○ ○ ○ ○ ○ ○ ○ ○ ○ ○ ○ ○ ○ ○ ○ ○ ○ ○ ○ ○ ○ ○ ○ ○ ○ ○ ○ ○ ○ ○ ○ ○ ○ ○ ○ ○ ○ ○ ○ ○ ○ ○
8 Haryana 76.75 72.55 94.53 65.60 85.48
○ ○ ○ ○ ○ ○ ○ ○ ○ ○ ○ ○ ○ ○ ○ ○ ○ ○ ○ ○ ○ ○ ○ ○ ○ ○ ○ ○ ○ ○ ○ ○ ○ ○ ○ ○ ○ ○ ○ ○ ○ ○ ○ ○ ○ ○ ○ ○ ○ ○ ○ ○ ○ ○ ○ ○ ○ ○ ○ ○ ○
9 Himachal Pr. 45.15 40.02 88.63 33.54 74.29
○ ○ ○ ○ ○ ○ ○ ○ ○ ○ ○ ○ ○ ○ ○ ○ ○ ○ ○ ○ ○ ○ ○ ○ ○ ○ ○ ○ ○ ○ ○ ○ ○ ○ ○ ○ ○ ○ ○ ○ ○ ○ ○ ○ ○ ○ ○ ○ ○ ○ ○ ○ ○ ○ ○ ○ ○ ○ ○ ○ ○
10 J & K 44.50 40.72 91.49 27.28 61.31
○ ○ ○ ○ ○ ○ ○ ○ ○ ○ ○ ○ ○ ○ ○ ○ ○ ○ ○ ○ ○ ○ ○ ○ ○ ○ ○ ○ ○ ○ ○ ○ ○ ○ ○ ○ ○ ○ ○ ○ ○ ○ ○ ○ ○ ○ ○ ○ ○ ○ ○ ○ ○ ○ ○ ○ ○ ○ ○ ○ ○
11 Karnataka 181.60 171.42 94.39 158.25 87.14
○ ○ ○ ○ ○ ○ ○ ○ ○ ○ ○ ○ ○ ○ ○ ○ ○ ○ ○ ○ ○ ○ ○ ○ ○ ○ ○ ○ ○ ○ ○ ○ ○ ○ ○ ○ ○ ○ ○ ○ ○ ○ ○ ○ ○ ○ ○ ○ ○ ○ ○ ○ ○ ○ ○ ○ ○ ○ ○ ○ ○
12 Kerala 132.95 120.02 90.27 79.13 59.52
○ ○ ○ ○ ○ ○ ○ ○ ○ ○ ○ ○ ○ ○ ○ ○ ○ ○ ○ ○ ○ ○ ○ ○ ○ ○ ○ ○ ○ ○ ○ ○ ○ ○ ○ ○ ○ ○ ○ ○ ○ ○ ○ ○ ○ ○ ○ ○ ○ ○ ○ ○ ○ ○ ○ ○ ○ ○ ○ ○ ○
13 Madhya Pradesh 181.20 169.90 93.77 146.24 80.70
○ ○ ○ ○ ○ ○ ○ ○ ○ ○ ○ ○ ○ ○ ○ ○ ○ ○ ○ ○ ○ ○ ○ ○ ○ ○ ○ ○ ○ ○ ○ ○ ○ ○ ○ ○ ○ ○ ○ ○ ○ ○ ○ ○ ○ ○ ○ ○ ○ ○ ○ ○ ○ ○ ○ ○ ○ ○ ○ ○ ○
14 Maharashtra 265.45 246.05 92.69 184.81 69.62
○ ○ ○ ○ ○ ○ ○ ○ ○ ○ ○ ○ ○ ○ ○ ○ ○ ○ ○ ○ ○ ○ ○ ○ ○ ○ ○ ○ ○ ○ ○ ○ ○ ○ ○ ○ ○ ○ ○ ○ ○ ○ ○ ○ ○ ○ ○ ○ ○ ○ ○ ○ ○ ○ ○ ○ ○ ○ ○ ○ ○
15 Manipur 16.05 14.81 92.30 14.25 88.77
○ ○ ○ ○ ○ ○ ○ ○ ○ ○ ○ ○ ○ ○ ○ ○ ○ ○ ○ ○ ○ ○ ○ ○ ○ ○ ○ ○ ○ ○ ○ ○ ○ ○ ○ ○ ○ ○ ○ ○ ○ ○ ○ ○ ○ ○ ○ ○ ○ ○ ○ ○ ○ ○ ○ ○ ○ ○ ○ ○ ○
16 Meghalaya 15.05 13.39 88.98 13.39 88.98
○ ○ ○ ○ ○ ○ ○ ○ ○ ○ ○ ○ ○ ○ ○ ○ ○ ○ ○ ○ ○ ○ ○ ○ ○ ○ ○ ○ ○ ○ ○ ○ ○ ○ ○ ○ ○ ○ ○ ○ ○ ○ ○ ○ ○ ○ ○ ○ ○ ○ ○ ○ ○ ○ ○ ○ ○ ○ ○ ○ ○
17 Mizoram 16.05 15.06 93.83 15.06 93.83
○ ○ ○ ○ ○ ○ ○ ○ ○ ○ ○ ○ ○ ○ ○ ○ ○ ○ ○ ○ ○ ○ ○ ○ ○ ○ ○ ○ ○ ○ ○ ○ ○ ○ ○ ○ ○ ○ ○ ○ ○ ○ ○ ○ ○ ○ ○ ○ ○ ○ ○ ○ ○ ○ ○ ○ ○ ○ ○ ○ ○
18 Nagaland 16.05 15.05 93.77 15.05 93.77
○ ○ ○ ○ ○ ○ ○ ○ ○ ○ ○ ○ ○ ○ ○ ○ ○ ○ ○ ○ ○ ○ ○ ○ ○ ○ ○ ○ ○ ○ ○ ○ ○ ○ ○ ○ ○ ○ ○ ○ ○ ○ ○ ○ ○ ○ ○ ○ ○ ○ ○ ○ ○ ○ ○ ○ ○ ○ ○ ○ ○
19 Orissa 150.00 135.71 90.48 87.38 58.25
○ ○ ○ ○ ○ ○ ○ ○ ○ ○ ○ ○ ○ ○ ○ ○ ○ ○ ○ ○ ○ ○ ○ ○ ○ ○ ○ ○ ○ ○ ○ ○ ○ ○ ○ ○ ○ ○ ○ ○ ○ ○ ○ ○ ○ ○ ○ ○ ○ ○ ○ ○ ○ ○ ○ ○ ○ ○ ○ ○ ○
20 Punjab 105.40 98.60 93.55 79.47 75.40
○ ○ ○ ○ ○ ○ ○ ○ ○ ○ ○ ○ ○ ○ ○ ○ ○ ○ ○ ○ ○ ○ ○ ○ ○ ○ ○ ○ ○ ○ ○ ○ ○ ○ ○ ○ ○ ○ ○ ○ ○ ○ ○ ○ ○ ○ ○ ○ ○ ○ ○ ○ ○ ○ ○ ○ ○ ○ ○ ○ ○
21 Rajasthan 149.00 144.54 97.00 120.29 80.73
○ ○ ○ ○ ○ ○ ○ ○ ○ ○ ○ ○ ○ ○ ○ ○ ○ ○ ○ ○ ○ ○ ○ ○ ○ ○ ○ ○ ○ ○ ○ ○ ○ ○ ○ ○ ○ ○ ○ ○ ○ ○ ○ ○ ○ ○ ○ ○ ○ ○ ○ ○ ○ ○ ○ ○ ○ ○ ○ ○ ○
22 Sikkim 15.05 13.96 92.78 11.82 78.52
○ ○ ○ ○ ○ ○ ○ ○ ○ ○ ○ ○ ○ ○ ○ ○ ○ ○ ○ ○ ○ ○ ○ ○ ○ ○ ○ ○ ○ ○ ○ ○ ○ ○ ○ ○ ○ ○ ○ ○ ○ ○ ○ ○ ○ ○ ○ ○ ○ ○ ○ ○ ○ ○ ○ ○ ○ ○ ○ ○ ○
23 Tamil Nadu 283.40 281.05 99.17 264.26 93.25
○ ○ ○ ○ ○ ○ ○ ○ ○ ○ ○ ○ ○ ○ ○ ○ ○ ○ ○ ○ ○ ○ ○ ○ ○ ○ ○ ○ ○ ○ ○ ○ ○ ○ ○ ○ ○ ○ ○ ○ ○ ○ ○ ○ ○ ○ ○ ○ ○ ○ ○ ○ ○ ○ ○ ○ ○ ○ ○ ○ ○
24 Tripura 15.05 14.05 93.34 11.59 76.99
○ ○ ○ ○ ○ ○ ○ ○ ○ ○ ○ ○ ○ ○ ○ ○ ○ ○ ○ ○ ○ ○ ○ ○ ○ ○ ○ ○ ○ ○ ○ ○ ○ ○ ○ ○ ○ ○ ○ ○ ○ ○ ○ ○ ○ ○ ○ ○ ○ ○ ○ ○ ○ ○ ○ ○ ○ ○ ○ ○ ○
25 Uttar Pradesh 479.20 449.49 93.80 379.14 79.12
○ ○ ○ ○ ○ ○ ○ ○ ○ ○ ○ ○ ○ ○ ○ ○ ○ ○ ○ ○ ○ ○ ○ ○ ○ ○ ○ ○ ○ ○ ○ ○ ○ ○ ○ ○ ○ ○ ○ ○ ○ ○ ○ ○ ○ ○ ○ ○ ○ ○ ○ ○ ○ ○ ○ ○ ○ ○ ○ ○ ○
26 West Bengal 218.80 200.12 91.46 158.89 72.62
○ ○ ○ ○ ○ ○ ○ ○ ○ ○ ○ ○ ○ ○ ○ ○ ○ ○ ○ ○ ○ ○ ○ ○ ○ ○ ○ ○ ○ ○ ○ ○ ○ ○ ○ ○ ○ ○ ○ ○ ○ ○ ○ ○ ○ ○ ○ ○ ○ ○ ○ ○ ○ ○ ○ ○ ○ ○ ○ ○ ○
27 Delhi 39.65 36.26 91.46 28.11 70.90
○ ○ ○ ○ ○ ○ ○ ○ ○ ○ ○ ○ ○ ○ ○ ○ ○ ○ ○ ○ ○ ○ ○ ○ ○ ○ ○ ○ ○ ○ ○ ○ ○ ○ ○ ○ ○ ○ ○ ○ ○ ○ ○ ○ ○ ○ ○ ○ ○ ○ ○ ○ ○ ○ ○ ○ ○ ○ ○ ○ ○
28 Pondicherry 16.05 16.18 100.83 12.71 79.21
○ ○ ○ ○ ○ ○ ○ ○ ○ ○ ○ ○ ○ ○ ○ ○ ○ ○ ○ ○ ○ ○ ○ ○ ○ ○ ○ ○ ○ ○ ○ ○ ○ ○ ○ ○ ○ ○ ○ ○ ○ ○ ○ ○ ○ ○ ○ ○ ○ ○ ○ ○ ○ ○ ○ ○ ○ ○ ○ ○ ○
29 Chhattisgarh 62.10 59.00 95.01 51.88 83.55
○ ○ ○ ○ ○ ○ ○ ○ ○ ○ ○ ○ ○ ○ ○ ○ ○ ○ ○ ○ ○ ○ ○ ○ ○ ○ ○ ○ ○ ○ ○ ○ ○ ○ ○ ○ ○ ○ ○ ○ ○ ○ ○ ○ ○ ○ ○ ○ ○ ○ ○ ○ ○ ○ ○ ○ ○ ○ ○ ○ ○
30 Uttaranchal 28.00 24.24 86.58 14.14 50.49
31 Jharkhand 47.05 39.95 84.90 27.92 59.35
GRAND TOTAL 3557.40 3466.61 97.45 2714.54 76.31
Source: Ministry of Statistics and Programme Implementation

55
Annexure-3
State wise Release of Funds/Expenditure of Lok Sabha Members of Parliament as on 31/12/2003
No. Name of Released by Amount % Sanctioned Expenditure % Utilisation
State/UT G.O.I. Sanctioned Over Released Incurred Over Released
○ ○ ○ ○ ○ ○ ○ ○ ○ ○ ○ ○ ○ ○ ○ ○ ○ ○ ○ ○ ○ ○ ○ ○ ○ ○ ○ ○ ○ ○ ○ ○ ○ ○ ○ ○ ○ ○ ○ ○ ○ ○ ○ ○ ○ ○ ○ ○ ○ ○ ○ ○ ○ ○ ○ ○ ○ ○ ○ ○ ○
1 Nominated 29.50 27.97 94.80 25.40 86.10
○ ○ ○ ○ ○ ○ ○ ○ ○ ○ ○ ○ ○ ○ ○ ○ ○ ○ ○ ○ ○ ○ ○ ○ ○ ○ ○ ○ ○ ○ ○ ○ ○ ○ ○ ○ ○ ○ ○ ○ ○ ○ ○ ○ ○ ○ ○ ○ ○ ○ ○ ○ ○ ○ ○ ○ ○ ○ ○ ○ ○
2 Andhra Pradesh 659.55 648.74 98.36 550.89 83.52
○ ○ ○ ○ ○ ○ ○ ○ ○ ○ ○ ○ ○ ○ ○ ○ ○ ○ ○ ○ ○ ○ ○ ○ ○ ○ ○ ○ ○ ○ ○ ○ ○ ○ ○ ○ ○ ○ ○ ○ ○ ○ ○ ○ ○ ○ ○ ○ ○ ○ ○ ○ ○ ○ ○ ○ ○ ○ ○ ○ ○
3 Arunachal Pr. 32.10 31.38 97.75 28.51 88.81
○ ○ ○ ○ ○ ○ ○ ○ ○ ○ ○ ○ ○ ○ ○ ○ ○ ○ ○ ○ ○ ○ ○ ○ ○ ○ ○ ○ ○ ○ ○ ○ ○ ○ ○ ○ ○ ○ ○ ○ ○ ○ ○ ○ ○ ○ ○ ○ ○ ○ ○ ○ ○ ○ ○ ○ ○ ○ ○ ○ ○
4 Assam 217.70 209.11 96.05 188.26 86.48
○ ○ ○ ○ ○ ○ ○ ○ ○ ○ ○ ○ ○ ○ ○ ○ ○ ○ ○ ○ ○ ○ ○ ○ ○ ○ ○ ○ ○ ○ ○ ○ ○ ○ ○ ○ ○ ○ ○ ○ ○ ○ ○ ○ ○ ○ ○ ○ ○ ○ ○ ○ ○ ○ ○ ○ ○ ○ ○ ○ ○
5 Bihar 616.90 590.24 95.68 512.53 83.08
○ ○ ○ ○ ○ ○ ○ ○ ○ ○ ○ ○ ○ ○ ○ ○ ○ ○ ○ ○ ○ ○ ○ ○ ○ ○ ○ ○ ○ ○ ○ ○ ○ ○ ○ ○ ○ ○ ○ ○ ○ ○ ○ ○ ○ ○ ○ ○ ○ ○ ○ ○ ○ ○ ○ ○ ○ ○ ○ ○ ○
6 Goa 31.10 31.24 100.45 24.61 79.12
○ ○ ○ ○ ○ ○ ○ ○ ○ ○ ○ ○ ○ ○ ○ ○ ○ ○ ○ ○ ○ ○ ○ ○ ○ ○ ○ ○ ○ ○ ○ ○ ○ ○ ○ ○ ○ ○ ○ ○ ○ ○ ○ ○ ○ ○ ○ ○ ○ ○ ○ ○ ○ ○ ○ ○ ○ ○ ○ ○ ○
7 Gujarat 400.30 384.45 96.04 322.20 80.49
○ ○ ○ ○ ○ ○ ○ ○ ○ ○ ○ ○ ○ ○ ○ ○ ○ ○ ○ ○ ○ ○ ○ ○ ○ ○ ○ ○ ○ ○ ○ ○ ○ ○ ○ ○ ○ ○ ○ ○ ○ ○ ○ ○ ○ ○ ○ ○ ○ ○ ○ ○ ○ ○ ○ ○ ○ ○ ○ ○ ○
8 Haryana 156.50 149.01 95.22 141.11 90.16
○ ○ ○ ○ ○ ○ ○ ○ ○ ○ ○ ○ ○ ○ ○ ○ ○ ○ ○ ○ ○ ○ ○ ○ ○ ○ ○ ○ ○ ○ ○ ○ ○ ○ ○ ○ ○ ○ ○ ○ ○ ○ ○ ○ ○ ○ ○ ○ ○ ○ ○ ○ ○ ○ ○ ○ ○ ○ ○ ○ ○
9 Himachal Pr. 58.20 53.51 91.94 53.47 91.87
○ ○ ○ ○ ○ ○ ○ ○ ○ ○ ○ ○ ○ ○ ○ ○ ○ ○ ○ ○ ○ ○ ○ ○ ○ ○ ○ ○ ○ ○ ○ ○ ○ ○ ○ ○ ○ ○ ○ ○ ○ ○ ○ ○ ○ ○ ○ ○ ○ ○ ○ ○ ○ ○ ○ ○ ○ ○ ○ ○ ○
10 J & K 80.00 75.83 94.79 53.80 67.25
○ ○ ○ ○ ○ ○ ○ ○ ○ ○ ○ ○ ○ ○ ○ ○ ○ ○ ○ ○ ○ ○ ○ ○ ○ ○ ○ ○ ○ ○ ○ ○ ○ ○ ○ ○ ○ ○ ○ ○ ○ ○ ○ ○ ○ ○ ○ ○ ○ ○ ○ ○ ○ ○ ○ ○ ○ ○ ○ ○ ○
11 Karnataka 438.40 430.52 98.20 386.01 88.05
○ ○ ○ ○ ○ ○ ○ ○ ○ ○ ○ ○ ○ ○ ○ ○ ○ ○ ○ ○ ○ ○ ○ ○ ○ ○ ○ ○ ○ ○ ○ ○ ○ ○ ○ ○ ○ ○ ○ ○ ○ ○ ○ ○ ○ ○ ○ ○ ○ ○ ○ ○ ○ ○ ○ ○ ○ ○ ○ ○ ○
12 Kerala 315.00 311.99 99.05 242.68 77.04
○ ○ ○ ○ ○ ○ ○ ○ ○ ○ ○ ○ ○ ○ ○ ○ ○ ○ ○ ○ ○ ○ ○ ○ ○ ○ ○ ○ ○ ○ ○ ○ ○ ○ ○ ○ ○ ○ ○ ○ ○ ○ ○ ○ ○ ○ ○ ○ ○ ○ ○ ○ ○ ○ ○ ○ ○ ○ ○ ○ ○
13 Madhya Pradesh 456.40 447.07 97.96 395.17 86.58
○ ○ ○ ○ ○ ○ ○ ○ ○ ○ ○ ○ ○ ○ ○ ○ ○ ○ ○ ○ ○ ○ ○ ○ ○ ○ ○ ○ ○ ○ ○ ○ ○ ○ ○ ○ ○ ○ ○ ○ ○ ○ ○ ○ ○ ○ ○ ○ ○ ○ ○ ○ ○ ○ ○ ○ ○ ○ ○ ○ ○
14 Maharashtra 753.30 746.29 99.07 596.12 79.13
○ ○ ○ ○ ○ ○ ○ ○ ○ ○ ○ ○ ○ ○ ○ ○ ○ ○ ○ ○ ○ ○ ○ ○ ○ ○ ○ ○ ○ ○ ○ ○ ○ ○ ○ ○ ○ ○ ○ ○ ○ ○ ○ ○ ○ ○ ○ ○ ○ ○ ○ ○ ○ ○ ○ ○ ○ ○ ○ ○ ○
15 Manipur 32.10 30.33 94.47 25.33 78.90
○ ○ ○ ○ ○ ○ ○ ○ ○ ○ ○ ○ ○ ○ ○ ○ ○ ○ ○ ○ ○ ○ ○ ○ ○ ○ ○ ○ ○ ○ ○ ○ ○ ○ ○ ○ ○ ○ ○ ○ ○ ○ ○ ○ ○ ○ ○ ○ ○ ○ ○ ○ ○ ○ ○ ○ ○ ○ ○ ○ ○
16 Meghalaya 30.10 28.01 93.04 26.72 88.77
○ ○ ○ ○ ○ ○ ○ ○ ○ ○ ○ ○ ○ ○ ○ ○ ○ ○ ○ ○ ○ ○ ○ ○ ○ ○ ○ ○ ○ ○ ○ ○ ○ ○ ○ ○ ○ ○ ○ ○ ○ ○ ○ ○ ○ ○ ○ ○ ○ ○ ○ ○ ○ ○ ○ ○ ○ ○ ○ ○ ○
17 Mizoram 16.05 15.47 96.39 15.47 96.39
○ ○ ○ ○ ○ ○ ○ ○ ○ ○ ○ ○ ○ ○ ○ ○ ○ ○ ○ ○ ○ ○ ○ ○ ○ ○ ○ ○ ○ ○ ○ ○ ○ ○ ○ ○ ○ ○ ○ ○ ○ ○ ○ ○ ○ ○ ○ ○ ○ ○ ○ ○ ○ ○ ○ ○ ○ ○ ○ ○ ○
18 Nagaland 15.05 13.05 86.71 13.05 86.71
○ ○ ○ ○ ○ ○ ○ ○ ○ ○ ○ ○ ○ ○ ○ ○ ○ ○ ○ ○ ○ ○ ○ ○ ○ ○ ○ ○ ○ ○ ○ ○ ○ ○ ○ ○ ○ ○ ○ ○ ○ ○ ○ ○ ○ ○ ○ ○ ○ ○ ○ ○ ○ ○ ○ ○ ○ ○ ○ ○ ○
19 Orissa 325.00 306.20 94.22 244.66 75.28
○ ○ ○ ○ ○ ○ ○ ○ ○ ○ ○ ○ ○ ○ ○ ○ ○ ○ ○ ○ ○ ○ ○ ○ ○ ○ ○ ○ ○ ○ ○ ○ ○ ○ ○ ○ ○ ○ ○ ○ ○ ○ ○ ○ ○ ○ ○ ○ ○ ○ ○ ○ ○ ○ ○ ○ ○ ○ ○ ○ ○
20 Punjab 187.65 178.22 94.98 144.45 76.98
○ ○ ○ ○ ○ ○ ○ ○ ○ ○ ○ ○ ○ ○ ○ ○ ○ ○ ○ ○ ○ ○ ○ ○ ○ ○ ○ ○ ○ ○ ○ ○ ○ ○ ○ ○ ○ ○ ○ ○ ○ ○ ○ ○ ○ ○ ○ ○ ○ ○ ○ ○ ○ ○ ○ ○ ○ ○ ○ ○ ○
21 Rajasthan 398.25 393.05 98.69 350.49 88.01
○ ○ ○ ○ ○ ○ ○ ○ ○ ○ ○ ○ ○ ○ ○ ○ ○ ○ ○ ○ ○ ○ ○ ○ ○ ○ ○ ○ ○ ○ ○ ○ ○ ○ ○ ○ ○ ○ ○ ○ ○ ○ ○ ○ ○ ○ ○ ○ ○ ○ ○ ○ ○ ○ ○ ○ ○ ○ ○ ○ ○
22 Sikkim 16.05 16.33 101.72 15.07 93.87
○ ○ ○ ○ ○ ○ ○ ○ ○ ○ ○ ○ ○ ○ ○ ○ ○ ○ ○ ○ ○ ○ ○ ○ ○ ○ ○ ○ ○ ○ ○ ○ ○ ○ ○ ○ ○ ○ ○ ○ ○ ○ ○ ○ ○ ○ ○ ○ ○ ○ ○ ○ ○ ○ ○ ○ ○ ○ ○ ○ ○
23 Tamil Nadu 607.95 595.45 97.94 552.91 90.95
○ ○ ○ ○ ○ ○ ○ ○ ○ ○ ○ ○ ○ ○ ○ ○ ○ ○ ○ ○ ○ ○ ○ ○ ○ ○ ○ ○ ○ ○ ○ ○ ○ ○ ○ ○ ○ ○ ○ ○ ○ ○ ○ ○ ○ ○ ○ ○ ○ ○ ○ ○ ○ ○ ○ ○ ○ ○ ○ ○ ○
24 Tripura 32.10 31.09 96.84 24.21 75.41
○ ○ ○ ○ ○ ○ ○ ○ ○ ○ ○ ○ ○ ○ ○ ○ ○ ○ ○ ○ ○ ○ ○ ○ ○ ○ ○ ○ ○ ○ ○ ○ ○ ○ ○ ○ ○ ○ ○ ○ ○ ○ ○ ○ ○ ○ ○ ○ ○ ○ ○ ○ ○ ○ ○ ○ ○ ○ ○ ○ ○
25 Uttar Pradesh 1264.50 1201.24 95.00 1064.32 84.17
○ ○ ○ ○ ○ ○ ○ ○ ○ ○ ○ ○ ○ ○ ○ ○ ○ ○ ○ ○ ○ ○ ○ ○ ○ ○ ○ ○ ○ ○ ○ ○ ○ ○ ○ ○ ○ ○ ○ ○ ○ ○ ○ ○ ○ ○ ○ ○ ○ ○ ○ ○ ○ ○ ○ ○ ○ ○ ○ ○ ○
26 West Bengal 612.05 585.22 95.62 417.28 68.18
○ ○ ○ ○ ○ ○ ○ ○ ○ ○ ○ ○ ○ ○ ○ ○ ○ ○ ○ ○ ○ ○ ○ ○ ○ ○ ○ ○ ○ ○ ○ ○ ○ ○ ○ ○ ○ ○ ○ ○ ○ ○ ○ ○ ○ ○ ○ ○ ○ ○ ○ ○ ○ ○ ○ ○ ○ ○ ○ ○ ○
27 A & N Islands 14.05 13.39 95.29 13.49 96.00
○ ○ ○ ○ ○ ○ ○ ○ ○ ○ ○ ○ ○ ○ ○ ○ ○ ○ ○ ○ ○ ○ ○ ○ ○ ○ ○ ○ ○ ○ ○ ○ ○ ○ ○ ○ ○ ○ ○ ○ ○ ○ ○ ○ ○ ○ ○ ○ ○ ○ ○ ○ ○ ○ ○ ○ ○ ○ ○ ○ ○
28 Chandigarh 14.05 13.35 95.04 13.35 95.04
○ ○ ○ ○ ○ ○ ○ ○ ○ ○ ○ ○ ○ ○ ○ ○ ○ ○ ○ ○ ○ ○ ○ ○ ○ ○ ○ ○ ○ ○ ○ ○ ○ ○ ○ ○ ○ ○ ○ ○ ○ ○ ○ ○ ○ ○ ○ ○ ○ ○ ○ ○ ○ ○ ○ ○ ○ ○ ○ ○ ○
29 D & N Haveli 16.05 16.56 103.18 14.60 90.98
○ ○ ○ ○ ○ ○ ○ ○ ○ ○ ○ ○ ○ ○ ○ ○ ○ ○ ○ ○ ○ ○ ○ ○ ○ ○ ○ ○ ○ ○ ○ ○ ○ ○ ○ ○ ○ ○ ○ ○ ○ ○ ○ ○ ○ ○ ○ ○ ○ ○ ○ ○ ○ ○ ○ ○ ○ ○ ○ ○ ○
30 Daman & Diu 16.05 14.90 92.87 14.90 92.87
○ ○ ○ ○ ○ ○ ○ ○ ○ ○ ○ ○ ○ ○ ○ ○ ○ ○ ○ ○ ○ ○ ○ ○ ○ ○ ○ ○ ○ ○ ○ ○ ○ ○ ○ ○ ○ ○ ○ ○ ○ ○ ○ ○ ○ ○ ○ ○ ○ ○ ○ ○ ○ ○ ○ ○ ○ ○ ○ ○ ○
31 Delhi 98.30 94.93 96.57 77.10 78.44
○ ○ ○ ○ ○ ○ ○ ○ ○ ○ ○ ○ ○ ○ ○ ○ ○ ○ ○ ○ ○ ○ ○ ○ ○ ○ ○ ○ ○ ○ ○ ○ ○ ○ ○ ○ ○ ○ ○ ○ ○ ○ ○ ○ ○ ○ ○ ○ ○ ○ ○ ○ ○ ○ ○ ○ ○ ○ ○ ○ ○
32 Lakshdweep 14.05 13.42 95.51 8.78 62.48
○ ○ ○ ○ ○ ○ ○ ○ ○ ○ ○ ○ ○ ○ ○ ○ ○ ○ ○ ○ ○ ○ ○ ○ ○ ○ ○ ○ ○ ○ ○ ○ ○ ○ ○ ○ ○ ○ ○ ○ ○ ○ ○ ○ ○ ○ ○ ○ ○ ○ ○ ○ ○ ○ ○ ○ ○ ○ ○ ○ ○
33 Pondicherry 15.05 15.21 101.04 11.93 79.30
○ ○ ○ ○ ○ ○ ○ ○ ○ ○ ○ ○ ○ ○ ○ ○ ○ ○ ○ ○ ○ ○ ○ ○ ○ ○ ○ ○ ○ ○ ○ ○ ○ ○ ○ ○ ○ ○ ○ ○ ○ ○ ○ ○ ○ ○ ○ ○ ○ ○ ○ ○ ○ ○ ○ ○ ○ ○ ○ ○ ○
34 Chhattisgarh 168.55 162.57 96.45 147.46 87.49
○ ○ ○ ○ ○ ○ ○ ○ ○ ○ ○ ○ ○ ○ ○ ○ ○ ○ ○ ○ ○ ○ ○ ○ ○ ○ ○ ○ ○ ○ ○ ○ ○ ○ ○ ○ ○ ○ ○ ○ ○ ○ ○ ○ ○ ○ ○ ○ ○ ○ ○ ○ ○ ○ ○ ○ ○ ○ ○ ○ ○
35 Uttaranchal 78.25 73.88 94.42 68.03 86.94
36 Jharkhand 207.70 193.84 93.33 159.12 76.61
GRAND TOTAL 8423.90 8143.06 96.67 6943.47 82.43
Source: Ministry of Statistics and Programme Implementation

By
SIBA SANKAR MOHANTY
CBGA
2004
FOR MORE INFORMATION, CONTACT:
Centre for Budget and Governance Accountability(A programme of NCAS) B 64, Second Floor, Sarvodaya Enclave, New Delhi – 110 017, IndiaTelefax: 91-11-26537603 Email: [email protected]
cbgaNational Centre for Advocacy StudiesSerenity Complex, Ramnagar Colony, Pune – 411 021, Maharashtra, IndiaTelefax: 91-20-22952003 / 4 Email: [email protected] Website: www.ncasindia.org
(for
priv
ate
circ
ulat
ion
only
)