for more information - rand corporation order rand documents or to obtain additional information,...
TRANSCRIPT

This document and trademark(s) contained herein are protected by law as indicated in a notice appearing later in this work. This electronic representation of RAND intellectual property is provided for non-commercial use only. Unauthorized posting of RAND PDFs to a non-RAND Web site is prohibited. RAND PDFs are protected under copyright law. Permission is required from RAND to reproduce, or reuse in another form, any of our research documents for commercial use. For information on reprint and linking permissions, please see RAND Permissions.
Limited Electronic Distribution Rights
Visit RAND at www.rand.org
Explore the RAND National Defense
Research Institute
View document details
For More Information
This PDF document was made available
from www.rand.org as a public service of
the RAND Corporation.
6Jump down to document
THE ARTS
CHILD POLICY
CIVIL JUSTICE
EDUCATION
ENERGY AND ENVIRONMENT
HEALTH AND HEALTH CARE
INTERNATIONAL AFFAIRS
NATIONAL SECURITY
POPULATION AND AGING
PUBLIC SAFETY
SCIENCE AND TECHNOLOGY
SUBSTANCE ABUSE
TERRORISM AND HOMELAND SECURITY
TRANSPORTATION ANDINFRASTRUCTURE
WORKFORCE AND WORKPLACE
The RAND Corporation is a nonprofit institution that helps improve policy and decisionmaking through research and analysis.
Purchase this document
Browse Books & Publications
Make a charitable contribution
Support RAND

This product is part of the RAND Corporation monograph series.
RAND monographs present major research findings that address the
challenges facing the public and private sectors. All RAND mono-
graphs undergo rigorous peer review to ensure high standards for
research quality and objectivity.

From Marginal Adjustments
to Meaningful Change
Rethinking Weapon System Acquisition
NATIONAL DEFENSE RESEARCH INSTITUTE
John Birkler, Mark V. Arena, Irv Blickstein,
Jeffrey A. Drezner, Susan M. Gates, Meilinda Huang,
Robert Murphy, Charles Nemfakos, Susan K. Woodward
Prepared for the Office of the Secretary of DefenseApproved for public release; distribution unlimited

The RAND Corporation is a nonprofit institution that helps improve policy and decisionmaking through research and analysis. RAND’s publications do not necessarily reflect the opinions of its research clients and sponsors.
R® is a registered trademark.
© Copyright 2010 RAND Corporation
Permission is given to duplicate this document for personal use only, as long as it is unaltered and complete. Copies may not be duplicated for commercial purposes. Unauthorized posting of RAND documents to a non-RAND website is prohibited. RAND documents are protected under copyright law. For information on reprint and linking permissions, please visit the RAND permissions page (http://www.rand.org/publications/permissions.html).
Published 2010 by the RAND Corporation1776 Main Street, P.O. Box 2138, Santa Monica, CA 90407-2138
1200 South Hayes Street, Arlington, VA 22202-50504570 Fifth Avenue, Suite 600, Pittsburgh, PA 15213-2665
RAND URL: http://www.rand.orgTo order RAND documents or to obtain additional information, contact
Distribution Services: Telephone: (310) 451-7002; Fax: (310) 451-6915; Email: [email protected]
Cover design by Eileen Delson La Russo
The research described in this report was prepared for the Office of the Secretary of Defense (OSD). The research was conducted within the RAND National Defense Research Institute, a federally funded research and development center sponsored by the Office of the Secretary of Defense, the Joint Staff, the Unified Combatant Commands, the Navy, the Marine Corps, the defense agencies, and the defense Intelligence Community under Contract W74V8H-06-C-0002.
Library of Congress Cataloging-in-Publication Data
From marginal adjustments to meaningful change : rethinking weapon system acquisition / John Birkler ... [et al.]. p. cm. Includes bibliographical references. ISBN 978-0-8330-5046-5 (pbk. : alk. paper) 1. United States. Dept. of Defense—Procurement. 2. United States—Armed Forces—Procurement. 3. United States—Armed Forces—Weapons systems. 4. Defense contracts—United States. I. Birkler, J. L., 1944-
UC263.F758 2010 355.6'212—dc22
2010042130

iii
Preface
In today’s defense environment, pressure is growing on policymakers to make the defense acquisition system more nimble and eff ective. To help, prior to the 2008 U.S. presidential election, the RAND Corpo-ration was asked to prepare a series of white papers as part of the Offi ce of the Secretary of Defense’s eff ort to provide the next administration with guidance on defense acquisition challenges in several areas likely to be of critical importance to the new defense acquisition leadership: competition, risk management, novel systems, prototyping, organiza-tional and management issues, and the acquisition workforce. Th ese eff orts led to six occasional papers that off er thought-provoking sug-gestions based on decades of RAND and other research, new quan-titative assessments, a RAND-developed cost-analysis methodology, and the expertise of core RAND research staff . Th e papers gener-ated considerable interest; indeed, demand exhausted the initial print run. Th is monograph, a compilation of those six papers, will be of interest to members of the acquisition and military requirements communities.
Th is research was sponsored by the Offi ce of the Under Secre-tary of Defense for Acquisition, Technology, and Logistics (OUSD (AT&L)) and conducted within the Acquisition and Technology Pol-icy Center of the RAND National Defense Research Institute, a feder-ally funded research and development center sponsored by the Offi ce of the Secretary of Defense, the Joint Staff , the Unifi ed Combatant Commands, the Navy, the Marine Corps, the defense agencies, and the defense Intelligence Community.

iv From Marginal Adjustments to Meaningful Change
123456789
101112131415161718192021222324252627282930313233343536
For more information on the RAND Acquisition and Technol-ogy Policy Center, see http://www.rand.org/nsrd/about/atp.html or contact the director (contact information is provided on the web page).

v
Contents
Preface ...................................................................................................... iiiFigures .......................................................................................................ixTables ........................................................................................................xiSummary .................................................................................................xiiiAbbreviations ..........................................................................................xxi
CHAPTER ONE
Determining When Competition Is a Reasonable Strategy for the Production Phase of Defense Acquisition ........................... 1
Introduction ............................................................................................... 1Pentagon Acquisitions: Not Business As Usual ........................................... 2Th e Benefi ts and Drawbacks of Competition ............................................. 3
Benefi ts of Competition ......................................................................... 5Drawbacks of Competition .................................................................... 7
Conditions Favorable to Competition via a Second Production Source ........................................................................... 12
Conclusions ............................................................................................. 19
CHAPTER TWO
Untying Gulliver: Taking Risks to Acquire Novel Weapon Systems ............................................................................. 21
Introduction ............................................................................................. 21What Is a Novel System? .......................................................................... 23A Strategy for Fielding Novel Systems Concepts ....................................... 26Conclusions ............................................................................................. 29

vi From Marginal Adjustments to Meaningful Change
123456789
101112131415161718192021222324252627282930313233343536
CHAPTER THREE
Dollar Value and Risk Levels: Changing How Weapon System Programs Are Managed .................................................................. 31
Introduction ............................................................................................. 31Managing by Risk Level Versus Dollar Value ............................................ 32Focusing on Causes Rather Th an Consequences ....................................... 33
Well-Defi ned Process for Assessing Technical Risk Is in Place .............. 36System Integration Risk Is Assessed, but at Later Stages ....................... 37Th e Risks of Design Process Management Are Not Well
Understood ................................................................................. 40Evaluation of Production Risks Lacks Rigor ......................................... 42Th e Risk of Early Business Decisions Is Not Fully Appreciated ............ 45
Conclusions ............................................................................................. 47
CHAPTER FOUR
Improving Acquisition Outcomes: Organizational and Management Issues ....................................... 51
Introduction ............................................................................................. 51Th e Service Chiefs’ Role in the Acquisition
Process Is Too Limited ..................................................................... 52Th e Combatant Commands’ Role in Defense Management ..................... 53Joint Duty Requirements Erode Operational Insights Within
Acquisition Program Management................................................... 55Too Much Emphasis on Management Processes over Creativity
and Initiative ................................................................................... 56Conclusions ............................................................................................. 60
CHAPTER FIVE
On Prototyping: Lessons from RAND Research ................................... 63Introduction ............................................................................................. 63What Is Prototyping?................................................................................ 64What Are the Expected Benefi ts of Prototyping? ...................................... 67Historical Evidence Is Mixed .................................................................... 73Conditions Th at Favor Prototyping .......................................................... 78Conclusions ............................................................................................. 81

Contents vii
CHAPTER SIX
Shining a Spotlight on the Defense Acquisition Workforce—Again ......................................................................... 85
Introduction ............................................................................................. 85Th e Defense Acquisition Workforce:
Policy Context, Size, and Composition ............................................ 88Defense Acquisition Workforce and Improvement Act ......................... 89Civilian Personnel Management in DoD:
Th e National Security Personnel System ...................................... 92Strategic Human Capital Planning for the Acquisition Workforce ....... 94
Basis of Main Concerns About the Defense Acquisition Workforce .......... 96Is the Defense Acquisition Workforce Really Too Small? ...................... 96
Overuse or Inappropriate Use of Contractors ......................................... 104Where Are Contractors Being Used? .................................................. 104Why Are Contractors Being Used? ..................................................... 106
Th e Workforce Lacks the Skills to Accomplish the Workload ................. 107Conclusions ........................................................................................... 108Occupational Grouping Defi nitions Used in Th is Report ....................... 112
Quality Assurance and Auditing ......................................................... 112Program Management and Logistics .................................................. 112Procurement ...................................................................................... 113Science and Engineering .................................................................... 113Sensitivity Checks .............................................................................. 115
About the Authors ................................................................................ 117Bibliography ......................................................................................... 123

123456789
101112131415161718192021222324252627282930313233343536

ix
Figures
S.1 Civilians in the Acquisition Workforce, September 30 Annual Snapshots ...................................................................xviii
2.1 Comparison of Conventional and Novel Systems ...................... 233.1 Th e Defense Acquisition Management System .......................... 344.1 DoD’s Requirements, Acquisition, and
Funding Processes ..................................................................... 585.1 Cost-Growth Factor Distribution of Prototyping and
Nonprototyping Programs, Circa 1993 ..................................... 756.1 Civilians in the Acquisition Workforce, September 30
Annual Snapshots ..................................................................... 916.2 Career Field Distribution for the Civilian Acquisition
Workforce, FY 2006.................................................................. 926.3 Career Field Distribution for the Military Acquisition
Workforce, FY 2006.................................................................. 936.4 Number of DoD Civilians in Acquisition-Related
Occupational Series (1980–2007), Drawn from Overall DoD Civilian Personnel Data ................................................... 99
6.5 Number of DoD Civilians in Acquisition-Related Occupational Series Classifi ed as Part of the Offi cial Acquisition Workforce Count (1992–2007) ............................ 100
6.6 Number of DoD Civilians in Science and Engineering and Other AW-Related Occupational Series (Occser), Overall and in the Offi cial Acquisition Workforce Count (1980–2007) ........................................................................... 101

x From Marginal Adjustments to Meaningful Change
123456789
101112131415161718192021222324252627282930313233343536
6.7 Number of All DoD Program Management Civilians and Percentage Included in Offi cial Acquisition Workforce Count .................................................................... 102
6.8 Number of All DoD Quality Assurance Civilians and Percentage Included in Offi cial Acquisition Workforce Count .................................................................... 103
xi
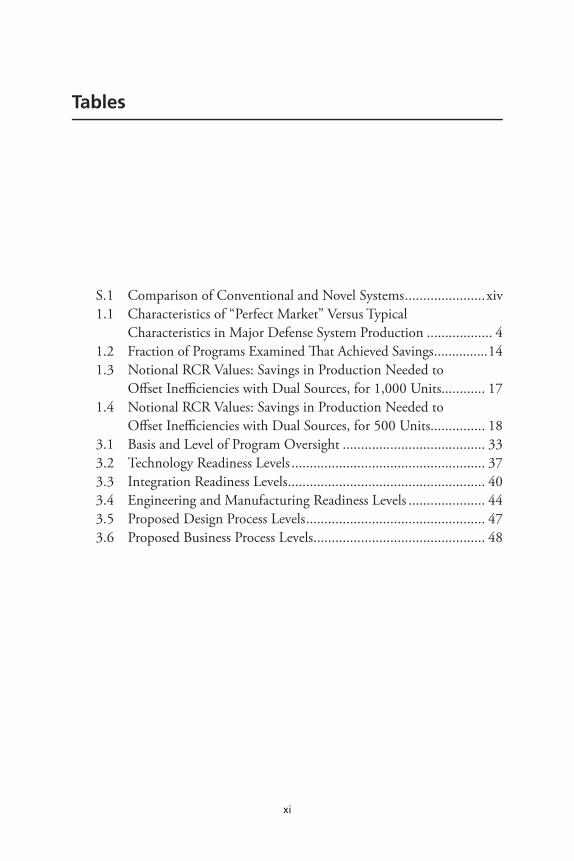
Tables
S.1 Comparison of Conventional and Novel Systems ......................xiv1.1 Characteristics of “Perfect Market” Versus Typical
Characteristics in Major Defense System Production .................. 41.2 Fraction of Programs Examined Th at Achieved Savings ...............141.3 Notional RCR Values: Savings in Production Needed to
Off set Ineffi ciencies with Dual Sources, for 1,000 Units............ 171.4 Notional RCR Values: Savings in Production Needed to
Off set Ineffi ciencies with Dual Sources, for 500 Units............... 183.1 Basis and Level of Program Oversight ....................................... 333.2 Technology Readiness Levels ..................................................... 373.3 Integration Readiness Levels ...................................................... 403.4 Engineering and Manufacturing Readiness Levels ..................... 443.5 Proposed Design Process Levels ................................................. 473.6 Proposed Business Process Levels ............................................... 48

123456789
101112131415161718192021222324252627282930313233343536

xiii
Summary
Despite years of change and reform, the Department of Defense (DoD) continues to develop and acquire weapon systems that it cannot aff ord and cannot deliver on schedule. Consequently, defense acquisition is one of the most urgent issues that DoD has to address today—a point emphatically conveyed by Deputy Secretary of Defense William Lynn during his confi rmation hearing: “[A]cquisition reform is not an option, it is an imperative” (2009, p. 10).
Th is monograph is designed to inform new initiatives for mark-edly improving the cost, timeliness, and innovativeness of weapon sys-tems that DoD intends to acquire. It is the result of a RAND eff ort that led to six occasional papers on topics that are likely to be of critical importance to DoD leadership: competition, novel systems, prototyp-ing, risk management, organizational and management issues, and the acquisition workforce. Th ese papers build on RAND staff ’s deep expe-rience in acquisition management issues to provide innovative ideas and suggestions to revitalize defense acquisitions.
Findings
Savings from Competition Are Not Inevitable
Th e value of competition is so much taken for granted that defense offi cials are often criticized for not relying more frequently on com-petition in awarding contracts for major defense systems. However, a second production source does not guarantee savings in every pro-curement. Defense acquisitions diff er from the typical business market

xiv From Marginal Adjustments to Meaningful Change
123456789
101112131415161718192021222324252627282930313233343536
in terms of priorities, the number of buyers and producers, and the level of market uncertainty. Moreover, competition requires additional time, money, and management eff ort.
RAND researchers used historical data and a RAND-developed methodology to determine whether and when competition is a rea-sonable acquisition strategy during the production phase. Th e analysis indicates that competition is more reasonable in situations in which nonrecurring costs are low, cost improvement is minimal, and a greater number of units will be produced. In some cases—especially in the procurement of major systems whose nonrecurring costs are large—it may actually be less costly for the government to forgo competition.
DoD Must Accept More Risk to Meet Demand for Novel Systems
Today, there is a growing need to respond to asymmetrical threats using novel weapon systems that can be quickly developed and fi elded. Novel systems—such as the F-117 Stealth Fighter and robotic ground vehi-cles—involve more uncertainty than conventional systems, not only with regard to design and technology but also in terms of how they will be used, how many units will be needed, and how much they will cost (see Table S.1).
Current acquisition policies and processes are too risk averse to enable the eff ective development and timely employment of novel sys-tems. Consequently, DoD needs a separate acquisition strategy that
Table S.1Comparison of Conventional and Novel Systems
Dimensions Conventional Systems Novel Systems
Design Follow-on New
Technology Evolutionary Disruptive
Operational employment Established In formulation
Outcomes Predictable Uncertain
Production run Large Uncertain
Operational life Long Uncertain

Summary xv
is less tied to achieving precise cost, schedule, and performance out-comes. Th e new strategy should include a focus on unique integrations of existing and emerging technologies, a willingness to accept risks, easy and quick termination of programs not yielding expected benefi ts, and early test and demonstration of military utility.
Oversight Is Based on Dollar Value, Irrespective of Risk
DoD assigns responsibility for decisions on major defense acquisi-tion programs on the basis of the program’s dollar value. Th e higher the value, the more senior the decisionmaker. Th is approach has been constantly refi ned over the years without having noticeably improved acquisition outcomes. A new paradigm in which the level of over-sight and management would be based on the level of risk a program represents would help DoD more eff ectively manage weapon system programs. Some very costly projects might have signifi cantly less risk than projects of similar cost and thus should require less oversight. Conversely, projects may cost little but have a lot of risk because they push the state of the art in technology; such programs require more-comprehensive oversight than dollar value alone would indicate.
Cost, schedule, and performance are the primary attributes by which programs are assessed, but more-discrete program attributes—such as technical, system, design, production, and business innovation risk—would better enable program managers to look ahead and act to avoid adverse outcomes. Th e Defense Acquisition Management Sys-tem has suffi cient tools and allows time for conducting proper assess-ment and management of technical risk and, to some extent, system integration risk. However, new approaches in design, production, and business areas of acquisition programs do not appear to receive the same level of skepticism and comprehensive oversight received by new technologies and systems. Descriptive levels of risk that could be used to assess new design approaches include the following:
• New, unproven processes. New design tools under development. New design organization.
• Large expansion of existing design organization. Many new design-ers and supervisors unfamiliar with design tools and processes.

xvi From Marginal Adjustments to Meaningful Change
123456789
101112131415161718192021222324252627282930313233343536
• Existing design organization using radically changed design tools, processes, and/or technologies.
• Experienced design organization using new design tools with proven processes.
• Experienced design organization using existing, proven design tools and processes.
Organizational Schisms and Rigid Processes Contribute to Ineffi ciencies
Many of the problems that contribute to poor cost and schedule out-comes are systemic to the way that the acquisition process is organized and managed in DoD. Specifi cally, organizational schisms and overly prescribed management processes contribute both to ineffi ciencies in the acquisition system and to unrealistic expectations.
For example, service chiefs1—who validate warfi ghting require-ments—have become increasingly disconnected from the service acqui-sition executives who develop and acquire new weapon and information systems in conjunction with their program executive offi cers and pro-gram managers. Without suffi cient dialogue between these entities, ser-vice chiefs may emphasize warfi ghting needs at the expense of reducing cost, and the acquisition process loses their operational insight, which is critical in analyzing trade-off s between cost, schedule, and performance. Th e service chiefs should have a central, but not controlling, voice in the acquisition process to enable the requirements, funding, and acquisition processes to function together well. Having the service vice chiefs serve as co-chairs of the military departments’ acquisition boards would be a step in the right direction. However, increasing the role of the combat-ant commands in these decisionmaking processes would require them to spend too much time away from their warfi ghting responsibilities.2 It is the job of those in the Pentagon to reach out to the combatant com-mands and demonstrate that their needs are being addressed.
1 Th at is, the Chief of Staff of the U.S. Air Force, the Chief of Staff of the U.S. Army, the Chief of Naval Operations, and the Commandant of the Marine Corps.2 Th e military departments supply forces to the combatant commands, which conduct joint military operations.

Summary xvii
Recent acquisition reforms have made management processes overly complex and rigid, leading to an environment in which “success” is measured by an ability to follow rules in a rote manner to move a program through an increasing number of wickets. DoD needs a more streamlined requirements and acquisition process, one that, unlike the current process that prescribes everything through an instruction or regulation, encourages workforce initiative and responsibility.
Evidence of the Benefi ts of Prototyping Is Mixed
Acquisition policy and practice refl ect the recurring theme that pro-totyping as part of weapon system development can reduce cost and time; allow demonstration of novel system concepts; provide a basis for competition; validate cost estimates, design, and manufacturing pro-cesses; and reduce or mitigate technical risk. A review of four decades of RAND research on prototyping indicates that the available evidence on its benefi ts is somewhat mixed overall. Nevertheless, the historical record does reveal some of the conditions under which prototyping strategies seem most likely to yield benefi ts in a development program. Th ese include ensuring that prototyping strategies and documenta-tion are austere, not committing to production during the prototyping phase, making few signifi cant design changes when moving to the fi nal confi guration, and maintaining strict funding limits.
Existing case studies and statistical analyses present the policy-maker with mixed results, so, in essence, DoD’s new competitive pro-totyping mandate was incorporated into policy without a strong link between the new policy emphasis and its intended improvements to program cost, schedule, and performance outcomes. A carefully struc-tured analysis of prototyping strategies emphasizing recent experiences with competitive prototyping (with, e.g., F-22 fi ghter aircraft, the Joint Strike Fighter, the Littoral Combat Ship) would help ensure a more successful implementation of the new policy.
DoD Lacks Systematic Data on the Acquisition Workforce
Th rough the end of FY 2015, DoD plans to increase the defense acqui-sition workforce by 20,000 workers (16 percent), converting contrac-tor positions to civil service positions and hiring new civil servants. Th is

xviii From Marginal Adjustments to Meaningful Change
123456789
101112131415161718192021222324252627282930313233343536
step responds to three common claims: (1) Th e acquisition workforce is too small to meet current workload, (2) it lacks the necessary skills, and (3) contractors are overused or inappropriately used to perform acquisition functions. However, DoD does not have systematic data on workforce supply and demand, the adequacy of workforce skills, or the amount and nature of contractor support. Without such data, it is diffi cult to determine whether and to what extent workforce attributes aff ect acquisition outcomes.
To gain insight into DoD’s acquisition workforce in terms of sup-ply and demand, a RAND analysis drew upon data about the depart-ment’s overall civilian workforce. Th ese data indicate that the number of DoD civilians in acquisition-related occupations declined during the 1990s, reaching a low of 77,504 in 1999, and then climbed steadily to reach 119,251 in 2005. By 2006, it had been reduced slightly to 113,605 (see Figure S.1). Th e greatest declines occurred in contracting, quality assurance, and auditing—groups that were the most likely to have been aff ected by increased workload due to procurement reforms and increased use of contractors.
Figure S.1Civilians in the Acquisition Workforce, September 30 Annual Snapshots
SOURCE: Gates et al., 2008, Figure 3.1.

Summary xix
DoD should acquire the evidence needed to make the case for workforce changes by gathering data on the total workforce, including contractors, mapping the workforce to acquisition activities for which performance may be measurable, and identifying and gathering infor-mation on processes and outcomes that the workforce can be expected to infl uence.
Conclusions
Th e following chapters contain more-detailed proposals to improve defense acquisition through initiatives focused on competition, novel systems, risk management, organizational factors, prototyping, and the acquisition workforce. Th e starting point for these proposals is the fol-lowing list of overarching conclusions:
• Explicit evaluation of the pros and cons of production competi-tion should be undertaken for each acquisition.
• Th e characteristics of novel systems are so diff erent from those of the systems for which the present acquisition process was designed that they require a separate acquisition strategy.
• Managing defense acquisition programs by risk, rather than dol-lar amount, merits serious consideration.
• Some bold steps are needed to clear structural impediments to acquisition reform. Greater participation of the service chiefs in a more streamlined acquisition system would most closely align requirements with contracting for material and material support.
• Th e successful application of prototyping strategies in the future requires certain conditions, such as testing critical performance attributes in a realistic environment.
• DoD needs to invest more in understanding the strengths and weaknesses of the acquisition workforce, including contractors.

123456789
101112131415161718192021222324252627282930313233343536

xxi
Abbreviations
AAC Air Armament CenterACAT acquisition categoryACTD Advanced Concept Technology
DemonstrationAFMC Air Force Materiel CommandAMRAAM Advanced Medium-Range Air-to-Air MissileAOR Area of ResponsibilityASDS Advanced SEAL Delivery SystemATD Advanced Technology DemonstrationAW acquisition workforceCBO Congressional Budget Offi ceCDR critical design reviewCDS Combat Data SystemCINC commander in chiefCOCOM combatant commandDAWIA Defense Acquisition Workforce
Improvement ActDoD Department of DefenseDoD IG Department of Defense Inspector GeneralDPAP Defense Procurement and Acquisition Policy

xxii From Marginal Adjustments to Meaningful Change
123456789
101112131415161718192021222324252627282930313233343536
EDM engineering development modelEMD engineering and manufacturing
developmentEMRL Engineering and Manufacturing
Readiness LevelFFRDC federally funded research and
development centerFRP full-rate productionGAO Government Accountability Offi ceHCSP Human Capital Strategic PlanIOT&E initial operational test and evaluationIPL Integrated Priority ListIPPD Integrated Product and Process
DevelopmentIRL Integration Readiness LevelJCIDS Joint Capabilities Integration and
Development SystemJCTD Joint Concept Technology DemonstrationJSF Joint Strike FighterLCS Littoral Combat ShipLRIP low-rate initial productionLWF Lightweight FighterMDA Milestone Decision AuthorityMDAP Major Defense Acquisition ProgramNASA National Aeronautics and Space
AdministrationNAVSEA Naval Sea Systems CommandNSPS National Security Personnel SystemNVR Naval Vessel Rules

Abbreviations xxiii
OMB Offi ce of Management and BudgetOPM Offi ce of Program ManagementOSD Offi ce of the Secretary of DefenseOUSD (AT&L) Offi ce of Under Secretary of Defense for
Acquisition, Technology, and LogisticsPDR preliminary design reviewPPBE planning, programming, budgeting,
and executionR&D research and developmentRAN Royal Australian NavyRCR required cost reductionRFP request for proposalS&T science and technologySAR Selected Acquisition ReportSPO system program offi ceSPRDE systems planning, research, development,
and engineeringSRL System Readiness LevelTDP technical data packageTDS Technology Development StrategyTRL Technology Readiness LevelUAS unmanned aerial systemUH utility helicopterUID PMO Unique Identifi cation Program
Management Offi ceUSN United States Navy

123456789
101112131415161718192021222324252627282930313233343536

1
CHAPTER ONE
Determining When Competition Is a Reasonable Strategy for the Production Phase of Defense Acquisition
Mark V. Arena and John Birkler
Introduction
Th e use of competition in weapon system acquisition is widely advo-cated in policy statements and widely refl ected in requirements issued by Congress, the Offi ce of Management and Budget (OMB), the Department of Defense (DoD), and the military services. Th is empha-sis stems from the conviction that competition during the production phase of the acquisition system will drive the unit cost of a system or subsystem down and reduce overall procure-ment cost to the government.1 Other argu-ments for having more than one producer exist (e.g., providing a surge capability should the services need to expand production quickly), but the crux of the com-petition issue is procurement cost (or, more accurately, price).
We do not question the value of competition as a means of induc-ing a fi rm to reduce prices, but it is not self-evident that a second production source will produce savings for the government in every procurement. In some cases—especially in the procurement of major systems where the nonrecurring costs are large—it may actually be less
1 A variety of competitive strategies exist. Each strategy addresses particular features of major acquisitions and is applicable to diff erent phases of the acquisition process. Th e focus of this analysis is on saving money during the production phase.
It is not self-evident that a second production source will produce savings—especially when nonrecurring costs are large.

2 From Marginal Adjustments to Meaningful Change
123456789
101112131415161718192021222324252627282930313233343536
costly for the government to forgo competition and to rely on a single supplier.
Senior DoD offi cials must determine whether competition is likely to result in savings or losses for the government. Th is paper compares the characteristics of a typical business market to those of defense acquisi-tions, identifi es the benefi ts and drawbacks of competition in defense acquisitions specifi cally, and shows how to determine when the introduc-tion of competition during production is a reasonable acquisition strategy.
Pentagon Acquisitions: Not Business As Usual
Th e complexity and uniqueness of major defense procurement make it diffi cult for DoD to follow typical commercial business price-competition approaches. In the typical business market, a buyer exam-ines the available products, requests competitive bids for production from a number of contractors, selects a bid based on a fi xed price,
and signs a one-step contract for delivery on a specifi ed date. Such a market depends on hav-ing complete information about a customer’s needs; a standardized, off -the-shelf product; a predictable budget; certainty about the num-ber of items to be purchased; and little reason for concern about the future viability of the losing fi rm. Major defense acquisitions lack these characteristics.
In major defense acquisitions, the rela-tionship between buyer and producer is almost completely diff erent from that assumed in the
economist’s model of the typical business market. For example, defense acquisitions have only one domestic buyer; producers typically compete during the design stage as opposed to the production stage; and concern about sustaining a unique industrial sector factors into the buyer’s deci-sionmaking process. Table 1 summarizes the characteristics assumed for the typical business market (or “perfect market”) and compares them to
If the unique characteristics
of defense procurement
are not taken into account,
expectations for the use of price
competition may be unrealistic.

Determining When Competition Is a Reasonable Strategy for Production 3
the corresponding characteristics of typical major defense acquisitions during production.
As indicated in the table, quality and schedule are often more important criteria than price in defense acquisitions. Th e high prior-ity the defense buyer usually gives to product quality is sometimes regarded as a defect in the acquisition process. Th e conventional wis-dom is that when programs experience diffi culties, expenditure is the fi rst constraint to be relaxed and schedule the second, but that perfor-mance goals are adhered to quite rigorously, with the result that the unit price of the product increases.
Th e data support this description of the way quality, schedule, and price are traded off , but it is by no means clear that this should be accepted as adverse criticism. Th e Services’ emphasis on high sys-tem quality is consistent with the long-established national policy that emphasizes quality rather than quantity for defense, and hence calls for the development and production of systems superior to those fi elded by possible opponents. If this emphasis is accepted, the question is not so much whether quality should be given priority, but rather, what kind of quality and how much quality is enough? Th is latter ques-tion, however, is peripheral to what concerns us here. It is suffi cient to recognize that major system acquisitions generally aim at a quality of product that requires innovations in design and the application of advanced technologies, with all the technical uncertainty this entails.
Comparison of the typical business market and defense acquisi-tions helps illustrate the inherent diffi culties in introducing eff ective price competition into defense acquisitions. Unless these diff erences are taken into account, expectations for the use of price competition in defense purchases may be unrealistic.
The Benefi ts and Drawbacks of Competition
Th e basic argument for competition in defense procurement is that it is believed to reduce the government’s costs of purchasing goods and services. Nonetheless, in some cases, it may actually be less costly for
4 From Marginal Adjustments to Meaningful Change
123456789
101112131415161718192021222324252627282930313233343536
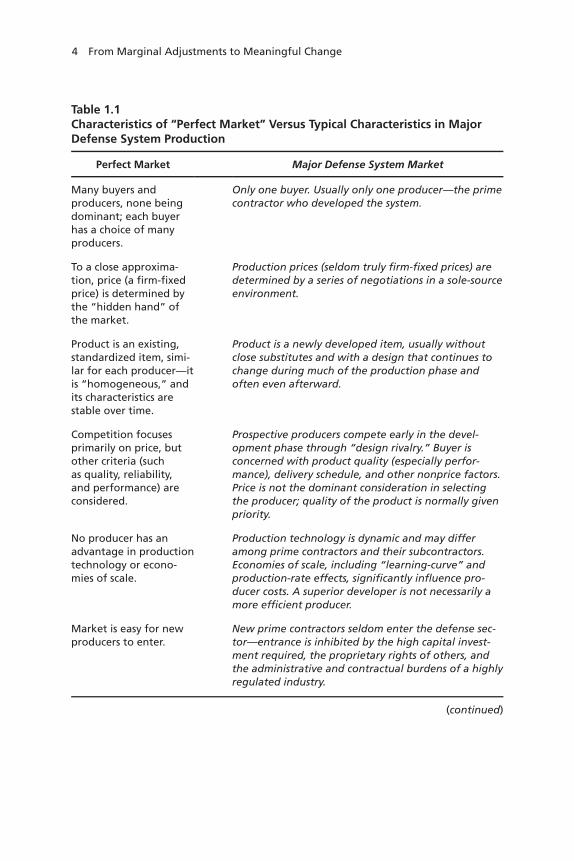
Table 1.1Characteristics of “Perfect Market” Versus Typical Characteristics in Major Defense System Production
Perfect Market Major Defense System Market
Many buyers and producers, none being dominant; each buyer has a choice of many producers.
Only one buyer. Usually only one producer—the prime contractor who developed the system.
To a close approxima-tion, price (a fi rm-fi xed price) is determined by the “hidden hand” of the market.
Production prices (seldom truly fi rm-fi xed prices) are determined by a series of negotiations in a sole-source environment.
Product is an existing, standardized item, simi-lar for each producer—it is “homogeneous,” and its characteristics are stable over time.
Product is a newly developed item, usually without close substitutes and with a design that continues to change during much of the production phase and often even afterward.
Competition focuses primarily on price, but other criteria (such as quality, reliability, and performance) are considered.
Prospective producers compete early in the devel-opment phase through “design rivalry.” Buyer is concerned with product quality (especially perfor-mance), delivery schedule, and other nonprice factors. Price is not the dominant consideration in selecting the producer; quality of the product is normally given priority.
No producer has an advantage in production technology or econo-mies of scale.
Production technology is dynamic and may differ among prime contractors and their subcontractors. Economies of scale, including “learning-curve” and production-rate effects, signifi cantly infl uence pro-ducer costs. A superior developer is not necessarily a more effi cient producer.
Market is easy for new producers to enter.
New prime contractors seldom enter the defense sec-tor—entrance is inhibited by the high capital invest-ment required, the proprietary rights of others, and the administrative and contractual burdens of a highly regulated industry.
(continued)

Determining When Competition Is a Reasonable Strategy for Production 5
the government to forgo competition during the production phase and rely on an alternative strategy. In this section, we discuss the gen-eral benefi ts of competition as well as common drawbacks for weapon system acquisition, including time; money; management eff ort; and a long-term, uncertain benefi t.
Benefi ts of Competition
Th e value of competition in U.S. society is so much taken for granted that defense procurement offi cials are often criticized for not relying more frequently on head-to-head competition in awarding production contracts for major defense systems. Th ose critics argue that com-petition produces many signifi cant benefi ts. Competition improves product quality and lowers unit costs, they say, compared with a noncompetitive environment. Competition
Table 1.1—Continued
Perfect Market Major Defense System Market
Buying the product is a simple, quickly completed, one-step transaction between the buyer and the producer, independent of other purchases from the same or other producers.
Acquiring a major system is a multiyear, multistep, complex process, involving scores of successive and usually interdependent contract negotiations between buyer and producer.
Market is characterized by near perfect intel-ligence and absence of uncertainty. Information about product price, standards of qual-ity, number of items purchased, and delivery schedule is freely avail-able to all concerned.
Uncertainty is a dominant and largely unavoidable feature. Among the market uncertainties are the• threat the system will face• most suitable system capabilities• best design approach• feasibility of development• time and other resources required to complete
development and make the transition to production• defi ciencies that may be revealed by operational
testing.
Competition can save money, improve product quality, ensure equity, and protect the industrial base.

6 From Marginal Adjustments to Meaningful Change
123456789
101112131415161718192021222324252627282930313233343536
forces manufacturers to quickly learn about new technologies and production techniques, fostering greater technological progress and industrial productivity. Finally, competition allows for a more equita-ble process under which acquisition contracts are awarded. Th e gov-ernment has the responsibility to treat fi rms fairly; competition allows companies that believe they can make a competitive bid to do so, which makes the bid process more fair than sole-source procurement.
We do not question the value of competition as a means of induc-ing a fi rm to reduce prices. When competition or the threat of com-petition is perceived as real, a fi rm may act in a number of ways to cut costs and price. Managers will often assign their best people to a competitive program, allocate corporate capital for equipment, and fund value-engineering studies (rather than expecting the customer to fund them). A company may also transfer production from an area of high labor costs, such as California or Massachusetts, to locales where labor costs are lower. Management may take measures to substitute capital for labor, accelerate cost-reduction schemes, and seek out alter-native vendors. A fi rm may be able to operate at an economical rate by producing enough parts in a few months to satisfy the contractual requirement for an entire year, and then assign the workers to other tasks for the remainder of the year. In addition, a company is usually able to reduce the number of engineering and manufacturing support personnel assigned to a program. Noncompetitive programs tend to be heavy in such personnel, often because the customer wants to retain the services they provide.
Saving money is not the only benefi t of bringing a second pro-ducer into a program. Improved quality assurance is often cited as a reason for introducing a second production source. In some instances, the underlying reason for a second source has been a profound dis-satisfaction with the initial contractor, which may be a good developer but an ineffi cient producer. Th e nature of defense procurement is such that, once a contractor is chosen to develop a major new system, the responsible military service is locked into a relationship with that con-tractor that could last 20 years or more. Bringing a second company into a program is an eff ective way to encourage greater cooperation from the initial fi rm.

Determining When Competition Is a Reasonable Strategy for Production 7
Drawbacks of Competition
Barriers to competition in defense acquisitions also exist. Analysts note that competition requires additional time and money and also entails extra management complexity and eff ort. At the same time, most of the benefi ts of competition are long term, providing program manag-ers with little incentive to implement competitive steps because payoff is well in the future. Further, competition has uncertain and mixed results. In a risk-averse environment, this uncertainty also reduces the program manager’s incentive to use competition.
We discuss each drawback separately below. Th roughout the dis-cussion, we attempt to distinguish among diff erent problems that arise during discrete phases of the acquisition cycle.
Additional Time and Money. At almost every phase in the acquisi-tion cycle and for almost every kind of competition, adding a second competitor requires current-year investment above what a sole-source would cost. During the planning phase, such funds are relatively small in absolute terms. However, when the program moves to the produc-tion phase, the magnitude of the funding required for a second, com-petitive source becomes large relative to program costs and in absolute terms, reaching tens or hundreds of millions of dollars.
Such a funding commitment can be diffi cult to obtain. It will have to come from higher up the chain of command, which means that many people will have to be “sold” on the competitive action. At every level in the orga-nization, there will be some who are sympa-thetic to the request for funds and others who will see themselves as competing for the same funds. Some groups will tend to underesti-mate the diffi culty of developing a particular system or have an interest in fi elding it very quickly, thus they will resist competition dur-ing full-scale development on the grounds that it wastes time and money. Th e situation is even more complex in multiservice programs, wherein all the armed services must agree to put up the extra money.
Funding for a second source is substantial; it can be diffi cult to secure and maintain throughout a development program.

8 From Marginal Adjustments to Meaningful Change
123456789
101112131415161718192021222324252627282930313233343536
When substantial amounts of money are involved, DoD and multiple congressional committees must be sold on the competition as well. When there is no great pressure for competition and when other acquisition initiatives are being emphasized, DoD and the con-gressional committees involved can be diffi cult to convince. Congress tends to dislike programs with heavy front-end cost; other, less obvi-ous political problems sometimes intrude as well. Funding requests are reviewed by four diff erent congressional committees, which do not automatically coordinate their decisions, so each must be persuaded separately. It is not unusual for one committee to support a competi-tion and another to delete the funds for it. DoD and Congress can also hold strongly diff ering positions.2
Further, once funding for a competition is approved, there is no guarantee that it will be maintained. Money for competitive programs is a prime target in a budget squeeze, and initial high-level support for competition may evaporate. In the services and in DoD, there are frequent changes in top-level personnel; when new people take over, they inevitably change priorities. Written policy supporting competi-tion remains fairly consistent, but interest in competition changes with personnel. Th e result is that it can be diffi cult to maintain all the fund-ing necessary to conduct a competitive program.
An additional barrier to competition is the time involved in test-ing or qualifying a second contractor. Schedules can also lengthen due to adjudication of protests by the losing fi rm and because competition can increase program complexity and bureaucratic involvement. By lengthening schedules, competition carries the risk of raising program costs. Th e risk of increased program length is a disincentive to compe-tition because there is usually a strong desire to deploy the system as rapidly as possible.
2 For example, the services have strongly fought against having a second General Electric engine developed to compete against the Pratt & Whitney engine for the F-35, but Congress continues to insist on funding the General Electric engine in order to maintain competition.

Determining When Competition Is a Reasonable Strategy for Production 9
Extra Management Effort. Competition increases the workload of the project offi ce. Th is extra work stems from several sources: additional planning, qualifying a second producer, and quality control and con-fi guration management issues. If a competition is to be benefi cial, considerable planning for the competitive steps is necessary. Th e request for proposal (RFP) must be prepared and the source selection process must be designed. Th e program offi ce must comply with regulations designed to ensure the fairness of the compe-tition. Th is process involves special security to deal with “competition sensitive” material, special reports, et cetera. Competition also introduces the possibility of lawsuits, disputes, and charges of unfairness by the contractors who lose the competition. Consequently, the source selection must be carried out in a way that not only chooses the best design, but also raises a minimum number of questions about fairness. In addition, if awards are granted to more than one contractor, each additional contractor the program offi ce must deal with usually means more work. Th is is especially true when cost-type contracts are involved because the program offi ce must moni-tor the costs of each contractor.
Competition during production can introduce more manage-ment complications and can be a major eff ort, especially when qualify-ing a second producer after production has begun. It is diffi cult and expensive to get a good technical data package (TDP) for the second contractor to use in starting production, and even more diffi cult to persuade the fi rst producer to pass along to a competitor the benefi ts of its manufacturing experience.3 Program managers can choose to develop their own TDP, but for major programs this is almost impos-sible. Not all services have in-house capability to evaluate a TDP, and
3 Th ere are various levels of detail for a TDP that must be validated, at government expense, by a competitive producer before submitting a fi nal bid for production. An alternative to using a TDP is the form-fi t-function (FFF) approach for the second-source product.
Competition involves additional planning, extra work to qualify the second producer, and diffi culties in confi guration management.

10 From Marginal Adjustments to Meaningful Change
123456789
101112131415161718192021222324252627282930313233343536
without this capability, it is diffi cult to judge the adequacy of a TDP. Even with a good TDP, it frequently takes a major eff ort by the pro-gram offi ce to help the second source through all its technical problems and into production. In some cases, the second source never succeeds in producing a usable product. Even in those cases where the second source is not successful, the pressure on the fi rst contractor may still make the eff ort worthwhile.
Another source of additional work in developing a second source is that the program offi ce must work with both contractors on such things as quality control and confi guration management. It is generally quite diffi cult to get two contractors to produce systems and compo-nents with interchangeable parts. If they do not do so, the program offi ce faces additional problems in spare parts procurement and logis-tics. Further, each added production line means an additional set of nonrecurring costs whenever there is an engineering change.
Few High-Confi dence, Near-Term Benefi ts. Th e costs of competition are short-term and clear, but the benefi ts are long-term and uncertain. Programs can last for a decade or more. Given that the typical tenure of program managers is about three years, it is unlikely that they will be around to receive the credit for any benefi ts that fi nally accrue; con-
sequently, they make look for strategies that return short-term benefi ts. In any case, they are unlikely to be rewarded merely for intro-ducing competition; apart from exhortations in policy documents and the conventional wisdom that competition is good for everyone, few direct incentives for introducing competi-tive practices exist.
Retrospective studies of second produc-tion source procurement programs have not
been conclusive about the benefi ts of competition, partly because the answers depend heavily on the analytical methods used. A 1981 RAND study of the Shillelagh missile, for example, showed that analysts using the same data but diff erent analytical procedures could produce vastly diff erent estimates of the eff ect that a second production source had on
The benefi ts of competition occur
over the long term and are inherently
uncertain—a disincentive for program
managers.

Determining When Competition Is a Reasonable Strategy for Production 11
procurement costs (Archibald et al., 1981). Th ose estimates ranged from a cost savings of 79 percent to a cost increase of 14 percent. A follow-on to the 1981 report describes fi ve methods of estimating the cost benefi ts of a second production source (Birkler et al., 1990). For each method, we estimated the hypothetical single-source cost for four air-to-air missile programs (AIM-7F, AIM-7M, AIM-9L, and AIM-9M). None of the fi ve analytical methods was unanimous in indicating that a net cost savings accrued to the government through competition in any of these programs. However, three of the fi ve methods did show a net savings for two programs (AIM-7F and AIM-9L), and four meth-ods did show a cost increase for one procurement (the AIM-7M).
Some uncertainty is inevitable because the various methods used for measuring savings are unavoidably judgmental. In particular, if two sources are used, one cannot know the cost that would have been incurred with a single source only. Th at cost must be estimated and compared with the actual cost incurred through second-source pro-curement. Some uncertainty about the benefi ts of competition is also inevitable because real cost reductions are diffi cult to prove and can be masked by other factors, such as changes in production quantities, requirements growth, and infl ation. RAND’s analysis of the Tomahawk and the Advanced Medium-Range Air-to-Air Missile (AMRAAM) pro-grams—both of which introduced competition during the production phase—indicated cost savings were achieved (Birkler and Large, 1990). However, it was exceedingly diffi cult, if not impossible, to isolate and quantify a distinct cost benefi t for competition from other program aspects, such as stability and maturity of the design, a fi rm’s business base and future outlook, availability of competing systems, government and the fi rms’ management approaches, profi t levels, and overall eco-nomic environment. Th e path not taken is always an educated guess. When the results are very sensitive to the assumptions made, one must be cautious in drawing any conclusions.
In addition to all of the drawbacks discussed above, competition is simply seen as impractical in many cases. Th ere may be few qualifi ed contractors to participate in a competition, and they may not wish to compete. Contractors are sometimes deterred from entering a com-petition due to uncertainties about how a competition will come out

12 From Marginal Adjustments to Meaningful Change
123456789
101112131415161718192021222324252627282930313233343536
and the criteria to be used in the source selection. Qualifying a second production source can also be seen as impractical because the produc-tion run is too small, the tooling for the second production line is too expensive, or the design is too complex to be transferable. In the case of subsystem components, there simply may not be enough money involved to justify the cost of funding another source.
Conditions Favorable to Competition via a Second Production Source
When is the introduction of competition a reasonable acquisition strategy? Th e question is not easy to answer because it is diffi cult to measure the future eff ects of competition, as suggested by the various, and sometimes confl icting, answers produced when measuring the past eff ects. Estimates of cost savings from competition are contingent on
• speculation about what might have happened if a second contrac-tor had not been brought into a program
• assumptions about estimates of program cost without competi-tion. If that estimate is too high, savings from competition or
other causes would be easy to achieve. If it is too low, savings would be unlikely.
Using historical data, we can estimate the likelihood that the government would “break even” on the introduction of a competitive second source; that is, that the cost reductions would be great enough to pay for the incre-mental costs of introducing competition.4 If the likelihood is high, the government might
4 Incremental costs include any nonrecurring or recurring development costs, nonrecurring investment in a manufacturing plant (facilities, general-purpose tools, general-purpose test equipment), and recurring materiel and labor costs.
If the likelihood of breaking even
on production costs is high,
competition might be reasonable; we use historical data to help calculate a break-even point.

Determining When Competition Is a Reasonable Strategy for Production 13
reasonably elect to introduce competition in the expectation of achiev-ing other potential benefi ts. Likewise, a low expectation of breaking even on production cost would discourage the government from intro-ducing competition because the net dollar cost of production might increase enough to outweigh other possible benefi ts.
Unfortunately, no data or cost estimating relationships exist that enable one to directly estimate production costs in a competitive environment. Instead, we have historical data showing the amount by which production cost changed when competition was introduced into ongoing sole-source production programs. Multiple studies of compe-tition in procurement have been conducted over the past 30 years, with the most recent completed in the early 1990s. Th ose historical studies cover a wide variety of weapon systems, subsystems, and components.5
In all of those cases, the program started with a sole-source producer, and a competitive second source was introduced later in the produc-tion run.
Whether and how much a second producer of a weapon system generates cost savings for DoD depends on the type of hardware or system that the competitors are developing and manufacturing. Our examination of the DoD’s past experience with introducing competi-tion into weapon programs suggests that second producers of elec-tronics6 have been more likely to generate savings in production costs than have second producers of missiles and ships.7 As Table 1.2 shows, half of the DoD programs in our historical survey that involved two or more competitive producers of electronics were able to reduce overall costs by 30 percent (which turned out to be the break-even point), but
5 For more detailed information about these data, see Birkler et al., 2001. Of the many sources we reviewed, we were able to obtain data from one that appears to be methodologically consistent: Birkler et al., 1990. Th e savings are based on actual costs or projections to the end of the program. 6 By electronics, we are referring to those items that are mainly subsystems or small compo-nents (e.g., radios, radars, transponders, and signal converters).7 Our analysis treats the electronics systems and hardware separately. Most of the nonelec-tronic items are ships and missiles; there have been no instances since World War II in which aircraft were produced by competitive sources.

14 From Marginal Adjustments to Meaningful Change
123456789
101112131415161718192021222324252627282930313233343536
only one in ten competitive missile and ship production eff orts were able to do so.
To gauge the likelihood that a government agency would recoup its costs if it were to invest in a second producer, we next applied a RAND-developed tool—the required cost reduction (RCR) meth-odology8—that determines whether competition can be reasonably introduced into the development and production phases of a variety of weapon systems. In particular, the model has allowed us to look at whether lower production costs engendered by the presence of a second producer would off set the investment in bringing that second source into the program. In recent years, we have applied this methodology to
the Joint Strike Fighter, the DD(X) program (as the destroyer was then known), and to the United Kingdom’s Type 45 Destroyer, as well as to numerous other acquisition programs.
Th e RCR methodology calculates a ratio of required savings necessary to off set the addi-tional costs introduced by multiple production sources (under competition) relative to the
8 Th is methodology was introduced in Birkler et al., 2001. It is a modifi cation to the original break-even analysis developed by Margolis et al., 1985.
Table 1.2Fraction of Programs Examined That Achieved Savings
Savings Achieved (%) Missiles and Ships Electronics
> 0 8/10 10/10
>10 7/10 9/10
>20 4/10 7/10
>30 2/10 5/10
>40 Nil 4/10
SOURCE: Birkler et al., 2001.
A RAND-developed tool calculates the percentage of sav-ings in production
needed to offset ineffi ciencies with a second producer.

Determining When Competition Is a Reasonable Strategy for Production 15
sole-source production cost.9 In other words, it answers the question, “How much do I need to save relative to the sole-source production costs to make competition break even?” To determine whether com-petition might be reasonable, we compare the RCR ratio to the values in Table 1.2. If the RCR is lower than the value for savings achieved where 50 percent of the programs saved at least that amount (i.e., there is a high likelihood of off setting the additional costs of competition), then we view a competitive strategy as being a reasonable approach. If the percentage is higher, then competition is not a reasonable strategy to reduce costs.
Th e RCR factors in the cost ineffi ciencies that are introduced with competition. Th e two cost ineffi ciencies that are typically considered are loss-of-learning and higher investment costs.10 Loss-of-learning occurs under a competition option because no one producer manufac-tures every unit. Learning (or, more formally, cost improvement) is the phenomenon where unit production costs decrease with each succes-sive unit. However, each producer under a competitive approach will typically produce fewer total units over the entire production run. Th is reduction in the total quantity each source produces indicates that the average unit cost under competition could be higher.
Additional investment costs also occur with a competitive approach. For example, each producer must invest in tooling and manufacturing facilities to produce enough units if it wins a competi-tion, so the overall facilities cost for a program are higher because each manufacturer needs redundant capability. Further, each manufacturer may need to engage in production design in order to produce an item (even under a build-to-print competition). Th erefore, development costs may also increase under a competitive strategy.
9 Th is RCR ratio is defi ned as RCR = (TC1 + TC2 – TCSS + IC – ISS) / TCSS, where,TC1 = recurring cost for contractor 1 under competitionTC2 = recurring cost for contractor 2 under competitionTCSS = recurring cost for single-source contractorIC = nonrecurring cost (investment) required under competitionISS = nonrecurring cost required under sole-source production
10 One could consider other infl uences, such as changes due to production rate effi ciency and overhead. Th ese infl uences are beyond the scope of this analysis.

16 From Marginal Adjustments to Meaningful Change
123456789
101112131415161718192021222324252627282930313233343536
To illustrate the potential range of answers with the RCR meth-odology, we built a simple spreadsheet model to evaluate competition using diff erent key assumptions. Th e model calculates production costs based on three key inputs: (1) a cost-improvement slope, (2) a value for the total number of units, and (3) the nonrecurring investment cost. Th e model includes some simplifying assumptions:
• First, competition will equally split the quantities between the two producers (it is not a winner-take-all situation). Th is fi rst assumption represents a “worst case” scenario.
• Second, the model assumes that the additional investment cost is equal to the sole-source investment cost. Th at is, each competing producer’s nonrecurring costs are equal and do not change with production quantity.
Table 1.3 presents the results of this calculation, based on a case where the total production quantity is 1,000 units. Th e fi rst column of the table represents the nonrecurring cost relative to the fi rst pro-duction unit cost; for example, a value of 5 in the fi rst column means that the nonrecurring cost was fi ve times greater than the cost of the fi rst production unit, and a value of 50 means that the nonrecurring cost was 50 times greater than the cost of the fi rst production unit. Th e remaining column headings represent (in percentages) an extent to which cost improvement may occur. For example, a cost improvement of 95 percent means that unit production cost decreased by 5 percent each time total production quantity doubled; a cost improvement of 100 percent means that unit production costs remained the same when total production quantity doubled.
Table 1.3 clearly illustrates that competition is more reasonable for situations where the nonrecurring costs are relatively low and the cost improvement is minimal (fl at)—for example, when nonrecurring costs are only 5 times greater than the cost of the fi rst production unit and cost improvement is 100 percent, then the percentage of savings in production needed to off set the costs of competition is only 1 per-cent. Note that RCR values (i.e., the results of the calculation) over 100 percent are cases where it is impossible to achieve savings. Even if

Determining When Competition Is a Reasonable Strategy for Production 17
the entire production was free, one could not off set the additional cost ineffi ciencies with multiple sources.
To understand when it might be rea-sonable to utilize competition (have dual sources), we compare the historical savings values for the ships, missiles, and electron-ics systems discussed in Table 1.2 with the notional RCR values in Table 1.3. We view competition as being reasonable where there is at least a 50-50 chance of achieving savings (i.e., at least half of the programs in our his-torical sample achieved that level of savings or more).11 For ship and missile systems, the cases where the cost-improvement slope is greater than 90 percent and the nonrecurring costs are less than 100 times the fi rst unit cost
11 At least half of the ship and missile programs in Table 1.2 achieved cost reductions of at least 17 percent. Similarly, at least half of the electronic systems programs in Table 1.2 achieved cost reductions of about 30 percent.
Table 1.3Notional RCR Values: Savings in Production Needed to Offset Ineffi ciencies with Dual Sources, for 1,000 Units
Nonrecurring Costs (T1)
Cost-Improvement Slope (%)
100 95 90 85 80 75
1 0 5 11 18 25 34
5 1 6 12 19 28 38
10 1 7 13 21 31 43
50 5 13 23 37 56 85
100 10 21 35 56 88 137
500 50 82 132 211 340 553
1,000 100 160 254 405 655 1,073
5,000 500 777 1,224 1,956 3,176 5,237
Our analyses indicate that competition is more reasonable in situations when both nonrecurring costs are low and cost improvement is minimal.

18 From Marginal Adjustments to Meaningful Change
123456789
101112131415161718192021222324252627282930313233343536
are favorable (see values shaded in green). For no cases where the cost-improvement slope was lower than 85 percent was competition seen as
favorable for these weapon systems. For elec-tronics-type systems, the range of competition-favorable values expands to include more cells (shown by the cells in green type, including those in the area shaded in green). Now, some favorable values extend to cost-improvement slopes as low as 80 percent, but the relative nonrecurring cost is still limited to values of 100 times the fi rst unit cost and less.
Table 1.4 shows a similar analysis, but where the production quan-tity has been cut in half (500 units). Again, a similar pattern emerges, but now fewer cells are identifi ed as favorable. Th is leads to the fi nal observation on competition: Situations with many production units are generally more favorable.
Competition may also be more reasonable in
situations where a greater number
of units will be produced.
Table 1.4Notional RCR Values: Savings in Production Needed to Offset Ineffi ciencies with Dual Sources, for 500 Units
Nonrecurring Costs (T1)
Cost-Improvement Slope (%)
100 95 90 85 80 75
1 0 5 11 18 25 34
5 1 7 13 21 29 40
10 2 8 15 24 34 48
50 10 20 33 50 75 111
100 20 35 55 83 126 189
500 100 152 229 347 530 817
1,000 200 299 448 678 1,036 1,603
5,000 1,000 1,473 2,196 3,319 5,083 7,885

Determining When Competition Is a Reasonable Strategy for Production 19
Conclusions
In major defense acquisitions, the relationship between the buyer and producer is almost completely diff erent from that assumed in the economist’s model of the marketplace. While the use of competi-tion in weapon system acquisition is widely advocated, savings are not inevitable. Splitting production between two contractors may in some instances result in a higher cost to the government.
As described in this paper, RAND has created a unique method-ology that senior decisionmakers have used to determine if and when introducing production competition is a reasonable acquisition strat-egy. Over the past decade, we have developed and refi ned a “break-even” model, built upon previous RAND studies, that identifi es how com-petition might be introduced into the production phases of a variety of weapon systems. Using this model, we have been able to gauge the likelihood that a government agency would recoup its costs if it were to invest in a second producer. In particular, the model has allowed us to look at whether lower production costs engendered by the presence of a second producer could off set the investment in bringing that second source into the program. In recent years, we have applied this method-ology to the Joint Strike Fighter, the DD(X) program (as the destroyer was then known), and to the United Kingdom’s Type 45 Destroyer, as well as to numerous other highly visible acquisition programs where the benefi ts of competition were being hotly debated.12
Because each and every acquisition is unique, our experience is that one must carefully evaluate whether introducing competition is reasonable. Th is is not an academic problem. Decisions involving bil-lions of dollars in future procurement will be based, to some extent, on estimates of single-source versus second-source cost.
12 Birkler et al., 2001; Schank et al., 2006; Birkler et al., 2002.

123456789
101112131415161718192021222324252627282930313233343536

21
CHAPTER TWO
Untying Gulliver: Taking Risks to Acquire Novel Weapon Systems
John Birkler
Introduction
Traditionally, the defense acquisition system equips relatively large forces for major combat operations involving weapon systems that are produced in signifi cant quantities and intended to be operational for decades. However, today there is a growing need to equip smaller forces to respond to asymmetrical threats using novel weapon systems that can be quickly developed and fi elded.
Novel systems—often an integration of several known technolo-gies, coupled with doctrinal and organizational changes—have more uncertainty when compared to traditional acquisition programs, and they present a challenge to the traditional acquisition process. Acquisi-tion policies and procedures in place today are designed to deliver new systems based on a stable design to minimize risk. However, to quickly fi eld innovative and novel systems, the acquisition community must accept precisely the uncertainties and risks that the traditional acquisi-tion process has been deliberately designed to avoid.
Th e aversion to risk that is built into the current acquisition pro-cess impedes rather than encourages the development of novel systems, especially those based upon disruptive rather than evolutionary tech-nology. Although DoD has established a number of organizations and undertaken numerous initiatives to manage the identifi cation, test, and deployment of novel systems,1 creating capabilities in the absence of
1 Examples include the Joint Rapid Acquisition Cell, the U.S. Army’s Rapid Equipping Force, the Director of Defense Research and Engineering’s Rapid Reaction Technology Offi ce,

22 From Marginal Adjustments to Meaningful Change
123456789
101112131415161718192021222324252627282930313233343536
any expressed warfi ghter need—that is, “technology push”—contin-ues to run too much against the political, bureaucratic, and regulatory
grain of the defense acquisition process. If it is allowed to continue, this aversion will have serious consequences for the long-term quality and capability of future U.S. combat forces. As near-term budget pressures and force modernization needs mount, spending scarce resources on capabilities that might become available or that might produce fundamental changes in mission capabilities is understand-ably viewed with little enthusiasm. Creating an environment that fosters innovation and
novel system development is one of the tough, but fundamental, chal-lenges facing senior leaders in DoD.
Th is paper argues that fostering innovative systems requires a sep-arate acquisition strategy that
• focuses on technology push and unique integrations of existing and emerging technologies;
• emphasizes fl exibility, including an overt willingness to accept risks;
• allows easy and quick termination of programs not yielding expected benefi ts;
• enables early test and demonstration of military utility.
In other words, we argue that fostering innovative systems requires a strategy that is more streamlined and less tied to achieving precise esti-mated cost, schedule, and performance outcomes in order to provide improved or unique capabilities to the warfi ghter as quickly as possible.
the Defense Advanced Research Projects Agency, the U.S. Air Force’s Quick Reaction Cell, the now-closed Air Force battle labs, Big Safari, et cetera.
An acquisition strategy for developing
novel systems cannot hinge on
achieving precise cost, schedule,
and performance outcomes.

Untying Gulliver: Taking Risks to Acquire Novel Weapon Systems 23
In this paper, we will fi rst defi ne what we mean by novel systems and describe their special features, and then we will outline the neces-sary elements of a strategy for developing these systems.
What Is a Novel System?
Novel systems diff er from legacy or conventional systems on several dimensions: design, operational employment, outcomes, production run, and operational life. Figure 2.1 compares novel systems to conven-tional systems in terms of these dimensions (the descriptive adjectives used are deliberately simplifi ed in order to emphasize the extent of the diff erences).
Conventional systems—for example, the Joint Strike Fighter, the F-22 fi ghter, and the Navy’s new destroyer, DD(X)—may contain the latest technologies, but this alone does not constitute a “novel system.” We know how to classify conventional systems (e.g., tactical aircraft, surface combatant); we know how we are going to use them; they fi ll an offi cial capability gap; and we know about how many we plan to buy.
On the other hand, in novel systems—such as the F-117 Stealth Fighter, novel mine-counter measures, and robotic ground vehicles—the following factors are less certain:
Figure 2.1Comparison of Conventional and Novel Systems
DIMENSIONS
Conventional Systems Novel Systems
Follow-on Design NewEvolutionary Technology DisruptiveEstablished Operational employment In formulationPredictable Outcomes UncertainLarge Production run UncertainLong Operational life Uncertain

24 From Marginal Adjustments to Meaningful Change
123456789
101112131415161718192021222324252627282930313233343536
• Th e design of a novel system is new in overall concept or in inte-gration of existing/use of emerging technologies, or both, so that the development outcomes (mainly performance and cost) can-not be confi dently predicted on the basis of studies alone.
• Th e operational employment doctrine has not been clearly defi ned and demonstrated and is therefore subject to substantial uncertainties and change.
• Th e eventual size of the production run and the subsequent operational life are uncertain (an obvious consequence of the uncertainties surrounding the cost, capabilities, and operational concept of the system).
• Th e nature of the key uncertainties is such that they can be resolved only through development and test of a system or through proto-types, hopefully at a cost that is commensurate with the potential value of the system.
Th e case of unmanned aerial systems (UASs) during the 1980s and early 1990s illustrates many of these characteristics. It had been
technically possible to build generic UAS plat-forms for several decades, and many had been built and used as aerial targets and reconnais-sance drones. Th roughout that period, various combat and combat-support roles had been posited for UASs, but every proposed appli-cation raised a host of troublesome issues: exactly how would UASs be controlled, espe-cially in situations demanding deviation from the original mission plan? How would the information normally obtained visually by the
pilot be acquired and translated into mission-relevant decisions? How would safety be ensured during peacetime operations over populated areas? And so on. Despite many studies and a small number of actual development projects that were canceled early, few UAS programs were actually completed in the United States during this time. How can we explain this? A 1997 study (Sommer et al., 1997) suggested a range of possible factors.
Novel systems involve
uncertainty not only with regard
to design, but also in terms
of operational employment and
possible outcomes.

Untying Gulliver: Taking Risks to Acquire Novel Weapon Systems 25
Th e cause of the poor track record of UAV2 programs in the United States is not entirely clear. Certainly, the mere fact of their being unmanned vehicles cannot be the cause. After all, the United States has had great success with other unmanned systems, rang-ing from interplanetary spacecraft and satellites to cruise missiles and submersibles. What, then, makes UAVs unique? A possible explanation is that UAVs in general have never had the degree of operational user support necessary to allow their procurement in suffi cient quantities (perhaps because of funding competitions from incumbent programs, or because of the conjectural nature of their capabilities). Th us, the learning curve is never ascended, multiple failures occur, risk tolerance decreases, unit costs rise as a result, and user support decreases yet further in a diminishing spiral.
In addition to these factors, the acquisition process itself (as defi ned in DoD’s 5000 series of directives) is simply not congenial to programs with a range of important uncertainties. A key problem in developing novel systems lies in the sequence of decisions and actions involved in the defense acquisi-tion process. Early on, when DoD is trying to decide how to fi ll a capability gap, a series of studies are performed, followed by a Milestone A decision, at which point the system concept to be developed is clearly defi ned and the spon-sor commits to funding for development and initial production. In the case of novel systems, major uncertainties and risks are not likely to be adequately resolved at this milestone; thus, the acquisition process eliminates them from further consideration. Th e funding needed to explore and resolve the major uncertainties generally exceeds that which could be obtained by a project, unless it is directly coupled with a major acquisition pro-gram. Th us, uncertainties are unresolved, and progress is stifl ed.
2 Unmanned aerial systems (UASs) were formerly called unmanned aerial vehicles (UAVs).
Major uncertainties in novel systems generally will not be resolved by Milestone A; this means they are eliminated from further consideration.

26 From Marginal Adjustments to Meaningful Change
123456789
101112131415161718192021222324252627282930313233343536
In the commercial world, some of the most successful products are ones consumers never knew they needed until they came on the mar-ket—iPods, cell phones, digital cameras, Blackberries, GPS navigation systems, Bluetooth headsets, et cetera. To achieve these breakthroughs, businesses accept a greater amount of risk in developing some of their product lines.
A Strategy for Fielding Novel Systems Concepts
Th e characteristics of novel systems are so diff erent from those of the systems for which the present acquisition process was designed that we believe “tinkering” with the present process is impractical. To formu-
late more appropriate procedures, we identify major elements of an acquisition strategy that would be more consistent with the special fea-tures of novel systems and with the expected environment of urgency that might attend their development.
Provide an Environment That Fosters New Concepts for Systems and New Concepts of Operations. To provide a rich source of new options to address emerging threats in a timely manner, DoD needs (1) staff who combine both technical and operational experience and skills and (2) a culture in which innovation is constrained only by perceptions of technical feasibility and relative operational value compared to other innovative investment ideas, not by current doctrine on force composi-tion and employment.
Monitor Civilian Technologies That Could Be Integrated in Unique Ways to Give Warfi ghters New Capabilities.3 Th is second element is
3 Th e idea of a single technological breakthrough, while popular, is belied by fact. Advances have not come with the introduction of a spectacular new technology, but with the integration of several known and often rather mundane existing technologies.
A new strategy is needed to oversee development and demonstration of
novel systems.

Untying Gulliver: Taking Risks to Acquire Novel Weapon Systems 27
needed because the level and scope of the private sector’s investment in fast-moving commercial technologies outpace DoD’s eff orts to shape the marketplace. Integrating and morphing commercial technologies into unique and new warfi ghting capabilities should be opportunity driven, rather than need driven, as is currently the case.
Upon Successful Demonstration of a New System, Permit Early, Pro-visional Fielding and Operation Before Completion of Full Matura-tion Development and Associated Testing. Th e third element of the strategy focuses on the later phases of acquisi-tion. Today’s acquisition procedures demand (1) extensive eff ort toward system maturation to minimize support costs, together with (2) extensive operational testing to ensure that no signifi cant lingering problems and defi ciencies exist. Th e interrelationships of funding, test-ing, and buying hardware that occur at this point should be examined with the objective of relaxing their interdependency. Delinking funding approvals from testing status could allow a novel system to proceed through an appropriation threshold and would break the link with service “requirements.” Th is delinking will reduce costs and proj-ect duration, getting the system to the warfi ghter sooner, but with less maturity than traditional systems.
Th is element is the most radical one of the acquisition strategy rec-ommended in this paper, and it poses the most challenging implemen-tation problems, but it potentially contains the most powerful tactic for moving an innovative new system concept to early operational capabil-ity. To implement this element will require establishment of “experi-mental” operational units designed to receive and operate systems that are not quite technically mature, that are not fully provisioned with support and training aids, and that lie outside the main thrust of acqui-sition policy for traditional major defense acquisition programs.
Encourage Timely and Visionary Decisions on Novel Programs by Decreasing the Need for Extensive Staff Support and Documentation
Our most radical proposal—and most powerful tactic to acquire novel systems—is to delink funding, testing, and buying.

28 From Marginal Adjustments to Meaningful Change
123456789
101112131415161718192021222324252627282930313233343536
and by Giving a Few Junior Offi cials More Authority for These Pro-grams. Th e fourth element of the strategy is needed to remove the
extensive and lengthy documentation and review procedures now required for milestone approval, especially at Milestone A. Th ose pro-cedures were designed to ensure a full exami-nation of all alternative concepts, to create a broad-based consensus on the selected concept and to manage risk. Such extensive documen-tation and reviews might make sense when the proposed new system concept is an extension of previous design concepts and operational employment strategies because a broad accu-
mulation of experience and historical data are available. However, such accumulation of experience and corresponding data do not exist for novel systems concepts. Further, DoD may have put too much faith in senior offi cials to make judgments and decisions about concepts with which they and their staff s have little or no experience. Th ose offi cials operate in an environment that severely criticizes them for any unsuc-cessful project. Many of our current “rules” are designed to govern the perceived excesses of acquisition offi cials. Giving junior executing offi -cers more fl exibility and responsibility, while holding them account-able, may be a more realistic and more eff ective approach.
Systematically Accumulate Lessons Learned About Managing the Development and Demonstration of Novel Systems and Operational Concepts. Almost without exception, novel systems have been con-ceived, designed, and developed outside of the conventional acquisi-tion system. All of the services have a quick reaction capability that functions outside normal acquisition rules and focuses on very quickly fi elding innovative concepts and novel systems. Similarly, DoD’s Defense Advanced Research Projects Agency and, in the private sector, Lockheed Martin’s Skunk Works and Boeing’s Phantom Works have acquired extensive experience with novel systems.
Th e point is that there are people and organizations that have sig-nifi cant experience with technology development, cleverly integrating
DoD will need to establish
“experimental” operational
units designed to receive and
operate systems that are not quite
technically mature.

Untying Gulliver: Taking Risks to Acquire Novel Weapon Systems 29
existing technologies and making changes in tactics that can help DoD more eff ectively bring innovation and novel systems to warfi ghting. An in-depth, systematic analysis of successful as well as ineff ective orga-nizational and managerial attributes for fostering innovation in the absence of a competitive, free market would help DoD establish new organizations with explicit charters for experimentation, testing and learning, and demonstration.
Conclusions
Each of these elements has been applied in the past under special circum-stances, with benefi cial results—for example, in developing the F-117, sea-launched ballistic missiles, cruise missiles, and UASs. But “special case” applications hinder the systematic development of management expertise and eff ective management processes. Moreover, these applica-tions were diffi cult to implement and transition to operational forces due to an acquisition environment that favors more detail about the end stages of a program than these mechanisms can provide.
Hence, we believe it appropriate and desirable to devise a less for-mal, less “standard” path for the acquisition of novel systems, based on the strategy outlined above. By understanding the environmental attri-butes to foster novel systems, DoD will signal that novel system ideas and concepts will be encouraged, and it will bestow a military advan-tage to U.S. warfi ghters as the fi rst nation to develop and use them.

123456789
101112131415161718192021222324252627282930313233343536
31
CHAPTER THREE
Dollar Value and Risk Levels: Changing How Weapon System Programs Are Managed
Robert Murphy and John Birkler
Introduction
Currently, acquisition programs are grouped and then managed at the Offi ce of the Secretary of Defense (OSD) by dollar value; depending on the dollar value, OSD provides diff erent levels of oversight and diff erent management processes. Th is approach has been constantly refi ned over the years without having produced any noticeable improvement in terms of reducing the cost growth, schedule slip-page, and performance shortfalls that continue to plague the acquisi-tion of weapon system programs. Th is paper argues for a diff erent paradigm: Th e level of overall risk inherent in a program should be the main basis for determining the process and level of review a proj-ect should receive.1
Drawing upon examples from warship acquisition programs, this paper also argues that inadequate assessment and management of various discrete program risks result in adverse cost, schedule, and performance outcomes. We examine existing scales for assessing some of these discrete program risks and make recommendations to better assess and manage several programs within the Defense Acquisition Management System.
1 Cost is a factor that must be considered when determining the level of review. A multi-billion dollar program requires high-level review because even a small amount of cost growth involves large dollar amounts.

32 From Marginal Adjustments to Meaningful Change
123456789
101112131415161718192021222324252627282930313233343536
Managing by Risk Level Versus Dollar Value
Currently, OSD requires review of acquisition programs and decisions by senior offi cials on the basis of a program’s dollar value, irrespective of risk, as shown in Table 3.1.
However, some very costly projects might have signifi cantly less risk than proj-ects of similar cost, and thus should require less oversight as well as the use of diff erent criteria at milestone reviews.2 Conversely, projects may cost little but have a lot of
risk because they tend to push the state of the art in technology and may also involve novel business or design processes that may require more comprehensive oversight than just dollar value would otherwise indicate. An excellent example of this type of program—the Advanced SEAL Delivery System (ASDS)—was discussed in a May 2007 report by the U.S. Government Accountability Offi ce (GAO). Th e ASDS is a Special Operations Forces’ battery-powered submersible carried to a deployment area by a submarine. Th e operating parameters for the submersible required development of batteries that would push the state of the art in that technology. Th e initial design, construct, and deliver contract was awarded for $70 million in 1994 for delivery in 1997; because of the dollar value, Milestone Decision Authority (MDA) resided with the Navy, which ultimately accepted delivery of ASDS in 2003 in “as is” condition at a cost in excess of $340 mil-lion. GAO concluded that “had the original business case for ASDS been properly assessed as an under-resourced, concurrent technology, design, and construction eff ort led by an inexperienced contractor,
2 For example, the Navy is about to restart construction of two DDG 51-class destroyers at a cost in excess of several billion dollars. Over 60 destroyers of this class have already been delivered or are in the fi nal stages of construction. Because of this track record, restarting con-struction of two new DDG 51s will no doubt expose the Navy to a far less risk of adverse cost, schedule, and performance outcomes than construction of three multibillion DDG 1000-class ships, which are now being designed and just entering construction.
OSD oversight is based on a program’s
dollar value, irrespective of risk.

Dollar Value and Risk Levels 33
DoD might have adopted an alternative solution or strategy” (GAO, May 2007, p. 13).
Focusing on Causes Rather Than Consequences
Risk, or the exposure to the chance of failure, is a word heard fre-quently in the acquisition community. All acquisition programs face risk of some form or another. Arguably, any new major weapon system that could be developed, produced, and fi elded with no risk involved is probably not worth acquiring.
Table 3.1Basis and Level of Program Oversight
Program Acquisition Category (ACAT) Basis for ACAT Designation Milestone Decision Authority (MDA)
I Estimated total expenditure for research, development, test, and evaluation (RDT&E) of more than $365 million or for procurement of more than $2.190 billion
ACAT ID: Under Secretary of Defense for Acquisition, Technology, and Logistics
ACAT IC: Head of DoD Component (e.g., Secretary of the Navy) or, if del-egated, DoD component acquisition executive (e.g., Assistant Secretary of the Navy for Research, Development, and Acquisition)
II Estimated total expenditure for RDT&E of more than $140 million or for procurement of more than $660 million
DoD component acquisition executive or designate (e.g., program executive offi cer)
III Does not meet criteria for ACAT II or above; less than a MAIS program
Designated by DoD component acqui-sition executive at the lowest level appropriate (e.g., program manager)
SOURCE: DoD, December 8, 2008.
NOTE: Estimated expenditures are in FY 2000 constant dollars.

34 From Marginal Adjustments to Meaningful Change
123456789
101112131415161718192021222324252627282930313233343536
Overtly or otherwise, much of a program manager’s time is spent managing risk. After all, the Defense Acquisition Management System, shown in Figure 3.1 is, in essence, a risk-management process designed to ensure success in the timely delivery of weapon systems that meet warfi ghter requirements while staying within budget.
Th e risks most frequently mentioned by defense acquisition offi -cials are cost growth, schedule slippage, and performance shortfalls. Th is is not surprising as cost, schedule, and performance are the pri-
mary attributes by which programs are assessed for success or failure. Moreover, the Defense Acquisition University (p. 2) teaches that cost, schedule, and performance are the risk factors that program managers must assess and man-age “to ensure that DoD is acquiring optimum systems that meet all capability needs.”
Assessment of cost, schedule, and per-formance is clearly a management task, and a good program manager assesses these risks
using periodic data accumulated into management reports to identify problems, regain lost ground, and then stay on track. However, these are broad measures of risk. A better program manager proactively man-ages by using discrete program risks, submeasures that allow him or her
Managing by cost, schedule,
or performance risks is reactive;
managing by discrete
programmatic risks is more proactive.
Figure 3.1The Defense Acquisition Management System
SOURCE: DoD, December 2, 2008.

Dollar Value and Risk Levels 35
to look ahead and act to avoid adverse cost, schedule, and/or perfor-mance trends and outcomes. In other words, managing by cost, sched-ule, and performance measures is akin to driving a car while looking solely in the rearview mirror: it is possible, but only if the road stays straight. A better driver looks mostly out the windshield, with only an occasional look in the mirror; this driver anticipates and easily handles curves in the road.
In this paper, we focus on fi ve discrete programmatic risk cate-gories:
• technical• system integration• design• production• business.
Taken together, these risk categories portray overall acquisition pro-gram risk.3 Th ey interact in numerous ways to aff ect a project’s cost, schedule, and/or performance outcomes: Obviously, technologies that do not work aff ect performance, but so can poor business decisions that increase cost and lead to features being deleted from the weapon system to remain within budget.
Th e Defense Acquisition Management System appears to ade-quately recognize that incorporation of new technologies into a weapon system presents risk, providing metrics to systematically assess this type of risk. Time is also provided in the acquisition process for system integration matters to be identifi ed and resolved, although there is room for improvement. However, as will be discussed in sub-sequent examples, new approaches in design, production, and busi-ness areas of acquisition programs do not appear to receive the same skepticism and comprehensive oversight that new technologies and systems receive.
3 For simplicity, risks involved in fi elding, operating, and maintaining the weapon system are not addressed in this paper.

36 From Marginal Adjustments to Meaningful Change
123456789
101112131415161718192021222324252627282930313233343536
Well-Defi ned Process for Assessing Technical Risk Is in Place
“Technical risk” is exposure to the chance that development of critical technologies will not meet program objectives within cost and schedule constraints. In assessing technical risk, program managers must address
the uncertainty in their estimates about how much time and eff ort it will take to make new technologies work. Th e importance of techni-cal risk is well understood in the acquisition community. For example, DoD guidance states that “the management and mitigation of tech-nology risk . . . is a crucial part of overall pro-gram management and is especially relevant to meeting cost and schedule goals” (DoD, 2008, para. 3.7.2.2).
Technical risk is also extensively addressed in the Defense Acquisition Management Sys-
tem. Th e system recognizes evolutionary acquisition as the preferred DoD strategy for rapid acquisition of mature technology for the user. One purpose of evolutionary acquisition (i.e., delivering capability in increments through spiral or incremental development) is to pro-vide time to better manage technology risk and avoid adverse cost and schedule outcomes that often result from trying to achieve diffi cult requirements in one step.
DoD has also established a well-defi ned process based on Tech-nology Readiness Levels (TRLs) to categorize technical risk and help ensure that key decisionmakers understand the risk of incorporating diff erent technologies into weapon system acquisition programs (the TRLs are described in Table 3.2). Using this process, program offi ces conduct a technology readiness assessment under the auspices of the DoD Component Science and Technology (S&T) Executive; the Dep-uty Under Secretary of Defense (S&T) evaluates the technology readi-ness assessment and forwards fi ndings to the Overarching Integrated Product Team leader and Defense Acquisition Board.
Th e TRLs are a good proxy measurement for technical risk: Th e lower the readiness level, the more development needed to incorpo-rate the technology into a weapon system; and the more development
The Defense Acquisition System
Framework incorporates
assessment of technical risk and
system integration risk but puts less
emphasis on other types of risk.
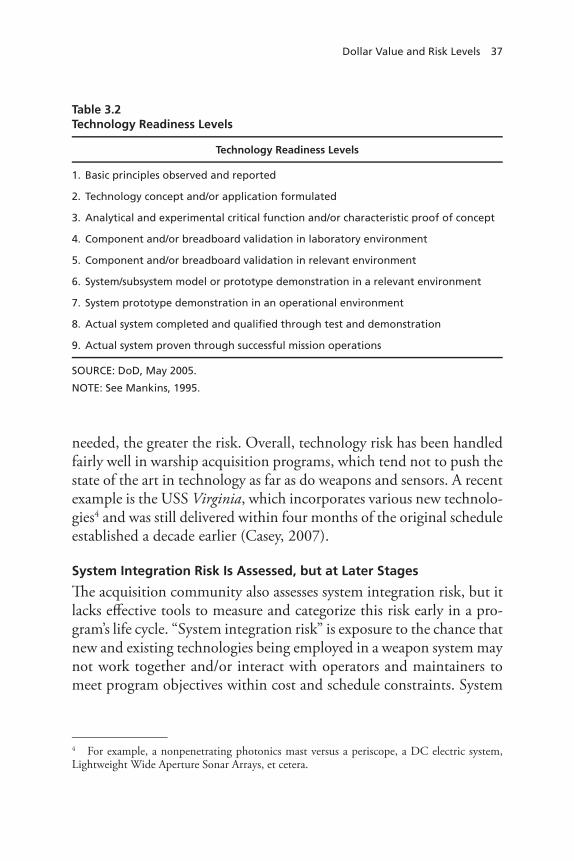
Dollar Value and Risk Levels 37
needed, the greater the risk. Overall, technology risk has been handled fairly well in warship acquisition programs, which tend not to push the state of the art in technology as far as do weapons and sensors. A recent example is the USS Virginia, which incorporates various new technolo-gies4 and was still delivered within four months of the original schedule established a decade earlier (Casey, 2007).
System Integration Risk Is Assessed, but at Later Stages
Th e acquisition community also assesses system integration risk, but it lacks eff ective tools to measure and categorize this risk early in a pro-gram’s life cycle. “System integration risk” is exposure to the chance that new and existing technologies being employed in a weapon system may not work together and/or interact with operators and maintainers to meet program objectives within cost and schedule constraints. System
4 For example, a nonpenetrating photonics mast versus a periscope, a DC electric system, Lightweight Wide Aperture Sonar Arrays, et cetera.
Table 3.2Technology Readiness Levels
Technology Readiness Levels
1. Basic principles observed and reported
2. Technology concept and/or application formulated
3. Analytical and experimental critical function and/or characteristic proof of concept
4. Component and/or breadboard validation in laboratory environment
5. Component and/or breadboard validation in relevant environment
6. System/subsystem model or prototype demonstration in a relevant environment
7. System prototype demonstration in an operational environment
8. Actual system completed and qualifi ed through test and demonstration
9. Actual system proven through successful mission operations
SOURCE: DoD, May 2005.
NOTE: See Mankins, 1995.
38 From Marginal Adjustments to Meaningful Change
123456789
101112131415161718192021222324252627282930313233343536
integration can be an issue within an individual acquisition program (e.g., when subsystems fail to interact). It can also be an issue between acquisition programs: Many programs develop capabilities that are a component of a larger warfi ghting capability; individually, the compo-nent programs might appear to be a low or moderate risk, but in com-bination with other programs, the overall risk might be much higher due to coordination and integration issues. A classic example occurred during the Grenada invasion when Army and Navy communications systems did not interact well during the joint operation.
System integration risk is extensively treated after Milestone B, during the engineering and manufacturing development (EMD) phase, at which time a program should demonstrate system integra-tion, interoperability, safety, and utility (DoD, 2008, para. 3.7.1.1). While appropriate attention is given to system integration risk dur-ing this phase, this assessment occurs after the second of three mile-stones in the process, when programs have typically built up so much momentum that they are diffi cult to stop, regardless of performance or progress. Early consideration of system integration risk—at Milestone A—by senior decisionmakers could result in developing and fund-ing integration-risk mitigation plans that could considerably improve acquisition outcomes.
Combat systems in warships provide an example of the problems that arise when decisions are made without adequate consideration of system integration risk.5 For example, early decisions on systems archi-tecture and processing approaches made without adequate consider-ation of risk led to cost, schedule, and performance problems with submarine combat systems for the SSN 688I, SEAWOLF, and Austra-lian Collins-class submarines. According to a report for the Parliament of Australia discussing the Collins-class submarine (Woolner, 2001),
Of the early decisions in the Collins program, the one which was to have the most public eff ect was that concerning the nature of the
5 A combat system integrates information from sensors, synthesizes this information for combat commanders, and provides fi re control solutions and guidance to weapons.

Dollar Value and Risk Levels 39
vessels’ Combat Data System (CDS). It has been the subsequent failure of this system to meet its design requirements that has left the submarines with a severely impaired combat capability.
By the end of 1982, . . . [the Royal Australian Navy (RAN)] had decided that the electronic combat systems of the new boats would be fully integrated. Instead of the then standard central computer performing all data analysis, the new submarine CDS would use a data bus to distribute information to a number of smaller computer work stations.
Th e report then goes on to discuss the lack of appreciation for the risk of switching to the new integrated architecture for combat systems.
Th e RAN was not alone in its ‘grand folly’. . . . Th e Australian information technology (IT) industry assured the RAN of both the feasibility and inherent advantages of a fully integrated com-bat system and of its ability to contribute to such a program.
Moreover, the RAN was not the only navy to think that the future of combat data processing lay with fully integrated systems. Th e USN [U.S. Navy] specifi ed the same concept for its [BSY-2] Inte-grated Combat System for the U.S. Navy’s Seawolf class nuclear attack submarines. Th is was an even more costly failure than the Collins CDS, absorbing . . . $1.5 billion [in U.S. dollars] before it was cancelled.6
Tools for assessing system-integration maturity earlier on have been proposed. For example, Sauser et al. (2008) have proposed a System Readiness Level (SRL) index that would incorporate the cur-rent TRL scale as well as an Integration Readiness Level (IRL) scale. Th e IRL scale they describe would use nine levels, which appear com-patible with the widely used TRLs and appear to be a good proxy
6 Th e original citation mistakenly attributed this to the BSY-1 program.

40 From Marginal Adjustments to Meaningful Change
123456789
101112131415161718192021222324252627282930313233343536
measurement of system integration risk. Th e proposed IRLs are listed in Table 3.3.
The Risks of Design Process Management Are Not Well Understood
“Design risk” is exposure to the chance that the weapon system’s design will not result in eff ective operation or be easy to produce. It is axiomatic that a good design is essential to a weapon system’s per-formance, but the impact of design on a weapon system’s production cost and schedule outcome is not as well appreciated. However, deci-sions made early in the design process quickly establish not only the performance but also the ease of manufacture and resultant cost of the weapon system. While the ability of the design to operate eff ectively can be considered a subset of technical risk, a more holistic approach
Table 3.3Integration Readiness Levels
Integration Readiness Levels
1. An interface between technologies is identifi ed with suffi cient detail to allow char-acterization of the relationship.
2. There is some level of specifi city to characterize the interaction (i.e., ability to infl u-ence) between technologies through their interface.
3. There is compatibility (i.e., a common language) between technologies to orderly and effi ciently integrate and interact.
4. There is suffi cient detail in the quality and assurance of the integration between technologies.
5. There is suffi cient control between technologies necessary to establish, manage, and terminate the integration.
6. The integrating technologies can accept, translate, and structure information for their intended application.
7. The integration of technologies is verifi ed and validated with suffi cient detail to be actionable.
8. Actual integration is completed and mission qualifi ed through test and demonstra-tion in the system environment.
9. Integration is mission proven through successful mission operations.
SOURCE: Sauser et al., 2008.

Dollar Value and Risk Levels 41
is for a program manager to assess the chance that the design process to be employed for the weapon system will generate an eff ective, easy-to-produce weapon.
Th e design process necessary for an eff ective and producible weapon system involves complex interactions between designers, sup-pliers, production experts, planners, and estimators. Design process complexity has also increased with the availability of more sophisti-cated design tools such as electronic product models and computa-tional techniques (e.g., fi nite element analysis).
Outcomes from two current acquisition programs—the United Kingdom’s ASTUTE-class submarine and the U.S. Navy’s LPD 17-class of amphibious transport dock ships—demonstrate why senior decision-makers in the OSD acquisition process need to better understand the risks new design processes and tools present. Th e ASTUTE was the fi rst UK submarine to be designed through use of an electronic, three-dimen-sional computer product model. Th e prime contractor’s inability to manage this new pro-cess resulted in extensive delays when design products needed to build the ship were late. General Dynamics ulti-mately had to be hired to augment and manage the fi nal stages of the submarine’s detail design process. Because of design and other prob-lems, the ASTUTE program has overrun cost greatly and is years behind schedule.
With LPD 17, the U.S. Navy competed the design and produc-tion of the fi rst three ships of the class using as major evaluation and award criteria (1) the plans for accomplishing detail design and other functions, (2) Integrated Product Data Environment (IPDE) tools, and (3) life-cycle cost projections; these criteria were given more weight than price (Comptroller General of the United States, 1997). Th e then Avondale Shipyard in New Orleans, Louisiana, partnered with a fi rm that was developing a new ship design IPDE tool and won the compe-tition. Subsequently, the LPD 17 experienced considerable cost growth (about 70 percent) and schedule delays (Congressional Research
Two current acquisition programs illustrate why better insight is needed into the risks of new design processes and tools.

42 From Marginal Adjustments to Meaningful Change
123456789
101112131415161718192021222324252627282930313233343536
Service, 2008, p. 12). GAO attributed much of this cost growth to the new design tool (GAO, July 2007):
In the LPD 17 program, the Navy’s reliance on an immature design tool led to problems that aff ected all aspects of the lead ship’s design. Without a stable design, work was often delayed from early in the building cycle to later, during integration of the hull. Shipbuilders stated that doing the work at this stage could cost up to fi ve times the original cost. Th e lead ship in the LPD class was delivered to the warfi ghter incomplete and with numerous mechanical failures.
Senior decisionmakers should require a program manager pro-posing to use new design processes, tools, or organizations to design a weapon system to justify selection of the new process, tool, or orga-nization and develop an appropriate risk mitigation plan. An example of a design process mitigation plan comes from the VIRGINIA-class submarine program. Prior to VIRGINIA-class construction using a new Integrated Product and Process Development (IPPD) approach, Electric Boat started
a representative section of the ship about a year early with a portion of that section started about two years early. Th is early, controlled, closely monitored ship construction eff ort ensured thorough preparation for full-ship application and high confi dence in the new process. (General Dynamics Electric Boat, 2002, p. 33)
Evaluation of Production Risks Lacks Rigor
An earlier and more rigorous evaluation of production risks could save DoD much diffi culty and taxpayers a lot of money. “Production risk” is exposure to the chance that the facility, labor, manufacturing processes, and procedures will fail to produce the weapon system within time and cost constraints. Producibility—or “production capability”—is a func-tion of the design; production facilities; management skills, processes, and experience; and workforce skills and experience. DoD requires assessment of contractors’ production capability before production

Dollar Value and Risk Levels 43
contract award in the production and deployment phase, but this may be too late because, at this point, production may be locked in by the organization that won the design contract. Moreover, in the authors’ experience and as exemplifi ed in the LPD 17 source-selection criteria discussed earlier, the production category of risk does not receive the same emphasis in selecting a shipbuilder as other factors, such as design concepts, past performance, and estimated cost.
Th e Navy’s DD 963-class of destroyers and LHA 1-class of amphibious assault ships are classic examples of programs in which DoD considered design and production risk acceptable when award-ing contracts, but which went on to experience about the worst of every production factor possible. Th ese ships presented little technical and system integration risk, but ended up far behind schedule and over cost due in part to identifi able production risks. Contracts were awarded to the lowest bidder, Litton Indus-tries, which owned the Ingalls shipyard in Pas-cagoula, Mississippi. In the late 1960s, Litton Industries decided to invest in an expansion of design and production facilities for warships, building a new shipyard on the west bank of the Pascagoula River, across from its existing ship-yard. Th e new shipyard was designed to be operated with a new pro-duction control system using modular techniques for building ships (Northrup Grumman, 2008).
After the award of the LHA- and DD 963-class contracts to Ingalls for nine LHAs and 30 DD 963s in the late 1960s, Ingalls’ management decided to shift construction of some commercial container ships from the old, conventional yard to the new facility (Northrup Grumman, 2008). Th e expectation was that doing so would allow the new facility to start up and have any problems worked out while the LHA and DD 963 were being designed. However, production of the container ships using the new control system led to delays; consequently, the ships were occupying facilities and using manpower needed to start produc-tion of the LHAs and DD 963s. Production of the LHAs and DD
Acquisition programs can end up far behind schedule and over cost when production risks are not adequately assessed.

44 From Marginal Adjustments to Meaningful Change
123456789
101112131415161718192021222324252627282930313233343536
963s fell far behind and, in combination with other problems (design-related issues, infl ation, et cetera), the costs were overrun substantially and the ships were late (GlobalSecurity.org, 2008).
A greater emphasis on evaluating production risks could have saved an enormous amount of time and money, but the promised cost savings resulting from construction in a new state-of-the-art ship fabri-cation and assembly facility proved too good to be true. Th e assessment that the facility would be derisked by building container ships fi rst turned out to be wrong, and meanwhile, two entire classes of ships had been priced and placed under contract.
A promising approach, initiated by the Missile Defense Agency, may provide program offi ces across DoD with better insight about production risk. Th e agency extended the notion of TRLs to engineer-ing and manufacturing by developing Engineering and Manufacturing Readiness Levels (EMRLs) to assess the maturity of a program’s design, related materials, tooling, test equipment, manufacturing, quality, and reliability levels. Th ere are fi ve EMRLs, as shown in Table 3.4.
Table 3.4Engineering and Manufacturing Readiness Levels
Engineering and Manufacturing Readiness Levels
1. System, component, or item validation in laboratory environment or initial relevant engineering application or breadboard, brass-board development.
2. System or components in prototype demonstration beyond breadboard, brass-board development.
3. System, component, or item in advanced development. Ready for low-rate initial production.
4. Similar system, component, or item previously produced or in production. System, component, or item in low-rate initial production. Ready for full-rate production.
5. Identical system, component, or item previously produced or in production. System, component, or item in full-rate production.
SOURCE: DoD, 2005.

Dollar Value and Risk Levels 45
The Risk of Early Business Decisions Is Not Fully Appreciated
Business decisions made early in a program’s life can signifi cantly aff ect cost, schedule, and performance outcomes. “Business risk” is exposure to the chance that the overall acquisition strategy for a program will not result in the desired cost, schedule, and/or performance outcomes. Decisions about the process to select who will build the weapon sys-tem, the standards to which it will be built, and the schedules for designing and building it all entail risk that is not always appreciated up front. To evaluate business risk, program managers should assess the following: (1) the extent to which the acquisition strategy can result in selection of the most eff ective, effi cient design and most eff ective, effi cient production entities; (2) whether cost estimates and schedules are valid; (3) whether proper government oversight organizations are in place; and (4) whether project personnel with proper training and experience are available.
A good example of early business decisions gone bad is the Navy’s Littoral Combat Ship (LCS) Program. Th e lead ship, USS Freedom (LCS 1), was recently delivered after experiencing substantial cost over-runs and delivery delays. In congressional testimony given to explain these outcomes, the U.S. Navy (2007) identifi ed the following tenets of the new business model used to acquire the LCS:
• Construction of LCS seaframes in midtier shipyards that “per-form predominately commercial work, maintaining business pro-cesses and overhead structures that keep them competitive in the world market” (i.e., little warship experience).7
• “A rapid 24-month build cycle for each seaframe, as opposed to the fi ve or more years that have become the norm in naval shipbuilding.”
7 To better understand the diff erences between military and commercial shipbuilding, see Birkler et al., Diff erences Between Military and Commercial Shipbuilding: Implications for the United Kingdom’s Ministry of Defence, Santa Monica, Calif: RAND Corporation, MG-236-MOD, 2005.

46 From Marginal Adjustments to Meaningful Change
123456789
101112131415161718192021222324252627282930313233343536
• “Th e LM lead ship detail design and construction eff ort was initi-ated simultaneously and the lead ship commenced construction only seven months after the start of fi nal design (i.e., concurrent design/build).”
• “In order to address the challenges of technical authority under this environment (reduction in NAVSEA technical personnel), in Feb-ruary 2003, NAVSEA and PEO Ships made two joint decisions. Th e fi rst was to work with the American Bureau of Shipping (ABS) to develop a set of standards (Naval Vessel Rules) that could be applied to non-nuclear naval combatant ships. Th e second was to utilize ABS to class8 both LCS and DDG 1000 using the new rules.”
No doubt there were good arguments for these individual pro-gram tenets. However, the cumulative eff ect of the risks involved in building a new design warship in small commercial shipyards with little warship experience during a rapid, concurrent design/build pro-cess and to a set of technical standards themselves under development appears to have been greatly underappreciated. In that same congres-sional testimony, the Navy identifi ed cost drivers for LCS 1 as “concur-rent design-and-build while incorporating Naval Vessel Rules (NVR), reduction gear delays created by a manufacturing error, and insuffi cient program oversight” (U.S. Navy, 2007). Th e risks inherent in utilizing an entirely new business model to acquire warships were obviously nei-ther adequately assessed nor managed.
One way to avoid such risk would be to require program manag-ers proposing new and/or radical business models to fully justify why the new model is superior to past practice, recommend more frequent assessment points than now required by the Defense Acquisition Man-agement System, and incorporate exit strategies in contracts for the government to use if the program fails to meet expectations.
8 Th e American Bureau of Ships is known in the commercial shipping industry as a “clas-sifi cation society,” which is an organization that sets standards for design and construction of vessels and integral machinery within.

Dollar Value and Risk Levels 47
Conclusions
Th e Defense Acquisition System Framework has suffi cient tools and allows time for proper assessment and management of technical risk and, to some extent, of system integration risk. However, design, pro-duction, and business risks are not always adequately assessed and man-aged. As shown in this discussion, scales exist that represent good proxy measurements of technical, systems integration, engineering, and pro-duction risks; what is missing are descriptive levels that could be used to assess and categorize design and business process risk. We recommend that DoD explore establishing such levels and, in Tables 3.5 and 3.6, off er starting points for doing so (based on the authors’ experience), which may help program managers more carefully consider these risks.
In addition, we recommend the following actions to better assess and manage program risk overall:
• Assess, categorize, and individually review each technical, system, design, production, and business risk of a program at each mile-stone in the Defense Acquisition Management Framework.
• Require program managers to justify new or radical approaches to design, production, or business processes and develop and imple-ment risk mitigation plans and/or contract off -ramps.
Table 3.5Proposed Design Process Levels
Design Processes
1. New, unproven processes. New design tools under development. New design organization.
2. Large expansion of existing design organization. Many new designers and supervi-sors unfamiliar with design tools and processes.
3. Existing design organization using radically changed design tools, processes, and/or technologies.
4. Experienced design organization using new design tools with proven processes.
5. Experienced design organization using existing, proven design tools and processes.

48 From Marginal Adjustments to Meaningful Change
123456789
101112131415161718192021222324252627282930313233343536
Although such tools would enhance the ability of program offi ces to assess and manage risk, DoD should also consider changes in over-sight. As stated at the outset of this paper, the current acquisition system requires review and decisions by senior offi cials on the basis of a program’s dollar value, irrespective of risk. A better use of their limited time may be to focus on programs with high risks, letting less-senior offi cials deal with lower risk programs, regardless of dollar value. For example, DoD could
• lower the MDA level for future milestones down—two levels for programs with low risk in all risk categories9
— one level for programs with moderate risk in all risk categories10
9 Determination of what constitutes “low risk” is obviously subjective. For our purposes, “low risk” would be technology and integration levels 8 and 9 and EMRL, design, and busi-ness levels 4 and 5.10 For our purposes, “moderate risk” would be TRL and IRL 5 and 6 and EMRL design and business levels 3.
Table 3.6Proposed Business Process Levels
Business Processes
1. Using a new, unproven approach to source selection. Encouraging new sources of supply. Acquiring new technologies without well-established cost-estimating relationships. Requiring new government and/or contractor organizations to be formed.
2. Using new procurement process in established industry. Cost-estimating rela-tionships only at high levels. Requires expansion of government and contractor organizations.
3. Evolutionary change from prior acquisition strategies. Good cost-estimating rela-tionships. Existing government and contractor organizations can easily adapt to changes.
4. Using same approach to buying similar products. Well-established cost-estimating relationships exist. Experienced government and contractor organizations involved.
5. Acquiring more of what has been successfully bought before. Using the same con-tractor and government organizations.

Dollar Value and Risk Levels 49
• continue to follow the patterns for decision authority as estab-lished in the Defense Acquisition Management System for any program with greater than moderate risk in any of the fi ve catego-ries of program risk.
In this way, senior decisionmakers might be able to better con-centrate their limited time on the real potential problem areas in a program before problems occur, and direct actions to be taken to avoid and/or mitigate potential problems.

123456789
101112131415161718192021222324252627282930313233343536

51
CHAPTER FOUR
Improving Acquisition Outcomes: Organizational and Management Issues
Irv Blickstein and Charles Nemfakos
Introduction
Despite years of change and reform, DoD continues to develop and acquire weapon systems that it cannot aff ord and cannot deliver on schedule. Th e U.S. Government Accountability Offi ce reported, for example, that research and development costs in 2008 for selected major programs were 42 percent higher than originally estimated and that the average delay in delivering initial capabilities had increased to 22 months (March 2009, p. 1). Also, William Lynn, the new deputy secretary of defense, stated that it will be very diffi cult to sustain a force large enough to meet demands if current acquisition trends continue. Th is suggests that the new administration will have to fi nd ways to halt traditional cost growth associated with fi elding new capabilities—or consider program terminations (Lynn, 2009, p. 16).
Many of the problems that contribute to poor cost and schedule outcomes are systemic to the way that the acquisition process is orga-nized and managed in DoD. It is our purpose in this paper to discuss a few of these problems and how they may be contributing to ineffi ciency and unrealistic expectations. Th ese issues include
• the service chiefs’ role in the acquisition process• the combatant commands’ (COCOMs’) role in the requirements
process• the impact of joint duty on the acquisition process• a growing emphasis on management processes at the expense of
workforce initiative.

52 From Marginal Adjustments to Meaningful Change
123456789
101112131415161718192021222324252627282930313233343536
Organizational and management issues contribute
to ineffi ciency and unrealistic
expectations in the acquisition process.
The Service Chiefs’ Role in the Acquisition Process Is Too Limited
Stronger ties are needed between service leaders who understand warfi ghting needs based on operational experience and those who are responsible for acquiring weapon systems to meet those needs. Over time, a schism has developed in some of the military departments between the service chiefs, who validate war fi ghting requirements, and
the service acquisition chiefs who develop and acquire new weapon and information systems in conjunction with their program executive offi cers and program managers.
A large impetus for the schism was the Goldwater-Nichols Act passed in 1986, which was intended to improve unity of command and push the military departments and the
Joint Chiefs of Staff to instill a more “joint” approach to military opera-tions. Among its key provisions, the act established that only one offi ce in a military department was to have responsibility for that department’s acquisition process, and that offi ce would report to the secretary of the
military department (through a service acquisi-tion executive). In eff ect, the Goldwater-Nich-ols Act put the service chiefs on the sidelines of the acquisition process.
At the time, there was some concern about the impact of this step. For example, Senator Sam Nunn said he “was concerned that we not create an impenetrable wall between the staff s of the service secretary and the service chief ”
(1985). As time has passed, it does appear that the service secretar-ies and the service chiefs, along with their respective staff s, are not regularly engaging in meaningful dialogue.1 Without such dialogue,
1 For example, one program executive offi cer told the authors that “they have substantive discussions of my programs at the Pentagon, but I am not invited.”
Service chiefs have become
increasingly disconnected from
the acquisition process.

Improving Acquisition Outcomes: Organizational and Management Issues 53
service chiefs may be intractable in emphasizing warfi ghting needs at the expense of reducing cost where possible; on the other hand, the acquisition process loses the operational insight that is critical in ana-lyzing trade-off s between cost, schedule, and performance.
To mitigate this problem, the military department acquisition instructions for each military department could be modifi ed to explic-itly state the duties and expectations of the service chiefs and their staff s. As an example, these instructions could state that program deci-sion meetings, where acquisition decisions are made, could be chaired by the service acquisition executive and the service vice chief. Such a revision would send a broad message to those who develop warfi ghting requirements that a link exists between the requirements process and the acquisition process.
The Combatant Commands’ Role in Defense Management
Th ere is a prevailing theory in Washington, D.C., that acquisi-tion outcomes would improve if the combatant commands had a greater role in DoD’s process for determining warfi ghting require-ments. According to this theory, acquisition outcomes would improve because the military departments would better attune themselves to the warfi ghting capabilities that COCOMs need to have as well as when they need to have them; on the other hand, acquisition out-comes would also improve because the COCOMs would have to take fi scal constraints into greater consideration when identifying the capabilities they want.
Th ere is an historic precedent for this concept. Th e idea of addressing warfi ghter needs more directly through participation of the COCOMs in DoD’s decisionmaking processes emerged in the middle 1980s during the Reagan Administration. At that time, Integrated Priority Lists (IPLs) were introduced to allow unifi ed and specifi ed commanders (at that time known as commanders in chief, or CINCs) to infl uence the direction of resource allocation and weapon systems acquisition by identifying their highest priority requirements and

54 From Marginal Adjustments to Meaningful Change
123456789
101112131415161718192021222324252627282930313233343536
making recommendations for programming funds. In concept, IPLs were a compelling idea: the people who are in charge of operationally leading our nation’s military would appear to be the logical ones to determine what they need on the battlefi eld.
In practice, however, this approach did not improve outcomes. Th e then CINCs did put together their lists, but each was quite diff erent from the next, both in content as well as depth. Some were thought-out and actionable (e.g., “I need 40 more Advanced Medium-Range Air-to-Air Missiles in my Area of Responsibility”). Others, however, were vague, and it was unclear what action was needed to address the warfi ghting need. Even when various administrations invited these senior military leaders to Washington, D.C., to present their ideas, it was clear that they were neither attuned to the requirements process nor to the acquisition process and had not given suffi cient thought to the content of their IPLs.
As the type of information in historical IPLs indicates, the com-batant commands are warriors equipped to fi ght today’s wars and to prepare for tomorrow’s threats; they are not equipped for a major role in developing comprehensive, detailed, and thus directly actionable requirements for the DoD acquisition processes. Th is is quite under-standable. Th e COCOMs and their staff s need to spend their tour
of duty understanding their Area of Respon-sibility and their potential adversaries through training, exercises, and building country-to-country military relationships. Taking a major role in DoD management processes would diminish their ability to carry out that mission, and could lead to an excessive emphasis in acquisition on near-term warfi ghting needs at the expense of long-term capability planning as well as to multiple and potentially duplicate
staff s, all of which would ultimately aff ect the acquisition process.Th e COCOMs’ input into the requirements and acquisition
processes is important and necessary, but current Title 10 allocations of responsibility already refl ect the need to divide this labor by estab-lishing the military department secretaries and their service chiefs to
The current system of checks and
balances between the COCOMs and the departmental headquarters are
in an approximate balance.
Improving Acquisition Outcomes: Organizational and Management Issues 55
support the COCOMs by assessing and addressing their requests in light of the funding available, the other demands of their individual departments (e.g., manpower and support), the ability of the public and private sectors to deliver what is possible, the condition of the industrial base, and the amount of risk in a program.
In short, the current systems of the operational commanders and the departmental headquarters already refl ect that the COCOMs can-not do everything and that the United States does not want to distract the COCOMs from winning wars and achieving other military objec-tives and actions within their Area of Responsibility. It is the job of those in Washington, D.C., to reach out to the COCOMs and demon-strate that their needs are being addressed, rather than turn the process over to them.
Joint Duty Requirements Erode Operational Insights Within Acquisition Program Management
Eff orts to instill greater “jointness” in military operations have had an unintended impact on the acquisition process, both diverting line offi -cers away from management roles in the acquisition process and eroding the management credibility of those offi cers who do choose acquisi-tion duty assignments. Prior to the Goldwater-Nichols Act (which required a military offi cer to serve in a joint duty assignment in order to achieve fl ag or general offi cer rank), offi cers could move between “line” operational duty assignments and acquisition duty assignments. After the Goldwater-Nichols Act, they could no longer do so as readily if they wanted to achieve fl ag or general offi cer rank in an operational role because of the limitations of time in a career. Consequently, they lacked the opportunity to develop a deeper understanding of the acqui-sition process by serving in acquisition duty assignments. Furthermore, those who chose to devote their energies to the acquisition realm faced erosion of their operational credentials and lacked credibility when, for example, it came to determining whether a particular performance requirement was truly needed.
56 From Marginal Adjustments to Meaningful Change
123456789
101112131415161718192021222324252627282930313233343536
Finally, as the number of offi cers serving in acquisition roles decreased, a sense emerged of the acquisition process “belonging” to the largely civilian material establishment, not the line offi cers. Interviews with program executive offi cers, senior requirements offi cials, and politi-cal appointees in the acquisition process have provided strong anecdotal evidence that the channels of communications between the services’ requirements and resourcing organizations (managed by line offi cers) and the service acquisition organizations are breaking down, and each realm is making decisions on common programs without consulting the other.
To improve this situation, the new administration could seek legislative change to give key service acquisition positions the equiva-lence of joint duty when it comes to potential promotion to fl ag or general offi cer rank. It would then become much easier for offi cers to move fl uidly between operational and acquisition duty assignments, increasing the linkage between these two realms and also increasing the range of knowledge and expertise both of offi cers participating in the acquisition process and those serving to identify military requirements. Given the pressure on DoD’s acquisition system, accomplishing such a change does not appear to be impossible.
Too Much Emphasis on Management Processes over Creativity and Initiative
Prescribing every step in the acquisition process has led to complexity, rigidity, and delay—not cost savings. Th e instruction that governs the department’s acquisition process (DoD 5000.2) has been under constant review and modifi cation from the late 1980s to today, with major updates issued in 1987, 1991, 1996, 2000, 2003, and 2008. Th e 2008 update references 79 laws, instructions, and directives, some addressing such eso-teric matters as “Transfer Syntax for High Capacity ADC Media” and “Management of Signature Support within the Department of Defense.”2
2 For example, the Defense Procurement and Acquisition Policy (DPAP) offi ce stated that “Th e UID PMO would like to announce the October 4, 2006, publication of ISO/

Improving Acquisition Outcomes: Organizational and Management Issues 57
Recent acquisition reforms, which may have individual merit, together add up to a series of process changes that have reduced man-agement fl exibility and created new layers of bureaucracy. Some of these reforms, implemented under the guidance of former Under Secretary of Defense for Acquisition, Technology, and Logistics (USD (AT&L)) Young with the best of intentions, and at times codifi ed into law by the Congress, include
• competitive prototyping3
• a new series of Joint Action Teams• Capability Portfolio Management Teams• Reliability, Availability, and Maintainability Policy• defi ning the “desirable attributes” of the defense industrial base
and the methodology to assess industry progress toward develop-ing these attributes
• Confi guration Steering Boards (now in law)• Joint Rapid Acquisition Committee.
Th e Joint Staff has also introduced changes that have increased the complexity of the overall acquisition process, replacing the Require-ments Generation System with the Joint Capa-bilities Integration and Development System (JCIDS) in 2003. With JCIDS came a new series of analytic tools and documents. Many of these reforms involve the rote application of rules and the production of prescribed man-agement information in preset templates that may not necessarily be appropriate or appli-cable for a specifi c program. Figure 4.1, which
IEC 15434.3, Transfer Syntax for High Capacity ADC Media, which establishes ‘12’ as the approved Format Code for Text Element Identifi ers.” As of May 14, 2009: http://www.acq.osd.mil/dpap/UID/enewsletter/archive/dec06/.3 See, for example, Drezner, Jeff rey A., and Meilinda Huang, On Prototyping: Lessons from RAND Research, OP-267-OSD, for an in-depth discussion of the benefi ts and issues of com-petitive and other prototyping.
Prescribing every step in the acquisition process has led to complexity, rigidity, and delay—not cost savings.

123456789101112131415161718192021222324252627282930313233343536
58 Fro
m M
argin
al Ad
justm
ents to
Mean
ing
ful C
han
ge
Figure 4.1DoD’s Requirements, Acquisition, and Funding Processes
SOURCE: Defense Acquisition University, 2008.

Improving Acquisition Outcomes: Organizational and Management Issues 59
contains DoD’s representation of the acquisition management frame-work, speaks for itself in terms of the complexity of the department’s requirements, acquisition, and budgeting processes.
From the perspective of the acquisition professionals in the Offi ce of the Secretary of Defense (OSD), in the military department sec-retariats, and in the program manager and program executive offi ces across DoD, the extent to which these changes govern their actions leads to only one conclusion: Success means getting a program through the wickets—not the application of logic, cost-cutting measures, or technology. Of course, their job should be to think, create, or seek effi -ciencies, but the process motivates them instead to follow rules in a rote manner. Changes the Clinton administration made to contracting rules in the middle 1990s shed some light on the impact of DoD’s emphasis on management processes. Th at administration eliminated all specifi cations and standards, but the acquisition workforce (AW) and the defense contractors did not embrace this new freedom, prefer-ring the safety of highly prescribed procedures they had become accus-tomed to. So, while military specifi cations were not required, defense contractors translated them into their own “company” specifi cations and used them on contracts, knowing that the government would readily accede to them.
One reason for DoD’s growing emphasis on management pro-cesses is its decreasing supply of knowledgeable acquisition profes-sionals. Th is decrease has occurred, in part, due to the enactment of false economies. For example, a critical event that helped shape the defense acquisition environment—the Defense Management Review process—had unforeseen long-term consequences. Th e Defense Man-agement Review attempted to derive economies in defense spending by enhancing the effi ciency of all elements of DoD through better material management practices, better organizational effi ciency, and elimination of staffi ng redundancies. Th e review anticipated billions of dollars in savings from these eff orts, and eliminated funding and bil-lets from DoD’s program plan. Many of the positions eliminated were in the acquisition management and oversight areas. Instead of sim-plifying the acquisition processes commensurate with a reduction in staff , the eff ort tried to substitute management processes for a cadre of

60 From Marginal Adjustments to Meaningful Change
123456789
101112131415161718192021222324252627282930313233343536
knowledgeable engineers, logisticians, and material managers, decreas-ing creativity in our acquisition process and forcing DoD to rely on additional support contractors to execute the process. We believe that doing so has created burdens that are neither well understood nor suf-fi ciently evaluated. Clearly, the acquisition process is tending toward a bookkeeping process where innovation is not accepted or encouraged. Th e nation needs to recapture, motivate, and reward the competitive drive and the innovation of its acquisition professionals.
A more streamlined requirements and acquisition process needs to be put into eff ect, but it should be one that encourages workforce initiative and responsibility. Federally funded research and develop-ment centers (FFRDCs) and others could play a role in the solution, but there is a need to fi nd the best practitioners, both uniformed and civilian, and empower them to identify the necessary changes. Laws and regulations will need to be reassessed to determine the latitude available, but with Congress complaining about the cost outcomes of the current system, even legislative change should be achievable. Th ere are enormous potential savings associated with this change, but unshackling key military offi cers and civilian personnel by allowing them to bring their creative powers to bear on spiraling acquisition costs is essential to give aff ordability more priority in defense acquisi-tions. To start, the elimination of duplicate processes in the military departments and the OSD would be a positive step, with the former focusing on execution and the latter on establishing policy. Better lines of decisionmaking authority would be a positive step as well, along with truly streamlining the acquisition; requirements; and planning, programming, budgeting, and execution (PPBE) processes.
Conclusions
In this paper, we have highlighted several organizational and manage-ment issues, the resolution of which could have a key role to play in improving acquisition outcomes. All of the problems facing defense acquisitions cannot be placed on their doorstep, but attending to these issues properly will lead to a more effi cient, integrated, and

Improving Acquisition Outcomes: Organizational and Management Issues 61
innovative basis for decisionmaking, without which improved acquisi-tion outcomes will not be possible. To this end, we off er the following recommendations:
• Increase the service chiefs’ role in the acquisition process. In order for the requirements, funding, and acquisition processes to better function together, the service chiefs need a central, but not controlling, voice in the acquisition process. Having the service vice chiefs as co-chairs of the Military Department’s Acquisition Board would be a step in the right direction. It would give the service chiefs a greater sense of participation in the acquisition process.
• Ensure that the combatant commanders’ role in the Penta-gon’s resource allocation processes is strictly advisory. Th e input from the combatant commanders is very important, but they need to be free from bureaucratic processes that would take too much time away from their warfi ghting responsibilities.
• Make acquisition positions equivalent to joint duty. To entice the military offi cer line community to opt for acquisition positions, make a series of these positions the equivalent of joint positions, thus better enabling these offi cers to compete for higher rank.
• Emphasize workforce initiative, not management processes. Methods need to be developed—and training and incentives need to be constructed—to enable the acquisition workforce to think for itself, as opposed to the current process of prescribing every-thing through an instruction or regulation.

123456789
101112131415161718192021222324252627282930313233343536

63
CHAPTER FIVE
On Prototyping: Lessons from RAND Research
Jeffrey A. Drezner and Meilinda Huang
Introduction
Acquisition policy and practice refl ect the recurring theme that pro-totyping as part of weapon system development can improve program outcomes. Specifi cally, prototyping is widely believed to reduce cost and time; allow demonstration of novel system concepts; provide a basis for competition; validate cost estimates, design, and manufac-turing processes; and reduce or mitigate technical risk.1 A mandate for competitive prototyping has periodically been included in revisions to the DoD 5000 series of regulations governing the defense acquisi-tion system. Th e most recent revision to DoD Instruction 5000.02 (December 2008, p. 17) contains the following mandate:
Th e TDS [Technology Development Strategy] and associated funding shall provide for two or more competing teams produc-ing prototypes of the system and/or key system elements prior to, or through, Milestone B. Prototype systems or appropriate component-level prototyping shall be employed to reduce techni-cal risk, validate designs and cost estimates, evaluate manufactur-ing processes, and refi ne requirements.
Th is paper reviews four decades of RAND research on the uses of prototyping in DoD in order to draw lessons that practitioners can
1 See, for instance, Young, 2007.

64 From Marginal Adjustments to Meaningful Change
123456789
101112131415161718192021222324252627282930313233343536
apply as they respond to the new emphasis on prototyping in DoD acquisition policy.2 RAND’s research on this topic has been periodic, refl ecting the waxing and waning of DoD interest in prototyping. We make only limited use of prototyping-related studies outside of RAND research; these studies have also been episodic in their cover-age of prototyping.
In this paper, we fi rst defi ne prototyping and discuss the potential benefi ts commonly attributed to it. We then review historical analyses to determine how well those potential benefi ts are supported by experi-ence. Last, we make explicit some of the more important thematic les-sons and specify the conditions under which prototyping is most likely to yield expected benefi ts.
What Is Prototyping?
In general, prototyping is a set of design and development activities intended to reduce technical uncertainty and to generate informa-tion to improve the quality of subsequent decisionmaking. Although
the term “prototyping” captures a wide range of activities, all prototyping has several ele-ments in common, including the design and fabrication of one or more representative sys-tems (hardware or software) for limited test-ing and demonstration prior to a production decision. Th e prototype itself is the article being tested.
A prototype is a distinct product (hardware or software) that allows hands-on testing in a realistic environment. In scope and
2 Of approximately 30 reports and papers reviewed, eight were specifi cally focused on proto-typing; the others touched on aspects of prototyping in the course of exploring other acquisi-tion issues, such as development strategies more generally or cost and schedule issues.
Prototyping is a conscious
strategy to obtain certain kinds of information to inform specifi c
decisions.

On Prototyping: Lessons from RAND Research 65
scale, it represents a concept, subsystem, or production article with potential utility. It is built to improve the quality of deci-sions, not merely to demonstrate satisfaction of contract specifi ca-tions. It is fabricated in the expectation of change, and is oriented towards providing information aff ecting risk management deci-sions. (Drezner, 1992, p.9)
In other words, prototypes are distinct from full-scale, fi nal confi gu-ration, production-representative test articles, the main purpose of which is to verify that performance requirements have been met and the program is ready to move into the production phase. Th e expecta-tion that prototyping will lead to change implies that a prototype is intended as a vehicle to learn something about the system’s technology or concept that will inform subsequent decisions. Th e prototype itself does not have to be a fully confi gured production article to accom-plish this purpose.
Prototyping can take many forms. It can be conducted at both the system and subsystem level. It can include competition (e.g., two or more teams designing, fabricating, and testing a representa-tive system in the context of a source-selection decision) or just a single organization experimenting with a novel concept or new tech-nology. Some developmental activities (i.e., experimentation, system concept and technology development, demonstration and validation) are often not labeled as prototyping, but the nature of the activi-ties planned and accomplished is consistent with prototyping. For example, Advanced Technology Demonstration (ATD), Advanced Concept Technology Demonstration (ACTD), and Joint Concept Technology Demonstration (JCTD) projects involve specifi c kinds of prototyping activities.3
Prototypes can be part of the early stages of a Major Defense Acquisition Program (MDAP), part of a series of related eff orts (e.g.,
3 See Drezner, 1992 for a full exploration of the diff erent kinds of prototyping strategies.

66 From Marginal Adjustments to Meaningful Change
123456789
101112131415161718192021222324252627282930313233343536
the X-plane series of experimental aircraft)4 or stand-alone projects. However, it is important to note that prototyping alone does not con-stitute a full weapon system development program. When incorpo-rated into an MDAP, prototyping should be used together with design analysis, empirical testing, modeling and simulation, and “other meth-ods of reducing technological uncertainty” (Perry, 1972, p.41) because these other methods produce information that prototyping alone will not; such approaches are complementary in the context of an MDAP. When prototyping is done outside of an MDAP, the transition and transfer of technology and information becomes an important practi-cal issue aff ecting the value of the prototyping eff ort. Unlike an MDAP, which has a constituency who ensure the political and budgetary sup-port necessary to move the project forward, an ATD or ACTD pro-gram does not necessarily have the support of the military service for which it ultimately may be intended.5
Some weapon types are generally too costly to prototype at the system level (e.g., large naval surface combatants and complex satel-lites). In such cases, subsystem prototyping is a cost-eff ective alternative for reducing uncertainty. For instance, the DD(X) program (now called DDG 1000, the Navy’s newest guided missile destroyer) successfully used a series of engineering development models (EDMs)—that is, prototypes of critical subsystems, such as the hull form, advanced gun and its munitions, composite deck house, peripheral vertical launch missile system, and radars, among others—to reduce technical risk and refi ne subsystem design.6
4 Th e X-planes were experimental aircraft (from the X-1 in 1946 to the X-53 in 2002) designed to expand knowledge of aerodynamics and air vehicle and engine design. Individual projects were run by combinations of NASA, the U.S. Air Force and U.S. Navy, and indus-try. Th e X-1 was the fi rst aircraft to break the sound barrier. Th e X-15 achieved hypersonic (Mach 6) manned fl ight. Other projects demonstrated diff erent wing or body confi gurations. Th e fi rst unmanned combat air vehicles (X-45 and X-47) were industry projects intended to demonstrate a new capability.5 Th e Predator and Global Hawk unmanned aerial systems (UAS) programs are good exam-ples of this issue and also demonstrate that the issue can be resolved. See Th irtle, et al., 1997; Drezner and Leonard, 2002.6 Several U.S. Government Accountability (GAO) reports discuss the role of the EDMs in the overall program, including GAO-07-115 (November 2006), GAO-05-924T (July 2005)

On Prototyping: Lessons from RAND Research 67
Although the Under Secretary of Defense for Acquisition, Tech-nology, and Logistics (USD (AT&L)) defi ned prototyping activities as occurring prior to Milestone B (Young, 2007, p.1), and the recently revised DoD acquisition policy, quoted above, places prototyping in the technology development phase (before Milestone B and the start of engineering and manufacturing development), prototyping as defi ned in this occasional paper is not confi ned to any particular acquisition-process stage of the development process. Moreover, our defi nition covers a broader range of activities and is not confi ned to a particular funding mechanism or program type.
What Are the Expected Benefi ts of Prototyping?
Th eoretical arguments heavily favor the use of prototyping as part of weapon system development, or more specifi cally, as a way to dem-onstrate novel concepts and resolve technological uncertainty. Th e expected benefi ts, as listed below, are largely related to the design, fabrication, and test of the prototype. However, prototyping can be applied in any situation in which improved information through dem-onstration would be of value. Less traditional applications include pro-totyping specifi c management techniques or policies, or prototyping the support and maintenance concepts for a weapon system.
Given DoD’s recent competitive prototyping policy, it is useful to compare DoD’s list of expected benefi ts with similar sets of ben-efi ts and skepticisms generated in prior research by RAND and others. DoD policy lists the following primary benefi ts:
• Reduce technical risk.• Validate designs.• Validate cost estimates.
and GAO-04-973 (September 2004). Full citations are in the Reference list at the end of this paper.

68 From Marginal Adjustments to Meaningful Change
123456789
101112131415161718192021222324252627282930313233343536
• Evaluate manufacturing processes.• Refi ne requirements.
Th e policy directive on competitive prototyping (Young, 2007, p. 1) listed these as well as a set of secondary benefi ts:
• Exercise and develop government and industry management teams.
• Provide an opportunity to develop and enhance system engineer-ing skills in both government and industry.
• Attract a new generation of scientists and engineers to DoD and the defense industry.
• Inspire and encourage students to embark on technical education and career paths.
Th e expected benefi ts of a particular prototyping strategy for an indi-vidual program will not necessarily include all of these potential ben-efi ts. Front-end planning activities should identify which benefi ts are being targeted and then design a prototyping strategy to provide those specifi c benefi ts. In other words, prototyping involves a conscious strategy to obtain certain kinds of information to inform specifi c deci-sions. In the remainder of this section, we examine expected benefi ts of prototyping in more detail.
Reduce Technical Risk. Reducing technical risk is an important benefi t of prototyping strategies. By building and testing representative items,
prototyping can identify and resolve techni-cal uncertainty; demonstrate technological feasibility; advance technological maturity; refi ne system requirements and validate the system design to satisfy those requirements; and provide information to improve esti-mates of cost, schedule, and performance.
An important aspect of risk reduction is the discovery of technical uncertainty not anticipated by the design engineers nor
Prototyping can resolve
known technical uncertainties—
and identify uncertainties that
were not anticipated (“unknown
unknowns”).

On Prototyping: Lessons from RAND Research 69
predicted by design analyses or prior experience with analogous tech-nologies. In other words, prototyping can address both the “known unknowns” and the “unknown unknowns,” sometimes yielding unex-pected (unlooked-for) benefi ts. For instance, testing of the Global Hawk (an unmanned aerial vehicle) resulted in the development of an unplanned for capability (in-fl ight retasking)7 not envisioned at the design stage (Drezner and Leonard, 2002).
Validate Design and Refi ne Requirements. Prototyping strategies are fundamentally about using information generated during design, fab-rication, and testing activities to inform subsequent decisions regarding cost–performance trade-off s, source selection, validation of technolo-gies, readiness to move into subsequent program phases, and force structure. Relatively more and higher-quality information can be gen-erated during prototyping than in alternative development approaches that rely more heavily on “paper” design activities or, more recently, on computer-aided design, modeling, and simulation. Presuming that the information that is generated is used appropriately, the quality of those decisions should improve.
Validate Cost Estimates. While prototyping may not truly validate cost estimates (most prototyping occurs early in development, and the pro-totypes themselves are not the full-production confi guration), it may improve the quality of those estimates. Other benefi ts discussed—such as reductions in technical risk, more mature technology, refi nement of requirements based on demonstrated feasibility, and validation of key system design elements—should enable a more accurate cost estimate.
Evaluate Manufacturing Processes. A prototyping strategy can be designed to evaluate or improve manufacturing processes. Achieving this potential benefi t would require making elements of the manu-facturing process (i.e., tooling, material use and handling, production process layout) an explicit part of the prototyping strategy. Th ere is
7 Th at is, redirecting the air vehicle so onboard sensors can capture targets of opportunity.

70 From Marginal Adjustments to Meaningful Change
123456789
101112131415161718192021222324252627282930313233343536
an important trade-off here: Including the full set of production con-siderations in a prototype designed, fabricated, and tested as part of technology development would likely add cost and time to the eff ort. Nevertheless, the construction of the prototype itself will provide some valuable insights to evaluate and improve production processes.
Th e expected secondary benefi ts identifi ed by DoD policy (listed above) relate either to the development and maintenance of program management, system engineering and other technical skills, or to the development and recruitment of the next generation of defense pro-gram managers, scientists, and engineers. RAND research has addressed the former but has not addressed the latter.
Maintaining Workforce Skills and Experience. Prototyping helps to sustain industry design capabilities through design, fabrication, test, and redesign activities. Prototyping provides a more complete experi-ence for a design team. As past RAND reports have noted:
To be really good at designing combat aircraft, members of a design team must have had the experience of designing several such aircraft that actually entered the fl ight-test stage. Paper designs and laboratory development are important, but they are not a substitute for putting aircraft through an actual fl ight-test program. (Drezner, 1992, p. 16)
If experience is as important as might be inferred from the his-torical record, clearly the DoD needs to consider options that will help maintain experience levels during long periods when no major R&D programs are under way. Such a strategy could focus on prototyping or technology demonstration. (Lorell, 1995, p. 65)
Similarly, prototyping activities may provide the government workforce with hands-on experience in program management, system engineer-ing, testing, and other skill sets necessary for the conduct of a successful acquisition program.
RAND research suggests additional potential benefi ts from pro-totyping not explicitly listed in DoD policy, including the following.
On Prototyping: Lessons from RAND Research 71
Reduction in Fielding Time. Prototypes can demonstrate the military utility of a system concept or technology, enabling relatively shorter time spans from concept defi nition to fi elding of an operationally use-ful capability. Th is applies to prototyping both as part of a MDAP (e.g., the YF-16 Lightweight Fighter, which led to the F-16A/B) or stand-alone, pre-MDAP programs (e.g., fi elding the ACTD confi gura-tion of Global Hawk during the initial stages of the wars in Afghani-stan and Iraq).
Enhanced Competition. Prototyping strategies can enhance competi-tion among two or more fi rms or teams by requiring actual demonstra-tion of proposed capabilities. Competitive prototyping has been used extensively, for example, in the history of fi ghter and bomber aircraft development, often demonstrating the value of new designs or tech-nologies and giving government source-selection authorities increased confi dence in their decisions (Lorell, 1995). Th e testing of competitive prototypes can provide better information than design proposals alone.
Improved Research and Development (R&D) Effi ciency. A prototyp-ing strategy can also be more effi cient, providing an opportunity for “obtaining information sooner or more cheaply than by other means” (Perry, 1972, p. 41).
Hedging Your Bet. Some prototyping strategies can off er a hedge against other kinds of uncertainty beyond technical uncertainty. For instance, a competition with two or more system designs provides a hedge against the nontechnical failure of one. For example, technology demonstration prototyping strategies—in which system concepts are tested outside of established programs—can provide a hedge against changing or emerging threats. Within DoD, these programs are usually ATDs, ACTD, JCTDs, or similar programs.
Skepticism about the benefi ts of prototyping is less common than enthusiasm, but it does exist. Th e counterarguments revolve around two notions—that changes in performance requirements (capabilities) and duplication of eff ort reduces the value of prototyping. Th e fi rst notion is that a prototype phase does not really reduce uncertainty (or

72 From Marginal Adjustments to Meaningful Change
123456789
101112131415161718192021222324252627282930313233343536
risk) because decisionmakers will be unable to resist the temptation to modify system performance specifi cations to capitalize on recent tech-nological advances. Incorporating that new technology will increase risk since those changes were not part of the prototype phase, thus reducing the value of prototyping. Th e second notion is that:
a comprehensive design eff ort is unavoidable in any case and . . . pausing . . . to construct a prototype merely lengthens the program and increases its cost without securing any equivalent benefi ts. Th e argument is that engineering problems will be encountered in both cases, but that careful study and design analysis will identify them earlier than will prototype construction. Furthermore, it is widely believed that the construction of a prototype encourages designers to overlook compatibility problems, to create something that is less than a system and that must be substantially reengi-neered before it is ready for production. (Perry, 1972, p. 10)
Th e counterargument about changing requirements after prototype testing revolves around the notion that signifi cantly changing the design of a system reduces the value of the information obtained through pro-totyping. Th is may be a valid concern at the extreme, where design
changes subsequent to prototype testing result in a completely diff erent confi guration. How-ever, one could also argue that the proto typing experience resolves uncertainties associated with the initial requirements, a nontrivial con-tribution to the development program even if requirements are changed somewhat or new capabilities added. To an important degree, prototyping is intended to result in design changes based on lessons from testing. It may also identify fl awed or infeasible requirements,
to the benefi t of the program. Prototyping does not resolve all uncer-tainties associated with a system or technology concept, but rather only those it was designed to resolve and perhaps some “unknown unknowns” that become apparent during testing.
Skeptics contend that subsequent
changes to performance requirements
and duplication of effort reduce
the value of prototyping.

On Prototyping: Lessons from RAND Research 73
Th e second counterargument—that the prototyping eff ort is duplicative and produces little unique knowledge informing the detailed design phase—is less valid. For instance, even with advances in computational fl uid dynamics, wind tunnel testing and live fl ight testing of aircraft confi gurations are still required for designs that push the edges of known and demonstrated performance, as many military systems do.8 Demonstrations in realistic operational environments consistently produce information about system performance not oth-erwise obtainable, and fabrication of a prototype certainly exercises skills that design activities alone cannot. Prototype testing also enables identifi cation of any unknown or unexpected performance behaviors or technical risk.
Historical Evidence Is Mixed
RAND’s past research on the topic of prototyping includes both (1) statistical analyses of large databases containing information on both prototyping and nonprototyping programs and (2) case studies (in varying degrees of detail) of prototyping programs, with comparisons to nonprototyping programs. Th e programs studied in this body of research include the following, among others:
• Century-series fi ghters (F-100 through F-105)• AX close air support/attack aircraft (YA-9 versus YA-10)• Lightweight Fighter (YF-16 versus YF-17)• Advanced attack helicopter (YAH-63 versus YAH-64)• Utility transport helicopter (UH-60 versus UH-61)• F-117 (Have Blue)• Advanced Medium-Range Air-to-Air Missile (AMRAAM)• Predator unmanned aerial system• Global Hawk unmanned aerial system
8 For a discussion, see Antón, et al., 2004, both TR-134-NASA/OSD and MG-178-NASA/OSD.

74 From Marginal Adjustments to Meaningful Change
123456789
101112131415161718192021222324252627282930313233343536
• DarkStar unmanned aerial system• F/A-18 and F/A-22 fi ghter aircraft
Overall, evidence from this body of work is somewhat mixed regard-ing the benefi ts of prototyping. However, many factors aff ect program outcomes independent of prototyping; thus, teasing out the relative eff ect of prototyping is challenging.
In general, we would expect to fi nd that programs incorporat-ing prototyping would have less cost growth on average because the baseline cost estimate would benefi t from the risk reduction and information on cost–performance trade-off s obtained through early prototyping.9 Findings from numerous case studies support this expectation, as indicated in the following examples:
Th e experience of the Air Force in buying “soft tooling” proto-types, including the two XF-104s, suggests that under appropriate conditions an airframe very useful for fl ight testing of both basic designs and readily available subsystems might be obtained for about 60 percent of the cost of a “hard tooled” prototype. And of course it becomes available much sooner. (Perry, 1972, p. 39)10
Th ere is some evidence that, on average, cost growth of proto-typed programs is less than that of conventional acquisition pro-grams, and the magnitude of such “savings” is much greater than the direct cost of the prototype phase. (Smith et al., 1981, p. 35)
9 In this paper, cost growth was measured from the Development Estimate baseline estab-lished at Milestone II (now called Milestone B) using quantity adjusted data from the Selected Acquisition Reports (SARs). Th ough this analysis is 15 years old, RAND has continued to update the database. More recent analyses, while not explicitly addressing prototyping, are consistent with the basic fi ndings in the earlier report and do not provide any indication that results on prototyping might change. See also Arena et al., 2006; Younossi et al., 2007; and Bolten et al., 2008.10 “Soft tooling” consists of the temporary set of tooling used to construct a limited number of prototypes. Such tools (molds for shaping materials, presses and drills, wire fi tting, worksta-tions, et cetera) may adapt general purpose or existing tools, or may even be made of wood. “Hard tooling” refers to the fi nal set of tools used for longer production runs.

On Prototyping: Lessons from RAND Research 75
However, a statistical analysis conducted in the early 1990s of the factors aff ecting weapon system cost growth—including the eff ect of prototyping on cost outcomes—found no easily discernible patterns in the data (see Figure 5.1).11 If anything, the data appeared to indicate that prototyping programs had higher cost growth than nonprototyp-ing programs, with average cost-growth factors of 1.29 and 1.19,12
respectively (there were 30 observations in both groups of programs).Th is counterintuitive result can be partially explained by the
fact that the programs in the prototyping group were, on average,
11 Drezner et al., 1993.12 Cost-growth factors translate directly to percentages: an average cost-growth factor of 1.29 indicates that on average, the programs in that group had 29 percent cost growth above their baseline estimates.
Figure 5.1Cost-Growth Factor Distribution of Prototyping and Nonprototyping Programs, Circa 1993
SOURCE: Drezner et al., 1993, p. 37, Figure 5.1.

76 From Marginal Adjustments to Meaningful Change
123456789
101112131415161718192021222324252627282930313233343536
A statistical analysis suggested that programs that
use prototyping do not show less
cost growth—unless prototyping
occurs prior to Milestone II.
older and smaller than the programs in the nonprototyping group: Relatively older (more mature) programs (measured as years past the baseline cost estimate) tend to have higher cost growth, and relatively smaller programs (measured in infl ation adjusted dol-lars) also tend to have higher cost growth. However, when we com-
pared programs in which the prototyping phase occurred earlier—prior to Milestone II (when the program baseline was estab-lished)—to programs in which the prototyp-ing phase occurred after the milestone, the expected result obtains: programs with earlier prototyping had an average cost-growth fac-tor of 1.23 versus 1.37. Th is result indicates that using the information generated during early prototyping may improve subsequent cost estimates.
Another widely held belief is that spending relatively more time prior to Milestone B (formerly, Milestone II) in planning and technol-ogy demonstration activities (including prototyping) would result in less schedule slip. A study that examined in detail the factors aff ect-ing schedule slip of 10 MDAPs did not fi nd evidence to support this hypothesis (Drezner and Smith, 1990); however, several other studies did. For example:
Th ere is no evidence that the introduction of a prototype either delays the availability of the production article or increases the cost of development. (Perry, 1972, p. 45)
Th e histories of attack and fi ghter aircraft developed by the Navy and the Air Force since 1950 indicate that introducing a proto-type makes little diff erence in the total development time. Fur-thermore, if a prototype program can be started earlier than could an equivalent full-scale development program (as was certainly the case with the LWF program), then use of a prototype phase may actually lead to an earlier fi elding date. (Smith et al., 1981, p. 35)

On Prototyping: Lessons from RAND Research 77
In addition, one study that compared the development strategies and outcomes of two programs using diff ering prototyping strategies found evidence that prototyping benefi ted both programs:
Another major diff erence between the two programs was that the YF-16 was a true prototype of the F-16 fl ight vehicle, thereby providing a considerable start on the overall system design. Con-versely, the Have Blue program was a technology demonstrator and provided almost nothing toward the detail design of the F-117. On that basis, we would expect that, measured from EMD start, the F-117 schedule would have been extended, compared with the F-16, while in fact the time to fi rst delivery was about the same for both programs. Th is suggests that the F-117 program was relatively short. (Smith et al., 1996, p. 30)
Th ough it was a subscale technology demonstrator, Have Blue did vali-date key aspects of the F-117 design, providing increased confi dence to decisionmakers. Th e two programs had very diff erent prototyping strategies, but both appear to have derived important benefi ts, includ-ing the generation of information that facilitated a relatively shorter development phase. Prototyping activities provide benefi ts by generat-ing information not otherwise attainable.
One possible explanation for these mixed results concerns the exact metric used in the analysis. By their nature, prototyping strat-egies generate useful information applicable mainly to a particular design, technology, system concept, or other engineering challenge. Th e information would be expected to improve decisionmaking or estimates for systems closest to the prototype’s design. For instance, when measuring the eff ect of prototyping on the accuracy of cost, schedule, or performance estimates, initial estimates of cost, sched-ule, or performance should be compared only to the version of the system that is based on the prototype. Applying this principle to F-16 program outcomes, discussed in the last case study above, only the F-16A/B models should be considered in the analysis; the F-16C/D models came much later, and cost, schedule, or performance estimates were not likely aff ected by the prototyping experience of earlier years.

78 From Marginal Adjustments to Meaningful Change
123456789
101112131415161718192021222324252627282930313233343536
Unfortunately, this level of discrimination in a study is diffi cult to achieve due to the limits of available data and so has been undertaken only infrequently.
Perhaps more importantly, many factors other than prototyping aff ect program outcomes. Such factors include infeasible requirements, requirements change, budget instability, and underestimation of tech-nological maturity. As discussed above, prototyping can be designed to address the feasibility of requirements and technological maturity, but any benefi ts in these areas can be overwhelmed by other factors. Th e F-22, the JSF (F-35), and Global Hawk all included prototyping strat-egies of one form or another that appeared quite useful at the time, yet all three programs have incurred high cost growth and schedule slip.13
Th is suggests that prototyping is not a panacea for solving all of the problems of the acquisition process.
In general, evidence from case studies tends to support the notion that prototyping strategies are benefi cial as part of weapon system development in some circumstances. Prototyping does help discover technical risks and thus can reduce technical uncertainty. Prototyping does produce information useful in validating design choices, refi ning requirements, and improving the quality of cost estimates. However, results from both case studies and statistical analyses suggest that the impact of these benefi ts on cost, schedule, and performance outcomes can be overwhelmed by other factors aff ecting programs.
Conditions That Favor Prototyping
Th ough the available evidence is somewhat mixed overall, the historical record does suggest some of the conditions under which prototyping strategies are most likely to yield benefi ts in a development program. Successful application of prototyping strategies in the future requires either creating these conditions or ensuring that they exist to the extent possible.
13 See Selected Acquisition Reports for the programs. See also several GAO reports.

On Prototyping: Lessons from RAND Research 79
Results Are Used to Inform Key Program Decisions. If the information generated from prototyping activities is not used to inform key pro-gram decisions (including fi nal design, technologies and capabilities to include in the initial production system, planning for subsequent technical and engineering activities, and cost and schedule estimates), then there would be no reason to expect benefi ts. If early testing of a prototype indicates that available technology is not yet mature enough to confi dently predict that system performance requirements will be met, then pushing ahead in that program without easing requirements and performance expectations to match demonstrated technological maturity will result in signifi cant cost growth, schedule slip, and per-formance shortfalls.
The Prototype Is Designed to Demonstrate the Critical Attributes of the Final Product in a Realistic Environment. Prototypes should be designed to test the key performance attributes about which there is the greatest uncertainty and which are expected to enable mission accomplishment. Th is includes major subsys-tems that aff ect not only performance, but also design (such as the integration of a specifi c engine, airframe confi guration, and sensor package in an aircraft). Prototyping strategies appear to yield benefi ts when they are focused on specifi c challenges or designed to generate specifi c kinds of informa-tion to inform specifi c kinds of decisions
Prototyping Strategies and Documentation Are Austere. Th ere is some evidence, particularly from the many past aircraft prototypes, that an austere program is an important attribute of a successful appli-cation of prototyping. Prototyping should include only the minimum necessary requirements specifi ed and only the minimum documenta-tion required to analyze test results and capture lessons learned from the activity. In general, this means focusing the prototype itself on a few key uncertainties, keeping noncritical technical standards to a minimum, and focusing associated program documentation on the
Prototyping is more effective when critical performance attributes are tested in a realistic environment.

80 From Marginal Adjustments to Meaningful Change
123456789
101112131415161718192021222324252627282930313233343536
prototyping activity. It also means the use of relatively small teams of highly capable people with appropriate decision authority regarding the prototyping activity, minimal requirements for status reporting, and minimal external interference (e.g., externally imposed design changes) with the team’s activities. Th is gives the design team more fl exibility to make the inevitable cost–performance trade-off s, such as deciding not to include demonstration of a second-order capability due to cost considerations.
Sustainment issues, technical data requirements, production planning, and tool design are commonly not addressed in an austere prototyping strategy. However, these issues could be addressed through a phased or incremental prototyping strategy in which two sets of pro-totypes are designed and tested—the fi rst addressing critical technical performance issues and the second addressing support issues. While possible in theory, we are not aware of any program that has attempted such an approach.
There Should Be No Commitment to Production During the Proto-typing Phase. Prototyping is experimental in nature, and failure
is a possible outcome in the sense that the desired capabilities could not adequately be demonstrated in a realistic environment and at a reasonable cost. Such an outcome would be strong evidence that the requirements need to be relaxed and additional technol-ogy development and maturation is needed. Perhaps the program based on the system
concept should be deferred indefi nitely until certain critical tech-nologies are demonstrated. Such decisions are much harder to make if a commitment to production has already been made, either implic-itly or explicitly. Production requires that a whole other set of issues be addressed (force structure, sustainment options, signifi cantly increased budgets, et cetera).
No Additional Requirements Are Added or Performance Increases Expected. Changing the design to add capabilities that were not part of
Prototyping may lead to tough decisions that are best made
before committing to production.

On Prototyping: Lessons from RAND Research 81
the initial design concept and therefore not explored during prototyp-ing may limit the value of the information gained during prototyping. Again, this condition relates to the need for an austere, focused pro-totyping eff ort in which the information generated is used to inform specifi c decisions regarding design, requirements, and technology.
Conclusions
A careful application of prototyping can result in signifi cant benefi ts to a program, including reduction in technical risk and demonstra-tion of technological feasibility, refi nement of requirements, and more informed cost–performance trade-off decisions. However, prototyp-ing alone cannot ensure a successful program outcome; cost, schedule, and performance outcomes are aff ected by a range of factors indepen-dent of prototyping that may overwhelm any benefi ts gained through prototyping.
DoD’s new acquisition policy mandates competitive prototyping at either the system or subsystem level prior to Milestone B.14 Compet-itive prototyping is one specifi c kind of prototyping strategy involving two or more teams designing, constructing, and testing their respective system (or subsystem) and technology concepts. Th is type of prototyp-ing strategy usually happens relatively early in the technology devel-opment phase of a program. Th e prototypes themselves are usually limited to demonstrating specifi c design concepts and technologies, and can provide information not otherwise attainable to inform the source-selection decision. Th is meets the defi nition of an austere pro-totyping strategy and satisfi es the conditions discussed above as facili-tating success. To the extent that the resulting information is properly used to inform program decisions at Milestone B, and no additional requirements or capabilities are added after the baseline is established, the policy may contribute to an improvement in program outcomes. However, recent experience represents a cautionary tale: Th e F-22, JSF,
14 See DoD Instruction 5000.02, December 2008.

82 From Marginal Adjustments to Meaningful Change
123456789
101112131415161718192021222324252627282930313233343536
and LCS all included a competitive prototyping phase, and all have experienced cost growth and schedule slip.
Th ere are several important caveats regarding the potential of competitive prototyping that acquisition offi cials should consider. First, the competitive aspect of this policy requires two or more teams with the requisite knowledge and capabilities at the system or subsys-tem level. However, consolidation in many sectors of the industrial base has changed the nature and value of competition.15 In these cases, competition will not necessarily yield the benefi ts of innovation and of cost reduction and control that are usually expected.
Second, by mandating competitive prototyping in the technol-ogy development phase, DoD’s policy may inhibit other prototyping strategies. Th e successful application of any prototyping policy requires that offi cials think through the goals, acquisition environment, techni-cal characteristics, and needs of a given program to determine what type of prototyping makes sense. Th e policy mandate might result in offi cials forcing a competitive prototyping strategy into the design of a program when the characteristics of that program require some other approach to addressing risk. For instance, the demonstration of the military utility of a new concept or technology does not always require competition. Th e discretion and judgment of experienced program managers and oversight offi cials are important conditions for success-ful implementation of this new policy mandate.
Last, the lack of defi nitive evidence supporting the benefi ts of prototyping in general, and competitive prototyping in particular, is somewhat troubling. Existing case studies and statistical analyses present the policymaker with mixed results. As a result, DoD’s new competitive prototyping mandate was incorporated into policy with-out a strong link between the new policy emphasis and its intended improvement to program cost, schedule, and performance outcomes.
15 In particular, if there are only two fi rms (or teams) that can design and build a particular system or subsystem, and there is a formal or informal policy to maintain at least two, then competition is very diff erent than it was in the past. Shipbuilding, manned aircraft and heli-copters, and heavy armored vehicles are sectors where this concern is real. See Schank et al., 2006; Birkler et al., 2001; and Birkler et al., 2003.

On Prototyping: Lessons from RAND Research 83
Does competitive prototyping really result in better outcomes? Under what conditions will competitive prototyping yield the desired ben-efi ts? What are the key lessons from past and more recent experience with competitive prototyping? How can the potential benefi ts of com-petitive prototyping be maintained in the face of all the other factors aff ecting program outcomes? A carefully structured analysis of proto-typing strategies, with an emphasis on recent experience with competi-tive prototyping (e.g., F-22, JSF, and LCS), would help ensure a more successful implementation of the new policy.

123456789
101112131415161718192021222324252627282930313233343536

85
CHAPTER SIX
Shining a Spotlight on the Defense Acquisition Workforce—Again
Susan M. Gates
Introduction
As we approach the end of the fi rst decade after the turn of the century, concerns about defense acquisition outcomes—cost escalation, reports of improper payments to contractors, appeals fi led over source-selection outcomes, schedule delays—pervade the popular press as well as DoD audits and internal reports. Although the term “defense acquisition” refers to all activities that are related to the procurement of goods and services from the private sector by DoD, two specifi c types of acquisi-tion activities are the source of greatest concern today: Major Defense Acquisition Programs (MDAPs) and contracting eff orts to support immediate needs in a contingency or combat operation (often referred to as “expeditionary contracting”). Th e U.S. Government Account-ability Offi ce (GAO) has designated defense contract management and defense weapon system acquisition as “high risk” areas.1 Another recent prominent assessment, the Report of the Acquisition Advisory Panel (Section 1423 Report) criticized government acquisition eff orts for awarding a substantial number of contracts (nearly one-third) through noncompetitive approaches, and the Report of the Commis-sion on Army Acquisition and Program Management in Expedition-ary Operations (Gansler Commission Report) concluded that “the
1 See the U.S. Government Accountability Offi ce’s Web site at http://www.gao.gov/doc search/featured/highrisk_march2008.pdf for a list of all GAO high-risk areas and the year in which they were designated as such; see also http://www.gao.gov/new.items/d07310.pdf on defense contract management, p. 71.

86 From Marginal Adjustments to Meaningful Change
123456789
101112131415161718192021222324252627282930313233343536
acquisition failures in expeditionary operations require a systemic fi x of the Army acquisition system” (p. 1).
Th e cacophony of criticism is not new, echoing stories from the 1980s about the government spending inordinate amounts of money on everyday items such as toilet seats or hammers (Fairhall, 1987). Now, as then, critics have shined a spotlight on the acquisition work-force (AW)—its size, quality, and eff ectiveness—as a key contributing factor to the observed problems.2 Indeed, a recent review conducted by DoD of “almost every acquisition improvement study . . . concluded in some fashion or another that more attention needs to be paid to acquisition workforce quantity and quality” (Lumb, 2008, p. 20). Th e following three workforce-related claims feature most prominently in the current debates:
1. Th e current workforce is too small to meet current work-load. Th e Gansler Commission Report attributes poor contracting outcomes, including recent contracting scandals, to insuffi cient growth in the size of the contracting workforce and exploding growth in the acquisition workload (Gansler Commission Report, 2007, p. 30). Th is perspective is consistent with more general arguments that have been made about the federal AW overall, most recently in the Section 1423 Report, which stresses that the demands on the federal AW have grown both more numerous and more complex since the mid-1990s. Key drivers of the increasing demands include the complexity of service contracting, which is a growing share of all government contracting; the fact that the number of transactions is no longer a good measure of workload; and the fact that best-value procurement approaches are substantially more complex than lowest-price contracting approaches. Th e Section 1423 Report (2007, p. 19) concludes that
2 Th e sources calling for AW improvement acknowledge that workforce issues are only part of the problem. For example, in discussing the barriers to eff ective requirements determination, the Section 1423 Report (2007, p.7) not only points toward a strained workforce that lacks the requisite market expertise, but also to other factors that contribute to poor outcomes, such as a culture that emphasizes “getting to award,” budgetary pressures, time pressures, and unclear roles and responsibilities—particularly in the use of interagency or government-wide contracts.

Shining a Spotlight on the Defense Acquisition Workforce—Again 87
the demands placed on the acquisition workforce have outstripped its capacity. And while the current workforce has remained stable in the new millennium, there were substantial reductions in the 1990s accompanied with a lack of attention to providing the training necessary to those remaining to eff ectively operate the more complex buying climate.
2. DoD overuses or inappropriately uses contractors to per-form acquisition functions. Th e dramatic increase in the federal gov-ernment’s use of contractors to provide services has received signifi cant attention in recent years. Concerns relate not only to the number of contractors performing government functions, but also to the role they are playing—in particular, whether they are performing inherently governmental functions. Rostker (2008) argues that it is time for the federal government to rein in and rationalize the use of contractors.
Similar points have been made with respect to the defense AW. Th ere is broad recognition in DoD that the contractor workforce has grown (Rostker, 2008; Section 814 Report, 2007), and congressional actions have prompted the Department of Homeland Security and DoD to review and reassess the way they are using service contractors (Rostker, 2008, p. 13).
3. Th e workforce lacks the skills to accomplish the workload. Another common refrain in discussions about the state of the defense AW is that the nature of the work has become substantially more com-plex, while the workforce has lost some of the skills or training needed to perform this work. Th is point is made in each of the reports dis-cussed above. Increased workload complexity is attributed primarily to increased use of best-value procurement methods and the complexity of service contracts, which comprise a growing share of the workload. Evidence that the workforce lacks the skills necessary to fulfi ll its mis-sion is largely anecdotal, and the arguments are far less specifi c than those related to workforce size.
DoD has announced plans to increase the defense AW by 20,000 (or 16 percent) over the next fi ve years. Th e workforce plan has been

88 From Marginal Adjustments to Meaningful Change
123456789
101112131415161718192021222324252627282930313233343536
described as a “bold step” toward addressing cost growth and schedule delays with major weapon systems (Hedgpeth, 2009). Th e proposed growth would include the conversion of 11,000 contractor support personnel to full-time government positions as well as 9,000 new fed-eral hires.
It is unclear whether this step will, in fact, deliver on its promise of improving acquisition outcomes. Unfortunately, for all the infor-
mation we have on acquisition outcomes and the AW, there is a dearth of evidence regard-ing whether and to what extent specifi c work-force issues are actually contributing to these outcomes. Th is paper assesses the evidence regarding the relationship between the issues described above and acquisition outcomes, and it discusses eff orts that could inform future policy decisions related to the defense AW.
In the next section of this paper, we provide an overview of the defense AW and the policy environment infl uencing its management. In the third section, we assess the strength of the evidence supporting the key concerns that have emerged related to the AW. Th e fi nal section off ers conclusions and recommendations.
The Defense Acquisition Workforce: Policy Context, Size, and Composition
Th is section provides some critical background needed to understand the context for AW management and to assess the extent to which workforce issues may be aff ecting acquisition outcomes.3 Th e man-agement of federal government employees is subject to myriad exter-nal pressures and extensive oversight at various levels. Th e defense AW has received substantial additional attention over the years, making it,
3 Th is chapter draws heavily on material contained in Gates et al., 2008.
It is unclear that increasing the size of the acquisition
workforce will improve
acquisition outcomes.
Shining a Spotlight on the Defense Acquisition Workforce—Again 89
arguably, the most heavily scrutinized work-force in the federal government.
Th e federal AW includes men and women across all federal agencies who are responsible for acquiring the goods and services that their organizations need. Th e DoD portion of the federal AW, as defi ned by the offi cial DoD AW count, consists of over 130,000 military and civilian employees, as well as a large num-ber of contractors. Th e defense AW includes individuals
responsible for planning, design, development, testing, contract-ing, production, introduction, acquisition logistics support, and disposal of systems, equipment, facilities, supplies, or services that are intended for use in, or support of, military missions. (DoD Instruction 5000.55, 2005)
Because of the breadth of the work carried out, the AW spans organizational boundaries within the Department of Defense to include the Army, Navy, Marine, Air Force, Defense Logistics Agency, and other entities within the Offi ce of the Secretary of Defense (DoD Instruction 5000.55, 1991).
Defense Acquisition Workforce and Improvement Act
Th e policy environment for the management of the defense AW is dom-inated by the Defense Acquisition Workforce and Improvement Act (DAWIA) of 1990. DAWIA had its roots in DoD acquisition scandals of the mid-1980s4 that led to internal and external pressures for reviews of defense acquisition processes, including President Reagan’s Packard Commission. Th e consensus that emerged from these reviews was that
4 See Fairhall, 1987.
Defense acquisition personnel work across a wide variety of functional areas and organizations within the military services and defense agencies.

90 From Marginal Adjustments to Meaningful Change
123456789
101112131415161718192021222324252627282930313233343536
the defense AW underperformed and was too large. DAWIA attempted to address these size and quality concerns by requiring that DoD count and track the size of the AW and by imposing requirements on the training of acquisition workers, both military and civilian, employed by DoD.
DoD Instructions 5000.55 and 5000.66 are the key policy doc-uments issued in response to DAWIA. Among other things, these instructions established twelve AW career fi elds;5 provided guidance for managing the selection, placement, and career development of those fi lling positions within the AW; and defi ned workforce reporting requirements.
Since 1992, DoD has, consistent with DoD Instruction 5000.55, reported the num-ber of military and civilian workers it employs who are part of the offi cial AW (referred to as the “DAWIA count”). Figure 6.1 displays the civilian AW end-of-fi scal-year totals according to this DAWIA count. Th e fi gure shows that the civilian AW declined through the 1990s, reaching a low of 77,504 as of September 30, 1999. It then climbed steadily to 119,251 as of September 30, 2005, and then was reduced slightly to 113,605 by September 30, 2006.
Th e military AW is substantially smaller than the civilian workforce, but the trends have been consistent with those observed on
the civilian side. Th e military AW stood at just over 16,500 in 1992; declined to 9,311 in 2000; and had increased to 14,976 by 2006.
5 Th e career fi elds are: Program Management; Communications-computer systems; Con-tracting; Purchasing; Industrial Property Management; Business, Cost Estimating, and Finan-cial Management; Auditing; Quality Assurance; Manufacturing and Production; Acquisition Logistics; Systems Planning, Research, Development, and Engineering (SPRDE); Test and Evaluation Engineering. Th e Manufacturing and Production career fi eld was eliminated in 2007 and a new career fi eld, SPRDE Program Systems Engineer, was added in 2008.
The military acquisition
workforce is substantially
smaller than the civilian acquisition
workforce—but they have
followed similar trends in terms
of increases and decreases
over time.

Shining a Spotlight on the Defense Acquisition Workforce—Again 91
As discussed in Gates et al. (2008, pp. 44–45), the services vary dra-matically in terms of the size and composition of their organic AW; the Air Force employs the largest number and proportion of military personnel.
Figure 6.2 presents the career fi eld distribution for the civilian AW. Th e majority of DoD civilian acquisition workers are employed in one of two career fi elds: (1) systems planning, research and devel-opment and engineering (SPRDE; 30 percent) or (2) contracting (22 percent). Only 7 percent of civilians are in program management. Figure 6.3 reveals a dramatically diff erent career fi eld distribution for military personnel.
Although contracting and SPRDE are important career fi elds for the military AW, the largest share of military acquisition workers is in the program management career fi eld (29 percent of the total). Military personnel rarely fi ll positions in a number of fi elds, such as auditing,
Figure 6.1Civilians in the Acquisition Workforce, September 30 Annual Snapshots
SOURCE: Gates et al., 2008, Figure 3.1.
120,000
100,000
80,000
60,000
40,000
20,000
01992 1993 1994 1995 1996 1997 1998 1999 2000 2001 2002 2003 2004 2005 2006
Nu
mb
er o
f ci
vilia
ns
Fiscal year

92 From Marginal Adjustments to Meaningful Change
123456789
101112131415161718192021222324252627282930313233343536
science and technology, manufacturing and production, purchasing and procurement, and industrial property management.
Civilian Personnel Management in DoD: The National Security Personnel System
As illustrated in the previous section, civilian personnel dominate the organic AW. In 2003, Congress approved DoD’s request to create a new human-resource management system for DoD’s civilian work-force to replace the more traditional personnel management system. Th e National Security Personnel System (NSPS) is based on person-nel demonstration projects that had been approved and implemented
Figure 6.2Career Field Distribution for the Civilian Acquisition Workforce, FY 2006
Facilities Engineering4%
Communications4%Test and Evaluation
Engineering5%
Other/Unknown5%
Quality Assurance6%
Business, Cost Estimating, Financial
Management7%
Program Management7%
Life Cycle Logistics10%
Contracting22%
Systems Planning, R&D,Engineering
30%
SOURCE: Gates et al., 2008, Figure 3.5.

Shining a Spotlight on the Defense Acquisition Workforce—Again 93
since 1980 on a limited basis across the federal government. NSPS is intended to increase management fl exibility in hiring, compensation and labor relations and to better motivate eff ective work. Importantly, NSPS allows DoD to link salary adjustments more directly with indi-vidual and organizational performance (Congressional Budget Offi ce [CBO], 2008, pp. 22–23). DoD views fl exibilities embodied in NSPS as critical to the eff ective recruitment and utilization of civilian person-nel within DoD (CBO 2008, pp.1–2). Th e department began convert-ing personnel to the NSPS system in 2006 and by the end of FY 2008,
Figure 6.3Career Field Distribution for the Military Acquisition Workforce, FY 2006
Communications3%
Quality Assurance4%Other/Unknown
6%
Life Cycle Logistics6%
Test and EvaluationEngineering
11%
Systems Planning, R&D,Engineering
14%
Contracting25%
Program Management29%
Business, CostEstimating, Financial
Management2%
SOURCE: Gates et al., 2008, Figure 6.6.

94 From Marginal Adjustments to Meaningful Change
123456789
101112131415161718192021222324252627282930313233343536
26 percent of DoD’s civilian workforce was part of NSPS.6 Further expansion of NSPS has been put on temporary hold, pending a review of its implementation (DoD, 2009).
Th e AW had substantially more experience with the demonstra-tion projects that inspired NSPS than has DoD’s workforce as a whole. As of the end of FY 2005, 24 percent of DoD’s AW was part of a demonstration project pay plan, compared with 7 percent of the overall DoD workforce.7
Th e Acquisition Workforce Personnel Dem-onstration Project, as its name would suggest, focused specifi cally on the AW, and oth-ers, such as the demonstration project at the Naval Weapons Center in China Lake, Cali-fornia, focused on locations with a large share of acquisition workers. Th is suggests that the AW and its managers may be better prepared to implement NSPS and to reap the hoped-for benefi ts of the new system.8
Strategic Human Capital Planning for the Acquisition Workforce
Th e Department of Defense generates a DoD-wide strategic human capital plan for its entire civilian workforce.9 Th e Under Secretary of Defense for Acquisition, Technology, and Logistics (USD (AT&L))
6 Author’s calculations based on FY 2008 DoD Civilian Master File.7 Author’s calculations based on FY 2005 DoD Civilian Master File and Acquisition Work-force File data.8 Evaluations of the demonstration projects provide a basis for encouragement, but no defi nitive evidence that the management fl exibilities improve outcomes. For example, Schay et al. (2002) found that the demonstration project shifted employee expectations, albeit slowly, about the relationship between pay and performance.9 Th e President’s Management Agenda of 2001 emphasized the importance of improved management and performance of the federal government; a key initiative in the agenda is the eff ective strategic management of human capital within the government agencies.
Military personnel make up one-third
of the program management
community—but there are few
military personnel in auditing, science and
technology, and the manufacturing
and production communities.

Shining a Spotlight on the Defense Acquisition Workforce—Again 95
issued a strategic human capital plan for the AW for the fi rst time in 2006, which is currently in its third revision (see U.S. Department of Defense, Acquisition, Technology, and Logistics, 2007). Th is plan emphasizes the importance of a “total workforce” perspective that includes military, civilians and contractors. Subsequently, Sec-tion 851 of the National Defense Authori-zation Act of 2008 required DoD to have a separate section in its Civilian Human Capi-tal Strategic Plan (HCSP) on the AW. Th e AW is the only workforce that has been sin-gled out for special focus with a stand-alone, DoD-wide HCSP.
Although USD (AT&L) is the senior offi cial providing overall supervision of the defense acquisition system, the offi ce does not have direct authority over the many issues aff ecting AW management.10
Th at authority falls to the services and agencies, which have “con-siderable infl uence over the shaping of their respective acquisition arms—prioritizing and approving operational requirements; building their [s]ervice program objective memorandums; and, in most cases, staffi ng and equipping program management offi ces” (Lumb, 2008, p. 19, summarizing fi ndings from the Section 814 Report). USD (AT&L) is responsible for developing the AW plan and improving the AW; but ultimately, its role is to provide leadership and guidance on workforce issues.
Th e current emphasis on strategic human capital management is one of many workforce-related perspectives that have captured the attention of Congress and other federal policymakers over the years. We have already mentioned the pressures that emerged from the Pack-ard Commission in the late 1980s to trim the size of the federal AW—the same workforce that is now criticized for being too small and for relying overmuch on contractors. Th ese calls were buttressed by a more
10 See the Section 814 Report, 2007, pp. 2–5.
The acquisition workforce is the only workforce for which DoD has developed a stand-alone human capital strategic plan.

96 From Marginal Adjustments to Meaningful Change
123456789
101112131415161718192021222324252627282930313233343536
general movement to reinvent and downsize the federal government that began in 1993 with the National Performance Review. Follow-ing closely on the heels of that downsizing push was an emphasis on outsourcing or “contracting out” for goods and services in the mid-1990s. Managers may have shifted work from civilian and military per-sonnel to contractor personnel in direct response. We cannot examine whether such a shift actually occurred because, as we discuss in the next section of this paper, we lack data on the use of contractors. In addi-tion to these broader pressures to increase or decrease the use of certain types of personnel, special attention has also been paid at times to the staffi ng of particular types of organizations (such as DoD Headquarters organizations) or special types of personnel (such as senior executives or fl ag offi cers). Although strategic human capital management argues for organizing work and managing people in a strategic and eff ective way from a total workforce perspective, the current emphasis on this approach is just one of many pressures to which government managers are subject.
Basis of Main Concerns About the Defense Acquisition Workforce
In this section we describe the evidence in support of three critical issues that have been raised about the AW: that it is too small to meet current workload, that it lacks the skills needed to eff ectively accom-plish the workload, and that the workforce mix is out of line in terms of the number of contractors being used to perform acquisition func-tions. We argue that the information available on workforce require-ments, size, quality, and mix is insuffi cient to assess whether more workers, more highly skilled workers, or a diff erent mix of workers would improve acquisition outcomes.
Is the Defense Acquisition Workforce Really Too Small?
To answer this question, one needs information about how many people are needed to accomplish the work (workforce demand) and how many people are currently part of the AW (workforce supply). No

Shining a Spotlight on the Defense Acquisition Workforce—Again 97
systematic data are currently available or referenced in workforce cri-tiques on defense acquisition workforce demand. Th is is a key barrier to answering the question posed above since a characterization of the required workforce must anchor any assessment of whether the current workforce is too small or too large. Data on workforce supply exist, but they have serious limitations for accurately depicting trends in the size of the defense AW. Two limitations are of particular importance: (1) varying defi nitions of the organic (military and civilian) defense AW and (2) the absence of DoD-wide information on the number of contractors in the defense AW.
DoD recognizes that workforce manage-ment eff orts must take a “total force perspec-tive” that includes all military, civilian, and contractor personnel. A key barrier to the total force perspective for AW management is a lack of systematic data available on the contractor workforce (GAO, 2009b). Because informa-tion on the contractor workforce is completely lacking and because the military portion of the workforce is so small, discussions of AW size tend to focus on the organic, civilian workforce. Even there, data avail-ability poses serious barriers to an analysis of the workforce.
For all the attention that has been focused on the defense AW over the past three decades, one would think there would be a clear and consistent defi nition of what the defense AW is, but this is not so. DoD has identifi ed and gathered data on civilian and military members des-ignated as part of the defense acquisition workforce (AW) since 1992. However, the defi nition used to identify these individuals has changed substantially over time—so much so that the Section 1423 Panel con-cluded that the data cannot be used to provide meaningful evidence of any personnel trends.11
11 Th e Section 1423 Report provides a detailed discussion of the AW counting methods employed by DoD and by the federal government as a whole (p. 346–350).
DoD data are based on defi nitions of the acquisition workforce that vary over time; we drew on data about DoD’s overall civilian workforce for a more consistent view.

98 From Marginal Adjustments to Meaningful Change
123456789
101112131415161718192021222324252627282930313233343536
Because DoD data are based on a defi nition of the AW that is not consistent over time, we performed an analysis of DoD-wide data to provide a new perspective on how changes in the size of the civilian defense workforce may be related to acquisition issues and compared our result to the offi cial count of the defense AW.12 Rather than focus
on offi cial defense AW data, we fi rst looked at DoD-wide civilian personnel data, focusing on the number of DoD civilians in occupational series that are closely related to the acquisition activities described above. We also examined the number of DoD civilians in those occupa-tional series who were counted as part of the offi cial defense AW from 1992 to 2007.
Our analysis of DoD Civilian Personnel Master File data from the Defense Manpower Data Center, presented in Figure 6.4, shows that the total number of DoD civilians in key
acquisition-related occupational groupings had increased through the 1980s, reached a peak in 1992, reached a low point in 2000, and has increased since then, but has not returned to 1992 levels (the 2007 level is 14 percent lower than in 1992). In contrast, between 1992 and 2007, the number of DoD AW civilians (as measured by the offi -cial workforce count in these same occupations) increased by 14 percent (see Figure 6.5). Th us, whereas trends based on the offi cial AW count (depicted in Figure 6.1) refl ect modest workforce growth since 1992, an analysis that is less tied to the arbitrary DAWIA (Defense Acqui-sition Workforce Improvement Act) workforce defi nition suggests a slight decline in the workforce over the same period of time.
12 To perform this analysis, we used data that RAND assembled to support AW analysis in DoD. Th ese data are described in detail in Gates et al., 2008. In identifying the occupa-tional groupings for this analysis, we were guided by the Section 1423 Panel recommendations regarding which types of personnel should be considered part of the AW (Section 1423 Report, p. 344). We were also guided by FY 2007 DoD AW data. We attempted to identify occupa-tional series for which designated members of the defense AW represent a large share of the overall DoD workforce. Details on the specifi c occupational series included in each grouping are described in the Appendix.
Whereas the offi cial DAWIA workforce has
increased since 1992, we found
that the number of DoD civilians in acquisition-related
occupations had declined.

Shining a Spotlight on the Defense Acquisition Workforce—Again 99
Th e dichotomy between trends based on the data we analyzed and trends based on offi cial AW counts can be explained by shifts in the AW defi nition—in particular, an increased emphasis on including scientists and engineers in the DAWIA workforce count. Whereas in 1992, 38 percent of DoD personnel in acquisition-related engineering occupational series were counted as part of the AW, that fi gure was 65 percent by 2007. Th e implications are summarized in Figure 6, which depicts the number of all DoD civilians in science and engineering (“AW-related Occser Science/Engineering”) versus the number of these who were counted as part of the offi cial acquisition workforce (“AW Science/Engineering”); it also depicts the number of all DoD civil-ian in areas “other” than science and engineering (“AW-related Occ-ser Other”) versus the number of these who were counted as part of
Figure 6.4Number of DoD Civilians in Acquisition-Related Occupational Series (1980–2007), Drawn from Overall DoD Civilian Personnel Data
0
20,000
40,000
60,000
80,000
100,000
120,000
140,000
160,000
180,000
200,000
198019
8119
8219
8319
8419
8519
8619
8719
8819
8919
9019
9119
9219
9319
9419
9519
9619
9719
9819
9920
0020
0120
0220
0320
0420
0520
0620
07
Fiscal year
Nu
mb
er o
f ci
vilia
ns
Science/EngineeringPM/LogisticsProcurementAuditingQuality Assurance

100 From Marginal Adjustments to Meaningful Change
123456789
101112131415161718192021222324252627282930313233343536
the offi cial acquisition workforce (“AW Other”). Figure 6.6 illustrates that the number of DoD civilians in acquisition-related occupations increased dramatically between 1980 and 1992, began to decline until about 2001, and then experienced slight growth through 2007. In con-trast, the number of individuals in these occupational series who were counted as part of the AW declined between 1992 and 2001 for sci-entists and engineers and then increased substantially after 2001. For other acquisition-related occupational series, the number counted as part of the AW was relatively stable between 1992 and 2007.
Th e modest growth in the offi cial AW count also masks divergent trends by occupational series, which can be seen when the DoD-wide
Figure 6.5Number of DoD Civilians in Acquisition-Related Occupational Series Classifi ed as Part of the Offi cial Acquisition Workforce Count (1992–2007)
0
20,000
40,000
60,000
80,000
100,000
120,000
19921993
19941995
19961997
19981999
20002001
20022003
20042005
20062007
Fiscal year
Nu
mb
er o
f ci
vilia
ns
Science/EngineeringPM/LogisticsProcurementAuditingQuality Assurance

Shining a Spotlight on the Defense Acquisition Workforce—Again 101
civilian workforce data are disaggregated. For example, the number of DoD civilians in the program management and logistics occupation series has increased substantially and consistently since 1980. In addi-tion, the share of the DoD workforce in these occupational groupings counted as part of the offi cial AW has increased from 1992 to 2007 (see Figure 6.7). In contrast, the total number of DoD civilians in the contracting, quality assurance, and auditing areas has declined steadily since the late 1980s. Figure 6.8 depicts the data for quality assurance. Th e share of the DoD civilian workforce counted as part of the offi cial
Figure 6.6Number of DoD Civilians in Science and Engineering and Other AW-Related Occupational Series (Occser), Overall and in the Offi cial Acquisition Workforce Count (1980–2007)
0
20,000
40,000
60,000
80,000
100,000
120,000
1980
1982
1984
1986
1988
1990
1992
1994
1996
1998
2000
2002
2004
2006
Fiscal year
Nu
mb
er o
f ci
vilia
ns
AW Other
AW Science/Engineering
AW-related Occser Other
AW-related OccserScience/Engineering

102 From Marginal Adjustments to Meaningful Change
123456789
101112131415161718192021222324252627282930313233343536
AW has been relatively stable since the offi cial AW count began in 1992, but the total number of DoD civilians in these occupational
areas has declined since then. Th e decline is most striking in quality assurance (44 percent) but is also substantial for auditing (26 percent) and for the more narrow contracting grouping (23 percent). Th e decline is 10 percent for the broader contracting grouping.
Th is analysis suggests that trend analysis based on the offi cial (DAWIA) AW count is misstating trends since 1992. Whereas offi -cial statistics suggest growth, there has likely been a slight decline in the size of the work-force. It also suggests that the contracting,
Figure 6.7Number of All DoD Program Management Civilians and Percentage Included in Offi cial Acquisition Workforce Count
0
2,000
4,000
6,000
8,000
10,000
12,000
14,000
16,000
18,000
20,000
1980
1982
1984
1986
1988
1990
1992
1994
1996
1998
2000
2002
2004
2006
Fiscal year
Nu
mb
er o
f ci
vilia
ns
0
10
20
30
40
50
60
70
80
90
100
% in
AW
All Program ManagementProgram Management % in AW
Contracting, quality assurance,
and auditing—areas most likely to be affected by
increased workload from procurement
reforms—have experienced
signifi cant decreases in size.
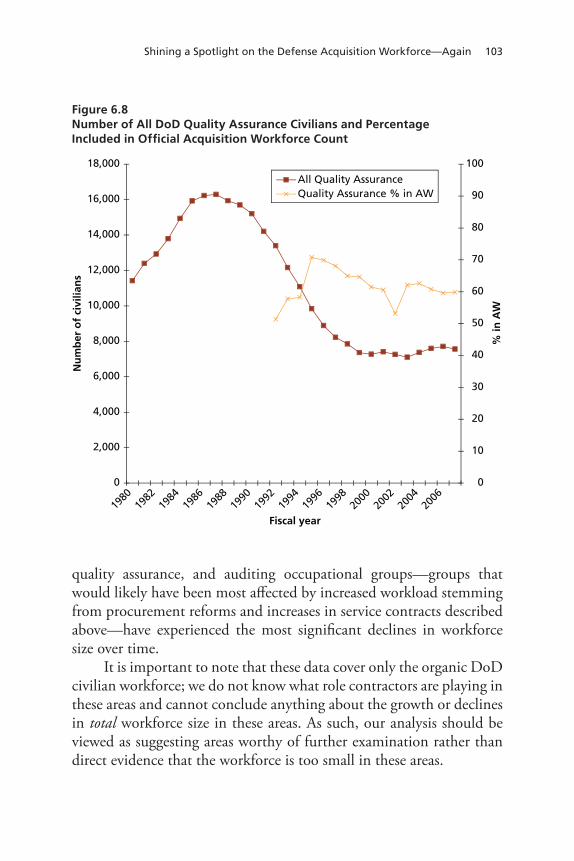
Shining a Spotlight on the Defense Acquisition Workforce—Again 103
quality assurance, and auditing occupational groups—groups that would likely have been most aff ected by increased workload stemming from procurement reforms and increases in service contracts described above—have experienced the most signifi cant declines in workforce size over time.
It is important to note that these data cover only the organic DoD civilian workforce; we do not know what role contractors are playing in these areas and cannot conclude anything about the growth or declines in total workforce size in these areas. As such, our analysis should be viewed as suggesting areas worthy of further examination rather than direct evidence that the workforce is too small in these areas.
Figure 6.8Number of All DoD Quality Assurance Civilians and Percentage Included in Offi cial Acquisition Workforce Count
0
2,000
4,000
6,000
8,000
10,000
12,000
14,000
16,000
18,000
1980
1982
1984
1986
1988
1990
1992
1994
1996
1998
2000
2002
2004
2006
Fiscal year
Nu
mb
er o
f ci
vilia
ns
0
10
20
30
40
50
60
70
80
90
100
% in
AW
All Quality AssuranceQuality Assurance % in AW

104 From Marginal Adjustments to Meaningful Change
123456789
101112131415161718192021222324252627282930313233343536
Overuse or Inappropriate Use of Contractors
Due to lack of data, we are simply unable to characterize when, where, and why contractors are being used to provide acquisition-related ser-vices across DoD; the characteristics of those contractors; and how their use and characteristics may have changed over time. Th e infor-mation that we do have comes from targeted, in-depth, point-in-time examinations of specifi c programs or specifi c organizations. Th e major take-away from these studies is that DoD makes substantial use of contractors in performing acquisition-related functions and that this use varies dramatically across functions, occupations, programs, and organizations.
Where Are Contractors Being Used?
Targeted studies of the use of contractors to perform acquisition func-tions suggest that contractors are being used by most DoD acquisition
organizations, but that organizational reliance on contractors is highly variable. Vernez et al. (2007) examined FY 2004 workforce data for individual business units within the Air Force Materiel Command (AFMC), which is the key acquisition command in the Air Force. Th eir analysis shows that the share of contractor man-power by organizational unit within AFMC varies dramatically, from 9 percent (Oklahoma Air Logistics Center) to as high as 89 percent (Arnold Engineering Development Center). Contractors represent 31 percent of the work-force at acquisition centers, 23 percent of the workforce at laboratory directorates, and 47 percent of the workforce at test and evaluation centers within AFMC. Other business units within AFMC, including logistics centers, have
a lower reliance on contractors (Vernez et al., 2007, Table 2.2, p. 14). Th e authors also found substantial variation in the use of contractors
Information on contractors is
based on point-in-time studies
of specifi c organizations;
we cannot characterize
when, where, and why contractors
are being used to provide
acquisition-related services
across DoD.

Shining a Spotlight on the Defense Acquisition Workforce—Again 105
across occupational areas; for example, 8 percent of engineers and sci-entists in the Aeronautical Systems Center were contractors, 55 percent in the Air Armament Center were contractors, and 78 percent in the Electronic Systems Center were contractors (Vernez et al., 2007, p. 13).
GAO’s analysis of program offi ce staffi ng for 61 major weapons programs showed that 41 percent of program offi ce staff consisted of contractors. Th e largest number of contractors was found among engi-neering and technical staff , where 53 percent were not government employees. Twenty-six percent of staff in program management, 17 per-cent in contracting, and 47 percent in other business functions were con-tractors or other nongovernment staff . Th e fractions were substantially higher for administrative support and other areas (GAO, 2009a, p. 24).
Vernez and Massey (forthcoming), in research on the Air Force cost-estimating workforce, conducted a comprehensive point-in-time survey of all individuals working on cost-estimating tasks for the Air Force in spring of 2008. Th eir work reveals that about half of the indi-viduals performing such tasks are contractors and that the proportion of contractors in the workforce varies across the product and logistics centers examined. Contractors did not appear to be any less qualifi ed; they were about as likely to have certifi cation in the area of cost esti-mation (about one-third of the workforce had such certifi cation) and tended to have as much or more experience in cost estimation com-pared with the organic workforce. Th e study also found that the Air Force was relying on contractors to do the actual cost-estimating work, whereas the organic staff tended to be fi nancial management general-ists or cost managers in charge of managing the cost-estimating work and integrating that work with other fi nancial management functions (Vernez and Massey, forthcoming).
In a 2006 DoD Inspector General (DoD IG) audit of the AW at six AW locations, one location (Naval Sea Systems Command) was unable to provide any data on contractors performing acquisition func-tions. At the other locations, contractors as a portion of the total AW ranged from 16 percent (Defense Supply Center Columbus) to 64 per-cent (Air Force Space and Missile Systems Center) (U.S. Department of Defense, Offi ce of the Inspector General, 2006, p. 12).

106 From Marginal Adjustments to Meaningful Change
123456789
101112131415161718192021222324252627282930313233343536
Why Are Contractors Being Used?Th e targeted studies described previously suggest that the use of con-tractors to perform acquisition functions is not based on a comprehen-sive strategic assessment of the long-run costs and benefi ts of their use. Th e studies also provide evidence that acquisition organizations are not able to fi ll all of their requirements with in-house personnel for a range
of reasons, including resource constraints and process barriers.
In its review of staffi ng for major weap-ons programs, GAO found that 46 out of 59 programs that responded to questions about staffi ng had received authorizations for all required positions, but that only 42 percent of the programs were able to fi ll all of their authorized positions (GAO, 2009a, pp. 23–24). Th irty-one of these programs
provided information to GAO about the reasons for using contractor personnel (GAO, 2009b, pp. 8–9). Only one cited cost considerations. Over three-quarters of DoD acquisition programs reported that they used contractors as a way to get around critical constraints: person-nel ceiling, civilian pay budget constraints, limitations with the federal government hiring process, or a lack of in-house capability in a particu-lar area. Th ese fi ndings echoed those from a prior study conducted by the DoD Inspector General (DoD IG, 2006, p. 13).
GAO attributes DoD’s reliance on contractor support to a “criti-cal shortage of certain acquisition professionals with technical skills as it [DoD] has downsized its workforce over the last decade” (GAO, 2008, p. 30). GAO’s report also noted that some of the program offi ces interviewed for its study expressed concerns about inadequate man-power. GAO found that DoD has given contractors increased respon-sibility for “key aspects of setting and executing a program’s business case,” including requirements development and product design (GAO, 2008, p. 29).
Vernez et al. (2007, p. 13) found varying perspectives on the pros and cons of using contractors to perform acquisition functions:
It is not clear that DoD’s use of contractors
to perform acquisition
functions is based on a strategic
assessment.

Shining a Spotlight on the Defense Acquisition Workforce—Again 107
When line managers in the AAC were asked what the optimum share of contractors would be, their answers ranged broadly, from a low of 20 to a high of 80 percent. Th e low fi gure refl ected respondents’ concerns for continuity and institutional memory. Th e high fi gure refl ected the view that contractors could do most of the functions of an SPO [system program offi ce] with the exceptions of the director and key fi nancial, security, and con-tracting positions.
Th e authors suggest that there was no way to assess the effi ciency of the use of contractors in the organizations they studied.
Vernez and Massey (2009) found that the actual workforce in the cost-estimating area was about 75 percent of stated requirements. Th ose interviewed for the study pointed to challenges in fi lling positions as well as a failure to obtain hiring authorizations for all the requirements as reasons why the actual workforce fell short of requirements.
The Workforce Lacks the Skills to Accomplish the Workload
Another common refrain in discussions about the state of the defense AW is that the nature of the work has become substantially more com-plex, while the workforce has lost some of the skills or training needed to perform this work. Th e drivers of increased complexity were dis-cussed earlier and are primarily attributed to increased use of best-value procurement methods and the complexity of service contracts.
Evidence that the workforce lacks the skills necessary is largely anecdotal, and the arguments are far less specifi c than those related to workforce size. A key barrier to assessing this perspective is a lack of systematic data on the skill level of the workforce, not to mention the skills that are required to perform the work (GAO, 2009b, p. 9). Th e only data available on the AW that are remotely related to workforce quality are certifi cation levels and education levels. Th is information is available only for the organic workforce.

108 From Marginal Adjustments to Meaningful Change
123456789
101112131415161718192021222324252627282930313233343536
On the basis of available information, the situation looks pretty good. According to the Section 814 Report (p. 3-2), the AW is more experienced and more highly educated than the defense workforce overall, and certifi cation rates are high:
66 percent of the AT&L civilian workforce is certifi ed, and 50 percent meet or exceed the required position certifi cation level. However, for critical acquisition positions, the certifi cation rate increases to 75 percent, with 65 percent meeting or exceeding the position.
But it is not clear how well certifi cation standards—and the train-ing provided to achieve those standards—are aligned to actual skill
requirements. Moreover, concerns have been expressed that even the certifi cation standards may be outdated or that the training provided to meet the standards does not refl ect current skill needs (Vernez and Massey, forthcoming).
USD (AT&L) is leading an eff ort to defi ne workforce competencies for critical seg-ments of the AW (GAO, 2009b, pp. 10–11). Th is eff ort should lay the groundwork for a more systematic analysis of the question of whether the workforce actually has the skills needed to do the work. A big question that must be addressed in any analysis of this issue
is whether observed defi cits in skills stem from a lack of training, from an inappropriate workforce mix, or from a combination of both.
Conclusions
Th e AW has been the subject of numerous investigations and specifi c policy guidance over the past three decades. Th ere have been pressures to increase and decrease the size of this workforce, to improve its qual-ity (usually in terms of training and certifi cation requirements), and
DoD lacks systematic data on
the skill level of the workforce—
and it is not clear how existing data, such as certifi cation
standards, are aligned to actual
skill requirements.

Shining a Spotlight on the Defense Acquisition Workforce—Again 109
to both outsource its workload and bring its workload in-house. Yet few would argue that defense acquisition outcomes have dramatically improved in response to these varied policy initiatives.
Th e FY 2010 defense budget proposal includes the latest install-ment in a series of policy initiatives targeting the defense AW—with recommendations to grow the workforce and rein in reliance on contractors. But should we expect that a larger federal defense AW will lead to improved acquisition outcomes? Work-force initiatives are unlikely to be the silver bullet that will improve acquisition outcomes, but given present data constraints, we would not be able to answer that question anyway. As we have demonstrated in this paper, the infor-mation needed to assess the success of workforce initiatives and their contribution to overall acquisition outcomes is sorely lacking.
Eff orts should be directed toward assembling the information needed to track the eff ectiveness of these new initiatives and to make, refi ne, or dismiss the case for further workforce adjustments. Below, we identify the steps DoD should take to acquire this information.
Establish Key Process Standards That Are Plausibly Infl uenced by the Workforce, and Consistently Monitor Those Processes. An infi nitely large and supremely qualifi ed AW will not generate on-time, on-budget systems with no problems or appeals 100 percent of the time. Th e AW acts within the confi nes of a process, and if the process itself is not operating eff ectively, then improvements to the workforce can only do so much. Attention must be paid to the acquisition process itself, including the incentives for eff ective work embodied in that process.
Th e AW must be viewed as an input to a process operation, and thought should be given to concrete outcomes that the workforce could be expected to infl uence. Th ese would not be the high-level outputs of on-time, on-budget systems, but they could include important process-oriented outcomes that refl ect top-fl ight systems engineering practices and could ultimately lead to improvements in the key outcomes of interest. It is also critical to acknowledge that the AW is engaged in a
Workforce initiatives are unlikely to be the silver bullet that will improve acquisition outcomes.

110 From Marginal Adjustments to Meaningful Change
123456789
101112131415161718192021222324252627282930313233343536
wide range of procurement-related activities and that diff erent types of activities are likely to require separate and distinct outcome measures.
Map Workforce Characteristics to Acquisition Activities and Their Outcomes. To identify the impact of workforce size and quality on acquisition outcomes, one needs to assess acquisition outcomes and relate those outcomes back to the workforce. For traditional defense acquisition systems, it may be sensible to track data at the acquisition program level using data on the workforce that are mapped to acquisi-tion programs. An ability to map the AW to outcome data for the programs or organizations in which they work would support system-atic analyses of the relationship between workforce attributes and out-comes. Currently, such a mapping of the defense AW is not possible
Accomplishing this goal would require managers to develop met-rics appropriate to the program, organization, or activity in question that plausibly inform the quality of the work being done; that is, they should develop metrics based on the things that the workforce could infl uence and that would ultimately be expected to aff ect outcomes. An improved ability to link the workforce with organizational out-comes is consistent with strategic human capital management and with an eff ective implementation of NSPS. For example, if manag-ers agree that providing timely systems engineering to support invest-ment decisionmaking is a critical process indicator, they could track whether such activities are occurring and possibly assess the quality of those activities. Th at information could then be linked with data on that program’s workforce to assess the relationship between work-force characteristics and these outcomes. Similarly, the tenure of pro-gram managers has been highlighted as a plausible factor infl uencing outcomes (GAO, 2008, p. 29). Th is workforce characteristic could be tracked at the program level and related to program outcomes to determine whether there exists a relationship between tenure and outcomes.
Assess the Appropriateness of the Current Workforce Mix. As illus-trated in this paper, the data required to provide a convincing argu-ment that the defense AW mix is inadequate or inappropriate to meet

Shining a Spotlight on the Defense Acquisition Workforce—Again 111
current needs are lacking. Our analysis reveals declines in the num-ber of DoD employees in auditing, contracting, and quality assurance occupations. Contractors may have been used to fi ll some of this gap. Our analysis also suggests that the AW focused on science and engi-neering has remained relatively stable and that program managers and logistics professionals (generalists) have grown. But current data cannot shed light on whether the workforce mix is appropriate and adequate to workforce needs.
Th e ideal workforce mix is likely to vary by acquisition activity and to change over time as acquisition processes and priorities change. Assessing whether the workforce mix is on target requires data that relates workforce measures to outcomes using a consistent unit of analysis such as the acquisition program. Because it will take time to assemble such data and identify the critical process and outcome data, it may be worthwhile for DoD to conduct a rough assessment of the appropriateness of the workforce mix through a systematic, program-by-program survey of program managers. Such information could be rolled up to provide a rough, high-level sense of some critical areas where the workforce mix is out of balance and to suggest more short-term actions that might be taken to correct some imbalances.
Include the Contractor Workforce in Strategic Workforce Plan-ning. Currently, contractors are eff ectively ignored in strategic human capital eff orts, yet we know they are playing a nontrivial role. Th e bot-tom line is that it is not possible to eff ectively manage human capital while ignoring an important segment of the workforce. In order to better understand the use of contractors in acquisitions, two things are needed: (1) better data on the contractor workforce as discussed above, and (2) a better understanding of the environment in which acquisition-related staffi ng and resource decisions are made.
Assess How Staffi ng and Resourcing Decisions Related to Acquisi-tion Functions Are Made. Policymakers must keep in mind that spe-cifi c characteristics of the workforce and its training and development are only partial contributors to acquisition outcomes. Even policies that are targeted specifi cally at the AW are infl uenced by budgeting

112 From Marginal Adjustments to Meaningful Change
123456789
101112131415161718192021222324252627282930313233343536
and management decisions that take place within the services and agencies. A realistic assessment of how staffi ng and resource decisions relate to the acquisition functions—the decisions that determine how many and what type of people are brought onboard to do the work, how their workload is managed, and how they are a mentored and trained—is necessary to understand the eff ect that specifi c policies are likely to have on the AW and ultimately on acquisition outcomes. Such an understanding is especially critical in a time of workforce growth because the hiring that takes place today will infl uence the AW for decades to come.
Occupational Grouping Defi nitions Used in This Report
To identify occupational groupings for this analysis, we were guided by the recommendations contained in the Section 1423 Report as to who should be considered part of the AW. We were also guided by FY 2007 DoD AW data. We attempted to identify occupational series for which designated members of the defense acquisition workforce (AW) represent a large share of the DoD workforce as a whole.
We considered the following occupational groupings:
• Quality Assurance• Auditing• Program Management and Logistics• Procurement• Science and Engineering
Quality Assurance and Auditing
In analyzing trends for quality assurance and auditing, we look at occu-pational series with 1910 (Quality Assurance) and 511 (Auditing).
Program Management and Logistics
In the program management and logistics area we provide two dif-ferent slices on the data. A comprehensive program management and logistics category includes all the following occupational series: 340 (Program Management), 343 (Management and Program Analysis),

Shining a Spotlight on the Defense Acquisition Workforce—Again 113
and 346 (Logistics Management). Th e more narrow program manage-ment category includes 340 and 343. Note that we exclude occupa-tional series 301 (Miscellaneous Administrative and Program) from both analyses. Although this occupational series represents a substantial share (21 percent) of civilians in the DoD AW Program Management career fi eld, the AW represents only 13 percent of all DoD civilians in that occupational series in FY 2007. Trends are similar for the two groupings.
“Series 301, covers positions the duties of which are to perform, supervise, or manage two-grade interval administrative or program work for which no other series is appropriate. Th e work requires ana-lytical ability, judgment, discretion, and knowledge of a substantial body of administrative or program principles, concepts, policies, and objectives.” (U.S. Offi ce of Personnel Management, 2008)
Procurement
In the procurement area, we also present two slices of the data. A more comprehensive grouping includes the following occupational series: 1101 (General Business and Industry), 1102 (Contracting), 1103 (Industrial Property Management), 1104 (Property Disposal), 1105 (Purchasing), and 1150 (Industrial Specialist).13
A more restricted grouping (Contracting 2) includes the follow-ing occupational series: 1102, 1103, 1105, 1150. Th e second grouping emphasizes those occupational series for which the AW is a 90 percent + share of the AW. Note that there are a large number of individuals in the 1101 series who are part of the AW, (3,816 in FY 2007), but they represent only 37 percent of the total DoD 1101 workforce. Th e over-all trends are similar for both defi nitions.
Science and Engineering
To determine the acquisition-related science and engineering posi-tions, we looked at the percentage of the DoD workforce that is
13 Note that some FAI analyses have included occupational series 1106, but there were fewer than 100 such individuals in the AW in 2007, and we have excluded them from the analysis.

114 From Marginal Adjustments to Meaningful Change
123456789
101112131415161718192021222324252627282930313233343536
counted as part of the AW by occupational series for the 800, 1300, 1500 series. We included all occupational series where the AW share was more than one-third in FY 2007. Th ese are as follows:
801 General Engineering803 Safety Engineering804 Fire Protection Engineering806 Materials Engineering810 Civil Engineering819 Environmental Engineering830 Mechanical Engineering850 Electrical Engineering854 Computer Engineering855 Electronics Engineering858 Biomedical Engineering861 Aerospace Engineering871 Naval Architecture890 Architectural Engineering893 Chemical Engineering896 Industrial Engineering1301 General Physical Sciences1310 Physics1315 Hydrology1320 Chemistry1321 Metallurgy1350 Geology1370 Cartography1382 Food Technology1384 Textile Technology1515 Operations Research1520 Mathematics1529 Mathematical Statistics1550 Computer Science
Th e largest occupational series included in this analysis are: 801 (8,013 AW members; 70 percent), 810 (4,126 AW members; 65 percent), 830

Shining a Spotlight on the Defense Acquisition Workforce—Again 115
(6,287 AW members; 69 percent), 854 (2,421 AW members; 81 per-cent), 855 (11,132 AW members; 67 percent), 861 (2,995 AW mem-bers; 82 percent), 1550 (2,564 AW members; 60 percent).
Although, as we report below, the share of DoD’s science and engineering workforce that is counted as part of the AW has grown over time, we did not observe shifts in the specifi c occupational series that were included in the defense AW.
Generally speaking, those occupational series in the 800, 1300, and 1500 series that were excluded on the basis of this cutoff had 25 or fewer DoD AW members in FY 2007. Th e three exceptions are occupational series 802 (Engineering Technical), which had 1045 AW members representing 9 percent of the DoD workforce; occupational series 808 (Architecture), which had 255 AW members representing 32 percent of the AW; and occupational series 856 (Electronics Techni-cal), which had 351 AW members representing 6 percent of the DoD workforce.
Sensitivity Checks
To validate that the occupational series considered part of the AW had not changed much between 1992 and 2007, we reviewed data on the percentage of the DoD workforce counted as part of the AW by occu-pational series for FY 1992. With a few exceptions (809, 856, 895, 1340, 1386, 1521, 1531), the share of the occupational series classifi ed as part of the AW rose between 1992 and 2007. Among those occu-pational series where the share declined between 1992 and 2007, the share of all occupational series members in the AW was well below the one-third threshold in both years except in the case of occupational series 1386 (Photographic Technology), where it was 34 percent in FY 1992. However, this is a small career fi eld (with only 26 members DoD-wide in FY 1992 and seven in FY 2007) that does not seem to be directly related to the acquisition; hence, we decided not to include it in the analysis.

123456789
101112131415161718192021222324252627282930313233343536

117
About the Authors
Mark V. Arena has worked on a variety of research projects for the U.S. Navy, the U.S. Air Force, OSD, and the U.K. Ministry of Defence since joining RAND in 1998. Currently, he is the associate director for the Acquisition and Technology Policy Center in RAND’s National Security Research Division. His research has focused on technology evaluations, cost analysis, risk analysis, and industrial-base simulations for acquisi-tion programs. Recent projects includes a study of the long-term price changes for ships and fi xed-wing aircraft, the history of cost growth for major weapon systems, the cost savings due to multiyear procurement for the F-22A, and an assessment of domestic submarine-design capa-bilities. He has also developed an analytical model for the U.S. Navy and the U.K. Ministry of Defence to understand the shipyard and bud-get impacts of various force-structure choices and procurement plans. He graduated from Yale University with a B.S. in chemistry and later received a Ph.D. in physical chemistry from Stanford University.
John Birkler has held a wide variety of research and management posi-tions since joining RAND in 1977. Currently, he manages RAND’s Maritime Program, overseeing research for the U.S. Navy, the Offi ce of the Secretary of Defense, the U.S. Special Operations Command (SOCOM), the U.S. Coast Guard, the Australian Department of Defence, and the U.K. Ministry of Defence. He also mentors U.S. Navy, Marine Corps, and Coast Guard Executive Fellows at RAND. His research spans RDT&E strategies and planning and industrial base, acquisition, management, and organizational issues. In addition to the above maritime clients, his research has covered a wide range of

118 From Marginal Adjustments to Meaningful Change
123456789
101112131415161718192021222324252627282930313233343536
aircraft systems (including the Joint Strike Fighter, the F-15, the F-14, the B-1, the B-2, the A-12, the C-5, the C-17, the F-117, the F/A-18 E/F), missiles and munitions (including the advanced cruise missile, the Tomahawk cruise missile, and precision conventional munitions), and surface and subsurface combatants. He also has led studies on the links between the health of the defense industrial base and levels of innovation and competition. His most recent work has involved man-aging or leading multiple analyses of alternatives for the U.S. Navy, the Marine Corps, the U.S. Army, and SOCOM and leading a high-profi le RAND analysis of Australia’s capabilities and capacity to design conventional submarines. He holds B.S. and M.S. degrees in physics and completed the UCLA executive program in management in 1992. After completing his third command tour, he retired from the Navy Reserve with the rank of captain.
Irv Blickstein is a senior engineer at RAND with 35 years of experi-ence in the fi eld of defense analysis and management; his specialties are planning, programming, budgeting, and acquisition. Since joining RAND in 2001, he has managed research activities associated with a series of projects in support of the offi ce of the Chief of Naval Opera-tions and the Undersecretary of Defense (AT&L), and he also serves on the Chief of Naval Operations Executive Panel. His projects have covered a wide variety of topics, including directed energy, unmanned vehicles, reviews of foreign acquisition programs, sea basing, and cost analyses of both ships and aircraft. He also has examined the cost of statutory and regulatory constraints in DoD. Recent research includes an analysis of cost growth in U.S. Navy ships over a 40-year period and an evaluation of the hiring and budgeting practices at naval shipyards. He served 31 years in DoD before joining RAND, 18 of them as a senior executive, and he was awarded four Presidential Rank awards. He received a B.S. in industrial engineering from Ohio State Univer-sity and an M.E.A. in engineering management from George Wash-ington University.
Jeff rey A. Drezner, a senior policy researcher, joined RAND in 1985. He has conducted policy analysis on a wide range of issues,

About the Authors 119
including energy research and development planning and program management; best practices in environmental management; analyses of cost and schedule outcomes in complex system development pro-grams; aerospace industrial policy; defense acquisition policy; and local emergency response. His current research continues to empha-size issues associated with technology development, organizational behavior, and program management. He served as the associate program director for acquisition in RAND’s Project Air Force from 1992 to 1994. From June 1995 to September 1995, he participated in a researcher exchange program in the Pentagon, sponsored by the Offi ce of the Under Secretary of Defense (AT&L). He received an M.S. in policy analysis from the University of California, Davis, and a Ph.D. in political science (public policy) from the Claremont Graduate School.
Susan M. Gates is a senior economist, the director of the Kauff man-RAND Institute for Entrepreneurship Public Policy in the RAND Institute for Civil Justice (ICJ), the quality assurance manager for ICJ, and a professor of economics at the Pardee RAND Graduate School. She specializes in the economics of organizations, political economy, and applications of economic management principles to public sector organizations. She has a special interest in organiza-tional governance, entrepreneurship, leadership, and workforce man-agement. She has led numerous projects on a wide range of topics over the years. Her current projects include a comprehensive evalua-tion of the New Leaders for New Schools national principal training and support program, data-driven analyses of the DoD acquisition workforce, and a study of the potential role of innovation in improv-ing health care delivery. Previous studies examined organizational approaches for ensuring the quality and productivity of DoD’s edu-cation and professional development activities targeting civilians, outsourcing in DoD, higher education from an industry perspec-tive, and the cost of and demand for a military childcare program. She received her Ph.D. in economics from Stanford Graduate School of Business and her M.A. in Russian and Eastern European studies from Stanford University.

120 From Marginal Adjustments to Meaningful Change
123456789
101112131415161718192021222324252627282930313233343536
Meilinda Huang was a research assistant at RAND from 2007 to 2009. In addition to national security projects, she contributed to analyses related to health economics and RAND’s Institute for Civil Justice. She worked with a large research team to develop a compre-hensive framework for assessing how to evaluate the Medicare Part D program, both on its own and in relation to other large public and private prescription drug programs. In addition, she contributed to case studies on cell phone radiation, deca-BDE, and benzene, which pose signifi cant health risks and could trigger the next mass litigation case. She also created a database that organized the compensation given to individuals and businesses by government agencies and programs, insurance, and charities in the aftermath of Hurricane Katrina. She received her B.A. in economics from Princeton University.
Robert Murphy retired as a member of the Senior Executive Service after a 33-year career in the U.S. Navy’s Nuclear Propulsion Program. He fi nished his career as the program’s director of resource manage-ment and was responsible for budget, acquisition, and logistic sup-port for the Naval Nuclear Propulsion Program. While in government service, he participated in the acquisition of every nuclear submarine in the U.S. fl eet today in addition to design contracts for Seawolf- and Virginia-class submarines. Since retiring from public service, he has been consulting for both commercial and government organizations, specializing in major system acquisitions. Projects have included sev-eral cost studies of Virginia-class submarines and advising on the most recent multiyear contract for acquisition of these submarines. RAND research projects have included several studies of the United Kingdom’s nuclear submarine industrial base and of Australian conventional sub-marine design issues. He earned an M.B.A. from George Washington University.
Charles Nemfakos was appointed a senior fellow at RAND after lead-ing Nemfakos Partners LLC in providing support to private sector and governmental entities, both in the United States and internationally. He provides research, strategically oriented analyses, support, and advice to a broad variety of RAND clients. Previously, he was an executive with

About the Authors 121
Lockheed Martin Corporation, Naval Electronics and Surveillance Systems. During his federal service, he served in assignments in the executive and legislative branches of government, primarily in DoD, as a budget analyst and as a planner in the Offi ce of the Secretary of Defense and the Department of the Navy. As a senior executive in the Department of the Navy, he served in a variety of fi nancial positions, including deputy assistant secretary for installations and logistics, dep-uty under secretary, and senior civilian offi cial for fi nancial manage-ment and comptroller. He was the recipient of multiple Distinguished Service Medals and numerous other awards and citations, and he has been recognized by three U.S. presidents with four Presidential Rank Awards. He was selected to receive American University’s Roger W. Jones Award for Executive Leadership, elected a fellow of the National Academy of Public Administration, and honored by the Secretary of Defense as one of nine Career Civilian Exemplars in the 228-year his-tory of the U.S. armed forces. He led two Department of the Navy operating units that were awarded the Meritorious Unit Citation. He received a B.A. in history from the University of Texas and an M.A. in government from Georgetown University.
Susan Woodward is a senior communications analyst, working prin-cipally for RAND’s national security divisions to develop all forms of research communication and help ensure RAND that research is acces-sible to diverse audiences. Prior to joining RAND, she was a senior analyst in the U.S. Government Accountability Offi ce’s Homeland Security and Defense divisions, assessing the eff ectiveness of govern-ment programs related to aviation security, defense acquisition, and defense personnel issues. She received a B.A. in English from the Uni-versity of Maine and an M.A. and Ph.D. candidacy in English from the University of Michigan.

123456789
101112131415161718192021222324252627282930313233343536

123
Bibliography
Acquisition Advisory Panel, Section 1423 Report, Report of the Acquisition Advisory Panel to the Offi ce of Federal Procurement Policy and the United States Congress, Washington, D.C.: Offi ce of Federal Procurement Pol-icy, 2007.
Antón, Philip S., Eugene C. Gritton, Richard Mesic, and Paul Steinberg, Wind Tunnel and Propulsion Test Facilities: An Assessment of NASA’s Capabilities to Serve National Needs, Santa Monica, Calif.: RAND Cor-poration, MG-178-NASA/OSD, 2004. As of November 16, 2009:
http://www.rand.org/pubs/monographs/MG178/Antón, Philip S., Dana J. Johnson, Michael Block, Michael Scott Brown,
Jeff rey A. Drezner, J. A. Dryden, E. C. Gritton, Th omas Hamilton, Th or Hogan, Richard Mesic, Deborah J. Peetz, Raj Raman, Paul Stein-berg, Joe Strong, and William Trimble, Wind Tunnel and Propulsion Test Facilities: Supporting Analyses to an Assessment of NASA’s Capabilities to Serve National Needs, Santa Monica, Calif.: RAND Corporation, TR-134-NASA/OSD, 2004. As of November 16, 2009:
http://www.rand.org/pubs/technical_reports/TR134/ Archibald, Kathleen A., Alvin J. Harman, M. Hesse, John R. Hiller, and
Giles K. Smith, Factors Aff ecting the Use of Competition in Weapon System Acquisition, Santa Monica, Calif.: RAND Corporation, R-2706-DRE, February 1981. As of November 16, 2009:
http://www.rand.org/pubs/reports/R2706/Arena, Mark V., Robert S. Leonard, Sheila E. Murray, and Obaid Younossi, His-
torical Cost Growth of Completed Weapon System Programs, Santa Monica, Calif.: RAND Corporation, TR-343-AF, 2006. As of November 16, 2009:
http://www.rand.org/pubs/technical_reports/TR343/

124 From Marginal Adjustments to Meaningful Change
123456789
101112131415161718192021222324252627282930313233343536
Arena, Mark V., Lionel A. Galway, John C. Graser, Felicia Wu, Obaid You-nossi, Bernard Fox, Jerry M. Sollinger, and Carolyn Wong, Impossible Certainty: Cost Risk Analysis for Air Force Systems, Santa Monica, Calif.: RAND Corporation, MG-415-AF, 2006. As of November 16, 2009:
http://www.rand.org/pubs/monographs/MG415/Birkler, John L., et al., Diff erences Between Military and Commercial Shipbuild-
ing: Implications for the United Kingdom’s Ministry of Defence, Santa Mon-ica, Calif.: RAND Corporation, MG-236-MOD, 2005.
http://www.rand.org/pubs/monographs/MG236/Birkler, John L., Anthony G. Bower, Jeff rey A. Drezner, Gordon T. Lee, Mark
A. Lorell, Giles K. Smith, Fred Timson, William P. G. Trimble, and Obaid Younossi, Competition and Innovation in the U.S. Fixed-Wing Military Aircraft Industry, Santa Monica, Calif.: RAND Corporation, MR-1656-OSD, 2003. As of November 16, 2009:
http://www.rand.org/pubs/monograph_reports/MR1656/Birkler, John L., Edmund Dews, and Joseph P. Large, Issues Associated with
Second-Source Procurement Decisions, Santa Monica, Calif.: RAND Corporation, R-3996-RC, 1990. As of November 16, 2009:
http://www.rand.org/pubs/reports/R3996/Birkler, John L., John C. Graser, Mark V. Arena, Cynthia R. Cook, Gordon
T. Lee, Mark A. Lorell, Giles K. Smith, Fred Timson, Obaid Younossi, and Jon Grossman, Assessing Competitive Strategies for the Joint Strike Fighter: Opportunities and Options, Santa Monica, Calif.: RAND Cor-poration, MR-1362-OSD/JSF, 2001. As of November 16, 2009:
http://www.rand.org/pubs/monograph_reports/MR1362/Birkler, John L., and J. P. Large, Dual-Source Procurement in the Tomahawk
Program, Santa Monica, Calif.: RAND Corporation, R-3867-DR&E, 1990. As of November 16, 2009:
http://www.rand.org/pubs/reports/R3867/Birkler, John L., John F. Schank, Mark V. Arena, Giles K. Smith, and Gordon
T. Lee, Th e Royal Navy’s New-Generation Type 45 Destroyer: Acquisition Options and Implications, Santa Monica, Calif.: RAND Corporation, MR-1486-MOD, 2002. As of November 16, 2009:
http://www.rand.org/pubs/monograph_reports/MR1486/Birkler, John L., Giles K. Smith, Glenn A. Kent, and Robert V. Johnson,
An Acquisition Strategy, Process, and Organization for Innovative Systems,

Bibliography 125
Santa Monica, Calif.: RAND Corporation, MR-1098-OSD, 2000. As of November 16, 2009:
http://www.rand.org/pubs/monograph_reports/MR1098/Bolten, J. G., Robert S. Leonard, Mark V. Arena, Obaid Younossi, and Jerry
M. Sollinger, Sources of Weapon System Cost Growth: Analysis of 35 Major Defense Acquisition Programs, Santa Monica, Calif.: RAND Corpora-tion, MG-670-AF, 2008.
http://www.rand.org/pubs/monographs/MG670/Casey, John P., Electric Boat Corporation, testimony before the Seapower
and Expeditionary Forces Subcommittee of the House Armed Services Committee, Washington, D.C., March 8, 2007.
Chadwick, Stephen Howard, Defense Acquisition: Overview, Issues, and Options for Congress, Washington, D.C.: Congressional Research Ser-vice, RL34026, June 20, 2007.
Chu, David, and Jeff rey Eanes, Th e Trajectory of Personnel Costs in the Depart-ment of Defense, Washington, D.C.: Offi ce of the Under Secretary of Defense for Personnel and Readiness, 2008.
Commission on Army Acquisition and Program Management in Expedi-tionary Operations, “Gansler Commission Report,” Urgent Reform Required: Army Expeditionary Contracting, October 31, 2007. As of December 12, 2008:
http://www.army.mil/docs/Gansler_Commission_Report_Final_071031.pdf
Comptroller General of the United States, Decision B-275830, April 7, 1997.Congressional Budget Offi ce, A Review of Th e Department of Defense’s National
Security Personnel System, Washington, D.C., November 2008.Congressional Research Service, Defense Acquisition Workforce: Issues for Con-
gress, Washington, D.C., March 11, 1999.———, Navy LPD-17 Amphibious Ship Procurement: Background, Issues, and
Options for Congress, updated May 23, 2008.Defense Acquisition University, Acquisition, Technology, and Logistics Knowl-
edge Sharing System, 2008. As of January 28, 2009: http://akss.dau.mil , “Systems Acquisition Management: An Introduction,” Lesson 2. As
of September 15, 2009: https://learn.dau.mil/CourseWare/1_13/media/Lesson_2_Summaryf.pdf

126 From Marginal Adjustments to Meaningful Change
123456789
101112131415161718192021222324252627282930313233343536
, Section 814 Report, Defense Acquisition Structures and Capabilities Review Report, Fiscal Year 2006, Fort Belvoir, Va., June 2007.
DoD—See U.S. Department of Defense.Drezner, Jeff rey A., Th e Nature and Role of Prototyping in Weapon System Devel-
opment, Santa Monica, Calif.: RAND Corporation, R-4161-ACQ, 1992. As of November 16, 2009:
http://www.rand.org/pubs/reports/R4161/Drezner, Jeff rey A., J. M Jarvaise, R. W. Hess, P. G. Hough, and D. Norton,
An Analysis of Weapon System Cost Growth, Santa Monica, Calif.: RAND Corporation, MR-291-AF, 1993. As of November 16, 2009:
http://www.rand.org/pubs/monograph_reports/MR291/Drezner, Jeff rey A., and Giles K. Smith, An Analysis of Weapon System Acqui-
sition Schedules, Santa Monica, Calif.: RAND Corporation, R-3937-ACQ, December 1990. As of November 16, 2009:
http://www.rand.org/pubs/reports/R3937/ Drezner, Jeff rey A., and Robert S. Leonard, Innovative Development: Global
Hawk and DarkStar—Flight Test in the HAE UAV ACTD Program, MR-1475-AF, Santa Monica: RAND, 2001a. As of November 16, 2009:
http://www.rand.org/pubs/monograph_reports/MR1475/ , Innovative Development: Global Hawk and DarkStar—HAE UAV
ACTD Program Description and Comparative Analysis, MR-1474-AF, Santa Monica: RAND, 2001b. As of November 16, 2009:
http://www.rand.org/pubs/monograph_reports/MR1474/ , Innovative Development: Global Hawk and DarkStar—Transitions
Within and Out of the HAE UAV ACTD Program, MR-1476-AF, Santa Monica: RAND, 2001c. As of November 16, 2009:
http://www.rand.org/pubs/monograph_reports/MR1476/ , Global Hawk and DarkStar: Transitions Within and Out of the HAE UAV
ACTD Program, Santa Monica, Calif.: RAND Corporation, MR-1473; MR-1474; MR-1475; MR-1476, 2002a. As of November 16, 2009:
http://www.rand.org/pubs/monograph_reports/MR1476/ , Innovative Development: Global Hawk and DarkStar—Th eir
Advanced Concept Technology Demonstrator Program Experience, Exec-utive Summary, MR-1473-AF, Santa Monica: RAND, 2002b. As of November 16, 2009:
http://www.rand.org/pubs/monograph_reports/MR1473/

Bibliography 127
Drezner, Jeff rey A., Geoff rey Sommer, and Robert S. Leonard, Innovative Management in the DARPA High Altitude Endurance Unmanned Aerial Vehicle Program, Santa Monica, Calif.: RAND Corporation, MR-1054-DARPA, 1999. As of November 16, 2009:
http://www.rand.org/pubs/monograph_reports/MR1054/Drezner, Jeff rey A., and Meilinda Huang, On Prototyping: Lessons from RAND
Research, Santa Monica, Calif.: RAND Corporation, OP-267-OSD, 2009. As of December 15, 2009:
http://www.rand.org/pubs/occasional_papers/OP267Executive Offi ce of the President Offi ce of Management and Budget, Th e
President’s Management Agenda, FY 2002.Fairhall, James, “Th e Case for the $435 Hammer: Investigation of Pentagon’s
Procurement,” Washington Monthly, January 1987.Gansler Commission Report—See Commission on Army Acquisition and
Program Management in Expeditionary Operations, 2007.GAO—See U.S. Government Accountability Offi ce.Garcia, A., H. Keyner, T. Robillard, and M. Van Mullekom, “Th e Defense
Acquisition Workforce Improvement Act: Five Years Later,” Acquisition Review Quarterly, Vol. 4, No. 3, 1997, p. 295.
Gates, Susan M., Christine Eibner, and Edward G. Keating, Civilian Work-force Planning in the Department of Defense: Diff erent Levels, Diff er-ent Roles, Santa Monica, Calif.: RAND Corporation, MG-449-OSD, 2006. As of November 16, 2009:
http://www.rand.org/pubs/monographs/MG449/Gates, Susan M., Edward G. Keating, Adria Jewell, Lindsay Daugherty, Bryan
Tysinger, and Ralph Masi, Th e Defense Acquisition Workforce: An Analysis of Personnel Trends Relevant to Policy, 1993–2006, Santa Monica, Calif.: RAND Corporation, TR-572-OSD, 2008. As of November 11, 2008:
http://www.rand.org/pubs/technical_reports/TR572/General Dynamics Electric Boat, Th e Virginia Class Submarine Program: A
Case Study, Groton, Conn., February 2002.Glennan, Th omas K., Jr., Susan J. Bodilly, Frank Camm, Kenneth R. Mayer,
and Timothy J. Webb, Barriers to Managing Risk in Large Scale Weapon System Development Programs, Santa Monica, Calif.: RAND Corpora-tion, MR-248-AF, 1993. As of November 16, 2009:
http://www.rand.org/pubs/monograph_reports/MR248/

128 From Marginal Adjustments to Meaningful Change
123456789
101112131415161718192021222324252627282930313233343536
GlobalSecurity.org, LHA-1 Tarawa class Program. As of November, 2008: http://www.globalsecurity.org/military/systems/ship/lha-1-program.htm
Hanks, Christopher H., Elliot I. Axelband, Shuna Lindsay, Mohammed Rehan Malik, and Brett D. Steele, Reexamining Military Acquisition Reform: Are We Th ere Yet? Santa Monica, Calif.: RAND Corporation, MG-291-A, 2005. As of November 16, 2009:
http://www.rand.org/pubs/monographs/MG291/Hedgpeth, Dana, “Pentagon to Expand Its Acquisition Force,” Washington
Post. As of April 7, 2009: http://voices.washingtonpost.com/government-inc/2009/04/pentagon_
to_expand_its_acquisi.html ? wprss = government - incJohnson, Robert V., and John L. Birkler, Th ree Programs and Ten Crite-
ria: Evaluating and Improving Acquisition Program Management and Oversight Processes Within the Department of Defense, Santa Monica, Calif.: RAND Corporation, MR-758-OSD, 1996. As of November 16, 2009:
http://www.rand.org/pubs/monograph_reports/MR758/Klein, B. H., T. K. Glennan, Jr., and G. H. Shubert, Th e Role of Prototypes
in Development, Santa Monica, Calif.: RAND Corporation, RM-3467/1-PR, February 1963. As of November 16, 2009:
http://www.rand.org/pubs/research_memoranda/RM3467.1/Klein, B. H., W. H Meckling, and E. G. Mesthene, Military Research and
Development Policies, Santa Monica, Calif.: RAND Corporation, R-333, December 4, 1958. As of November 16, 2009:
http://www.rand.org/pubs/reports/R333/Lardner, Richard, “Army Overhauls Wartime Purchasing,” USA Today. As of
February 28, 2008: http://www.usatoday.com/news/washington/2008-02-28-2650652096_x.htm
Leonard, Robert S., Jeff rey A. Drezner, and Geoff rey Sommer, Th e Arsenal Ship: Acquisition Process Experience, Santa Monica, Calif.: RAND Cor-poration, MR-1030-DARPA, 1999. As of November 16, 2009:
http://www.rand.org/pubs/monograph_reports/MR1030/Lorell, Mark A., Bomber R&D Since 1945: Th e Role of Experience, Santa Mon-
ica, Calif.: RAND Corporation, MR-670-AF, 1995. As of November 16, 2009:
http://www.rand.org/pubs/monograph_reports/MR670/

Bibliography 129
Lorell, Mark A., Julia F. Lowell, and Obaid Younossi, Evolutionary Acquisition: Implementation Challenges for Defense Space Programs, Santa Monica, Calif.: RAND Corporation, MG-431-AF, 2006. As of November 16, 2009:
http://www.rand.org/pubs/monographs/MG431/Lumb, Mark, “Where Defense Acquisition Is Today: A Close Examination of
Structures and Capabilities,” Defense AT&L, January–February, 2008.Lynn, William, written testimony of William Lynn, Deputy Secretary of
Defense, on his confi rmation hearing before the Senate Armed Services Committee, Washington, D.C., January 15, 2009.
Mankins, John C., Technology Readiness Levels: A White Paper, NASA, Offi ce of Space Access and Technology, Advanced Concepts Offi ce, April 6, 1995. As of May 21, 2009:
http://www.hq.nasa.gov/offi ce/codeq/trl/trl.pdfMargolis, M. A., R. G. Bonesteele, and J. L. Wilson, “A Method for Analyz-
ing Competitive, Dual Source Production Programs,” presented at the 19th Annual DoD Cost Analysis Symposium, September 1985.
Northrup Grumman Corporation, Ingalls Operations: A Chronological Per-spective. As of November 8, 2008:
http://www.ss.northropgrumman.com/company/chronological.htmlNunn, Sam, “Statement of Senator Sam Nunn,” Conference Report, Vol. 132,
No. 121, 1985, p. 10.Perry, Robert L., D. DiSalvo, George R. Hall, Alvin J. Harman, G. S. Levenson,
Giles K. Smith, and James P. Stucker, System Acquisition Experience, Santa Monica, Calif.: RAND Corporation, RM-6072-PR, November 1969. As of November 16, 2009:
http://www.rand.org/pubs/research_memoranda/RM6072/ , A Prototype Strategy for Aircraft Development, RAND, RM-5597-1-PR,
July 1972.Rich, Michael, and Edmund Dews with C. L. Batten, Jr., Improving the
Military Acquisition Process, Santa Monica, Calif.: RAND Corporation, R-3373-AF/RC, February 1986. As of November 16, 2009:
http://www.rand.org/pubs/reports/R3373/Rostker, Bernard, A Call to Revitalize the Engines of Government, Santa Monica,
CA: RAND Corporation, OP-240-OSD, 2008. As of November 16, 2009:
http://www.rand.org/pubs/occasional_papers/OP240/

130 From Marginal Adjustments to Meaningful Change
123456789
101112131415161718192021222324252627282930313233343536
Sauser, B. J., J. E. Ramirez-Marquez, R. B. Magnaye, and W. Tan, System Maturity Indices for Decision Support in the Defense Acquisition Process, proceedings of the 5th Annual Acquisition Research Symposium, Naval Postgraduate School, Monterey, Calif., May 2008.
Schank, John F., Giles K. Smith, John L. Birkler, Brien Alkire, Michael Boito, Gordon T. Lee, Raj Raman, and John Ablard, Acquisition and Competi-tion Strategy Options for the DD(X): Th e Navy’s 21st Century Destroyer, Santa Monica, Calif.: RAND Corporation, MG-259/1-NAVY, 2006. As of November 16, 2009:
http://www.rand.org/pubs/monographs/MG259.1/Schay, B. et al. Summative Evaluation for DoD Labs, Washington, D.C.:
Offi ce of Personnel Management, 2002.Section 814 Report—See Defense Acquisition University, 2007.Section 1423 Report—See Acquisition Advisory Panel, 2007.Smith, Giles K., A. A. Barbour, T. L. McNaugher, M. D. Rich, and W. L.
Stanley, Th e Use of Prototypes in Weapon System Development, Santa Monica, Calif.: RAND Corporation, R-2345-AF, March 1981. As of November 16, 2009:
http://www.rand.org/pubs/reports/R2345/Smith, Giles K., and E. T. Friedmann, An Analysis of Weapon System Acquisi-
tion Intervals, Past and Present, Santa Monica, Calif.: RAND Corpora-tion, R-2605-DR&E/AF, November 1980. As of November 16, 2009:
http://www.rand.org/pubs/reports/R2605/Smith, Giles K., Hyman L. Shulman, and Robert S. Leonard, Application
of F-117 Acquisition Strategy to Other Programs in the New Acquisition Environment, Santa Monica, Calif.: RAND Corporation, MR-749-AF, 1996. As of November 16, 2009:
http://www.rand.org/pubs/monograph_reports/MR749/Sommer, Geoff rey, Giles K. Smith, John L. Birkler, and James R. Chiesa, Th e
Global Hawk Unmanned Aerial Vehicle Acquisition Process, Santa Monica, Calif.: RAND Corporation, MR-809-DARPA, 1997. As of November 5, 2009:
http://www.rand.org/pubs/monograph_reports/MR809/Th irtle, Michael R., Robert V. Johnson, and John L. Birkler, Th e Predator
ACTD: A Case Study for Transition Planning to the Formal Acquisition

Bibliography 131
Process, Santa Monica, Calif.: RAND Corporation, MR-899-OSD, 1997. As of November 16, 2009:
http://www.rand.org/pubs/monograph_reports/MR899/U.S. Department of Defense, DoD Instruction 5000.55, “Reporting Man-
agement Information on DoD Military and Civilian Acquisition Per-sonnel and Position,” November 1, 1991.
, Technology Readiness Assessment (TRA) Deskbook, prepared by the Deputy Under Secretary of Defense for Science and Technology (DUSD (S&T)), Washington, D.C., May 2005. As of May 21, 2009:
http://www.dod.mil/ddre/doc/May2005_TRA_2005_DoD.pdf , Manager’s Guide to Technology Transition in an Evolutionary Acquisi-
tion Environment, Version 2.0, Fort Belvoir, Va.: Defense Acquisition University Press, June 2005.
, DoD Instruction 5000.66, “Operation of the Defense Acquisition, Technology, and Logistics Workforce Education, Training, and Career Development Program,” December 21, 2005.
, Quadrennial Defense Review Report, February 6, 2006. As of April 7, 2009:
http://www.defenselink.mil/qdr/report/Report20060203.pdf , DoD Instruction 5000.2, “Operation of the Defense Acquisition
System,” Washington, D.C., December 2, 2008. , DoD Instruction 5000.2, “Operation of the Defense Acquisition
System,” December 8, 2008. , “DoD and OPM to Review National Security Personnel System.”
As of March 16, 2009: http://www.defenselink.mil/releases/release.aspx?releaseid=12556U.S. Department of Defense, Acquisition, Technology, and Logistics, AT&L
Human Capital Strategic Plan, Volume 1, 2006. , AT&L Human Capital Strategic Plan, Version 3.0, 2007.U.S. Department of Defense, Offi ce of the Inspector General, Human
Capital: Report on the DoD Acquisition Workforce Count, D-2006-073, 2006.
U.S. Department of Defense, Under Secretary of Defense, Acquisition, Tech-nology, and Logistics, DoD Instruction 5000.02, “Operation of the Defense Acquisition System,” Washington, D.C., December 2, 2008.

132 From Marginal Adjustments to Meaningful Change
123456789
101112131415161718192021222324252627282930313233343536
U.S. General Accounting Offi ce, Acquisition Workforce: Department of Defense’s Plans to Address Workforce Size and Structure Challenges, GAO-02-630, April 2002.
U.S. Government Accountability Offi ce, Defense Acquisitions: Challenges Fac-ing the DD(X) Destroyer Program, GAO-04-973, September 2004.
, Defense Acquisitions: Progress and Challenges Facing the DD(X) Sur-face Combatant Program, Paul Francis, “Testimony Before the Subcom-mittee on Projection Forces, Committee on Armed Services, House of Representatives,” GAO-05-924T, July 19, 2005.
, Defense Acquisitions: Challenges Remain in developing Capabilities for Naval Surface Fire Support, GAO-07-115, November 2006.
, Success of Advanced SEAL Delivery System (ASDS) Hinges on Establish-ing a Sound Contracting Strategy and Performance Criteria, Washington, D.C., GAO-07-745, May 2007.
, “Defense Acquisitions: Realistic Business Cases Needed to Execute Navy Shipbuilding Programs, Statement of Paul L. Francis, Director Acquisition and Sourcing Management Team, Testimony Before the Subcommittee on Seapower and Expeditionary Forces, Committee on Armed Services, House of Representatives,” Washington, D.C., GAO-07-943T, July 24, 2007.
, Defense Acquisitions: Assessment of Selected Weapon Programs, GAO-08-467-SP, March 2008.
, Defense Acquisitions: Assessment of Selected Weapon Programs, GAO-09-326-SP, March 2009a.
, Department of Defense: Additional Actions and Data are Needed to Eff ectively Manage and Oversee DoD’s Acquisition Workforce, GAO-09-342, March 2009b.
U.S. Navy, “Statement of the Honorable Dr. Delores M. Etter, Assistant Sec-retary of the Navy (Research, Development, and Acquisition); VADM Paul E. Sullivan, U.S. Navy, Commander, Naval Sea Systems Com-mand; RADM Charles S. Hamilton, II, U.S. Navy, Program Executive Offi cer, Ships; and RADM Barry J. McCullough, U.S. Navy Director of Surface Warfare, Before the Subcommittee on Seapower and Expedi-tionary Forces of the House Armed Services Committee on Acquisition Oversight of the U.S. Navy’s Littoral Combat Ship Program,” Washing-ton, D.C., February 8, 2007.

Bibliography 133
U.S. Offi ce of Personnel Management, FERS—Federal Employees Retirement System Transfer Handbook: A Guide to Making Your Decision, RI 90-3, 1997. As of July 5, 2007:
http://www.opm.gov/retire/fers_election/fersh/hb.pdf , Handbook of Occupational Groups and Families, January 2008.Vernez, Georges, and H. Garrison Massey, Th e Acquisition Cost Estimating
Workforce: Census and Characteristics, Santa Monica, Calif.: RAND Corporation, TR-708-AF, 2009.
Vernez, Georges, Albert A. Robbert, Hugh G. Massey, and Kevin Driscoll, Workforce Planning and Development Processes: A Practical Guide, Santa Monica, Calif.: RAND Corporation, TR-408-AF, 2007.
http://www.rand.org/pubs/technical_reports/TR408/Woolner, Derek, Getting in Early: Lessons of the Collins Submarine Program
for Improved Oversight of Defence Procurement, Parliament of Australia, Parliamentary Library, 2001. As of September 15, 2009:
http://www.aph.gov.au/library/pubs/rp/2001-02/02RP03.htmYoung, John J., Under Secretary of Defense (Acquisition, Technology and
Logistics), “Prototyping and Competition,” Policy Memorandum, Sep-tember 19, 2007.
Younossi, Obaid, Mark V. Arena, Robert S. Leonard, Charles Robert Roll, Arvind K. Jain, Jerry M. Sollinger, Is Weapon System Cost Growth Increasing? A Quantitative Assessment of Completed and Ongoing Pro-grams, Santa Monica, Calif.: RAND Corporation, MG-588-AF, 2007.As of November 16, 2009:
http://www.rand.org/pubs/monographs/MG588/ Younossi, Obaid, David E. Stem, Mark A. Lorell, and Frances M. Lussier,
F/A-22 and F/1-18E/F Development Programs, Santa Monica, Calif.: RAND Corporation, MG-276-AF, 2005. As of November 16, 2009:
http://www.rand.org/pubs/monographs/MG276/