for peer review - phycoweb.netphycoweb.net/reprints/marcelino_halimedaalphaniche.pdf · for peer...
TRANSCRIPT

For Peer Review
Title: Microhabitat specialisation facilitates thermal niche evolution in
the green algal genus Halimeda
Authors: Vanessa R. Marcelino1, Lennert Tyberghein2,3, Olivier De Clerck3, Heroen Verbruggen1
Affiliations: 1 School of Botany, University of Melbourne, Australia
2 Flanders Marine Institute (VLIZ), Ostend, Belgium
3 Phycology Research Group, Ghent University, Belgium
Contact:
VRM: School of Botany, University of Melbourne, VIC 3010, Australia. [email protected]
LT: Flanders Marine Institute, Wandelaarkaai 7, 8400 Ostend Ostend, Belgium.
ODC: Phycology Research Group, Ghent University, Krijgslaan 281, building S8, 9000 Gent, Belgium
HV: School of Botany, University of Melbourne, VIC 3010, Australia.
Keywords: Macroecology, environmental stress, Halimeda, α-niche, species traits, evolutionary rates,
pre-adaptation, niche evolution, evolvability, niche shifts.
Running title: Traits and thermal niche evolution
Corresponding author: Vanessa Rossetto Marcelino
Abstract: 204 words.
Main text: 3821 words (5185 including references).
Number of references: 50.
Page 1 of 21 Global Ecology and Biogeography
123456789101112131415161718192021222324252627282930313233343536373839404142434445464748495051525354555657585960

For Peer Review
Abstract
Aims: The "out of the tropics" model explains the latitudinal diversity gradient but does not address
why some lineages are able to shift their thermal niche into temperate biomes while others fail to do so.
We investigate this question by testing whether the thermal niche of Halimeda seaweeds evolves as a
function of niche breadth and microhabitat-related lineage traits.
Location: Worldwide tropical and subtropical
Methods: We use phylogenetic comparative methods to test the effects of two types of traits –
proximity to temperate biomes (climatic niche breadth and geographical range) and microhabitat
specialisations (α-niche traits) – on thermal niche evolution of the green algal genus Halimeda.
Additionally, we use Monte Carlo simulations to test the robustness of the analyses.
Results: While proximity exhibited no clear relationship to niche evolution, we found evidence
relating microhabitat specialisation to thermal niche evolvability. Lineages associated with
exposed/harsh microhabitats have 3× faster rates of thermal niche evolution, with most change
happening from warmer to colder climates
Main conclusions: The results support the hypothesis that α-niche lineage traits can facilitate the
transition out of the tropics. Possible underlying mechanisms include adaptations to harsh habitats
constituting pre-adaptations to cooler biomes, and scenarios whereby evolutionary rates are boosted by
the available energy or other capacitors of evolutionary change.
Page 2 of 21Global Ecology and Biogeography
123456789101112131415161718192021222324252627282930313233343536373839404142434445464748495051525354555657585960

For Peer Review
Introduction
Understanding why there are more species in the tropics is a central question in ecology and
evolution. One of the best supported explanations is the out of the tropics (OTT) model postulating that
species predominantly originate at low latitudes and expand towards cooler regions afterwards
(Jablonski et al., 2006). In addition to having higher speciation and lower extinction rates in the tropics,
many organisms show strong climatic niche conservatism, confining their distributions to tropical
biomes. Only a small proportion of the lineages from the tropical pool shift their climatic niche and
diversify into temperate zones (Buckley et al., 2010; Olalla-Tárraga et al., 2011; Jablonski et al.,
2013).
This begs the question why some lineages do evolve along the thermal gradient and expand
into temperate biomes while others fail to do so. Two non-mutually exclusive hypotheses based on
species traits can be invoked. We refer to the first one as the “proximity effect,” which is centred on the
assumption that lineages with larger geographical ranges or niche breadths are more likely to diversify
out of the tropics simply because they are in closer proximity to temperate habitats at their range edges.
The ocean’s cooling trend since the Cenozoic Era and the steepening of the temperature gradient
(Zachos et al., 2001; Bijl et al., 2009) further increased proximity effects by leading edge populations
to perish or adapt in the new climate. Proximity has been suggested to affect thermal niche evolution in
a number of studies (e.g. Fisher-Reid et al., 2012). The well-studied bivalves fossil record indicates
that transitions to colder climates was mediated by bridge species with expanded distributions
encompassing higher latitudes (Jablonski et al., 2013).
The second hypothesis is that thermal niche evolution is modulated by traits related to
microhabitat and use of resources at local scales (e.g. depth, substrate), commonly referred as α-niche
traits (Ackerly et al., 2006; Silvertown et al., 2006 and references therein). Two sources of evidence
point in this direction. First, α-niche traits are often correlated to climate. For example, leaf shape
(Schmerler et al., 2012) and nitrogen-phosphorus content (Reich & Oleksyn, 2004) in plants show a
remarkable correlation with temperature, and α-niche traits are related to trade-offs between utilization
of resources and performance through climate variations (Angert et al., 2009). Trait-climate
relationships could affect thermal niche evolvability either directly through natural selection/adaptation
or indirectly as a by-product of other evolutionary processes, e.g. exaptations (see Pigliucci, 2008).
Second, α-niche traits evolved earlier and remained stable in the phylogenetic history of several
Page 3 of 21 Global Ecology and Biogeography
123456789101112131415161718192021222324252627282930313233343536373839404142434445464748495051525354555657585960
For Peer Review
organisms while their thermal niches evolved more gradually (e.g. Ackerly et al., 2006; Emery et al.,
2012), although this trend is by no means universal (e.g. Kostikova et al., 2014). Early diversification
and subsequent stasis of α-niche traits has been successful because it facilitates species coexistence
through resource partitioning (Cavender-Bares et al., 2004; Ackerly et al., 2006; Prinzing et al., 2008;
Ackerly, 2009). Taking these two elements together, it would appear reasonable to assume that early
specialization of the α-niche scale leads to differential chances of lineages to transition into new
biomes later on. This hypothesis is surprisingly underexplored in the literature.
We use the seaweed genus Halimeda (Bryopsidales, Chlorophyta) as a model to investigate
the influence of proximity and α-niche traits on thermal niche evolution. Halimeda is unusual among
seaweeds in being siphonous (its entire body, sometimes metres in length, is composed of a single
multinucleate cell) and calcareous (Hillis, 2001). The earliest known Halimeda fossil dates back to the
Permian (Poncet, 1989) and most of the extant lineages diversified during the Cretaceous (Hillis, 2001;
Verbruggen et al., 2009a). Halimeda is found in tropical and temperate coastal regions but originated
and retained most of its species diversity in the tropics (Verbruggen et al., 2009b). Some Halimeda
lineages established in wave-affected areas, while others occupied sheltered slopes or lagoons
(Kooistra et al., 2002; Verbruggen & Kooistra, 2004). The well-known phylogeny, geographical
distribution and microhabitat characterization makes this genus a good model to test alternative
hypotheses on the influence of lineage traits on the out of the tropics process. We apply phylogenetic
comparative methods to test the relationships between thermal niche and species traits. Additionally,
we use simulations to make a critical evaluation of the statistical power of the methods to test our
hypotheses on the Halimeda dataset. We show that microhabitat specialisation, but not proximity,
relates to the pace of thermal niche evolution in Halimeda.
Material and Methods
Phylogeny
DNA sequences from nuclear (partial 18S, ITS1, 5.8S, EF1α and HSP90) and plastid (tufA,
rcbL, UCP3, UCP7) loci were generated following previously described protocols or taken from
previous work (Kooistra et al., 2002; Verbruggen et al., 2005, 2009b). Sequences generated in this
Page 4 of 21Global Ecology and Biogeography
123456789101112131415161718192021222324252627282930313233343536373839404142434445464748495051525354555657585960
For Peer Review
study are available on GenBank (accession numbers to be provided). Loci were aligned in MEGA v.5
(Tamura et al., 2011), checked and corrected manually against the chromatograms. The resulting
concatenated alignment contained 7,185 bp. Suitable models of molecular evolution and a partitioning
strategy were identified using PMT (www.phycoweb.net) following a Bayesian Information Criterion
approach. The phylogenetic tree was reconstructed using 56 Halimeda species, including the vast
majority of the known species of the genus. Because we only had microhabitat data for 53 species, 3
species were excluded from the downstream analyses. The phylogeny was reconstructed with BEAST
v.1.7.5 (Drummond et al., 2012) and calibrated following Verbruggen et al. (2009a). In order to
account for phylogenetic uncertainty, we used 10,000 random trees from the posterior distribution set
(after discarding the burn-in) to test the effects of the α-niche on thermal niche evolution. The analyses
of the proximity effects are more computationally intensive, prohibiting running it with 10,000 trees,
hence we used the 10 trees with the highest posterior probabilities. For illustration purposes, we present
only the tree with the maximum sum of posterior clade probabilities.
Occurrence dataset
Species occurrence data were obtained from herbaria at Ghent University (GENT), Western
Australia Museum (WA), University of Michigan (MICH), São Paulo University (USP), Rural
University of Pernambuco (PEUFR), Nationaal Herbarium Nederland (Leiden branch; L), Smithsonian
Institution National Museum of Natural History (US) and Institute of Research for Development (IRD).
All specimens were re-identified by HV, taking into account any information about species recently
discovered using DNA barcodes that have not yet been published but are taken into consideration in
this study (in occurrence records as well as phylogeny). Uncertain identifications and duplicated
records were excluded. Coordinates for each collection were obtained from GPS records available on
the herbarium notes or georeferenced based on localities description using Google Earth. In total, we
gathered 2,508 unique occurrence records.
Thermal niche trait values
Species' thermal niches were derived from mean Sea Surface Temperature (SST) for each
locality, extracted from the Bio-ORACLE database (Tyberghein et al., 2012). In order to avoid effects
of geographic sampling bias on the obtained values, we applied geographic kernel smoothing and
Page 5 of 21 Global Ecology and Biogeography
123456789101112131415161718192021222324252627282930313233343536373839404142434445464748495051525354555657585960

For Peer Review
derived weighted mean SST values for each species. The exact procedures and R scripts used to derive
the thermal niche traits from occurrence records can be found in Appendix 1 in Supporting
Information. Ancestral thermal affinities were estimated from the averaged SST values with the
function ace from the R package APE (Paradis et al., 2004) and plotted along the tree with
TreeGradients v.1.03 (Verbruggen, 2012).
Proximity trait values and their impact on thermal niche evolution
To test for possible effects of proximity on thermal niche evolution, we investigated correlated
evolution between SST affinities and three features that could help bridge the gap from tropical to
temperate regions. The first of these features is "SST breadth", a proxy variable describing the width of
the distribution of SSTmean records. The second is "SST extremes", the difference between maximum
and minimum observed SSTmean values. The third feature is "distribution range", the surface area of
the smallest polygon (convex hull) containing the species occurrences. The influence of each of these
features on thermal niche evolution was evaluated with the "rate by state" test (function ratebystate in
the R package phytools (Revell, 2012)), which evaluates how the evolution of a continuous trait (here
the thermal niche) is affected by another continuous trait (each of the proximity features). This is
accomplished by regressing the squared contrasts of the thermal niche trait on the estimates of ancestral
states of the proximity variables. Simulations are then performed to test whether the influence of one
trait over the other is statistically significant. We performed 1,000 simulations for the 10 trees with
maximum posterior probabilities. The R script to calculate each proximity variable and perform the
ratebystate test can be found in Appendix 2.
α-niche trait values and their impact on thermal niche evolution
To test the influence of α-niche traits on thermal niche evolution, we selected two microhabitat
traits associated with the harshness of environmental conditions: depth – for which species were
classified as shallow or deep (threshold 1 m.), and exposure (to waves, desiccation, intertidal) – species
classified as exposed or sheltered. Depth and exposure data were gathered for each species based on
previous published work (e.g. Kooistra et al., 2002; Verbruggen & Kooistra, 2004) and personal
observations in the field (HV), and coded as binary characters. We evaluated if rates of thermal niche
evolution vary among clades with different discrete traits (i.e. exposure, depth values) by comparing
Page 6 of 21Global Ecology and Biogeography
123456789101112131415161718192021222324252627282930313233343536373839404142434445464748495051525354555657585960
For Peer Review
the fit of a Brownian motion model with a single rate of thermal evolution (the null model) to that of a
model where the rate of thermal evolution depends on the state of the binary α-niche trait (alternative
model, trait-dependent rates). Both models were optimized with the brownie.lite function implemented
in phytools (Revell, 2012) and compared based on the Akaike Information Criterion (AIC). The models
were fitted to 10,000 random trees (post-burn in) to account for phylogenetic uncertainty. See
Appendix 3 for R scripts and more detailed information.
Phylogenetic Monte Carlo simulations
AIC-based model choice is prevalent in studies using phylogenetic comparative methods, but is
prone to errors when the data contain insufficient information to perform the tests or when the real
model of evolution considerably differs from the hypotheses being tested (Boettiger et al., 2012;
Pennell et al., 2014). To address this issue, we performed phylogenetic Monte Carlo (PMC, Boettiger
et al., 2012) simulations to test whether the analyses of the α-niche effects had sufficient statistical
power to distinguish between single vs. multi-rate evolutionary models. The null model is that all
Halimeda lineages have a single rate of thermal niche evolution, independent of α-niche traits. The
alternative model is that lineages with different microhabitat traits have different rates of thermal niche
evolution. The PMC simulations consist of: i) parameter estimation for both models using the original
data; ii) simulating n datasets based on the estimated parameters for each model; iii) re-estimating the
parameters and likelihood for both models based on the simulated dataset. The difference in log
likelihood (δ) of observing the data under two maximum likelihood estimated models provides the
basis for an approximation to the p-value for the test. The power of the test is the probability of
correctly rejecting the null model when the data is produced by the alternative (more complex) model.
We wrote an R function to perform PMC (Boettiger et al., 2012) for the brownie.lite function
(Appendix 4). The ancestral microhabitat traits were estimated with stochastic character mapping
(simmap) replicated 100 times (to account for the different possible histories) for each of the 10 trees
with the highest posterior probabilities. This resulted in 1,000 trees, which we refer hereafter as “trait
trees”. 1,000 PMC simulations were performed for each trait tree to obtain the statistical test for model
selection. The results were evaluated based on how many times a significant result (favoring the multi-
rate evolutionary model over the null hypothesis) was obtained for each trait tree. The R scripts for
generating the trait trees and performing PMC analyses are available in Appendix 4.
Page 7 of 21 Global Ecology and Biogeography
123456789101112131415161718192021222324252627282930313233343536373839404142434445464748495051525354555657585960
For Peer Review
Results
Estimation of ancestral SST affinities in Halimeda support the notion that most of the lineages
retained a tropical distribution and that thermal niche evolution happened from tropical to temperate
waters in a handful of lineages (Figs. 1 and S1, Verbruggen et al. 2009b). None of the proximity traits
(SST breadth, SST extremes or distribution range) were related to the rate of thermal niche evolution
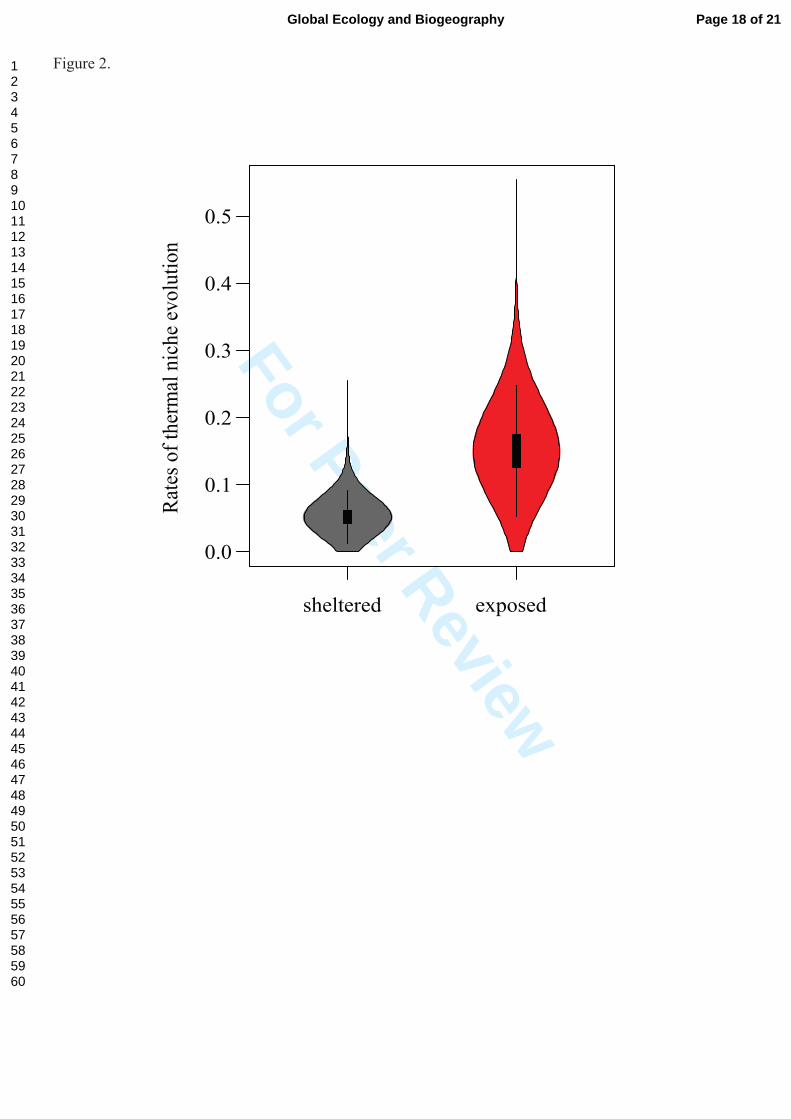
(Table 1). In contrast, we did find a strong relationship between the α-niche and the rate of thermal
niche evolution (Table 2). Specifically, we found that lineages from exposed microhabitats have on
average 3× higher rates of thermal niche evolution when compared with lineages from sheltered
habitats (Fig. 2). The model with separate rates of thermal evolution for exposed and sheltered habitats
fits the data better than a model with a single rate across both exposure categories. Species living in
shallower waters also showed slightly faster thermal evolution, but in this case the trait-dependent
model was not preferred over the null hypothesis (Table 2).
Phylogenetic Monte Carlo simulations failed to distinguish between trait-dependent vs. single-
rate evolutionary models with depth as the predictor (Table 3). For exposure however, 75% of the
simulations on 1,000 trait trees preferred the trait-dependent model with a significant p-value,
indicating that this result is robust to variations in the topology and mapped character history and
therefore unlikely to be a false positive.
Discussion:
Our results indicate that ancestral α-niche traits can explain why some lineages are more
susceptible to thermal niche shifts than others. We found that lineages associated with exposed
microhabitats have 3× higher rates of thermal niche evolution on average (Figs. 1 and 2, Table 2).
Since Halimeda originated and largely remained in tropical waters (Verbruggen et al., 2009b), most of
the observed thermal niche evolution is towards colder climates (Fig. 1). Phylogenetic Monte Carlo
simulations suggest that the higher evolutionary rate associated with exposure is unlikely to be an
artefact of the analysis.
Unlike exposure, the depth trait does not seem to affect thermal niche in Halimeda. Exposure
and depth are naturally correlated in the sense that all exposed species are found in shallow waters, but
not vice-versa. Lagoon species, for example, inhabit shallow but much less exposed microhabitats than
Page 8 of 21Global Ecology and Biogeography
123456789101112131415161718192021222324252627282930313233343536373839404142434445464748495051525354555657585960
For Peer Review
species living near the reef crest. Despite this correlation, we did not detect a significant effect of depth
on thermal evolution. PMC simulations indicate that depth-related influence is not strong enough or
our dataset is not sufficiently explanatory to inform the model choice in this case (Table 3).
Theoretically, one would expect lineages with broader climatic niches or geographical ranges
to be in closer proximity to cooler biomes, which could promote the formation of cold-adapted species
near their range edges. In Halimeda, however, we found no evidence for effects of climatic or
geographical proximity effects on the evolution of thermal niches (Table 1). In bivalves, it was shown
that lineages moving out of the tropics did so via bridge species whose distribution spans tropical and
extratropical areas (Jablonski et al., 2013). In contrast to many invertebrates that disperse with pelagic
larvae, seaweeds generally have small populations and limited dispersal (Kinlan et al., 2005), which
favors adaptive speciation. Higher levels of gene flow in bivalves may have prevented adaptive
speciation along a thermal gradient (via gene swamping, see Lenormand 2002), resulting in
eurythermal species with larger geographical ranges – the bridge species. If this scenario is correct, the
magnitude of proximity effects is influenced by dispersal strategy, leading to a situation where lineage-
specificity in rates of thermal evolution can be seen as a function of a pre-existing (non-geographic)
species trait. Regardless of the underlying mechanism, the proximity hypothesis of thermal evolution
raises a chicken or the egg dilemma where it is tricky to discern which aspect – proximity or thermal
niche – diversified first and which of them affects the other. In other words, it is difficult to discern
causality in this correlation. Approaches integrating the feedback between environment, ecology and
evolution (see Lavergne et al. 2010) could be suitable to better understand how and when one trait (or
process) shapes another.
Previous evidence shows that many α-niche traits in Halimeda have diversified soon after its
origin (Kooistra et al., 2002; Verbruggen & Kooistra, 2004; Verbruggen et al., 2009b). This helps
interpret their influence on thermal niche evolution. One obvious possibility is that adaptations to life
in harsh habitats constitute pre-adaptations to cooler biomes, facilitating the transition into it. Lineages
living in shallower and exposed microhabitats are subject to more drastic variations in temperature, and
adaptations to such conditions could leave these lineages with a higher likelihood of settling in
temperate habitats and producing temperate-water species. In this context, it is important to note that
all species inhabiting the entire intertidal and/or reef crest habitats were classified as exposed species,
Page 9 of 21 Global Ecology and Biogeography
123456789101112131415161718192021222324252627282930313233343536373839404142434445464748495051525354555657585960
For Peer Review
being therefore less protected from a variety of environmental stressors than their sheltered
counterparts.
Experimental studies on E. coli exposed to high temperatures reproduced in vitro evolutionary
improvement in fitness and adaptation in these temperatures (Bennett & Lenski, 1997). Interestingly,
the E. coli lineages adapted to higher temperatures also showed enhanced fitness in maltose media,
which the authors considered to be a preadaptation due to pleiotropic side effects of the selected
mutations, likely related to heat shock proteins. These proteins are known as capacitors of phenotypic
evolution because they buffer accumulated mutations and release them under environmental stress,
accelerating evolutionary rates (Rutherford & Lindquist, 1998; Sangster et al., 2004). Likewise, faster
thermal niche evolution in some Halimeda lineages may have resulted directly from adaptations to
quotidian temperature stress or indirectly by the action of ‘capacitors’ of evolvability (see Pigliucci,
2008; Masel & Trotter, 2010).
Another potential explanation involves the biologically available energy associated with the α-
niche traits analysed here. A number of studies show positive relationships between energy and
evolutionary rates (reviewed in Hawkins et al. 2003 and Wright & Rohde 2013). Lineages living in
exposed/shallow microhabitats usually receive more photosynthetically active radiation and could have
higher evolutionary rates through energy-related processes, increasing the chances of cold-adapted
species being produced. The available energy can be further increased in exposed microhabitats
through wave action, as it promotes circulation, thereby reducing the diffusion boundary layer and
loosening constraints on nutrient availability (Hurd et al., 1996).
It is interesting to note the parallel of the out of the tropics scenarios raised here and the
“shallow-towards-deep” pattern in species turnover observed in fossil records (Jablonski et al., 1983).
The mechanisms proposed to explain a possible onshore-origination trend, including higher nutrients
input, environmental stress, variability of selection pressures, rates of gene flow and phenotypic
plasticity in onshore habitats (Jablonski, 2005), also constitute plausible explanations for why only a
few lineages diversify out of the tropics. Those lineages experiencing continuous environmental
variability at α-niche scales inside the tropics may acquire adaptive traits via genetic assimilation (see
Pigliucci et al., 2006), increasing their chances of establishing in regions with similarly (or more)
stressful conditions – like the extratropics. While empirically testing these driving mechanisms remains
Page 10 of 21Global Ecology and Biogeography
123456789101112131415161718192021222324252627282930313233343536373839404142434445464748495051525354555657585960

For Peer Review
a challenge, new approaches for assessing the correlation among traits and diversification constitute an
important step forward (Ng & Smith, 2014).
The approach used here also has limitations and potential caveats. Phylogenetic comparative
methods search the best fit of different evolutionary models (hypotheses) to the data, but can produce
misleading results if the real model of evolution is not among the hypotheses or when the data is not
informative enough (Boettiger et al., 2012; Pennell et al., 2014). Simulations (e.g. phylogenetic Monte
Carlo) help in the critical evaluation of the results. Our simulations demonstrated that it is impossible
to discern whether depth influences thermal niche evolutionary rates in Halimeda, even though 22% of
these simulations resulted in a significant positive answer, the power of the test is relatively low (Table
3). In other words, we cannot discern if depth has no influence on thermal niche evolution or if the
analysis was unable to resolve the differences between the proposed models because the data is not
informative enough (in terms of how the trait is structured along the phylogeny and how it relates to the
thermal niche), or the difference in evolutionary rates (σ2) between shallow and deep lineages is just too
small to be detected. We obtained much higher levels of certainty for the exposure analysis (Table 3),
suggesting that the effect of this trait on thermal niche evolution is unlikely to be an artefact of the test.
Bias may also arise from the way the variables are quantified. For example, α-niche traits could also be
measured as continuous variables if sufficient data were available for that (i.e. enough intra-specific
depth records). Using mean trait values for each species as is done here could mask the importance of
intraspecific variation and microevolution. It is reasonable to assume that the observed
macroevolutionary pattern result from microevolutionary processes (Wright & Rohde, 2013), hence
integrating comparative phylogenetic methods with experimental approaches across ecological and
evolutionary scales could bridge this knowledge gap and reduce the sources of uncertainty (Weber &
Agrawal, 2012; Verbruggen et al., 2014).
In summary, our study addresses a missing puzzle piece in explaining the out of the tropics
model: why some lineages are able to shift their thermal niche and establish in colder biomes while
others cannot. We investigated this question in the light of lineage traits using phylogenetic
comparative methods. The results do not support an influence of climatic or geographical proximity
traits on thermal evolution and we argue that it seems problematic to discern causation in proximity-
thermal niche correlations. Our data support the notion that α-niche lineage traits can have an effect on
the transition to cooler biomes, although the above-mentioned limitations should be investigated in
Page 11 of 21 Global Ecology and Biogeography
123456789101112131415161718192021222324252627282930313233343536373839404142434445464748495051525354555657585960
For Peer Review
more detail before drawing detailed conclusions about its mechanisms. Using PMC simulations we
observed that was not possible to assess the influence of depth with credibility, but the effect of
exposure was confirmed with substantial support. Halimeda lineages inhabiting exposed microhabitats
exhibited three-fold faster thermal niche evolution. Our model organism seems to follow Nietzsche’s
maxim “that which does not kill us makes us stronger”: lineages exposed to harsher conditions
apparently have more chances of getting out of the tropics.
Acknowledgements
We thank Sofie D'hondt for generating sequence data and Wiebe Kooistra, Claude Payri, Diane and
Mark Littler, John Huisman, Eric Coppejans, Mike Wynne, Willem Prud'homme van Reine, Mariana
C. de Oliveira, Maria Elisabeth Bandeira-Pedrosa for facilitating access to specimens and/or herbarium
collections. Funding was provided by the Research Foundation Flanders, the Australian Research
Council (FT110100585), the Australian Biological Resources Study (RFL213-08), the Erasmus
Mundus Master program in Marine Biodiversity and Conservation (EMBC), a University of Melbourne
scholarship to VRM and a SYNTHESYS grant to LT.
References
Ackerly, D. (2009) Conservatism and diversification of plant functional traits: Evolutionary rates versus phylogenetic signal. Proceedings of the National Academy of Sciences of the United States of America, 106 Suppl , 19699–706.
Ackerly, D.D., Schwilk, D.W. & Webb, C.O. (2006) Niche evolution and adaptive radiation: testing the order of trait divergence. Ecology, 87, 50–61.
Angert, A.L., Huxman, T.E., Chesson, P. & Venable, D.L. (2009) Functional tradeoffs determine species coexistence via the storage effect. Proceedings of the National Academy of Sciences of the United States of America, 106, 11641–5.
Bennett, A.. & Lenski, R.E. (1997) Environmental Stress, Adaptation and Evolution. Experientia Supplementum. (ed. by R. Bijlsma and V. Loeschcke), pp. 135–154. Birkhäuser Basel, Basel.
Bijl, P.K., Schouten, S., Sluijs, A., Reichart, G.-J.J., Zachos, J.C. & Brinkhuis, H. (2009) Early Palaeogene temperature evolution of the southwest Pacific Ocean. Nature, 461, 776–779.
Boettiger, C., Coop, G. & Ralph, P. (2012) Is your phylogeny informative? Measuring the power of comparative methods. Evolution; international journal of organic evolution, 66, 2240–51.
Page 12 of 21Global Ecology and Biogeography
123456789101112131415161718192021222324252627282930313233343536373839404142434445464748495051525354555657585960

For Peer Review
Buckley, L.B., Davies, T.J., Ackerly, D.D., Kraft, N.J.B., Harrison, S.P., Anacker, B.L., Cornell, H. V, Damschen, E.I., Grytnes, J.-A., Hawkins, B. a, McCain, C.M., Stephens, P.R. & Wiens, J.J. (2010) Phylogeny, niche conservatism and the latitudinal diversity gradient in mammals. Proceedings. Biological sciences / The Royal Society, 277, 2131–8.
Cavender-Bares, J., Ackerly, D.D., Baum, D.A. & Bazzaz, F.A. (2004) Phylogenetic overdispersion in Floridian oak communities. The American naturalist, 163, 823–43.
Drummond, A.J., Suchard, M.A., Xie, D. & Rambaut, A. (2012) Bayesian phylogenetics with BEAUti and the BEAST 1.7. Molecular biology and evolution, 29, 1969–73.
Emery, N., Forrestel, E., Jui, G. & Park, M. (2012) Niche evolution across spatial scales : climate and habitat specialization in California Lasthenia ( Asteraceae ). Ecology, 93, 151–166.
Fisher-Reid, M.C., Kozak, K.H. & Wiens, J.J. (2012) How is the rate of climatic-niche evolution related to climatic-niche breadth? Evolution; international journal of organic evolution, 66, 3836–51.
Hawkins, B.A., Field, R., Cornell, H. V., Currie, D.J., Guégan, J.-F., Kaufman, D.M., Kerr, J.T., Mittelbach, G.G., Oberdorff, T., O’Brien, E.M., Porter, E.E. & Turner, J.R.G. (2003) Energy, water, and the broad-scale geographic patterns of species richness. Ecology, 84, 3105–3117.
Hillis, L. (2001) The calcareous reef alga Halimeda (Chlorophyta, Byropsidales): a cretaceous genus that diversified in the cenozoic. Palaeogeography, Palaeoclimatology, Palaeoecology, 166, 89–100.
Hurd, C.L., Harrison, P.J. & Druehl, L.D. (1996) Effect of seawater velocity on inorganic nitrogen uptake by morphologically distinct forms of Macrocystis integrifolia from wave-sheltered and exposed sites. Marine Biology, 126, 205–214.
Jablonski, D. (2005) Evolutionary innovations in the fossil record: the intersection of ecology, development, and macroevolution. Journal of experimental zoology. Part B, Molecular and developmental evolution, 304, 504–19.
Jablonski, D., Belanger, C.L., Berke, S.K., Huang, S., Krug, A.Z., Roy, K., Tomasovych, A. & Valentine, J.W. (2013) Out of the tropics, but how? Fossils, bridge species, and thermal ranges in the dynamics of the marine latitudinal diversity gradient. Proceedings of the National Academy of Sciences of the United States of America, 110, 10487–94.
Jablonski, D., Roy, K. & Valentine, J.W. (2006) Out of the tropics: evolutionary dynamics of the latitudinal diversity gradient. Science (New York, N.Y.), 314, 102–6.
Jablonski, D., Sepkoski, J.J., Bottjer, D.J. & Sheehan, P.M. (1983) Onshore-offshore patterns in the evolution of phanerozoic shelf communities. Science (New York, N.Y.), 222, 1123–5.
Kinlan, B.P., Gaines, S.D. & Lester, S.E. (2005) Propagule dispersal and the scales of marine community process. Diversity and Distributions, 11, 139–148.
Kooistra, W., Coppejans, E. & Payri, C. (2002) Molecular systematics, historical ecology, and phylogeography of Halimeda (Bryopsidales). Molecular Phylogenetics and Evolution, 24, 121–138.
Kostikova, A., Litsios, G., Burgy, S., Milani, L., Pearman, P.B. & Salamin, N. (2014) Scale-dependent adaptive evolution and morphological convergence to climatic niche in Californian eriogonoids (Polygonaceae). Journal of Biogeography, 41, 1326–1337.
Page 13 of 21 Global Ecology and Biogeography
123456789101112131415161718192021222324252627282930313233343536373839404142434445464748495051525354555657585960

For Peer Review
Lenormand, T. (2002) Gene flow and the limits to natural selection. Trends in Ecology & Evolution, 17, 183–189.
Masel, J. & Trotter, M. V (2010) Robustness and evolvability. Trends in genetics : TIG, 26, 406–14.
Ng, J. & Smith, S.D. (2014) How traits shape trees: new approaches for detecting character state-dependent lineage diversification. Journal of Evolutionary Biology, 27, 2035–2045.
Olalla-Tárraga, M.Á., McInnes, L., Bini, L.M., Diniz-Filho, J. a. F., Fritz, S. a., Hawkins, B. a., Hortal, J., Orme, C.D.L., Rahbek, C., Rodríguez, M.Á. & Purvis, A. (2011) Climatic niche conservatism and the evolutionary dynamics in species range boundaries: global congruence across mammals and amphibians. Journal of Biogeography, 38, 2237–2247.
Paradis, E., Claude, J. & Strimmer, K. (2004) APE: Analyses of Phylogenetics and Evolution in R language. Bioinformatics, 20, 289–290.
Pennell, M., FitzJohn, R., Cornwell, W. & Harmon, L. (2014) Model adequacy and the macroevolution of angiosperm functional traits. bioRxiv, 0–57.
Pigliucci, M. (2008) Is evolvability evolvable? Nature reviews. Genetics, 9, 75–82.
Pigliucci, M., Murren, C.J. & Schlichting, C.D. (2006) Phenotypic plasticity and evolution by genetic assimilation. The Journal of experimental biology, 209, 2362–7.
Poncet, J. (1989) Présence du genre Halimeda Lamouroux, 1812 (algue verte calcaire) dans Ie Permien supérieur du sud Tunisien. Revue Micropeléontologie, 32, 40–44.
Prinzing, A., Reiffers, R., Braakhekke, W.G., Hennekens, S.M., Tackenberg, O., Ozinga, W. a, Schaminée, J.H.J. & van Groenendael, J.M. (2008) Less lineages - more trait variation: phylogenetically clustered plant communities are functionally more diverse. Ecology letters, 11, 809–19.
Reich, P.B. & Oleksyn, J. (2004) Global patterns of plant leaf N and P in relation to temperature and latitude. Proceedings of the National Academy of Sciences of the United States of America, 101, 11001–6.
Revell, L.J. (2012) phytools: an R package for phylogenetic comparative biology (and other things). Methods in Ecology and Evolution, 3, 217–223.
Rutherford, S.L. & Lindquist, S. (1998) Hsp90 as a capacitor for morphological evolution. Nature, 396, 336–42.
Sangster, T. a, Lindquist, S. & Queitsch, C. (2004) Under cover: causes, effects and implications of Hsp90-mediated genetic capacitance. BioEssays : news and reviews in molecular, cellular and developmental biology, 26, 348–62.
Schmerler, S.B., Clement, W.L., Beaulieu, J.M., Chatelet, D.S., Sack, L., Donoghue, M.J. & Edwards, E.J. (2012) Evolution of leaf form correlates with tropical-temperate transitions in Viburnum (Adoxaceae). Proceedings. Biological sciences / The Royal Society, 279, 3905–13.
Silvertown, J., Dodd, M., Gowing, D., Lawson, C. & McConway, K. (2006) Phylogeny and the hierarchical organization of plant diversity. Ecology, 87, S39–S49.
Tamura, K., Peterson, D., Peterson, N., Stecher, G., Nei, M. & Kumar, S. (2011) MEGA5: molecular evolutionary genetics analysis using maximum likelihood, evolutionary distance, and maximum parsimony methods. Molecular Biology and Evolution, 28, 2731–2739.
Page 14 of 21Global Ecology and Biogeography
123456789101112131415161718192021222324252627282930313233343536373839404142434445464748495051525354555657585960

For Peer Review
Tyberghein, L., Verbruggen, H., Pauly, K., Troupin, C., Mineur, F. & De Clerck, O. (2012) Bio-ORACLE: a global environmental dataset for marine species distribution modelling. Global Ecology and Biogeography, 21, 272–281.
Verbruggen, H. (2012) TreeGradients. Available at: www.phycoweb.net.
Verbruggen, H., Ashworth, M., LoDuca, S.T., Vlaeminck, C., Cocquyt, E., Sauvage, T., Zechman, F.W., Littler, D.S., Littler, M.M., Leliaert, F. & De Clerck, O. (2009a) A multi-locus time-calibrated phylogeny of the siphonous green algae. Molecular phylogenetics and evolution, 50, 642–653.
Verbruggen, H., Clerck, O. De, Schils, T., Kooistra, W.H.C.F. & Coppejans, E. (2005) Evolution and phylogeography of Halimeda section Halimeda (Bryopsidales, Chlorophyta). Molecular phylogenetics and evolution, 37, 789–803.
Verbruggen, H. & Kooistra, W. (2004) Morphological characterization of lineages within the calcified tropical seaweed genus Halimeda (Bryopsidales, Chlorophyta). European Journal of Phycology, 39, 213–228.
Verbruggen, H., Marcelino, V.R. & Costa, J.F. (2014) Evolutionary dynamics of algal traits and diversity. Perspectives in Phycology, 1, 53–60.
Verbruggen, H., Tyberghein, L., Pauly, K., Vlaeminck, C., Nieuwenhuyze, K. Van, Kooistra, W.H.C.F., Leliaert, F. & Clerck, O. De (2009b) Macroecology meets macroevolution: evolutionary niche dynamics in the seaweed Halimeda. Global Ecology and Biogeography, 18, 393–405.
Weber, M.G. & Agrawal, A. a (2012) Phylogeny, ecology, and the coupling of comparative and experimental approaches. Trends in ecology & evolution, 27, 394–403.
Wright, S.D. & Rohde, K. (2013) Energy and spatial order in niche and community. Biological Journal of the Linnean Society, 110, 696–714.
Zachos, J., Pagani, M., Sloan, L., Thomas, E. & Billups, K. (2001) Trends, rhythms, and aberrations in global climate 65 Ma to present. Science, 292, 686–693.
Biosketch
The Verbruggen lab at Melbourne University has a broad interest in algal biology and
evolution. The ongoing research focuses on the biodiversity and evolutionary diversification of marine
algae. The group uses bioinformatics, phylogenetics, metabarcoding and genomics to integratively
approach the research questions. More info: http://www.phycoweb.net.
The Phycology Research Group at Ghent University is interest in several aspects of seaweed
evolution. The research focus includes molecular phylogenetics, reproductive biology, bacterial–algal
interactions, remote sensing, biogeography and genomics. More info: www.phycology.ugent.be.
Page 15 of 21 Global Ecology and Biogeography
123456789101112131415161718192021222324252627282930313233343536373839404142434445464748495051525354555657585960

For Peer Review
Supporting Information:
Appendices 1 – 4: R scripts and tutorial explaining the analyses.
Supplementary figure 1: Phylogenetic tree of the genus Halimeda including posterior probabilities.
Figures:
Figure 1: Phylogenetic tree of the seaweed Halimeda showing the evolution of its thermal niche and
exposure traits. Ancestral estate estimates of the mean Sea Surface Temperature (SST) are plotted
along the tree as a colour gradient, with warmer colours indicating warmer SST values. Pie diagrams
represent the ancestral state probabilities of living in exposed vs. sheltered microhabitats.
Figure 2: Evolutionary rates (Brownian motion parameter σ2) of the thermal niche for Halimeda
lineages living in exposed and sheltered microhabitats. The violin plots represent the distribution of
evolutionary rates of the trait-dependent model optimized for 10,000 phylogenetic trees from the
Bayesian posterior set of trees. Species inhabiting exposed habitats exhibited 3× higher (0.05 vs. 0.15)
rates of thermal niche evolution on average.
Page 16 of 21Global Ecology and Biogeography
123456789101112131415161718192021222324252627282930313233343536373839404142434445464748495051525354555657585960

For Peer Review
H cuneata brazilH discoidea atl.H friabilisH scabraH tuna carH hummiiH lacunalisH tuna medH magnidiscaH cuneata africa 2H cuneata africa 1H no ID 4H discoidea ip.H gigasH cuneata australiaH magnicuneataH cuneata arabiaH taenicolaH xishaensisH macrophysaH copiosaH goreauiiH velasqueziiH renschiiH minima 1H minima 3H minima 2H minima 4H no ID 1H distorta 2H distorta 1H opuntiaH gracilis ip. 2H gracilis ip. 1H gracilis car. 1H gracilis car. 2H lacrimosaH gracilis fl.H pygmaeaH crypticaH fragilis 2H micronesicaH fragilis 1H cf. stuposaH monileH incrassataH simulansH melanesicaH borneensisH kanaloanaH heteromorphaH macrolobaH cylindracea
SST (°C)19.5 24.5 29.6
MicrohabitatShelteredExposed
Figure 1.
Page 17 of 21 Global Ecology and Biogeography
123456789101112131415161718192021222324252627282930313233343536373839404142434445464748495051525354555657585960
For Peer Review
0.0
0.1
0.2
0.3
0.4
0.5
sheltered exposed
Rate
s of t
herm
al n
iche
evo
lutio
n
Figure 2.
Page 18 of 21Global Ecology and Biogeography
123456789101112131415161718192021222324252627282930313233343536373839404142434445464748495051525354555657585960

For Peer Review
Table 1. Relationship between proximity features and evolution of the thermal niche. The results are
based on a regression of the squared contrasts of the thermal niche on the ancestral estimates of the
proximity variables. Mean and standard deviation values are given for the analyses performed on 10
trees with maximum posterior probabilities, with 1,000 simulations per tree to assess statistical
significance. beta = mean regression coefficient. r = mean correlation coefficient. SD = standard
deviation
Proximity trait beta (SD) r (SD) p-value SST breadth -6.5 x10⁻³ (3.5 x10 -4) -0.02 (1.2 x10⁻³) 0.86 (0.01) SST extremes 0.02 (1.7 x10⁻⁴) 0.19 (1.1 x10⁻³) 0.16 (0.01) Distribution range 1.8 x10⁻⁶ (7.4 x10⁻⁸) 0.02 (1.0 x10⁻³) 0.86 (0.01)
Page 19 of 21 Global Ecology and Biogeography
123456789101112131415161718192021222324252627282930313233343536373839404142434445464748495051525354555657585960

For Peer Review
Table 2. Relationship between alpha niche traits and evolution of the thermal niche. Brownian motion
models were fitted to 10,000 phylogenetic trees in order to compare a single rate of evolution (σ2
single) vs. a multiple rate of evolution (σ2 multi) with two different peaks. Note that the rate of thermal
niche evolution is 3× higher for species inhabiting exposed microhabitats than for species living in
sheltered microhabitats. Δ AIC = difference between the AIC values among models (multi-rate AIC
minus single-rate AIC). Mean σ2 values are given. σ2 multi 1 = rates of thermal niche evolution for
lineages inhabiting sheltered or deep microhabitats. σ2 multi 2 = rates of thermal evolution for lineages
associated with exposed or shallow microhabitats.
α-niche trait Min. ΔAIC Max Δ AIC Δ AIC (mean) σ2 single σ2 multi 1 σ2 multi 2 Exposure -1.99 34.64 4.32 0.09 0.05 0.15
Depth -2.00 25.24 0.93 0.08 0.07 0.10
Page 20 of 21Global Ecology and Biogeography
123456789101112131415161718192021222324252627282930313233343536373839404142434445464748495051525354555657585960

For Peer Review
Table 3: Phylogenetic Monte Carlo simulations performed to test the statistical significance of the
analysis relating the α-niche traits ‘exposure’ and ‘depth’ with Halimeda’s thermal niche evolution.
PMC simulations were performed for 1,000 trait trees (100 simmap trees for each 10 trees with the
maximum posterior probabilities). The average and standard deviation (SD) of p-values and power of
the test across the 1,000 trees, and the proportion of significant p-values (≤0.05) are given.
α -niche trait p-value (SD) Significant p-values Power of test (SD) Exposure 0.049 (0.1) 75% 0.573 (0.2) Depth 0.280 (0.3) 22.6% 0.337 (0.3)
Page 21 of 21 Global Ecology and Biogeography
123456789101112131415161718192021222324252627282930313233343536373839404142434445464748495051525354555657585960