for personal use only - asx · 2013 ($) 30 june 2013 ($) net tangible assets per ordinary share*...
TRANSCRIPT

For
per
sona
l use
onl
y

Appendix 4D | 1
Steadfast Group Limited and controlled entities
Appendix 4D (rule 4.3A) Preliminary final report for the half year ended 31 December 2013
Results for announcement to the market (All comparisons to half year ended 31 December 2012)
2013$’000
Up/Down % Movement
Revenues from ordinary activities 73,887 57,792 359%
Earnings before interest expense, tax and amortisation expense (EBITA) from core operations pre-corporate income/(expenses)
26,860 19,843 283%
EBITA from ordinary activities from core operations post-corporate income/(expenses) 24,468 18,508 311%
Profit before income tax expense from core operations before non-recurring items (Note 1) 18,940 13,195 230%
Profit before income tax expense from core operations after non-recurring items (Note 1) 15,543 12,516 413%
Profit/(loss) from ordinary activities after tax attributable to shareholders 8,832 6,965 373%
Profit/(loss) from discontinued operations after tax attributable to shareholders - - -
Net profit/(loss) after tax attributable to shareholders 8,832 6,965 373%
Total comprehensive income attributable to shareholders 9,427 7,560 405%
Note 1:
The table below provided the reconciliation between the profit before income tax expense from core operations before and
after non-recurring items.
2013$’000
Profit before income tax expense from core operations before non-recurring items 18,940
Add/(less): non-recurring income/(expenses)
Profit on fair value the equity interest in an associate which became a subsidiary 4,611
Due diligence and restructure costs (2,328)
Share based payment (6,015)
Write back of interest free executive loans 335
Profit before income tax expense from core operations after non-recurring items 15,543
For
per
sona
l use
onl
y
Appendix 4D | 2
During the financial year ended 30 June 2013, the Group recognised net expenses of $3,732,000 as non-recurring items
which arose due to specific activities to facilitate the Company listing on the Australian Securities Exchange. These
income/expenses were:
a profit of $4,611,000 was recognised as a result of remeasuring to fair value the equity interest in Miramar Underwriting Agency Pty Ltd (Miramar). The Group increased its shareholding in Miramar from 50% to 100% (refer to Note 11.A.i.f. to the financial statements as per Attachment A); offset by
$2,328,000 in relation to due diligence and restructuring on acquisition of equity interests in 64 subsidiaries and associates, completed in August 2013 and in relation to potential acquisitions in line with the Group’s strategy; and
$6,015,000 of share based payment expenses on executive shares, and other employment costs recognised in relation to the grant of interest free loans to four executives and share options issued to a key management personnel of an acquired business; and
$335,000 of effective interest costs wrote back on interest free executive loans.
Some of the financial data in the table above, namely the EBITA related items, are not disclosed in accordance with current Australian Accounting Standards requirements. However, all financial data is based on the information disclosed in the reviewed financial statements and notes to the financial statements of the Group and follow the recognition requirements of Australian Accounting Standards.
For
per
sona
l use
onl
y
Appendix 4D | 3
Dividend information
Amount per share
(cents)
Franked amount per
share (cents)
Tax rate for franking credit
(%)
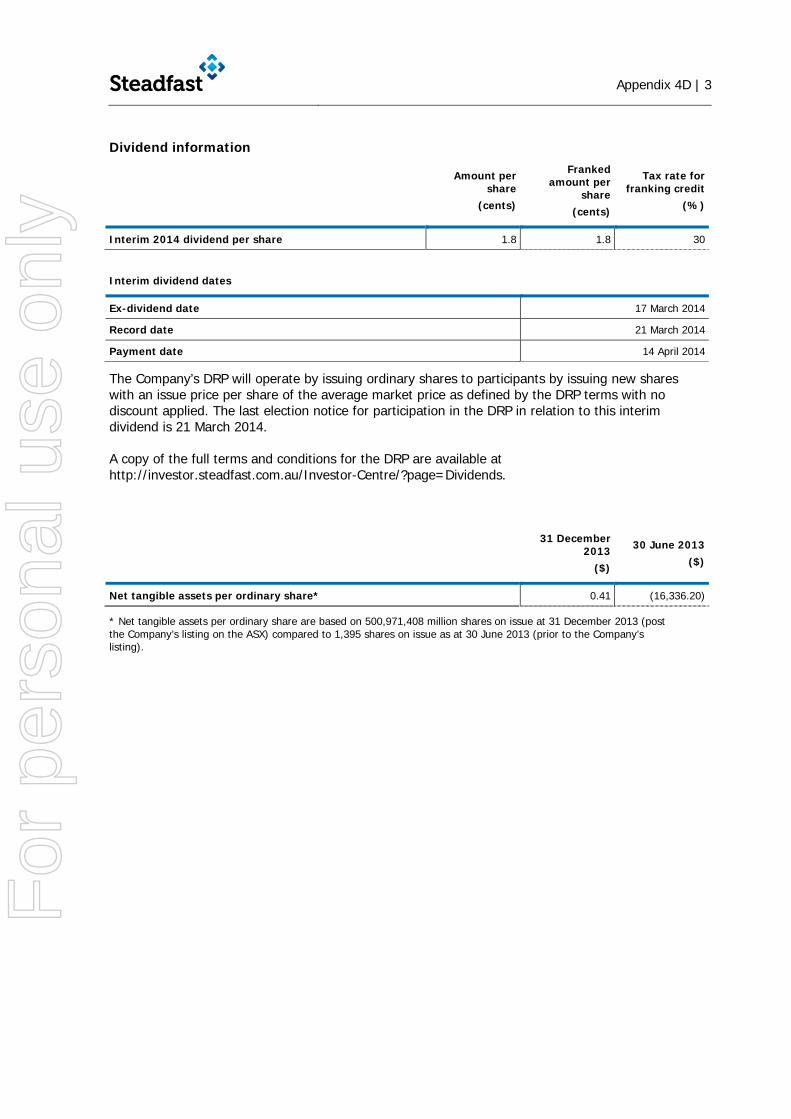
Interim 2014 dividend per share 1.8 1.8 30
Interim dividend dates
Ex-dividend date 17 March 2014
Record date 21 March 2014
Payment date 14 April 2014
The Company’s DRP will operate by issuing ordinary shares to participants by issuing new shares with an issue price per share of the average market price as defined by the DRP terms with no discount applied. The last election notice for participation in the DRP in relation to this interim dividend is 21 March 2014.
A copy of the full terms and conditions for the DRP are available at http://investor.steadfast.com.au/Investor-Centre/?page=Dividends.
31 December 2013
($)
30 June 2013($)
Net tangible assets per ordinary share* 0.41 (16,336.20)
* Net tangible assets per ordinary share are based on 500,971,408 million shares on issue at 31 December 2013 (post the Company’s listing on the ASX) compared to 1,395 shares on issue as at 30 June 2013 (prior to the Company’s listing).
For
per
sona
l use
onl
y
Appendix 4D | 4
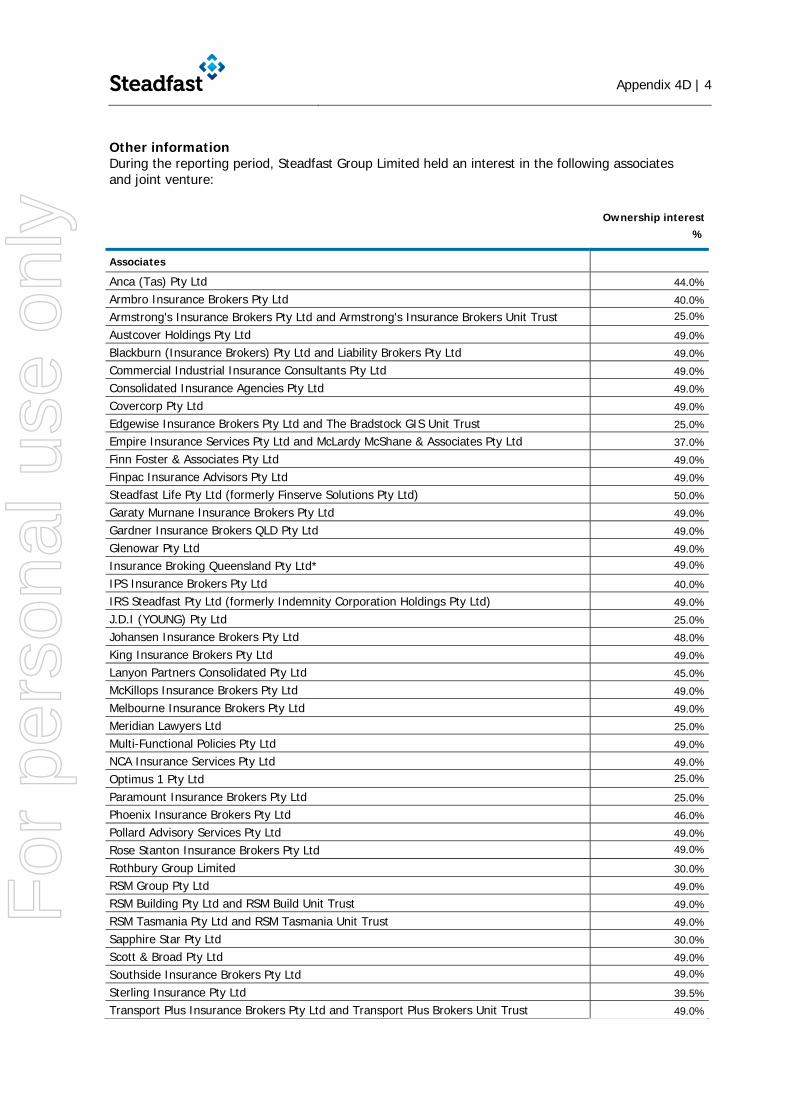
Other information During the reporting period, Steadfast Group Limited held an interest in the following associates and joint venture:
Ownership interest
%
Associates
Anca (Tas) Pty Ltd 44.0%
Armbro Insurance Brokers Pty Ltd 40.0%
Armstrong's Insurance Brokers Pty Ltd and Armstrong's Insurance Brokers Unit Trust 25.0%
Austcover Holdings Pty Ltd 49.0%
Blackburn (Insurance Brokers) Pty Ltd and Liability Brokers Pty Ltd 49.0%
Commercial Industrial Insurance Consultants Pty Ltd 49.0%
Consolidated Insurance Agencies Pty Ltd 49.0%
Covercorp Pty Ltd 49.0%
Edgewise Insurance Brokers Pty Ltd and The Bradstock GIS Unit Trust 25.0%
Empire Insurance Services Pty Ltd and McLardy McShane & Associates Pty Ltd 37.0%
Finn Foster & Associates Pty Ltd 49.0%
Finpac Insurance Advisors Pty Ltd 49.0%
Steadfast Life Pty Ltd (formerly Finserve Solutions Pty Ltd) 50.0%
Garaty Murnane Insurance Brokers Pty Ltd 49.0%
Gardner Insurance Brokers QLD Pty Ltd 49.0%
Glenowar Pty Ltd 49.0%
Insurance Broking Queensland Pty Ltd* 49.0%
IPS Insurance Brokers Pty Ltd 40.0%
IRS Steadfast Pty Ltd (formerly Indemnity Corporation Holdings Pty Ltd) 49.0%
J.D.I (YOUNG) Pty Ltd 25.0%
Johansen Insurance Brokers Pty Ltd 48.0%
King Insurance Brokers Pty Ltd 49.0%
Lanyon Partners Consolidated Pty Ltd 45.0%
McKillops Insurance Brokers Pty Ltd 49.0%
Melbourne Insurance Brokers Pty Ltd 49.0%
Meridian Lawyers Ltd 25.0%
Multi-Functional Policies Pty Ltd 49.0%
NCA Insurance Services Pty Ltd 49.0%
Optimus 1 Pty Ltd 25.0%
Paramount Insurance Brokers Pty Ltd 25.0%
Phoenix Insurance Brokers Pty Ltd 46.0%
Pollard Advisory Services Pty Ltd 49.0%
Rose Stanton Insurance Brokers Pty Ltd 49.0%
Rothbury Group Limited 30.0%
RSM Group Pty Ltd 49.0%
RSM Building Pty Ltd and RSM Build Unit Trust 49.0%
RSM Tasmania Pty Ltd and RSM Tasmania Unit Trust 49.0%
Sapphire Star Pty Ltd 30.0%
Scott & Broad Pty Ltd 49.0%
Southside Insurance Brokers Pty Ltd 49.0%
Sterling Insurance Pty Ltd 39.5%
Transport Plus Insurance Brokers Pty Ltd and Transport Plus Brokers Unit Trust 49.0%
For
per
sona
l use
onl
y

Appendix 4D | 5
Ownership interest
%
Tudor Insurance Australia (Insurance Brokers) Pty Ltd and Tudor Insurance Agency Unit Trust 48.0%
Watkins Taylor Stone Insurance Brokers Pty Ltd and D&E Watkins Unit Trust 35.0%
Webmere Pty Ltd 49.0%
Joint ventures Macquarie Premium Funding Pty Ltd 50.0%
* Steadfast acquired 100% of the equity interest of Insurance Broking Queensland Pty Ltd (IBQ) in August 2013. IBQ’s 100% equity interest was sold to Webmere Pty Ltd during the internal restructure (transferring the equity interests of the broking business and its operations into a business hub). After the hubbing arrangement, IBQ became an associate with effective equity interest reduced to 49%.
The aggregate share of profits after tax of associates and joint venture accounted for using equity method is $6,238,000.
Additional Appendix 4D disclosure requirements can be found in the directors’ report and the 31 December 2013 financial statements and accompanying notes.
This report is based on the consolidated financial statements which have been reviewed by KPMG.
For
per
sona
l use
onl
y

Appendix 4D | 6
Attachment A – Steadfast Group Ltd Half year financial report – 31 December 2013
For
per
sona
l use
onl
y
2014 Half Year Financial Report Steadfast Group Limited
For
per
sona
l use
onl
y

Financial ReportFor the half year ended 31 December 2013
Contents
Directors’ report 1Lead auditor’s independence declaration 5Consolidated statement of comprehensive income 6Consolidated statement of financial position 7Consolidated statement of changes in equity 8Consolidated statement of cash flows 10Notes to the financial statements 11Directors’ declaration 26Independent auditor’s review report 27
Steadfast Group LimitedABN 98 073 659 677
For
per
sona
l use
onl
y
1 | SGL FY14 Half year financial report
Steadfast Group Limited Directors’ Report
The Directors present their report together with the consolidated financial statements of Steadfast Group Limited (Steadfast or the Company) and its subsidiaries, and the Group’s interests in associates and a joint venture (Steadfast Group or the Group) for the half year ended 31 December 2013 and the auditor’s review report thereon.
Directors
The Directors of the Company at any time during or since the end of the half year are as follows. Directors were in office for the entire period unless otherwise stated.
Name Date of appointment Chairman Frank O’Halloran, AM 21 October 2012 Managing Director & CEO Robert Kelly 18 April 1996 Other Directors David Liddy 1 January 2013 Anne O’Driscoll 1 July 2013 Philip Purcell 1 February 2013 Greg Rynenberg 10 August 1998 Jonathan Upton 9 May 2005
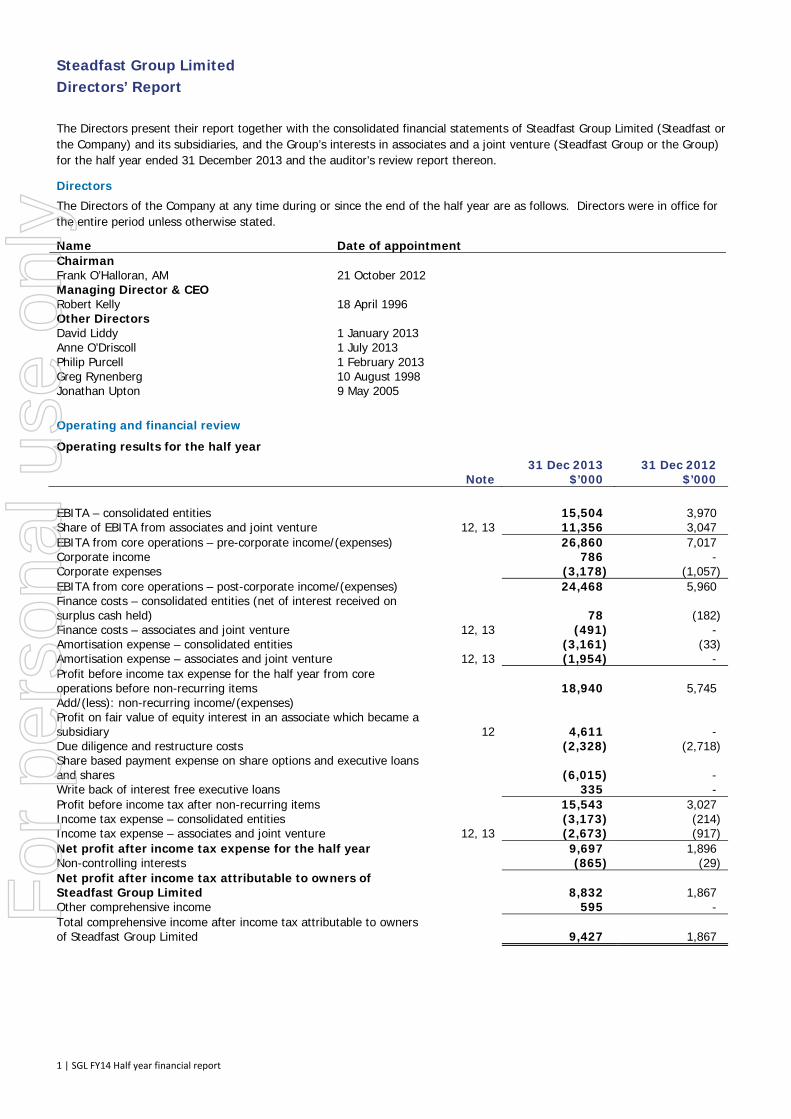
Operating and financial review
Operating results for the half year 31 Dec 2013 31 Dec 2012
Note $’000 $’000 EBITA – consolidated entities 15,504 3,970 Share of EBITA from associates and joint venture 12, 13 11,356 3,047 EBITA from core operations – pre-corporate income/(expenses) 26,860 7,017 Corporate income 786 - Corporate expenses (3,178) (1,057) EBITA from core operations – post-corporate income/(expenses) 24,468 5,960 Finance costs – consolidated entities (net of interest received on surplus cash held) 78 (182) Finance costs – associates and joint venture 12, 13 (491) - Amortisation expense – consolidated entities (3,161) (33) Amortisation expense – associates and joint venture 12, 13 (1,954) - Profit before income tax expense for the half year from core operations before non-recurring items 18,940 5,745 Add/(less): non-recurring income/(expenses) Profit on fair value of equity interest in an associate which became a subsidiary 12 4,611 - Due diligence and restructure costs (2,328) (2,718) Share based payment expense on share options and executive loans and shares (6,015) - Write back of interest free executive loans 335 - Profit before income tax after non-recurring items 15,543 3,027 Income tax expense – consolidated entities (3,173) (214) Income tax expense – associates and joint venture 12, 13 (2,673) (917) Net profit after income tax expense for the half year 9,697 1,896 Non-controlling interests (865) (29) Net profit after income tax attributable to owners of Steadfast Group Limited 8,832 1,867 Other comprehensive income 595 - Total comprehensive income after income tax attributable to owners of Steadfast Group Limited 9,427 1,867
For
per
sona
l use
onl
y

2 | SGL FY14 Half year financial report
The Group’s total comprehensive income after income tax attributable to owners for the half year was $9.427 million (31 December 2012: $1.867 million).
The increase in comprehensive income after tax was mainly due to:
increased profits generated from the date of acquisition of subsidiaries and associates upon successful listing on the Australian Stock Exchange (ASX) in August 2013 and acquisition of Protecsure Pty Limited in December 2013;
a profit of $4.611 million was recognised as a result of remeasuring to fair value the equity interest in Miramar Underwriting Agency Pty Ltd (Miramar). The Group increased its shareholding in Miramar from 50% to 100% (refer to Note 11.A.i.f. for further details); offset by
an increase in non-recurring expenses which arose due to specific activities to facilitate the Company restructure and listing on the ASX. The significant expenses were: - $2.328 million in relation to due diligence and restructuring on acquisition of equity interests in 64 subsidiaries and
associates, completed in August 2013 and in relation to potential acquisitions in line with the Group’s strategy; and - a total of $6.015 million of share based payments expense and other employment costs recognised due to:
o $1.635 million share based payments expense for the $0.15 discount on 10.900 million ordinary shares allotted to four executives (executive shares) at $1.00 per share;
o $4.015 million costs on interest free, unsecured and full recourse loans provided to four executives (executive loans) for the allotment of executive shares. This effective interest costs will be reversed in the 5 years period to August 2018, $0.335 million of the effective interest costs was written back in the half year ended 31 December 2013. The Board assessed and confirmed that these executive loans are recoverable; and
o $0.365 million share based payments expense on share options issued to a key management personnel of an acquired business; and
higher income tax expense on the increased scale of operations.
Some of the financial data in the table above, namely the EBITA related items, are not disclosed in accordance with current Australian Accounting Standards requirements. However, all financial data is based on the information disclosed in the reviewed financial statements and notes to the financial statements of the Group and follow the recognition requirements of Australian Accounting Standards.
Review of financial condition
Financial position
The total assets of the Group as at 31 December 2013 were $704.105 million compared to $97.729 million as at 30 June 2013. The increase was mainly attributable to the raising of capital on the ASX which was applied towards:
the acquisitions of 64 subsidiaries and equity interests in associates completed on 7 August 2013 that included: - cash and cash equivalents of $81.619 million. This included cash held on trust, being cash received from insurance
policyholders which cannot be used to meet business obligations/operating expenses other than payments to insurers, underwriting agencies and/or refunds to policyholders;
- trade and other receivables of $77.534 million; - investments in associates of $138.153 million; - acquired intangible assets of $65.251 million; and - goodwill of $221.794 million; and
approximately $25.000 million surplus cash raised on issuing new shares when the Company listed on the ASX for future acquisitions.
The total liabilities of the Group as at 31 December 2013 were $187.687 million compared to $85.347 million as at 30 June 2013. The increase was mainly attributable to:
an increase in trade and other payables of $140.946 million following the acquisition of subsidiaries and equity interests in associates completed on 7 August 2013. A portion of the trade and other payables represent amounts to be paid to insurance companies or underwriting agencies out of cash received on trust from policyholders; offset by
the repayment of bank loans of $36.623 million which was funded by the cash inflows from the shares issued to the retail and institutional investors when the Company listed on the ASX.
For
per
sona
l use
onl
y
3 | SGL FY14 Half year financial report
The increase in the Group’s equity from $12.382 million at 30 June 2013 to $516.418 million at 31 December 2013 largely reflects:
$486.827 million of share capital issued, net of costs (net of income tax) of $12.117 million;
$10.292 million of comprehensive income;
$6.857 million of acquired non-controlling interests; and
$2.760 million share based payments reserve recognised for ordinary shares issued to a number of executives at a discount as per the executive shares, share options granted and employee share plan arrangements.
Cash from operations
The operating net cash flows, before broking trust account movements, of $4.899 million are higher than the prior period reflecting the increased scale of operation of the Group. This amount reflects the derivation of the profits for the period, apart from the delayed receipt of dividends from associates which are contracted to be received typically no later than 45 days post half year end.
The net cash inflow/(outflow) from operating activities for the half year ended 31 December 2013 was $(15.895) million compared to $0.664 million for the half year ended 31 December 2012. The net outflows of $15.693 million include a net outflow of $20.794 million from broking accounts and net inflows from the balance of operating activities of $4.899 million as detailed above. At the time of acquisition in August 2013, the liabilities of the brokers included cash held on trust which was subsequently remitted to insurers in accordance with normal trading terms. The seasonality of insurance premium receipts following June renewals meant that the amounts held on trust at acquisition in August 2013 were higher than the $56.512 million balance as at 31 December 2013.
The Company raised $333.703 million in cash on issuing new shares when listing of the Company on the ASX in August 2013. The cash raised was used to fund the following:
transactions costs (gross) of $15.951 million in relation to the Company’s listing on the ASX;
repayment of borrowings of $36.623 million which had been used to invest in subsidiaries, associates and business assets completed in the prior year to 30 June 2013;
settlement of $170.535 million (net of cash acquired) for the acquisitions of 64 subsidiaries and equity interests in associates completed on 7 August 2013 and the subsequent acquisition of Protecsure; and
cash held for future acquisitions.
Capital management
In August 2013, the Company listed on the ASX. As at 31 December 2013, the Company had a total of 500.971 million ordinary shares on issue resulting from:
65.686 million ordinary shares for re-weighting shares;
10.900 million ordinary shares for executive shares;
134.210 million ordinary shares for consideration shares in respect of acquisitions of subsidiaries and associates; and
290.175 million ordinary shares for individual and institutional investors.
In addition, there were 1,395 preferred capital shares issued resulting from the conversion of the ordinary share capital on issue as at 30 June 2013. These preferred capital shares were cancelled in November following member approval.
Events subsequent to reporting date
Subsequent to 31 December 2013, the following events occurred:
the Board declared an interim dividend of 1.8 cents per share, 100% franked;
Steadfast completed the following hubbing arrangements and acquisition: - Melbourne hubbing of GWS Network Insurance Broker, Gallivan Magee & Associates and Masterman; - Sydney hubbing of IRS Steadfast, Wagland Salter & Associates and DMA; and - acquisition of the remaining 12.5% of minority interest of White Outsourcing; and
an $85.000 million Corporate facility has been put in place with Macquarie Bank (to replace the $44.430 million Corporate facility) to fund future acquisitions.
Further details of the above events are set out in note 16.
For
per
sona
l use
onl
y
For
per
sona
l use
onl
y
5
KPMG, an Australian partnership and a member firm of the KPMG network of independent member firms affiliated with KPMG International Cooperative (“KPMG International”), a Swiss entity.
Liability limited by a scheme approved under Professional Standards Legislation.
Lead Auditor’s Independence Declaration under Section 307C of the Corporations Act 2001
To: the directors of Steadfast Group Limited
I declare that, to the best of my knowledge and belief, in relation to the review for the half year ended 31 December 2013 there have been:
(i) no contraventions of the auditor independence requirements as set out in the Corporations Act 2001 in relation to the review; and
(ii) no contraventions of any applicable code of professional conduct in relation to the review.
KPMG
Andrew Dickinson Partner
Sydney
24 February 2014
For
per
sona
l use
onl
y

6 | SGL FY14 Half year financial report
Steadfast Group Limited Consolidated Statement of Comprehensive Income For the half year ended 31 December 2013 Note 31 Dec 2013 31 Dec 2012 $’000 $’000 Marketing and administration fees 13,451 12,241 Sales and other revenue 49,409 1,711 Revenue 62,860 13,952 Share of profits of associates and joint venture accounted for using the equity method
6,238 2,130
Profit on fair value of investment 4,611 - Other income 178 13 73,887 16,095 Expenses Employment expense (36,184) (3,765)Steadfast Network Broker rebates (3,335) (2,881)Occupancy expense (2,265) (416)Selling expense (1,728) (409)Administration, brokers support service and other expenses (10,682) (3,378)Amortisation expense (3,161) (33)Depreciation expense (783) (203)Finance costs (551) (182)Due diligence and restructure costs (2,328) (2,718) Profit before income tax expense 12,870 2,110 Income tax expense (3,173) (214) Profit after income tax expense for the half year 9,697 1,896 Other comprehensive income Items that may be reclassified subsequently to profit or loss Net movement in foreign currency translation reserve 850 - Income tax expense on other comprehensive income (255) - Other comprehensive income for the period, net of tax 595 - Total comprehensive income for the half year, net of tax 10,292 1,896 Profit for the half year is attributable to: Non-controlling interests 865 29 Owners of Steadfast Group Limited 8,832 1,867 9,697 1,896 Total comprehensive income for the half year is attributable to: Non-controlling interests 865 29 Owners of Steadfast Group Limited 9,427 1,867 10,292 1,896 Basic earnings per share (cents per share) 5 2.08 2.84 Diluted earnings per share (cents per share) 5 2.07 2.84 The above consolidated statement of comprehensive income should be read in conjunction with the notes to the financial statements.
For
per
sona
l use
onl
y
7 | SGL FY14 Half year financial report
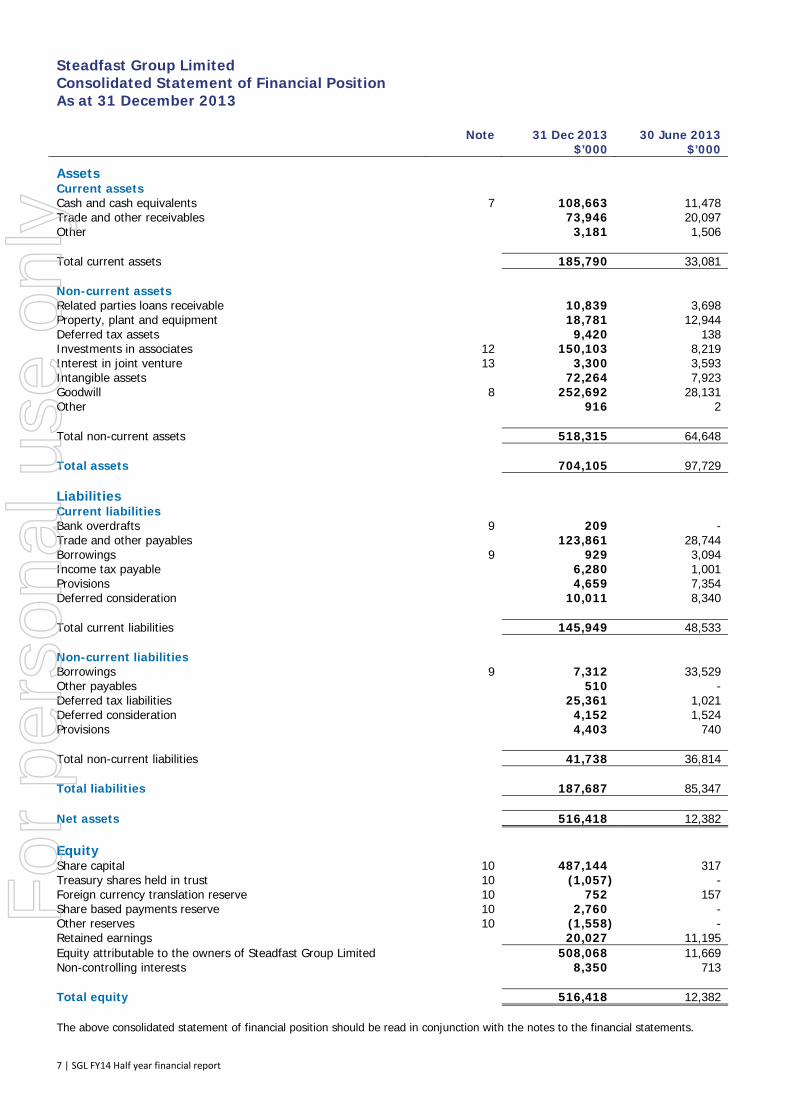
Steadfast Group Limited Consolidated Statement of Financial Position As at 31 December 2013 Note 31 Dec 2013 30 June 2013 $’000 $’000 Assets Current assets Cash and cash equivalents 7 108,663 11,478 Trade and other receivables 73,946 20,097 Other 3,181 1,506 Total current assets 185,790 33,081 Non-current assets Related parties loans receivable 10,839 3,698 Property, plant and equipment 18,781 12,944 Deferred tax assets 9,420 138 Investments in associates 12 150,103 8,219 Interest in joint venture 13 3,300 3,593 Intangible assets 72,264 7,923 Goodwill 8 252,692 28,131 Other 916 2 Total non-current assets 518,315 64,648 Total assets 704,105 97,729 Liabilities Current liabilities Bank overdrafts 9 209 - Trade and other payables 123,861 28,744 Borrowings 9 929 3,094 Income tax payable 6,280 1,001 Provisions 4,659 7,354 Deferred consideration 10,011 8,340 Total current liabilities 145,949 48,533 Non-current liabilities Borrowings 9 7,312 33,529 Other payables 510 - Deferred tax liabilities 25,361 1,021 Deferred consideration 4,152 1,524 Provisions 4,403 740 Total non-current liabilities 41,738 36,814 Total liabilities 187,687 85,347 Net assets 516,418 12,382 Equity Share capital 10 487,144 317 Treasury shares held in trust 10 (1,057) - Foreign currency translation reserve 10 752 157 Share based payments reserve 10 2,760 - Other reserves 10 (1,558) - Retained earnings 20,027 11,195 Equity attributable to the owners of Steadfast Group Limited 508,068 11,669 Non-controlling interests 8,350 713 Total equity 516,418 12,382 The above consolidated statement of financial position should be read in conjunction with the notes to the financial statements.
For
per
sona
l use
onl
y

8 | SGL FY14 Half year financial report
Steadfast Group Limited Consolidated Statement of Changes in Equity For the half year ended 31 December 2013
Equity attributable to owners of Steadfast Group Limited
Non- controlling
interests Total
equity
31 Dec 2013 Share
capital
Treasury shares held in
trust
Foreign currency
translation reserve
Share based
payments reserve
Other reserves
Retained earnings
$'000 $'000 $'000 $'000 $'000 $'000 $'000 $'000 Balance at 1 July 2013 317 - 157 - - 11,195 713 12,382
Profit after income tax expense for the half year
- - - - - 8,832 865 9,697
Other comprehensive income for the half year, net of tax - - 595 - - - - 595 Total comprehensive income for the half year - - 595 - - 8,832 865 10,292
Transactions with owners in their capacity as owners: Contributions of equity, net of transaction costs (note 10) 486,827 - - - - - - 486,827Shares acquired and held in trust (note 10) - (1,057) - - - - - (1,057)Share based payments expense on executive shares and employee share plans - - - 2,395 - - - 2,395Share based payments expense on share options granted - - - 365 - - - 365Put option liability on acquisition of subsidiaries - - - - (1,062) - - (1,062)Acquisition of non-controlling interests (note 11) - - - - - - 6,857 6,857Disposal of part equity interests in subsidiaries without loss of control - - - - (496) - 630 134Dividends declared and paid to non-controlling interests holders - - - - - - (715) (715) Balance at 31 December 2013 487,144 (1,057) 752 2,760 (1,558) 20,027 8,350 516,418 The above consolidated statement of changes in equity should be read in conjunction with the notes to the financial statements.
For
per
sona
l use
onl
y
9 | SGL FY14 Half year financial report
Steadfast Group Limited Consolidated Statement of Changes in Equity For the half year ended 31 December 2013
Equity attributable to owners of Steadfast Group Limited
Non- controlling
interests Total
equity
31 Dec 2012 Share
capital
Treasury shares held in
trust
Foreign currency
translation reserve
Share based
payments reserve
Other reserves
Retained earnings
$'000 $'000 $'000 $'000 $'000 $'000 $'000 $'000 Balance at 1 July 2012 317 - - - - 14,152 - 14,469
Profit after income tax expense for the half year - - - - - 1,867 29 1,896 Other comprehensive income for the half year, net of tax - - - - - - - - Total comprehensive income for the half year - - - - - 1,867 29 1,896
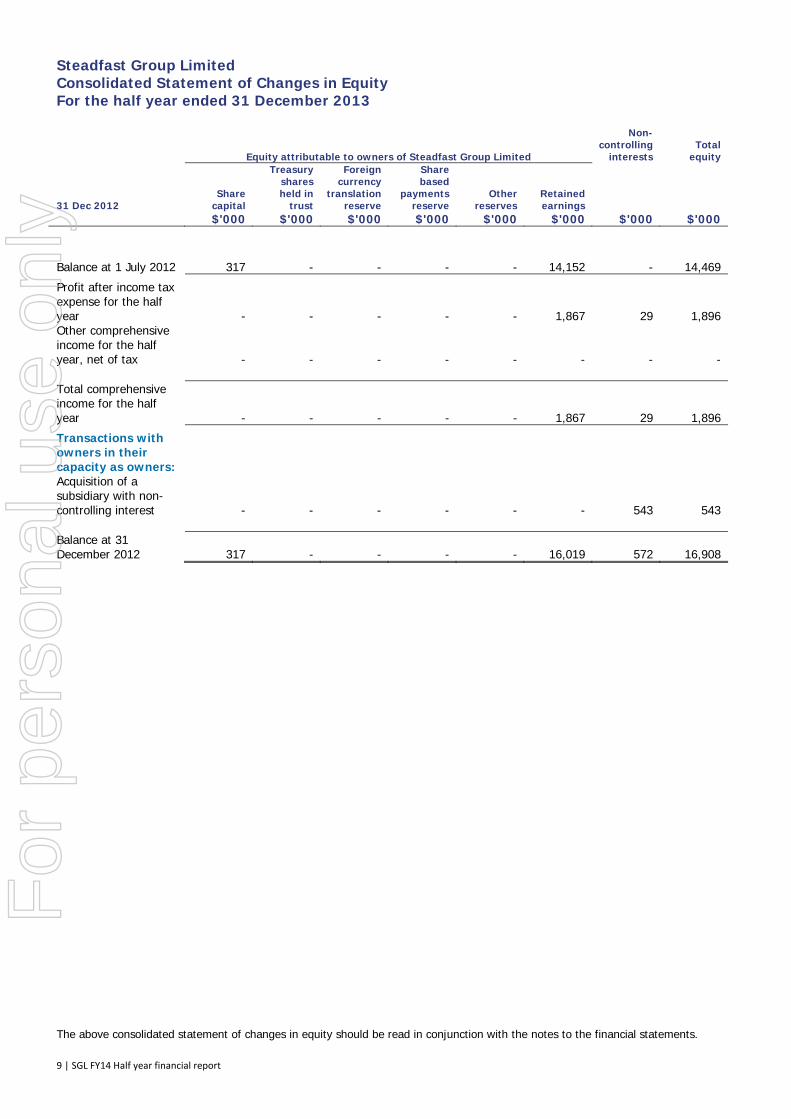
Transactions with owners in their capacity as owners: Acquisition of a subsidiary with non-controlling interest - - - - - - 543 543 Balance at 31 December 2012 317 - - - - 16,019 572 16,908 The above consolidated statement of changes in equity should be read in conjunction with the notes to the financial statements.
For
per
sona
l use
onl
y

10 | SGL FY14 Half year financial report
Steadfast Group Limited Consolidated Statement of Cash Flows For the half year ended 31 December 2013 Note 31 Dec 2013 31 Dec 2012 $’000 $’000 Cash flows from operating activities Receipts from customers 91,013 21,138 Payments to suppliers and employees, and member rebates (89,505) (20,109)Dividends received from associates and joint venture 3,510 - Interest received 2,225 153 Interest and other finance costs paid (551) (142)Income taxes paid (1,793) (2) Net cash from operating activities before customer trust accounts movement
4,899 1,038
Net movement in customer trust accounts (net cash receipts/payments on behalf of customers)
(20,794) (374)
Net cash from operating activities (15,895) 664 Cash flows from investing activities Payment for acquisitions of subsidiaries and business assets, net of cash acquired and repayment of subsidiaries’ loans
(100,100) (4,866)
Payments for investments in associates and joint venture (70,435) - Proceeds on part disposal of investments in subsidiaries on hubbing arrangements
5,371 -
Payments for property, plant and equipment (1,322) (8,481) Net cash used in investing activities (166,486) (13,347) Cash flows from financing activities Proceeds from issue of shares 333,703 - Payments of transaction costs on issue of shares (15,951) - Proceeds from shares buy back - 50 Payments for purchase of treasury shares (1,057) - Proceeds from borrowings - 10,288 Repayment of borrowings (36,623) - Dividends paid to owners of Steadfast Group Ltd - (167)Dividends paid to non-controlling interests (715) - Net cash from financing activities 279,357 10,171 Net increase/(decrease) in cash and cash equivalents 96,976 (2,512)Cash and cash equivalents at the beginning of the financial period 11,478 9,990 Cash and cash equivalents at the end of the financial period* 108,454 7,478 * Balance represents: Cash and cash equivalents 7 108,663 7,478 Bank overdrafts 9 (209) - 108,454 7,478 The above consolidated statement of cash flows should be read in conjunction with the notes to the financial statements.
For
per
sona
l use
onl
y
11 | SGL FY14 Half year financial report
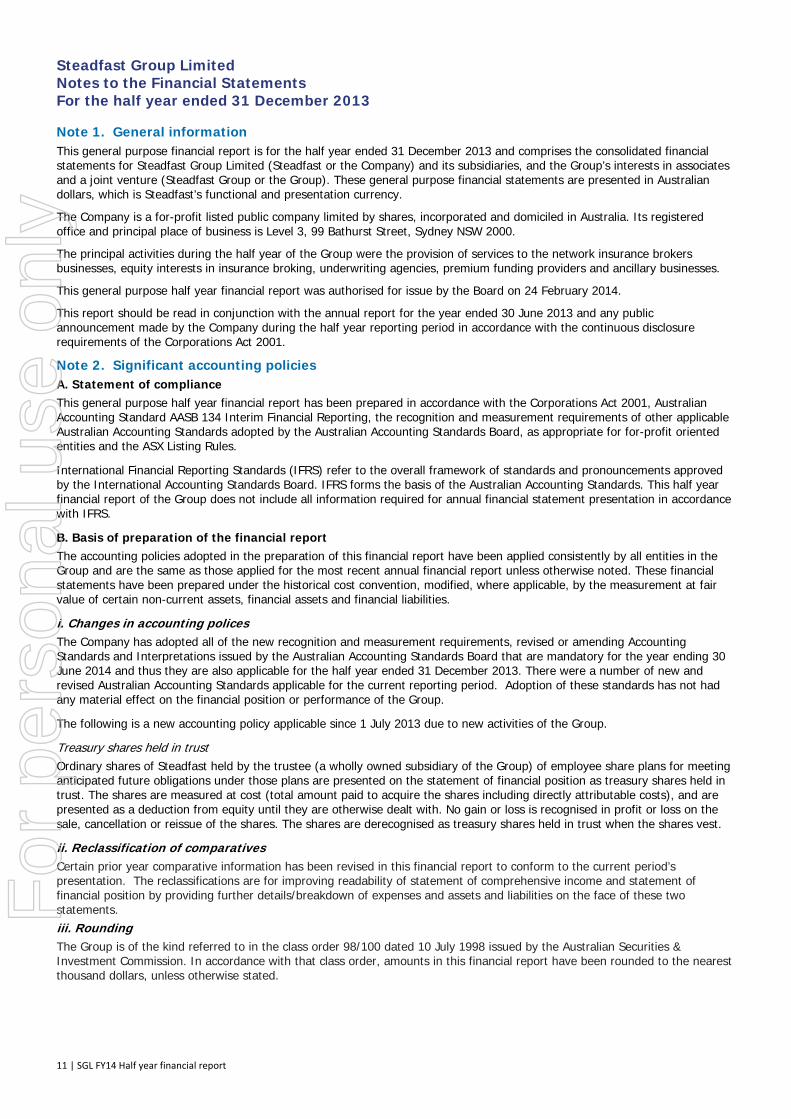
Steadfast Group Limited Notes to the Financial Statements For the half year ended 31 December 2013 Note 1. General information This general purpose financial report is for the half year ended 31 December 2013 and comprises the consolidated financial statements for Steadfast Group Limited (Steadfast or the Company) and its subsidiaries, and the Group’s interests in associates and a joint venture (Steadfast Group or the Group). These general purpose financial statements are presented in Australian dollars, which is Steadfast’s functional and presentation currency.
The Company is a for-profit listed public company limited by shares, incorporated and domiciled in Australia. Its registered office and principal place of business is Level 3, 99 Bathurst Street, Sydney NSW 2000.
The principal activities during the half year of the Group were the provision of services to the network insurance brokers businesses, equity interests in insurance broking, underwriting agencies, premium funding providers and ancillary businesses.
This general purpose half year financial report was authorised for issue by the Board on 24 February 2014.
This report should be read in conjunction with the annual report for the year ended 30 June 2013 and any public announcement made by the Company during the half year reporting period in accordance with the continuous disclosure requirements of the Corporations Act 2001.
Note 2. Significant accounting policies A. Statement of compliance This general purpose half year financial report has been prepared in accordance with the Corporations Act 2001, Australian Accounting Standard AASB 134 Interim Financial Reporting, the recognition and measurement requirements of other applicable Australian Accounting Standards adopted by the Australian Accounting Standards Board, as appropriate for for-profit oriented entities and the ASX Listing Rules.
International Financial Reporting Standards (IFRS) refer to the overall framework of standards and pronouncements approved by the International Accounting Standards Board. IFRS forms the basis of the Australian Accounting Standards. This half year financial report of the Group does not include all information required for annual financial statement presentation in accordance with IFRS.
B. Basis of preparation of the financial report The accounting policies adopted in the preparation of this financial report have been applied consistently by all entities in the Group and are the same as those applied for the most recent annual financial report unless otherwise noted. These financial statements have been prepared under the historical cost convention, modified, where applicable, by the measurement at fair value of certain non-current assets, financial assets and financial liabilities.
i. Changes in accounting polices The Company has adopted all of the new recognition and measurement requirements, revised or amending Accounting Standards and Interpretations issued by the Australian Accounting Standards Board that are mandatory for the year ending 30 June 2014 and thus they are also applicable for the half year ended 31 December 2013. There were a number of new and revised Australian Accounting Standards applicable for the current reporting period. Adoption of these standards has not had any material effect on the financial position or performance of the Group.
The following is a new accounting policy applicable since 1 July 2013 due to new activities of the Group.
Treasury shares held in trust Ordinary shares of Steadfast held by the trustee (a wholly owned subsidiary of the Group) of employee share plans for meeting anticipated future obligations under those plans are presented on the statement of financial position as treasury shares held in trust. The shares are measured at cost (total amount paid to acquire the shares including directly attributable costs), and are presented as a deduction from equity until they are otherwise dealt with. No gain or loss is recognised in profit or loss on the sale, cancellation or reissue of the shares. The shares are derecognised as treasury shares held in trust when the shares vest.
ii. Reclassification of comparatives Certain prior year comparative information has been revised in this financial report to conform to the current period’s presentation. The reclassifications are for improving readability of statement of comprehensive income and statement of financial position by providing further details/breakdown of expenses and assets and liabilities on the face of these two statements. iii. Rounding The Group is of the kind referred to in the class order 98/100 dated 10 July 1998 issued by the Australian Securities & Investment Commission. In accordance with that class order, amounts in this financial report have been rounded to the nearest thousand dollars, unless otherwise stated.
For
per
sona
l use
onl
y
12 | SGL FY14 Half year financial report
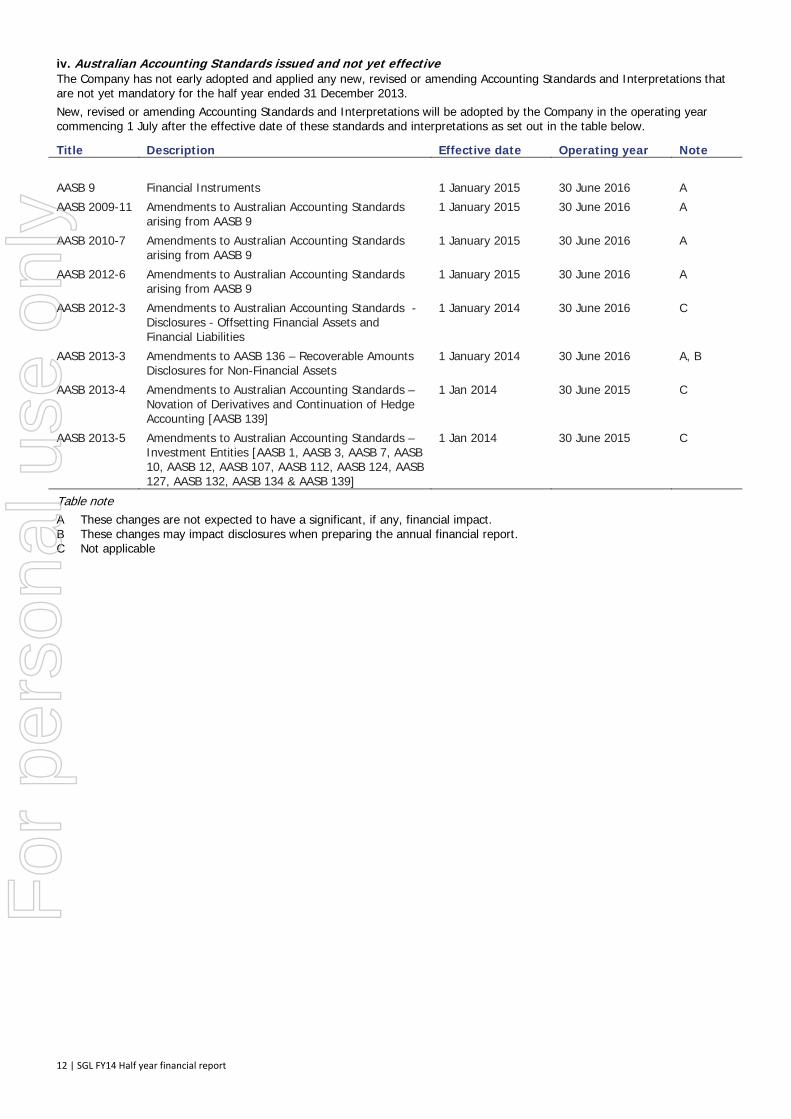
iv. Australian Accounting Standards issued and not yet effective The Company has not early adopted and applied any new, revised or amending Accounting Standards and Interpretations that are not yet mandatory for the half year ended 31 December 2013. New, revised or amending Accounting Standards and Interpretations will be adopted by the Company in the operating year commencing 1 July after the effective date of these standards and interpretations as set out in the table below.
Title Description Effective date Operating year Note AASB 9 Financial Instruments 1 January 2015 30 June 2016 A
AASB 2009-11 Amendments to Australian Accounting Standards arising from AASB 9
1 January 2015 30 June 2016 A
AASB 2010-7 Amendments to Australian Accounting Standards arising from AASB 9
1 January 2015 30 June 2016 A
AASB 2012-6 Amendments to Australian Accounting Standards arising from AASB 9
1 January 2015 30 June 2016 A
AASB 2012-3 Amendments to Australian Accounting Standards - Disclosures - Offsetting Financial Assets and Financial Liabilities
1 January 2014 30 June 2016 C
AASB 2013-3 Amendments to AASB 136 – Recoverable Amounts Disclosures for Non-Financial Assets
1 January 2014 30 June 2016 A, B
AASB 2013-4 Amendments to Australian Accounting Standards – Novation of Derivatives and Continuation of Hedge Accounting [AASB 139]
1 Jan 2014 30 June 2015 C
AASB 2013-5 Amendments to Australian Accounting Standards – Investment Entities [AASB 1, AASB 3, AASB 7, AASB 10, AASB 12, AASB 107, AASB 112, AASB 124, AASB 127, AASB 132, AASB 134 & AASB 139]
1 Jan 2014 30 June 2015 C
Table note A These changes are not expected to have a significant, if any, financial impact. B These changes may impact disclosures when preparing the annual financial report. C Not applicable
For
per
sona
l use
onl
y
13 | SGL FY14 Half year financial report
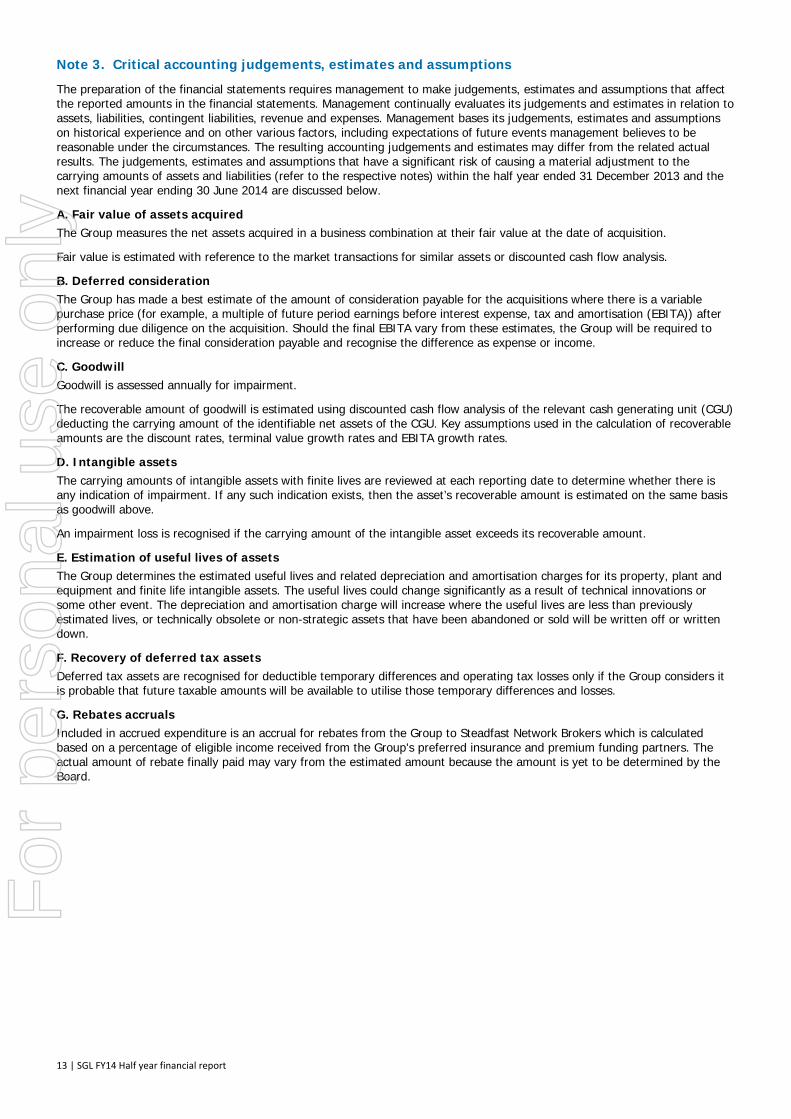
Note 3. Critical accounting judgements, estimates and assumptions
The preparation of the financial statements requires management to make judgements, estimates and assumptions that affect the reported amounts in the financial statements. Management continually evaluates its judgements and estimates in relation to assets, liabilities, contingent liabilities, revenue and expenses. Management bases its judgements, estimates and assumptions on historical experience and on other various factors, including expectations of future events management believes to be reasonable under the circumstances. The resulting accounting judgements and estimates may differ from the related actual results. The judgements, estimates and assumptions that have a significant risk of causing a material adjustment to the carrying amounts of assets and liabilities (refer to the respective notes) within the half year ended 31 December 2013 and the next financial year ending 30 June 2014 are discussed below.
A. Fair value of assets acquired The Group measures the net assets acquired in a business combination at their fair value at the date of acquisition.
Fair value is estimated with reference to the market transactions for similar assets or discounted cash flow analysis.
B. Deferred consideration The Group has made a best estimate of the amount of consideration payable for the acquisitions where there is a variable purchase price (for example, a multiple of future period earnings before interest expense, tax and amortisation (EBITA)) after performing due diligence on the acquisition. Should the final EBITA vary from these estimates, the Group will be required to increase or reduce the final consideration payable and recognise the difference as expense or income.
C. Goodwill Goodwill is assessed annually for impairment.
The recoverable amount of goodwill is estimated using discounted cash flow analysis of the relevant cash generating unit (CGU) deducting the carrying amount of the identifiable net assets of the CGU. Key assumptions used in the calculation of recoverable amounts are the discount rates, terminal value growth rates and EBITA growth rates.
D. Intangible assets The carrying amounts of intangible assets with finite lives are reviewed at each reporting date to determine whether there is any indication of impairment. If any such indication exists, then the asset’s recoverable amount is estimated on the same basis as goodwill above.
An impairment loss is recognised if the carrying amount of the intangible asset exceeds its recoverable amount.
E. Estimation of useful lives of assets The Group determines the estimated useful lives and related depreciation and amortisation charges for its property, plant and equipment and finite life intangible assets. The useful lives could change significantly as a result of technical innovations or some other event. The depreciation and amortisation charge will increase where the useful lives are less than previously estimated lives, or technically obsolete or non-strategic assets that have been abandoned or sold will be written off or written down.
F. Recovery of deferred tax assets Deferred tax assets are recognised for deductible temporary differences and operating tax losses only if the Group considers it is probable that future taxable amounts will be available to utilise those temporary differences and losses.
G. Rebates accruals Included in accrued expenditure is an accrual for rebates from the Group to Steadfast Network Brokers which is calculated based on a percentage of eligible income received from the Group's preferred insurance and premium funding partners. The actual amount of rebate finally paid may vary from the estimated amount because the amount is yet to be determined by the Board.
For
per
sona
l use
onl
y

14 | SGL FY14 Half year financial report
Note 4. Operating segments
The Company’s corporate structure includes equity investments in insurance intermediary entities (insurance broking and underwriting agencies and premium funders) and ancillary businesses. Discrete financial information about each of these entities is reported to management on a regular basis and accordingly management considers each entity to be a discrete business operation. The Company believes that all of the Group’s equity investments in insurance intermediary entities exhibit similar economic characteristics and have therefore been aggregated into a single reporting segment, being the general insurance intermediary sector. This assessment is based on each of the business operations having similar products and services, similar types of customer, employing similar operating processes and procedures and operating within similar regulatory environments. The Group is in the business of distributing and advising on insurance products in Australia, New Zealand and Singapore.
In addition to reviewing performance based on statutory profit after tax, the Chief Operating Decision Maker (being the Managing Director & CEO) also reviews the additional performance measure, earnings before interest expense, tax, and amortisation (EBITA) broken down by consolidated entities, and associates and joint venture.
The additional performance measure, EBITA, and other related information (broken down by consolidated entities, and associates and joint venture) provided on a regular basis to the Chief Operating Decision Maker is outlined in the table below.
31 Dec 2013 31 Dec 2012
Note Insurance
intermediary Other Total Insurance
intermediary $’000 $’000 $’000 $’000 EBITA – consolidated entities 14,698 806 15,504 3,970 Share of EBITA from associates and joint venture 12, 13 11,016 340 11,356 3,047 EBITA from core operations – pre-corporate income/(expenses) 25,714 1,146 26,860 7,017 Corporate income 786 - 786 - Corporate expenses (3,178) - (3,178) (1,057)EBITA from core operations – post-corporate income/(expenses) 23,322 1,146 24,468 5,960 Finance costs – consolidated entities (net of interest received on surplus cash held) 78 - 78 (182)Finance costs – associates and joint venture 12, 13 (491) - (491) - Amortisation expense – consolidated entities (3,051) (110) (3,161) (33)Amortisation expense – associates and joint venture 12, 13 (1,933) (21) (1,954) - Net profit before income tax from core operations before non-recurring items 17,925 1,015 18,940 5,745 Add/(less): non-recurring income/(expenses) Profit on fair value of equity interest in an associate which became a subsidiary 12 4,611 - 4,611 - Due diligence and restructure costs (2,328) - (2,328) (2,718)Share based payment expense on share options and executive loans and shares (6,015) - (6,015) - Write back of interest free executive loans 335 - 335 - Net profit before income tax after non-recurring items 14,528 1,015 15,543 3,027 Income tax expense – consolidated entities (2,965) (208) (3,173) (214)Income tax expense – associates and joint venture 12, 13 (2,571) (102) (2,673) (917)Net profit after income tax expense for the half year 8,992 705 9,697 1,896 Non-controlling interests (804) (61) (865) (29)Net profit after income tax attributable to owners of Steadfast Group Limited 8,188 644 8,832 1,867
For
per
sona
l use
onl
y
15 | SGL FY14 Half year financial report
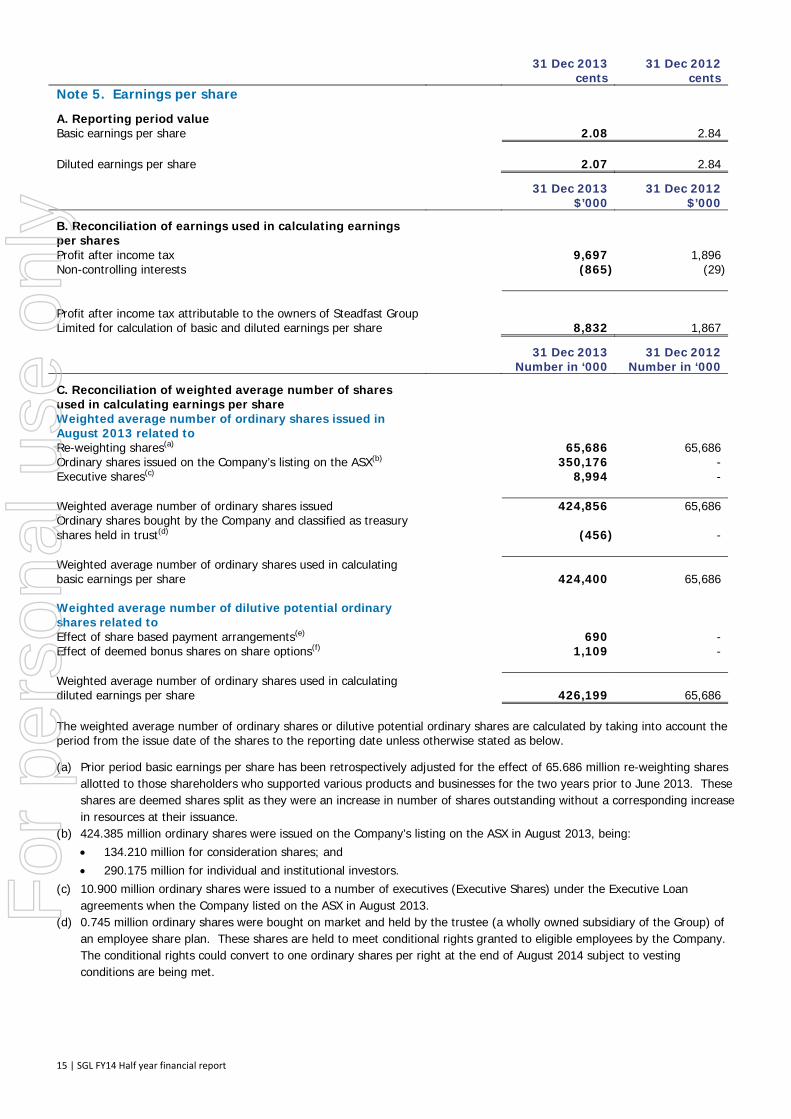
31 Dec 2013 31 Dec 2012 cents centsNote 5. Earnings per share
A. Reporting period value Basic earnings per share 2.08 2.84 Diluted earnings per share 2.07 2.84 31 Dec 2013 31 Dec 2012 $’000 $’000 B. Reconciliation of earnings used in calculating earnings per shares
Profit after income tax 9,697 1,896 Non-controlling interests (865) (29) Profit after income tax attributable to the owners of Steadfast Group Limited for calculation of basic and diluted earnings per share
8,832 1,867
31 Dec 2013 31 Dec 2012 Number in ‘000 Number in ‘000 C. Reconciliation of weighted average number of shares used in calculating earnings per share
Weighted average number of ordinary shares issued in August 2013 related to
Re-weighting shares(a) 65,686 65,686 Ordinary shares issued on the Company’s listing on the ASX(b) 350,176 - Executive shares(c) 8,994 - Weighted average number of ordinary shares issued 424,856 65,686 Ordinary shares bought by the Company and classified as treasury shares held in trust(d)
(456) -
Weighted average number of ordinary shares used in calculating basic earnings per share
424,400 65,686
Weighted average number of dilutive potential ordinary shares related to
Effect of share based payment arrangements(e) 690 - Effect of deemed bonus shares on share options(f) 1,109 - Weighted average number of ordinary shares used in calculating diluted earnings per share
426,199 65,686
The weighted average number of ordinary shares or dilutive potential ordinary shares are calculated by taking into account the period from the issue date of the shares to the reporting date unless otherwise stated as below. (a) Prior period basic earnings per share has been retrospectively adjusted for the effect of 65.686 million re-weighting shares
allotted to those shareholders who supported various products and businesses for the two years prior to June 2013. These shares are deemed shares split as they were an increase in number of shares outstanding without a corresponding increase in resources at their issuance.
(b) 424.385 million ordinary shares were issued on the Company’s listing on the ASX in August 2013, being: 134.210 million for consideration shares; and 290.175 million for individual and institutional investors.
(c) 10.900 million ordinary shares were issued to a number of executives (Executive Shares) under the Executive Loan agreements when the Company listed on the ASX in August 2013.
(d) 0.745 million ordinary shares were bought on market and held by the trustee (a wholly owned subsidiary of the Group) of an employee share plan. These shares are held to meet conditional rights granted to eligible employees by the Company. The conditional rights could convert to one ordinary shares per right at the end of August 2014 subject to vesting conditions are being met.
For
per
sona
l use
onl
y

16 | SGL FY14 Half year financial report
(e) Steadfast has issued share based payment arrangements (being employee conditional rights scheme, short term incentive plan and long term incentive plan) where eligible employees could receive conditional rights instead of cash. One conditional right will convert to one Steadfast’s ordinary share subject to vesting conditions being met. These share based payment arrangements are granted to employees free of costs and no consideration will be paid on conversion to Steadfast’s ordinary shares. These arrangements have a dilutive effect to the basic earnings per share in the current reporting period.
(f) 3.000 million share options were issued to a key management personnel of an acquired business with an exercise price of $1 per share. Because the average share price exceeds the exercise price, 1.109 million shares are deemed to be bonus shares.
Note 6. Dividends
A. Dividends on ordinary shares during the half year No dividends were declared or paid by the Company during the half year ended 31 December 2013 (31 December 2012: $Nil).
B. Dividend reinvestment A Dividend Reinvestment Plan (DRP) operates which allows equity holders to elect to receive their dividend entitlement in the form of the Company’s ordinary shares. The price of DRP shares is the average share market price, less a discount if any (determined by the directors) calculated over the pricing period (which is at least five trading days) as determined by the directors for each dividend payment date.
C. Dividend not recognised at reporting date On 24 February 2014, the Board resolved to pay the following dividend. As this occurred after the reporting date, the dividends declared have not be recognised in this financial report.
Cents per share
Total amount
Expected payment date
Tax rate for franking credit
Percentage franked
$’000 2014 interim dividend 1.8 9,017 14 April 2014 30% 100% The Company’s DRP will operate by issuing ordinary shares to participants by issuing new shares with an issue price per share of the average market price as defined by the DRP terms with no discount applied. The last election notice for participation in the DRP in relation to this interim dividend is 21 March 2014. 31 Dec 2013 30 June 2013 $’000 $’000Note 7. Cash and cash equivalents Cash and cash equivalents 52,151 3,235 Cash held on trust 56,512 8,243 108,663 11,478 31 Dec 2013 30 June 2013 $’000 $’000Note 8. Goodwill Balance at the beginning of the financial period 28,131 - Changes in cash consideration for a subsidiary acquired prior to the Company’s listing
(601) -
Additions through business combinations 230,803 28,131 Reduction in goodwill on part disposal of subsidiaries in hubbing arrangements
(5,641) -
Balance at the end of the financial period 252,692 28,131
For
per
sona
l use
onl
y
17 | SGL FY14 Half year financial report
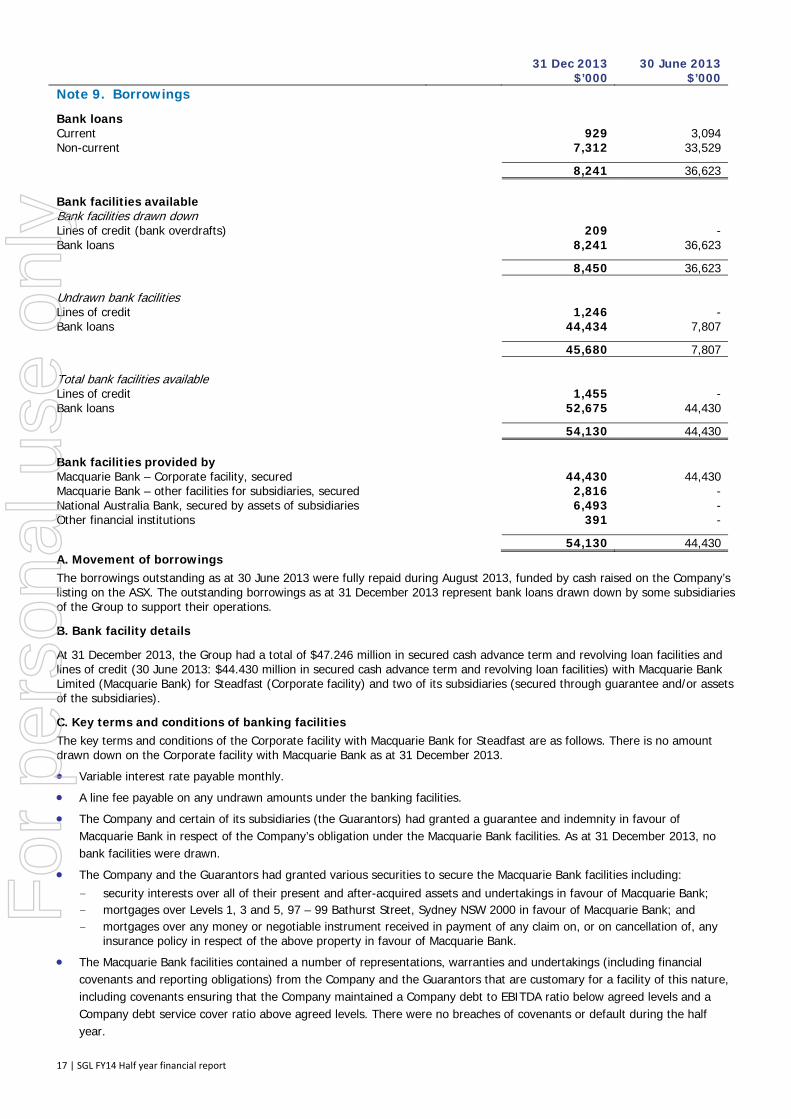
31 Dec 2013 30 June 2013 $’000 $’000Note 9. Borrowings
Bank loans Current 929 3,094 Non-current 7,312 33,529 8,241 36,623 Bank facilities available Bank facilities drawn down Lines of credit (bank overdrafts) 209 - Bank loans 8,241 36,623 8,450 36,623 Undrawn bank facilities Lines of credit 1,246 - Bank loans 44,434 7,807 45,680 7,807 Total bank facilities available Lines of credit 1,455 - Bank loans 52,675 44,430 54,130 44,430 Bank facilities provided by Macquarie Bank – Corporate facility, secured 44,430 44,430 Macquarie Bank – other facilities for subsidiaries, secured 2,816 - National Australia Bank, secured by assets of subsidiaries 6,493 - Other financial institutions 391 - 54,130 44,430 A. Movement of borrowings The borrowings outstanding as at 30 June 2013 were fully repaid during August 2013, funded by cash raised on the Company’s listing on the ASX. The outstanding borrowings as at 31 December 2013 represent bank loans drawn down by some subsidiaries of the Group to support their operations.
B. Bank facility details
At 31 December 2013, the Group had a total of $47.246 million in secured cash advance term and revolving loan facilities and lines of credit (30 June 2013: $44.430 million in secured cash advance term and revolving loan facilities) with Macquarie Bank Limited (Macquarie Bank) for Steadfast (Corporate facility) and two of its subsidiaries (secured through guarantee and/or assets of the subsidiaries).
C. Key terms and conditions of banking facilities The key terms and conditions of the Corporate facility with Macquarie Bank for Steadfast are as follows. There is no amount drawn down on the Corporate facility with Macquarie Bank as at 31 December 2013.
Variable interest rate payable monthly.
A line fee payable on any undrawn amounts under the banking facilities.
The Company and certain of its subsidiaries (the Guarantors) had granted a guarantee and indemnity in favour of Macquarie Bank in respect of the Company’s obligation under the Macquarie Bank facilities. As at 31 December 2013, no bank facilities were drawn.
The Company and the Guarantors had granted various securities to secure the Macquarie Bank facilities including: - security interests over all of their present and after-acquired assets and undertakings in favour of Macquarie Bank; - mortgages over Levels 1, 3 and 5, 97 – 99 Bathurst Street, Sydney NSW 2000 in favour of Macquarie Bank; and - mortgages over any money or negotiable instrument received in payment of any claim on, or on cancellation of, any
insurance policy in respect of the above property in favour of Macquarie Bank.
The Macquarie Bank facilities contained a number of representations, warranties and undertakings (including financial covenants and reporting obligations) from the Company and the Guarantors that are customary for a facility of this nature, including covenants ensuring that the Company maintained a Company debt to EBITDA ratio below agreed levels and a Company debt service cover ratio above agreed levels. There were no breaches of covenants or default during the half year.
For
per
sona
l use
onl
y

18 | SGL FY14 Half year financial report
Note 10. Notes to the statement of changes in equity and reserves
A. Share capital 31 Dec 2013 30 June 2013 31 Dec 2013 30 June 2013
Number of
shares in 000’sNumber of
shares in 000’s $’000 $’000 Reconciliation of movements Balance at the beginning of the financial period 1 1 317
317
Conversion to preferred capital shares* (1) - - - Shares issued in August 2013 on the Company’s listing on the ASX 500,971 - 498,944
-
Less: Transaction costs on issue of ordinary shares, net of income tax - - (12,117) - Balance at the end of the financial period 500,971 1 487,144 317 In August 2013, the Company issued a total of 500.971 million ordinary shares that were allotted as follows.
Purpose of allotment of shares Number of
shares in ’000
Amount per share
$Total amount
$’000
Cash received/ receivable
$’000 Re-weighting shares 65,686 - - - Executive shares 10,900 1.00 10,900 10,900 Consideration shares for acquisitions 134,210 1.15 154,341 - Individual and institutional investors 290,175 1.15 333,703 333,703 500,971 498,944 344,603
* In addition, 1,395 ordinary shares on issue at 30 June 2013 were converted into 1,395 preferred capital shares. These preferred capital shares were cancelled in November 2013 following member approval.
B. Treasury shares held in trust 31 Dec 2013 30 June 2013 31 Dec 2013 30 June 2013
Number of
shares in ’000Number of
shares in ’000 $’000 $’000 Reconciliation of movements Shares acquired 745 - (1,057) - Balance at the end of the financial period 745 - (1,057) -
Treasury shares are ordinary shares of Steadfast bought on market by the trustee (a wholly owned subsidiary of the Group) of an employee share plan for meeting future obligations under that plan when conditional rights vest and shares allocated to participants.
C. Nature and purpose of reserves i. Foreign currency translation reserve The foreign currency translation reserve records the foreign currency differences from the translation of the financial information of foreign operations that have a functional currency other than Australian dollars.
ii. Share based payments reserve The share based payments reserve is used to recognise the fair value at grant date of equity settled share based remuneration provided to employees and a key management personnel of an operation and is the discount on executive shares.
ii. Other reserves The other reserves are used to recognise other movements in equity including the fair value of a put option issued to a subsidiary’s shareholder over that subsidiary’s shares and the net effect on disposal of partial equity ownership in subsidiaries without loss of control.
For
per
sona
l use
onl
y
19 | SGL FY14 Half year financial report
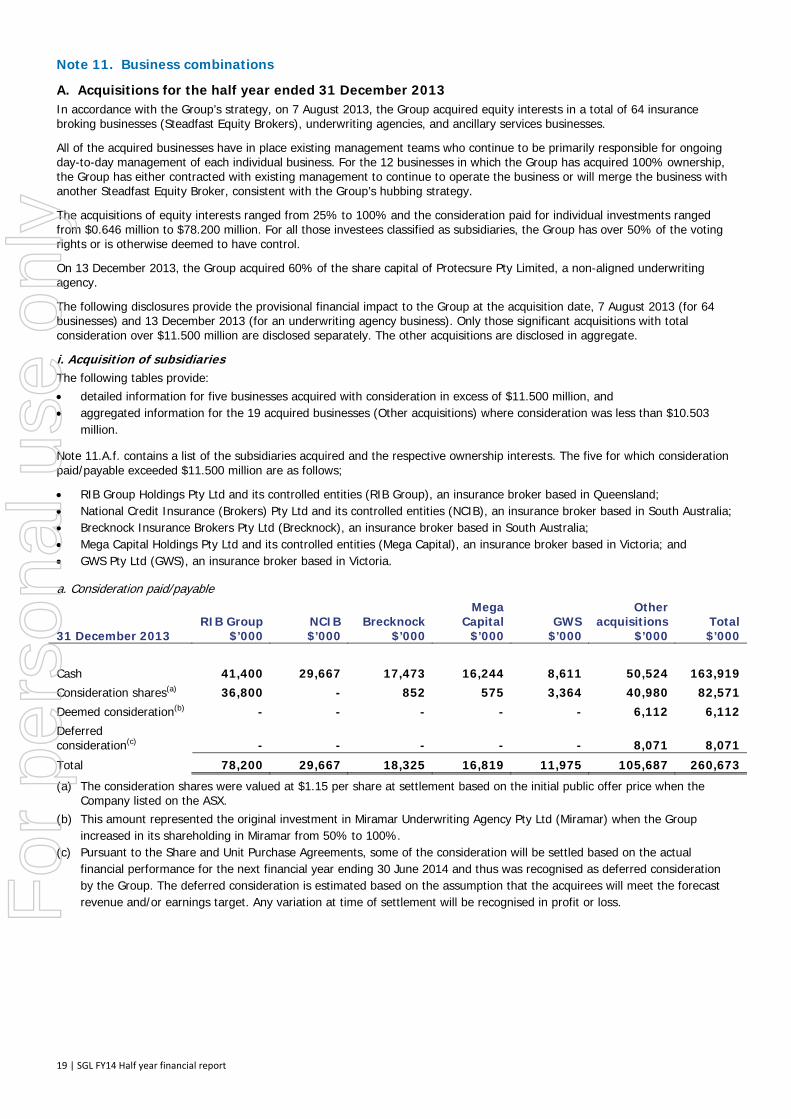
Note 11. Business combinations
A. Acquisitions for the half year ended 31 December 2013 In accordance with the Group’s strategy, on 7 August 2013, the Group acquired equity interests in a total of 64 insurance broking businesses (Steadfast Equity Brokers), underwriting agencies, and ancillary services businesses.
All of the acquired businesses have in place existing management teams who continue to be primarily responsible for ongoing day-to-day management of each individual business. For the 12 businesses in which the Group has acquired 100% ownership, the Group has either contracted with existing management to continue to operate the business or will merge the business with another Steadfast Equity Broker, consistent with the Group’s hubbing strategy.
The acquisitions of equity interests ranged from 25% to 100% and the consideration paid for individual investments ranged from $0.646 million to $78.200 million. For all those investees classified as subsidiaries, the Group has over 50% of the voting rights or is otherwise deemed to have control.
On 13 December 2013, the Group acquired 60% of the share capital of Protecsure Pty Limited, a non-aligned underwriting agency.
The following disclosures provide the provisional financial impact to the Group at the acquisition date, 7 August 2013 (for 64 businesses) and 13 December 2013 (for an underwriting agency business). Only those significant acquisitions with total consideration over $11.500 million are disclosed separately. The other acquisitions are disclosed in aggregate.
i. Acquisition of subsidiaries The following tables provide: detailed information for five businesses acquired with consideration in excess of $11.500 million, and aggregated information for the 19 acquired businesses (Other acquisitions) where consideration was less than $10.503
million.
Note 11.A.f. contains a list of the subsidiaries acquired and the respective ownership interests. The five for which consideration paid/payable exceeded $11.500 million are as follows;
RIB Group Holdings Pty Ltd and its controlled entities (RIB Group), an insurance broker based in Queensland; National Credit Insurance (Brokers) Pty Ltd and its controlled entities (NCIB), an insurance broker based in South Australia; Brecknock Insurance Brokers Pty Ltd (Brecknock), an insurance broker based in South Australia; Mega Capital Holdings Pty Ltd and its controlled entities (Mega Capital), an insurance broker based in Victoria; and GWS Pty Ltd (GWS), an insurance broker based in Victoria.
a. Consideration paid/payable
RIB Group NCIB BrecknockMega
Capital GWS Other
acquisitions Total31 December 2013 $’000 $’000 $’000 $’000 $’000 $’000 $’000 Cash 41,400 29,667 17,473 16,244 8,611 50,524 163,919Consideration shares(a) 36,800 - 852 575 3,364 40,980 82,571Deemed consideration(b) - - - - - 6,112 6,112Deferred consideration(c) - - - - - 8,071 8,071
Total 78,200 29,667 18,325 16,819 11,975 105,687 260,673
(a) The consideration shares were valued at $1.15 per share at settlement based on the initial public offer price when the Company listed on the ASX.
(b) This amount represented the original investment in Miramar Underwriting Agency Pty Ltd (Miramar) when the Group increased in its shareholding in Miramar from 50% to 100%.
(c) Pursuant to the Share and Unit Purchase Agreements, some of the consideration will be settled based on the actual financial performance for the next financial year ending 30 June 2014 and thus was recognised as deferred consideration by the Group. The deferred consideration is estimated based on the assumption that the acquirees will meet the forecast revenue and/or earnings target. Any variation at time of settlement will be recognised in profit or loss.
For
per
sona
l use
onl
y
20 | SGL FY14 Half year financial report
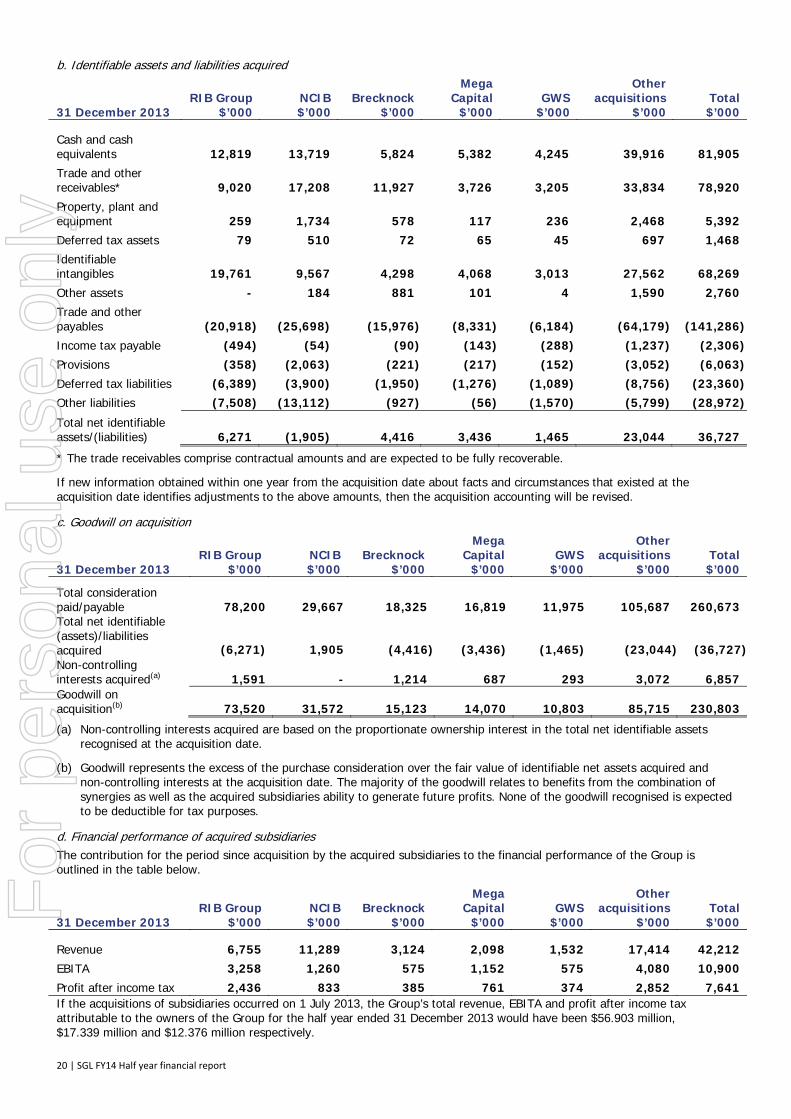
b. Identifiable assets and liabilities acquired
RIB Group NCIB BrecknockMega
Capital GWS Other
acquisitions Total31 December 2013 $’000 $’000 $’000 $’000 $’000 $’000 $’000 Cash and cash equivalents 12,819 13,719 5,824 5,382 4,245 39,916 81,905Trade and other receivables* 9,020 17,208 11,927 3,726 3,205 33,834 78,920Property, plant and equipment 259 1,734 578 117 236 2,468 5,392Deferred tax assets 79 510 72 65 45 697 1,468Identifiable intangibles 19,761 9,567 4,298 4,068 3,013 27,562 68,269Other assets - 184 881 101 4 1,590 2,760Trade and other payables (20,918) (25,698) (15,976) (8,331) (6,184) (64,179) (141,286)Income tax payable (494) (54) (90) (143) (288) (1,237) (2,306)Provisions (358) (2,063) (221) (217) (152) (3,052) (6,063)Deferred tax liabilities (6,389) (3,900) (1,950) (1,276) (1,089) (8,756) (23,360)Other liabilities (7,508) (13,112) (927) (56) (1,570) (5,799) (28,972)
Total net identifiable assets/(liabilities) 6,271 (1,905) 4,416 3,436 1,465 23,044 36,727
* The trade receivables comprise contractual amounts and are expected to be fully recoverable.
If new information obtained within one year from the acquisition date about facts and circumstances that existed at the acquisition date identifies adjustments to the above amounts, then the acquisition accounting will be revised.
c. Goodwill on acquisition
RIB Group NCIB BrecknockMega
Capital GWS Other
acquisitions Total31 December 2013 $’000 $’000 $’000 $’000 $’000 $’000 $’000 Total consideration paid/payable 78,200 29,667 18,325 16,819 11,975 105,687 260,673Total net identifiable (assets)/liabilities acquired (6,271) 1,905 (4,416) (3,436) (1,465) (23,044) (36,727)Non-controlling interests acquired(a) 1,591 - 1,214 687 293 3,072 6,857Goodwill on acquisition(b) 73,520 31,572 15,123 14,070 10,803 85,715 230,803
(a) Non-controlling interests acquired are based on the proportionate ownership interest in the total net identifiable assets recognised at the acquisition date.
(b) Goodwill represents the excess of the purchase consideration over the fair value of identifiable net assets acquired and non-controlling interests at the acquisition date. The majority of the goodwill relates to benefits from the combination of synergies as well as the acquired subsidiaries ability to generate future profits. None of the goodwill recognised is expected to be deductible for tax purposes.
d. Financial performance of acquired subsidiaries The contribution for the period since acquisition by the acquired subsidiaries to the financial performance of the Group is outlined in the table below.
RIB Group NCIB Brecknock
Mega Capital GWS
Other acquisitions Total
31 December 2013 $’000 $’000 $’000 $’000 $’000 $’000 $’000 Revenue 6,755 11,289 3,124 2,098 1,532 17,414 42,212EBITA 3,258 1,260 575 1,152 575 4,080 10,900Profit after income tax 2,436 833 385 761 374 2,852 7,641If the acquisitions of subsidiaries occurred on 1 July 2013, the Group’s total revenue, EBITA and profit after income tax attributable to the owners of the Group for the half year ended 31 December 2013 would have been $56.903 million, $17.339 million and $12.376 million respectively.
For
per
sona
l use
onl
y
21 | SGL FY14 Half year financial report
e. Acquisition-related costs The Group incurred acquisition-related costs, being external legal fees and due diligence costs for business interests acquired during the half year ended 31 December 2013. The amounts incurred could not be separately identified by individual acquisition as there were concurrent acquisition activities for all businesses acquired throughout the half year.
The legal fees and due diligence costs have been included in due diligence and restructure costs in the Group’s consolidated statement of comprehensive income.
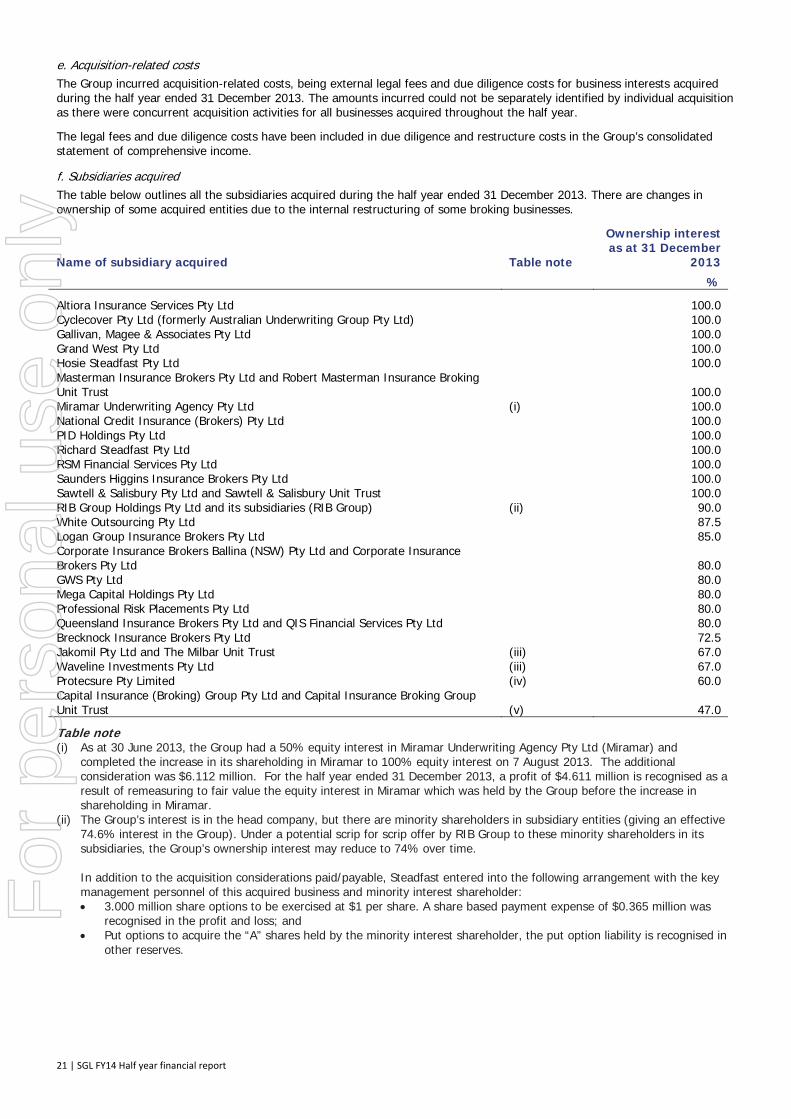
f. Subsidiaries acquired The table below outlines all the subsidiaries acquired during the half year ended 31 December 2013. There are changes in ownership of some acquired entities due to the internal restructuring of some broking businesses.
Name of subsidiary acquired Table note
Ownership interest as at 31 December
2013
% Altiora Insurance Services Pty Ltd 100.0 Cyclecover Pty Ltd (formerly Australian Underwriting Group Pty Ltd) 100.0 Gallivan, Magee & Associates Pty Ltd 100.0 Grand West Pty Ltd 100.0 Hosie Steadfast Pty Ltd 100.0Masterman Insurance Brokers Pty Ltd and Robert Masterman Insurance Broking Unit Trust 100.0 Miramar Underwriting Agency Pty Ltd (i) 100.0 National Credit Insurance (Brokers) Pty Ltd 100.0 PID Holdings Pty Ltd 100.0 Richard Steadfast Pty Ltd 100.0RSM Financial Services Pty Ltd 100.0Saunders Higgins Insurance Brokers Pty Ltd 100.0 Sawtell & Salisbury Pty Ltd and Sawtell & Salisbury Unit Trust 100.0 RIB Group Holdings Pty Ltd and its subsidiaries (RIB Group) (ii) 90.0 White Outsourcing Pty Ltd 87.5 Logan Group Insurance Brokers Pty Ltd 85.0 Corporate Insurance Brokers Ballina (NSW) Pty Ltd and Corporate Insurance Brokers Pty Ltd 80.0 GWS Pty Ltd 80.0 Mega Capital Holdings Pty Ltd 80.0 Professional Risk Placements Pty Ltd 80.0 Queensland Insurance Brokers Pty Ltd and QIS Financial Services Pty Ltd 80.0 Brecknock Insurance Brokers Pty Ltd 72.5 Jakomil Pty Ltd and The Milbar Unit Trust (iii) 67.0 Waveline Investments Pty Ltd (iii) 67.0 Protecsure Pty Limited (iv) 60.0 Capital Insurance (Broking) Group Pty Ltd and Capital Insurance Broking Group Unit Trust (v) 47.0 Table note (i) As at 30 June 2013, the Group had a 50% equity interest in Miramar Underwriting Agency Pty Ltd (Miramar) and
completed the increase in its shareholding in Miramar to 100% equity interest on 7 August 2013. The additional consideration was $6.112 million. For the half year ended 31 December 2013, a profit of $4.611 million is recognised as a result of remeasuring to fair value the equity interest in Miramar which was held by the Group before the increase in shareholding in Miramar.
(ii) The Group’s interest is in the head company, but there are minority shareholders in subsidiary entities (giving an effective 74.6% interest in the Group). Under a potential scrip for scrip offer by RIB Group to these minority shareholders in its subsidiaries, the Group’s ownership interest may reduce to 74% over time. In addition to the acquisition considerations paid/payable, Steadfast entered into the following arrangement with the key management personnel of this acquired business and minority interest shareholder: 3.000 million share options to be exercised at $1 per share. A share based payment expense of $0.365 million was
recognised in the profit and loss; and Put options to acquire the “A” shares held by the minority interest shareholder, the put option liability is recognised in
other reserves.
For
per
sona
l use
onl
y
22 | SGL FY14 Half year financial report
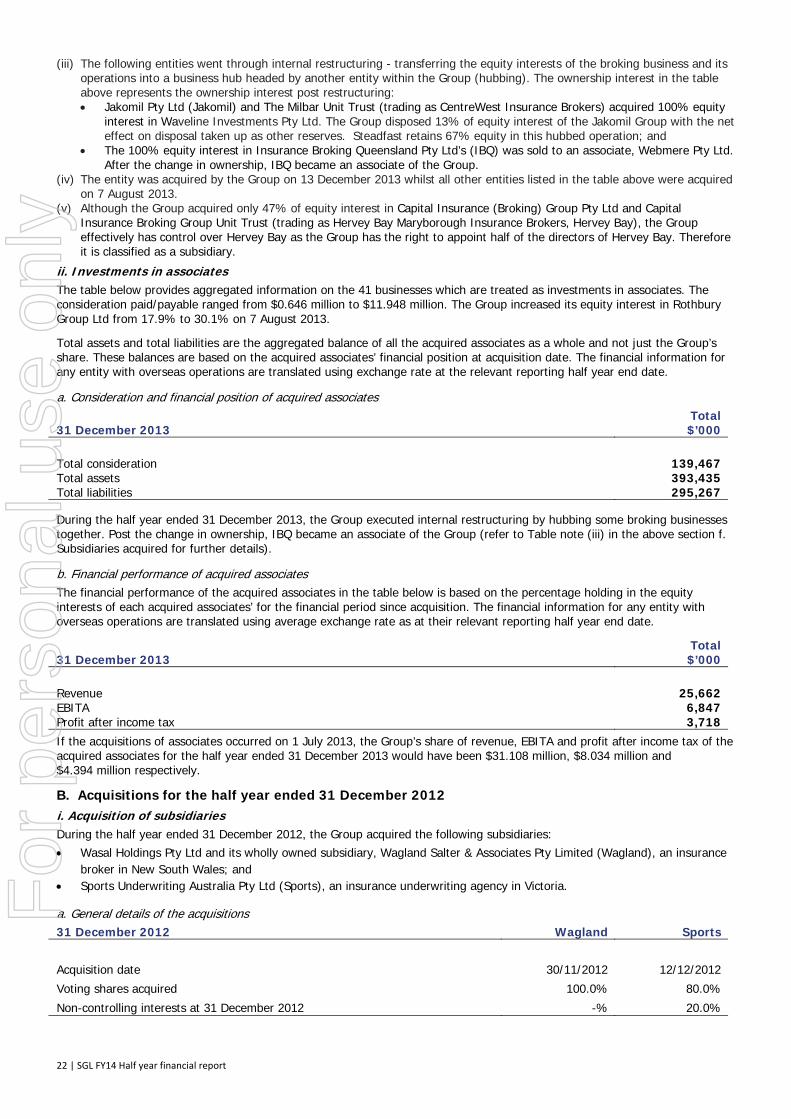
(iii) The following entities went through internal restructuring - transferring the equity interests of the broking business and its operations into a business hub headed by another entity within the Group (hubbing). The ownership interest in the table above represents the ownership interest post restructuring: Jakomil Pty Ltd (Jakomil) and The Milbar Unit Trust (trading as CentreWest Insurance Brokers) acquired 100% equity
interest in Waveline Investments Pty Ltd. The Group disposed 13% of equity interest of the Jakomil Group with the net effect on disposal taken up as other reserves. Steadfast retains 67% equity in this hubbed operation; and
The 100% equity interest in Insurance Broking Queensland Pty Ltd’s (IBQ) was sold to an associate, Webmere Pty Ltd. After the change in ownership, IBQ became an associate of the Group.
(iv) The entity was acquired by the Group on 13 December 2013 whilst all other entities listed in the table above were acquired on 7 August 2013.
(v) Although the Group acquired only 47% of equity interest in Capital Insurance (Broking) Group Pty Ltd and Capital Insurance Broking Group Unit Trust (trading as Hervey Bay Maryborough Insurance Brokers, Hervey Bay), the Group effectively has control over Hervey Bay as the Group has the right to appoint half of the directors of Hervey Bay. Therefore it is classified as a subsidiary.
ii. Investments in associates The table below provides aggregated information on the 41 businesses which are treated as investments in associates. The consideration paid/payable ranged from $0.646 million to $11.948 million. The Group increased its equity interest in Rothbury Group Ltd from 17.9% to 30.1% on 7 August 2013.
Total assets and total liabilities are the aggregated balance of all the acquired associates as a whole and not just the Group’s share. These balances are based on the acquired associates’ financial position at acquisition date. The financial information for any entity with overseas operations are translated using exchange rate at the relevant reporting half year end date.
a. Consideration and financial position of acquired associates Total 31 December 2013 $’000 Total consideration 139,467Total assets 393,435Total liabilities 295,267 During the half year ended 31 December 2013, the Group executed internal restructuring by hubbing some broking businesses together. Post the change in ownership, IBQ became an associate of the Group (refer to Table note (iii) in the above section f. Subsidiaries acquired for further details).
b. Financial performance of acquired associates The financial performance of the acquired associates in the table below is based on the percentage holding in the equity interests of each acquired associates’ for the financial period since acquisition. The financial information for any entity with overseas operations are translated using average exchange rate as at their relevant reporting half year end date.
Total 31 December 2013 $’000 Revenue 25,662EBITA 6,847Profit after income tax 3,718If the acquisitions of associates occurred on 1 July 2013, the Group’s share of revenue, EBITA and profit after income tax of the acquired associates for the half year ended 31 December 2013 would have been $31.108 million, $8.034 million and $4.394 million respectively.
B. Acquisitions for the half year ended 31 December 2012 i. Acquisition of subsidiaries During the half year ended 31 December 2012, the Group acquired the following subsidiaries: Wasal Holdings Pty Ltd and its wholly owned subsidiary, Wagland Salter & Associates Pty Limited (Wagland), an insurance
broker in New South Wales; and Sports Underwriting Australia Pty Ltd (Sports), an insurance underwriting agency in Victoria.
a. General details of the acquisitions 31 December 2012 Wagland Sports Acquisition date 30/11/2012 12/12/2012
Voting shares acquired 100.0% 80.0%
Non-controlling interests at 31 December 2012 -% 20.0%
For
per
sona
l use
onl
y

23 | SGL FY14 Half year financial report
b. Consideration transferred Wagland Sports
31 December 2012 $’000 $’000 Cash 4,055 3,733 Deferred consideration - shares(a) 1,554 5,750 Deferred consideration(b) - 1,036Total 5,609 10,519
(a) On 7 August 2013, 25% and 50%, respectively of the purchase price for Wagland and Sports were settled with ordinary shares issued by the Company. The shares are valued at $1.15 per share based on the initial public offer price when the Company listed on the ASX. As at 30 June 2013, these amounts were classified as current liabilities as part of trade and other payables as the amounts were expected to be settled as cash if the listing of the Company was not successful.
(b) The deferred consideration for Sports was subject to adjustment based on EBITA for the financial year ended 30 June 2013. The amount recognised was based on 2013 actual EBITA and was subsequently settled at a lower amount than the forecast EBITA at date of acquisition.
c. Identifiable assets and liabilities acquired Wagland Sports
31 December 2012 $’000 $’000 Cash and cash equivalents 1,596 1,925 Trade and other receivables* 1,398 3,701 Property, plant and equipment 67 48 Deferred tax assets 81 13 Identifiable intangibles 972 3,000 Other assets 30 - Trade and other payables (2,549) (4,700)Income tax payable (67) (164)Provisions (268) (34)Deferred tax liabilities (408) (1,073)Total net identifiable assets 852 2,716
* The trade receivables comprise contractual amounts and are expected to be fully recoverable.
d. Goodwill on acquisition Wagland Sports
31 December 2012 $’000 $’000 Total consideration paid 5,609 10,519 Total net identifiable assets acquired (852) (2,716)Non-controlling interests acquired(a) - 543 Goodwill on acquisition(b) 4,757 8,346
(a) Non-controlling interests acquired are based on the proportionate ownership interest in the total net identifiable assets recognised at the acquisition date.
(b) Goodwill represents the excess of the purchase consideration over the fair value of identifiable net assets acquired and non-controlling interests at the acquisition date. The majority of the goodwill relates to benefits from the combination of synergies as well as the acquired subsidiaries ability to generate future profits. None of the goodwill recognised is expected to be deductible for tax purposes.
Goodwill on acquisition for Sports was reduced to reflect the final calculation of consideration shares. Cash was received subsequently and therefore reflected as reduction to goodwill.
e. Financial performance of acquired subsidiaries The contribution by the acquired subsidiaries to the financial performance of the Group was not material from the acquisition date to 31 December 2012.
f. Acquisition-related costs The Group incurred acquisition-related costs, being legal fees and due diligence costs for businesses acquired. They could not be separately identified by individual acquisition as there were concurrent acquisition activities for all businesses acquired throughout the financial periods.
For
per
sona
l use
onl
y

24 | SGL FY14 Half year financial report
Note 12. Investments in associates 31 Dec 2013 30 June 2013 $’000 $’000Reconciliation of movements Balance at the beginning of the financial period 8,219 1,543 Acquisition of associates 139,467 6,360 Write down of investment in an associate being deregistered - (24)Reclassification of investment in an associate to investment in subsidiaries* (1,501) - Reclassification of investment in a subsidiary to investment in associates due to hubbing arrangement 47 - Share of EBITA from associates 7,794 824 Less share of: Finance costs (376) (17)Amortisation expense (1,465) (29)Income tax expense (1,786) (232) Share of associates’ profit after income tax 4,167 546 Dividend received/receivable (1,146) (430)Net foreign exchange movements 850 224 Balance at the end of the financial period 150,103 8,219 * Represents the carrying value of 50% equity interest in Miramar Underwriting Agency Pty Ltd (Miramar) as at 7 August
2013 prior to deemed disposal of investment in associate. As at 30 June 2013, the Group had a 50% equity interest in Miramar and completed the increase in its shareholding in Miramar to 100% equity interest on 7 August 2013. The additional consideration was $6.112 million. For the half year ended 31 December 2013, a profit of $4.611 million is recognised as a result of remeasuring to fair value the equity interest in Miramar which is held by the Group before the increase in shareholding in Miramar.
Note 13. Interest in joint venture 31 Dec 2013 30 June 2013 $’000 $’000Reconciliation of movements Balance at the beginning of the financial period 3,593 2,462 Additional investment in joint venture - 1,206 Share of EBITA from joint venture 3,562 3,648 Less share of: Finance costs (115) - Amortisation expense (489) (206)Income tax expense (887) (1,056) Share of joint venture’s profit after income tax 2,071 2,386 Dividend received/receivable (2,364) (2,461) Balance at the end of the financial period 3,300 3,593 Note 14. Related party transactions
A. Transactions with subsidiaries All transactions that have occurred among the subsidiaries within the Group have been eliminated for consolidation purposes.
B. Transactions with other related parties The following transactions occurred with related parties: 31 Dec 2013 31 Dec 2012 $ $ i. Sale of goods and services Marketing and administration fees received from Directors' and former Directors' related entities on normal commercial terms 25,997 21,985 Marketing and administration fees received from associates on normal commercial terms 64,639 - Marketing and administration fees received from joint venture on normal commercial terms 1,491,587 953,114 Commission income received/receivable from associates on normal commercial terms 48,096 - ii. Interest income Interest income received/receivable from joint venture 219,408 -
For
per
sona
l use
onl
y
25 | SGL FY14 Half year financial report
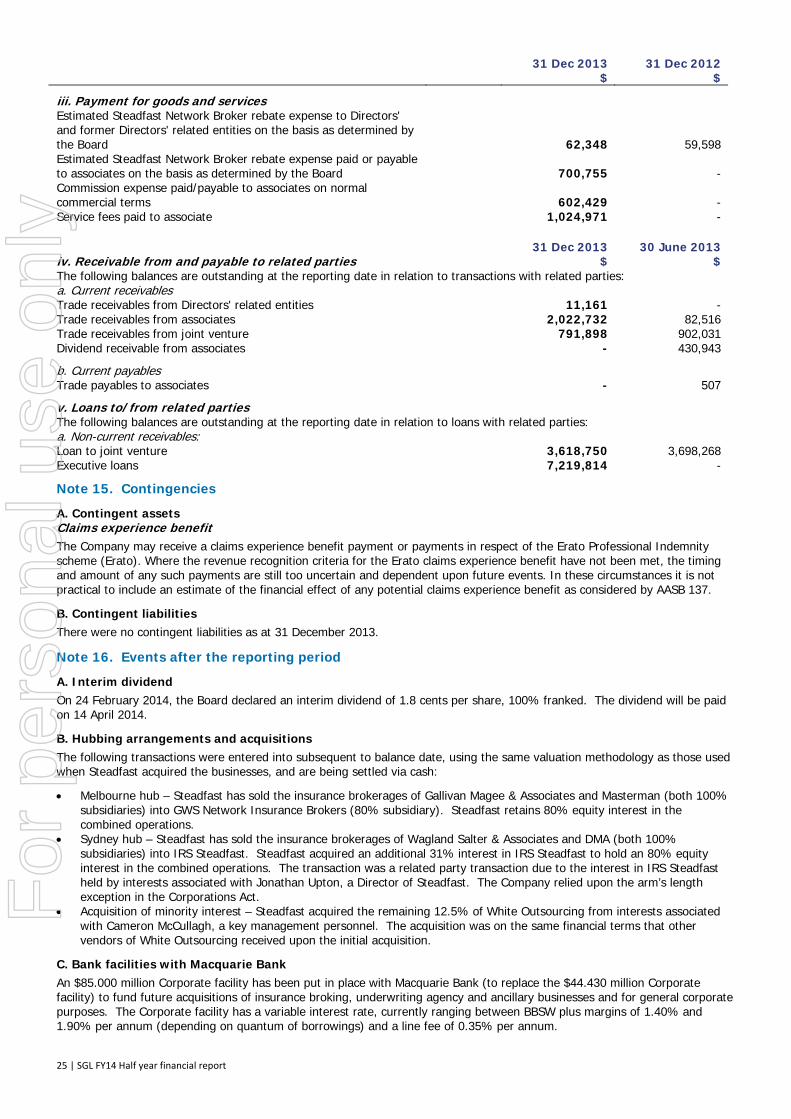
31 Dec 2013 31 Dec 2012 $ $ iii. Payment for goods and services Estimated Steadfast Network Broker rebate expense to Directors' and former Directors' related entities on the basis as determined by the Board 62,348 59,598 Estimated Steadfast Network Broker rebate expense paid or payable to associates on the basis as determined by the Board 700,755 - Commission expense paid/payable to associates on normal commercial terms 602,429 - Service fees paid to associate 1,024,971 - 31 Dec 2013 30 June 2013iv. Receivable from and payable to related parties $ $The following balances are outstanding at the reporting date in relation to transactions with related parties: a. Current receivables Trade receivables from Directors' related entities 11,161 - Trade receivables from associates 2,022,732 82,516 Trade receivables from joint venture 791,898 902,031 Dividend receivable from associates - 430,943
b. Current payables Trade payables to associates - 507
v. Loans to/from related parties The following balances are outstanding at the reporting date in relation to loans with related parties: a. Non-current receivables: Loan to joint venture 3,618,750 3,698,268 Executive loans 7,219,814 -
Note 15. Contingencies
A. Contingent assets Claims experience benefit The Company may receive a claims experience benefit payment or payments in respect of the Erato Professional Indemnity scheme (Erato). Where the revenue recognition criteria for the Erato claims experience benefit have not been met, the timing and amount of any such payments are still too uncertain and dependent upon future events. In these circumstances it is not practical to include an estimate of the financial effect of any potential claims experience benefit as considered by AASB 137.
B. Contingent liabilities There were no contingent liabilities as at 31 December 2013.
Note 16. Events after the reporting period
A. Interim dividend On 24 February 2014, the Board declared an interim dividend of 1.8 cents per share, 100% franked. The dividend will be paid on 14 April 2014.
B. Hubbing arrangements and acquisitions The following transactions were entered into subsequent to balance date, using the same valuation methodology as those used when Steadfast acquired the businesses, and are being settled via cash:
Melbourne hub – Steadfast has sold the insurance brokerages of Gallivan Magee & Associates and Masterman (both 100% subsidiaries) into GWS Network Insurance Brokers (80% subsidiary). Steadfast retains 80% equity interest in the combined operations.
Sydney hub – Steadfast has sold the insurance brokerages of Wagland Salter & Associates and DMA (both 100% subsidiaries) into IRS Steadfast. Steadfast acquired an additional 31% interest in IRS Steadfast to hold an 80% equity interest in the combined operations. The transaction was a related party transaction due to the interest in IRS Steadfast held by interests associated with Jonathan Upton, a Director of Steadfast. The Company relied upon the arm’s length exception in the Corporations Act.
Acquisition of minority interest – Steadfast acquired the remaining 12.5% of White Outsourcing from interests associated with Cameron McCullagh, a key management personnel. The acquisition was on the same financial terms that other vendors of White Outsourcing received upon the initial acquisition.
C. Bank facilities with Macquarie Bank An $85.000 million Corporate facility has been put in place with Macquarie Bank (to replace the $44.430 million Corporate facility) to fund future acquisitions of insurance broking, underwriting agency and ancillary businesses and for general corporate purposes. The Corporate facility has a variable interest rate, currently ranging between BBSW plus margins of 1.40% and 1.90% per annum (depending on quantum of borrowings) and a line fee of 0.35% per annum.
For
per
sona
l use
onl
y

For
per
sona
l use
onl
y
KPMG, an Australian partnership and a member firm of the KPMG network of independent member firms affiliated with KPMG International Cooperative (“KPMG International”), a Swiss entity
Liability limited by a scheme approved under Professional Standards Legislation.
Independent auditor’s review report to the members of Steadfast Group Limited
Report on the financial report We have reviewed the accompanying half-year financial report of Steadfast Group Limited, which comprises the consolidated statement of financial position as at 31 December 2013, consolidated statement of comprehensive income, consolidated statement of changes in equity and consolidated statement of cash flows for the half-year ended on that date, notes 1 to 16 comprising a summary of significant accounting policies and other explanatory information and the directors’ declaration of the Group comprising the company and the entities it controlled at the half-year’s end or from time to time during the half-year.
Directors’ responsibility for the half-year financial report
The directors of the company are responsible for the preparation of the half-year financial report that gives a true and fair view in accordance with Australian Accounting Standards and the Corporations Act 2001 and for such internal control as the directors determine is necessary to enable the preparation of the half-year financial report that is free from material misstatement, whether due to fraud or error.
Auditor’s responsibility
Our responsibility is to express a conclusion on the half-year financial report based on our review. We conducted our review in accordance with Auditing Standard on Review Engagements ASRE 2410 Review of a Financial Report Performed by the Independent Auditor of the Entity, in order to state whether, on the basis of the procedures described, we have become aware of any matter that makes us believe that the half-year financial report is not in accordance with the Corporations Act 2001 including: giving a true and fair view of the Group’s financial position as at 31 December 2013 and its performance for the half-year ended on that date; and complying with Australian Accounting Standard AASB 134 Interim Financial Reporting and the Corporations Regulations 2001. As auditor of Steadfast Group Limited, ASRE 2410 requires that we comply with the ethical requirements relevant to the audit of the annual financial report.
A review of a half-year financial report consists of making enquiries, primarily of persons responsible for financial and accounting matters, and applying analytical and other review procedures. A review is substantially less in scope than an audit conducted in accordance with Australian Auditing Standards and consequently does not enable us to obtain assurance that we would become aware of all significant matters that might be identified in an audit. Accordingly, we do not express an audit opinion.
Independence
In conducting our review, we have complied with the independence requirements of the Corporations Act 2001.
27
For
per
sona
l use
onl
y
Conclusion
Based on our review, which is not an audit, we have not become aware of any matter that makes us believe that the half-year financial report of Steadfast Group Limited is not in accordance with the Corporations Act 2001, including:
(a) giving a true and fair view of the Group’s financial position as at 31 December 2013 and of its performance for the half-year ended on that date; and
(b) complying with Australian Accounting Standard AASB 134 Interim Financial Reporting and the Corporations Regulations 2001.
KPMG
Andrew Dickinson Partner
Sydney
24 February 2014 28
For
per
sona
l use
onl
y

Postal AddressLocked Bag A14Sydney South NSW 1235
Phone: 1300 554 474 Email: [email protected]
Corporate O�ceSteadfastLevel 399 Bathurst StSydney NSW 2000
Postal AddressPO Box A980Sydney South NSW 1235
Phone: 02 9495 6500 Email: [email protected] Website: www.steadfast.com.au
Share RegistryLink Market ServicesLevel 12680 George StSydney NSW 2000
Stock ListingThe Steadfast Group shares are listed on the Australian Stock Exchange ASX code: SDF
For
per
sona
l use
onl
y

Steadfast Group LimitedABN 98 073 659 677
www.steadfast.com.au
For
per
sona
l use
onl
y