for personal use only...2020/04/27 · 5,368 5,481 2,692 2,789 fy16 fy17 1h17 2h17 total revenue...
TRANSCRIPT

For
per
sona
l use
onl
y
Overview 3
1H20 Financials 10
Update On Long-term Strategy 26
Additional Information 34
Divisional Performances 34
NAB And Our Community 40
Australian Customer Experience 50
Australian Business Lending 57
Australian Housing Lending 61
Other Australian Products 68
New Zealand Banking 71
Group Asset Quality 75
Capital & Funding 85
Economics 97
Other Information 103
NAB 2020 HALF YEAR RESULTS INDEXThis presentation is general background information about NAB. It is intended to be used by a professional analyst audience and is not intended to be relied upon as financial advice. Refer to page 107 for legal disclaimer.
Financial information in this presentation is based on cash earnings, which is not a statutory financial measure. Refer to page 104 for definition of cash earnings and reconciliation to statutory net profit.
OVERVIEW
ROSS McEWANGroup Chief Executive Officer
For
per
sona
l use
onl
y
Sound underlying performance but COVID-19 impact at Group level
Outlook impacted by unprecedented environment
Decisive action for uncertain times ahead
Rapid response to support customers and colleagues
Focused on future opportunities
KEY MESSAGES
4
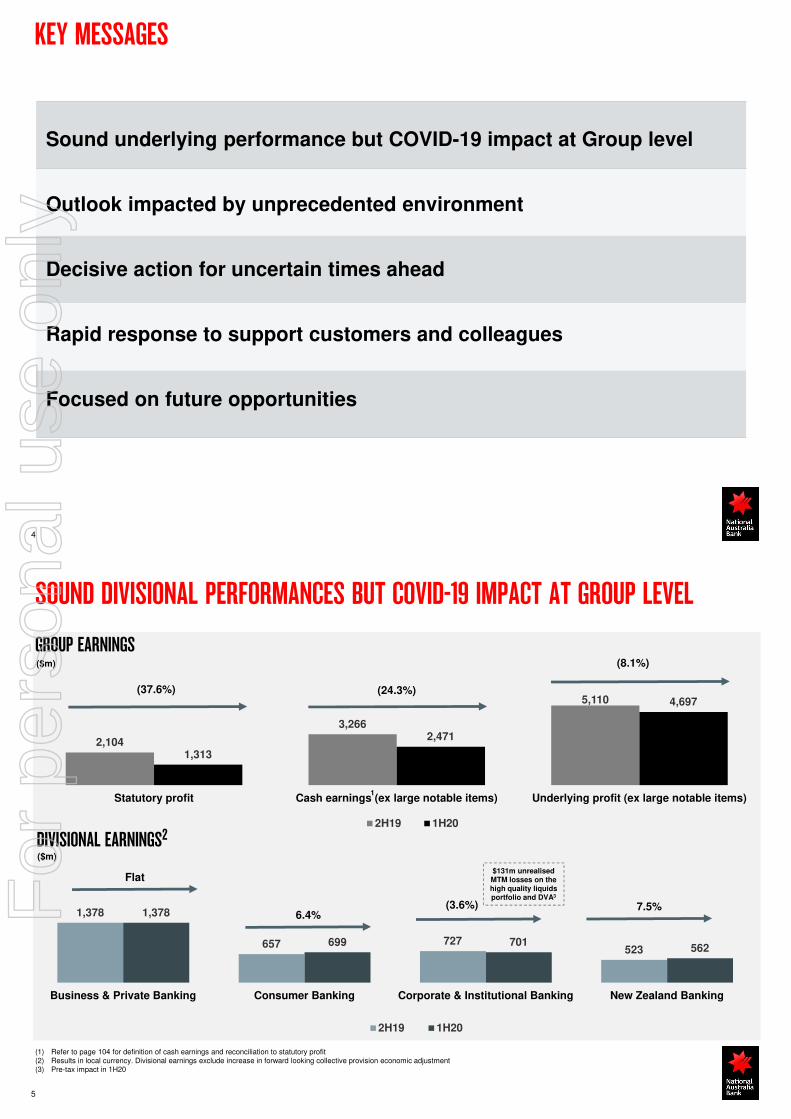
1,378
657 727523
1,378
699 701562
Business & Private Banking Consumer Banking Corporate & Institutional Banking New Zealand Banking
2H19 1H20
SOUND DIVISIONAL PERFORMANCES BUT COVID-19 IMPACT AT GROUP LEVEL
GROUP EARNINGS($m)
5
Flat
6.4%(3.6%) 7.5%
(1) Refer to page 104 for definition of cash earnings and reconciliation to statutory profit(2) Results in local currency. Divisional earnings exclude increase in forward looking collective provision economic adjustment(3) Pre-tax impact in 1H20
2,104
3,266
5,110
1,313
2,471
4,697
Statutory profit Cash earnings (ex large notable items) Underlying profit (ex large notable items)
2H19 1H20
DIVISIONAL EARNINGS2
($m)
(37.6%) (24.3%)
(8.1%)
1
$131m unrealised MTM losses on the high quality liquids portfolio and DVA3F
or p
erso
nal u
se o
nly

5,368 5,481
2,692 2,789
FY16 FY17 1H17 2H17
Total revenue
• Efforts to contain COVID-19 have had an unprecedented impact on the economy
• Duration and magnitude of impact highly uncertain –depends on the timing and phasing of the recovery and the effectiveness of government support
• Expect unemployment to rise sharply to 11.7% by June and progressively reduce in 20211
• GDP expected to rebound in Q4 but some sectors will face longer term impacts and structural change
UNCERTAIN ECONOMIC OUTLOOK
COMMENTS UNEMPLOYMENT TO PEAK IN MID-20201
GDP BACK TO ‘PRE COVID-19’ LEVELS BY EARLY 20223
6
-0.3%
-7.3%
-8.4%
-4.4%
-3.0%
-2.1%-1.4%
-0.6%
-10%
-9%
-8%
-7%
-6%
-5%
-4%
-3%
-2%
-1%
0%Dec 19 Mar 20 Jun 20 Sep 20 Dec 20 Mar 21 Jun 21 Sep 21 Dec 21
(1) Source: NAB Economics – Mar-20 onwards represents forecasts(2) Represents change in payment inflows by industry for the month of April 2020 compared to April 2019. April 2020 data extrapolated based on actuals to 19 April 2020. Payment Inflows are credits
to a NAB merchant’s account that are not financing credits from NAB or a transfer from related accounts(3) Chart shows forecast GDP levels indexed to actual Dec-19 GDP. Forecasts are from NAB Economics
5.1 5.2
11.7 11.5 11.610.8
8.97.8
7.3
Dec 19 Mar 20 Jun 20 Sep 20 Dec 20 Mar 21 Jun 21 Sep 21 Dec 21
(%)
PAYMENT INFLOWS INTO NAB MERCHANTS – APRIL YOY2
-70%
-50%
-30%
-10%
Accom &Food
services
Agri,Forestry &
Fishing Construction
Arts &Rec
servicesEducation& Training
Health &Social
AssistanceManufac-
turingRetailTrade
Transport,Postal &
Warehousing
7
CAPITAL RAISING
DECISIVE ACTION FOR UNCERTAIN TIMES AHEAD
DIVIDEND SETTINGS
• 30c Interim dividend, fully franked, reflecting a payout ratio of 35%2
• Difficult decision which reflects a balance between returning capital to our shareholders and retaining a strong balance sheet in this environment
• DRP open, 0% discount
• Currently expect to continue to pay a dividend but Board decision will be subject to regulatory requirements, the environment and performance at the time
PRO FORMA CET1 RATIO• Underwritten $3bn institutional placement and non-
underwritten share purchase plan targeting to raise approximately $500m
• Provides a CET1 buffer in an uncertain environment and enables continued support for customers
• Sizing seeks to provide buffer to assist with credit losses and RWA increases which could occur under a range of scenarios including a severe and prolonged downturn
• Strong capital position post capital raising, with a pro forma CET1 of 11.20%1
(1) Assumes $3bn placement and $500m raised under share purchase plan(2) Excluding large notable items
10.39% 11.20%
Mar 20 Capital Raising Mar 20 Pro forma
81bps
1
Further supported by 53c reduction in interim dividend
equivalent to $1.6bn or 37bps of CET1
PROVISIONING STRENGTHENED
2,473 2,635 2,719 2,932
581 614 641 662
807 3,054 3,249
3,360
4,401
Sep 18 Mar 19 Sep 19 Mar 20
• Economic Adjustment top-up (COVID-19) of $807m
• Total EA balance $1,473m, 33% of CP
Collective provision balances ($m)
1
For
per
sona
l use
onl
y
8
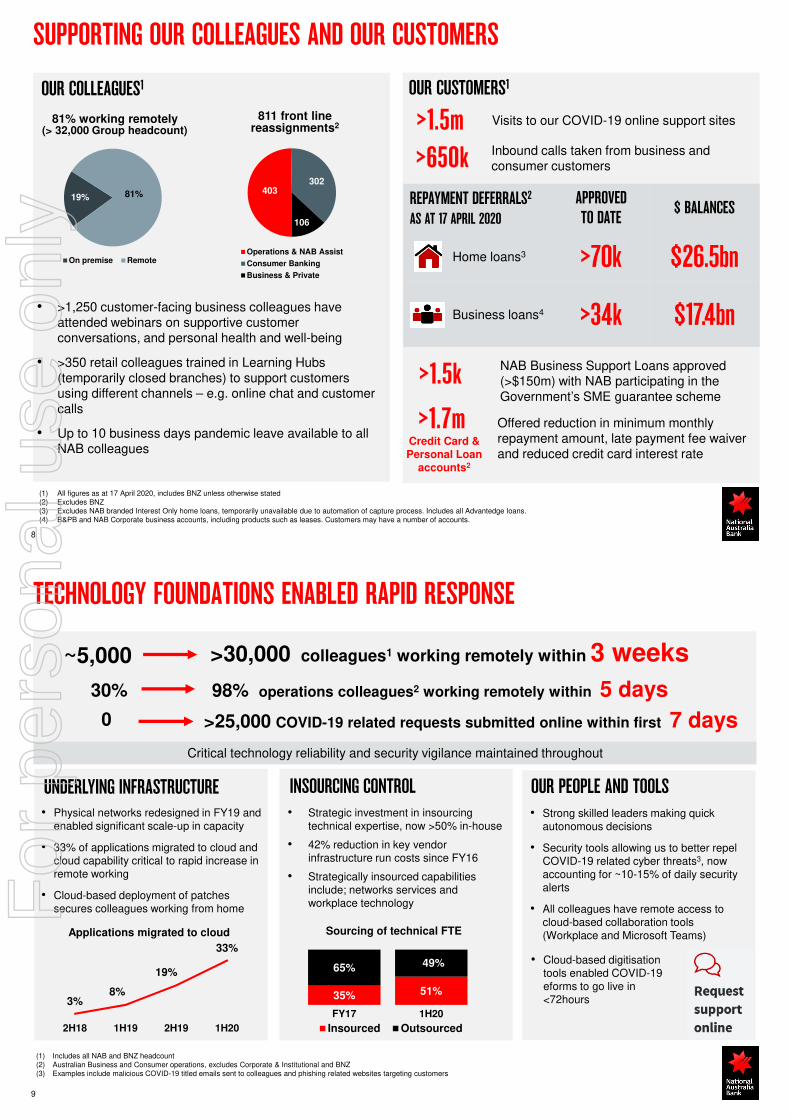
SUPPORTING OUR COLLEAGUES AND OUR CUSTOMERS
OUR COLLEAGUES1 OUR CUSTOMERS1
19% 81%
On premise Remote
81% working remotely (> 32,000 Group headcount)
• >1,250 customer-facing business colleagues have attended webinars on supportive customer conversations, and personal health and well-being
• >350 retail colleagues trained in Learning Hubs (temporarily closed branches) to support customers using different channels – e.g. online chat and customer calls
• Up to 10 business days pandemic leave available to all NAB colleagues
(1) All figures as at 17 April 2020, includes BNZ unless otherwise stated(2) Excludes BNZ (3) Excludes NAB branded Interest Only home loans, temporarily unavailable due to automation of capture process. Includes all Advantedge loans.(4) B&PB and NAB Corporate business accounts, including products such as leases. Customers may have a number of accounts.
>1.5m
>650k
Visits to our COVID-19 online support sites
Inbound calls taken from business and consumer customers
REPAYMENT DEFERRALS2
AS AT 17 APRIL 2020
APPROVED TO DATE
$ BALANCES
Home loans3 >70k $26.5bn
Business loans4 >34k $17.4bn
811 front line reassignments2
403302
106
Operations & NAB Assist
Consumer Banking
Business & Private
>1.7m Offered reduction in minimum monthly repayment amount, late payment fee waiver and reduced credit card interest rate
Credit Card & Personal Loan
accounts2
>1.5k NAB Business Support Loans approved (>$150m) with NAB participating in the Government’s SME guarantee scheme
9
TECHNOLOGY FOUNDATIONS ENABLED RAPID RESPONSE
INSOURCING CONTROL
Critical technology reliability and security vigilance maintained throughout
35% 51%
65% 49%
FY17 1H20
Sourcing of technical FTE
Insourced Outsourced
• Strategic investment in insourcing technical expertise, now >50% in-house
• 42% reduction in key vendor infrastructure run costs since FY16
• Strategically insourced capabilities include; networks services and workplace technology
UNDERLYING INFRASTRUCTURE
3%8%
19%
33%
2H18 1H19 2H19 1H20
Applications migrated to cloud
• Physical networks redesigned in FY19 and enabled significant scale-up in capacity
• 33% of applications migrated to cloud and cloud capability critical to rapid increase in remote working
• Cloud-based deployment of patches secures colleagues working from home
OUR PEOPLE AND TOOLS
• Strong skilled leaders making quick autonomous decisions
• Security tools allowing us to better repel COVID-19 related cyber threats3, now accounting for ~10-15% of daily security alerts
• All colleagues have remote access to cloud-based collaboration tools (Workplace and Microsoft Teams)
(1) Includes all NAB and BNZ headcount(2) Australian Business and Consumer operations, excludes Corporate & Institutional and BNZ(3) Examples include malicious COVID-19 titled emails sent to colleagues and phishing related websites targeting customers
• Cloud-based digitisation tools enabled COVID-19 eforms to go live in <72hours
>30,000 colleagues1 working remotely within 3 weeks~5,000
>25,000 COVID-19 related requests submitted online within first 7 days0
98% operations colleagues2 working remotely within 5 days30%
For
per
sona
l use
onl
y
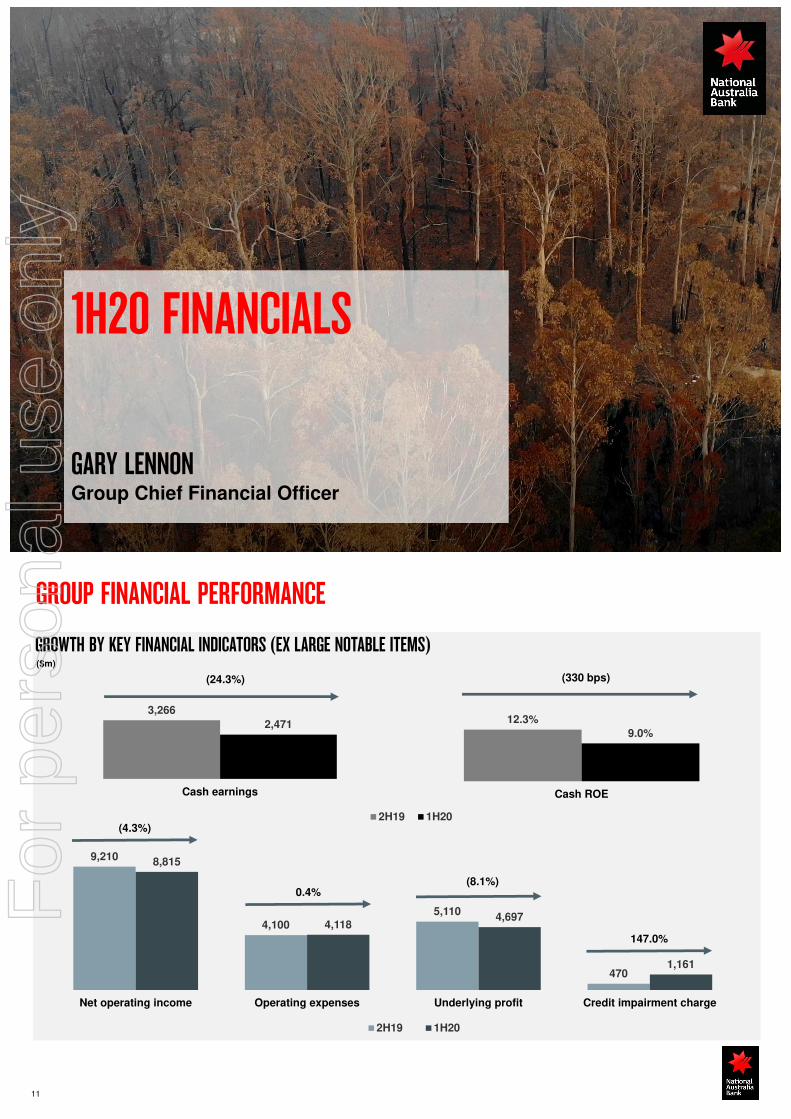
1H20 FINANCIALS
GARY LENNONGroup Chief Financial Officer
9,210
4,100
5,110
470
8,815
4,1184,697
1,161
Net operating income Operating expenses Underlying profit Credit impairment charge
2H19 1H20
3,266
2,471
Cash earnings
2H19 1H20
12.3%
9.0%
Cash ROE
GROUP FINANCIAL PERFORMANCE
($m)
11
(4.3%)
0.4%(8.1%)
147.0%
(24.3%) (330 bps)
GROWTH BY KEY FINANCIAL INDICATORS (EX LARGE NOTABLE ITEMS)
For
per
sona
l use
onl
y
261 279
709
202
046
66
91
261325
775
293
2H18 1H19 2H19 1H20
Wealth Banking
12
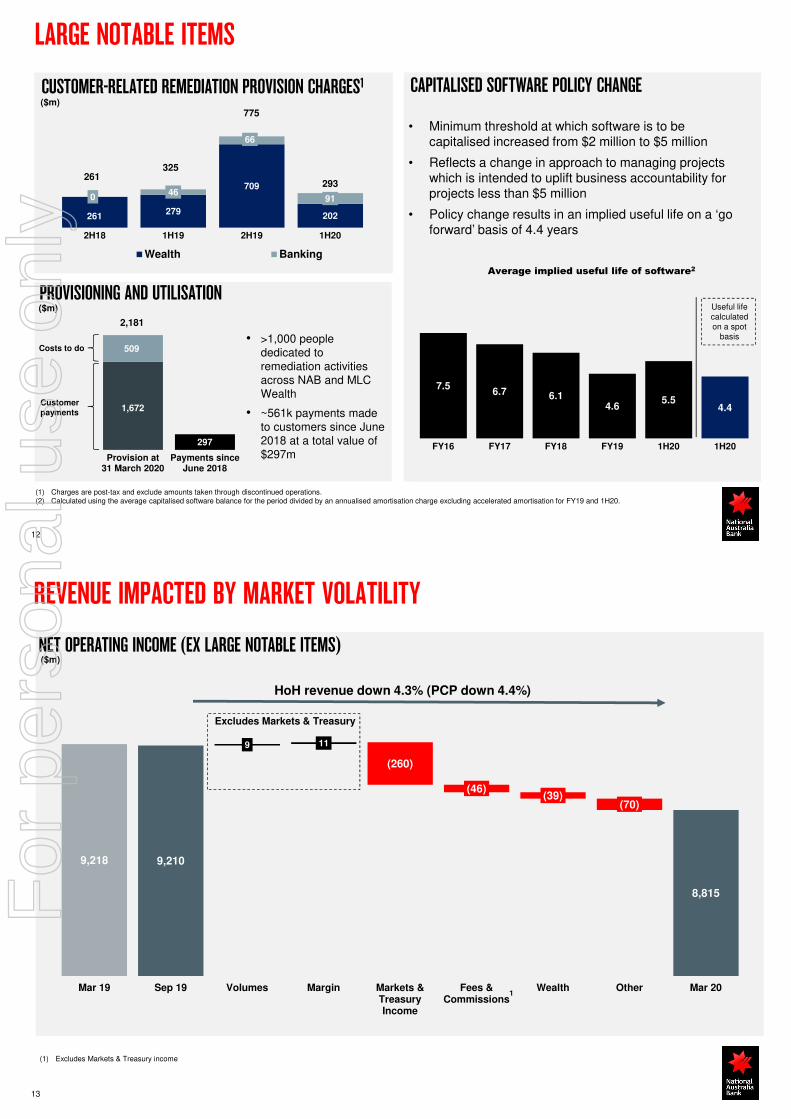
CUSTOMER-RELATED REMEDIATION PROVISION CHARGES1
LARGE NOTABLE ITEMS
CAPITALISED SOFTWARE POLICY CHANGE($m)
• Minimum threshold at which software is to be capitalised increased from $2 million to $5 million
• Reflects a change in approach to managing projects which is intended to uplift business accountability for projects less than $5 million
• Policy change results in an implied useful life on a ‘go forward’ basis of 4.4 years
7.56.7 6.1
4.65.5
4.4
FY16 FY17 FY18 FY19 1H20 1H20
Useful life calculated on a spot
basis
Average implied useful life of software2
(1) Charges are post-tax and exclude amounts taken through discontinued operations.(2) Calculated using the average capitalised software balance for the period divided by an annualised amortisation charge excluding accelerated amortisation for FY19 and 1H20.
PROVISIONING AND UTILISATION
• >1,000 people dedicated to remediation activities across NAB and MLC Wealth
• ~561k payments made to customers since June 2018 at a total value of $297m
($m)
1,672
297
509
2,181
Provision at31 March 2020
Payments sinceJune 2018
Costs to do
Customer payments
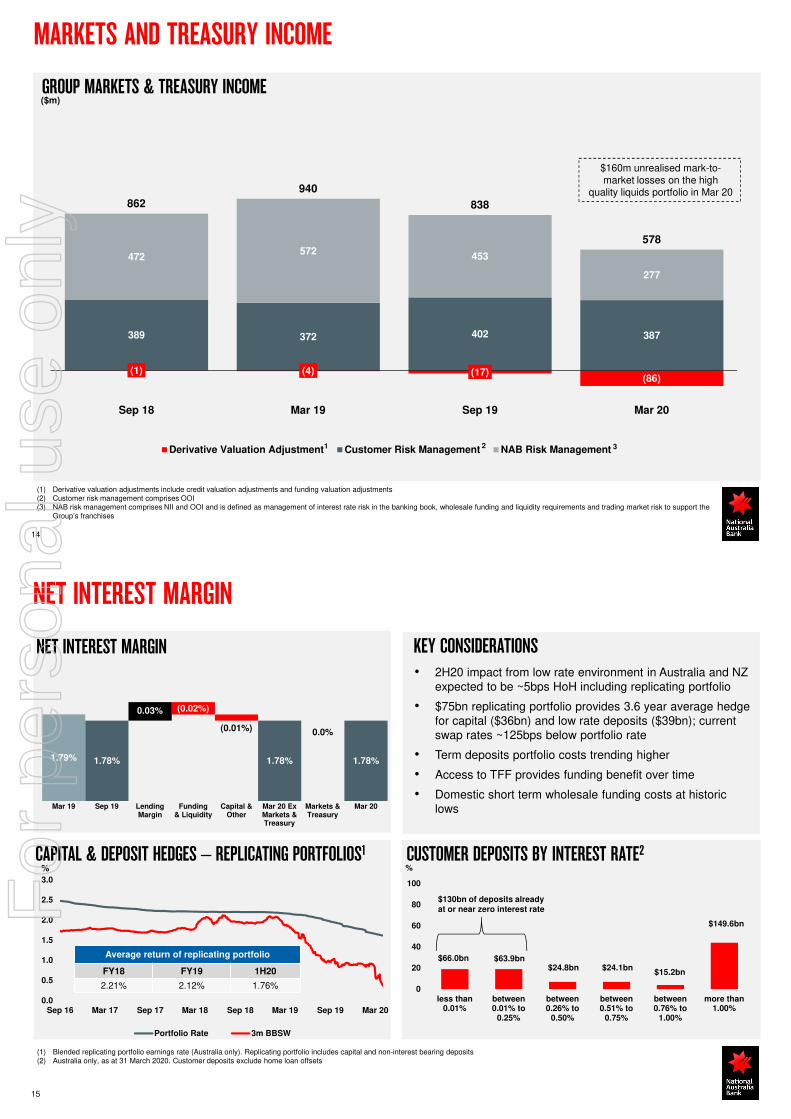
9,218 9,210
8,815
9 11
(260)
(46)(39)
(70)
Mar 19 Sep 19 Volumes Margin Markets &TreasuryIncome
Fees &Commissions
Wealth Other Mar 20
NET OPERATING INCOME (EX LARGE NOTABLE ITEMS)($m)
13
HoH revenue down 4.3% (PCP down 4.4%)
Excludes Markets & Treasury
(1) Excludes Markets & Treasury income
REVENUE IMPACTED BY MARKET VOLATILITY
1
For
per
sona
l use
onl
y
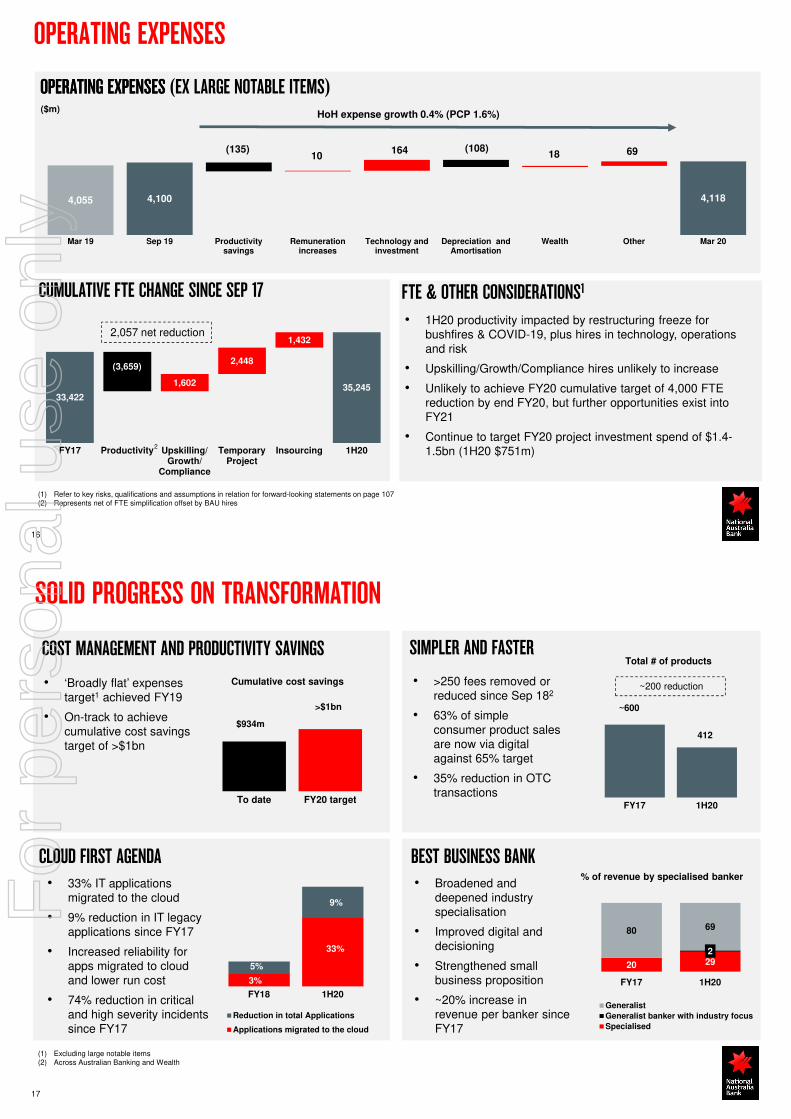
(1) (4) (17)(86)
389 372 402 387
472572
453
277
862
940
838
578
Sep 18 Mar 19 Sep 19 Mar 20
Derivative Valuation Adjustment Customer Risk Management NAB Risk Management
GROUP MARKETS & TREASURY INCOME
14
MARKETS AND TREASURY INCOME
(1) Derivative valuation adjustments include credit valuation adjustments and funding valuation adjustments(2) Customer risk management comprises OOI(3) NAB risk management comprises NII and OOI and is defined as management of interest rate risk in the banking book, wholesale funding and liquidity requirements and trading market risk to support the
Group’s franchises
1 2 3
($m)
$160m unrealised mark-to-market losses on the high
quality liquids portfolio in Mar 20
NET INTEREST MARGIN
CAPITAL & DEPOSIT HEDGES – REPLICATING PORTFOLIOS1
15
NET INTEREST MARGIN
(1) Blended replicating portfolio earnings rate (Australia only). Replicating portfolio includes capital and non-interest bearing deposits (2) Australia only, as at 31 March 2020. Customer deposits exclude home loan offsets
CUSTOMER DEPOSITS BY INTEREST RATE2
0.0
0.5
1.0
1.5
2.0
2.5
3.0
Sep 16 Mar 17 Sep 17 Mar 18 Sep 18 Mar 19 Sep 19 Mar 20
Portfolio Rate 3m BBSW
Average return of replicating portfolio
FY18 FY19 1H20
2.21% 2.12% 1.76%
KEY CONSIDERATIONS• 2H20 impact from low rate environment in Australia and NZ
expected to be ~5bps HoH including replicating portfolio
• $75bn replicating portfolio provides 3.6 year average hedge for capital ($36bn) and low rate deposits ($39bn); current swap rates ~125bps below portfolio rate
• Term deposits portfolio costs trending higher
• Access to TFF provides funding benefit over time
• Domestic short term wholesale funding costs at historic lows
0
20
40
60
80
100
less than0.01%
between0.01% to
0.25%
between0.26% to
0.50%
between0.51% to
0.75%
between0.76% to
1.00%
more than1.00%
$66.0bn
$130bn of deposits already at or near zero interest rate
$63.9bn$24.8bn $24.1bn
$15.2bn
$149.6bn
%
1.79% 1.78% 1.78% 1.78%
(0.02%)
(0.01%) 0.0%
0.03%
Mar 19 Sep 19 LendingMargin
Funding& Liquidity
Capital &Other
Mar 20 ExMarkets &Treasury
Markets &Treasury
Mar 20
%
For
per
sona
l use
onl
y
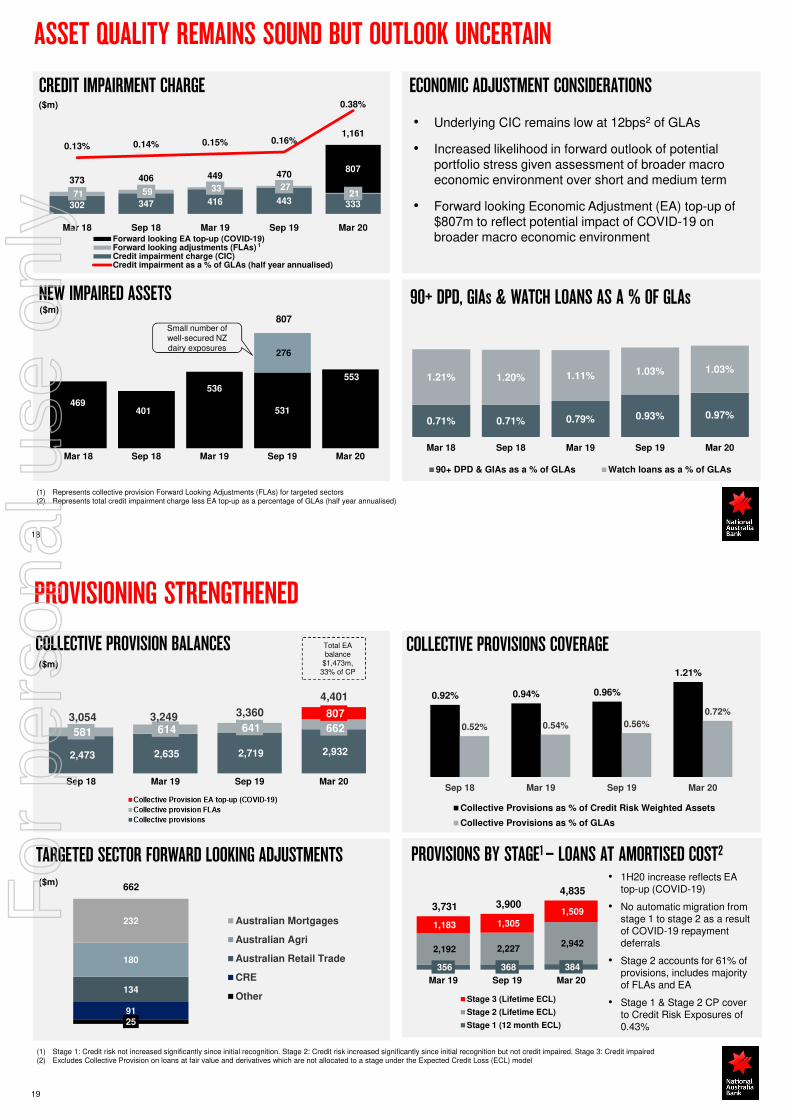
4,055 4,100 4,118
10 164 18 69 (135) (108)
Mar 19 Sep 19 Productivitysavings
Remunerationincreases
Technology andinvestment
Depreciation andAmortisation
Wealth Other Mar 20
33,42235,245
1,602
2,448
1,432
FY17 Productivity Upskilling/Growth/
Compliance
TemporaryProject
Insourcing 1H20
2,057 net reduction
OPERATING EXPENSES
OPERATING EXPENSES
OPERATING EXPENSES (EX LARGE NOTABLE ITEMS)($m)
16
CUMULATIVE FTE CHANGE SINCE SEP 17 FTE & OTHER CONSIDERATIONS1
(3,659)
HoH expense growth 0.4% (PCP 1.6%)
• 1H20 productivity impacted by restructuring freeze for bushfires & COVID-19, plus hires in technology, operations and risk
• Upskilling/Growth/Compliance hires unlikely to increase
• Unlikely to achieve FY20 cumulative target of 4,000 FTE reduction by end FY20, but further opportunities exist into FY21
• Continue to target FY20 project investment spend of $1.4-1.5bn (1H20 $751m)
(1) Refer to key risks, qualifications and assumptions in relation for forward-looking statements on page 107(2) Represents net of FTE simplification offset by BAU hires
2
BEST BUSINESS BANK CLOUD FIRST AGENDA
COST MANAGEMENT AND PRODUCTIVITY SAVINGS
17
SIMPLER AND FASTER
$934m
>$1bn
To date FY20 target
Cumulative cost savings
~600
412
FY17 1H20
Total # of products
• >250 fees removed or reduced since Sep 182
• 63% of simple consumer product sales are now via digital against 65% target
• 35% reduction in OTC transactions
• 33% IT applications migrated to the cloud
• 9% reduction in IT legacy applications since FY17
• Increased reliability for apps migrated to cloud and lower run cost
• 74% reduction in critical and high severity incidents since FY17
20 292
80 69
FY17 1H20
Generalist
Generalist banker with industry focus
Specialised
% of revenue by specialised banker• Broadened and
deepened industry specialisation
• Improved digital and decisioning
• Strengthened small business proposition
• ~20% increase in revenue per banker since FY17
FY18 1H20
Reduction in total Applications
Applications migrated to the cloud
33%
5%
3%
9%
SOLID PROGRESS ON TRANSFORMATION
• ‘Broadly flat’ expenses target1 achieved FY19
• On-track to achieve cumulative cost savings target of >$1bn
(1) Excluding large notable items(2) Across Australian Banking and Wealth
~200 reduction
For
per
sona
l use
onl
y
0.71% 0.71% 0.79% 0.93% 0.97%
1.21% 1.20% 1.11% 1.03% 1.03%
Mar 18 Sep 18 Mar 19 Sep 19 Mar 20
90+ DPD & GIAs as a % of GLAs Watch loans as a % of GLAs
302 347 416 443 33371 59 33 27
21
807
373 406 449 470
1,161
0.13% 0.14% 0.15% 0.16%
0.38%
Mar 18 Sep 18 Mar 19 Sep 19 Mar 20Forward looking EA top-up (COVID-19)Forward looking adjustments (FLAs)Credit impairment charge (CIC)Credit impairment as a % of GLAs (half year annualised)
(1) Represents collective provision Forward Looking Adjustments (FLAs) for targeted sectors(2) Represents total credit impairment charge less EA top-up as a percentage of GLAs (half year annualised)
90+ DPD, GIAs & WATCH LOANS AS A % OF GLAsNEW IMPAIRED ASSETS
CREDIT IMPAIRMENT CHARGE($m)
($m)
1
18
ASSET QUALITY REMAINS SOUND BUT OUTLOOK UNCERTAIN
531
553
276
469401
536
Mar 18 Sep 18 Mar 19 Sep 19 Mar 20
Small number of well-secured NZ dairy exposures
ECONOMIC ADJUSTMENT CONSIDERATIONS
• Underlying CIC remains low at 12bps2 of GLAs
• Increased likelihood in forward outlook of potential portfolio stress given assessment of broader macro economic environment over short and medium term
• Forward looking Economic Adjustment (EA) top-up of $807m to reflect potential impact of COVID-19 on broader macro economic environment
807
($m)
COLLECTIVE PROVISION BALANCES
19
PROVISIONING STRENGTHENED
2591
134
180
232 Australian Mortgages
Australian Agri
Australian Retail Trade
CRE
Other
($m)662
0.92% 0.94% 0.96%
1.21%
0.52% 0.54% 0.56%
0.72%
Sep 18 Mar 19 Sep 19 Mar 20
Collective Provisions as % of Credit Risk Weighted Assets
Collective Provisions as % of GLAs
COLLECTIVE PROVISIONS COVERAGE
TARGETED SECTOR FORWARD LOOKING ADJUSTMENTS
(1) Stage 1: Credit risk not increased significantly since initial recognition. Stage 2: Credit risk increased significantly since initial recognition but not credit impaired. Stage 3: Credit impaired (2) Excludes Collective Provision on loans at fair value and derivatives which are not allocated to a stage under the Expected Credit Loss (ECL) model
PROVISIONS BY STAGE1 – LOANS AT AMORTISED COST2
• 1H20 increase reflects EA top-up (COVID-19)
• No automatic migration from stage 1 to stage 2 as a result of COVID-19 repayment deferrals
• Stage 2 accounts for 61% of provisions, includes majority of FLAs and EA
• Stage 1 & Stage 2 CP cover to Credit Risk Exposures of 0.43%
356 368 384
2,192 2,227 2,942
1,183 1,305
1,509 3,731 3,900
4,835
Mar 19 Sep 19 Mar 20
Stage 3 (Lifetime ECL)
Stage 2 (Lifetime ECL)
Stage 1 (12 month ECL)
2,473 2,635 2,719 2,932
581 614 641 662
807 3,054 3,249 3,360
4,401
Sep 18 Mar 19 Sep 19 Mar 20
Total EA balance
$1,473m, 33% of CP
For
per
sona
l use
onl
y

EXPECTED CREDIT LOSS (ECL) SENSITIVITY CONSIDERATIONS IN ESTIMATING EXPECTED CREDIT LOSSES
20
ECONOMIC ADJUSTMENT TOP-UP
• Updated forward looking macro-economic data and assumptions including potential impacts of COVID-19 pandemic
• Incorporates assumptions about migration of exposures between Stage 1 (12 month expected losses) to Stage 2 (lifetime expected losses) and Stage 3 (lifetime expected losses), and payment deferral uptake and recoveries
• Uncertainty exists re duration of COVID-19 restrictions, impact of government stimulus and regulatory actions
• ECL outcome reflects impact of 3 probability weighted EA scenarios (base, upside, severe downside) plus FLAs for emerging risks at industry, geography or segment level
• ECL base case reflects COVID-19 estimated impacts
• ECL severe downside: more prolonged and severe downturn, sustained negative GDP change, elevated (double-digit) unemployment, acute asset value falls
• 1H20 EA top-up reflects deterioration in base case assumptions and increased weighting to severe downside scenario vs Sep 19
Total Provisions for Expected Credit Losses (ECL)1
$m1H20
(probability weighted)
100% Base case
100% Severe Downside
Housing 1,150 968 3,395
Business 3,275 3,025 3,830
Total Group 4,835 4,391 7,855
Implied EA top-up (change vs Sep 19)
807 363 3,827
KEY ASSUMPTIONS
Base case Severe downside
2020 2021 2020 2021 2022
GDP change YoY %
(3.0) 3.4 (3.0) (2.5) 2.0
Unemployment %
11.6 7.3 7.4 10.0 10.4
House price change YoY %
(10.0) 2.6 (20.9) (11.8) 2.5
(1) Expected credit losses (ECL) excludes collective provisions on fair value loans and derivatives. Scenarios, prepared for purposes of informing forward looking provisions, rely on NAB Economics modelling and management judgement
21
COVID-19 SECTORS OF INTEREST
8.0
3.0
Drawn Undrawn
EAD $11.0bn• Direct lending
to airlines and aircraft leasing companies
• Severely impacted by international and domestic travel restrictions
• Retail Trade portfolio experience is mixed: ~52% is discretionary retail, while non-discretionary component likely to be less impacted
• Department store exposure ~$150m
• Household consumption growth was already at slowest pace since 1990s recession pre COVID-19
• Provisioning includes $134m FLA
Motor Vehicles
25%
Food25%
Personal & Household
Goods50%
EAD Portfolio by sector Mar 20
RETAIL TRADE (~3% OF NON RETAIL EAD)
7.6
7.0
Non-Discretionay
Discretionary
EAD $14.6bn
Fully secured
44%
Partially secured
43%
Unsecured13%
Portfolio security Mar 201
(1) Fully Secured is where the loan amount is less than 100% of the bank extended value of security; Partially Secured is where the loan amount is greater than 100% of the bank extended value of security; Unsecured is where no security is held and/or no value held against the security and negative pledge arrangements are normally in place. Bank extended value is calculated as a discount to market value based on the nature of the underlying security
(2) Retail Trade and Accommodation & Hospitality are aligned to Regulatory Industry Classifications. Discretionary / Non-discretionary Retail Trade determined at an individual ANZSIC code level
ACCOMMODATION & HOSPITALITY2 (~2% OF NON RETAIL EAD)
• Hospitality portfolio materially impacted by government restrictions
• Credit impacts will be dependent on length of continued shutdowns, speed of recovery and mitigating impact of government support
Cafes, Restaurants & Clubs17%
Pubs, Taverns & Bars
21%
Accomodation62%
EAD Portfolio by sector Mar 20
Fully secured
75%
Partially secured
21%
Unsecured4%
Portfolio security Mar 201
8.5
3.9
2.2
B&PB C&IB NZ
EAD $14.6bn
5.1
3.7
1.4
B&PB C&IB NZ
EAD $10.2bnFor
per
sona
l use
onl
y

22
COVID-19 SECTORS OF INTEREST
Air Transport43%
Aircraft leasing
35%
Service to Air Transport
22%
EAD Portfolio by sector Mar 20
AIR TRAVEL & RELATED SERVICES1 (~2% OF NON RETAIL EAD)
Fully secured
64%
Partially secured
23%
Unsecured13%
Portfolio security Mar 202
(1) Air Travel and related services defined based on relevant ANZSIC codes(2) Fully Secured is where the loan amount is less than 100% of the bank extended value of security; Partially Secured is where the loan amount is greater than 100% of the bank extended value of
security; Unsecured is where no security is held and/or no value held against the security and negative pledge arrangements are normally in place. Bank extended value is calculated as a discount to market value based on the nature of the underlying security
(3) Measured as EAD / drawn balances outstanding per APRA Commercial Property ARF 230 definitions
• Portfolio includes lending to airlines, aircraft leasing and airports
• Lending is to highly rated counterparties (82% Investment Grade)
• Rate of recovery post COVID-19 will be slower than for domestic industries
COMMERCIAL REAL ESTATE3 (~15% NON RETAIL EAD)Balances Sector breakdown Mar 20
Group balances over time
0.3
10.9
0.5
B&PB C&IB NZ
EAD $11.7bn
Office28%
Tourism & Leisure
3%
Retail29%
Residential11%
Industrial17%
Other7%
Land5%
75
61 62 62 61
17.1%
11.6% 11.3% 10.2% 9.9%
-15.0%
18.0%
40
80
Sep 09 Sep 13 Sep 16 Sep 19 Mar 20
Group CRE $bn
Group CRE % of Group GLAs
31.6
9.5
B&PB C&IB NZ
EAD $74.2bn
• CRE book remains diversified by geography and sector
• Largest sector exposures are in Retail & Tourism (32% of CRE balances) and Office (28%). Short term and long term impacts of COVID-19 across CRE book remain uncertain
• Portfolio is 89% investor, 11% developer
• Australian residential development apartment limits are down ~42% since March 2019
10.38 10.39
11.20
0.59 0.35(0.35)(0.24)
(0.06)(0.13)
(0.15)
Sep 19 Cash earnings Dividend(net DRP)
RWAGrowth
DRP Underwriteand NCN
Conversion
Large NotableItems
Rates and FXMTM
Other Mar 20 Mar 20Pro forma
Capital generation +0bps (-22bps ex DRP)
23
CAPITAL
GROUP BASEL III COMMON EQUITY TIER 1 CAPITAL RATIO(%)
CAPITAL CONSIDERATIONSCREDIT RWA• APRA allowance for some of the 150bps of ‘unquestionably
strong’ buffers to be utilised
• Strong expected FY20 Australian business lending growth (~13-16%) has limited capital implications as mostly relates to drawdowns where capital is already held or low RWA sectors
• Pro forma CET1 ratio 11.2% assuming $3.5bn equity raising3
(+81bps)
• CET1 drag from FX and MTM on high quality liquids (cash earnings, reserves & CRWA impacts) 21bps, EA top-up 19bps
(1) Net of 1.5% discount(2) DRP underwrite (17bps) and NCN conversion (18bps)(3) Assumes $3bn placement and $500m raised under share purchase plan
($bn)
351.6364.5
3.3 1.5 1.7
7.3
(0.9)
Sep 19 Volume Model andMethodology
CreditQuality
andPortfolio
Mix
Derivativesand
RepurchaseAgreements
TranslationFX
Mar 20
2
1
Further supported by 53c reduction in interim dividend
equivalent to $1.6bn or 37bps of CET1
3
For
per
sona
l use
onl
y
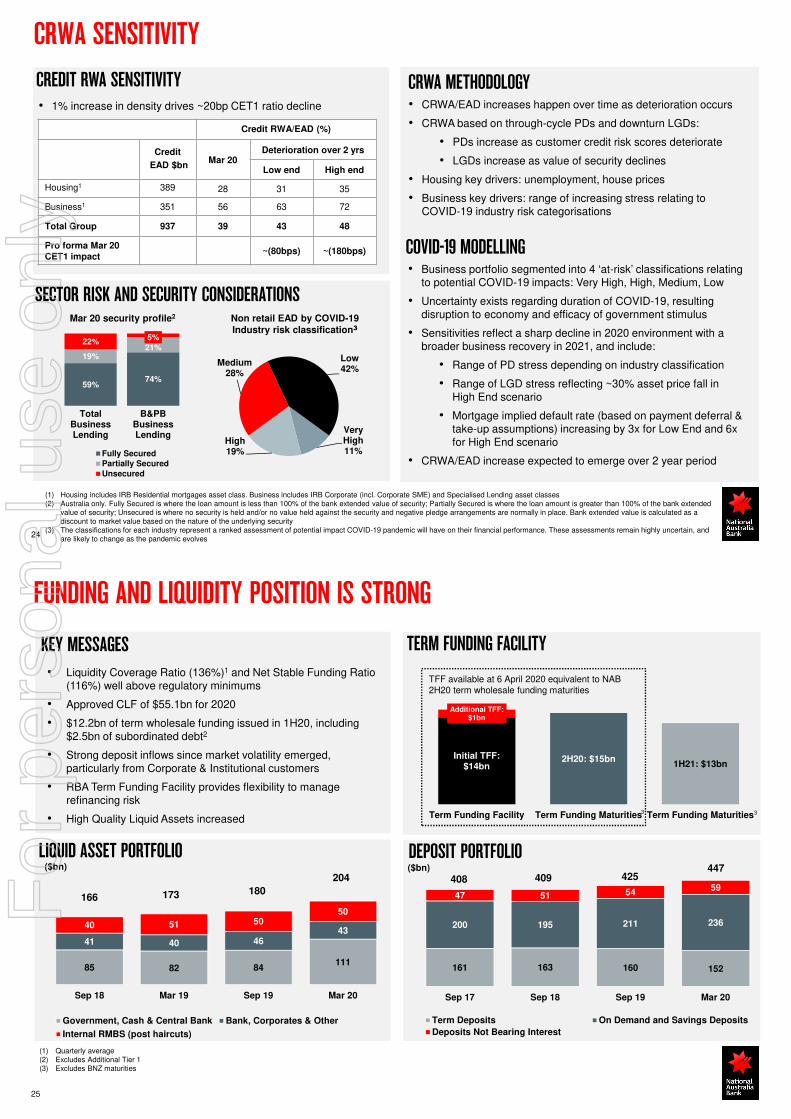
CREDIT RWA SENSITIVITY CRWA METHODOLOGY
24
CRWA SENSITIVITY
Credit RWA/EAD (%)
Credit
EAD $bnMar 20
Deterioration over 2 yrs
Low end High end
Housing1 389 28 31 35
Business1 351 56 63 72
Total Group 937 39 43 48
Pro forma Mar 20 CET1 impact
~(80bps) ~(180bps)
59%74%
19%21%
22%5%
TotalBusinessLending
B&PBBusinessLending
Fully SecuredPartially SecuredUnsecured
Non retail EAD by COVID-19 Industry risk classification3
Very High11%
High19%
Medium28%
Low42%
(1) Housing includes IRB Residential mortgages asset class. Business includes IRB Corporate (incl. Corporate SME) and Specialised Lending asset classes(2) Australia only. Fully Secured is where the loan amount is less than 100% of the bank extended value of security; Partially Secured is where the loan amount is greater than 100% of the bank extended
value of security; Unsecured is where no security is held and/or no value held against the security and negative pledge arrangements are normally in place. Bank extended value is calculated as a discount to market value based on the nature of the underlying security
(3) The classifications for each industry represent a ranked assessment of potential impact COVID-19 pandemic will have on their financial performance. These assessments remain highly uncertain, and are likely to change as the pandemic evolves
Mar 20 security profile2
• 1% increase in density drives ~20bp CET1 ratio decline
SECTOR RISK AND SECURITY CONSIDERATIONS
• CRWA/EAD increases happen over time as deterioration occurs
• CRWA based on through-cycle PDs and downturn LGDs:
• PDs increase as customer credit risk scores deteriorate
• LGDs increase as value of security declines
• Housing key drivers: unemployment, house prices
• Business key drivers: range of increasing stress relating to COVID-19 industry risk categorisations
• Business portfolio segmented into 4 ‘at-risk’ classifications relating to potential COVID-19 impacts: Very High, High, Medium, Low
• Uncertainty exists regarding duration of COVID-19, resulting disruption to economy and efficacy of government stimulus
• Sensitivities reflect a sharp decline in 2020 environment with a broader business recovery in 2021, and include:
• Range of PD stress depending on industry classification
• Range of LGD stress reflecting ~30% asset price fall in High End scenario
• Mortgage implied default rate (based on payment deferral & take-up assumptions) increasing by 3x for Low End and 6x for High End scenario
• CRWA/EAD increase expected to emerge over 2 year period
COVID-19 MODELLING
161 163 160 152
200 195 211 236
47 51 5459
Sep 17 Sep 18 Sep 19 Mar 20
Term Deposits On Demand and Savings Deposits
Deposits Not Bearing Interest
408 409 425447
25
DEPOSIT PORTFOLIO
• Liquidity Coverage Ratio (136%)1 and Net Stable Funding Ratio (116%) well above regulatory minimums
• Approved CLF of $55.1bn for 2020
• $12.2bn of term wholesale funding issued in 1H20, including $2.5bn of subordinated debt2
• Strong deposit inflows since market volatility emerged, particularly from Corporate & Institutional customers
• RBA Term Funding Facility provides flexibility to manage refinancing risk
• High Quality Liquid Assets increased
KEY MESSAGES
FUNDING AND LIQUIDITY POSITION IS STRONG
(1) Quarterly average(2) Excludes Additional Tier 1(3) Excludes BNZ maturities
85 82 84111
41 40 4643
40 51 5050
Sep 18 Mar 19 Sep 19 Mar 20
Government, Cash & Central Bank Bank, Corporates & Other
Internal RMBS (post haircuts)
166 173 180
204
LIQUID ASSET PORTFOLIO
TERM FUNDING FACILITY
Initial TFF: $14bn
2H20: $15bn
Additional TFF: $1bn
1H21: $13bn
Term Funding Facility Term Funding Maturities Term Funding Maturities
TFF available at 6 April 2020 equivalent to NAB 2H20 term wholesale funding maturities
3 3
($bn) ($bn)
For
per
sona
l use
onl
y
UPDATE ON LONG-TERM STRATEGY
ROSS McEWANGroup Chief Executive Officer
27 200407 - Draft Market Announce ...PER
OUR AMBITION FOR NAB
To serve customers well and help our communities prosper
To invest in our colleagues and customers, the ‘twin peaks’ of our strategy
To be safe; protecting customers and colleagues through financial and operational resilience
To be easy; a simpler, more seamless and digitally enabled bank that gets things done faster
To be relationship-led; building on market-leading expertise, data and insights
Making the decisions for the long-term to deliver sustainable outcomes for our stakeholders
For
per
sona
l use
onl
y
28 200407 - Draft Market Announce ...PER
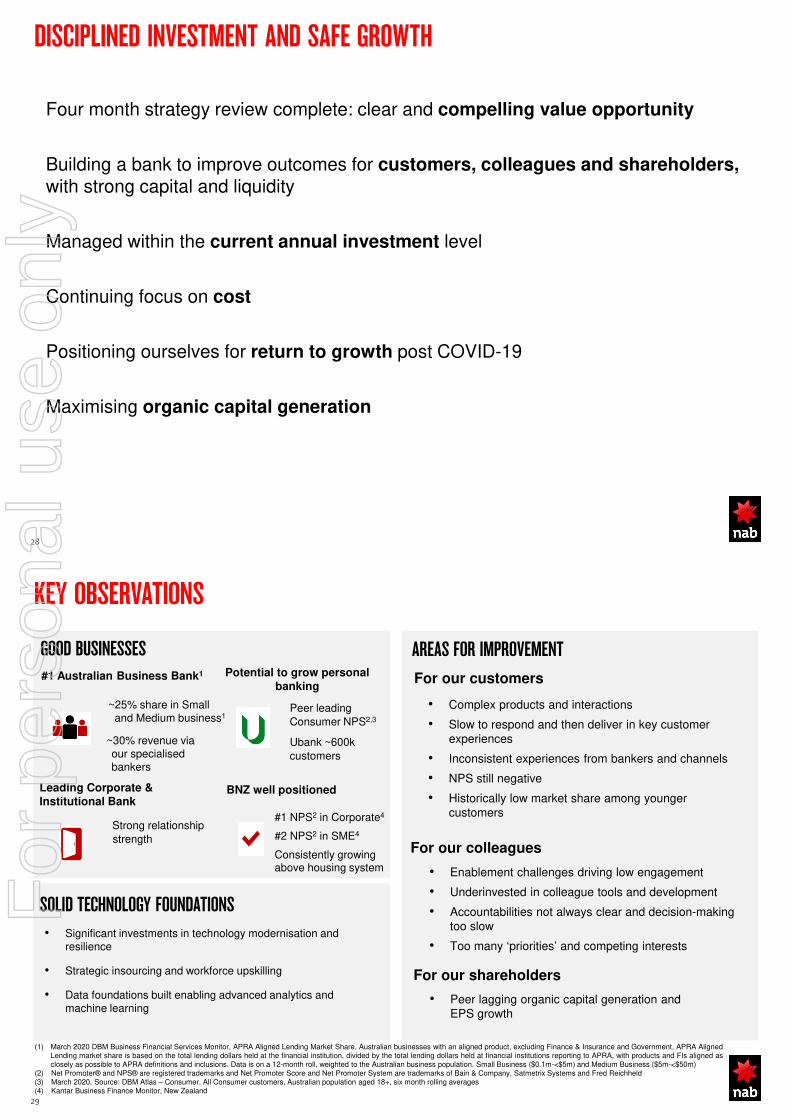
DISCIPLINED INVESTMENT AND SAFE GROWTH
Four month strategy review complete: clear and compelling value opportunity
Building a bank to improve outcomes for customers, colleagues and shareholders, with strong capital and liquidity
Managed within the current annual investment level
Continuing focus on cost
Positioning ourselves for return to growth post COVID-19
Maximising organic capital generation
29 200407 - Draft Market Announce ...PER
GOOD BUSINESSES
KEY OBSERVATIONS
(1) March 2020 DBM Business Financial Services Monitor, APRA Aligned Lending Market Share. Australian businesses with an aligned product, excluding Finance & Insurance and Government. APRA AlignedLending market share is based on the total lending dollars held at the financial institution, divided by the total lending dollars held at financial institutions reporting to APRA, with products and FIs aligned asclosely as possible to APRA definitions and inclusions. Data is on a 12-month roll, weighted to the Australian business population. Small Business ($0.1m-<$5m) and Medium Business ($5m-<$50m)
(2) Net Promoter® and NPS® are registered trademarks and Net Promoter Score and Net Promoter System are trademarks of Bain & Company, Satmetrix Systems and Fred Reichheld(3) March 2020. Source: DBM Atlas – Consumer. All Consumer customers, Australian population aged 18+, six month rolling averages(4) Kantar Business Finance Monitor, New Zealand
Leading Corporate & Institutional Bank
Strong relationship
strength
Potential to grow personal banking
Peer leading
Consumer NPS2,3
Ubank ~600k
customers
BNZ well positioned
AREAS FOR IMPROVEMENT
For our customers
• Complex products and interactions
• Slow to respond and then deliver in key customer experiences
• Inconsistent experiences from bankers and channels
• NPS still negative
• Historically low market share among younger customers
• Enablement challenges driving low engagement
• Underinvested in colleague tools and development
• Accountabilities not always clear and decision-making too slow
• Too many ‘priorities’ and competing interests
For our colleagues
For our shareholders
• Peer lagging organic capital generation and EPS growth
SOLID TECHNOLOGY FOUNDATIONS
• Significant investments in technology modernisation and resilience
• Strategic insourcing and workforce upskilling
• Data foundations built enabling advanced analytics and machine learning
#1 NPS2 in Corporate4
#2 NPS2 in SME4
Consistently growing above housing system
#1 Australian Business Bank1
~25% share in Small and Medium business1
~30% revenue via our specialised bankers
For
per
sona
l use
onl
y
30 200407 - Draft Market Announce ...PER
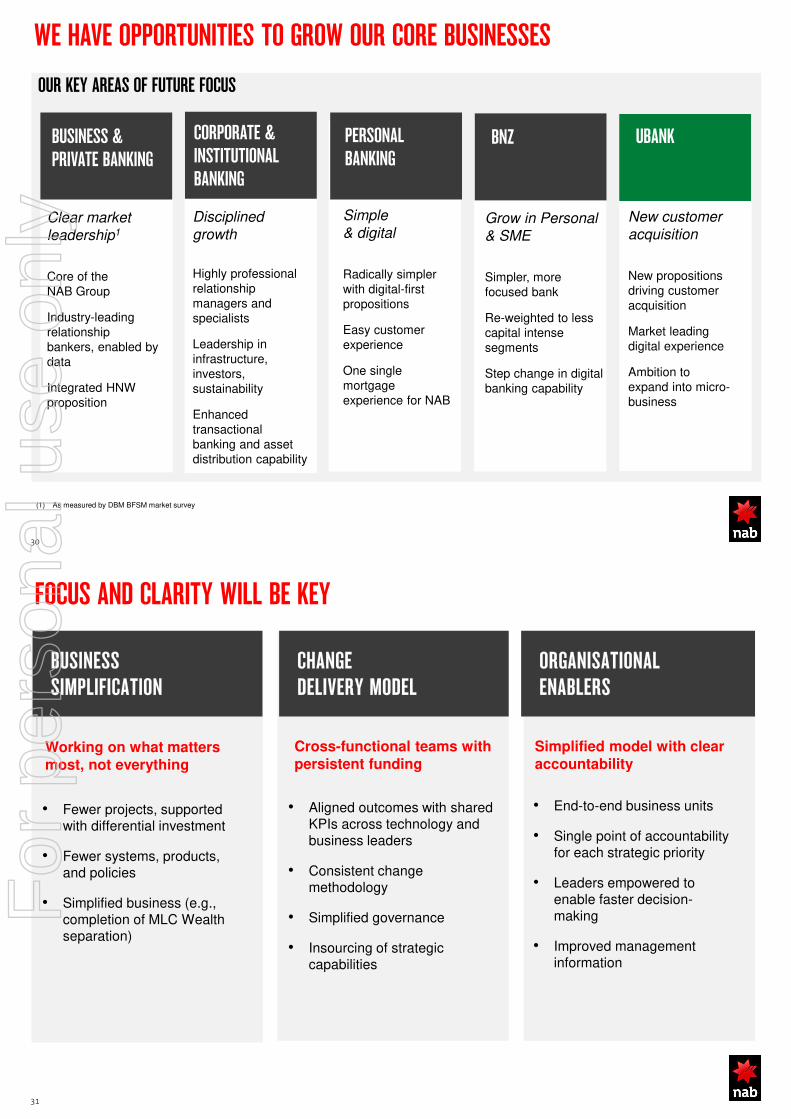
WE HAVE OPPORTUNITIES TO GROW OUR CORE BUSINESSES
BUSINESS & PRIVATE BANKING
PERSONALBANKING
Simple
& digital
Radically simpler with digital-first propositions
Easy customer experience
One single mortgage experience for NAB
CORPORATE & INSTITUTIONAL BANKING
Disciplined
growth
Highly professional relationship managers and specialists
Leadership in infrastructure, investors, sustainability
Enhanced transactional banking and asset distribution capability
BNZ
Grow in Personal
& SME
Simpler, more focused bank
Re-weighted to less capital intense segments
Step change in digital banking capability
UBANK
New customer
acquisition
New propositions driving customer acquisition
Market leading digital experience
Ambition to expand into micro-business
Clear market
leadership1
Core of the NAB Group
Industry-leading relationship bankers, enabled by data
Integrated HNW proposition
OUR KEY AREAS OF FUTURE FOCUS
(1) As measured by DBM BFSM market survey
31 200407 - Draft Market Announce ...PER
FOCUS AND CLARITY WILL BE KEY
CHANGE DELIVERY MODEL
BUSINESS SIMPLIFICATION
• Fewer projects, supported with differential investment
• Fewer systems, products, and policies
• Simplified business (e.g., completion of MLC Wealth separation)
ORGANISATIONALENABLERS
Working on what matters most, not everything
Cross-functional teams with persistent funding
Simplified model with clear accountability
• Aligned outcomes with shared KPIs across technology and business leaders
• Consistent change methodology
• Simplified governance
• Insourcing of strategic capabilities
• End-to-end business units
• Single point of accountability for each strategic priority
• Leaders empowered to enable faster decision-making
• Improved management information
For
per
sona
l use
onl
y
32 200407 - Draft Market Announce ...PER
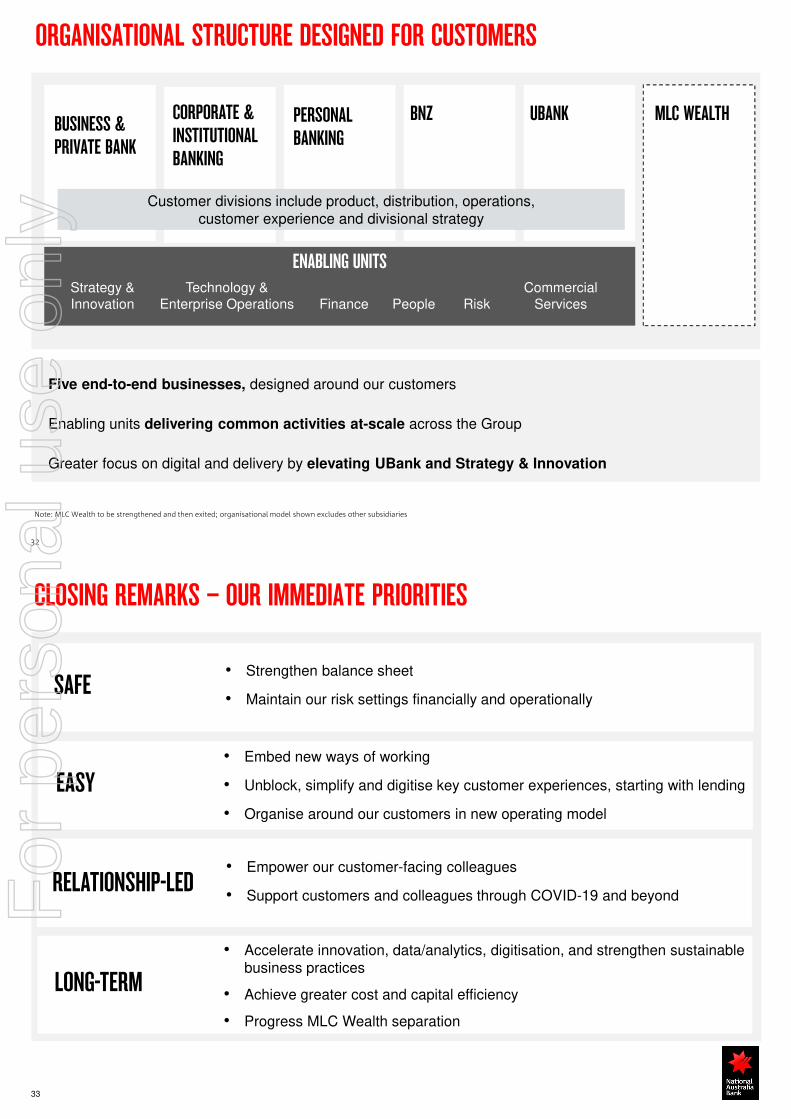
ORGANISATIONAL STRUCTURE DESIGNED FOR CUSTOMERS
Five end-to-end businesses, designed around our customers
Enabling units delivering common activities at-scale across the Group
Greater focus on digital and delivery by elevating UBank and Strategy & Innovation
Note: MLC Wealth to be strengthened and then exited; organisational model shown excludes other subsidiaries
ENABLING UNITS
PERSONAL BANKING
CORPORATE & INSTITUTIONAL BANKING
BNZBUSINESS & PRIVATE BANK
UBANK MLC WEALTH
Customer divisions include product, distribution, operations, customer experience and divisional strategy
Technology & Enterprise Operations Finance People Risk
Commercial Services
Strategy & Innovation
CLOSING REMARKS – OUR IMMEDIATE PRIORITIES
• Strengthen balance sheet
• Maintain our risk settings financially and operationallySAFE
EASY
RELATIONSHIP-LED
LONG-TERM
• Embed new ways of working
• Unblock, simplify and digitise key customer experiences, starting with lending
• Organise around our customers in new operating model
• Empower our customer-facing colleagues
• Support customers and colleagues through COVID-19 and beyond
• Accelerate innovation, data/analytics, digitisation, and strengthen sustainable business practices
• Achieve greater cost and capital efficiency
• Progress MLC Wealth separation
33
For
per
sona
l use
onl
y
ADDITIONAL INFORMATIONDIVISIONAL PERFORMANCES
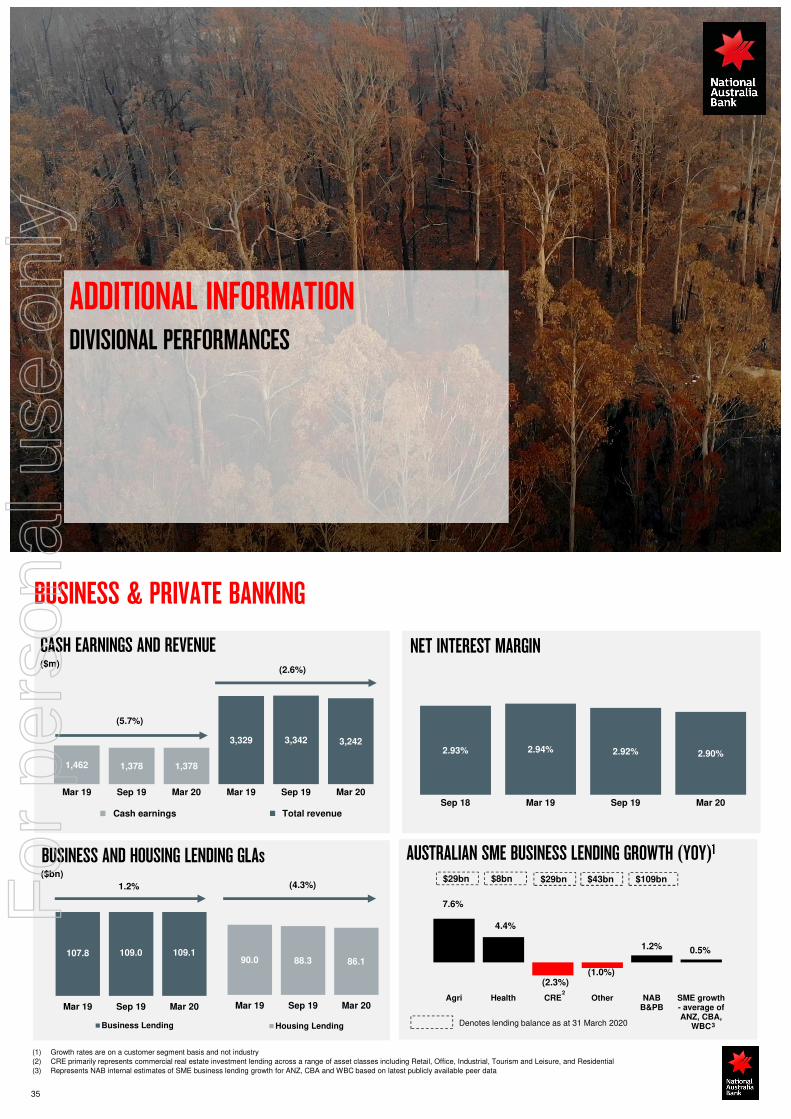
AUSTRALIAN SME BUSINESS LENDING GROWTH (YOY)1
7.6%
4.4%
(2.3%)(1.0%)
1.2% 0.5%
Agri Health CRE Other NABB&PB
SME growth- average ofANZ, CBA,
WBCDenotes lending balance as at 31 March 2020
$29bn
5,368 5,481
2,692 2,789
FY16 FY17 1H17 2H17
Total revenue
1,462 1,378 1,378
3,329 3,342 3,242
Mar 19 Sep 19 Mar 20 Mar 19 Sep 19 Mar 20
Cash earnings Total revenue
2.93% 2.94% 2.92% 2.90%
Sep 18 Mar 19 Sep 19 Mar 20
BUSINESS & PRIVATE BANKING
CASH EARNINGS AND REVENUE NET INTEREST MARGIN($m)
BUSINESS AND HOUSING LENDING GLAs($bn)
1.2%
90.0 88.3 86.1
Mar 19 Sep 19 Mar 20
Housing Lending
(4.3%)
107.8 109.0 109.1
Mar 19 Sep 19 Mar 20
Business Lending
35
(2.6%)
(5.7%)
(1) Growth rates are on a customer segment basis and not industry
(2) CRE primarily represents commercial real estate investment lending across a range of asset classes including Retail, Office, Industrial, Tourism and Leisure, and Residential
(3) Represents NAB internal estimates of SME business lending growth for ANZ, CBA and WBC based on latest publicly available peer data
3
2
$8bn $29bn $43bn $109bnFor
per
sona
l use
onl
y
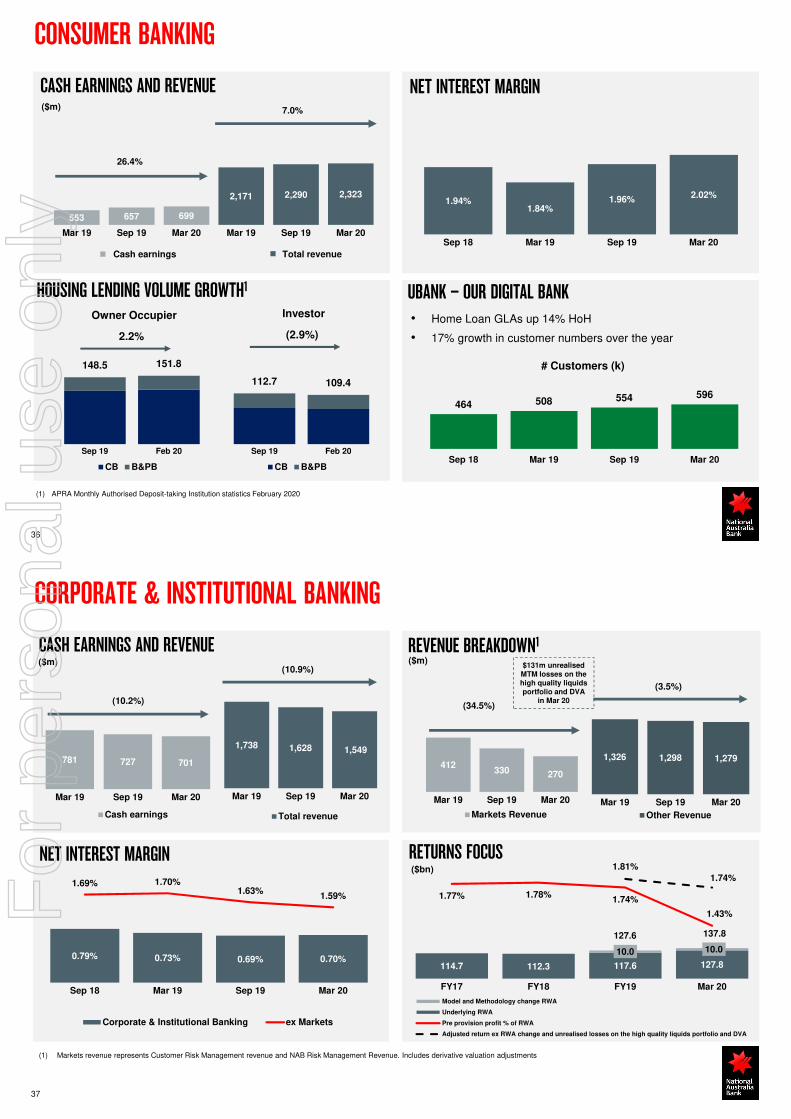
CONSUMER BANKING
NET INTEREST MARGINCASH EARNINGS AND REVENUE($m)
36
1.94%1.84%
1.96%2.02%
Sep 18 Mar 19 Sep 19 Mar 20
553 657 699
2,171 2,290 2,323
Mar 19 Sep 19 Mar 20 Mar 19 Sep 19 Mar 20
Cash earnings Total revenue
7.0%
26.4%
HOUSING LENDING VOLUME GROWTH1
148.5 151.8
Sep 19 Feb 20
CB B&PB
2.2%
Owner Occupier
112.7 109.4
Sep 19 Feb 20
CB B&PB
(2.9%)
Investor
UBANK – OUR DIGITAL BANK
• Home Loan GLAs up 14% HoH
• 17% growth in customer numbers over the year
464 508 554 596
Sep 18 Mar 19 Sep 19 Mar 20
# Customers (k)
(1) APRA Monthly Authorised Deposit-taking Institution statistics February 2020
114.7 112.3 117.6 127.8
10.0 10.0
127.6 137.8
1.77% 1.78%1.74%
1.43%
1.81%
1.74%
1.00%0
250
500
FY17 FY18 FY19 Mar 20
Model and Methodology change RWA
Underlying RWA
Pre provision profit % of RWA
Adjusted return ex RWA change and unrealised losses on the high quality liquids portfolio and DVA
RETURNS FOCUS
0.79% 0.73% 0.69% 0.70%
1.69% 1.70%1.63%
1.59%
Sep 18 Mar 19 Sep 19 Mar 20
Corporate & Institutional Banking ex Markets
1,738 1,628 1,549
Mar 19 Sep 19 Mar 20
Total revenue
CORPORATE & INSTITUTIONAL BANKING
CASH EARNINGS AND REVENUE
NET INTEREST MARGIN
($m)
($bn)
781 727 701
Mar 19 Sep 19 Mar 20
Cash earnings
(10.2%)
(1) Markets revenue represents Customer Risk Management revenue and NAB Risk Management Revenue. Includes derivative valuation adjustments
412330 270
Mar 19 Sep 19 Mar 20
Markets Revenue
1,326 1,298 1,279
Mar 19 Sep 19 Mar 20
Other Revenue
(3.5%)
(34.5%)
REVENUE BREAKDOWN1
($m)(10.9%)
37
$131m unrealised MTM losses on the high quality liquidsportfolio and DVA
in Mar 20
For
per
sona
l use
onl
y
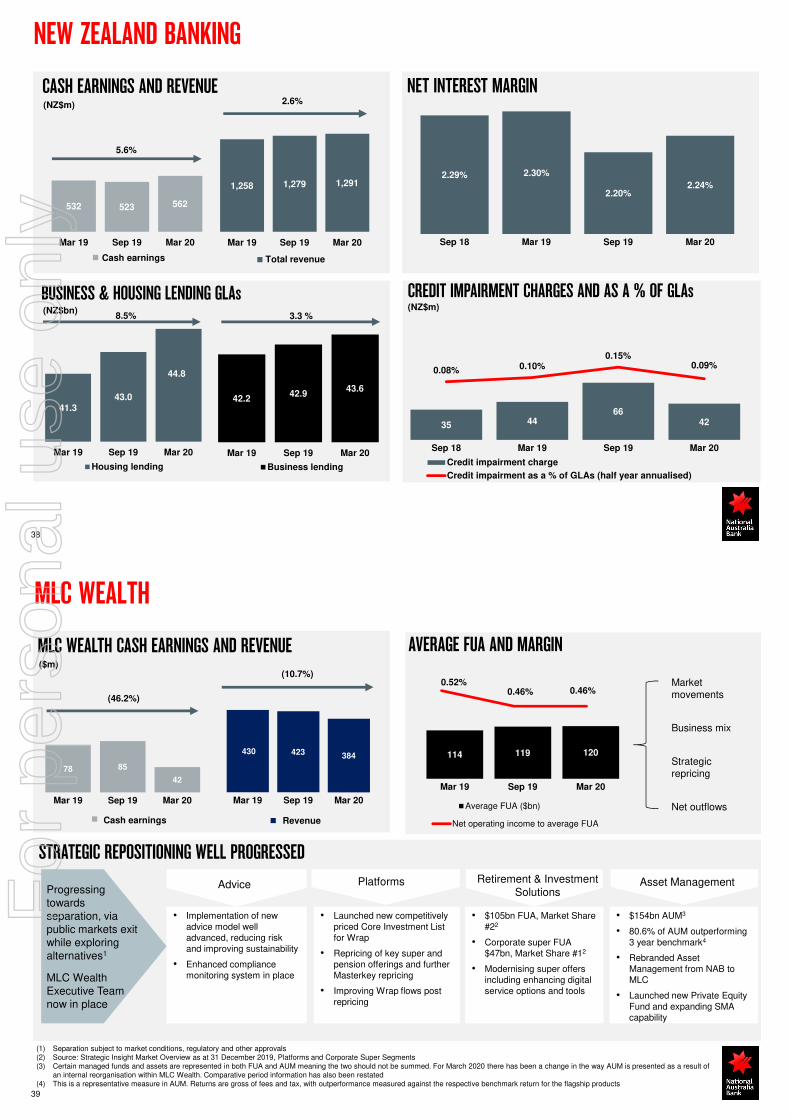
35 4466
42
0.08% 0.10%0.15%
0.09%
-0.20%0
90
Sep 18 Mar 19 Sep 19 Mar 20
Credit impairment charge
Credit impairment as a % of GLAs (half year annualised)
532 523 562
Mar 19 Sep 19 Mar 20
Cash earnings
1,258 1,279 1,291
Mar 19 Sep 19 Mar 20
Total revenue
NEW ZEALAND BANKING
(NZ$m)
2.29% 2.30%
2.20%2.24%
Sep 18 Mar 19 Sep 19 Mar 20
NET INTEREST MARGINCASH EARNINGS AND REVENUE
5.6%
(NZ$bn)
2.6%
38
42.242.9
43.6
Mar 19 Sep 19 Mar 20
Business lending
3.3 %
BUSINESS & HOUSING LENDING GLAs CREDIT IMPAIRMENT CHARGES AND AS A % OF GLAs
41.343.0
44.8
Mar 19 Sep 19 Mar 20
Housing lending
8.5%(NZ$m)
MLC WEALTH
(1) Separation subject to market conditions, regulatory and other approvals(2) Source: Strategic Insight Market Overview as at 31 December 2019, Platforms and Corporate Super Segments(3) Certain managed funds and assets are represented in both FUA and AUM meaning the two should not be summed. For March 2020 there has been a change in the way AUM is presented as a result of
an internal reorganisation within MLC Wealth. Comparative period information has also been restated(4) This is a representative measure in AUM. Returns are gross of fees and tax, with outperformance measured against the respective benchmark return for the flagship products
Progressing towards separation, via public markets exit while exploring alternatives1
MLC Wealth Executive Team now in place
STRATEGIC REPOSITIONING WELL PROGRESSED
Retirement & Investment Solutions
Advice Platforms Asset Management
• Implementation of new advice model well advanced, reducing risk and improving sustainability
• Enhanced compliance monitoring system in place
• Launched new competitively priced Core Investment List for Wrap
• Repricing of key super and pension offerings and further Masterkey repricing
• Improving Wrap flows post repricing
• $105bn FUA, Market Share #22
• Corporate super FUA $47bn, Market Share #12
• Modernising super offers including enhancing digital service options and tools
• $154bn AUM3
• 80.6% of AUM outperforming 3 year benchmark4
• Rebranded Asset Management from NAB to MLC
• Launched new Private Equity Fund and expanding SMA capability
AVERAGE FUA AND MARGIN
0.52%0.46%
Net operating income to average FUA
114 119 120
Mar 19 Sep 19 Mar 20
Average FUA ($bn)
Market movements
Business mix
Strategic repricing
Net outflows
39
430 423 384
Mar 19 Sep 19 Mar 20
Revenue
MLC WEALTH CASH EARNINGS AND REVENUE
Cash earnings
($m)
(46.2%)
(10.7%)
78 85
42
Mar 19 Sep 19 Mar 20
0.46%
For
per
sona
l use
onl
y
ADDITIONAL INFORMATIONNAB AND OUR COMMUNITY
NAB AND OUR COMMUNITY
41
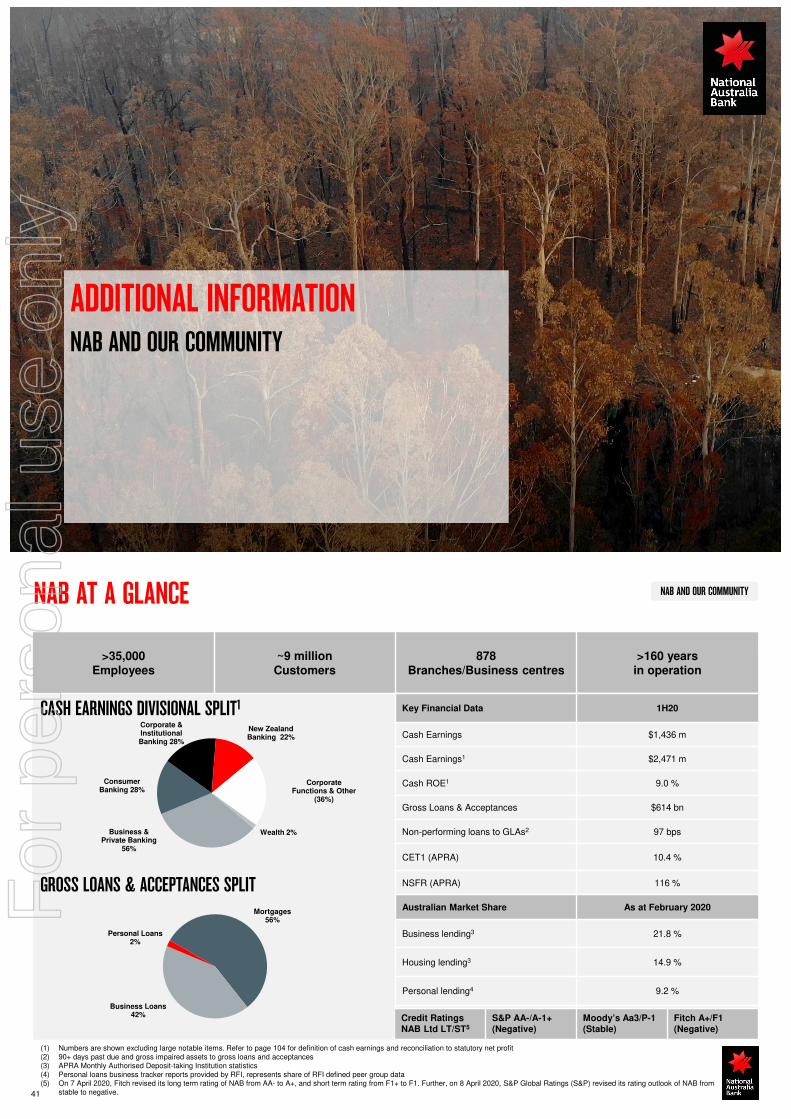
>35,000Employees
~9 millionCustomers
878Branches/Business centres
>160 yearsin operation
Key Financial Data 1H20
Cash Earnings $1,436 m
Cash Earnings1 $2,471 m
Cash ROE1 9.0 %
Gross Loans & Acceptances $614 bn
Non-performing loans to GLAs2 97 bps
CET1 (APRA) 10.4 %
NSFR (APRA) 116 %
Australian Market Share As at February 2020
Business lending3 21.8 %
Housing lending3 14.9 %
Personal lending4 9.2 %
Cards3 13.1%Credit RatingsNAB Ltd LT/ST5
S&P AA-/A-1+(Negative)
Moody’s Aa3/P-1(Stable)
Fitch A+/F1(Negative)
GROSS LOANS & ACCEPTANCES SPLIT
CASH EARNINGS DIVISIONAL SPLIT1
(1) Numbers are shown excluding large notable items. Refer to page 104 for definition of cash earnings and reconciliation to statutory net profit(2) 90+ days past due and gross impaired assets to gross loans and acceptances(3) APRA Monthly Authorised Deposit-taking Institution statistics(4) Personal loans business tracker reports provided by RFI, represents share of RFI defined peer group data(5) On 7 April 2020, Fitch revised its long term rating of NAB from AA- to A+, and short term rating from F1+ to F1. Further, on 8 April 2020, S&P Global Ratings (S&P) revised its rating outlook of NAB from
stable to negative.
NAB AT A GLANCE
Mortgages56%
Business Loans42%
Personal Loans 2%
Update
Business & Private Banking
56%
Consumer Banking 28%
Corporate & Institutional Banking 28%
New Zealand Banking 22%
Corporate Functions & Other
(36%)
Wealth 2%
For
per
sona
l use
onl
y

NAB AND OUR COMMUNITYUPDATE ON SELF-ASSESSMENT AND ROYAL COMMISSION RESPONSE
42
ROYAL COMMISSION RESPONSE
8
29
32
7
76 Royal Commissionrecommendations
Completed
No action required by NAB (including
awaiting future reviews)
In progress (including those
pending legislation, or regulatory or
industry guidance)
Not applicable to NAB
• Working with Government
To formulate legislation that addresses 22 of the Royal Commission recommendations
• Default Interest
Ceased charging default interest to agri customers in drought declared and other natural disaster areas
• Greater access to banking
services with new Banking
Code of Practice adopted
New measures to support vulnerable customers including new Framework for Customers Experiencing Vulnerability
• Indigenous services
Created Indigenous Customer Service Telephone Line to improve access for Aboriginal and Torres Strait Islander customers, particularly those living in remote areas
APRA SELF-ASSESSMENT RESPONSE
Customer First
• Brought voice of the customer to Executive and Board governance committees to place customers’ interests at the forefront of decision-making.
• Everyday Banking, Home Lending and Unsecured Lending products were reviewed in response to customer needs.
• Enterprise-wide program led by ELT, overseen by NAB Board, with 150-strong working group
Improving risk and
accountab-ility
Finding and fixing
issues
Better Delivery
Realising NAB’s desired culture
• Increased focus on frontline technology upgrades, processes and capabilities to improve the rigour and discipline of our delivery.
• 43% decline in ‘Critical and High’ incidents in 1H20.
• Delivered single NAB wide leadership program to reiterate cultural priorities and set clear expectations of the role our leaders play as curators of culture
• Improved depth and rigour of senior executive's risk performance assessment and their contribution to managing risk and compliance
• Brought more rigour and discipline in the areas of conduct, compliance and operational risk through:
• Implementing an improved Conduct Risk Framework to enable 1st and 2nd line to manage conduct risk with key focus on customers
• Introduced consistent approach to design, govern and report controls to achieve compliant processes and better outcomes.
• Established fully resourced Customer Remediation team to resolve complex cross-divisional issues and complaints.
• Aligned breach reporting metrics for management and Board to speed up identification & resolution of critical issues.
NAB AND OUR COMMUNITY
43
OUR SOCIAL IMPACT STRATEGY
Our prioritised goals to address significant long-term environmental and social challenges facing our business and community
Financial Health Stronger Communities
Climate ActionBanking On Nature
Helping people reducefinancial stress andfeel more in control
of their money
Creating more sustainable, accessible and inclusive
communities across Australia
Working with communities to ensure they are more resilient
to climate change, and supporting a low-carbon
economy
Driving investment in natural assets to improve the
wellbeing of our communities, including natural disaster recovery and resilience
Aligned to five key United Nations Sustainable Development Goals1 –where we can make the biggest impact
(1) www.un.org/sustainabledevelopment
For
per
sona
l use
onl
y
NAB AND OUR COMMUNITY
CUSTOMER SUPPORT HUB
1H20 HIGHLIGHTS
FINANCIAL HEALTH
44
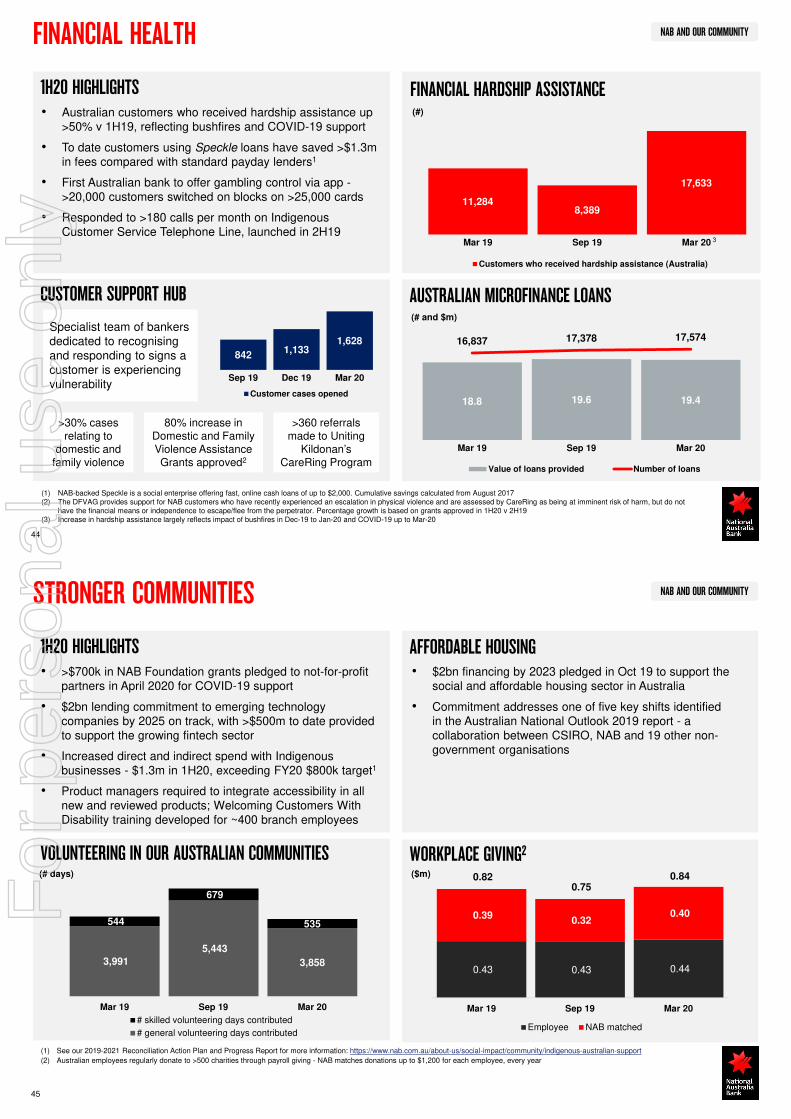
FINANCIAL HARDSHIP ASSISTANCE • Australian customers who received hardship assistance up
>50% v 1H19, reflecting bushfires and COVID-19 support
• To date customers using Speckle loans have saved >$1.3m in fees compared with standard payday lenders1
• First Australian bank to offer gambling control via app ->20,000 customers switched on blocks on >25,000 cards
• Responded to >180 calls per month on Indigenous Customer Service Telephone Line, launched in 2H19
>30% cases relating to
domestic and family violence
80% increase in Domestic and Family Violence Assistance Grants approved2
(1) NAB-backed Speckle is a social enterprise offering fast, online cash loans of up to $2,000. Cumulative savings calculated from August 2017(2) The DFVAG provides support for NAB customers who have recently experienced an escalation in physical violence and are assessed by CareRing as being at imminent risk of harm, but do not
have the financial means or independence to escape/flee from the perpetrator. Percentage growth is based on grants approved in 1H20 v 2H19(3) Increase in hardship assistance largely reflects impact of bushfires in Dec-19 to Jan-20 and COVID-19 up to Mar-20
11,2848,389
17,633
Mar 19 Sep 19 Mar 20
Customers who received hardship assistance (Australia)
(#)
Specialist team of bankers dedicated to recognising and responding to signs a customer is experiencing vulnerability
>360 referrals made to Uniting
Kildonan’sCareRing Program
8421,133
1,628
Sep 19 Dec 19 Mar 20
Customer cases opened
4
3
18.8 19.6 19.4
16,837 17,378 17,574
Mar 19 Sep 19 Mar 20
Value of loans provided Number of loans
AUSTRALIAN MICROFINANCE LOANS (# and $m)
NAB AND OUR COMMUNITY
VOLUNTEERING IN OUR AUSTRALIAN COMMUNITIES
1H20 HIGHLIGHTS
STRONGER COMMUNITIES
45
• >$700k in NAB Foundation grants pledged to not-for-profit partners in April 2020 for COVID-19 support
• $2bn lending commitment to emerging technology companies by 2025 on track, with >$500m to date provided to support the growing fintech sector
• Increased direct and indirect spend with Indigenous businesses - $1.3m in 1H20, exceeding FY20 $800k target1
• Product managers required to integrate accessibility in all new and reviewed products; Welcoming Customers With Disability training developed for ~400 branch employees
AFFORDABLE HOUSING
(1) See our 2019-2021 Reconciliation Action Plan and Progress Report for more information: https://www.nab.com.au/about-us/social-impact/community/indigenous-australian-support
(2) Australian employees regularly donate to >500 charities through payroll giving - NAB matches donations up to $1,200 for each employee, every year
(# days)
• $2bn financing by 2023 pledged in Oct 19 to support the social and affordable housing sector in Australia
• Commitment addresses one of five key shifts identified in the Australian National Outlook 2019 report - a collaboration between CSIRO, NAB and 19 other non-government organisations
3,991
5,443
3,858
544
679
535
Mar 19 Sep 19 Mar 20
# skilled volunteering days contributed
# general volunteering days contributed
WORKPLACE GIVING2
0.43 0.43 0.44
0.39 0.32
0.40
0.82 0.75
0.84
Mar 19 Sep 19 Mar 20
Employee NAB matched
($m)
For
per
sona
l use
onl
y
NAB AND OUR COMMUNITY
0.40
0.40
0.12
Donations ($m)
Local organisations
ARC disaster & recovery
ARC resilience project
BUSHFIRE RECOVERY AND RESILIENCE PACKAGE
BANKING ON NATURE
46
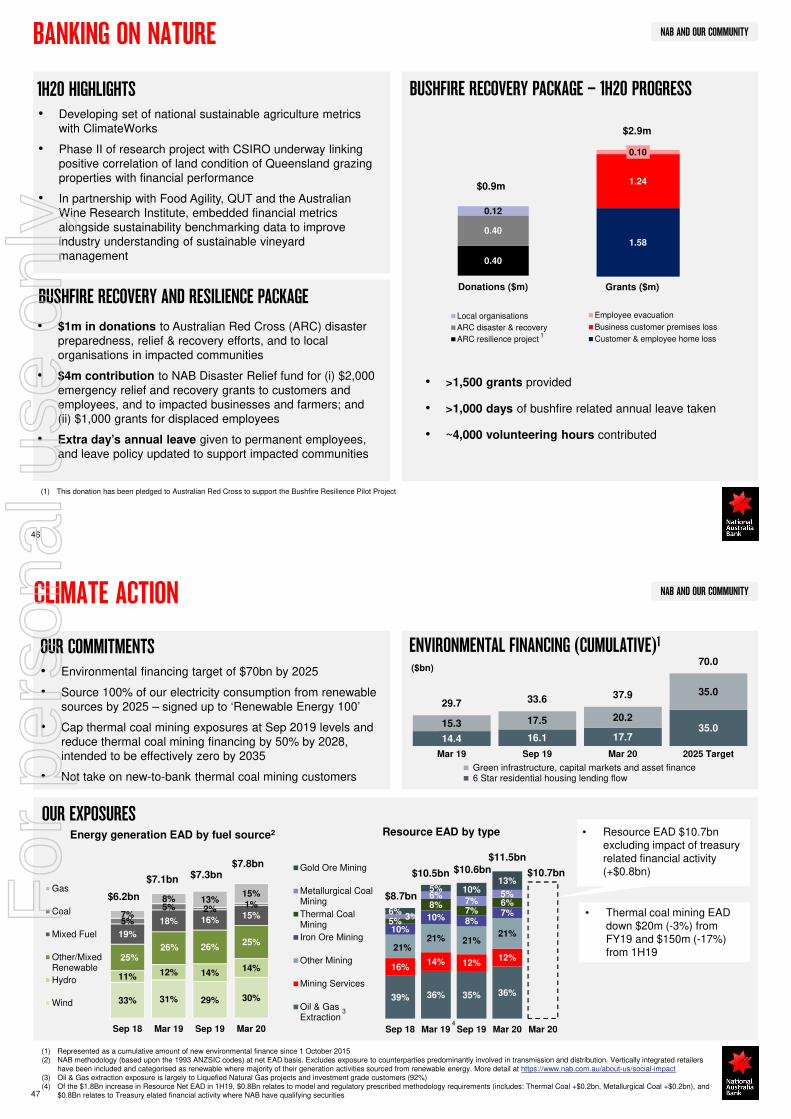
• Developing set of national sustainable agriculture metrics with ClimateWorks
• Phase II of research project with CSIRO underway linking positive correlation of land condition of Queensland grazing properties with financial performance
• In partnership with Food Agility, QUT and the Australian Wine Research Institute, embedded financial metrics alongside sustainability benchmarking data to improve industry understanding of sustainable vineyard management
1H20 HIGHLIGHTS BUSHFIRE RECOVERY PACKAGE – 1H20 PROGRESS
• $1m in donations to Australian Red Cross (ARC) disaster preparedness, relief & recovery efforts, and to local organisations in impacted communities
• $4m contribution to NAB Disaster Relief fund for (i) $2,000 emergency relief and recovery grants to customers and employees, and to impacted businesses and farmers; and (ii) $1,000 grants for displaced employees
• Extra day’s annual leave given to permanent employees, and leave policy updated to support impacted communities
1.58
1.24
0.10
Grants ($m and #)
Employee evacuation
Business customer premises loss
Customer & employee home loss
$0.9m
(1) This donation has been pledged to Australian Red Cross to support the Bushfire Resilience Pilot Project
$2.9m
Grants ($m)
• >1,500 grants provided
• >1,000 days of bushfire related annual leave taken
• ~4,000 volunteering hours contributed
1
NAB AND OUR COMMUNITYCLIMATE ACTION
47
• Environmental financing target of $70bn by 2025
• Source 100% of our electricity consumption from renewable sources by 2025 – signed up to ‘Renewable Energy 100’
• Cap thermal coal mining exposures at Sep 2019 levels and reduce thermal coal mining financing by 50% by 2028, intended to be effectively zero by 2035
• Not take on new-to-bank thermal coal mining customers
ENVIRONMENTAL FINANCING (CUMULATIVE)1OUR COMMITMENTS
14.4 16.1 17.735.015.3 17.5 20.2
35.029.7 33.6 37.9
70.0
Mar 19 Sep 19 Mar 20 2025 Target
Green infrastructure, capital markets and asset finance 6 Star residential housing lending flow
OUR EXPOSURESEnergy generation EAD by fuel source2 Resource EAD by type
(1) Represented as a cumulative amount of new environmental finance since 1 October 2015(2) NAB methodology (based upon the 1993 ANZSIC codes) at net EAD basis. Excludes exposure to counterparties predominantly involved in transmission and distribution. Vertically integrated retailers
have been included and categorised as renewable where majority of their generation activities sourced from renewable energy. More detail at https://www.nab.com.au/about-us/social-impact(3) Oil & Gas extraction exposure is largely to Liquefied Natural Gas projects and investment grade customers (92%)(4) Of the $1.8Bn increase in Resource Net EAD in 1H19, $0.8Bn relates to model and regulatory prescribed methodology requirements (includes: Thermal Coal +$0.2bn, Metallurgical Coal +$0.2bn), and
$0.8Bn relates to Treasury elated financial activity where NAB have qualifying securities
($bn)
33% 31% 29% 30%
11% 12% 14%14%
25%26% 26%
25%19%
18% 16%15%
5%
5% 2%1%
7%
8% 13%15%
Sep 18 Mar 19 Sep 19 Mar 20
Gas
Coal
Mixed Fuel
Other/MixedRenewable
Hydro
Wind
$6.2bn
$7.1bn $7.3bn$7.8bn
39% 36% 35% 36%
16%14% 12%
12%21%
21% 21%21%10%
10% 8%7%
5%
8%7%
6%
3%
6%7%
5%
6%
5% 10%13%
Sep 18 Mar 19 Sep 19 Mar 20 Mar 20
Gold Ore Mining
Metallurgical CoalMining
Thermal CoalMining
Iron Ore Mining
Other Mining
Mining Services
Oil & GasExtraction
$8.7bn
$10.5bn $10.6bn$11.5bn
4
3
• Thermal coal mining EAD down $20m (-3%) from FY19 and $150m (-17%) from 1H19
$10.7bn
• Resource EAD $10.7bn excluding impact of treasury related financial activity (+$0.8bn)
For
per
sona
l use
onl
y
NAB AND OUR COMMUNITYCLIMATE ACTION
48
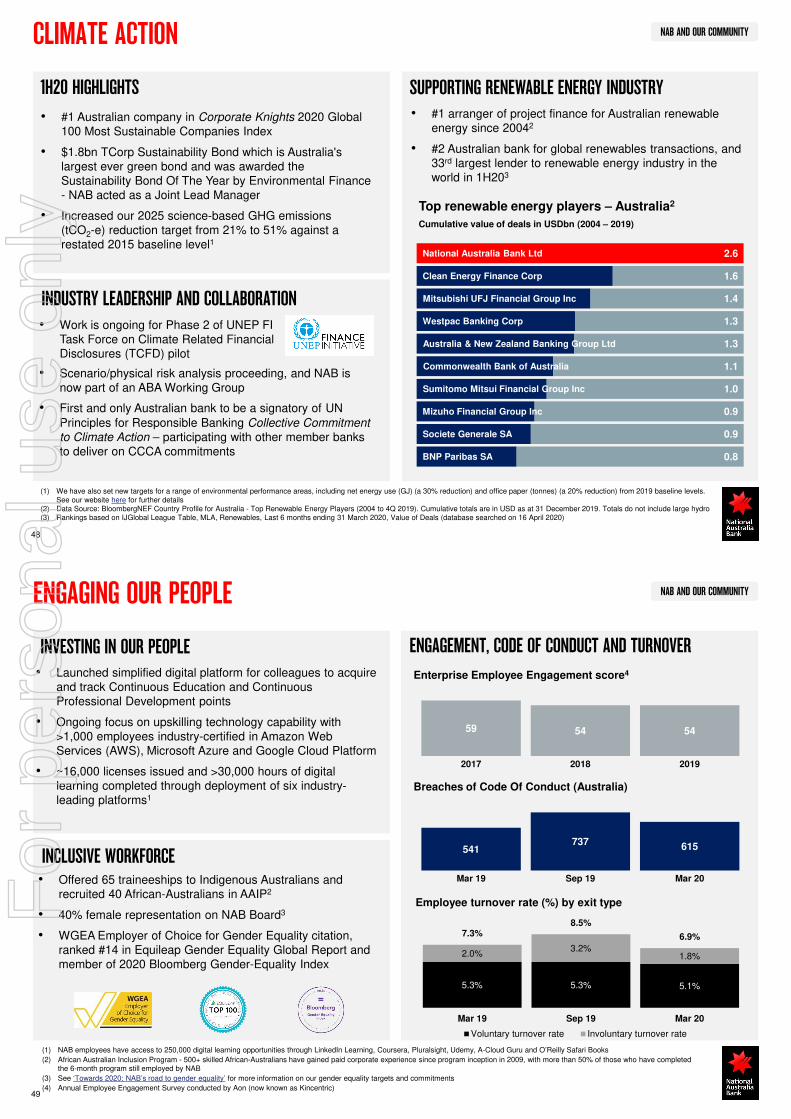
• #1 Australian company in Corporate Knights 2020 Global 100 Most Sustainable Companies Index
• $1.8bn TCorp Sustainability Bond which is Australia's largest ever green bond and was awarded the Sustainability Bond Of The Year by Environmental Finance - NAB acted as a Joint Lead Manager
• Increased our 2025 science-based GHG emissions (tCO2-e) reduction target from 21% to 51% against a restated 2015 baseline level1
SUPPORTING RENEWABLE ENERGY INDUSTRY
Cumulative value of deals in USDbn (2004 – 2019)
1H20 HIGHLIGHTS• #1 arranger of project finance for Australian renewable
energy since 20042
• #2 Australian bank for global renewables transactions, and 33rd largest lender to renewable energy industry in the world in 1H203
(1) We have also set new targets for a range of environmental performance areas, including net energy use (GJ) (a 30% reduction) and office paper (tonnes) (a 20% reduction) from 2019 baseline levels. See our website here for further details
(2) Data Source: BloombergNEF Country Profile for Australia - Top Renewable Energy Players (2004 to 4Q 2019). Cumulative totals are in USD as at 31 December 2019. Totals do not include large hydro(3) Rankings based on IJGlobal League Table, MLA, Renewables, Last 6 months ending 31 March 2020, Value of Deals (database searched on 16 April 2020)
Top renewable energy players – Australia2
• Scenario/physical risk analysis proceeding, and NAB is now part of an ABA Working Group
• First and only Australian bank to be a signatory of UN Principles for Responsible Banking Collective Commitment
to Climate Action – participating with other member banks to deliver on CCCA commitments
INDUSTRY LEADERSHIP AND COLLABORATION• Work is ongoing for Phase 2 of UNEP FI
Task Force on Climate Related Financial Disclosures (TCFD) pilot
BNP Paribas SA
Societe Generale SA
Mizuho Financial Group Inc
Sumitomo Mitsui Financial Group Inc
Commonwealth Bank of Australia
Australia & New Zealand Banking Group Ltd
Westpac Banking Corp
Mitsubishi UFJ Financial Group Inc
Clean Energy Finance Corp
National Australia Bank Ltd
0.8
0.9
0.9
1.0
1.1
1.3
1.3
1.4
1.6
2.6
NAB AND OUR COMMUNITY
INCLUSIVE WORKFORCE
ENGAGEMENT, CODE OF CONDUCT AND TURNOVERINVESTING IN OUR PEOPLE
ENGAGING OUR PEOPLE
49
Enterprise Employee Engagement score4
Employee turnover rate (%) by exit type
59 54 54
2017 2018 2019
Breaches of Code Of Conduct (Australia)
541737 615
Mar 19 Sep 19 Mar 20• Offered 65 traineeships to Indigenous Australians and recruited 40 African-Australians in AAIP2
• 40% female representation on NAB Board3
• WGEA Employer of Choice for Gender Equality citation, ranked #14 in Equileap Gender Equality Global Report and member of 2020 Bloomberg Gender-Equality Index
• Launched simplified digital platform for colleagues to acquire and track Continuous Education and Continuous Professional Development points
• Ongoing focus on upskilling technology capability with >1,000 employees industry-certified in Amazon Web Services (AWS), Microsoft Azure and Google Cloud Platform
• ~16,000 licenses issued and >30,000 hours of digital learning completed through deployment of six industry-leading platforms1
(1) NAB employees have access to 250,000 digital learning opportunities through LinkedIn Learning, Coursera, Pluralsight, Udemy, A-Cloud Guru and O’Reilly Safari Books
(2) African Australian Inclusion Program - 500+ skilled African-Australians have gained paid corporate experience since program inception in 2009, with more than 50% of those who have completed the 6-month program still employed by NAB
(3) See ‘Towards 2020: NAB’s road to gender equality’ for more information on our gender equality targets and commitments
(4) Annual Employee Engagement Survey conducted by Aon (now known as Kincentric)
5.1%5.3%5.3%
1.8%3.2%
2.0%
6.9%
8.5%7.3%
Mar 20Sep 19Mar 19
Voluntary turnover rate Involuntary turnover rate
For
per
sona
l use
onl
y
ADDITIONAL INFORMATIONAUSTRALIAN CUSTOMER EXPERIENCE
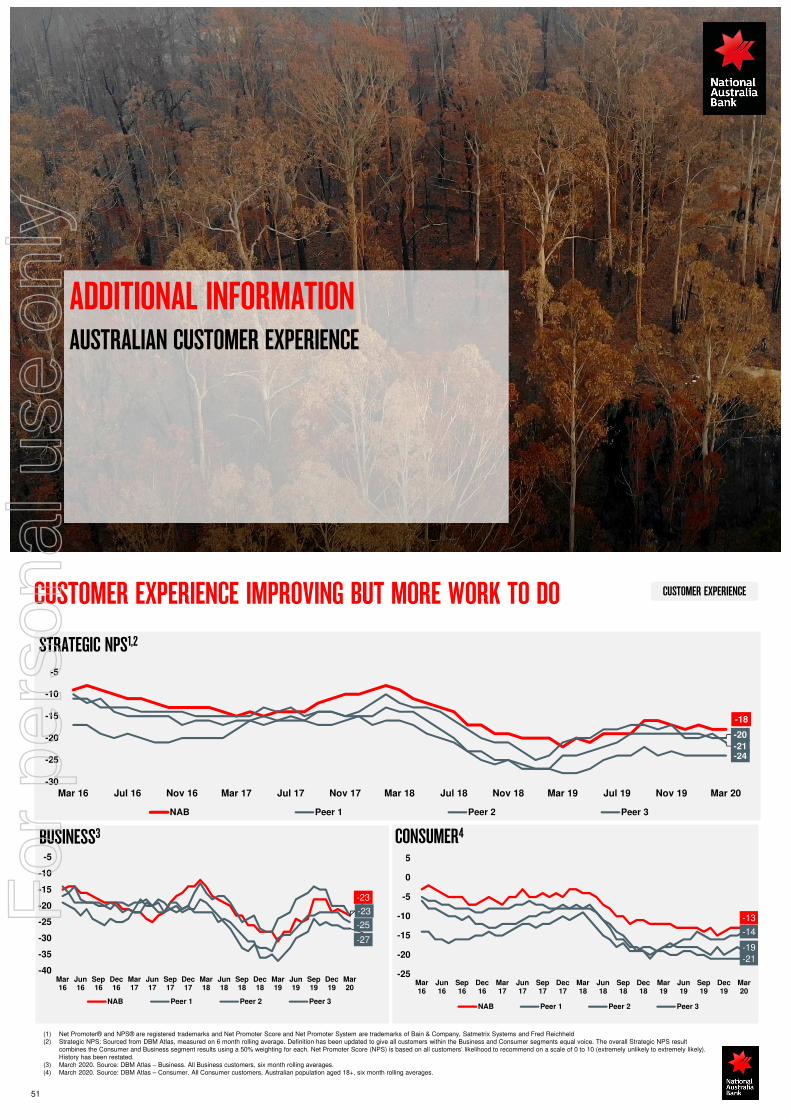
CUSTOMER EXPERIENCE
STRATEGIC NPS1,2
51
-18
-24
-20
-21
-30
-25
-20
-15
-10
-5
Mar 16 Jul 16 Nov 16 Mar 17 Jul 17 Nov 17 Mar 18 Jul 18 Nov 18 Mar 19 Jul 19 Nov 19 Mar 20
NAB Peer 1 Peer 2 Peer 3
(1) Net Promoter® and NPS® are registered trademarks and Net Promoter Score and Net Promoter System are trademarks of Bain & Company, Satmetrix Systems and Fred Reichheld (2) Strategic NPS: Sourced from DBM Atlas, measured on 6 month rolling average. Definition has been updated to give all customers within the Business and Consumer segments equal voice. The overall Strategic NPS result
combines the Consumer and Business segment results using a 50% weighting for each. Net Promoter Score (NPS) is based on all customers’ likelihood to recommend on a scale of 0 to 10 (extremely unlikely to extremely likely). History has been restated.
(3) March 2020. Source: DBM Atlas – Business. All Business customers, six month rolling averages. (4) March 2020. Source: DBM Atlas – Consumer. All Consumer customers, Australian population aged 18+, six month rolling averages.
-13
-21
-14
-19
-25
-20
-15
-10
-5
0
5
Mar16
Jun16
Sep16
Dec16
Mar17
Jun17
Sep17
Dec17
Mar18
Jun18
Sep18
Dec18
Mar19
Jun19
Sep19
Dec19
Mar20
NAB Peer 1 Peer 2 Peer 3
-23
-27
-25
-23
-40
-35
-30
-25
-20
-15
-10
-5
Mar16
Jun16
Sep16
Dec16
Mar17
Jun17
Sep17
Dec17
Mar18
Jun18
Sep18
Dec18
Mar19
Jun19
Sep19
Dec19
Mar20
NAB Peer 1 Peer 2 Peer 3
CONSUMER4BUSINESS3
CUSTOMER EXPERIENCE IMPROVING BUT MORE WORK TO DO
For
per
sona
l use
onl
y
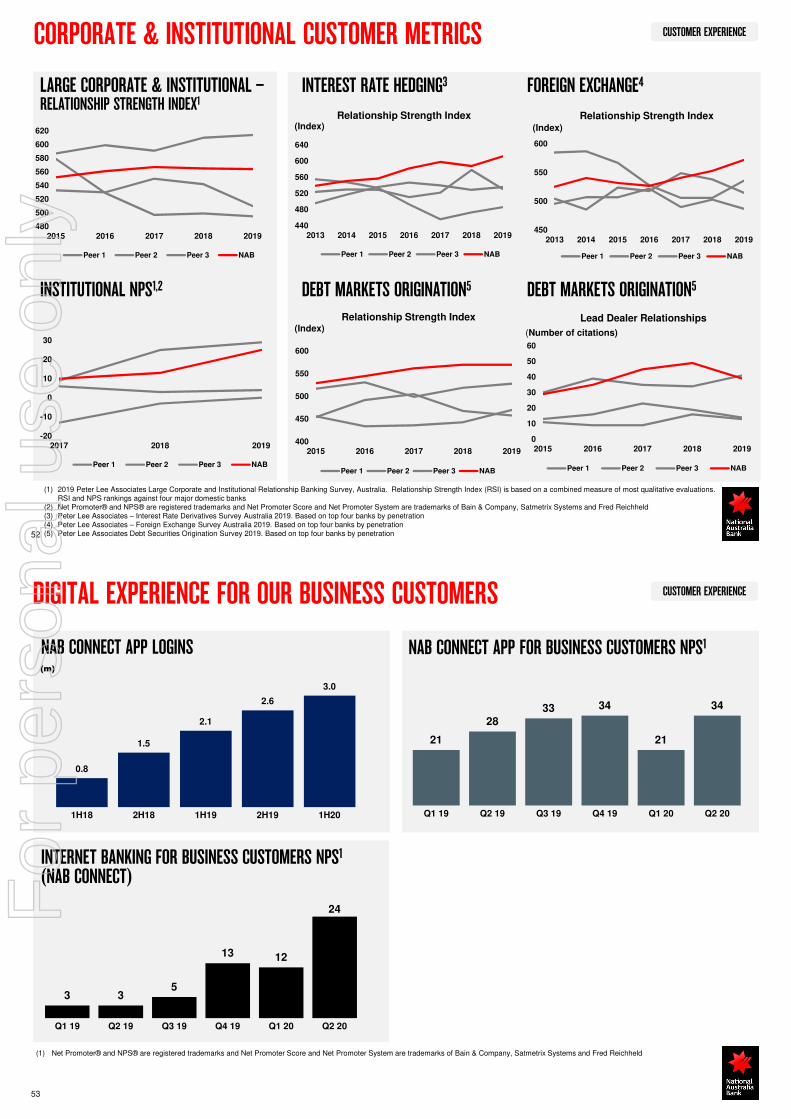
CUSTOMER EXPERIENCECORPORATE & INSTITUTIONAL CUSTOMER METRICS
LARGE CORPORATE & INSTITUTIONAL –RELATIONSHIP STRENGTH INDEX1
INSTITUTIONAL NPS1,2
(1) 2019 Peter Lee Associates Large Corporate and Institutional Relationship Banking Survey, Australia. Relationship Strength Index (RSI) is based on a combined measure of most qualitative evaluations. RSI and NPS rankings against four major domestic banks
(2) Net Promoter® and NPS® are registered trademarks and Net Promoter Score and Net Promoter System are trademarks of Bain & Company, Satmetrix Systems and Fred Reichheld(3) Peter Lee Associates – Interest Rate Derivatives Survey Australia 2019. Based on top four banks by penetration(4) Peter Lee Associates – Foreign Exchange Survey Australia 2019. Based on top four banks by penetration(5) Peter Lee Associates Debt Securities Origination Survey 2019. Based on top four banks by penetration52
440
480
520
560
600
640
2013 2014 2015 2016 2017 2018 2019
Peer 1 Peer 2 Peer 3 NAB
450
500
550
600
2013 2014 2015 2016 2017 2018 2019
Peer 1 Peer 2 Peer 3 NAB
INTEREST RATE HEDGING3 FOREIGN EXCHANGE4
400
450
500
550
600
2015 2016 2017 2018 2019
Peer 1 Peer 2 Peer 3 NAB
(Index)Relationship Strength Index
DEBT MARKETS ORIGINATION5
0
10
20
30
40
50
60
2015 2016 2017 2018 2019
Peer 1 Peer 2 Peer 3 NAB
Lead Dealer Relationships
(Number of citations)
DEBT MARKETS ORIGINATION5
Relationship Strength Index Relationship Strength Index(Index) (Index)
-20
-10
0
10
20
30
2017 2018 2019
Peer 1 Peer 2 Peer 3 NAB
480
500
520
540
560
580
600
620
2015 2016 2017 2018 2019
Peer 1 Peer 2 Peer 3 NAB
CUSTOMER EXPERIENCEDIGITAL EXPERIENCE FOR OUR BUSINESS CUSTOMERS
53
NAB CONNECT APP LOGINS(m)
INTERNET BANKING FOR BUSINESS CUSTOMERS NPS1
(NAB CONNECT)
(1) Net Promoter® and NPS® are registered trademarks and Net Promoter Score and Net Promoter System are trademarks of Bain & Company, Satmetrix Systems and Fred Reichheld
NAB CONNECT APP FOR BUSINESS CUSTOMERS NPS1
21
2833 34
21
34
Q1 19 Q2 19 Q3 19 Q4 19 Q1 20 Q2 20
0.8
1.5
2.1
2.6
3.0
1H18 2H18 1H19 2H19 1H20
3 35
13 12
24
Q1 19 Q2 19 Q3 19 Q4 19 Q1 20 Q2 20
For
per
sona
l use
onl
y
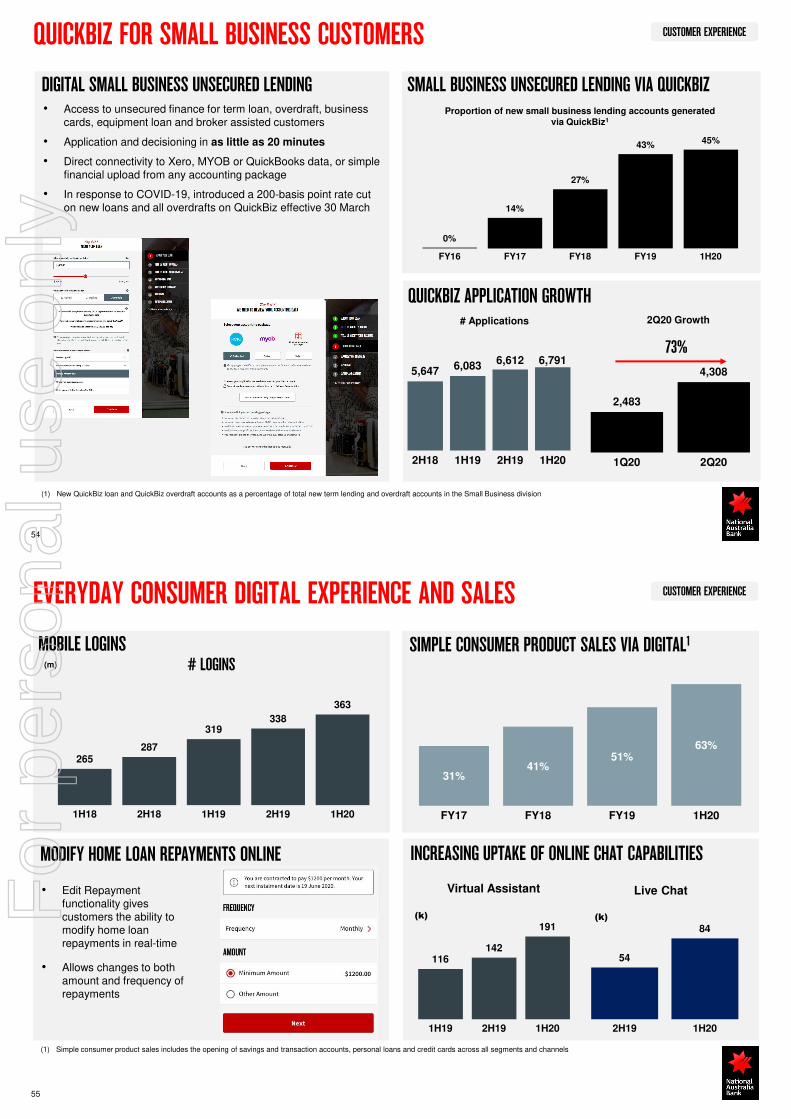
CUSTOMER EXPERIENCEQUICKBIZ FOR SMALL BUSINESS CUSTOMERS
• Access to unsecured finance for term loan, overdraft, business cards, equipment loan and broker assisted customers
• Application and decisioning in as little as 20 minutes
• Direct connectivity to Xero, MYOB or QuickBooks data, or simple financial upload from any accounting package
• In response to COVID-19, introduced a 200-basis point rate cut on new loans and all overdrafts on QuickBiz effective 30 March
5,647 6,0836,612 6,791
2H18 1H19 2H19 1H20
73%
# Applications
(1) New QuickBiz loan and QuickBiz overdraft accounts as a percentage of total new term lending and overdraft accounts in the Small Business division
DIGITAL SMALL BUSINESS UNSECURED LENDING SMALL BUSINESS UNSECURED LENDING VIA QUICKBIZ
QUICKBIZ APPLICATION GROWTH
54
0%
14%
27%
43% 45%
FY16 FY17 FY18 FY19 1H20
Proportion of new small business lending accounts generated via QuickBiz1
2,483
4,308
1Q20 2Q20
2Q20 Growth
CUSTOMER EXPERIENCEEVERYDAY CONSUMER DIGITAL EXPERIENCE AND SALES
SIMPLE CONSUMER PRODUCT SALES VIA DIGITAL1
55
(1) Simple consumer product sales includes the opening of savings and transaction accounts, personal loans and credit cards across all segments and channels
31%41%
51%63%
FY17 FY18 FY19 1H20
INCREASING UPTAKE OF ONLINE CHAT CAPABILITIES MODIFY HOME LOAN REPAYMENTS ONLINE
265287
319338
363
1H18 2H18 1H19 2H19 1H20
# LOGINS(m)
54
84
2H19 1H20
(k) (k)
Virtual Assistant Live Chat
MOBILE LOGINS
• Edit Repayment functionality gives customers the ability to modify home loan repayments in real-time
• Allows changes to both amount and frequency of repayments
116142
191
1H19 2H19 1H20
For
per
sona
l use
onl
y

CUSTOMER EXPERIENCEREDUCTION IN CRITICAL AND HIGH PRIORITY INCIDENTS
‘CRITICAL’ AND ‘HIGH’ PRIORITY INCIDENTS1
(1) Critical Incidents – Significant impact or outages to customer facing service or payment channels. High Incidents – Functionality impact to customer facing service or impact/outage to internal systems
Investment in technology driving lower instance of technology incidents since 1H14• 97% reduction in “High” priority incidents• 85% reduction in of “Critical” priority incidents
0
100
200
300
400
500
600
0
5
10
15
20
25
30
35
40
45
H1
FY14
H2
FY14
H1
FY15
H2
FY15
H1
FY16
H2
FY16
H1
FY17
H2
FY17
H1
FY18
H2
FY18
H1
FY19
H2
FY19
H1
FY20
Critical (left axis) High (right axis)
56
ADDITIONAL INFORMATIONAUSTRALIAN BUSINESS LENDINGF
or p
erso
nal u
se o
nly
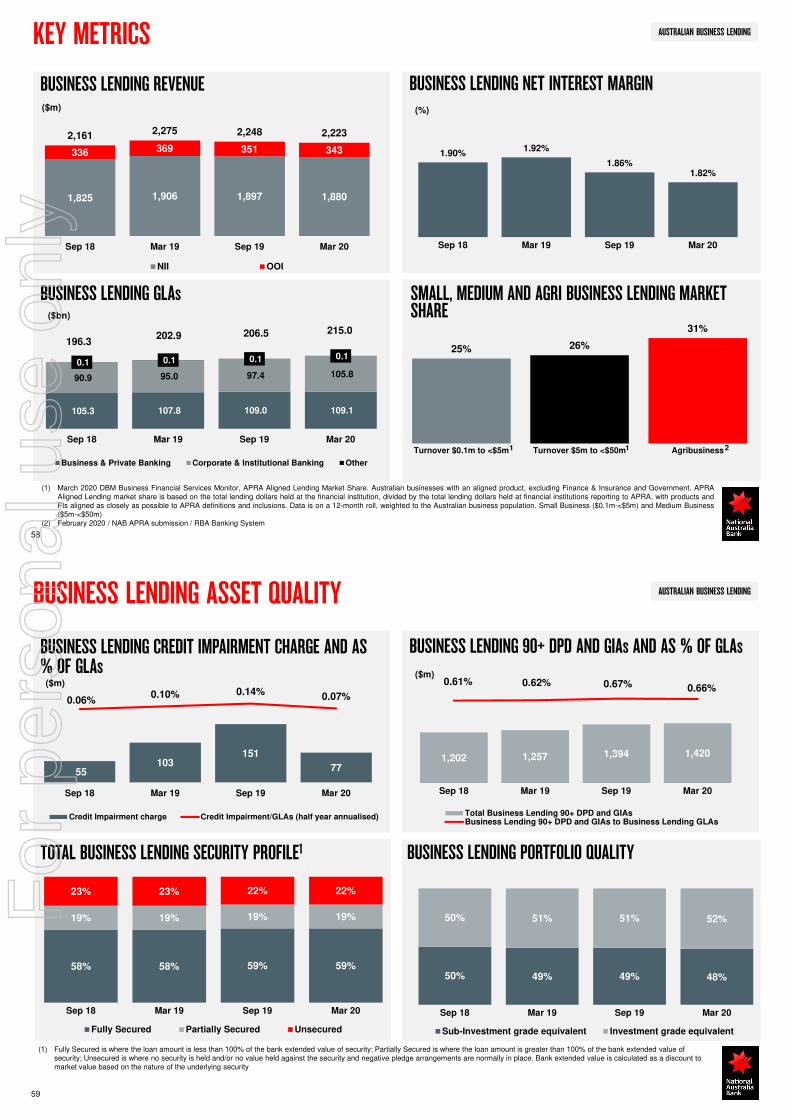
AUSTRALIAN BUSINESS LENDING
1.90%1.92%
1.86%1.82%
Sep 18 Mar 19 Sep 19 Mar 20
KEY METRICS
BUSINESS LENDING NET INTEREST MARGINBUSINESS LENDING REVENUE($m) (%)
BUSINESS LENDING GLAs($bn)
58
(1) March 2020 DBM Business Financial Services Monitor, APRA Aligned Lending Market Share. Australian businesses with an aligned product, excluding Finance & Insurance and Government. APRAAligned Lending market share is based on the total lending dollars held at the financial institution, divided by the total lending dollars held at financial institutions reporting to APRA, with products andFIs aligned as closely as possible to APRA definitions and inclusions. Data is on a 12-month roll, weighted to the Australian business population. Small Business ($0.1m-<$5m) and Medium Business($5m-<$50m)
(2) February 2020 / NAB APRA submission / RBA Banking System
1,825 1,906 1,897 1,880
336 369 351 343
2,161 2,275 2,248 2,223
Sep 18 Mar 19 Sep 19 Mar 20
NII OOI
105.3 107.8 109.0 109.1
90.9 95.0 97.4 105.8
0.1 0.1 0.1 0.1
196.3 202.9 206.5 215.0
Sep 18 Mar 19 Sep 19 Mar 20
Business & Private Banking Corporate & Institutional Banking Other
25% 26%
31%
Turnover $0.1m to <$5m Turnover $5m to <$50m Agribusiness
SMALL, MEDIUM AND AGRI BUSINESS LENDING MARKET SHARE
1 1 2
AUSTRALIAN BUSINESS LENDINGBUSINESS LENDING ASSET QUALITY
BUSINESS LENDING 90+ DPD AND GIAs AND AS % OF GLAsBUSINESS LENDING CREDIT IMPAIRMENT CHARGE AND AS % OF GLAs
TOTAL BUSINESS LENDING SECURITY PROFILE1
($m)($m)
(1) Fully Secured is where the loan amount is less than 100% of the bank extended value of security; Partially Secured is where the loan amount is greater than 100% of the bank extended value of security; Unsecured is where no security is held and/or no value held against the security and negative pledge arrangements are normally in place. Bank extended value is calculated as a discount to market value based on the nature of the underlying security
1,202 1,257 1,394 1,420
0.61% 0.62% 0.67% 0.66%
Sep 18 Mar 19 Sep 19 Mar 20
Total Business Lending 90+ DPD and GIAsBusiness Lending 90+ DPD and GIAs to Business Lending GLAs
59
55 103
151
77
0.06%0.10% 0.14% 0.07%
-1.0%
0.0%
Sep 18 Mar 19 Sep 19 Mar 20
Credit Impairment charge Credit Impairment/GLAs (half year annualised)
BUSINESS LENDING PORTFOLIO QUALITY
58% 58% 59% 59%
19% 19% 19% 19%
23% 23% 22% 22%
Sep 18 Mar 19 Sep 19 Mar 20
Fully Secured Partially Secured Unsecured
50% 49% 49% 48%
50% 51% 51% 52%
Sep 18 Mar 19 Sep 19 Mar 20
Sub-Investment grade equivalent Investment grade equivalent
For
per
sona
l use
onl
y

AUSTRALIAN BUSINESS LENDING
13 2463
2
96 67
127
84
24 28
27
40
0.13% 0.12%
0.22%
0.13%
-$10.0
$340.0
-0.10%
0.15%
Sep 18 Mar 19 Sep 19 Mar 20
Other banking productsBusiness lendingHousing lendingCredit impairment charge as % of GLAs annualised
BUSINESS & PRIVATE BANKING (B&PB) ASSET QUALITY
B&PB BUSINESS LENDING PORTFOLIO QUALITY
B&PB CREDIT IMPAIRMENT CHARGE AND AS % OF GLAs B&PB 90+ DPD AND GIAs AND AS % OF GLAs($m)
($m)
(1) Fully Secured is where the loan amount is less than 100% of the bank extended value of security; Partially Secured is where the loan amount is greater than 100% of the bank extended value of security; Unsecured is where no security is held and/or no value held against the security and negative pledge arrangements are normally in place. Bank extended value is calculated as a discount to market value based on the nature of the underlying security
60
B&PB BUSINESS LENDING SECURITY PROFILE1
856 818 950 1,075
707 844 955
1,036 1,563 1,662
1,9052,1110.78% 0.83%
0.95%1.07%
Sep 18 Mar 19 Sep 19 Mar 20
Housing 90+ DPD and GIAs Non-housing 90+ DPD and GIAs
90+ DPD and GIAs to GLAs
133 119
217
126
74% 74% 74% 75%
26% 26% 26% 25%
Sep 18 Mar 19 Sep 19 Mar 20
Sub-Investment grade equivalent Investment grade equivalent
74% 74% 74% 74%
21% 21% 21% 21%
5% 5% 5% 5%
Sep 18 Mar 19 Sep 19 Mar 20
Fully Secured Partially Secured Unsecured
ADDITIONAL INFORMATIONAUSTRALIAN HOUSING LENDINGF
or p
erso
nal u
se o
nly
AUSTRALIAN HOUSING LENDING
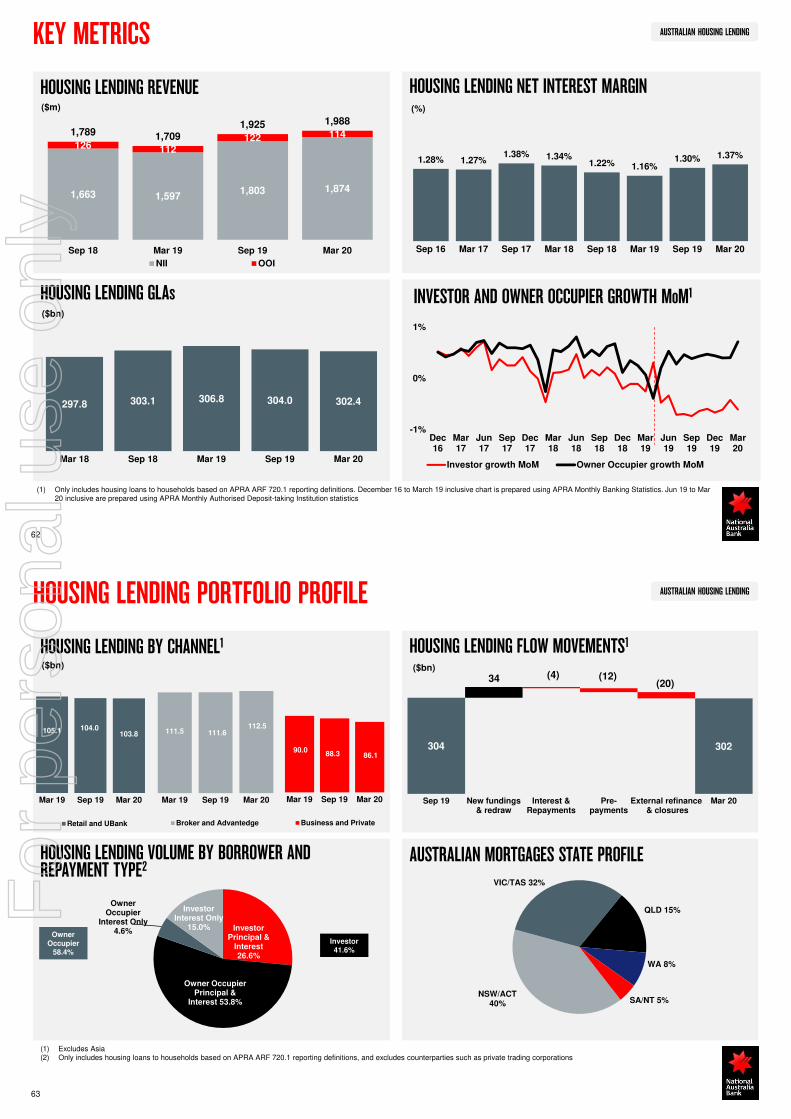
1,663 1,5971,803 1,874
126 112122 1141,789 1,709
1,925 1,988
Sep 18 Mar 19 Sep 19 Mar 20
NII OOI
HOUSING LENDING GLAs
HOUSING LENDING NET INTEREST MARGINHOUSING LENDING REVENUE
($bn)
($m) (%)
KEY METRICS
297.8 303.1 306.8 304.0 302.4
Mar 18 Sep 18 Mar 19 Sep 19 Mar 20
62
1.28% 1.27%1.38% 1.34%
1.22% 1.16%1.30% 1.37%
Sep 16 Mar 17 Sep 17 Mar 18 Sep 18 Mar 19 Sep 19 Mar 20
INVESTOR AND OWNER OCCUPIER GROWTH MoM1
(1) Only includes housing loans to households based on APRA ARF 720.1 reporting definitions. December 16 to March 19 inclusive chart is prepared using APRA Monthly Banking Statistics. Jun 19 to Mar 20 inclusive are prepared using APRA Monthly Authorised Deposit-taking Institution statistics
-1%
0%
1%
Dec16
Mar17
Jun17
Sep17
Dec17
Mar18
Jun18
Sep18
Dec18
Mar19
Jun19
Sep19
Dec19
Mar20
Investor growth MoM Owner Occupier growth MoM
AUSTRALIAN HOUSING LENDING
304 302
34 (4) (12)(20)
Sep 19 New fundings& redraw
Interest &Repayments
Pre-payments
External refinance & closures
Mar 20
HOUSING LENDING PORTFOLIO PROFILE
AUSTRALIAN MORTGAGES STATE PROFILE
HOUSING LENDING BY CHANNEL1
HOUSING LENDING VOLUME BY BORROWER AND REPAYMENT TYPE2
HOUSING LENDING FLOW MOVEMENTS1
63
($bn) ($bn)
(1) Excludes Asia(2) Only includes housing loans to households based on APRA ARF 720.1 reporting definitions, and excludes counterparties such as private trading corporations
111.5 111.6 112.5
Mar 19 Sep 19 Mar 20
Broker and Advantedge
90.0 88.3 86.1
Mar 19 Sep 19 Mar 20
Business and Private
105.1 104.0103.8
Mar 19 Sep 19 Mar 20
Retail and UBank
Investor Principal &
Interest26.6%
Owner Occupier Principal &
Interest 53.8%
Owner Occupier
Interest Only4.6%
Investor Interest Only
15.0%Owner
Occupier58.4%
Investor41.6%
NSW/ACT40%
VIC/TAS 32%
QLD 15%
WA 8%
SA/NT 5%
For
per
sona
l use
onl
y

AUSTRALIAN HOUSING LENDING
INTEREST ONLY CONVERSIONS TO P&I($bn)
HOUSING LENDING PORTFOLIO PROFILE
REPAYMENT BUFFERS1
64
90+ DPD AND GIAs AS % OF TOTAL HOUSING LENDING GLAs– BY CHANNEL
5.4 4.8 5.5 5.16.4 6.3
7.9 8.2
1.41.1
3.82.4
2.3 1.6
2.0 1.5
6.85.9
9.2
7.6
8.77.9
9.9 9.7
2H16 1H17 2H17 1H18 2H18 1H19 2H19 1H20
Contractual conversion Early conversion
0.0%
0.4%
0.8%
1.2%
1.6%
Mar 11 Mar 12 Mar 13 Mar 14 Mar 15 Mar 16 Mar 17 Mar 18 Mar 19 Mar 20
Broker Proprietary
HOUSING LENDING 90+DPD & GIAs AS % OF GLAs
1.00%
1.35%
1.31%
0.95%
2.28%
1.16%
0.0%
0.5%
1.0%
1.5%
2.0%
2.5%
Mar 14 Mar 15 Mar 16 Mar 17 Mar 18 Mar 19 Mar 20
NSW/ACT QLD SA/NT VIC/TAS WA Total
(1) Represents payments in advance by accounts. Includes offsets. Excludes accounts in arrears, Advantedge book and line of credit
31%
7%
14% 13%16% 16%
3%
32%
7%
14% 13% 15% 15%
3%
0%
10%
20%
30%
40%
50%
60%
>2 years
1-2years
3-12months
1-3months
<1month
On time Behind
Mar 19 Mar 20
AUSTRALIAN HOUSING LENDINGHOUSING LENDING PORTFOLIO QUALITY
65
LVR ≤60%
LVR60.01% - 70%
LVR 70.01% - 80%
LVR 80.01% - 90%
LVR >90%
0%
10%
20%
30%
40%
50%
60%
Sep 18 Mar 19 Sep 19 Mar 20
DYNAMIC LVR BREAKDOWN OF DRAWN BALANCE LVR BREAKDOWN AT ORIGINATION
LVR ≤60%
LVR60.01% - 70%
LVR 70.01% - 80%
LVR 80.01% - 90%
LVR >90%
0%
10%
20%
30%
40%
50%
60%
Sep 18 Feb 19 Sep 19 Mar 20
For
per
sona
l use
onl
y
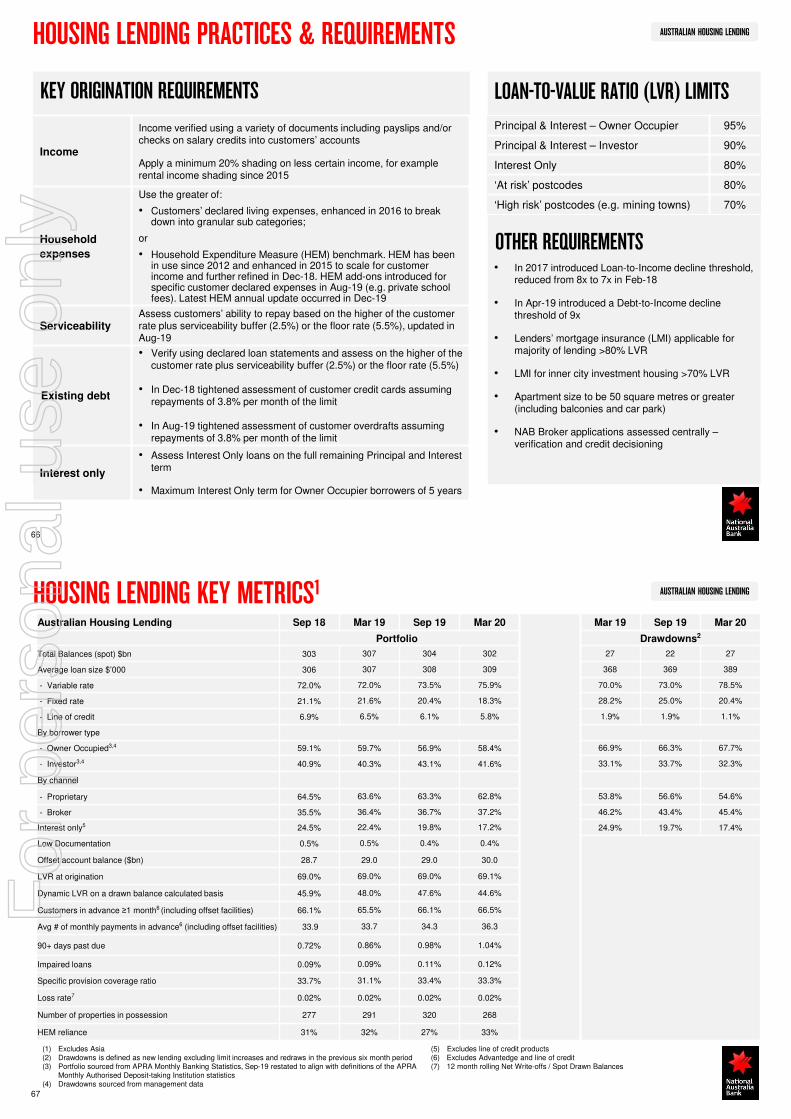
AUSTRALIAN HOUSING LENDINGHOUSING LENDING PRACTICES & REQUIREMENTS
KEY ORIGINATION REQUIREMENTS
Income
Income verified using a variety of documents including payslips and/or checks on salary credits into customers’ accounts
Apply a minimum 20% shading on less certain income, for example rental income shading since 2015
Household
expenses
Use the greater of:
• Customers’ declared living expenses, enhanced in 2016 to break down into granular sub categories;
or
• Household Expenditure Measure (HEM) benchmark. HEM has been in use since 2012 and enhanced in 2015 to scale for customerincome and further refined in Dec-18. HEM add-ons introduced for specific customer declared expenses in Aug-19 (e.g. private school fees). Latest HEM annual update occurred in Dec-19
ServiceabilityAssess customers’ ability to repay based on the higher of the customer rate plus serviceability buffer (2.5%) or the floor rate (5.5%), updated in Aug-19
Existing debt
• Verify using declared loan statements and assess on the higher of the customer rate plus serviceability buffer (2.5%) or the floor rate (5.5%)
• In Dec-18 tightened assessment of customer credit cards assuming repayments of 3.8% per month of the limit
• In Aug-19 tightened assessment of customer overdrafts assuming repayments of 3.8% per month of the limit
Interest only
• Assess Interest Only loans on the full remaining Principal and Interest term
• Maximum Interest Only term for Owner Occupier borrowers of 5 years
66
LOAN-TO-VALUE RATIO (LVR) LIMITS
Principal & Interest – Owner Occupier 95%
Principal & Interest – Investor 90%
Interest Only 80%
‘At risk’ postcodes 80%
‘High risk’ postcodes (e.g. mining towns) 70%
OTHER REQUIREMENTS• In 2017 introduced Loan-to-Income decline threshold,
reduced from 8x to 7x in Feb-18
• In Apr-19 introduced a Debt-to-Income decline threshold of 9x
• Lenders’ mortgage insurance (LMI) applicable for majority of lending >80% LVR
• LMI for inner city investment housing >70% LVR
• Apartment size to be 50 square metres or greater (including balconies and car park)
• NAB Broker applications assessed centrally –verification and credit decisioning
AUSTRALIAN HOUSING LENDINGHOUSING LENDING KEY METRICS1
(1) Excludes Asia (2) Drawdowns is defined as new lending excluding limit increases and redraws in the previous six month period (3) Portfolio sourced from APRA Monthly Banking Statistics, Sep-19 restated to align with definitions of the APRA
Monthly Authorised Deposit-taking Institution statistics(4) Drawdowns sourced from management data
(5) Excludes line of credit products(6) Excludes Advantedge and line of credit (7) 12 month rolling Net Write-offs / Spot Drawn Balances
67
Australian Housing Lending Sep 18 Mar 19 Sep 19 Mar 20 Mar 19 Sep 19 Mar 20
Portfolio Drawdowns2
Total Balances (spot) $bn 303 307 304 302 27 22 27
Average loan size $’000 306 307 308 309 368 369 389
- Variable rate 72.0% 72.0% 73.5% 75.9% 70.0% 73.0% 78.5%
- Fixed rate 21.1% 21.6% 20.4% 18.3% 28.2% 25.0% 20.4%
- Line of credit 6.9% 6.5% 6.1% 5.8% 1.9% 1.9% 1.1%
By borrower type
- Owner Occupied3,4 59.1% 59.7% 56.9% 58.4% 66.9% 66.3% 67.7%
- Investor3,4 40.9% 40.3% 43.1% 41.6% 33.1% 33.7% 32.3%
By channel
- Proprietary 64.5% 63.6% 63.3% 62.8% 53.8% 56.6% 54.6%
- Broker 35.5% 36.4% 36.7% 37.2% 46.2% 43.4% 45.4%
Interest only5 24.5% 22.4% 19.8% 17.2% 24.9% 19.7% 17.4%
Low Documentation 0.5% 0.5% 0.4% 0.4%
Offset account balance ($bn) 28.7 29.0 29.0 30.0
LVR at origination 69.0% 69.0% 69.0% 69.1%
Dynamic LVR on a drawn balance calculated basis 45.9% 48.0% 47.6% 44.6%
Customers in advance ≥1 month6 (including offset facilities) 66.1% 65.5% 66.1% 66.5%
Avg # of monthly payments in advance6 (including offset facilities) 33.9 33.7 34.3 36.3
90+ days past due 0.72% 0.86% 0.98% 1.04%
Impaired loans 0.09% 0.09% 0.11% 0.12%
Specific provision coverage ratio 33.7% 31.1% 33.4% 33.3%
Loss rate7 0.02% 0.02% 0.02% 0.02%
Number of properties in possession 277 291 320 268
HEM reliance 31% 32% 27% 33%
For
per
sona
l use
onl
y
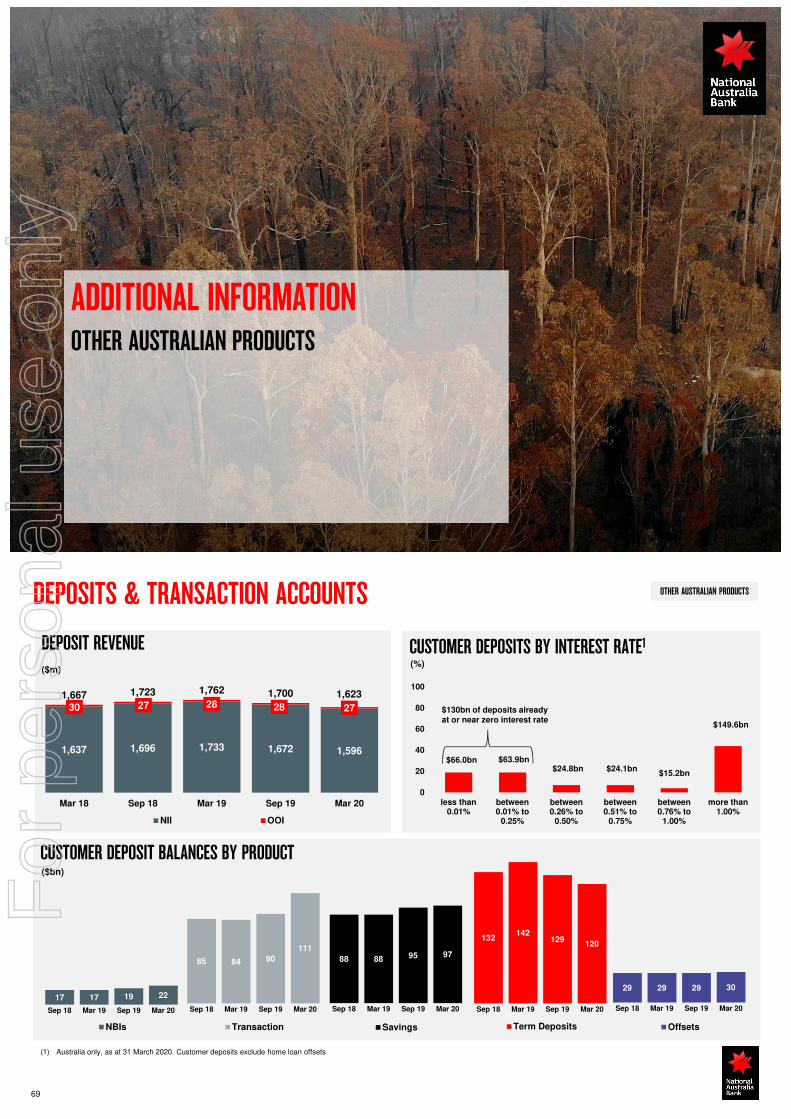
ADDITIONAL INFORMATIONOTHER AUSTRALIAN PRODUCTS
OTHER AUSTRALIAN PRODUCTS
88 88 95 97
Sep 18 Mar 19 Sep 19 Mar 20
Savings
17 17 19 22
Sep 18 Mar 19 Sep 19 Mar 20
NBIs
DEPOSITS & TRANSACTION ACCOUNTS
69
DEPOSIT REVENUE
CUSTOMER DEPOSIT BALANCES BY PRODUCT($bn)
($m)
29 29 29 30
Sep 18 Mar 19 Sep 19 Mar 20
Offsets
85 84 90
111
Sep 18 Mar 19 Sep 19 Mar 20
Transaction
132142
129120
Sep 18 Mar 19 Sep 19 Mar 20
Term Deposits
1,637 1,696 1,733 1,672 1,596
30 27 28 28 27
1,667 1,723 1,762 1,700 1,623
Mar 18 Sep 18 Mar 19 Sep 19 Mar 20
NII OOI
0
20
40
60
80
100
less than0.01%
between0.01% to
0.25%
between0.26% to
0.50%
between0.51% to
0.75%
between0.76% to
1.00%
more than1.00%
CUSTOMER DEPOSITS BY INTEREST RATE1
(%)
$130bn of deposits already at or near zero interest rate
(1) Australia only, as at 31 March 2020. Customer deposits exclude home loan offsets
$63.9bn$24.8bn $24.1bn
$15.2bn
$149.6bn
$66.0bn
For
per
sona
l use
onl
y

OTHER AUSTRALIAN PRODUCTSOTHER BANKING PRODUCTS
(1) Personal loans business tracker reports provided by RFI represents share of RFI defined peer group data for Feb 20(2) APRA Monthly Banking Statistics is used for Sep-18 to Mar-19 market share. Sep-19 onwards is prepared using APRA Monthly Authorised Deposit-taking Institution statistics. Latest market share
statistics are as at Feb 20
CARDS BALANCE AND MARKET SHAREPERSONAL LENDING BALANCE AND MARKET SHARE1
($bn)($bn)
70
CARDS AND PERSONAL LENDING 90+ DPD AND AS % OF TOTAL CARDS AND PERSONAL LENDING GLAS
CONSUMER CARDS 90+ DPD AS % OF OUTSTANDINGS
($m)
APRA methodology change2
1.8 1.7 1.5 1.4
10.4% 10.1% 9.7% 9.2%
0.00%
11.00%
0.0
2.7
Sep 18 Mar 19 Sep 19 Mar 20
Personal Lending Market share
6.2 6.1 5.7 5.4
13.6% 13.4% 13.3% 13.1%
Sep 18 Mar 19 Sep 19 Mar 20
Cards Market share
95 92 80 77
1.18% 1.17% 1.10% 1.13%
Sep 18 Mar 19 Sep 19 Mar 20
90+ DPD 90+ DPD/GLAs
0.8%
1.0%
1.2%
1.4%
Sep 16 Mar 17 Sep 17 Mar 18 Sep 18 Mar 19 Sep 19 Mar 20
NSW/ACT QLD SA/NT VIC/TAS WA Total
ADDITIONAL INFORMATIONNEW ZEALAND BANKINGF
or p
erso
nal u
se o
nly

NEW ZEALAND BANKINGKEY CUSTOMER METRICS
72
(1) Source: Kantar Business Finance Monitor (data on 4 quarter roll)(2) Source: Camorra Retail Market Monitor (data on 12 month roll) for Consumer Priority segments which include Savers and Starters, Home Owners, Investors & High Net Worth clients(3) Net Promoter® and NPS® are registered trademarks and Net Promoter Score and Net Promoter System are trademarks of Bain & Company, Satmetrix Systems and Fred Reichheld(4) Due to a change in Retail Market Monitor methodology, there has been a re-set of strategic NPS for the consumer market for all five major banks. The use of a 12 month rolling average in BNZ reporting
has smoothed the transition (we are using data that was collected in parallel from May 2019 to September 2019), but there is a methodology-driven increase in NPS for all banks visible during this period of transition. The new methodology has been fully embedded since October 2019.
BNZ SME NPS1,3
BNZ CONSUMER NPS2,3,4
-10
-16
4
-21
-35
-25
-15
-5
5
15
25
Sep 16 Dec 16 Mar 17 Jun 17 Sep 17 Dec 17 Mar 18 Jun 18 Sep 18 Dec 18 Mar 19 Jun 19 Sep 19 Dec 19 Mar 20
BNZ Peer 1 Peer 2 Peer 3
30
20
32
16
39
-5
0
5
10
15
20
25
30
35
40
Sep 16 Dec 16 Mar 17 Jun 17 Sep 17 Dec 17 Mar 18 Jun 18 Sep 18 Dec 18 Mar 19 Jun 19 Sep 19 Dec 19 Mar 20
BNZ Peer 1 Peer 2 Peer 3 Peer 4
NEW ZEALAND BANKINGHOUSING LENDING KEY METRICS
73
(1) Drawdowns is defined as new lending including limit increases and excluding redraws in the previous six month period (2) Excludes line of credit products(3) 12 month rolling Net Write-offs / Spot Drawn Balances
New Zealand Housing Lending Sep 18 Mar 19 Sep 19 Mar 20 Mar 19 Sep 19 Mar 20
Portfolio Drawdowns1
Total Balances (spot) NZ$bn 39.8 41.3 43.0 44.8 5.3 5.8 5.8
By product
- Variable rate 19.6% 17.7% 15.9% 15.2% 16.8% 15.4% 15.4%
- Fixed rate 77.7% 79.7% 81.7% 82.6% 82.6% 84.0% 84.0%
- Line of credit 2.7% 2.6% 2.4% 2.2% 0.6% 0.6% 0.6%
By borrower type
- Owner Occupied 64.6% 65.4% 66.2% 66.4% 70.9% 72.0% 70.2%
- Investor 35.4% 34.6% 33.8% 33.6% 29.1% 28.0% 29.8%
By channel
- Proprietary 84.7% 82.3% 80.0% 77.9% 74.7% 72.9% 70.8%
- Broker 15.3% 17.7% 20.0% 22.1% 25.3% 27.1% 29.2%
Low Documentation 0.0% 0.0% 0.0% 0.0% 0.0% 0.0% 0.0%
Interest only2 22.1% 21.4% 20.4% 24.4% 25.9% 25.3% 29.2%
LVR at origination 66.2% 66.3% 66.5% 66.7%
90+ days past due 0.05% 0.10% 0.07% 0.11%
Impaired loans 0.03% 0.04% 0.03% 0.03%
Specific Impairment coverage ratio 23.5% 17.9% 17.0% 25.50%
Loss rate3 0.01% 0.01% 0.01% 0.01%
For
per
sona
l use
onl
y

NEW ZEALAND BANKING
74
NEW ZEALAND LENDING MIX
MORTGAGE PORTFOLIO BREAKDOWN BY GEOGRAPHY – TOTAL MORTGAGE NZ$44.8BN
AGRIBUSINESS PORTFOLIO BREAKDOWN BY INDUSTRY –TOTAL AGRI NZ$15.5BN
Canterbury12%
Wellington11%
Waikato 7%
Bay of Plenty6%
Other 16%
Auckland 48%
PORTFOLIO BREAKDOWN – TOTAL NZ$89.6BN
Personal Lending
3%
Other Commercial
12%
Manufacturing4%
Retail and Wholesale
Trade4%
Agriculture, Forestry and
Fishing17%
Commercial Real Estate
10%
Mortgages50%
Dairy 50%
Drystock 20%
Forestry 5%
Kiwifruit 7%
Other 13%
Services to Agriculture
5%
ADDITIONAL INFORMATIONGROUP ASSET QUALITYF
or p
erso
nal u
se o
nly

GROUP ASSET QUALITY
Late 80’s / Early 90’s Recession
GFC
GROUP CREDIT IMPAIRMENT CHARGE
CREDIT IMPAIRMENT CHARGE AS % OF GLAs
CREDIT IMPAIRMENT CHARGE AND AS % OF GLAs1
($m)
(1) Ratios for all periods refer to the half year ratio annualised
76
722426 299 399 349 375 425 394 416 373 406 449 470
1,161
0.31%
0.18% 0.12% 0.16% 0.13% 0.14% 0.16% 0.14% 0.15% 0.13% 0.14% 0.15% 0.16%
0.38%
Sep 13 Mar 14 Sep 14 Mar 15 Sep 15 Mar 16 Sep 16 Mar 17 Sep 17 Mar 18 Sep 18 Mar 19 Sep 19 Mar 20
0.38%
0.0%
0.2%
0.4%
0.6%
0.8%
1.0%
1.2%
1.4%
Sep87
Sep88
Sep89
Sep90
Sep91
Sep92
Sep93
Sep94
Sep95
Sep96
Sep97
Sep98
Sep99
Sep00
Sep01
Sep02
Sep03
Sep04
Sep05
Sep06
Sep07
Sep08
Sep09
Sep10
Sep11
Sep12
Sep13
Sep14
Sep15
Sep16
Sep17
Sep18
Sep19
Mar20
GROUP ASSET QUALITYGROUP ESTIMATED LONG RUN LOAN LOSS RATE 1985 TO 2020
GROUP BUSINESS MIX – GLAs BY CATEGORY
(1) For 1985 Group business mix, all overseas GLAs are allocated to Commercial category(2) Data used in calculation of net write off rate as a % of GLAs is based on NAB’s Australian geography and sourced from NAB’s Supplemental Information Statements (2007 - 2019) and NAB’s Annual
Financial Reports (1985 - 2006). (3) Home lending represents “Real estate – mortgages” category; Personal lending represents “Instalment loans to individuals and other personal lending (including credit cards)” category; Commercial
represents “all other industry lending categories” as presented in the source documents as described in note 2 above(4) Group average is calculated by applying each of the Australian geography long run average net write off rates by product to the respective percentage of Group GLAs by product as at 31 March 2020.
Commercial long run average net write off rate has been applied to acceptances
Commercial1
76%
Home lending 16%
Personal lending 8%
Commercial 42%
Home lending 56%
Personal lending 2%
1985
2020
ESTIMATING LONG RUN LOAN LOSS RATE
NAB Australian geography net write off rates as a % of GLAs 1985 - 20192
Long run average
Home lending3 0.03%
Personal lending3 1.51%
Commercial3 0.54%
Australian average (1985-2019) 0.34%
Group average4 based on 2020 business mix 0.26%
Group average4 based on 2020 business mix excluding 1991-1993 and 2008-2010 0.19%
77
For
per
sona
l use
onl
y

GROUP ASSET QUALITY
588 630 684 702
87 87
98 125 675717
782827
44.4%45.8%
39.7% 40.6%
0.00%
5.00%
10.00%
15.00%
20.00%
25.00%
30.00%
35.00%
40.00%
45.00%
50.00%
-100
100
300
500
700
900
1,100
1,300
1,500
Sep 18 Mar 19 Sep 19 Mar 20
Business Retail Specific provision coverage
GROUP PROVISIONS
COLLECTIVE PROVISION BALANCE($m) ($m)
SPECIFIC PROVISIONS
78
2,840 3,015
3,118
4,008 80
73 65
56
134
161 177
337
3,054
3,249
3,360
4,401
Sep 18 Mar 19 Sep 19 Mar 20
Amortised Loans Fair Value Loans Fair Value Derivatives
GROUP ASSET QUALITYGROUP LENDING MIX
GROSS LOANS AND ACCEPTANCES BY GEOGRAPHY1
GROSS LOANS AND ACCEPTANCES BY BUSINESS UNIT
79
GROSS LOANS AND ACCEPTANCES BY PRODUCT
(1) Based on booking office where transactions have been recorded
Housing loans 56%
Other term lending
38%
Asset & lease financing
2%
Overdrafts1%
Credit card outstandings
1%
Other 1%
Acceptances1%
Business & Private
Banking 33%
Consumer Banking
36%
Corporate & Institutional
Banking17%
New Zealand Banking
14%
Australia 83%
New Zealand 14%
Other International
3%
For
per
sona
l use
onl
y
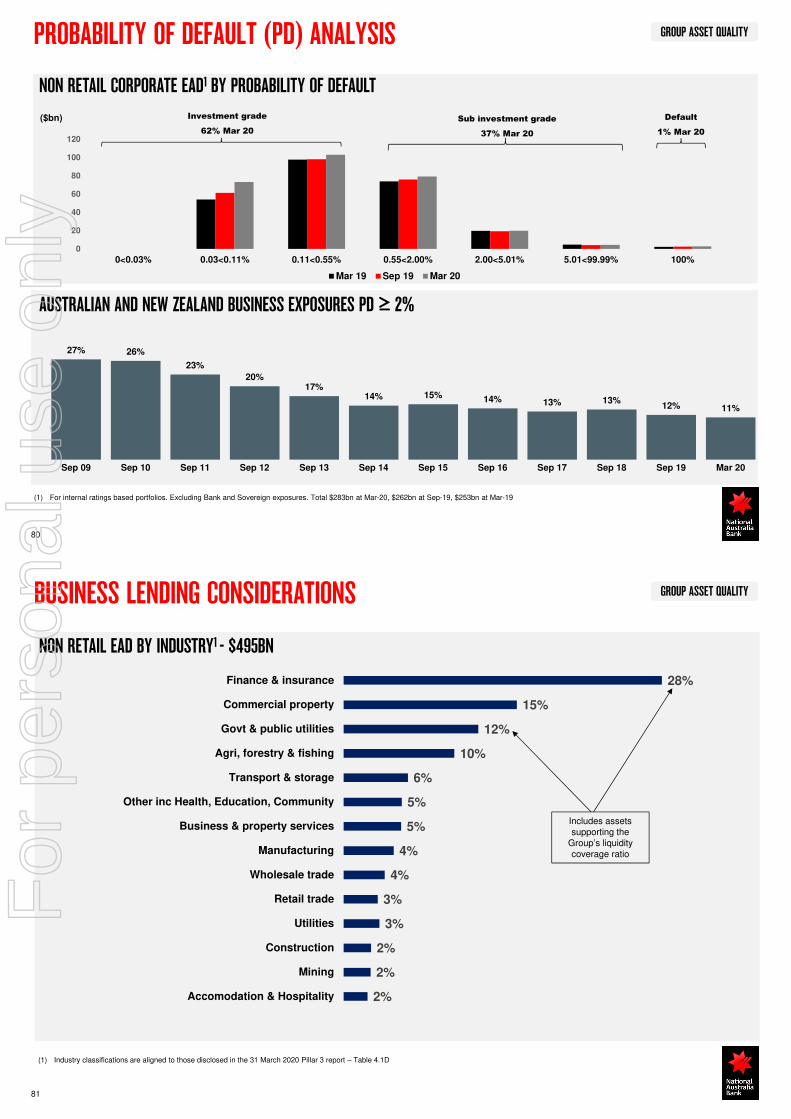
GROUP ASSET QUALITY
27% 26%
23%
20%17%
14% 15% 14% 13% 13%12% 11%
0
0
0
0
Sep 09 Sep 10 Sep 11 Sep 12 Sep 13 Sep 14 Sep 15 Sep 16 Sep 17 Sep 18 Sep 19 Mar 20
PROBABILITY OF DEFAULT (PD) ANALYSIS
NON RETAIL CORPORATE EAD1 BY PROBABILITY OF DEFAULT
($bn)
80
AUSTRALIAN AND NEW ZEALAND BUSINESS EXPOSURES PD ≥ 2%
0
20
40
60
80
100
120
0<0.03% 0.03<0.11% 0.11<0.55% 0.55<2.00% 2.00<5.01% 5.01<99.99% 100%
Mar 19 Sep 19 Mar 20
Sub investment grade
37% Mar 20
Default
1% Mar 20
Investment grade
62% Mar 20
(1) For internal ratings based portfolios. Excluding Bank and Sovereign exposures. Total $283bn at Mar-20, $262bn at Sep-19, $253bn at Mar-19
GROUP ASSET QUALITY
2%
2%
2%
3%
3%
4%
4%
5%
5%
6%
10%
12%
15%
28%
Accomodation & Hospitality
Mining
Construction
Utilities
Retail trade
Wholesale trade
Manufacturing
Business & property services
Other inc Health, Education, Community
Transport & storage
Agri, forestry & fishing
Govt & public utilities
Commercial property
Finance & insurance
81
BUSINESS LENDING CONSIDERATIONS
NON RETAIL EAD BY INDUSTRY1 - $495BN
Includes assets supporting the
Group’s liquidity coverage ratio
(1) Industry classifications are aligned to those disclosed in the 31 March 2020 Pillar 3 report – Table 4.1D
For
per
sona
l use
onl
y

GROUP ASSET QUALITYGROUP AGRICULTURE, FORESTRY & FISHING EXPOSURES
GROUP EAD $47.5BN MARCH 2020
AUSTRALIAN AGRICULTURE, FORESTRY & FISHING
($m)
(1) Fully Secured is where the loan amount is less than 100% of the bank extended value of security; Partially Secured is where the loan amount is greater than 100% of the bank extended value of security; Unsecured is where no security is held and/or no value held against the security and negative pledge arrangements are normally in place. Bank extended value is calculated as a discount to market value based on the nature of the underlying security
Australia63%
New Zealand
37%
Diverse Portfolio EAD $30.0bn March 2020
122 118 120 132 146
0.46% 0.44% 0.43%0.46%
0.49%
Mar 18 Sep 18 Mar 19 Sep 19 Mar 20
90+DPD & Impaired as % EAD
Dairy 5%
Grain 11%
Other Crop & Grain 8%
Cotton 5%
Vegetables 3%
Beef 19%
Sheep/Beef 6%
Sheep 3%
Other Livestock2%
Poultry 1%Mixed 23%
Services 10%
Forestry & Fishing 4%
Fully Secured
83%
Partially Secured
15%
Unsecured2%
82
Australian Agriculture Asset Quality Australian Agriculture Portfolio Well Secured1
AUSTRALIAN DROUGHT CONSIDERATIONS
• NSW and QLD have seen good rainfall in recent months
• Asset quality remains sound, but follow up rain will be important for winter crops
• NAB continues supporting farming customers through disaster relief packages and a moratorium on branch closures in affected regions
• Collective provision forward looking adjustments of $180m to address impact of extreme weather conditions
GROUP ASSET QUALITY
Sector breakdown Geographic breakdown
GROUP COMMERCIAL REAL ESTATE1
Office28%
Tourism & Leisure
3%
Retail29%
Residential11%
Industrial17%
Other7%
Land5%
Total $60.8bn9.9% of Gross Loans & Acceptances
(1) Measured as balance outstanding as at 31 March 2020 per APRA Commercial Property ARF 230 definitions
Trend Sep 18 Mar 19 Sep 19 Mar 20
Impaired loans ratio 0.27% 0.22% 0.25% 0.26%
Specific Provision Coverage 30.5% 34.4% 31.9% 32.2%
AustNew
Zealand Other
International
Total
TOTAL CRE (A$bn) 52.3 8.4 0.1 60.8
Increase/(decrease) on
September 2019 (A$bn)(0.9) 0.2 - (0.7)
% of geographical GLAs 10.3% 9.6% 0.8% 9.9%
Change in % on September 2019
(0.3%) (0.4%) 0.3% (0.3%)
NSW33%
VIC25%
QLD13%
WA6% Other
Australia9%
New Zealand
14%
Other international
0.2%
Investor89%
Developer11%
Borrower breakdown
83
75
61 62 62 61
17.1%
11.6% 11.3% 10.2% 9.9%
-15.0%
18.0%
40
80
Sep 09 Sep 13 Sep 16 Sep 19 Mar 20
Group CRE $bn
Group CRE % of Group GLAs
Group balances over time
For
per
sona
l use
onl
y
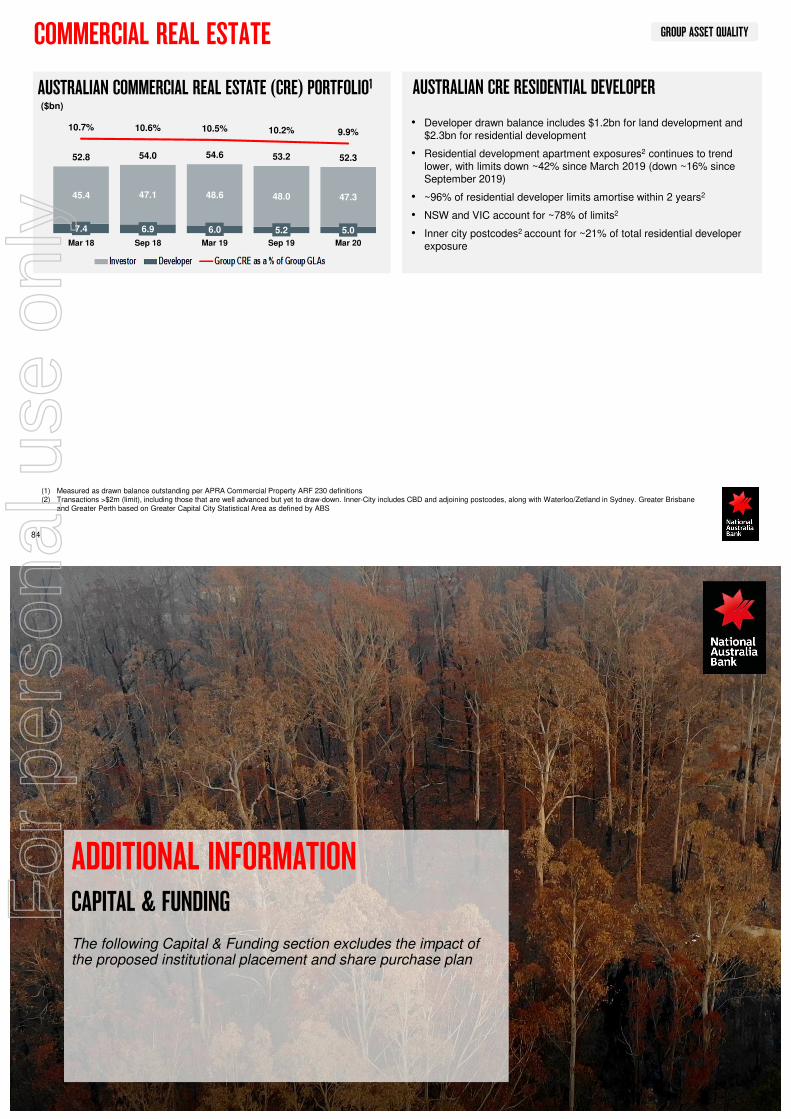
GROUP ASSET QUALITYCOMMERCIAL REAL ESTATE
84
(1) Measured as drawn balance outstanding per APRA Commercial Property ARF 230 definitions(2) Transactions >$2m (limit), including those that are well advanced but yet to draw-down. Inner-City includes CBD and adjoining postcodes, along with Waterloo/Zetland in Sydney. Greater Brisbane
and Greater Perth based on Greater Capital City Statistical Area as defined by ABS
AUSTRALIAN COMMERCIAL REAL ESTATE (CRE) PORTFOLIO1
• Developer drawn balance includes $1.2bn for land development and $2.3bn for residential development
• Residential development apartment exposures2 continues to trend lower, with limits down ~42% since March 2019 (down ~16% since September 2019)
• ~96% of residential developer limits amortise within 2 years2
• NSW and VIC account for ~78% of limits2
• Inner city postcodes2 account for ~21% of total residential developer exposure
AUSTRALIAN CRE RESIDENTIAL DEVELOPER($bn)
7.4 6.9 6.0 5.2 5.0
45.4 47.1 48.6 48.0 47.3
52.8 54.0 54.6 53.2 52.3
10.7% 10.6% 10.5% 10.2% 9.9%
Mar 18 Sep 18 Mar 19 Sep 19 Mar 20
ADDITIONAL INFORMATIONCAPITAL & FUNDING
The following Capital & Funding section excludes the impact of the proposed institutional placement and share purchase plan
For
per
sona
l use
onl
y

CAPITAL & FUNDING
351.6364.5
3.31.5 1.7
7.3
(0.9)
Sep 19 Volume Model andMethodology
CreditQuality
andPortfolio
Mix
Derivativesand
RepurchaseAgreements
TranslationFX
Mar 20
CAPITAL AND RWA MOVEMENTS
86
GROUP RWA CREDIT RWA($bn) ($bn)
GROUP CET1 CAPITAL GROUP CET1 RATIO
10.2
9.7
10.2
10.0
10.4 10.4 10.4
10.6
10.4
Mar 18 Jun 18 Sep 18 Dec 18 Mar 19 Jun 19 Sep 19 Dec 19 Mar 20
($bn)
415.8432.7
12.9 2.9 0.0 1.1
Sep 19 CreditRisk
OperationalRisk
MarketRisk
IRRBB Mar 20
39.6 39.8 41.9
43.1 45.0
5.0
11.0
30
45
Mar 18 Sep 18 Mar 19 Sep 19 Mar 20
(%)
CAPITAL & FUNDING
10.40%12.45%
14.00%
10.38%12.36%
14.68%
10.39%11.96%
14.61%
14.62%
17.25%
19.25%
14.34%
16.84%
19.77%
14.35%
16.33%
19.66%
(1) Internationally Comparable CET1 ratios align with the APRA study entitled “International capital comparison study” released on 13 July 2015
GROUP BASEL III CAPITAL RATIOS
APRA to Internationally Comparable CET1 Ratio Reconciliation CET1
Group CET1 ratio under APRA 10.39%
APRA’s Basel capital adequacy standards require a 100% deduction from common equity for deferred tax assets, investments in non consolidated subsidiaries and equity investments. Under Basel Committee on Banking Supervision (BCBS) such items are concessionally risk weighted if they fall below prescribed thresholds
+76bps
Mortgages – reduction in Loss given Default floor from 20% to 15% and adjustment for correlation factor +151bps
Interest rate risk in the banking book (IRRBB) – removal of IRRBB risk weighted assets from Pillar 1 capital requirements +24bps
Other adjustments including corporate lending adjustments and treatment of specialised lending +145bps
Group Internationally Comparable CET1 14.35%
Equivalent Internationally Comparable ratios1APRA Total Capital ratiosAPRA Tier 1 ratiosAPRA Common Equity Tier 1 ratios
87
Mar 19 Sep 19 Mar 20
For
per
sona
l use
onl
y

CAPITAL & FUNDING KEY REGULATORY CHANGES IMPACTING CAPITAL AND FUNDING
88
REGULATORY CHANGE DATES DEFERRAL OF REGULATORY CHANGE
ChangeOriginal
dateAmended
date
APS 110 Capital Adequacy 1 Jan 2022 1 Jan 2023
APS 111 Measurement of Capital 1 Jan 2021 No change
APS 112 Capital Adequacy: Standardised Approach to Credit Risk
1 Jan 2022 1 Jan 2023
APS 113 Capital Adequacy: Internal Ratings-based Approach to Credit Risk
1 Jan 2022 1 Jan 2023
APS 115 Capital Adequacy: Standardised Measurement Approach to Operational Risk
1 Jan 2021 (AMA banks)
1 Jan 2023
APS 116 Capital Adequacy: Market Risk
1 Jan 2023 1 Jan 2024
APS 117 Capital Adequacy: Interest Rate Risk in the Banking Book
1 Jan 2022 1 Jan 2023
APS 330 Public Disclosures 1 Jan 2022 1 Jan 2023
Loss Absorbing Capacity 1 Jan 2024 No change
• APRA has deferred its scheduled implementation of the Basel III reforms in Australia by one year, consistent with international implementation.
• The deferral supports ADIs in maintaining operations and supporting customers in response to COVID-19.
• APRA has reiterated it’s view that ADIs currently hold sufficient capital to meet the new requirements.
• NAB remains committed to progressing APRA’s regulatory change agenda.
APRA’S GUIDANCE ON CAPITAL MANAGEMENT
• On 7 April 2020, APRA announced its expectation that ADIs will seriously consider deferring decisions on the appropriate level of dividends until the outlook is clearer.
• APRA noted where dividends are approved, this should only be on the basis of robust stress testing results that have been discussed with APRA, and should be at a materially reduced level. Any dividend payments should be offset to the extent possible through the use of capital management initiatives.
CAPITAL & FUNDING
1.2 0.21.5
1.0 1.2
4.1
FY20 FY21 FY22 FY23 FY24 FY25 >FY25
89
• In July 2019, APRA announced a 3% increase to the Total Capital requirement for all domestic systemically important banks (D-SIBs) by 1 January 2024
• Based on NAB’s 31 March 2020 RWA of A$433bn, this represents an incremental Group Total Capital requirement of approximately A$12.5bn prior to January 2024
• NAB Ltd issued A$3 billion of LAC qualifying instruments in 1H20, A$500 million Additional Tier 1 and A$2.5 billion Tier 2
• Ahead of January 2024 APRA will consider “feasible alternative methods” for raising an additional 1% to 2% of RWA in loss-absorbing capacity, in consultation with industry and other interested stakeholders
APRA CHANGES TO MAJOR BANKS' CAPITAL STRUCTURESLOSS ABSORBING CAPACITY
CET1, 4.5%
CET1, 10.39%
CET1, 4.5%
AT1, 1.5%
AT1, 1.57%
AT1, 1.5%
T2, 2.0%
T2, 2.65%
T2, 5.0%
CCB3, 3.5%
CCB³, 3.5%Capital surplus¹ ²,
3.0%
Capital surplus¹ ², 3.0%
Current Requirements NAB Mar 2020 Jan 2024 Requirements
Total Capital 14.5%
Total Capital 17.5%
LOSS ABSORBING CAPACITY
NAB TIER 2 MATURITIES (TO FIRST CALL)4 ($bn)
(1) Capital surplus of 3% is generally higher than the normal level for D-SIBs, as a result of the ‘unquestionably strong’ capital benchmarks(2) Excludes any Pillar 2 requirements and additional 1%-2% RWA requirement through “feasible alternative methods”(3) CCB is the Capital Conservation Buffer(4) Including FY20 remaining maturities
Total Capital 14.61%
For
per
sona
l use
onl
y

CAPITAL & FUNDING
90
NEW ZEALAND CAPITAL CHANGES
• Based on BNZ’s balance sheet as at 31 March 2020, the RBNZ capital proposals would imply a NZ$4-5bn increase in BNZ Tier 1 capital or a decrease in BNZ balance sheet (RWAs).
• Management actions are expected to materially reduce the impact of the proposals.
• Under APRA’s proposed changes to APS 111 Capital Adequacy, there is minimal impact on NAB’s Level 1 CET1 ratio and NAB’s Level 2 CET1 ratio would be unchanged. As at 31 March 2020, Level 1 CET1 is 10.4%.
NEW ZEALAND REGULATORY CHANGE
NEW ZEALAND CONDITION OF REGISTRATION CHANGES
• To support the stability of the New Zealand financial system, the RBNZ has restricted payment of dividends on ordinary shares and the redemption of non-CET1 capital instruments. The restrictions will remain until further notice.
• The dividend restriction is not expected to have a material impact on NAB’s Level 1 CET1. The restriction does not impact NAB's Level 2 capital ratio
CAPITAL & FUNDING FUNDING PROFILE
AUSTRALIAN CORE FUNDING GAP1GROUP STABLE FUNDING INDEX (SFI)
DEPOSIT QUALITY3
(% of total)
($bn)
COVERED BOND ISSUANCE2
(1) Australian core funding gap = Gross loans and advances + Acceptances less Total deposits (excluding financial institution deposits and certificates of deposit). APRA Monthly Banking Statistics are used from Sep 17 to Mar 19. Apr 19 onwards is prepared using APRA Monthly Authorised Deposit-taking Institution statistics as at February 2020
91
DEPOSIT PORTFOLIO($bn)
6 months to 31 March 2020
($bn)
DEPOSIT GROWTH
($bn)AUSTRALIAN CORE FUNDING GAP1($bn)
APRA Methodology Change1
66% 70% 69% 69% 70% 72%
20% 20% 22% 24% 23% 24%86% 90% 91% 93% 93% 96%
Sep 12 Sep 14 Sep 16 Sep 18 Sep 19 Mar 20
Customer Funding Index Term Funding Index
140
160
180
200
220
240
260
Sep 17 Mar 18 Sep 18 Mar 19 Sep 19 Mar 20
(1.3)
12.5
5.2
1.0
5.2
-6.6 0.0 6.6 13.2
Corporate & InstitutionalBanking
New Zealand Banking
Consumer Banking & Wealth
Business & Private Banking
Corporate Functions & Other
161 163 160 152
200 195 211 236
47 51 5459
Sep 17 Sep 18 Sep 19 Mar 20
Term Deposits On Demand and Savings Deposits
Deposits Not Bearing Interest
408 409 425447
For
per
sona
l use
onl
y
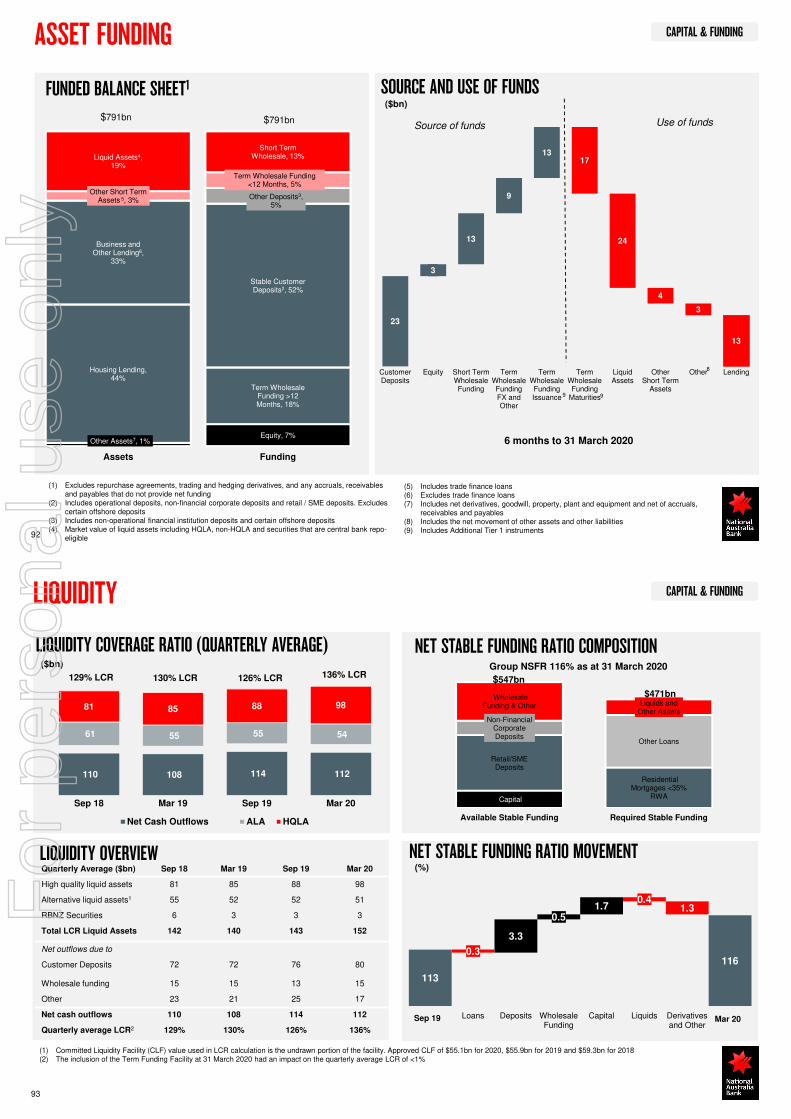
CAPITAL & FUNDING
Other Assets7, 1%
Housing Lending, 44%
Business and Other Lending6,
33%
Other Short Term Assets 5, 3%
Liquid Assets4, 19%
Equity, 7%
Term Wholesale Funding >12 Months, 18%
Stable Customer Deposits2, 52%
Other Deposits3, 5%
Term Wholesale Funding <12 Months, 5%
Short Term Wholesale, 13%
Assets Funding
$791bn $791bn
ASSET FUNDING
FUNDED BALANCE SHEET1 SOURCE AND USE OF FUNDS
(5) Includes trade finance loans(6) Excludes trade finance loans(7) Includes net derivatives, goodwill, property, plant and equipment and net of accruals,
receivables and payables(8) Includes the net movement of other assets and other liabilities(9) Includes Additional Tier 1 instruments
(1) Excludes repurchase agreements, trading and hedging derivatives, and any accruals, receivables and payables that do not provide net funding
(2) Includes operational deposits, non-financial corporate deposits and retail / SME deposits. Excludes certain offshore deposits
(3) Includes non-operational financial institution deposits and certain offshore deposits(4) Market value of liquid assets including HQLA, non-HQLA and securities that are central bank repo-
eligible92
23
3
13
9
1317
24
4
3
13
CustomerDeposits
Equity Short TermWholesaleFunding
TermWholesaleFundingFX andOther
TermWholesaleFundingIssuance
TermWholesaleFunding
Maturities
LiquidAssets
OtherShort Term
Assets
Other Lending
9
8
9
6 months to 31 March 2020
Source of funds Use of funds
($bn)
CAPITAL & FUNDING LIQUIDITY
LIQUIDITY OVERVIEW
LIQUIDITY COVERAGE RATIO (QUARTERLY AVERAGE)
(1) Committed Liquidity Facility (CLF) value used in LCR calculation is the undrawn portion of the facility. Approved CLF of $55.1bn for 2020, $55.9bn for 2019 and $59.3bn for 2018(2) The inclusion of the Term Funding Facility at 31 March 2020 had an impact on the quarterly average LCR of <1%
93
NET STABLE FUNDING RATIO MOVEMENT
Sep 19 Mar 20
(%)
($bn)
Quarterly Average ($bn) Sep 18 Mar 19 Sep 19 Mar 20
High quality liquid assets 81 85 88 98
Alternative liquid assets1 55 52 52 51
RBNZ Securities 6 3 3 3
Total LCR Liquid Assets 142 140 143 152
Net outflows due to
Customer Deposits 72 72 76 80
Wholesale funding 15 15 13 15
Other 23 21 25 17
Net cash outflows 110 108 114 112
Quarterly average LCR2 129% 130% 126% 136%
NET STABLE FUNDING RATIO COMPOSITIONGroup NSFR 116% as at 31 March 2020
110 108 114 112
61 55 55 54
81 85 88 98
Sep 18 Mar 19 Sep 19 Mar 20
Net Cash Outflows ALA HQLA
129% LCR 130% LCR 126% LCR 136% LCR
113
0.3
3.3
0.51.7
0.41.3
116
Loans Deposits WholesaleFunding
Capital Liquids Derivativesand Other
Capital
Residential Mortgages <35%
RWA
Retail/SME Deposits
Other Loans
Non-Financial Corporate Deposits
Liquids and Other Assets
Wholesale Funding & Other
-
Available Stable Funding Required Stable Funding
$471bn
$547bn
For
per
sona
l use
onl
y
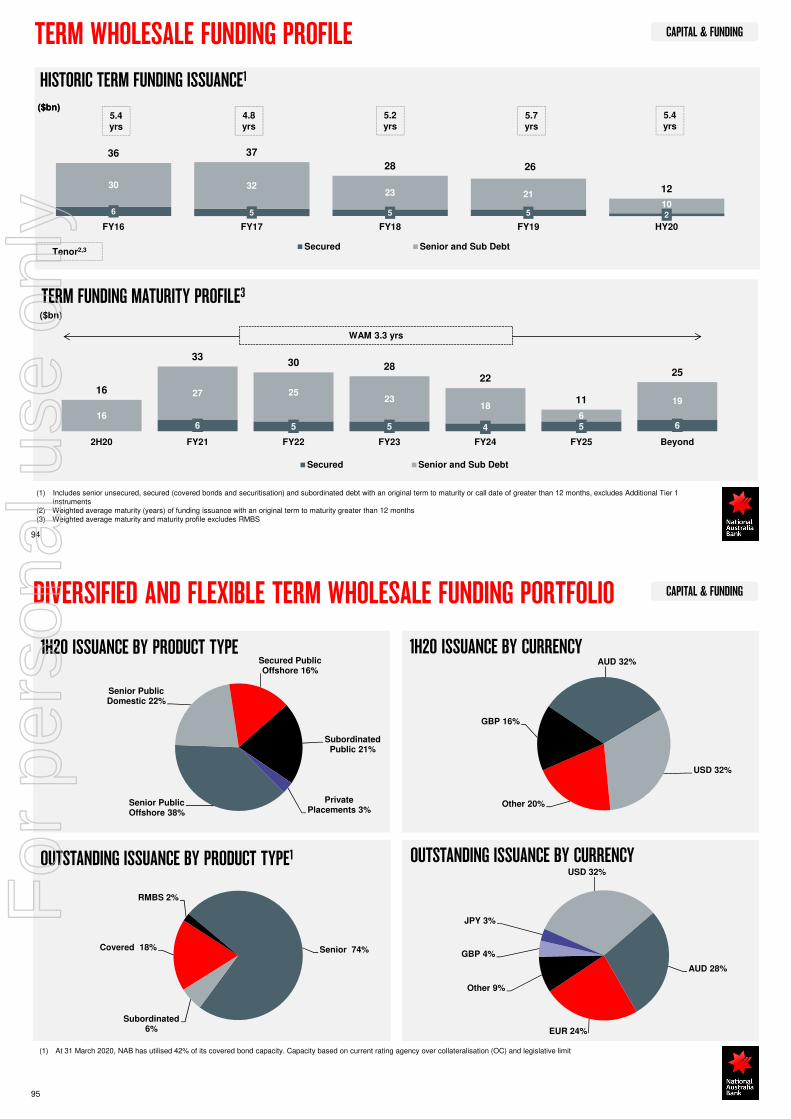
CAPITAL & FUNDING TERM WHOLESALE FUNDING PROFILE
94
(1) Includes senior unsecured, secured (covered bonds and securitisation) and subordinated debt with an original term to maturity or call date of greater than 12 months, excludes Additional Tier 1 instruments
(2) Weighted average maturity (years) of funding issuance with an original term to maturity greater than 12 months(3) Weighted average maturity and maturity profile excludes RMBS
TERM FUNDING MATURITY PROFILE3
($bn)
6 5 5 4 5 616
27 2523
186
1916
3330 28
22
11
25
2H20 FY21 FY22 FY23 FY24 FY25 Beyond
Secured Senior and Sub Debt
WAM 3.3 yrs
HISTORIC TERM FUNDING ISSUANCE1
($bn)
Tenor2,3
($bn)5.4yrs
4.8 yrs
5.2yrs
5.7yrs
5.4yrs
6 5 5 5 2
30 3223 21
10
36 37
28 26
12
FY16 FY17 FY18 FY19 HY20
Secured Senior and Sub Debt
CAPITAL & FUNDING DIVERSIFIED AND FLEXIBLE TERM WHOLESALE FUNDING PORTFOLIO
95
1H20 ISSUANCE BY CURRENCY1H20 ISSUANCE BY PRODUCT TYPE
OUTSTANDING ISSUANCE BY CURRENCYOUTSTANDING ISSUANCE BY PRODUCT TYPE1
Senior 74%
Subordinated6%
Covered 18%
RMBS 2%
USD 32%
AUD 28%
EUR 24%
Other 9%
GBP 4%
JPY 3%
(1) At 31 March 2020, NAB has utilised 42% of its covered bond capacity. Capacity based on current rating agency over collateralisation (OC) and legislative limit
Senior Public Offshore 38%
Senior Public Domestic 22%
Secured Public Offshore 16%
Subordinated Public 21%
Private Placements 3%
AUD 32%
USD 32%
Other 20%
GBP 16%
For
per
sona
l use
onl
y
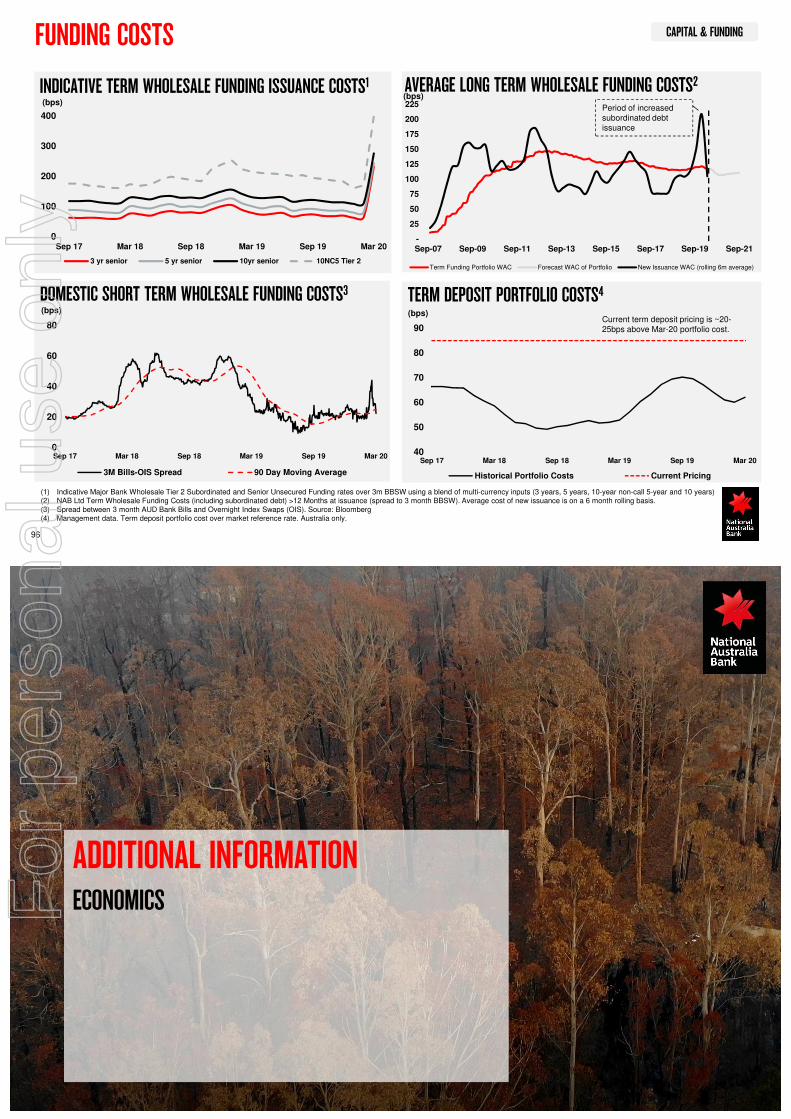
CAPITAL & FUNDING FUNDING COSTS
DOMESTIC SHORT TERM WHOLESALE FUNDING COSTS3 TERM DEPOSIT PORTFOLIO COSTS4
(1) Indicative Major Bank Wholesale Tier 2 Subordinated and Senior Unsecured Funding rates over 3m BBSW using a blend of multi-currency inputs (3 years, 5 years, 10-year non-call 5-year and 10 years)(2) NAB Ltd Term Wholesale Funding Costs (including subordinated debt) >12 Months at issuance (spread to 3 month BBSW). Average cost of new issuance is on a 6 month rolling basis. (3) Spread between 3 month AUD Bank Bills and Overnight Index Swaps (OIS). Source: Bloomberg(4) Management data. Term deposit portfolio cost over market reference rate. Australia only.
96
0
20
40
60
80
Sep 17 Mar 18 Sep 18 Mar 19 Sep 19 Mar 20
(bps)
3M Bills-OIS Spread 90 Day Moving Average
INDICATIVE TERM WHOLESALE FUNDING ISSUANCE COSTS1
(bps)
0
100
200
300
400
Sep 17 Mar 18 Sep 18 Mar 19 Sep 19 Mar 20
3 yr senior 5 yr senior 10yr senior 10NC5 Tier 2
AVERAGE LONG TERM WHOLESALE FUNDING COSTS2
40
50
60
70
80
90
Sep 17 Mar 18 Sep 18 Mar 19 Sep 19 Mar 20
(bps)
Historical Portfolio Costs Current Pricing
Current term deposit pricing is ~20-25bps above Mar-20 portfolio cost.
-
25
50
75
100
125
150
175
200
225
Sep-07 Sep-09 Sep-11 Sep-13 Sep-15 Sep-17 Sep-19 Sep-21
Term Funding Portfolio WAC Forecast WAC of Portfolio New Issuance WAC (rolling 6m average)
(bps)
Period of increased subordinated debt issuance
ADDITIONAL INFORMATIONECONOMICSF
or p
erso
nal u
se o
nly
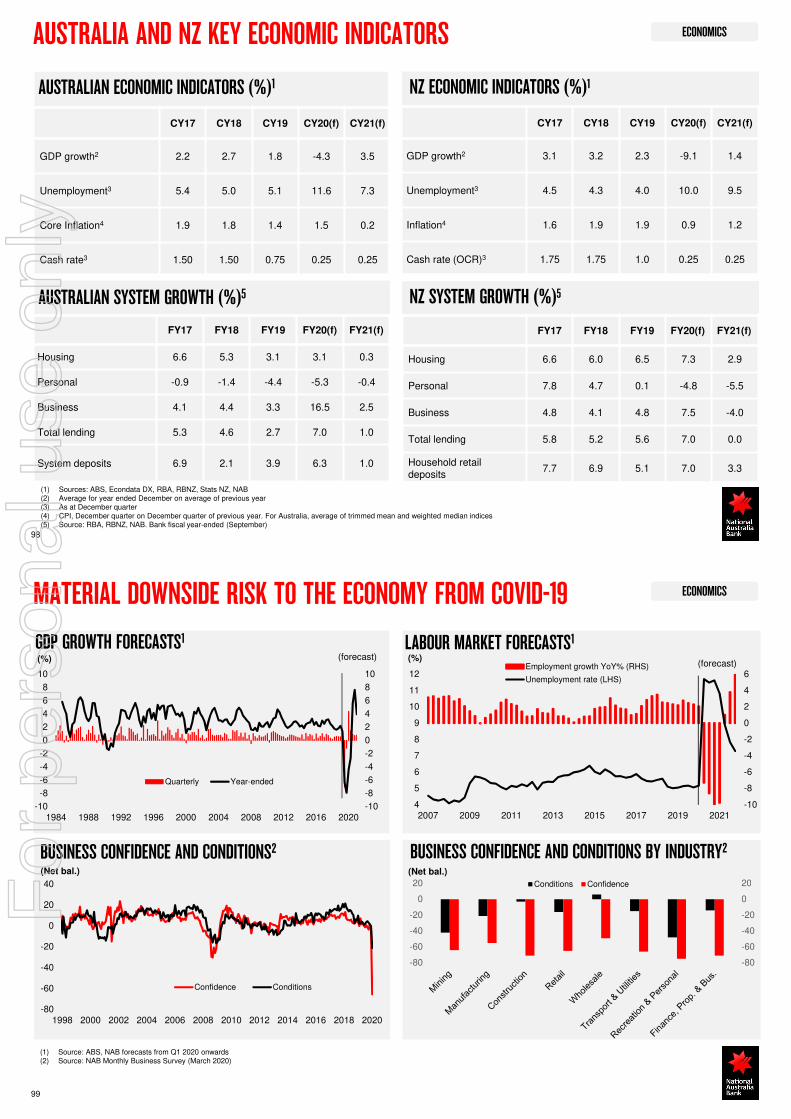
ECONOMICSAUSTRALIA AND NZ KEY ECONOMIC INDICATORS
98
AUSTRALIAN ECONOMIC INDICATORS (%)1
AUSTRALIAN SYSTEM GROWTH (%)5
NZ ECONOMIC INDICATORS (%)1
NZ SYSTEM GROWTH (%)5
(1) Sources: ABS, Econdata DX, RBA, RBNZ, Stats NZ, NAB(2) Average for year ended December on average of previous year(3) As at December quarter(4) CPI, December quarter on December quarter of previous year. For Australia, average of trimmed mean and weighted median indices(5) Source: RBA, RBNZ, NAB. Bank fiscal year-ended (September)
CY17 CY18 CY19 CY20(f) CY21(f)
GDP growth2 3.1 3.2 2.3 -9.1 1.4
Unemployment3 4.5 4.3 4.0 10.0 9.5
Inflation4 1.6 1.9 1.9 0.9 1.2
Cash rate (OCR)3 1.75 1.75 1.0 0.25 0.25
FY17 FY18 FY19 FY20(f) FY21(f)
Housing 6.6 6.0 6.5 7.3 2.9
Personal 7.8 4.7 0.1 -4.8 -5.5
Business 4.8 4.1 4.8 7.5 -4.0
Total lending 5.8 5.2 5.6 7.0 0.0
Household retail deposits
7.7 6.9 5.1 7.0 3.3
CY17 CY18 CY19 CY20(f) CY21(f)
GDP growth2 2.2 2.7 1.8 -4.3 3.5
Unemployment3 5.4 5.0 5.1 11.6 7.3
Core Inflation4 1.9 1.8 1.4 1.5 0.2
Cash rate3 1.50 1.50 0.75 0.25 0.25
FY17 FY18 FY19 FY20(f) FY21(f)
Housing 6.6 5.3 3.1 3.1 0.3
Personal -0.9 -1.4 -4.4 -5.3 -0.4
Business 4.1 4.4 3.3 16.5 2.5
Total lending 5.3 4.6 2.7 7.0 1.0
System deposits 6.9 2.1 3.9 6.3 1.0
ECONOMICS
BUSINESS CONFIDENCE AND CONDITIONS BY INDUSTRY2
(1) Source: ABS, NAB forecasts from Q1 2020 onwards(2) Source: NAB Monthly Business Survey (March 2020)
99
BUSINESS CONFIDENCE AND CONDITIONS2
MATERIAL DOWNSIDE RISK TO THE ECONOMY FROM COVID-19
(Net bal.)
-80
-60
-40
-20
0
20
40
1998 2000 2002 2004 2006 2008 2010 2012 2014 2016 2018 2020
Confidence Conditions
(Net bal.)
-10
-8
-6
-4
-2
0
2
4
6
8
10
-10
-8
-6
-4
-2
0
2
4
6
8
10
1984 1988 1992 1996 2000 2004 2008 2012 2016 2020
Quarterly Year-ended
(%) (forecast)
-10
-8
-6
-4
-2
0
2
4
6
4
5
6
7
8
9
10
11
12
2007 2009 2011 2013 2015 2017 2019 2021
Employment growth YoY% (RHS)
Unemployment rate (LHS)
(%)(forecast)
GDP GROWTH FORECASTS1 LABOUR MARKET FORECASTS1
-80
-60
-40
-20
0
20
-80
-60
-40
-20
0
20 Conditions ConfidenceFor
per
sona
l use
onl
y
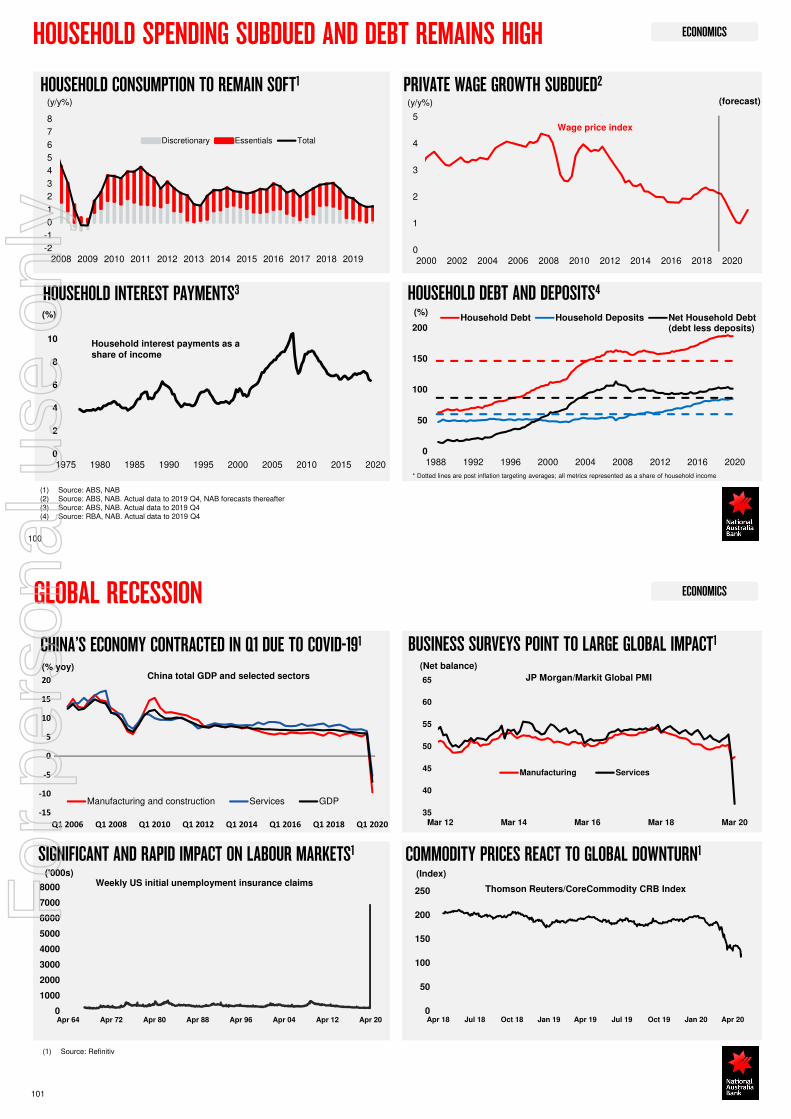
ECONOMICS
0
1
2
3
4
5
2000 2002 2004 2006 2008 2010 2012 2014 2016 2018 2020
(y/y%)
Wage price index
HOUSEHOLD INTEREST PAYMENTS3
HOUSEHOLD SPENDING SUBDUED AND DEBT REMAINS HIGH
HOUSEHOLD CONSUMPTION TO REMAIN SOFT1 PRIVATE WAGE GROWTH SUBDUED2
HOUSEHOLD DEBT AND DEPOSITS4
0
50
100
150
200
1988 1992 1996 2000 2004 2008 2012 2016 2020
Household Debt Household Deposits Net Household Debt(debt less deposits)
* Dotted lines are post inflation targeting averages; all metrics represented as a share of household income
(%)
100
(forecast)
0
2
4
6
8
10
1975 1980 1985 1990 1995 2000 2005 2010 2015 2020
(%)
Household interest payments as a share of income
-2
-1
0
1
2
3
4
5
6
7
8
2008 2009 2010 2011 2012 2013 2014 2015 2016 2017 2018 2019
Discretionary Essentials Total
(y/y%)
(1) Source: ABS, NAB(2) Source: ABS, NAB. Actual data to 2019 Q4, NAB forecasts thereafter(3) Source: ABS, NAB. Actual data to 2019 Q4(4) Source: RBA, NAB. Actual data to 2019 Q4
ECONOMICS
BUSINESS SURVEYS POINT TO LARGE GLOBAL IMPACT1
GLOBAL RECESSION
CHINA’S ECONOMY CONTRACTED IN Q1 DUE TO COVID-191
(1) Source: Refinitiv
101
SIGNIFICANT AND RAPID IMPACT ON LABOUR MARKETS1 COMMODITY PRICES REACT TO GLOBAL DOWNTURN1
0
1000
2000
3000
4000
5000
6000
7000
8000
Apr 64 Apr 72 Apr 80 Apr 88 Apr 96 Apr 04 Apr 12 Apr 20
Weekly US initial unemployment insurance claims('000s)
0
50
100
150
200
250
Apr 18 Jul 18 Oct 18 Jan 19 Apr 19 Jul 19 Oct 19 Jan 20 Apr 20
Thomson Reuters/CoreCommodity CRB Index
(Index)
35
40
45
50
55
60
65
Mar 12 Mar 14 Mar 16 Mar 18 Mar 20
Manufacturing Services
JP Morgan/Markit Global PMI
(Net balance)
-15
-10
-5
0
5
10
15
20
Q1 2006 Q1 2008 Q1 2010 Q1 2012 Q1 2014 Q1 2016 Q1 2018 Q1 2020
Manufacturing and construction Services GDP
(% yoy)China total GDP and selected sectors
For
per
sona
l use
onl
y
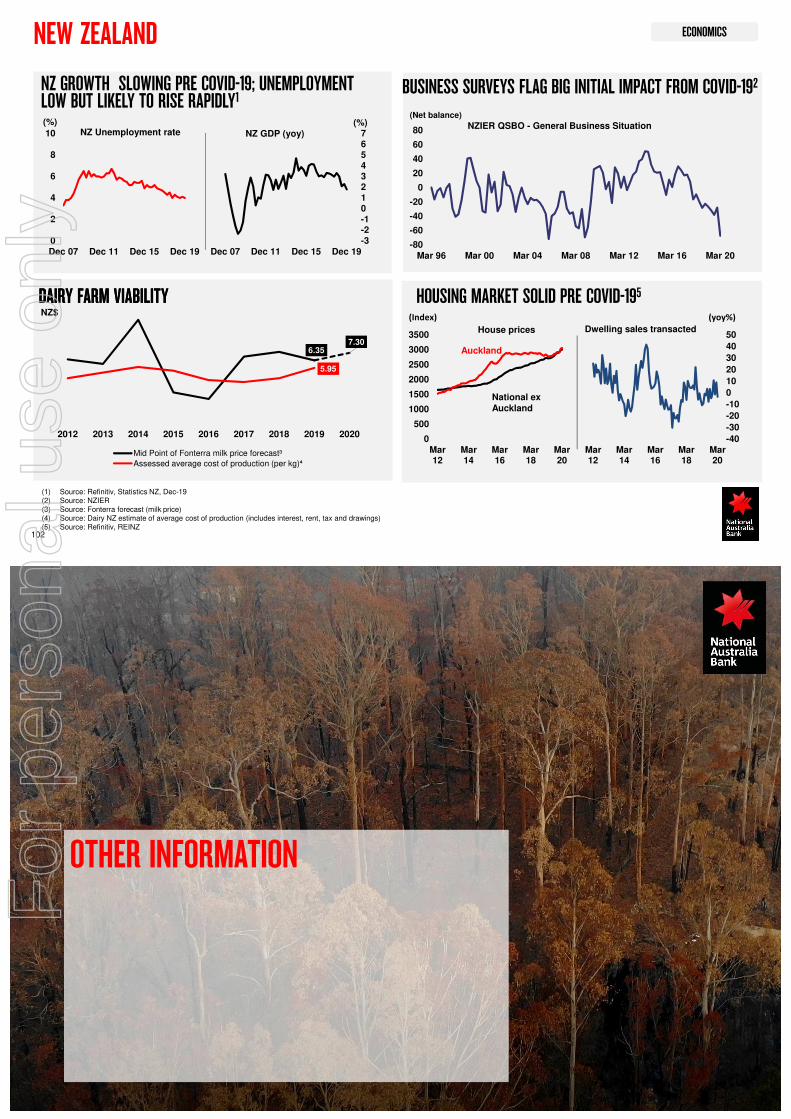
ECONOMICSNEW ZEALAND
102
HOUSING MARKET SOLID PRE COVID-195
NZ GROWTH SLOWING PRE COVID-19; UNEMPLOYMENT LOW BUT LIKELY TO RISE RAPIDLY1
(1) Source: Refinitiv, Statistics NZ, Dec-19(2) Source: NZIER(3) Source: Fonterra forecast (milk price)(4) Source: Dairy NZ estimate of average cost of production (includes interest, rent, tax and drawings)(5) Source: Refinitiv, REINZ
DAIRY FARM VIABILITY
BUSINESS SURVEYS FLAG BIG INITIAL IMPACT FROM COVID-192
-40
-30
-20
-10
0
10
20
30
40
50
0
500
1000
1500
2000
2500
3000
3500
Mar12
Mar14
Mar16
Mar18
Mar20
Mar12
Mar14
Mar16
Mar18
Mar20
Auckland
National ex Auckland
Dwelling sales transacted
(Index)
House prices
(yoy%)
DAIRY FARM VIABILITY
6.357.30
5.95
3
6
9
2012 2013 2014 2015 2016 2017 2018 2019 2020
Mid Point of Fonterra milk price forecast³
Assessed average cost of production (per kg)⁴
NZ$
-80
-60
-40
-20
0
20
40
60
80
Mar 96 Mar 00 Mar 04 Mar 08 Mar 12 Mar 16 Mar 20
NZIER QSBO - General Business Situation(Net balance)
-3-2-101234567
0
2
4
6
8
10
Dec 07 Dec 11 Dec 15 Dec 19 Dec 07 Dec 11 Dec 15 Dec 19
NZ GDP (yoy)NZ Unemployment rate(%) (%)
OTHER INFORMATION
For
per
sona
l use
onl
y
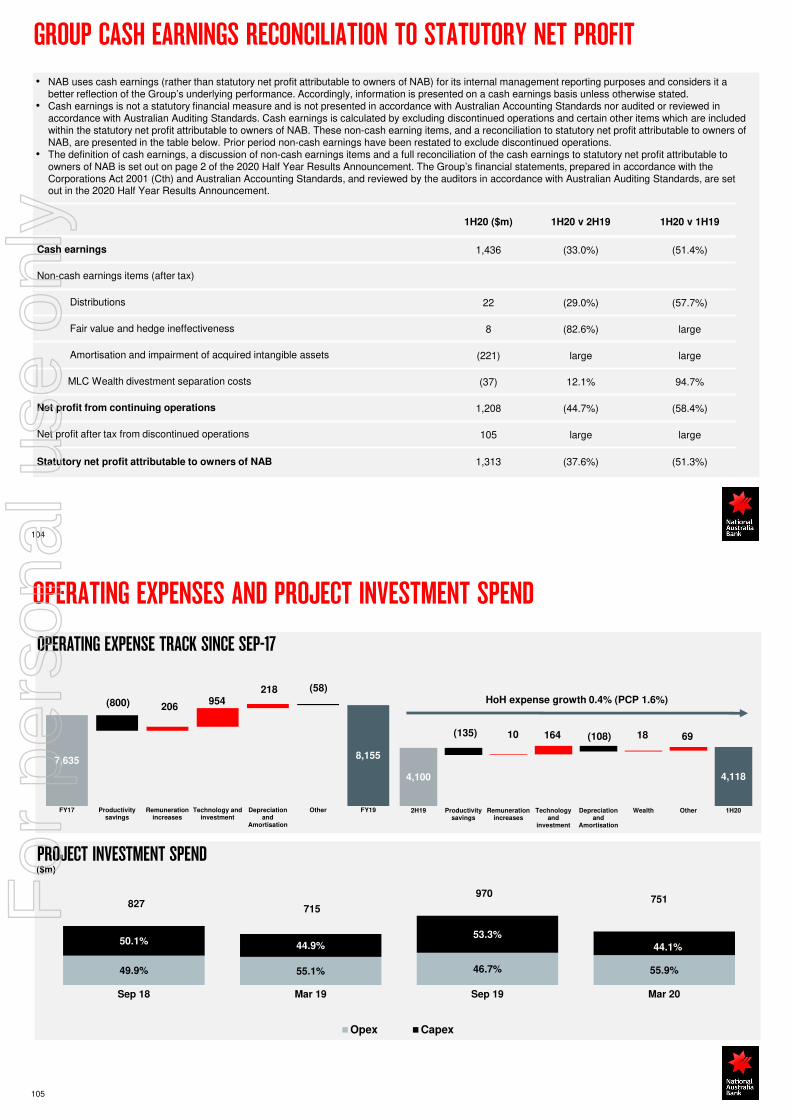
GROUP CASH EARNINGS RECONCILIATION TO STATUTORY NET PROFIT
104
1H20 ($m) 1H20 v 2H19 1H20 v 1H19
Cash earnings 1,436 (33.0%) (51.4%)
Non-cash earnings items (after tax)
Distributions 22 (29.0%) (57.7%)
Fair value and hedge ineffectiveness 8 (82.6%) large
Amortisation and impairment of acquired intangible assets (221) large large
MLC Wealth divestment separation costs (37) 12.1% 94.7%
Net profit from continuing operations 1,208 (44.7%) (58.4%)
Net profit after tax from discontinued operations 105 large large
Statutory net profit attributable to owners of NAB 1,313 (37.6%) (51.3%)
• NAB uses cash earnings (rather than statutory net profit attributable to owners of NAB) for its internal management reporting purposes and considers it a better reflection of the Group’s underlying performance. Accordingly, information is presented on a cash earnings basis unless otherwise stated.
• Cash earnings is not a statutory financial measure and is not presented in accordance with Australian Accounting Standards nor audited or reviewed in accordance with Australian Auditing Standards. Cash earnings is calculated by excluding discontinued operations and certain other items which are included within the statutory net profit attributable to owners of NAB. These non-cash earning items, and a reconciliation to statutory net profit attributable to owners of NAB, are presented in the table below. Prior period non-cash earnings have been restated to exclude discontinued operations.
• The definition of cash earnings, a discussion of non-cash earnings items and a full reconciliation of the cash earnings to statutory net profit attributable to owners of NAB is set out on page 2 of the 2020 Half Year Results Announcement. The Group’s financial statements, prepared in accordance with the Corporations Act 2001 (Cth) and Australian Accounting Standards, and reviewed by the auditors in accordance with Australian Auditing Standards, are set out in the 2020 Half Year Results Announcement.
49.9% 55.1% 46.7% 55.9%
50.1% 44.9%53.3%
44.1%
827 715
970 751
Sep 18 Mar 19 Sep 19 Mar 20
Opex Capex
OPERATING EXPENSES AND PROJECT INVESTMENT SPEND
105
PROJECT INVESTMENT SPEND($m)
OPERATING EXPENSE TRACK SINCE SEP-17
4,100 4,118
10 164 18 69 (135) (108)
2H19 Productivitysavings
Remunerationincreases
Technologyand
investment
Depreciationand
Amortisation
Wealth Other 1H20
HoH expense growth 0.4% (PCP 1.6%)
7,6358,155
206 954
218
(800)
(58)
FY17 Productivitysavings
Remunerationincreases
Technology andinvestment
Depreciationand
Amortisation
Other FY19
For
per
sona
l use
onl
y
ABBREVIATIONS
106
AUM Assets Under Management
CET1 Common Equity Tier 1 Capital
CIC Credit impairment charge
CLF Committed Liquidity Facility
CPS Cents Per Share
CTI Cost to income ratio
DRP Dividend Reinvestment Plan
DVA Derivative valuation adjustment
EAD Exposure at Default
EA Economic Adjustment
EPS Earnings Per Share
FTEs Full-time Equivalent Employees
FUM/A Funds Under Management and Administration
GIAs Gross Impaired Assets
GLAs Gross Loans and acceptances
HQLA High Quality Liquid Assets
IRB Internal Ratings Based approach
LCR Liquidity Coverage Ratio
LVR Loan to Value Ratio
MTM Mark to market
NII Net Interest Income
NPS Net Promoter Score
NSFR Net Stable Funding Ratio
OIS Overnight Index Swap
OOI Other operating income
OTC Over the counter
RMBS Residential Mortgage Backed Securities
ROE Return on Equity
RWAs Risk-weighted assets
SFI Stable Funding Index
SME Small and Medium Enterprise
TCFD Task Force on Climate-related Financial Disclosures
TFF Term Funding Facility
UNEP FI United Nations Environment Programme - Finance Initiative
The material in this presentation is general background information about the NAB Group current at the date of the presentation on 27 April 2020. The information is given in summary form and does not purport to be complete. It is intended to be read by a professional analyst audience in conjunction with the verbal presentation and the 2020 Half Year Results Announcement (available at www.nab.com.au). It is not intended to be relied upon as advice to investors or potential investors and does not take into account the investment objectives, financial situation or needs of any particular investor. No representation is made as to the accuracy, completeness or reliability of the presentation.
This presentation contains statements that are, or may be deemed to be, forward looking statements. These forward looking statements may be identified by the use of forward looking terminology, including the terms "believe", "estimate", "plan", "project", "anticipate", "expect", “target”, "intend", “likely”, "may", "will", “could” or "should" or, in each case, their negative or other variations or other similar expressions, or by discussions of strategy, plans, objectives, targets, goals, future events or intentions. Indications of, and guidance on, future earnings and financial position and performance are also forward looking statements. You are cautioned not to place undue reliance on such forward looking statements. Such forward looking statements are not guarantees of future performance and involve known and unknown risks, uncertainties and other factors, many of which are beyond the control of the Group, which may cause actual results to differ materially from those expressed or implied in such statements. There can be no assurance that actual outcomes will not differ materially from these statements.
This presentation describes certain initiatives relating to the Group’s strategic agenda (“Program”), including certain forward looking statements. These statements are subject to a number of risks, assumptions and qualifications, including: (1) the Group’s ability to execute productivity initiatives and realise operational synergies, cost savings and revenue benefits in accordance with the Program plan (including, in relation to CTI and ROE targets, the extension of improvements beyond the current Program plan); (2) the Group’s ability to meet its internal net FTE reduction targets; (3) the Group’s ability to recruit and retain FTE and contractors with the requisite skills and experience to deliver Program initiatives; (4) there being no significant change in the Group’s financial performance or operating environment, including the economic conditions in Australia and New Zealand, changes to financial markets and the Group’s ability to raise funding and the cost of such funding, increased competition, changes in interest rates and changes in customer behaviour; (5) there being no material change to law or regulation or changes to regulatory policy or interpretation, including relating to the capital and liquidity requirements of the Group; (6) for the purpose of calculating FTE cost savings and redundancy costs, the Group has assumed an average FTE cost based on Group-wide averages, and such costs are not calculated by reference to specific productivity initiatives or individual employee entitlements; and (7) NAB’s proposed divestment of its wealth management businesses (excluding JBWere and nabtrade) may have an impact on the timing, scope and cost of the Program, however the impact cannot be quantified at this time.
There are a number of other important factors that could cause actual results to differ materially from those projected in such Statements, including (without limitation) the risks and uncertainties associated with the ongoing impacts of COVID-19, the Australian and global economic environment and capital market conditions. Further information is contained in the Group’s Luxembourg Transparency Law disclosures released to the ASX on 27 April 2020 and the Group’s Annual Financial Report for the 2019 financial year, which is available at www.nab.com.au.
No Offer
This presentation does not constitute an offer to sell, or the solicitation of an offer to buy, any securities in the United States or any other jurisdiction in which such an offer would beillegal. The securities referred to in this presentation have not been, and will not be, registered under the U.S. Securities Act of 1933, as amended (the U.S. Securities Act), or thesecurities laws of any state or other jurisdiction of the United States. Accordingly, the securities referred to in this presentation may not be offered or sold, directly or indirectly, in theUnited States unless the securities have been registered under the U.S. Securities Act (which NAB is under no obligation to do) or are offered or sold pursuant to an exemptionfrom, or in a transaction not subject to, the registration requirements of the U.S. Securities Act and applicable securities laws of any state or other jurisdiction of the United States.
DISCLAIMER
For further information visit www.nab.com.au or contact:
Sally Mihell
Executive General Manager, Investor Relations
Mobile | +61 (0) 436 857 669
107
Natalie CoombeDirector, Investor Relations
Mobile | +61 (0) 477 327 540
Mark AlexanderGeneral Manager, Corporate Communications
Mobile | +61 (0) 412 171 447
For
per
sona
l use
onl
y