for personal use only - asx · appendix 4d evolutionmininglimitedacn 084669036 and...
TRANSCRIPT

APPENDIX 4DEVOLUTION MINING LIMITED ACN 084 669 036
AND CONTROLLED ENTITIESHALF-YEAR FINANCIAL REPORT
For the half-year ended 31 December 2018
Results for Announcement to the Market
Key Information
31 December2018$'000
31 December2017$'000
Up / (down)$'000
% increase/(decrease)
Revenues from ordinary activities 756,218 782,139 (25,921) (3)%SPACEEarnings before Interest, Tax, Depreciation,Amortisation & Fair value adjustments (EBITDA) 359,659 399,099 (39,440) (10)%SPACEStatutory profit before income tax 132,057 175,091 (43,034) (25)%SPACEProfit from ordinary activities after income taxattributable to members 91,110 122,518 (31,408) (26)%
Dividend Information
Amountper share
Cents
Frankedamount per
shareCents
SpaceInterim dividend for the year ended 30 June 2019
Dividend to be paid on 29 March 2019 3.5 3.5Space
Net Tangible Assets
31 December2018
$
31 December2017
$
Net tangible assets per share 1.38 1.29
Earnings Per Share
31 December2018
Cents
31 December2017
Cents
Basic earnings per share 5.37 7.25Diluted earnings per share 5.34 7.21
Additional Appendix 4D disclosure requirements can be found in the notes of this Half-Year Financial Report andthe Directors' Report attached thereto. This report is based on the consolidated Half-Year Financial Report whichhas been subject to review by PricewaterhouseCoopers.
For
per
sona
l use
onl
y
Evolution Mining LimitedHalf-Year Financial Report
Corporate Information
ABN 74 084 669 036
Directors
Jacob (Jake) Klein Executive ChairmanLawrence (Lawrie) Conway Finance Director and Chief Financial OfficerThomas (Tommy) McKeith (i) Lead Independent DirectorColin (Cobb) Johnstone Non-Executive DirectorJames (Jim) Askew Non-Executive DirectorGraham Freestone Non-Executive DirectorAndrea Hall Non-Executive DirectorNaguib Sawiris (ii) Non-Executive DirectorSebastien de Montessus (ii) Non-Executive Director
Andrew Wray (ii)Alternate Non-Executive Director for Naguib Sawiris and Sebastien deMontessus
(i) Appointed as Lead Independent Director effective 1 December 2018.(ii) Resigned effective 1 August 2018.
Company Secretary
Evan Elstein
Registered Office
Level 24, 175 Liverpool StreetSYDNEY NSW 2000
Postal Address
Level 24, 175 Liverpool StreetSYDNEY NSW 2000
T: +61 2 9696 2900F: +61 2 9696 2901
Share Register
Link Market ServicesLevel 12, 680 George StreetSYDNEY NSW 2000
T: +61 2 9315 2333F: +61 2 9287 0303
Auditor
PricewaterhouseCoopersOne International Towers SydneySYDNEY NSW 2000
T: + 61 2 8266 0000F: + 61 2 8266 9999
Website
www.evolutionmining.com.au
Stock Exchange Listing
Evolution Mining Limited (EVN) shares are listed on the Australian Securities Exchange.
For
per
sona
l use
onl
y

Table of ContentsPage
Directors' Report 1Auditor's Independence Declaration 13Half-Year Financial Report
Consolidated Statement of Profit or Loss and Other Comprehensive Income 14Consolidated Balance Sheet 15Consolidated Statement of Changes in Equity 16Consolidated Statement of Cash Flows 17Notes to the Consolidated Financial Statements 18Directors' Declaration 37
Independent Auditor's Review Report to the Members 38
For
per
sona
l use
onl
y

Directors' Report
Directors' Report
Directors
Jacob (Jake) Klein Executive ChairmanLawrence (Lawrie) Conway Finance Director and Chief Financial OfficerThomas (Tommy) McKeith (i) Lead Independent DirectorColin (Cobb) Johnstone Non-Executive DirectorJames (Jim) Askew Non-Executive DirectorGraham Freestone Non-Executive DirectorAndrea Hall Non-Executive DirectorNaguib Sawiris (ii) Non-Executive DirectorSebastien de Montessus (ii) Non-Executive Director
Andrew Wray (ii)Alternate Non-Executive Director for Naguib Sawiris and Sebastien deMontessus
(i) Appointed as Lead Independent Director effective 1 December 2018.(ii) Resigned effective 1 August 2018.
Company Secretary
The name of the Company Secretary during the whole of the half-year ended 31 December 2018 and up to thedate of this report is as follows:Evan Elstein
Key highlights for the period
Key highlights for the half-year ended 31 December 2018 include:
• Driving a safety culture where our people do the right thing because they want to, not because they have to,underpins our safety programs. The total recordable injury frequency (TRIF) was 7.3 (30 June 2018: 5.5).This reflects an increase in minor injuries with a need to increase focus on promoting mindfulness andpre-task risk identification. Safety programs included HSE Systems and Critical Control verification audits.The focus continues to be on improving Evolution’s safety culture and embedding critical controls across allsites.
• Evolution published its inaugural Sustainability Report in the December 2018 half-year.
• The Group recorded a statutory net profit after tax of $91.1 million and underlying net profit after tax of $92.2million for the period to 31 December 2018 (31 December 2017: $122.5 million and $124.7 millionrespectively). The lower profit was driven predominantly by the impact of non-cash related items whichreduced profit before tax by $35.3 million while cash related items reduced profit before tax by $11.3 million.These were partially offset by a lower tax expense of $11.6 million and the impact of the divestment of EdnaMay of $3.7 million.
• Full-year production and cost guidance remains unchanged. This indicates a planned improved operationalperformance for the second half of the financial year. In addition, the gold price is currently $155/oz higherthan the achieved price for the half-year to December 2018 of $1,695/oz. If this level is sustained, then amaterially better profit in the second half of the year is likely.
• Evolution continued investing for extensions of mine life and production growth, including the approval ofmajor development projects and exploration drilling at Cowal, and an underground mine development andplant upgrade at Mt Carlton.
• Key results are as follows:
• Total gold production of 382,214 oz at an AISC of $928/oz.• Operating mine cash flow of $387.9 million.
1
For
per
sona
l use
onl
y

Directors' Report
Key highlights for the period (continued)
• Net mine cash flow of $237.8 million, with all operations delivering positive cash flow generationafter meeting their operating and capital needs.
• Net bank debt reduced by $30.7 million to $41.1 million (30 June 2018: $71.8 million).
• A $67.8 million fully franked dividend in respect of the year ended 30 June 2018 was paid during the period.The Directors have approved an interim fully franked dividend of 3.5 cents per fully paid ordinary share. Theaggregate amount of the proposed dividend to be paid on 29 March 2019 is estimated at $59.4 million.
• During the period ended 31 December 2018, the Group made $40.0 million of repayments on the SeniorSecured Term Loan (“Facility D”). The $350.0 million Senior Secured Revolving Loan ("Facility A") remainsundrawn at 31 December 2018.
• A total investment of $29.9 million in discovery and resource definition drilling programs across the Groupdelivered excellent results during the period. Highlights include continued success from the explorationdrilling programs at Cowal’s GRE46 and Dalwhinnie, and Mungari’s Scottish Archer and Ora Banda projects.
• During the period, the Company took advantage of the elevated Australian dollar gold price to hedge a further300,000oz of production at an average price of A$1,871/oz for quarterly deliveries between July 2020 andJune 2023. The additional hedging provides support to the balance sheet during a period of major capitalinvestment while leaving the majority of production unhedged.
• During December 2018, the Group agreed to subscribe for a further 3.2 million shares in Riversgold Ltd,taking the Company’s shareholding to 15.7 million shares and a total of 18.7% of the outstanding shares inRiversgold Ltd.
• In October 2018, the Board approved the Mt Carlton underground development and plant upgrademodifications. The capital expenditure required for the underground development and plant modifications isestimated at $60.0 million to be incurred from FY19 to FY22. First ore from the underground is planned forFY21.
• In October 2018, the Cowal operation was granted regulatory approval from the NSW Department ofPlanning and Environment to increase the plant processing rate by 31% from 7.5 million tonnes per annum(Mtpa) to 9.8Mtpa. Other key features of the modification application include the implementation of asecondary crushing circuit at the processing plant and the development of an Integrated Waste Landform(IWL) to facilitate storage of tailings over the life of mine. Subsequent to this regulatory approval, the Boardapproved the first stage upgrade to the Cowal processing plant in November 2018. The first stage of theproject will take the processing capacity to 8.7Mtpa at an estimated capital investment of $25 to $30 million.
• In October 2018, regulatory approval to commence the development of the Galway-Regal-E46 (GRE46)exploration decline at Cowal was received. The decline will allow Evolution to conduct further resourcedefinition and discovery drilling at GRE46 as well as further drilling to delineate the Dalwhinnie Lode. Workswill commence in the March 2019 quarter.
• In September 2018, Evolution entered into an earn-in joint venture agreement with Andromeda MetalsLimited over the Drummond exploration project. Drummond is an early-stage gold exploration project locatedin northern Queensland covering roughly 520km². The project is approximately 50km southwest ofEvolution’s Mt Carlton operation. The key terms of the agreement are as follows:
• Evolution can earn a 51% interest in the project by making a cash payment of $300k toAndromeda and spending $2 million on exploration over a two year period.
• Evolution can earn a further 29% (for a total of over 80%) by making an additional cash paymentof $200k and spending $4 million on exploration over two years.
• In August 2018, La Mancha sold a portion of their shareholding in the Company, taking their total holdingdown to 9.6%. In line with the terms of the Share Sale Agreement signed between the two Companies, LaMancha’s nominee Directors Mr Naguib Sawiris, Mr Sebastian de Montessus and their Alternate Director MrAndrew Wray resigned from the Board of Directors in August 2018.
2
For
per
sona
l use
onl
y

Directors' Report
Operating and Financial Review
Overview
As at 31 December 2018, the Group consisted of five wholly-owned operating gold mines; Cowal in New SouthWales; Cracow, Mt Carlton and Mt Rawdon in Queensland; Mungari in Western Australia, and an economicinterest in the Ernest Henry Copper-Gold Operation (100% of gold and 30% of copper and silver) in Queensland.
The Group posted a statutory profit after tax of $91.1 million for the half-year ended 31 December 2018 (31December 2017: $122.5 million). The following graph shows the movements in the Group’s statutory profit for thehalf-year ended 31 December 2018 compared to 31 December 2017.
Statutory profit was lower mainly due to the impact of non-cash related items including; utilisation of orestockpiles at Mt Rawdon of $11.4 million; a higher depreciation and amortisation expense of $13.3 million; andlower capitalisation of mine costs of $10.6 million in the current period for both underground and open pit (mainlythe completion of the White Foil cutback at Mungari). Higher achieved gold prices were offset by lower silver andcopper revenue and higher operating costs for an overall net impact of $11.3 million. Mine operating costs whichimpacted cash were $25.1 million higher, in part driven by higher labour, power and diesel costs. The prior periodincluded a loss of $3.7 million at Edna May which was sold in October 2017.
Full-year production and cost guidance remains unchanged. This indicates a planned improved operationalperformance for the second half of the financial year. In addition, the gold price is currently $155/oz higher thanthe achieved price for the half-year to December 2018 of $1,695/oz. If this level is sustained, then a materiallybetter profit in the second half of the year is likely.
The Group recorded an underlying net profit after tax of $92.2 million for the period ended 31 December 2018 (31December 2017: $124.7 million). The underlying net profit after tax excludes one-off transactions of $1.0 million.
The table below shows the differences of statutory profit before tax to the underlying profit after tax.
2018 2017
$'000 $'000Statutory profit before income tax 132,057 175,091Fair value gain - (3,142)Transaction and integration costs 1,040 1,192Underlying profit before income tax 133,097 173,141Income tax expense (40,947) (52,573)Tax expense on sale of subsidiary - 4,165Underlying profit after income tax 92,150 124,733
3
For
per
sona
l use
onl
y

Directors' Report
Operating and Financial Review (continued)
Overview (continued)
The positive impact of a 5% increase in achieved gold price of $1,695/oz was offset by a 3% higher cost of salesand a 6% lower achieved copper price to generate operating mine cash flow of $387.9 million (31 December2017: $415.1 million).
Total capital expenditure increased 23% to $150.9 million (including all sustaining and major capital expenditure,rehabilitation costs and capital stripping). The planned increase in capital expenditure is in the most partattributable to Stage H development, the Float Tails Leach project and land acquisition costs at Cowal;underground mine development at Cracow, Mt Carlton and Mungari; and capital waste stripping at both MtCarlton and Mt Rawdon.
4
For
per
sona
l use
onl
y

Directors' Report
Operating and Financial Review (continued)
Overview (continued)
Key Results
The consolidated operating and financial results for the current and prior period are summarised below. All $figures refer to Australian thousand dollars (A$'000) unless otherwise stated.
Key Business Metrics31 December
201831 December
2017% Change
(ii)
Total underground ore mined (kt) 4,014 3,878 4%Total underground lateral development (m) 6,717 6,835 (2)%Total open pit ore mined (kt) 5,768 7,768 (26)%Total open pit waste mined (kt) 21,300 18,011 18%Processed tonnes (kt) 10,687 10,942 (2)%Gold grade processed (g/t) 1.33 1.36 (2)%Gold production (oz) 382,214 407,459 (6)%Silver production (oz) 383,183 529,241 (28)%Copper production (t) 11,448 11,949 (4)%Gold sold (oz) 384,556 409,705 (6)%Unit cash operating cost (A$/oz) (i) 626 507 (23)%All in sustaining cost (A$/oz) (i) 928 785 (18)%All in cost (A$/oz) (i) 1,201 993 (21)%Gold price achieved (A$/oz) 1,695 1,621 5%Silver price achieved (A$/oz) 21 21 -Copper price achieved (A$/t) 8,424 8,997 (6)%Total Revenue 756,218 782,139 (3)%Cost of sales (excluding D&A and fair value adjustments (i)) (377,776) (365,234) (3)%Corporate, admin, exploration and other costs (excluding D&A) (18,783) (17,806) (5)%EBITDA (i) 359,659 399,099 (10)%EBIT (i) 154,739 203,598 (24)%Statutory profit/(loss) after income tax 91,110 122,518 (26)%Underlying profit after income tax 92,150 124,733 (26)%Operating mine cash flow 387,923 415,113 (7)%Capital expenditure (iv) (150,136) (122,583) (22)%Net mine cash flow 237,787 292,530 (19)%
(i) EBITDA, EBIT, Unit cash operating cost, All in sustaining cost (AISC), and All in cost (AIC) are non-IFRS financialinformation and are not subject to audit.
(ii) Percentage change represents positive/(negative) impact on the business(iii) Ernest Henry mining and processing statistics are in 100% terms while costs represent Evolution's cost and not solely
the cost of Ernest Henry's operation.(iv) Capital expenditure excludes corporate spend of $790k for the half-year to 31 December 2018.(v) Included in the prior year comparatives are results from the divested Edna May asset. During the period that Edna
May was still under Evolution ownership in the prior year, Edna May produced 21,639oz of gold at an AISC of$1,588oz.
5
For
per
sona
l use
onl
y
Directors' Report
Operating and Financial Review (continued)
Mining Operations
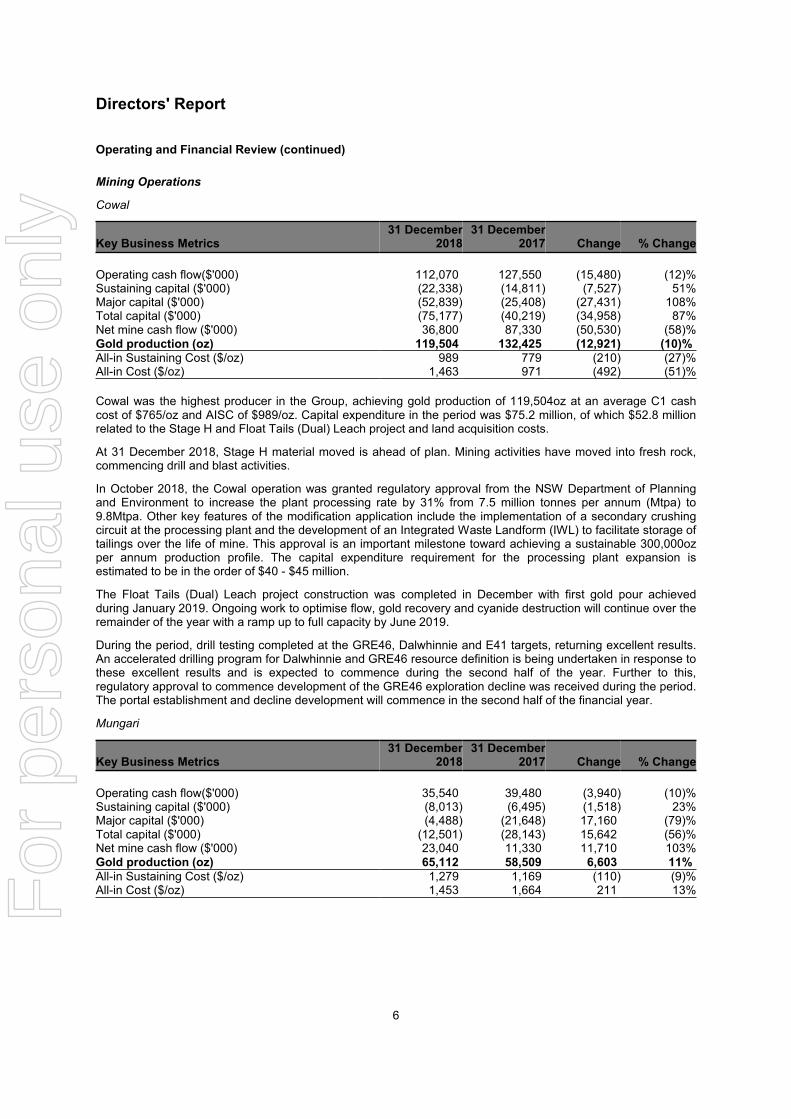
Cowal
Key Business Metrics31 December
201831 December
2017 Change % Change
Operating cash flow($'000) 112,070 127,550 (15,480) (12)%Sustaining capital ($'000) (22,338) (14,811) (7,527) 51%Major capital ($'000) (52,839) (25,408) (27,431) 108%Total capital ($'000) (75,177) (40,219) (34,958) 87%Net mine cash flow ($'000) 36,800 87,330 (50,530) (58)%Gold production (oz) 119,504 132,425 (12,921) (10)%All-in Sustaining Cost ($/oz) 989 779 (210) (27)%All-in Cost ($/oz) 1,463 971 (492) (51)%
Cowal was the highest producer in the Group, achieving gold production of 119,504oz at an average C1 cashcost of $765/oz and AISC of $989/oz. Capital expenditure in the period was $75.2 million, of which $52.8 millionrelated to the Stage H and Float Tails (Dual) Leach project and land acquisition costs.
At 31 December 2018, Stage H material moved is ahead of plan. Mining activities have moved into fresh rock,commencing drill and blast activities.
In October 2018, the Cowal operation was granted regulatory approval from the NSW Department of Planningand Environment to increase the plant processing rate by 31% from 7.5 million tonnes per annum (Mtpa) to9.8Mtpa. Other key features of the modification application include the implementation of a secondary crushingcircuit at the processing plant and the development of an Integrated Waste Landform (IWL) to facilitate storage oftailings over the life of mine. This approval is an important milestone toward achieving a sustainable 300,000ozper annum production profile. The capital expenditure requirement for the processing plant expansion isestimated to be in the order of $40 - $45 million.
The Float Tails (Dual) Leach project construction was completed in December with first gold pour achievedduring January 2019. Ongoing work to optimise flow, gold recovery and cyanide destruction will continue over theremainder of the year with a ramp up to full capacity by June 2019.
During the period, drill testing completed at the GRE46, Dalwhinnie and E41 targets, returning excellent results.An accelerated drilling program for Dalwhinnie and GRE46 resource definition is being undertaken in response tothese excellent results and is expected to commence during the second half of the year. Further to this,regulatory approval to commence development of the GRE46 exploration decline was received during the period.The portal establishment and decline development will commence in the second half of the financial year.
Mungari
Key Business Metrics31 December
201831 December
2017 Change % Change
Operating cash flow($'000) 35,540 39,480 (3,940) (10)%Sustaining capital ($'000) (8,013) (6,495) (1,518) 23%Major capital ($'000) (4,488) (21,648) 17,160 (79)%Total capital ($'000) (12,501) (28,143) 15,642 (56)%Net mine cash flow ($'000) 23,040 11,330 11,710 103%Gold production (oz) 65,112 58,509 6,603 11%All-in Sustaining Cost ($/oz) 1,279 1,169 (110) (9)%All-in Cost ($/oz) 1,453 1,664 211 13%
6
For
per
sona
l use
onl
y
Directors' Report
Operating and Financial Review (continued)
Mining Operations (continued)
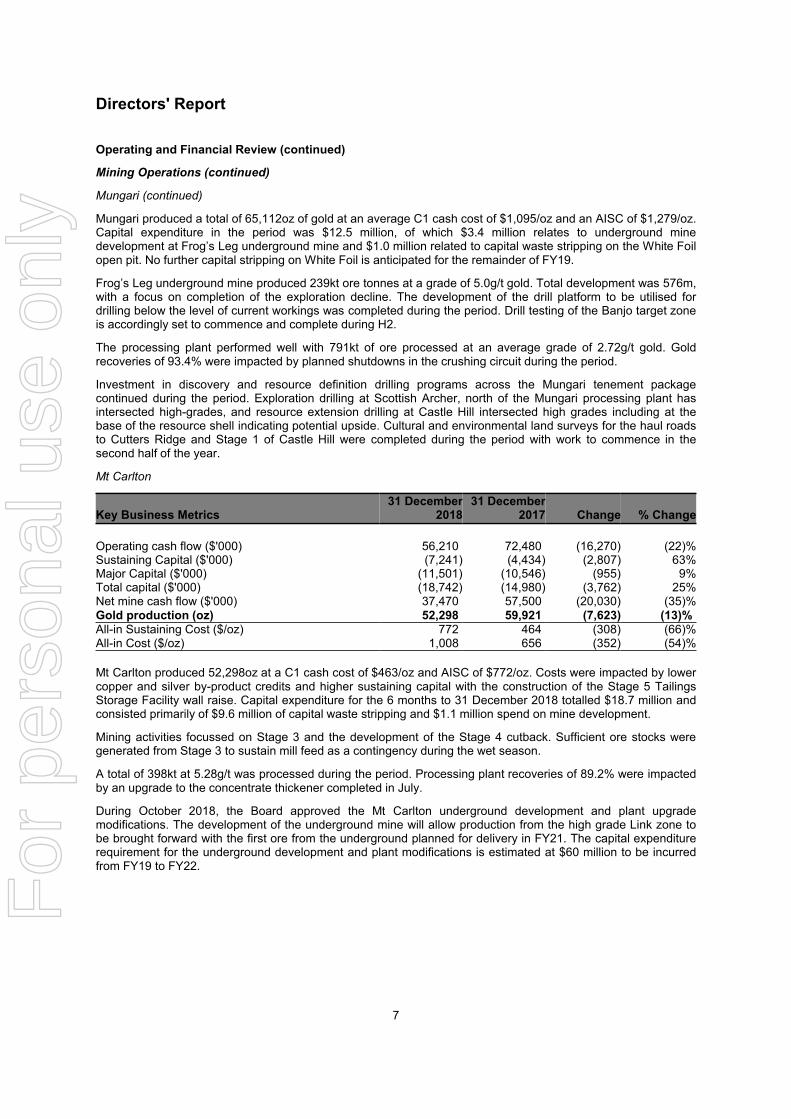
Mungari (continued)
Mungari produced a total of 65,112oz of gold at an average C1 cash cost of $1,095/oz and an AISC of $1,279/oz.Capital expenditure in the period was $12.5 million, of which $3.4 million relates to underground minedevelopment at Frog’s Leg underground mine and $1.0 million related to capital waste stripping on the White Foilopen pit. No further capital stripping on White Foil is anticipated for the remainder of FY19.
Frog’s Leg underground mine produced 239kt ore tonnes at a grade of 5.0g/t gold. Total development was 576m,with a focus on completion of the exploration decline. The development of the drill platform to be utilised fordrilling below the level of current workings was completed during the period. Drill testing of the Banjo target zoneis accordingly set to commence and complete during H2.
The processing plant performed well with 791kt of ore processed at an average grade of 2.72g/t gold. Goldrecoveries of 93.4% were impacted by planned shutdowns in the crushing circuit during the period.
Investment in discovery and resource definition drilling programs across the Mungari tenement packagecontinued during the period. Exploration drilling at Scottish Archer, north of the Mungari processing plant hasintersected high-grades, and resource extension drilling at Castle Hill intersected high grades including at thebase of the resource shell indicating potential upside. Cultural and environmental land surveys for the haul roadsto Cutters Ridge and Stage 1 of Castle Hill were completed during the period with work to commence in thesecond half of the year.
Mt Carlton
Key Business Metrics31 December
201831 December
2017 Change % Change
Operating cash flow ($'000) 56,210 72,480 (16,270) (22)%Sustaining Capital ($'000) (7,241) (4,434) (2,807) 63%Major Capital ($'000) (11,501) (10,546) (955) 9%Total capital ($'000) (18,742) (14,980) (3,762) 25%Net mine cash flow ($'000) 37,470 57,500 (20,030) (35)%Gold production (oz) 52,298 59,921 (7,623) (13)%All-in Sustaining Cost ($/oz) 772 464 (308) (66)%All-in Cost ($/oz) 1,008 656 (352) (54)%
Mt Carlton produced 52,298oz at a C1 cash cost of $463/oz and AISC of $772/oz. Costs were impacted by lowercopper and silver by-product credits and higher sustaining capital with the construction of the Stage 5 TailingsStorage Facility wall raise. Capital expenditure for the 6 months to 31 December 2018 totalled $18.7 million andconsisted primarily of $9.6 million of capital waste stripping and $1.1 million spend on mine development.
Mining activities focussed on Stage 3 and the development of the Stage 4 cutback. Sufficient ore stocks weregenerated from Stage 3 to sustain mill feed as a contingency during the wet season.
A total of 398kt at 5.28g/t was processed during the period. Processing plant recoveries of 89.2% were impactedby an upgrade to the concentrate thickener completed in July.
During October 2018, the Board approved the Mt Carlton underground development and plant upgrademodifications. The development of the underground mine will allow production from the high grade Link zone tobe brought forward with the first ore from the underground planned for delivery in FY21. The capital expenditurerequirement for the underground development and plant modifications is estimated at $60 million to be incurredfrom FY19 to FY22.
7
For
per
sona
l use
onl
y

Directors' Report
Operating and Financial Review (continued)
Mining Operations (continued)
Mt Rawdon
Key Business Metrics31 December
201831 December
2017 Change % Change
Operating cash flow ($'000) 36,330 23,460 12,870 55%Sustaining capital ($'000) (4,864) (4,079) (785) 19%Major capital ($'000) (16,155) (8,047) (8,108) 101%Total capital ($'000) (21,019) (12,126) (8,893) 73%Net mine cash flow ($'000) 15,320 11,330 3,990 35%Gold production (oz) 50,119 43,183 6,936 16%All-in Sustaining Cost ($/oz) 1,277 1,070 (207) (19)%All-in Cost ($/oz) 1,605 1,253 (352) (28)%
Mt Rawdon produced 50,119oz at a C1 cash cost of $1,094/oz and AISC of $1,277/oz. Production and costswere negatively impacted due to the processing of low-grade stockpiles as a result of scheduled ore availability inthe pit. Capital expenditure of $21.0 million consisted primarily of $16.2 million of capital waste stripping.
Ore mined was 875kt at an average grade of 1.08g/t. Mining activities were focused on the Stage 4 cutback andthe installation of additional ground support in the western area of the pit until mid-October when a significantstorm event resulted in a geotechnical mine slip in the southern section of the pit. Remediation work will beongoing for the remainder of FY19 and ore will be sourced from the northern section of the pit.
Cracow
Key Business Metrics31 December
201831 December
2017 Change % Change
Operating cash flow ($'000) 32,870 30,220 2,650 9%Sustaining capital ($'000) (9,524) (6,412) (3,112) 49%Major capital ($'000) (6,251) (6,786) 535 (8)%Total capital ($'000) (15,775) (13,198) (2,577) 20%Net mine cash flow ($'000) 17,100 17,020 80 %Gold production (oz) 44,731 43,612 1,119 3%All-in Sustaining Cost ($/oz) 1,231 1,136 (95) (8)%All-in Cost ($/oz) 1,309 1,228 (81) (7)%
Cracow produced 44,731oz at an average C1 cash cost of $822/oz and AISC of $1,231/oz. Capital expendituretotalled $15.8 million with $6.2 million of spend incurred on underground mine development.
A total of 306kt of ore was mined at an average grade of 5.05g/t gold. Primary ore sources were the Kilkenny,Coronation and Imperial ore bodies. The plant processed a six monthly throughput record of 292kt at an averagegrade of 5.17g/t and recovery of 92.0%.
Resource definition drill programs continue to deliver strong results from the Killarney structure wheremineralisation is continuing to be defined both down dip and along strike to the south of the currently definedresource.
8
For
per
sona
l use
onl
y
Directors' Report
Operating and Financial Review (continued)
Mining Operations (continued)
Ernest Henry
Key Business Metrics31 December
201831 December
2017 Change % Change
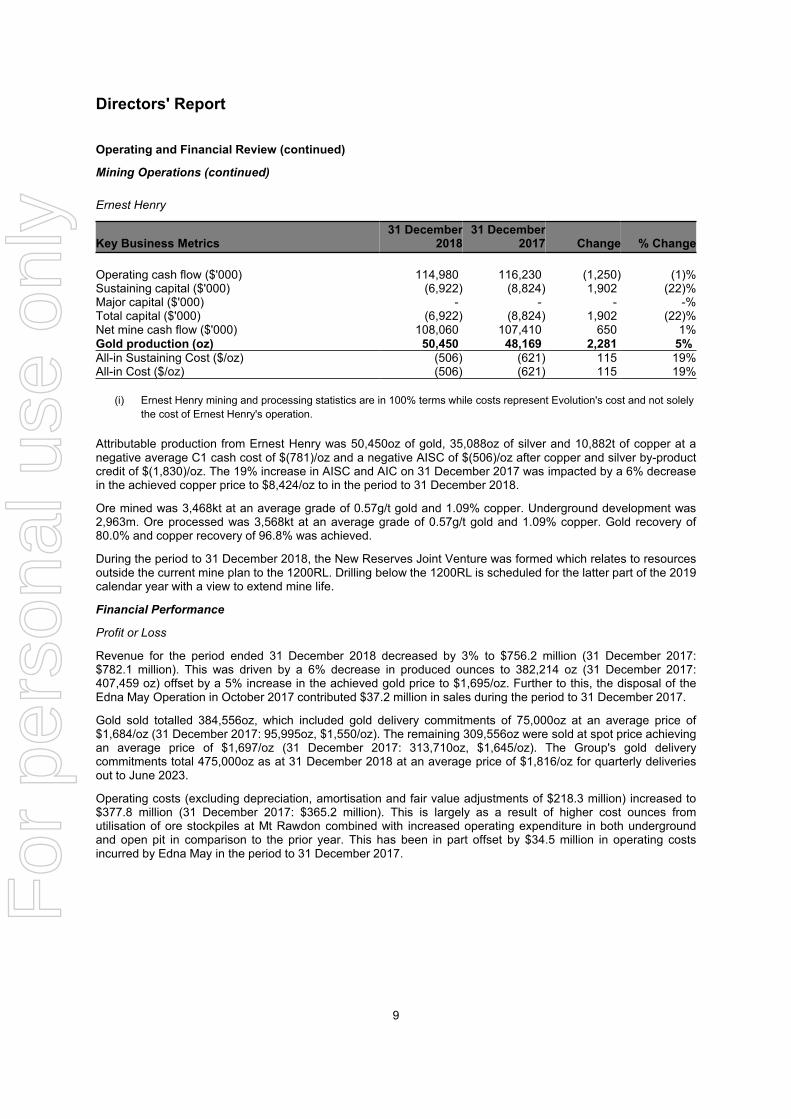
Operating cash flow ($'000) 114,980 116,230 (1,250) (1)%Sustaining capital ($'000) (6,922) (8,824) 1,902 (22)%Major capital ($'000) - - - -%Total capital ($'000) (6,922) (8,824) 1,902 (22)%Net mine cash flow ($'000) 108,060 107,410 650 1%Gold production (oz) 50,450 48,169 2,281 5%All-in Sustaining Cost ($/oz) (506) (621) 115 19%All-in Cost ($/oz) (506) (621) 115 19%
(i) Ernest Henry mining and processing statistics are in 100% terms while costs represent Evolution's cost and not solelythe cost of Ernest Henry's operation.
Attributable production from Ernest Henry was 50,450oz of gold, 35,088oz of silver and 10,882t of copper at anegative average C1 cash cost of $(781)/oz and a negative AISC of $(506)/oz after copper and silver by-productcredit of $(1,830)/oz. The 19% increase in AISC and AIC on 31 December 2017 was impacted by a 6% decreasein the achieved copper price to $8,424/oz to in the period to 31 December 2018.
Ore mined was 3,468kt at an average grade of 0.57g/t gold and 1.09% copper. Underground development was2,963m. Ore processed was 3,568kt at an average grade of 0.57g/t gold and 1.09% copper. Gold recovery of80.0% and copper recovery of 96.8% was achieved.
During the period to 31 December 2018, the New Reserves Joint Venture was formed which relates to resourcesoutside the current mine plan to the 1200RL. Drilling below the 1200RL is scheduled for the latter part of the 2019calendar year with a view to extend mine life.
Financial Performance
Profit or Loss
Revenue for the period ended 31 December 2018 decreased by 3% to $756.2 million (31 December 2017:$782.1 million). This was driven by a 6% decrease in produced ounces to 382,214 oz (31 December 2017:407,459 oz) offset by a 5% increase in the achieved gold price to $1,695/oz. Further to this, the disposal of theEdna May Operation in October 2017 contributed $37.2 million in sales during the period to 31 December 2017.
Gold sold totalled 384,556oz, which included gold delivery commitments of 75,000oz at an average price of$1,684/oz (31 December 2017: 95,995oz, $1,550/oz). The remaining 309,556oz were sold at spot price achievingan average price of $1,697/oz (31 December 2017: 313,710oz, $1,645/oz). The Group's gold deliverycommitments total 475,000oz as at 31 December 2018 at an average price of $1,816/oz for quarterly deliveriesout to June 2023.
Operating costs (excluding depreciation, amortisation and fair value adjustments of $218.3 million) increased to$377.8 million (31 December 2017: $365.2 million). This is largely as a result of higher cost ounces fromutilisation of ore stockpiles at Mt Rawdon combined with increased operating expenditure in both undergroundand open pit in comparison to the prior year. This has been in part offset by $34.5 million in operating costsincurred by Edna May in the period to 31 December 2017.
9
For
per
sona
l use
onl
y

Directors' Report
Operating and Financial Review (continued)
Financial Performance (continued)
Profit or Loss (continued)
The Group’s All in Sustaining Cost increased by 18% to $928/oz (31 December 2017: $785/oz) impacted by a2% drop in the average grade processed during the year and an increase in sustaining capital levels combinedwith the decrease in gold sales and increase in operating costs as discussed above.
The Group posted a decrease of 25% in profit before income tax to $132.1 million, driven by decreased sales andincreased cost of sales resulting in a net impact of $45.1 million on the period to 31 December 2018. The cost ofsales increase was driven by a drawdown of inventory at Mt Rawdon, higher power rates at Cowal and thecompletion of the Mungari White Foil cutback in FY18 which resulted in mining costs which were capitalised inthe December 2017 period being expensed in the December 2018 period as the operation transitioned frommining waste to ore production. Statutory profit after tax was $91.1 million (31 December 2017: $122.5 million)and underlying profit after tax totalled $92.2 million (31 December 2017: $124.7 million).
Balance Sheet
Total assets at the end of period, reduced slightly to $2,997.5 million (30 June 2018: $3,056.3 million). Thedecrease is driven by a reduction in cash and cash equivalents of $9.6 million and $11.4 million decrease ininventories primarily driven by the utilisation of stockpiles at Mt Rawdon. Further to this, a decrease of $44.3million in the net carrying amount of mine development and exploration to $1,699.5 million was incurred due to adepreciation charge of $143.1 million outstripping capital additions of $113.7 million.
Total liabilities for the Group decreased by $83.2 million or 11% to $684.7 million at 31 December 2018. Thedecrease is in part attributable to a $40.0 million repayment on the Senior Secured Term Loan (“Facility D”). Anet decrease in tax liabilities of $24.1 million and a $10.4 million decrease in trade and other payables comprisedthe other changes in liabilities.
The Group ended the period with a cash balance of $313.6 million and available credit of $350.0 million in FacilityA as part of its Senior Secured Syndicated Revolving and Term Facility. Net bank debt was $41.4 million with agearing of 1.4% at 31 December 2018.
Taxation
During the period, the Group made income tax payments of $64.6 million and recognised an income tax expenseof $40.9 million (31 December 2017: $52.6 million). On the balance sheet the Company recognised a current taxliability of $0.02 million (30 June 2018: 47.3 million) and a deferred tax liability of $23.0 million (30 June 2018:asset of $0.4 million).
The tax payment made in respect of the 30 June 2018 financial year combined with tax instalments expected tobe paid during the 2019 financial year have enabled the declaration of a fully franked interim dividend. Thefranking credit balance as at 31 December 2018 was a surplus of $36.9 million.
Capital Expenditure
Capital expenditure for the period to 31 December 2018 totalled $150.9 million (31 December 2017: $122.6million). This consists of sustaining capital, including near mine exploration and resource definition of $59.7million (31 December 2017: $47.1 million) and mine development of $91.2 million (31 December 2017: $75.5million). The main capital projects include the Cowal Stage H development, Float Tails Leach project and E46land acquisition costs ($52.8 million); underground mine development at Cracow ($6.2 million), Mt Carlton ($1.1million) and Mungari ($3.4 million); and capital waste stripping at Mt Carlton ($9.6 million) and Mt Rawdon ($16.2million).
10
For
per
sona
l use
onl
y
Directors' Report
Operating and Financial Review (continued)
Financial Performance (continued)
Financing
Total finance costs for the period were consistent at $12.3 million (31 December 2017: $12.3 million). Included intotal finance costs is interest expense of $9.5 million (31 December 2017: $10.0 million), amortisation of debtestablishment costs of $1.1 million (31 December 2017: $0.2 million) and discount unwinding on minerehabilitation liabilities of $1.7 million (31 December 2017: $2.2 million). Debt establishment costs at 31December 2018 total $7.2 million and an amortisation charge of $1.1 million has been recognised in the period.
Finance income for the period totalled $4.0 million (31 December 2017: $0.9 million). The increase is driven by a92% increase in cash and cash equivalents on 31 December 2017.
The Senior Secured Term Loan ("Facility D") balance outstanding at 31 December 2018 was $355.0 million.
No changes have been made to the existing Senior Secured Term Loan ("Facility D"), the $175.0 millionPerformance Bond Facility ("Facility C") or the Senior Secured Revolving Loan ("Facility A").
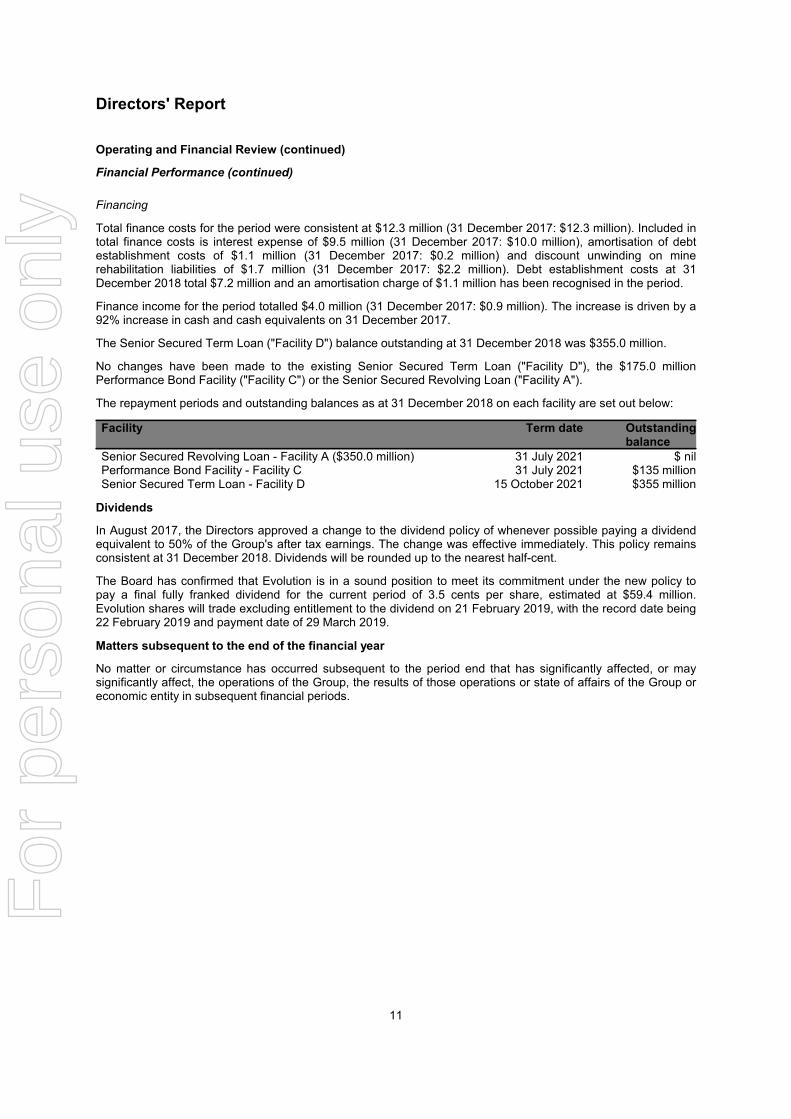
The repayment periods and outstanding balances as at 31 December 2018 on each facility are set out below:
Facility Term date Outstandingbalance
Senior Secured Revolving Loan - Facility A ($350.0 million) 31 July 2021 $ nilPerformance Bond Facility - Facility C 31 July 2021 $135 millionSenior Secured Term Loan - Facility D 15 October 2021 $355 million
Dividends
In August 2017, the Directors approved a change to the dividend policy of whenever possible paying a dividendequivalent to 50% of the Group's after tax earnings. The change was effective immediately. This policy remainsconsistent at 31 December 2018. Dividends will be rounded up to the nearest half-cent.
The Board has confirmed that Evolution is in a sound position to meet its commitment under the new policy topay a final fully franked dividend for the current period of 3.5 cents per share, estimated at $59.4 million.Evolution shares will trade excluding entitlement to the dividend on 21 February 2019, with the record date being22 February 2019 and payment date of 29 March 2019.
Matters subsequent to the end of the financial year
No matter or circumstance has occurred subsequent to the period end that has significantly affected, or maysignificantly affect, the operations of the Group, the results of those operations or state of affairs of the Group oreconomic entity in subsequent financial periods.
11
For
per
sona
l use
onl
y
Directors' Report
Auditor's independence declaration
A copy of the auditor's independence declaration as required under section 307C of the Corporations Act 2001 isset out on page 13 .
Rounding of amounts
The Company is of a kind referred to in ASIC Legislative Instrument 2016/191, relating to the 'rounding off' ofamounts in the Directors' Report. Amounts in the Directors' Report have been rounded off in accordance with theinstrument to the nearest thousand dollars, or in certain cases, to the nearest dollar.
This report is made in accordance with a resolution of Directors.
Jacob (Jake) KleinExecutive Chairman
Andrea HallChair of the Audit Committee
Sydney
12
For
per
sona
l use
onl
y

PricewaterhouseCoopers, ABN 52 780 433 757One International Towers Sydney, Watermans Quay, Barangaroo, GPO BOX 2650, SYDNEY NSW 2001 T: +61 2 8266 0000, F: +61 2 8266 9999, www.pwc.com.au
Level 11, 1PSQ, 169 Macquarie Street, Parramatta NSW 2150, PO Box 1155 Parramatta NSW 2124 T: +61 2 9659 2476, F: +61 2 8266 9999, www.pwc.com.au
Liability limited by a scheme approved under Professional Standards Legislation.
Auditor’s Independence Declaration As lead auditor for the review of Evolution Mining Limited for the half-year ended 31 December 2018, I declare that to the best of my knowledge and belief, there have been:
(a) no contraventions of the auditor independence requirements of the Corporations Act 2001 inrelation to the review; and
(b) no contraventions of any applicable code of professional conduct in relation to the review.
This declaration is in respect of Evolution Mining Limited and the entities it controlled during the period.
Marc Upcroft SydneyPartner PricewaterhouseCoopers
13 February 2019
13
For
per
sona
l use
onl
y

EVOLUTION MINING LIMITED
Consolidated Statement of Profit or Loss andOther Comprehensive IncomeFor the half-year ended 31 December 2018
Notes
31 December2018$'000
31 December2017$'000
Revenue 3 756,218 782,139Cost of sales (595,397) (576,235)Gross profit 160,821 205,904
Interest income 3,999 860Other income 259 366Share based payments expense (4,512) (4,589)Corporate and other administration costs (12,786) (12,631)Transaction and integration costs (1,040) (1,192)Exploration and evaluation costs expensed (2,448) (1,307)Gain on sale of subsidiary 106 -Finance costs (12,342) (12,320)Profit before income tax 132,057 175,091
Income tax expense 4 (40,947) (52,573)Profit after income tax expense 91,110 122,518
Other comprehensive (loss)/incomeItems that may be reclassified subsequently to profit or loss
Exchange differences on translation of foreign operations - 42BlankItems that will not be reclassified to profit or loss
Changes in the fair value of available-for-sale financial assets (1,240) (1,349)Other comprehensive (loss)/income, net of tax (1,240) (1,307)
Total comprehensive income 89,870 121,211
Total comprehensive income for the period is attributable to:Owners of Evolution Mining Limited 89,870 121,211
89,870 121,211
Cents Cents
Earnings per share for profit attributable to the ordinary equityholders of the Company:Basic earnings per share 5.37 7.25Diluted earnings per share 5.34 7.21
The above Consolidated Statement of Profit or Loss and Other Comprehensive Income should be read inconjunction with the accompanying notes.
14
For
per
sona
l use
onl
y

EVOLUTION MINING LIMITED
Consolidated Balance SheetAs at 31 December 2018
Notes
31 December2018$'000
30 June2018$'000
ASSETSCurrent assetsCash and cash equivalents 313,626 323,226Trade and other receivables 77,772 71,296Inventories 246,719 264,221Total current assets 638,117 658,743
Non-current assetsInventories 44,554 38,459Available-for-sale financial assets 4,640 5,536Property, plant and equipment 6 573,038 571,775Mine development and exploration 7 1,699,488 1,743,752Deferred tax assets - 419Other non-current assets 37,616 37,632Total non-current assets 2,359,336 2,397,573
Total assets 2,997,453 3,056,316
LIABILITIESCurrent liabilitiesTrade and other payables 141,998 152,430Interest bearing liabilities 8 103,085 93,496Current tax liabilities 224 47,312Provisions 30,960 32,085Total current liabilities 276,267 325,323
Non-current liabilitiesInterest bearing liabilities 8 243,995 292,470Provisions 141,442 150,129Deferred tax liabilities 23,018 -Total non-current liabilities 408,455 442,599
Total liabilities 684,722 767,922
Net assets 2,312,731 2,288,394
EQUITYIssued capital 9 2,183,727 2,183,727Reserves 46,390 45,407Retained earnings 82,614 59,260Capital and reserves attributable to owners of Evolution Mining Limited 2,312,731 2,288,394
Total equity 2,312,731 2,288,394
The above Consolidated Balance Sheet should be read in conjunction with the accompanying notes.
15
For
per
sona
l use
onl
y

EVOLUTION MINING LIMITED
Consolidated Statement of Changes in EquityFor the half-year ended 31 December 2018
Notes
Issuedcapital
$'000
Share-based
payments$'000
Fair valuerevaluation
reserve$'000
Foreigncurrency
translation$'000
Retainedearnings
$'000
Totalequity$'000
Balance at 1 July 2017 2,183,727 37,149 1,589 57 (94,270) 2,128,252
Profit after income tax expense - - - - 122,518 122,518Other comprehensive income - - (1,349) 42 - (1,307)Total comprehensive income - - (1,349) 42 122,518 121,211
Transactions with owners in theircapacity as owners:Dividends provided for or paid 5 - - - - (50,678) (50,678)Recognition of share-based payments - 4,589 - - - 4,589
- 4,589 - - (50,678) (46,089)
Balance at 31 December 2017 2,183,727 41,738 240 99 (22,430) 2,203,374
Balance at 1 July 2018 2,183,727 45,640 (336) 103 59,260 2,288,394
Profit after income tax expense - - - - 91,110 91,110Fair value loss on available-for-salefinancial assets, net of tax - - 1,137 - - 1,137Exchange differences on translation offoreign operations - - - (103) - (103)Total comprehensive income - - (1,137) (103) 91,110 89,870
Transactions with owners in theircapacity as owners:Dividends provided for or paid 5 - - - - (67,756) (67,756)Recognition of share-based payments - 2,223 - - - 2,223
- 2,223 - - (67,756) (65,533)
Balance at 31 December 2018 2,183,727 47,863 (1,473) - 82,614 2,312,731
The above Consolidated Statement of Changes in Equity should be read in conjunction with the accompanyingnotes.
16
For
per
sona
l use
onl
y

EVOLUTION MINING LIMITED
Consolidated Statement of Cash FlowsFor the half-year ended 31 December 2018
Notes
31 December2018$'000
31 December2017$'000
Cash flows from operating activitiesReceipts from sales 756,958 767,083Payments to suppliers and employees (419,600) (398,436)Other income 259 366Interest received 3,486 496Interest paid (9,485) (10,000)Income taxes paid (64,598) (36,200)Net cash inflow from operating activities 267,020 323,309
Cash flows from investing activitiesPayments for property, plant and equipment (59,206) (37,097)Payments for mine development and exploration (110,559) (103,391)Proceeds from sale of property, plant and equipment 2,182 80Payments for available-for-sale assets (240) (2,500)Proceeds from sale of subsidiary - 40,000Cash disposed on sale of subsidiary - (13)Payments for transaction and integration costs (1,040) (1,192)Transfer from term deposits 16 -Net cash outflow from investing activities (168,847) (104,113)
Cash flows from financing activitiesRepayment of interest bearing liabilities - Senior Secured SyndicatedRevolving and Term Facility (40,000) (40,000)Proceeds from short term borrowings - 66,121Repayment of short term borrowings - (67,701)Payment of finance lease liabilities - (854)Dividends paid (67,773) (50,688)Net cash outflow from financing activities (107,773) (93,122)
Net (decrease)/increase in cash and cash equivalents (9,600) 126,074Cash and cash equivalents at the beginning of the period 323,226 37,385Effects of exchange rate changes on cash and cash equivalents - 41Cash and cash equivalents at end of period 313,626 163,500
The above Consolidated Statement of Cash Flows should be read in conjunction with the accompanying notes.
17
For
per
sona
l use
onl
y
Notes to the Consolidated FinancialStatements
Contents of the notes to the consolidated financial statements
Page
1 Significant changes in the current reporting period 19
2 Performance by Mine 19
3 Revenue and expenses 20
4 Income tax 22
5 Dividends 23
6 Property, plant and equipment 24
7 Mine development and exploration 25
8 Interest Bearing Liabilities 26
9 Issued Capital 28
10 Related party transactions 29
11 Contingencies 29
12 Gold Delivery Commitments 29
13 Events occurring after the reporting period 30
14 Basis of preparation of half-year report 31
18
For
per
sona
l use
onl
y

Notes to the Consolidated FinancialStatements
1 Significant changes in the current reporting period
No matter or circumstance has occurred subsequent to the period end that has significantly affected, or maysignificantly affect, the operations of the Group, the results of those operations or state of affairs of the Group oreconomic entity in subsequent financial years.
2 Performance by Mine
(a) Description of segments
The Group has identified its operating segments based on the internal reports that are reviewed and used by theExecutive Chairman and the Senior Leadership Team (the chief business decision makers) in assessingperformance and in determining the allocation of resources.
The Group’s operational mine sites, Exploration and Corporate are each treated as individual operatingsegments. Management monitors the operating results of its business units separately for the purpose of makingdecisions about resource allocation and performance assessment.
Corporate includes share-based payment expenses and other corporate expenditures supporting the businessduring the period.
Segment performance is evaluated based on earnings before interest, tax, depreciation and amortisation(EBITDA).
The Group’s operations are all conducted in the mining industry in Australia.
(b) Segment information
The segment information for the reportable segments for the half-year ended 31 December 2018 is as follows:
Cowal$'000
Mungari$'000
MtCarlton
$'000
MtRawdon
$'000Cracow
$'000
ErnestHenry$'000
EdnaMay
$'000
Explo-ration$'000
Corp-orate$'000
Total$'000
31 December 2018
SPACERevenue 212,756 113,326 95,973 84,827 74,192 175,144 - - - 756,218EBITDA 110,024 38,103 55,983 26,168 33,800 114,364 - (2,448) (16,335) 359,659Sustaining Capital 22,338 8,013 7,241 4,864 9,524 6,922 - - 786 59,688Major Capital 52,839 4,488 11,501 16,155 6,251 - - - - 91,234Total Capital 75,177 12,501 18,742 21,019 15,775 6,922 - - 786 150,922
The segment information for the reportable segments for the half-year ended 31 December 2017 is as follows:
Cowal$'000
Mungari$'000
MtCarlton
$'000
MtRawdon
$'000Cracow
$'000
ErnestHenry$'000
EdnaMay
$'000
Explo-ration$'000
Corp-orate$'000
Total$'000
31 December 2017
SPACERevenue 221,251 96,390 110,714 72,817 68,451 175,345 37,171 - - 782,139EBITDA 128,606 35,674 73,801 29,034 30,890 116,287 2,629 (1,310) (16,512) 399,099Sustaining Capital 14,811 6,495 4,434 4,079 6,412 8,824 1,599 - 422 47,076Major Capital 25,408 21,648 10,546 8,047 6,786 - 3,072 - - 75,507Total Capital 40,219 28,143 14,980 12,126 13,198 8,824 4,671 - 422 122,583
19
For
per
sona
l use
onl
y
Notes to the Consolidated FinancialStatements
2 Performance by Mine (continued)
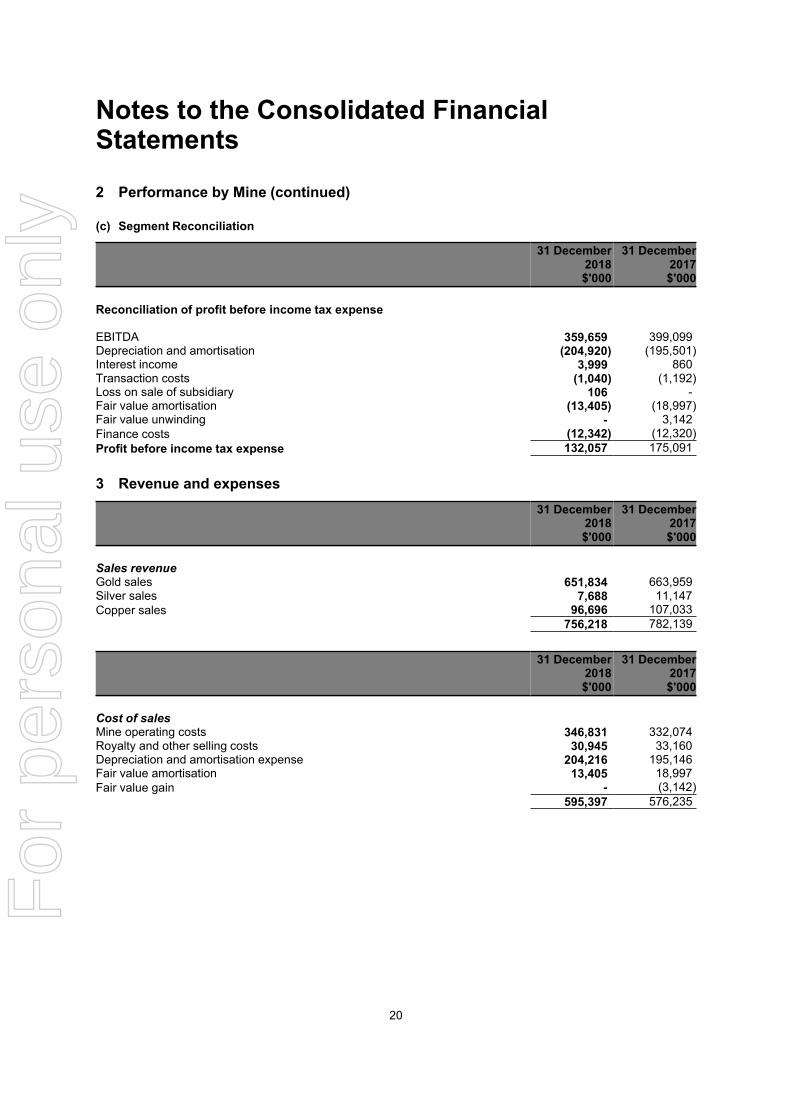
(c) Segment Reconciliation
31 December2018$'000
31 December2017$'000
Reconciliation of profit before income tax expenseSPACEEBITDA 359,659 399,099Depreciation and amortisation (204,920) (195,501)Interest income 3,999 860Transaction costs (1,040) (1,192)Loss on sale of subsidiary 106 -Fair value amortisation (13,405) (18,997)Fair value unwinding - 3,142Finance costs (12,342) (12,320)Profit before income tax expense 132,057 175,091
3 Revenue and expenses
31 December2018$'000
31 December2017$'000
Sales revenueGold sales 651,834 663,959Silver sales 7,688 11,147Copper sales 96,696 107,033
756,218 782,139
31 December2018$'000
31 December2017$'000
Cost of salesMine operating costs 346,831 332,074Royalty and other selling costs 30,945 33,160Depreciation and amortisation expense 204,216 195,146Fair value amortisation 13,405 18,997Fair value gain - (3,142)
595,397 576,235
20
For
per
sona
l use
onl
y

Notes to the Consolidated FinancialStatements
3 Revenue and expenses (continued)
31 December2018$'000
31 December2017$'000
Corporate and other administration costsDepreciation and amortisation expense 704 355Corporate overheads 12,082 12,276
12,786 12,631
Transaction and integration costsContractor, consultants and advisory expense 793 219Corporate and administration expense 231 973Stamp duty on business combinations 16 -
1,040 1,192
Finance costsFinance lease interest expense - 17Amortisation of debt establishment costs 1,115 161Unwinding of discount on provisions 1,742 2,159Interest expense 9,485 9,983
12,342 12,320
Depreciation and amortisationCost of sales (excluding Ernest Henry) 137,609 131,828Cost of sales (Ernest Henry) 66,607 63,318Corporate and other administration costs 704 355
204,920 195,501
21
For
per
sona
l use
onl
y

Notes to the Consolidated FinancialStatements
4 Income tax
(a) Income tax
31 December2018$'000
31 December2017$'000
Current tax on profits for the period 21,640 38,875Deferred tax 19,307 17,677Adjustments for current tax of prior periods - (3,979)Total income tax expense 40,947 52,573SPACE(b) Numerical reconciliation of income tax to prima facie tax payable
31 December2018$'000
31 December2017$'000
Profit before income tax 132,057 175,091Tax at the Australian tax rate of 30% 39,617 52,527SPACETax effect of amounts which are not deductible (taxable) in calculating taxableincome:
Profit on sale of subsidiary (32) -Share-based payments 1,354 1,376Deferred tax expense on sale of subsidiary - 4,165Adjustments for current tax of prior periods - (3,979)Other 8 (1,516)
Total income tax expense 40,947 52,573
(c) Tax losses
The Group has unrecognised available tax losses of $31.428 million as at 31 December 2018. These tax losseshave not been recognised due to the uncertainty of their recoverability in future periods.
22
For
per
sona
l use
onl
y

Notes to the Consolidated FinancialStatements
5 Dividends
(a) Ordinary Shares
31 December2018$'000
31 December2017$'000
Final dividend - 2018Final dividend for the year ended 30 June 2018 of 4 cents per share fullyfranked (30 June 2017: 3 cent per share fully franked) paid on 28 September2018 67,773 50,678
67,773 50,678
(b) Dividends not recognised at the end of the reporting period
In August 2017, the Directors approved a change to the dividend policy of whenever possible paying a dividendequivalent to 50% of the Group's earnings. The interim dividend for 2019 has been calculated accordingly.
31 December2018$'000
31 December2017$'000
In addition to the above dividends, since period end the Directors have approvedthe payment of an interim fully franked dividend of 3.5 cents per fully paid ordinaryshare (31 December 2017 - 3.5 cents fully franked). The aggregate amount of theproposed dividend expected to be paid on 29 March 2019 out of retained earningsat 31 December 2018, but not recognised as a liability at the period end is: 59,397 59,241
59,397 59,241
23
For
per
sona
l use
onl
y

Notes to the Consolidated FinancialStatements
6 Property, plant and equipment
Freehold land$'000
Plant andequipment
$'000Total$'000
At 1 July 2018Cost 14,261 1,590,847 1,605,108Accumulated depreciation - (1,033,333) (1,033,333)Net carrying amount 14,261 557,514 571,775
Year ended 31 December 2018Carrying amount at the beginning of period 14,261 557,514 571,775Additions - 59,206 59,206Disposals - (2,182) (2,182)Depreciation - (54,699) (54,699)Depreciation relating to fair value uplift on business combination - (1,062) (1,062)Carrying amount at the end of the year 14,261 558,777 573,038
At 31 December 2018Cost 14,261 1,646,809 1,661,070Accumulated depreciation - (1,088,032) (1,088,032)Net carrying amount 14,261 558,777 573,038
Included in aboveAssets in the course of construction - 126,896 126,896
24
For
per
sona
l use
onl
y
Notes to the Consolidated FinancialStatements
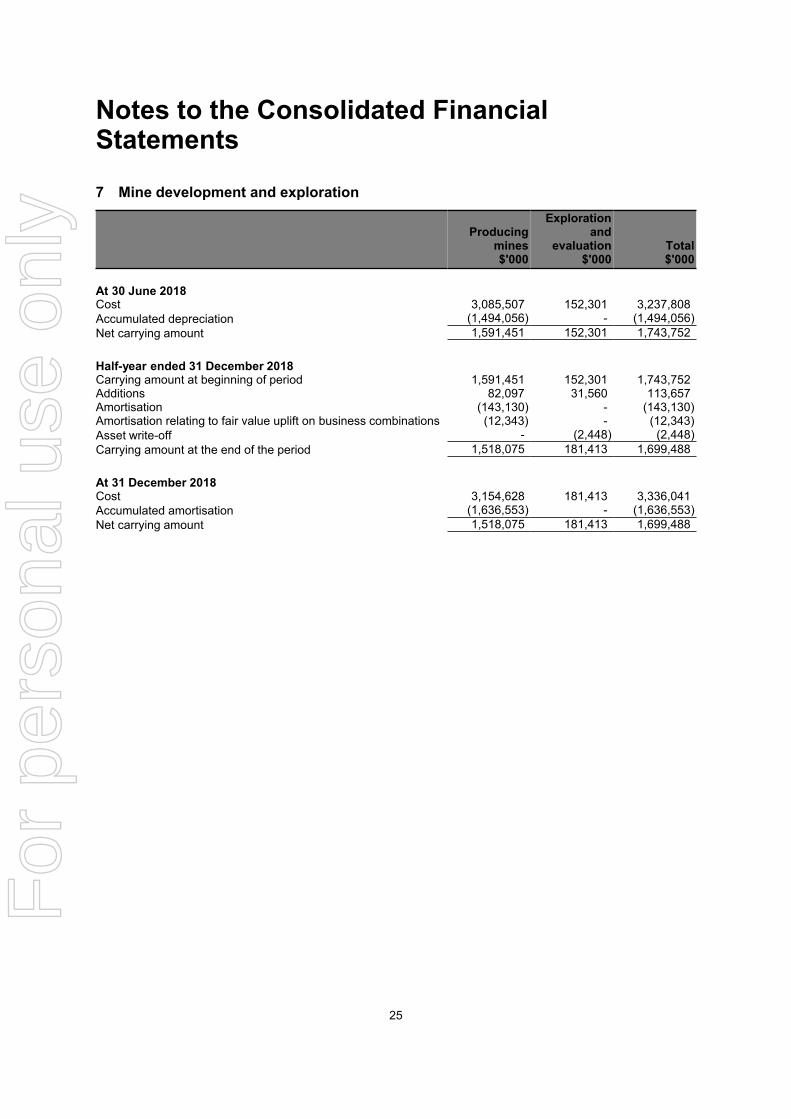
7 Mine development and exploration
Producingmines$'000
Explorationand
evaluation$'000
Total$'000
At 30 June 2018Cost 3,085,507 152,301 3,237,808Accumulated depreciation (1,494,056) - (1,494,056)Net carrying amount 1,591,451 152,301 1,743,752
Half-year ended 31 December 2018Carrying amount at beginning of period 1,591,451 152,301 1,743,752Additions 82,097 31,560 113,657Amortisation (143,130) - (143,130)Amortisation relating to fair value uplift on business combinations (12,343) - (12,343)Asset write-off - (2,448) (2,448)Carrying amount at the end of the period 1,518,075 181,413 1,699,488
At 31 December 2018Cost 3,154,628 181,413 3,336,041Accumulated amortisation (1,636,553) - (1,636,553)Net carrying amount 1,518,075 181,413 1,699,488
25
For
per
sona
l use
onl
y

Notes to the Consolidated FinancialStatements
8 Interest Bearing Liabilities
31 December2018$'000
30 June2018$'000
CurrentBank loans 105,000 95,000Less: Borrowing costs (1,915) (1,504)
103,085 93,496
Non-CurrentBank loans 250,000 300,000Less: Borrowing costs (6,005) (7,530)
243,995 292,470
Total interest bearing liabilities 347,080 385,966
No changes have been made to the existing Senior Secured Term Loan ("Facility D"), the $175.0 millionPerformance Bond Facility ("Facility C") or the Senior Secured Revolving Loan ("Facility A").
During the period the Group made repayments totalling $40.0 million on the Senior Secured Term Loan ("FacilityD") bringing the total balance outstanding at 31 December 2018 to $355.0 million.
The repayment periods and outstanding balances as at 31 December 2018 on each facility are set out below:
Term date Outstandingbalance
Senior Secured Revolving Loan - Facility A ($350.0 million) 31 July 2021 $ nilPerformance Bond Facility - Facility C 31 July 2021 $135 millionSenior Secured Term Loan - Facility D 15 October 2021 $355 million
26
For
per
sona
l use
onl
y

Notes to the Consolidated FinancialStatements
8 Interest Bearing Liabilities (continued)
(a) Financing arrangements
The Group had access to the following undrawn borrowing facilities at the end of the reporting period:
31 December2018$'000
30 June2018$'000
Bank loans - revolving credit facilityExpiring within one year - -Expiring beyond one year 350,000 350,000
350,000 350,000
(b) Contractual maturities of interest bearing liabilities
The tables below analyse the Group's interest bearing liabilities into relevant maturity groupings based on theircontractual maturities. The amounts disclosed in the table are the contractual undiscounted cash flows, whichalso includes interest and commitment fees.
Less than1 year$'000
Between1 and 2
years$'000
Between2 and 5
years$'000
Over 5years$'000
Totalcontractualcash flows
$'000
Carryingamount
$'000
At 31 December 2018
Bank loans 118,273 117,703 142,639 - 378,615 355,000118,273 117,703 142,639 - 378,615 355,000
At 30 June 2018
Bank loans 109,826 119,873 195,858 - 425,557 395,000109,826 119,873 195,858 - 425,557 395,000
(c) Debt covenants
The Senior Secured Revolving and Term Loan have covenants in place based on the current ratio, leverageratio, debt service ratio and the tangible net worth ratio. The Group has complied with these covenants during theperiod.
27
For
per
sona
l use
onl
y

Notes to the Consolidated FinancialStatements
9 Issued Capital
(a) Share capital
Notes
31 December2018
Shares
31 December2018$'000
30 June2018
Shares
30 June2018$'000
Fully paid ordinary shares 1,697,069,720 2,183,727 1,692,612,049 2,183,7271,697,069,720 2,183,727 1,692,612,049 2,183,727
(b) Contributed equity
Movements in ordinary share capital
Ordinary shares are fully-paid and have no par value. They carry one vote per share and the rights to dividends.They bear no special terms or conditions affecting income or capital entitlements of the shareholders and areclassified as equity.
Number ofshares $'000
Balance at 1 July 2017 1,682,798,626 2,183,727Shares issued on vesting of performance rights 9,214,401 -Shares issued under Employee Share Scheme 501,234 -Shares issued under NED Equity Plan 97,788 -Balance at 31 December 2017 1,692,612,049 2,183,727
Balance at 1 July 2018 1,692,612,049 2,183,727Shares issued on vesting of performance rights 4,063,414 -Shares issued under Employee Share Scheme 287,716 -Shares issued under NED Equity Plan 106,541 -Balance at 31 December 2018 1,697,069,720 2,183,727
28
For
per
sona
l use
onl
y

Notes to the Consolidated FinancialStatements
10 Related party transactions
(a) Transactions with other related parties
Directors fees in the amount of $57,500 were paid to International Mining and Finance Corp, a company of which Mr James Askew is a Director for services provided during the period (31 December 2017: $57,500).
Directors fees in the amount of $150,000 were paid to DAK Corporation, a company of which Mr Jacob Klein is a Director for services provided during the period (31 December 2017: $150,000).
Directors fees in the amount of $66,250 were paid to Lazy 7 Pty Ltd, a company of which Mr Colin Johnstone is a Director for services provided during the period (31 December 2017: $67,500).
Directors fees in the amount of $7,917 were paid to Mr Naguib Sawaris as a Director for services provided during the period (31 December 2017: $47,500).
Directors fees in the amount of $8,750 were paid to Mr Sebastien de Montessus as a Director for services provided during the period (31 December 2017: $52,500)
11 Contingencies
(a) Contingent liabilities
The Group had contingent liabilities at 31 December 2018 in respect of:
(i) Claims
At the date of this report the Group was unaware of any material claims, actual or contemplated.
(ii) Guarantees
The Group has provided bank guarantees in favour of various government authorities and service providers withrespect to site restoration, contractual obligations and premises at 31 December 2018. The total of theseguarantees at 31 December 2018 was $134.737 million with various financial institutions (30 June 2018:$132.356 million).
12 Gold Delivery Commitments
Gold forphysicaldelivery
oz
Contractedsales price
A$/oz
Value ofcommitted
sales$'000
As at 31 December 2018Within one year 125,000 1,693 211,592Later than one year but not greater than five years 350,000 1,860 650,901
475,000 3,553 862,493
As at 30 June 2018Within one year 150,000 1,694 254,037Later than one year but not greater than five years 100,000 1,737 173,667
250,000 3,431 427,704
29
For
per
sona
l use
onl
y

Notes to the Consolidated FinancialStatements
12 Gold Delivery Commitments (continued)
The counterparties to the physical gold delivery contracts are Australia and New Zealand Banking Group Limited("ANZ"), National Australia Bank Limited ("NAB"), Westpac Banking Corporation ("WBC"), Commonwealth Bankof Australia ("CBA"), Citibank N.A ("Citibank") and Societe Generale ("SG"). Contracts are settled on a quarterlybasis by the physical delivery of gold per the banks instructions. The contracts are accounted for as salecontracts with revenue recognised once the gold has been delivered to ANZ, NAB, WBC, CBA, Citibank, SG orone of their agents. The physical gold delivery contracts are considered a contract to sell a non-financial item andis therefore out of the scope of AASB 9 Financial Instruments. As a result, no derivatives are required to berecognised. The Company has no other gold sale commitments with respect to its current operations.
13 Events occurring after the reporting period
No matter or circumstance has occurred subsequent to period end that has significantly affected, or maysignificantly affect, the operations of the Group, the results of those operations or the state of affairs of the Groupor economic entity in subsequent financial periods.
30
For
per
sona
l use
onl
y

Notes to the Consolidated FinancialStatements
14 Basis of preparation of half-year report
This consolidated Half-Year Financial Report for the half-year ended 31 December 2018 has been prepared inaccordance with Accounting Standard AASB 134 Interim Financial Reporting and the Corporations Act 2001.
This consolidated Half-Year Financial Report does not include all the notes of the type normally included in anAnnual Financial Report. Accordingly, this report is to be read in conjunction with the Annual Financial Report forthe period ended 30 June 2018 and any public announcements made by Evolution Mining Limited during thehalf-year ended 31 December 2018 in accordance with the continuous disclosure requirements of theCorporations Act 2001 and Australian Securities Exchange.
The accounting policies adopted are consistent with those of the previous Annual Financial Report andcorresponding Half-Year Financial Report in the prior period except for the adoption of new and amendedstandards as set out below.
(a) New and amended standards adopted by the Group
A number of new or amended standards became applicable for the current reporting period. The Group was notrequired to make any retrospective adjustments however had to change its accounting policies as a result ofadopting these standards:
• AASB 9 Financial Instruments, and• AASB 15 Revenue from Contracts with Customers.
The impact of the adoption of these standards and the new accounting policies are disclosed below.
(b) Adoption of new and revised standards
The impact of the adoption of IFRS 9 Financial Instruments and AASB 15 Revenue from Contracts withCustomers on the Group's financial statements is explained below. The new accounting policies that have beenapplied from 1 July 2018 have also been disclosed where they vary to those applied in prior periods.
(i) AASB 9 Financial Instruments
AASB 9 Financial Instruments supersedes AASB139 “Financial Instruments: Recognition and Measurement” andcovers classification and measurement of financial assets and financial liabilities, impairment of financial assetsand hedge accounting. AASB 9 modifies the classification and measurement of certain classes of financial assetsand liabilities and requires the Group to reassess classification of financial assets into to three primary categories(amortised cost, fair value through profit and loss, fair value through other comprehensive income), reflecting thebusiness model in which assets are managed and their cash flow characteristics. Financial liabilities continue tobe measured at either fair value through profit and loss or amortised cost. In addition, AASB 9 introduces anexpected credit loss (“ECL”) impairment model, whereby anticipated as opposed to incurred credit losses arerecognised resulting in earlier recognition of impairments.
The new hedge accounting rules under AASB 9 have no impact as the group is not currently hedge accounting.The new standard also introduces expanded disclosure requirements and changes in presentation.
Changes in accounting policies resulting from AASB 9 have been applied as at 1 July 2018, with no restatementof comparative information for prior year. The following summarises the impact from the adoption of IFRS 9:
• There will be no impact on the Group's accounting for financial liabilities, as the new requirements only affectthe accounting for financial liabilities that are designated at fair value through profit or loss and the Groupdoes not have any such liabilities. The derecognition rules have been transferred from AASB 139 FinancialInstruments: Recognition and Measurement and have not been changed.
• There is no material impact on the Group's accounting for financial assets. A breakdown of the classificationconsiderations and impact by asset class is included below.
31
For
per
sona
l use
onl
y
Notes to the Consolidated FinancialStatements
14 Basis of preparation of half-year report (continued)
(b) Adoption of new and revised standards (continued)
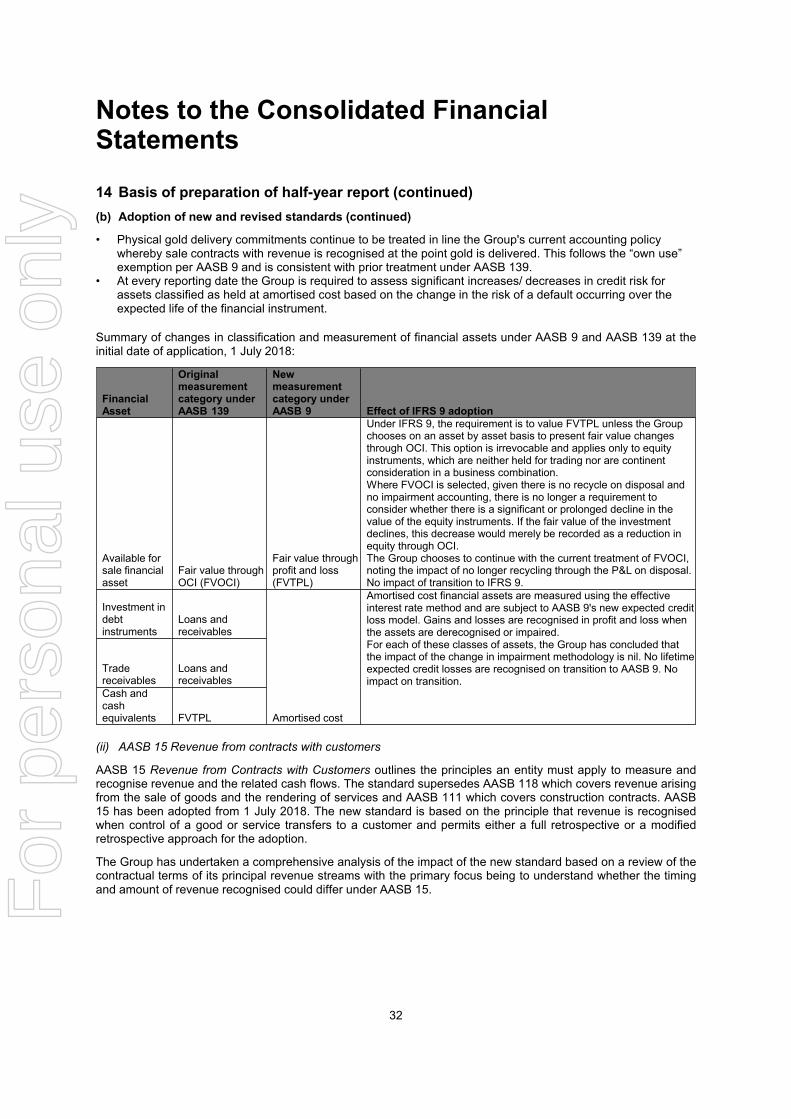
• Physical gold delivery commitments continue to be treated in line the Group's current accounting policywhereby sale contracts with revenue is recognised at the point gold is delivered. This follows the “own use”exemption per AASB 9 and is consistent with prior treatment under AASB 139.
• At every reporting date the Group is required to assess significant increases/ decreases in credit risk forassets classified as held at amortised cost based on the change in the risk of a default occurring over theexpected life of the financial instrument.
Summary of changes in classification and measurement of financial assets under AASB 9 and AASB 139 at theinitial date of application, 1 July 2018:
FinancialAsset
Originalmeasurementcategory underAASB 139
Newmeasurementcategory underAASB 9 Effect of IFRS 9 adoption
Available forsale financialasset
Fair value throughOCI (FVOCI)
Fair value throughprofit and loss(FVTPL)
Under IFRS 9, the requirement is to value FVTPL unless the Groupchooses on an asset by asset basis to present fair value changesthrough OCI. This option is irrevocable and applies only to equityinstruments, which are neither held for trading nor are continentconsideration in a business combination.Where FVOCI is selected, given there is no recycle on disposal andno impairment accounting, there is no longer a requirement toconsider whether there is a significant or prolonged decline in thevalue of the equity instruments. If the fair value of the investmentdeclines, this decrease would merely be recorded as a reduction inequity through OCI.The Group chooses to continue with the current treatment of FVOCI,noting the impact of no longer recycling through the P&L on disposal.No impact of transition to IFRS 9.
Investment indebtinstruments
Loans andreceivables
Amortised cost
Amortised cost financial assets are measured using the effectiveinterest rate method and are subject to AASB 9's new expected creditloss model. Gains and losses are recognised in profit and loss whenthe assets are derecognised or impaired.For each of these classes of assets, the Group has concluded thatthe impact of the change in impairment methodology is nil. No lifetimeexpected credit losses are recognised on transition to AASB 9. Noimpact on transition.
Tradereceivables
Loans andreceivables
Cash andcashequivalents FVTPL
(ii) AASB 15 Revenue from contracts with customers
AASB 15 Revenue from Contracts with Customers outlines the principles an entity must apply to measure andrecognise revenue and the related cash flows. The standard supersedes AASB 118 which covers revenue arisingfrom the sale of goods and the rendering of services and AASB 111 which covers construction contracts. AASB15 has been adopted from 1 July 2018. The new standard is based on the principle that revenue is recognisedwhen control of a good or service transfers to a customer and permits either a full retrospective or a modifiedretrospective approach for the adoption.
The Group has undertaken a comprehensive analysis of the impact of the new standard based on a review of thecontractual terms of its principal revenue streams with the primary focus being to understand whether the timingand amount of revenue recognised could differ under AASB 15.
32
For
per
sona
l use
onl
y

Notes to the Consolidated FinancialStatements
14 Basis of preparation of half-year report (continued)
(b) Adoption of new and revised standards (continued)
(ii) AASB 15 Revenue from contracts with customers (continued)
As the Group’s revenue is derived from arrangements in which the transfer of risks and rewards coincides withthe fulfilment of performance obligations and transfer of control as defined by AASB 15, the adoption of AASB 15has had no impact in respect of timing and amount of revenue currently recognised by the Group and accordinglyprior period amounts were not restated. Revenue for the period is comprised of the following:
31 December2018$'000
31 December2017$'000
Sales revenueGold sales 651,834 663,959Silver sales 7,688 11,147Copper sales 96,696 107,033
756,218 782,139
(c) Accounting policies applied from 1 July 2018
The new accounting policies that have been applied from 1 July 2018 following adoption of IFRS 9 FinancialInstruments and AASB 15 Revenue from Contracts with Customers are disclosed below where they vary to thoseapplied in prior periods.
(i) AASB 9 Financial Instruments
(a) Financial Assets
Recognition
From 1 July 2018, the Group classifies its financial assets in the following measurement categories:
• Those to be measured subsequently at fair value (either through OCI or through profit or loss), and• Those to be measured at amortised cost.
The classification depends on the Group's business model for managing the financial assets and the contractualterms of the cash flows.
For assets measured at fair value, gains and losses will either be recorded in profit or loss or OCI. Forinvestments in equity instruments that are not held for trading, depends on whether the Group has made anirrevocable election at the time of initial recognition to account for the equity investment at fair value through othercomprehensive income (FVOCI).
The group reclassifies debt investments when and only when its business model for managing those assetschanges.
Measurement
At initial recognition, the Group measures a financial asset at its fair value plus, in the case of a financial assetnot at fair value through profit or loss (FVTPL), transaction costs that are directly attributable to the acquisition ofthe financial asset. Transaction costs of financial assets carried at FVTPL are expensed in profit or loss.
33
For
per
sona
l use
onl
y
Notes to the Consolidated FinancialStatements
14 Basis of preparation of half-year report (continued)
(c) Accounting policies applied from 1 July 2018 (continued)
Measurement (continued)
Debt instruments
Subsequent measurement of debt instruments per AASB 9 depends on the group’s business model for managingthe asset and the cash flow characteristics of the asset. All debt instruments at 31 December 2018 arecategorised as held at amortised cost.
Assets that are held for collection of contractual cash flows where those cash flows represent solely payments ofprincipal and interest are measured at amortised cost. Interest income from these financial assets is included infinance income using the effective interest rate method. Any gain or loss arising on derecognition is recogniseddirectly in profit or loss and presented in other gains/(losses), together with foreign exchange gains and losses.Impairment losses are presented as separate line item in the statement of profit or loss.
Equity instruments
The group subsequently measures all equity investments at fair value. For available for sale financial assets,management has elected to present fair value gains and losses on equity investments in OCI, there is nosubsequent reclassification of fair value gains and losses to profit or loss following the derecognition of theinvestment.
Changes in the fair value of financial assets at FVTPL are recognised in other gains/(losses) in the statement ofprofit or loss as applicable. Impairment losses (and reversal of impairment losses) on equity investmentsmeasured at FVOCI are not reported separately from other changes in fair value.
Impairment of financial assets
From 1 July 2018, the group assesses on a forward looking basis the expected credit losses associated with itsdebt instruments carried at amortised cost and FVOCI. The impairment methodology applied depends onwhether there has been a significant increase in credit risk.
For trade receivables, the group applies the simplified approach permitted by AASB 9, which requires expectedlifetime losses to be recognised from initial recognition of the receivables.
(b) Derivatives and hedge accounting
Physical gold delivery commitments continue to be treated in line the Group's current accounting policy wherebysale contracts with revenue is recognised at the point gold is delivered. This follows the “own use” exemption perAASB 9 and is consistent with prior treatment under AASB 139.
(ii) AASB 5 Revenue from contracts with customers
Recognition
Revenue from the sale of goods is recognised when control of the goods or services passes to the customer andno further processing is required by the Group, the quality and quantity of the goods has been determined withreasonable accuracy, the price is fixed or determinable, and collectability is probable. In most instances, controlpasses and sales revenue is recognised when the product is delivered either upon leaving the gold room or ondelivery over the ship's rail at port of loading. Revenue is measured at the fair value of the consideration receivedor receivable.
34
For
per
sona
l use
onl
y

Notes to the Consolidated FinancialStatements
14 Basis of preparation of half-year report (continued)
(c) Accounting policies applied from 1 July 2018 (continued)
Measurement
The amount of revenue recognised reflects the consideration to which the Group is or expects to be entitled inexchange for those goods or services. The terms of metal in concentrate sales contracts with third parties containprovisional pricing arrangements whereby the selling price for metal in concentrate is based on prevailing spotprices on a specified future date after shipment to the customer (quotation period). Adjustments to the sales priceoccur based on movements in quoted marked prices up to the date of final settlement. The period betweenprovisional invoicing and final settlement is typically between one and three months. Revenue on provisionallypriced sales is recognised based on the estimated fair value of the total consideration receivable.
35
For
per
sona
l use
onl
y

Notes to the Consolidated FinancialStatements
14 Basis of preparation of half-year report (continued)
(d) Impact of standards issued but not yet applied by the Group
Certain new accounting standards and interpretations have been published that are not mandatory for 31December 2018 reporting periods and have not been early adopted by the Group. The Group's assessment ofthe impact of these new standards and interpretations is set out below.
Title ofstandard
Nature of change Impact Mandatoryapplicationdate/ Date ofadoption bygroup
AASB 16Leases
AASB 16 was issued in February2016. It will result in almost allleases being recognised on thebalance sheet, as the distinctionbetween operating and financeleases is removed. Under the newstandard, an asset (the right to usethe leased item) and a financialliability to pay rentals arerecognised. The only exceptions areshort-term and low-value leases.
The standard will affect primarily theaccounting for the Group’s operating leases.
To date, the group has focussed on theprovisions of the standard that will most impactthe financial results. Below is a summary of thework performed and the assessed impact of thenew standard:
• Data gathering: Site and group data has beencollated related to contracts that may contain alease.
• Data integrity and analysis: a number of theidentified contracts are covered by theexception for short-term and low-value leasesand some commitments may relate toarrangements that will not qualify as leasesunder AASB 16.
• Modelling of transition options: Review of thetransition options indicates that there is not amaterial difference to the group between thethree transition methodologies. Accordingly, thegroup intends to apply the modifiedretrospective transition approach.
• Financial reporting: Preliminary review resultsindicate that under the requirements of AASB16, a lease asset and liability would berecorded on balance sheet of approximately$20m-$25m if the standard applied at 31December 2018.
Work will continue on the implementation ofprocesses and systems prior to the effectivedate of 1 July 2019.
Mandatory forfinancial yearscommencing onor after 1January 2019.At this stage,the Group doesnot intend toadopt thestandard beforeits effectivedate.
The groupintends to applythe modifiedretrospectivetransitionapproach andwill not restatecomparativeamounts for theyear prior to firstadoption.
36
For
per
sona
l use
onl
y
Directors' Declaration
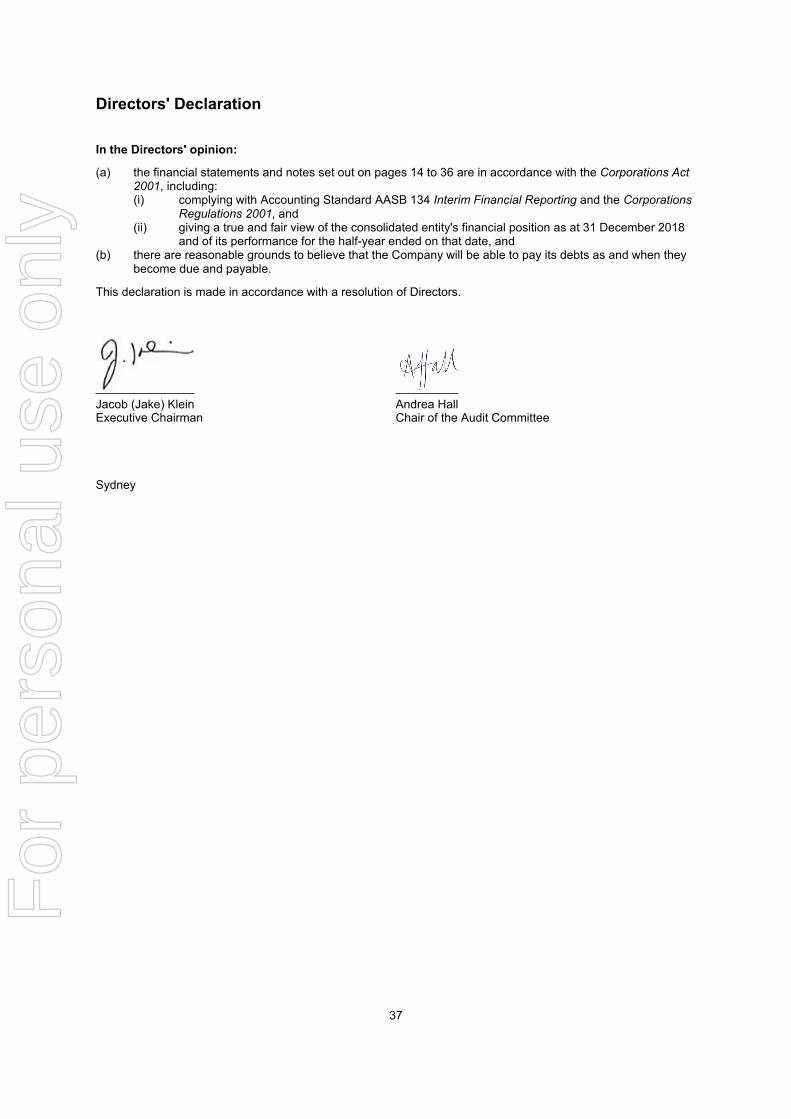
In the Directors' opinion:
(a) the financial statements and notes set out on pages 14 to 36 are in accordance with the Corporations Act2001, including:(i) complying with Accounting Standard AASB 134 Interim Financial Reporting and the Corporations
Regulations 2001, and(ii) giving a true and fair view of the consolidated entity's financial position as at 31 December 2018
and of its performance for the half-year ended on that date, and(b) there are reasonable grounds to believe that the Company will be able to pay its debts as and when they
become due and payable.
This declaration is made in accordance with a resolution of Directors.
Jacob (Jake) KleinExecutive Chairman
Andrea HallChair of the Audit Committee
Sydney
37
For
per
sona
l use
onl
y
PricewaterhouseCoopers, ABN 52 780 433 757One International Towers Sydney, Watermans Quay, Barangaroo, GPO BOX 2650, SYDNEY NSW 2001 T: +61 2 8266 0000, F: +61 2 8266 9999, www.pwc.com.au
Level 11, 1PSQ, 169 Macquarie Street, Parramatta NSW 2150, PO Box 1155 Parramatta NSW 2124 T: +61 2 9659 2476, F: +61 2 8266 9999, www.pwc.com.au
Liability limited by a scheme approved under Professional Standards Legislation.
Independent auditor's review report to the members of Evolution Mining Limited
Report on the Half-Year Financial Report We have reviewed the accompanying half-year financial report of Evolution Mining Limited (the Company), which comprises the consolidated balance sheet as at 31 December 2018, the consolidated statement of changes in equity, consolidated statement of cash flows and consolidated statement of profit or loss and other comprehensive income for the half-year ended on that date, selected other explanatory notes and the directors' declaration for Evolution Mining Limited. The Group comprises the Company and the entities it controlled during that half-year.
Directors' responsibility for the half-year financial report The directors of the Company are responsible for the preparation of the half-year financial report that gives a true and fair view in accordance with Australian Accounting Standards and the Corporations Act 2001 and for such internal control as the directors determine is necessary to enable the preparation of the half-year financial report that is free from material misstatement whether due to fraud or error.
Auditor's responsibility Our responsibility is to express a conclusion on the half-year financial report based on our review. We conducted our review in accordance with Australian Auditing Standard on Review Engagements ASRE 2410 Review of a Financial Report Performed by the Independent Auditor of the Entity, in order to state whether, on the basis of the procedures described, we have become aware of any matter that makes us believe that the half-year financial report is not in accordance with the Corporations Act 2001 including giving a true and fair view of the Group’s financial position as at 31 December 2018 and its performance for the half-year ended on that date; and complying with Accounting Standard AASB 134 Interim Financial Reporting and the Corporations Regulations 2001. As the auditor of Evolution Mining Limited, ASRE 2410 requires that we comply with the ethical requirements relevant to the audit of the annual financial report.
A review of a half-year financial report consists of making enquiries, primarily of persons responsible for financial and accounting matters, and applying analytical and other review procedures. A review is substantially less in scope than an audit conducted in accordance with Australian Auditing Standards and consequently does not enable us to obtain assurance that we would become aware of all significant matters that might be identified in an audit. Accordingly, we do not express an audit opinion.
Independence In conducting our review, we have complied with the independence requirements of the Corporations Act 2001.
38
For
per
sona
l use
onl
y

Conclusion Based on our review, which is not an audit, we have not become aware of any matter that makes us believe that the half-year financial report of Evolution Mining Limited is not in accordance with the Corporations Act 2001 including:
1. giving a true and fair view of the Group’s financial position as at 31 December 2018 and of itsperformance for the half-year ended on that date;
2. complying with Accounting Standard AASB 134 Interim Financial Reporting and theCorporations Regulations 2001.
PricewaterhouseCoopers
Marc Upcroft SydneyPartner 13 February 2019
39
For
per
sona
l use
onl
y