for personal use only asx:gxy · 3. lost time injury frequency rate calculation measures the number...
TRANSCRIPT

Slide 1[xx]
GALAXY RESOURCES LIMITEDFinancial Results for the Half Year Ended 30 June 2019
29 August 2019ASX:GXY
For
per
sona
l use
onl
y

Slide 2[xx]Galaxy Resources Limited (ASX:GXY)
Disclaimer
Caution Regarding Forward Looking InformationThis document contains forward looking statements concerning Galaxy. Statements concerning mining reserves and resources may also be deemed to be forward looking statements in that they involve estimates based on specific assumptions.
Forward-looking statements are not statements of historical fact and actual events and results may differ materially from those described in the forward-looking statements as a result of a variety of risks, uncertainties and other factors. Forward-looking statements are inherently subject to business, economic, competitive, political and social uncertainties and contingencies. Many factors could cause the Company’s actual results to differ materially from those expressed or implied in any forward-looking information provided by the Company, or on behalf of the Company. Such factors include, among other things, risks relating to additional funding requirements, The metal prices, exploration, development and operating risks, competition, production risks, regulatory restrictions, including environmental regulation and liability and potential title disputes.
Forward looking statements in this document are based on Galaxy’s beliefs, opinions and estimates of Galaxy as of the dates the forward-looking statements are made and no obligation is assumed to update forward looking statements if these beliefs, opinions and estimates should change or to reflect other future developments. There can be no assurance that Galaxy’s plans for development of its mineral properties will proceed as currently expected. There can also be no assurance that Galaxy will be able to confirm the presence of additional mineral deposits, that any mineralisation will prove to be economic or that a mine will successfully be developed on any of Galaxy’s mineral properties. Circumstances or management’s estimates or opinions could change. The reader is cautioned not to place undue reliance on forward-looking statements. Data and amounts shown in this document relating to capital costs, operating costs, potential or estimated cashflow and project timelines are internally generated best estimates only. All such information and data is currently under review as part of Galaxy’s ongoing operational, development and feasibility studies. Accordingly, Galaxy makes no representation as to the accuracy and/or completeness of the figures or data included in the document.
Not For Release in the United StatesThis announcement has been prepared for publication in Australia and may not be released in the United States. This announcement does not constitute an offer of securities for sale in any jurisdiction, including the United States and any securities described in this announcement may not be offered or sold in the United States absent registration or an exemption from registration under the United States Securities Act of 1933, as amended. Any public offering of securities to be made in the United States will be made by means of a prospectus that may be obtained from the issuer and that will contain detailed information about the company and management, as well as financial statements
2
CONTACT INFORMATIONLevel 4 / 21 Kintail Road, Applecross, Western Australia 6153 PO Box 1337, Canning Bridge LPOApplecross WA 6953T: +61 8 9215 1700F: +61 8 9215 1799E: [email protected]
For
per
sona
l use
onl
y

Slide 3[xx]
Operational and Financial Performance
For
per
sona
l use
onl
y

Slide 4[xx]Galaxy Resources Limited (ASX:GXY)
14.31
Health & Safety
The health and safety of our employees, contractors and any other key stakeholders remains the number one priority
Notes1. Our safety performance includes both employees and contractors and covers Perth Head Office (Australia) Mt Cattlin (Australia) James Bay (Canada) and Sal de Vida (Argentina)2. Total Recordable Injury Frequency Rate calculation measures the total number of injuries (excluding first aid) per million hours worked in a given financial year3. Lost Time Injury Frequency Rate calculation measures the number of lost time injuries per million hours work in a given financial year4. Injuries are classified in accordance with OSHA 3245-09R (2005) The Regulation and Related Interpretations for Recording and Reporting Occupational Injuries and Illnesses
0 2 2.0414
978,104Hours worked byemployees + contractors
298Average daily number of personnel onsite
Health and Safety Statistics for the Rolling 12 Months Ended 30 June 2019
Measure 30-Jun-19 30-Jun-18
Exposure Hours 978,104 668,280
Lost Time Injury Frequency Rate (LTIFR)3 2.04 -
Total Recordable Injury Frequency Rate (TRIFR)2 14.31 17.96
Total Recordable Injury Frequency
Rate (TRIFR) per million hours
worked
Fatalities Lost Time Injuries Lost Time Injury Frequency Rate
(LTIFR) per million hours
worked
Total Recordable Injuries
(LTI+RWI+MTI)
HSE Performance Comparison1,4
2 low severity LTI’s recorded at Sal de Vida
Roll out of site specific Health, Safety & Environmental Management System progressing
Improvement in TRIFR despite substantial increase in exposure hours and average daily personnel onsite
4
For
per
sona
l use
onl
y
Slide 5[xx]Galaxy Resources Limited (ASX:GXY)
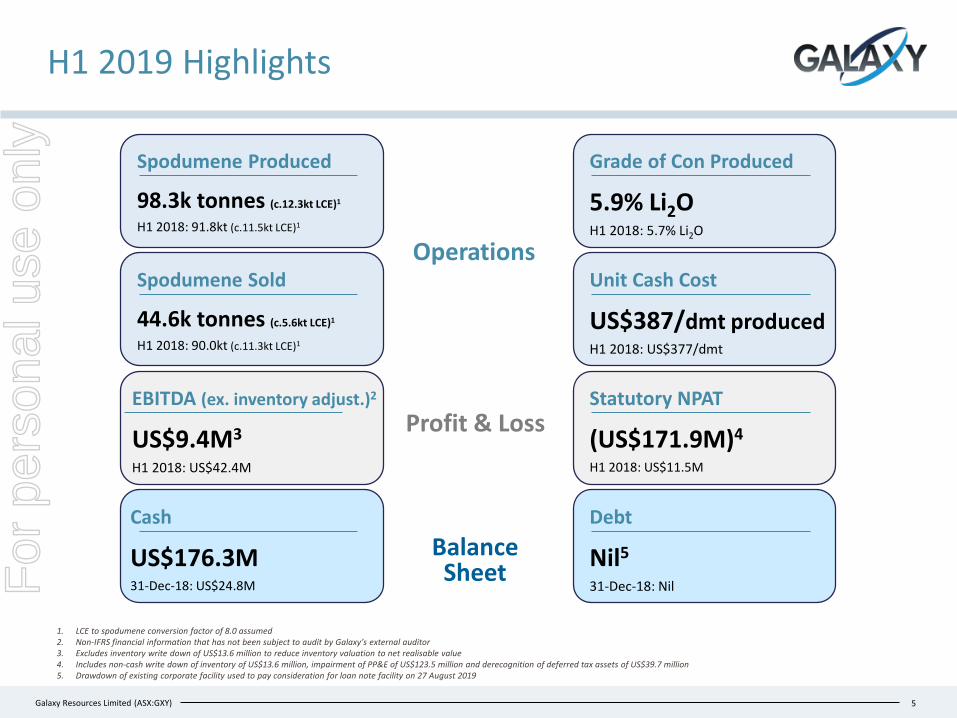
H1 2019 Highlights
5
Spodumene Produced
98.3k tonnes (c.12.3kt LCE)1
H1 2018: 91.8kt (c.11.5kt LCE)1
EBITDA (ex. inventory adjust.)2
US$9.4M3
H1 2018: US$42.4M
Grade of Con Produced
5.9% Li2OH1 2018: 5.7% Li2O
1. LCE to spodumene conversion factor of 8.0 assumed2. Non-IFRS financial information that has not been subject to audit by Galaxy’s external auditor 3. Excludes inventory write down of US$13.6 million to reduce inventory valuation to net realisable value4. Includes non-cash write down of inventory of US$13.6 million, impairment of PP&E of US$123.5 million and derecognition of deferred tax assets of US$39.7 million5. Drawdown of existing corporate facility used to pay consideration for loan note facility on 27 August 2019
Cash
US$176.3M31-Dec-18: US$24.8M
Debt
Nil5
31-Dec-18: Nil
Statutory NPAT
(US$171.9M)4
H1 2018: US$11.5M
Unit Cash Cost
US$387/dmt producedH1 2018: US$377/dmt
Spodumene Sold
44.6k tonnes (c.5.6kt LCE)1
H1 2018: 90.0kt (c.11.3kt LCE)1
Operations
Profit & Loss
Balance SheetF
or p
erso
nal u
se o
nly

Slide 6[xx]Galaxy Resources Limited (ASX:GXY)
Mt Cattlin Operations
Strong production volumes, improved product quality and lower operating costs
6
Mt Cattlin Production & Sales Statistics
Units H1 2018 H2 2018 H1 2019
MiningTotal material mined bcm 1,690,138 1,767,872 2,347,045
Ore mined wmt 948,291 829,429 817,119
Grade of ore mined % Li2O 1.06 0.94 1.20Processing and Sales Ore processed wmt 865,694 837,809 836,695
Grade of ore processed % Li2O 1.14 1.02 1.28
Mass yield % 11 8 12
Recovery % 54 45 55
Concentrate produced dmt 91,753 64,936 98,334
Grade of concentrate produced % Li2O 5.7 5.7 5.9
Concentrate sold dmt 90,019 69,236 44,630
Grade of concentrate sold % Li2O 5.7 5.8 5.8Selling Price and Production CostsRealised selling price1 US$/dmt 940 912 584
Selling and royalty costs US$/dmt 105 75 79
Cash cost per tonne sold1,2 US$/dmt 345 497 423
Cash Margin3,4 US$/dmt 490 340 82
Cash cost per tonne produced1 US$/dmt 377 556 387
One of the strongest half year periods of operational performance since restart in Q4 2016
— Record quarter of production in Q2 2019
Yield optimisation project (“YOP”) completed in H1 2019 and initial benefits are being realised
Recoveries and mass yield improving
— Targeting higher grade at request of customers
— Recovery loss approximately 3% for every 0.1% increase in Li2O product grade demonstrated across Q2 2019
— Projects underway to increase grade and minimise recovery loss
Improved product quality with higher final product grade of Li2O and reduced impurity concentrations
— Reliable and consistent production targeting 5.9-6.0%+ Li2O; <1.5% Fe2O3
One of the lowest cost spodumene operations, globally, firming Galaxy’s market position despite weak market conditions
— Unit cash cost of US$387/ dmt in H1 2019, a 30% reduction on H2 2018
Targeted production volume of 45,000 – 55,000 dmt in Q3 2019
Targeted shipment volume of 60,000 – 70,000 dmt in Q3 2019Notes:1. FOB Esperance price excluding shipping costs2. Calculated by taking cash costs after net inventory adjustments divided by tonnes sold3. Calculated as realised selling price less selling and royalty costs less cash cost per tonne sold4. Non-IFRS measure that has been included to assist investors to better understand the performance of the business, and where included in this report, has not been subject to audit
For
per
sona
l use
onl
y
Slide 7[xx]Galaxy Resources Limited (ASX:GXY)
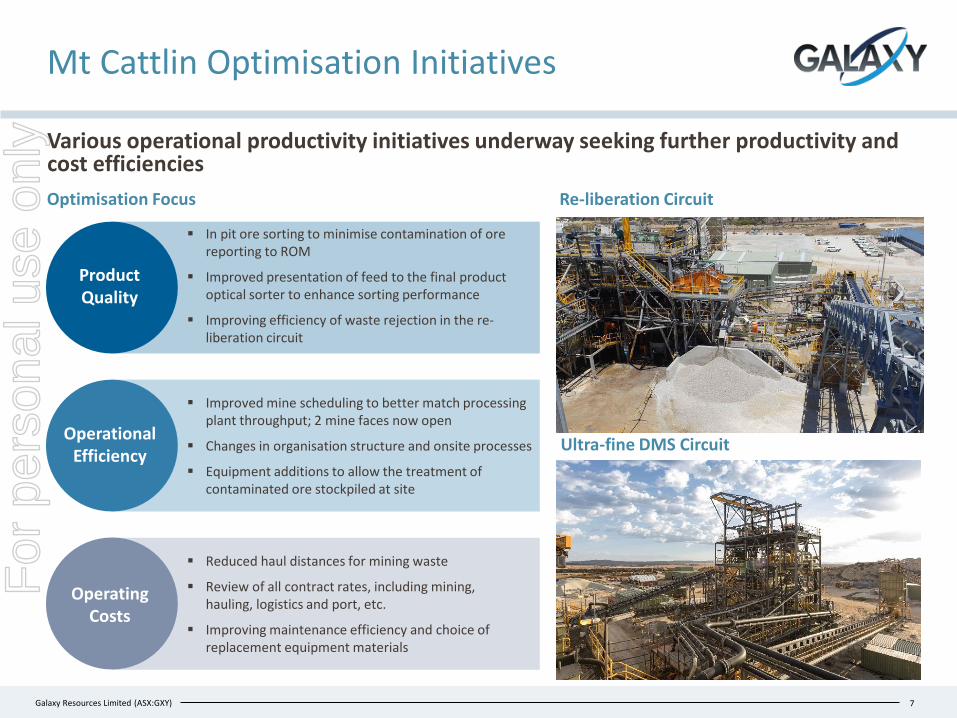
Mt Cattlin Optimisation Initiatives
Various operational productivity initiatives underway seeking further productivity and cost efficiencies
7
Ultra-fine DMS Circuit
Optimisation Focus
Product Quality
Re-liberation Circuit
Operational Efficiency
Operating Costs
Improved mine scheduling to better match processing plant throughput; 2 mine faces now open
Changes in organisation structure and onsite processes
Equipment additions to allow the treatment of contaminated ore stockpiled at site
In pit ore sorting to minimise contamination of ore reporting to ROM
Improved presentation of feed to the final product optical sorter to enhance sorting performance
Improving efficiency of waste rejection in the re-liberation circuit
Reduced haul distances for mining waste
Review of all contract rates, including mining, hauling, logistics and port, etc.
Improving maintenance efficiency and choice of replacement equipment materials
For
per
sona
l use
onl
y

Slide 8[xx]Galaxy Resources Limited (ASX:GXY)
40.2 26.6
(13.6)
212.9
89.4
(123.5)
39.7-
(39.7)
Non-cash Write Downs and Impairment
8
Total non-cash write downs and impairment of US$176.8 million across inventory and property, plant & equipment at Mt Cattlin and a derecognition of deferred tax assets Key Balance Sheet Items and Write Down Amounts (US$M)
Future production based on the current life of mine plan
Spodumene price forecasts (real) ranging from US$577/dmt – US$692/dmt CIF China
Average future cost of production ranging from US$385/dmt – US$470/dmt CIF China
Discount rate (real, post-tax) of 8.46%
Key PP&E Impairment Assumptions
Pre-write down Post-write down Write down quantum
Ore and Spodumene Inventory
Mt Cattlin Property, Plant and Equipment
Deferred Tax Assets
Inventory
Due to current weakness in spodumene price, the net realisable value of inventory on hand is less than total cost of goods sold to be expensed (cash and non-cash) when sold and therefore the carrying value has been written down to net realisable value
Property, Plant and Equipment (“PP&E”)
Impairment of US$48M and US$75.5M in plant & equipment and mine development expenditure, respectively
Mine development expenditure at Mt Cattlin represents the difference between the consideration paid under the General Mining acquisition and the fair value of assets acquired
Deferred Tax Assets Deferred tax assets have been
derecognised due to insufficient forecast taxable income available to utilise previously capitalised carried forward tax losses F
or p
erso
nal u
se o
nly

Slide 9[xx]Galaxy Resources Limited (ASX:GXY)
6 months ending
30-Jun-19
6 months ending
30-Jun-18
Revenue US$’000 27,961 88,440
EBITDA1 (before inventory write down) US$’000 9,414 42,377
EBITDA Margin % 33% 48%
Depreciation & Amortisation (“D&A”) US$’000 (11,766) (24,642)
Write Down and Impairment US$’000 (137,061) -
Tax Expense US$’000 (32,777) (6,512)
Net Profit After Tax US$’000 (171,864) 11,495
Earnings Per Share (undiluted)2 cps (43.7) 2.8
Earnings Per Share (diluted)2 cps (43.7) 2.8
Profit & Loss Statement Analysis
9
Notes: 1. Underlying EBITDA is a non-IFRS financial information that has not been subject to audit by Galaxy’s external auditor2. Weighted average no. of shares (undiluted) = 409.3 million; Weighted average no. of shares (diluted) = 407.8 million
H1 2019 EBITDA of US$9.4M before inventory write down; Future earnings positively impacted by lower expected D&A (compared to historical) following impairment of PP&E
RemarksProfit & Loss Statement
Revenue impacted by a 38% reduction in the average realised selling price, and a 50% reduction in sales volumes compared to H1 2018
Sales volumes skewed to H2 2019, thus revenue expected to improve based on volume in H2 2019
Ore and final product inventory written down by US$13.6M to net realisable value (see slide 8)
US$123.5M impairment of property, plant & equipment at Mt Cattlin (see slide 8)
Reduced D&A a function of lower sales
Includes the derecognition of deferred tax assets of US$39.7M
Includes foreign exchange gain
For
per
sona
l use
onl
y

Slide 10[xx]Galaxy Resources Limited (ASX:GXY)
6 months ending
30-Jun-19
6 months ending
30-Jun-18
Receipts from customers 19,027 75,920
Payments to suppliers, contractors and employees (44,225) (44,764)
Income tax paid (54,268) -
Net cash outflow from operating activities (79,466) 31,156
Interest received 1,938 399
Payments for exploration and evaluation assets (12,092) (8,542)
Net payments for property, plant and equipment (5,241) (11,957)
Net payments for financial assets (18,261) (10,988)
Proceeds from sale of exploration and evaluation assets 271,600 77
Net cash inflow from investing activities 237,944 (31,011)
Net cash outflow from financing activities (5,441) (426)
Net change in cash and cash equivalents 153,037 (281)
Cash and cash eq. at the beginning of period 24,755 46,629
Effect of foreign exchange rate changes (1,446) (1,226)
Cash and cash equivalents at period end 176,346 45,122
Cash Flow Analysis
Cash Flow Statement Remarks
10
Strong cash position founded by the proceeds received from the POSCO transaction
Income tax paid in relation to the gain on the tenement package sale in northern Salar del Hombre Muerto to POSCO (“POSCO Transaction”)
Total quantum favourably impacted by movements in the ARS:USD exchange rate
Investments made in financial assets, including:— A$22.5M subscription in Alita Resources (ASX: A40)— Subscription of entitlement in Lepidco (ASX:LPD) rights issue
of A$1.2M
Capitalised expenditure related to development and exploration work undertaken at Sal de Vida and James Bay
Capital expenditure related to the Mt Cattlin creek and road diversion
Proceeds received from the POSCO Transaction, net of withholding tax paid prior to completion of US$8.4M
For
per
sona
l use
onl
y

Slide 11[xx]Galaxy Resources Limited (ASX:GXY)
24.8
217.3 1.2
(26.4)(17.8)
(18.2) (4.8)
176.3
Cash as at31-Dec-18
POSCO sale(net of tax)
Operations Mt Cattlininventory
Capex Investments Other Cash as at30-Jun-19
Cash On Hand Analysis
11
For the period 1 January 2019 to 30 June 2019 (US$M)
Strong cash position, in the face of challenging market conditions, allowing for strategic flexibility through the commodity cycle
Includes proceeds from the sale of the tenement package in northern Salar del Hombre Muerto net of US$62.7 million in income and withholding tax paid
Inventory build up following customer shipping schedules being weighted to H2 2019
Includes an investment into Alita Resources and subscription of entitlement in Lepidico rights issue
Includes Capex at Mt Cattlin of US$5.2 million and capitalised project expenditure at development assets
For
per
sona
l use
onl
y

Slide 12[xx]Galaxy Resources Limited (ASX:GXY)
As at 30-Jun-19US$ ‘000
As at 30-Jun-18US$ ‘000
Cash and cash equivalents 176,346 24,755Receivables 13,232 278,703Inventories 29,172 16,708Other current assets 1,732 1,456Total Current Assets 220,482 321,622Property, plant and equipment 89,367 213,374Right of use assets 27,593 -Exploration and evaluation assets 81,343 81,644Financial assets 27,183 15,542Deferred tax asset - 33,344Other non-current assets 1,930 1,611Total Non-Current Assets 227,416 345,515Total Assets 447,898 667,137Trade and other payables 31,130 34,611Lease liabilities 6,406 -Provisions 6,867 6,569Income tax payable - 67,343Total Current Liabilities 44,403 108,523Lease liabilities 21,512 -Provisions 6,047 4,962Total Non-Current Liabilities 27,559 4,962Total Liabilities 71,962 113,485Contributed equity 673,994 673,801Reserves (9,117) (2,447)Accumulated Losses (288,941) (117,702)Total Equity 375,936 553,652
Balance Sheet Analysis
Balance Sheet
Robust balance sheet with cash of US$176.3 million and nil debt as at 30 June 2019 Remarks
12
Property, plant and mine development expenditures for Mt Cattlin impaired by US$123.5M following a review of the recoverable amount of Mt Cattlin
Final product inventory build resulting from customer shipping schedules being weighted to H2 2019
Ore and final product spodumene inventory written down by US$13.6M to reflect net realisable value
Galaxy has adopted accounting standard AASB 16 “Lease” with effect 1 January 2019 resulting in:— Right to use the underlying assets under lease recognised as an
asset on the balance sheet— Recognition of a liability in regards to future lease payments
US$39.7M in deferred tax assets derecognised
Payment of income tax in Argentina of US$54.3M
FX gain on movement in ARS:USD fx rate on payment dateFor
per
sona
l use
onl
y

Slide 13[xx]
Acquisition of Senior, Secured Loan Note
For
per
sona
l use
onl
y

Slide 14[xx]Galaxy Resources Limited (ASX:GXY)
Timeline of Key Dates
Acquisition of Alita Resources Debt Facility
Key Commercial Terms of the Facility
Galaxy purchased the senior secured loan facility (“Facility”) provided to Alita Resources from a consortium of lenders led by Tribeca Investment Partners for US$31.1M
14
Overview and Next Steps
Term Details
Borrower Lithco No. 2 Pty Ltd. (wholly owned subsidiary of Alita)
Principal US$28.8M
Repayment Date 1 July 2020
Interest rate LIBOR plus 13% p.a. (15.33288% for current interest period)
Security First ranking security over all assets of Alita and its key subsidiaries
Redemption premium 2% (on outstanding amount repaid at maturity)
Early call premium 5% (on any amounts prepaid voluntarily prior to maturity)
14 August 2019
Alita shares placed into voluntary suspension
Alita appointed voluntary administrator and Galaxy
appointed receivers & managers
Galaxy liaising with key stakeholders
28-29 August 2019
Alita and lenders enter a standstill in respect of unremedied events of
default
Galaxy acquired the loan Facility
Reorganisation strategy
27 August 201916 August 2019
Galaxy entitled to the rights, title and interests of the Facility, including repayment of the principal, accrued interest, reimbursable costs and any future interest
First ranking security of the debt facility assigned to Galaxy through the acquisition
Galaxy appointed KPMG as receivers and managers (“receiver”) on 29 Aug 2019
Small Galaxy team onsite at Bald Hill and assisting the receiver in winding down operations to a minimum
Galaxy will now work with the Receivers and the voluntary administrators to determine a course of action for the Alita GroupF
or p
erso
nal u
se o
nly

Slide 15[xx]
Outlook
For
per
sona
l use
onl
y

Slide 16[xx]Galaxy Resources Limited (ASX:GXY)
Outlook & Growth Catalysts
MT CATTLINProduction & optimisation
Targeting 45-55kt spodumene production in Q3 2019 (180-210kt for CY2019) Targeting 60-70kt of shipment volume in Q3 2019 Focused on productivity improvements and further rationalising cash costs Exploring potential downstream opportunities with existing customers
16
Market conditions currently challenging, with excess supply and soft near term demand for spodumene resulting in inventory build
China targeting 1.5-1.7 million NEVs in 2019 continuing strong growth trajectory Rest of the world will begin to see the launch of mainstream EV models from global OEMs Increasing number of energy storage system deployments adopting lithium ion batteries
MACRORobust lithium demand
JAMES BAYProject development
Comprehensive test work program for the upstream operation nearing completion Phase 2 test work for downstream operation underway, with results expected in H2 2019 Confirmation of execution plan Continued progress on ESIA and IBA processes
SAL DE VIDAField work, offtake & project financing
Optimisation and early development works; complete construction of demonstration ponds Dual stream test work program seeking to optimise the process flow sheet Confirmation of process flowsheet and updated execution plan targeted for Q4 2019 Resourcing up for project development through key team appointments
Operational optimisation at Mt Cattlin and a strong balance sheet underpin Galaxy’s continued commitment to the development of Sal de Vida and James Bay
For
per
sona
l use
onl
y
Slide 17[xx]Galaxy Resources Limited (ASX:GXY)
Competent & Qualified Persons’ Statement
Competent Person Statements
Mt CattlinAny information in this report that relates to Mt Cattlin Mineral Resources and Ore Reserves is extracted from the report entitled “42% increase in Mt Cattlin resource to 16.7Mt” created on 23 January 2019 which is available to view on www.gxy.com and www.asx.com.au. The Company confirms that it is not aware of any new information or data that materially affects the information included in the original market announcement and that all material assumptions and technical parameters underpinning the Mineral Resources and Ore Reserves estimates in the relevant market announcement continue to apply and have not materially changed. The Company confirms that the form and context in which the Competent Person’s findings are presented have not been materially modified from the original market announcement.
Sal de Vida Any information in this report that relates to Sal de Vida Project Mineral Resources is extracted from the report entitled “Sale of Northern Tenements at Sal de Vida to POSCO Completed” created on 26 November 2018 and the Sal de Vida Project Ore Reserves is extracted from the report entitled “Sal De Vida: Revised Definitive Feasibility Study Confirms Low Cost, Long Life and Economically Robust Operation” created on 22 August 2016 both of which are available to view on www.gxy.com and www.asx.com.au. The Company confirms that it is not aware of any new information or data that materially affects the information included in the original market announcements and that all material assumptions and technical parameters underpinning the Mineral Resources and Ore Reserves estimates in the relevant market announcement continue to apply and have not materially changed. The Company confirms that the form and context in which the Competent Person’s findings are presented have not been materially modified from the original market announcement
James Bay Any information in this report that relates to James Bay Mineral Resources is extracted from the ASX announcement, entitled “James Bay Resource Update” dated 4 December 2017 which is available to view on www.gxy.com and www.asx.com.au. The Company confirms that it is not aware of any new information or data that materially affects the information included in the original market announcement and that all material assumptions and technical parameters underpinning the Mineral Resources in the relevant market announcement continue to apply and have not materially changed. The Company confirms that the form and context in which the Competent Person’s findings are presented have not been materially modified from the original market announcement.
17
For
per
sona
l use
onl
y