for personal use only business-wide review … new international licence fee revenues > dividend...
TRANSCRIPT

1H18 RESULTS PRESENTATION&
BUSINESS-WIDE REVIEW UPDATEFor
per
sona
l use
onl
y

Colin Archer Independent Non-executive Chairman André Nell Managing Director
André Nell Managing Director Peter McGettigan Chief Financial Officer
Stephen Lonie Independent Non-executive Director Richard Hinson Chief Executive – Australia
Kerry Ryan Independent Non-executive Director Mike Gilbert Chief Executive – International
Russell Shields Independent Non-executive Director Darren Dench Global Head of Coffee
Jessica Buchanan
Independent Non-executive Director Mark Connors Director Corporate Services/Company Secretary
BOARD EXECUTIVE
(ASX:RFG)RFG is a global food and beverage company headquartered in Queensland. It is Australia’s largest multi-brand retail food franchise owner, a roaster and supplier of high quality coffee products and an emerging leader in the foodservice, dairy processing and wholesale bakery sectors.
1H18 RESULTS PRESENTATION PAGE 2
For
per
sona
l use
onl
y

STRATEGIC GROWTH DRIVERSFRANCHISE
A diverse portfolio of market leading brandsacross bakery, café, retail coffee and QSR
INTERNATIONAL
Expanding global footprint provides a sustainable long term growth platform
COFFEE & ALLIEDBEVERAGE
Growing global demand underpins significant growth opportunity
COMMERCIAL
Supports diversification and vertical integration whilst offering access to strong new business opportunities
1H18 RESULTS PRESENTATION PAGE 3
For
per
sona
l use
onl
y

1H18: SNAPSHOT
1H18 RESULTS PRESENTATION PAGE 4
> Disappointing 1H18 performance • Underlying NPAT of $24.7m, down 31.8% on PCP• Impacted by persistent challenging trading conditions
and internal challenges
> Business-wide review fast-tracked but ongoing• Significant aspects of review complete, key
recommendations being implemented• Strategic reset to focus on quality of domestic
franchise business• c.160-200 domestic outlets to be closed by end of
FY19• c.$10.0m annualised operational savings targeted
• c.$4.8m realised to date (full impact FY19)• Further efficiencies to be delivered in 2H18• c.$1.5m investment to bolster capability in
enhanced Field Service support model
> Significant items recognised 1H18:• Non-cash impairments, write-downs and provisioning
totalling $138.0m pre-tax included in 1H18 result, comprising:• Brand System impairments of $84.0m• $35.7m arising from closure program• $18.3m for PP&E and inventory write-downs, loss
on real property disposals and miscellaneous matters
• Contributed to 1H18 statutory net loss after tax of $87.8m
> Senior debt/capital management• Net debt as at 31 December 2017 - $259.7m• Compliance with all covenants as at 31 December 2017• Senior debt covenant reset agreed (including leverage
ratio [debt/EBITDA] increase to 3.0x)• Dividends suspended, supporting balance sheetF
or p
erso
nal u
se o
nly

1H18 PERFORMANCE REVIEWF
or p
erso
nal u
se o
nly

1H18 PERFORMANCESUMMARY(1)
> Revenue increase (+20.8%) reflects full period contribution of FY17 acquired assets (HPC/AFS)
> 1H18 EBITDA/NPAT performance influenced by:
• Persistent challenging retail trading conditions
• Compounded by ineffective tactical initiatives and disappointing execution across certain business units
• Cumulative impact of 2H17/1H18 domestic outlet closures (impacting Domestic Franchise performance)
• Sharp decline in domestic new / resale / renewal activity, impacted by negative sentiment
• Timing delay -> early 2H18 recognition of significant new international licence feerevenues
> Dividend payments suspended • Supports balance sheet following strategic reset• Dividend policy to be reassessed at appropriate
time
1H18 RESULTS PRESENTATION PAGE 6
1H18 UNDERLYINGGROUP PERFORMANCE(1) 1H17 1H18 % Change
Revenue $161.9m $195.5m 20.8%
EBITDA $60.5m $45.7m (24.5%)
NPAT $36.2m $24.7m (31.8%)
EPS 21.2cps 13.8cps (34.9%)
Dividend 14.75cps -
Dividend Payout Ratio 69.5% -
Net Operating Cash Flow (2)(3) $31.4m $3.4m
Net Debt $227.4m $259.7m
(1) Underlying results – refer following slide for reconciliation to statutory results
(2) Statutory
(3) 1H17 restated: as further detailed in the notes to 1H18 Financial StatementsFor
per
sona
l use
onl
y

RECONCILIATION OF UNDERLYING TO STATUTORY RESULTS
1H18 Underlying Statutory
EBITDA $m 45.7 (100.8)
NPAT $m 24.7 (87.8)
EPS cps 13.8 (49.0)
1H18 RESULTS PRESENTATION PAGE 7
Underlying Adjustments (1) $m
Statutory EBITDA (100.8)
Acquisition, Integration & Restructuring 6.8
Property Disposal & Lease Exit 1.4
Provisioning & Impairment of Assets (non-cash)• Provisioning: $33.4m• Impairment of assets (non-cash): $104.6m
138.0
Contingent Consideration Expensed 0.3
Underlying EBITDA 45.7
> Recent operating performance, re-assessment of near term prospects, and decision to implement initial recommendations from business-wide review led to significant items being accounted for in 1H18 result
• Non-cash impairments, write-downs, and provisioning, totalling $138.0m, accounted for, comprising:
• Brand System impairments ($84.0m):• Michel’s Patisserie ($45.0m)• Pizza Capers ($4.5m)• Coffee Retail Division CGU ($34.5m)
• Non-cash write-downs, and provisioning, totalling $35.7m, arising from domestic outlet network analysis and resulting actions;
• Non-cash write-down, and provisioning, of $18.3m for PP&E and inventory write-downs, loss on real property disposals and miscellaneous matters
> Adjustments to statutory performance also reflects non-core expenditure, including investment to date in business-wide review
(1) Underlying adjustments refer 1H18 financial statements for further details For
per
sona
l use
onl
y

Domestic Franchise
Coffee Wholesale
Brand System Coffee Contribution
InternationalFranchise
Commercial
14.4%
1H18 RESULTS PRESENTATION PAGE 8
EBITDA BY DIVISION
Divisional EBITDA Contribution(1) 1H17 1H18 % Change
Brand Systems (Domestic) $37.6m $26.7m (29.0%)
Brand Systems (International) $10.1m $6.3m (37.6%)
TOTAL BRAND SYSTEM EBITDA $47.7m $33.0m (30.8%)
Coffee Wholesale(3) $9.1m $5.5m (39.6%)
Commercial Division $3.7m $7.2m 94.6%
TOTAL GROUP EBITDA $60.5m $45.7m (24.5%)
Divisional EBITDA Breakdown(1) 1H17 1H18 % Change
Domestic Franchise OperationsDomestic Coffee Contribution(2)
$26.6m$11.0m
$16.7m$10.0m
(37.2%)(9.1%)
International Franchise OperationsInternational Coffee Contribution(2)
$8.7m$1.4m
$4.5m$1.8m
(48.3%)28.6%
TOTAL BRAND SYSTEM EBITDA $47.7m $33.0m (30.8%)
Domestic Coffee WholesaleInternational Coffee Wholesale
$9.0m$0.1m
$5.5m$0.0m
(38.9%)(100.0%)
Commercial Division $3.7m $7.2m 94.6%
TOTAL GROUP EBITDA $60.5m $45.7m (24.5%)(1) Underlying results – refer preceding slide for reconciliation to statutory results(2) EBITDA Contribution from Coffee & Allied Beverage sales to Brand System franchise partners(3) Excludes EBITDA contribution from Coffee & Allied Beverage to Brand System franchise partners
(1)
DomesticFranchise
Coffee Wholesale
Brand System Coffee Contribution
InternationalFranchise
Commercial
6.1%
44.0%
15.0%
20.5%
15.8%
36.6%
12.0%25.8%
9.8%
1H17 EBITDA $60.5m 1H18 EBITDA $45.7m
For
per
sona
l use
onl
y
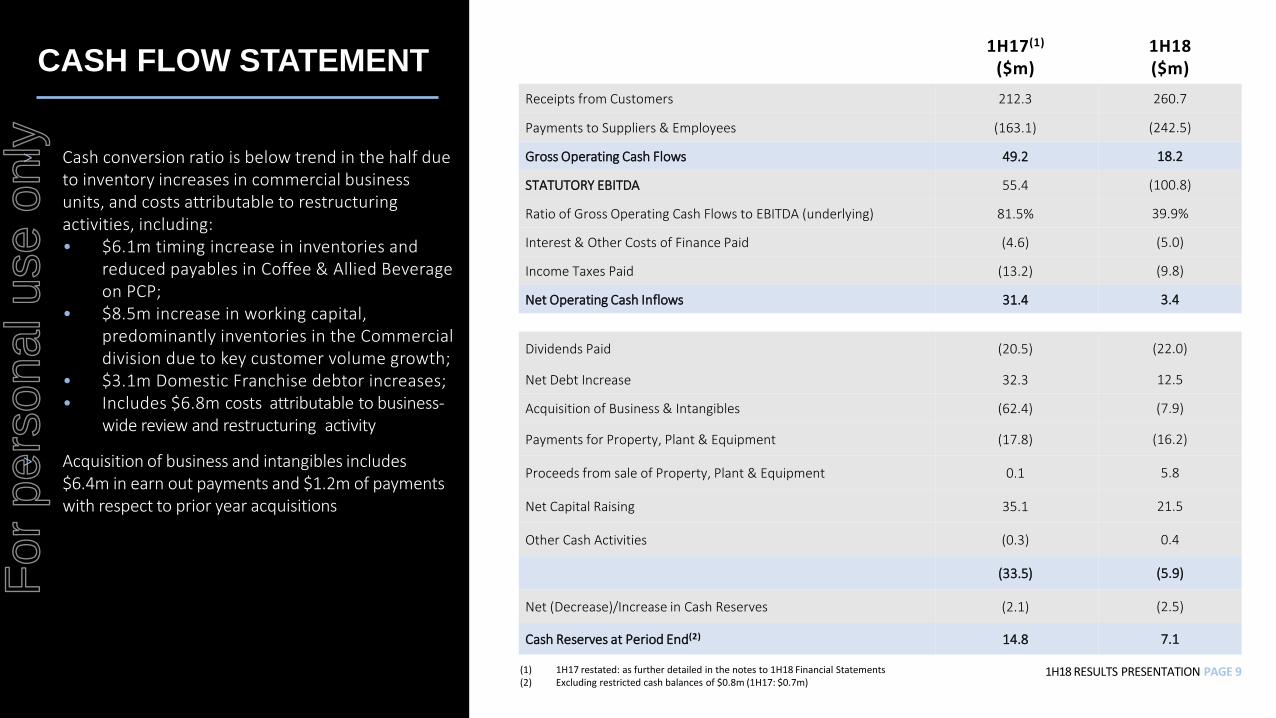
CASH FLOW STATEMENT
> Cash conversion ratio is below trend in the half due to inventory increases in commercial business units, and costs attributable to restructuring activities, including: • $6.1m timing increase in inventories and
reduced payables in Coffee & Allied Beverage on PCP;
• $8.5m increase in working capital, predominantly inventories in the Commercial division due to key customer volume growth;
• $3.1m Domestic Franchise debtor increases; • Includes $6.8m costs attributable to business-
wide review and restructuring activity
> Acquisition of business and intangibles includes $6.4m in earn out payments and $1.2m of payments with respect to prior year acquisitions
1H17(1)
($m)1H18($m)
Receipts from Customers 212.3 260.7
Payments to Suppliers & Employees (163.1) (242.5)
Gross Operating Cash Flows 49.2 18.2
STATUTORY EBITDA 55.4 (100.8)
Ratio of Gross Operating Cash Flows to EBITDA (underlying) 81.5% 39.9%
Interest & Other Costs of Finance Paid (4.6) (5.0)
Income Taxes Paid (13.2) (9.8)
Net Operating Cash Inflows 31.4 3.4
Dividends Paid (20.5) (22.0)
Net Debt Increase 32.3 12.5
Acquisition of Business & Intangibles (62.4) (7.9)
Payments for Property, Plant & Equipment (17.8) (16.2)
Proceeds from sale of Property, Plant & Equipment 0.1 5.8
Net Capital Raising 35.1 21.5
Other Cash Activities (0.3) 0.4
(33.5) (5.9)
Net (Decrease)/Increase in Cash Reserves (2.1) (2.5)
Cash Reserves at Period End(2) 14.8 7.1
1H18 RESULTS PRESENTATION PAGE 9(1) 1H17 restated: as further detailed in the notes to 1H18 Financial Statements(2) Excluding restricted cash balances of $0.8m (1H17: $0.7m)
For
per
sona
l use
onl
y

Sara Bradford 22/02/2018RIBUTOR TO DELTA
BALANCE SHEET
1H RESULTS PRESENTATION PAGE 10
RFG Consolidated Group FY17($m)
1H18($m)
Assets:Cash Reserves 10.3 7.9Trade Receivables 85.8 75.9Financial Assets 23.7 19.7Inventories 28.5 32.7Assets held for sale - 2.1Plant & Equipment 95.6 81.5Intangibles 668.9 586.3Current Tax Assets - 6.4Deferred Tax Assets 13.7 22.4Other 3.2 3.3
929.7 838.2
Liabilities:Trade Payables 69.8 62.0Provisions 7.8 25.3Current Tax Liability 2.5 -Borrowings 250.0 261.8Derivative Liability 1.8 1.6Deferred Tax Liability 119.4 103.2Contingent Consideration 7.0 0.3Other 6.2 7.3
464.5 461.5
Equity:Share Capital 402.5 428.6Reserves 0.1 (0.2)Retained Earnings 62.6 (51.7)
465.2 376.7
> Decreases in receivables, PP&E, intangible assets, and tax balances, and increases in provisioning, primarily attributable to non-cash impairments and write-downs, and provisioning, totalling $138.0m;
> Other asset and liability movements include• $4.3m increase in domestic franchise trade
receivables• $9.3m increase in inventories due to Commercial
and Coffee & Allied Beverage divisions• $1.3m decrease in PPE due to property disposals• $7.8m decrease in trade payables, timing related• $6.7m contingent consideration reduction due to
$6.4m of earn-out payments for Hudson Pacific and Di Bella Coffee acquisitions
> Share capital increase of $26.1m reflects DRP & dividend shortfall placement
> Retained earnings decrease due to the $87.8m NPAT loss in 1H18 and $26.5m final FY17 dividend (paid October 2017)
> Dividends suspended to strengthen balance sheet
For
per
sona
l use
onl
y

Sara Bradford 22/02/2018RIBUTOR TO DELTADEBT STRUCTURE
1H18 RESULTS PRESENTATION PAGE 11
> Gross debt of $267.6m(2)
> Compliance with all lending covenants at 31 December 2017
> Three year debt facilities of $150m extended:• $100m extended to facilities maturing Jan
2020• $50m extended to facilities maturing Dec
2020
> Reduced excess available debt facilities by $25m
> Financial covenant reset agreed 2H18:
• Resets covenants• Operating leverage ratio increased to
3.0x (from 2.5x) to 31 December 2018• Introduction of a financial covenant on
actual performance to budget• Quarterly covenant compliance in
operational reporting• Loan amortisation of $12.5m to occur by
March 2019
SENIOR DEBT FACILITIES FY17 1H18
Net debt(1) $247.1m $259.7m
Interest expense $9.6m $10.0m
Interest cover 13.2x 10.9x
Gearing ratio (net debt/net debt + equity)(1) 34.7% 40.8%
TOTAL FACILITIES $344.0m $319.0m
(1) Calculated in accordance with Senior Debt Facility Agreement(2) Including ancillary facilities, as at 31 December 2017
For
per
sona
l use
onl
y

1H18 DIVISIONAL PERFORMANCEFRANCHISE | INTERNATIONAL | COFFEE & ALLIED BEVERAGE | COMMERCIAL
For
per
sona
l use
onl
y
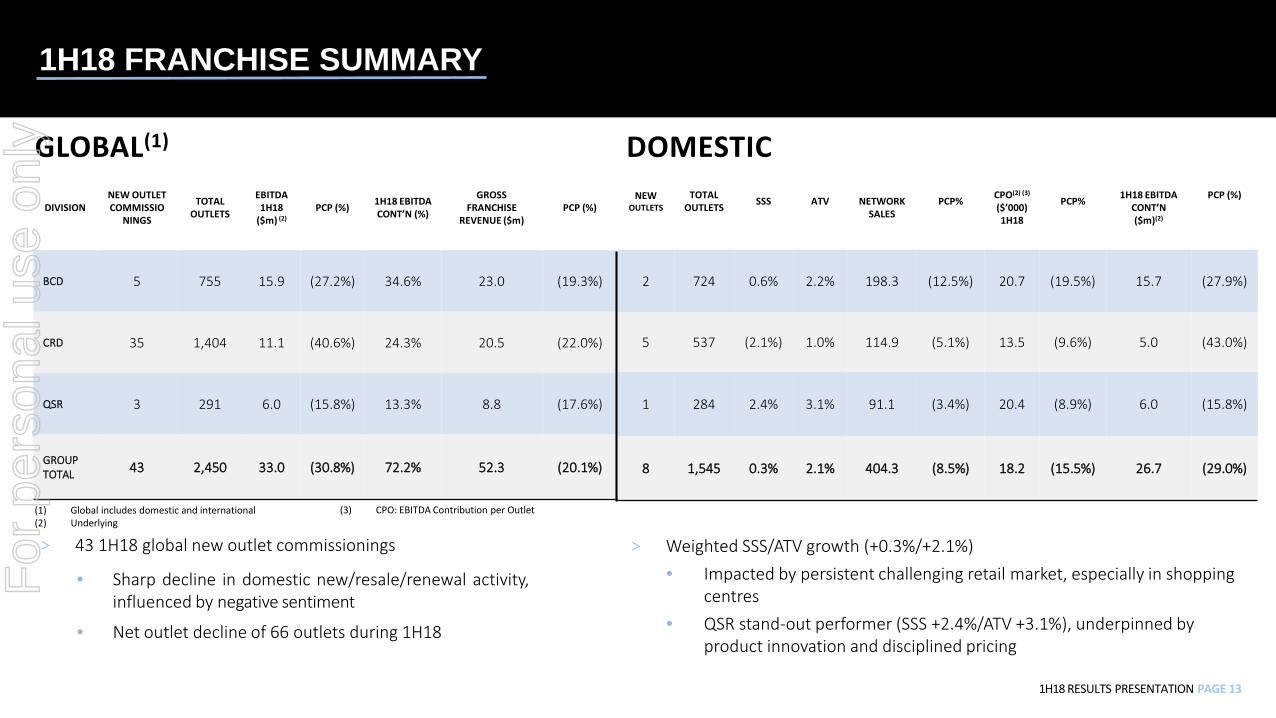
1H18 RESULTS PRESENTATION PAGE 13
(1) Global includes domestic and international(2) Underlying
> Weighted SSS/ATV growth (+0.3%/+2.1%)• Impacted by persistent challenging retail market, especially in shopping
centres• QSR stand-out performer (SSS +2.4%/ATV +3.1%), underpinned by
product innovation and disciplined pricing
> 43 1H18 global new outlet commissionings
• Sharp decline in domestic new/resale/renewal activity,influenced by negative sentiment
• Net outlet decline of 66 outlets during 1H18
GLOBAL(1)DOMESTIC
NEWOUTLETS
TOTAL OUTLETS SSS ATV NETWORK
SALESPCP% CPO(2) (3)
($’000) 1H18
PCP% 1H18 EBITDA CONT’N($m)(2)
PCP (%)
2 724 0.6% 2.2% 198.3 (12.5%) 20.7 (19.5%) 15.7 (27.9%)
5 537 (2.1%) 1.0% 114.9 (5.1%) 13.5 (9.6%) 5.0 (43.0%)
1 284 2.4% 3.1% 91.1 (3.4%) 20.4 (8.9%) 6.0 (15.8%)
8 1,545 0.3% 2.1% 404.3 (8.5%) 18.2 (15.5%) 26.7 (29.0%)
DIVISIONNEW OUTLET COMMISSIO
NINGS
TOTALOUTLETS
EBITDA 1H18
($m) (2)PCP (%) 1H18 EBITDA
CONT’N (%)
GROSSFRANCHISE
REVENUE ($m)PCP (%)
BCD 5 755 15.9 (27.2%) 34.6% 23.0 (19.3%)
CRD 35 1,404 11.1 (40.6%) 24.3% 20.5 (22.0%)
QSR 3 291 6.0 (15.8%) 13.3% 8.8 (17.6%)
GROUPTOTAL 43 2,450 33.0 (30.8%) 72.2% 52.3 (20.1%)
DOMESTIC
1H18 FRANCHISE SUMMARY
(3) CPO: EBITDA Contribution per Outlet
For
per
sona
l use
onl
y

> $5.9m Divisional EBITDA decrease, and CPO reductions, impacted by:
• Cumulative impact of 2H17/1H18 domestic outlet closures
• Sharp decline in domestic new and renewalactivity, impacted by negative sentiment
> Most acute in Michel’s Patisserie Brand System:
• Transition to in-store operating model continues to present challenges
• 2018 repositioning, including new menu items, to emphasise French café heritage and enhance consumer relevance
> Ongoing focus on new product innovation, digital initiatives and reinvigorated franchisee support structures to drive enhanced performance
1H18 RESULTS PRESENTATION PAGE 14
1H18 BAKERY CAFE DIVISION PERFORMANCE
1H17 1H18 PCPCONTRIBUTIONTO GROUP EBITDA (1)
BCD 36.0% 34.6%
Donut King 13.7% 15.4%
Brumby’s 8.9% 9.0%
Michel‘s Patisserie 13.5% 10.2%
EBITDA(1) ($m) ($m)
BCD 21.8 15.9 (27.2%)
Donut King 8.3 7.1 (14.9%)
Brumby’s 5.4 4.1 (23.2%)
Michel‘s Patisserie 8.1 4.7 (42.4%)
EBITDA CPO(1) (2) ($’000) ($’000)
BCD 25.7 20.7 (19.5%)
Donut King 25.2 22.5 (10.5%)
Brumby’s 21.2 18.0 (15.3%)
Michel‘s Patisserie 30.7 20.9 (31.8%)
GROSS FRANCHISE REVENUE ($m) ($m)
BCD 28.6 23.0 (19.3%)
Donut King 10.5 8.9 (14.9%)
Brumby’s 7.5 6.4 (14.2%)
Michel’s Patisserie 10.6 7.7 (27.4%)
NETWORK SALES ($m) ($m)
BCD 226.6 198.3 (12.5%)
Donut King 83.1 81.3 (2.1%)
Brumby’s 79.2 66.8 (15.7%)
Michel’s Patisserie 64.3 50.1 (22.0%)
(1) Underlying(2) Domestic only
For
per
sona
l use
onl
y

• Divisional EBITDA has decreased by $7.6m impacted by:
• Challenging retail conditions, especially in shopping centres
• Delayed timing of significant international license fee revenue (recognised early 2H18)
• Reduced domestic transactional revenues in 1H18
• GJ20:20 first pilot outlet launched February 2018
• Significant brand evolution for Gloria Jean’s
• Provides entry into fast casual dining (all day menu and new ‘hero’ products)
• Underpinned by significant R&D and franchisee, consumer and landlord engagement
• Staged network rollout (tailored to individual store circumstances)
• Complemented by heightened focus on core coffee credentials
1H18 RESULTS PRESENTATION PAGE 15
1H18 COFFEE RETAILDIVISION PERFORMANCE
(1) Underlying (2) Domestic only
1H17 1H18 PCPCONTRIBUTIONTO GROUP EBITDA (1)
Coffee Retail 30.9% 24.3%
Gloria Jean’s 27.9% 21.6%
Mobile 3.0% 2.7%
EBITDA(1) ($m) ($m)
Coffee Retail 18.7 11.1 (40.6%)
Gloria Jean’s 16.9 9.9 (41.4%)
Mobile 1.8 1.2 (32.5%)
EBITDA CPO(1) ($’000) ($’000)
Non-mobile Domestic 18.9 18.1 (4.1%)
Non-mobile International 15.6 5.3 (65.9%)
Mobile Domestic 7.9 5.6 (28.3%)
Mobile International 1.3 0.6 (51.6%)
GROSS FRANCHISE REVENUE ($m) ($m)
Coffee Retail 26.3 20.5 (22.0%)
Gloria Jean’s 23.7 18.3 (22.6%)
Mobile 2.6 2.2 (15.9%)
NETWORK SALES (2) ($m) ($m)
Gloria Jean’s 121.1 114.9 (5.1%)
For
per
sona
l use
onl
y

1H18 RESULTS PRESENTATION PAGE 16
1H18 QSRDIVISION PERFORMANCE
(1) Underlying (2) Domestic only
> Divisional EBITDA has decreased by $1.2m impacted by challenged Pizza Capers Brand System:• Geographic repositioning and
rationalisation of corporate outlets led to network contraction
• Focus on operational excellence, menu innovation and new target customer segments to drive enhanced performance
> Credible SSS/ATV metrics (+2.4%/+3.1) within highly competitive market disrupted by online delivery service providers, driven by:• Focus on operational excellence• Menu innovation and LTOs• Alignment with delivery aggregators• Disciplined pricing policies
1H17 1H18 % Change
Contribution to Group EBITDA(1) 11.9% 13.3%
EBITDA(1) $7.2m $6.0m (15.8%)
EBITDA CPO ($’000)(1) (2) 22.4 20.4 (8.9%)
Gross Franchise Revenue $10.7m $8.8m (17.6%)
Network Sales $94.3m $91.1m (3.4%)
For
per
sona
l use
onl
y

1H18 RESULTS PRESENTATION PAGE 17
INTERNATIONALHIGHLIGHTS• International EBITDA has decreased by $3.8m impacted by:
• Reduced margin reflecting investment in divisional capability and resourcing to service expanding network and realise growth opportunities
• Brief timing delay regarding conclusion of new international master license grants
• Entered into joint venture arrangements to accelerate Brand System expansion in the Gulf, and establish a world class coffee enterprise throughout the Middle East & North Africa (MENA) region
• Current global footprint: 84 territories across 12 Brand systems
Middle East JV and new licences granted across three brand systems
1H17 1H18 % Change
Revenue $12.3m $11.5m (6.5%)
EBITDA(1) $10.1m $6.3m (37.6%)
EBITDA Margin 82.1% 54.8%
(1) Underlying
Secured 2H18Secured 1H18For
per
sona
l use
onl
y

1H18 RESULTS PRESENTATION PAGE 18
1H18 COFFEE & ALLIEDBEVERAGE PERFORMANCE
(1) Underlying
> Divisional EBITDA decreased by $3.6m, influenced by: • Loss of margin in contract roasting sector on new customer
acquisition • Lower volumes on existing customer base impacted by
retail challenges• c.$2m non-recurring gains in 1H17 and losses on sale of
assets in 1H18• Growth in lower margin grocery/retail sales
> Recent restructure to reinvigorate performance:• Global Head of Coffee appointed• Refocused sales strategy and capability alignment
> Existing capsule business to be wound down:• Domestic capsule supply agreement not renewed (phase-
out period applies for existing customer commitments)• Professional machine program unsuccessful, significantly
impacted by technical/manufacturer issues• Future capsule strategy under review
1H17 1H18 % Change
Revenue $31.6m $32.4m 2.6%
EBITDA(1) $9.1m $5.5m (39.6%)
EBITDA Margin 28.8% 16.9%
Wholesale Coffee
For
per
sona
l use
onl
y

1H18 RESULTS PRESENTATION PAGE 19
COMMERCIALDIVISION PERFORMANCE> Divisional EBITDA performance reflects a full 6
months contribution from both the HPC and AFS acquisitions and is consistent with expectation
> Positive outcomes driven by investment in sales & management capability
• +9.5% increase in foodservice customers since 30 June 2017
• Dairy Country throughput bolstered by new business secured, largely commencing 2H18
• New customer acquisition and product innovation driving Bakery Fresh throughput
> Procurement division resourcing and capability strengthened
• Focused on delivering positive supply-chain outcomes for franchise network
1H17(2) 1H18 % ChangeRevenue
Foodservice $13.9m $42.2m 204.2%
Dairy Country $16.1m $30.4m 88.3%
Bakery Fresh $4.0m $8.1m 101.8%
TOTAL $34.0m $80.7m 137.1%
Gross Margin %
Foodservice 18.4% 20.7%
Dairy Country 30.1% 28.3%
Bakery Fresh 8.8% 10.5%
TOTAL 22.8% 22.6%
EBITDA(1)
Foodservice $0.2m $1.8m 666.2%
Dairy Country $3.3m $4.2m 26.6%
Bakery Fresh $0.2m $1.2m 467.0%
TOTAL $3.7m $7.2m 94.6%
Throughput
Dairy Country 7.4m kg 12.4m kg 67.6%
Bakery Fresh c.1.1m kg c.2.3m kg 109.1%
(1) Underlying (2) Businesses acquired September 2016
For
per
sona
l use
onl
y

STRATEGIC RESET
For
per
sona
l use
onl
y

CHALLENGES RESULTED IN STRATEGIC REVIEW
> Challenging retail conditions• Domestic retail expenditure flat –
FMCG particularly hard hit• Inflationary cost pressures for small
business rising:• Landlord rents• Labour costs• Electricity
• Intense competition, particularly inshopping centres
• Evolving consumer trends• Market disruptors (e.g. delivery
aggregators)
1H18 RESULTS PRESENTATION PAGE 21
Macro retail challenges
> Rapid growth via acquisition led to: • Increased franchise network• New market segments • Distraction from underlying business
operations• Increasingly complex business model
> Contributed to significant increase in head office and shared service resource, diminishing organisational effectiveness
Internal environment
> Surveyed franchise network - consistent feedback on rising costs and support structures
> Commissioned business-wide review focused on: • Franchisee network sustainability and
enhancement of franchise investment proposition
• Internal capability and resource alignment
• Simplification of operating model • Realising organic growth opportunities
> Implementation of recommendations underway
RFG’s three phase response: Assist, Integrate, Optimise
For
per
sona
l use
onl
y

ASSIST
1H18 RESULTS PRESENTATION PAGE 22
1ASSIST: FRANCHISEE FOCUS
> Improving relationships and support for franchisees, while increasing revenues, reducing costs and driving regulatory compliance
> Underlying franchise model sound, albeit subject to challenges
> Delivering increased value to franchisees:
• Targeted initiatives to improve franchisee sustainability
• Driving revenue and reducing COGs
• Enhanced Field Service support model
• c.$1.5m investment to bolster capability
• Using consumer insights and data to underpin marketing and innovation strategy
• Improving renewal proposition
SUSTAINABILITY
> Revenue> COGs> Rent> Labour> Utilities> Fees
> Customer centricity
> Marketing effectiveness
> Product and pricing
> In store support> Quality service> Training> Procurement
and supply chain
SUPPORT MARKETING
For
per
sona
l use
onl
y

MAPPING NETWORK SUSTAINABILITY: APPROACH AND FINDINGS
> Revenue and Average Weekly Sales – to determine trends in sales and customer traffic
> COGs – to assess financial impact
> Rent – as a key financial indicator of site sustainability
> Labour expenditure
> Lease expiry dates
> Shopping centre performance – MAT, GLA and Foot Traffic
1H18 RESULTS PRESENTATION PAGE 23
Quantitative assessment of sustainability
> Operational performance and compliance
> Field service site assessments –customer service, store cleanliness and operational capability
> Overall site potential and location
Qualitative assessmentundertaken
> Review determined c.160-200 domestic outlets unsustainable on long-term basis• Majority impacted by landlord/site
factors• Approximately one-third represent
corporate sites
> Subject to moderation of landlord rental requirements, by end FY19 identified outlets to close or lease renewal not sought• RFG to work alongside stakeholders• Franchisee first focus
> Support structure refocused on stronger resultant network population
Findings from network review
For
per
sona
l use
onl
y

RFG vs Industry*
*Source: FRANdata 2018
RFG vs Industry*
1H18 RESULTS PRESENTATION PAGE 24
> Driving initiatives which lower store establishment, refurbishment and upgrade costs
> Refurbishments subject to individual site circumstances
> Average FY17 refurbishment costs c.$69K(1)
FRANCHISEE FEES & COSTS vs INDUSTRY
(1) Average FY17 refurbishment costs across Michel’s Donut King, Brumby’s, Gloria Jeans
INDUSTRY MAXIMUM
INDUSTRY AVERAGE
RFG
For
per
sona
l use
onl
y

INTEGRATE
1H18 RESULTS PRESENTATION PAGE 25
2ENHANCED STRUCTURE
> Enhancing organisational capability and better integrating head office and support infrastructure
> Enhancing integration of head office and support structures• Improved alignment with core revenue drivers• c.$10m annualised operational savings targeted
• c.$4.8m realised to date (full impact FY19)
• Further efficiencies programed 2H18
> Enhancing wage entitlement compliance framework• Refining existing procedures and activities• Bolstering resources
> Strengthening executive management complement• Appointment of:
• Chief Executive – Australia, Richard Hinson• Global Head of Coffee, Darren DenchF
or p
erso
nal u
se o
nly

OPTIMISE
1H18 RESULTS PRESENTATION PAGE 26
3SIMPLIFIED BUSINESS MODEL
> Focus on simplification of business model and driving optimisation of shareholder value from core pursuits
> Reducing complexity within existing business model• Enhancing integration amongst key business drivers, including
procurement and supply-chain• Extracting process and procedural efficiencies• Removing ineffective or non-core overheads and investment• Broader brand strategy and portfolio review
> Better leveraging diversified growth platform
> Focusing resources on key growth drivers
> Domestic outlet network analysis complete
For
per
sona
l use
onl
y

WAGE COMPLIANCE AND MONITORING
1H18 RESULTS PRESENTATION PAGE 27
> Strong advocates of training and educational support• Partnership with National Retail Association (NRA)
• Launched RFG/NRA Foundations program in 2016 to provide regular training sessions, webinars, online resource portal, workplace relations & legal advice, employment tools & national toll free workplace advice hotline
> Proactive and regular communications to franchise network regarding Fair Work obligations, available support & RFG initiated wage entitlement compliance activities
> Established and implemented Wage Entitlement Audit Framework
HISTORICAL
> Further refinement and enhancement of wage entitlement compliance framework• Bolstering wage compliance capabilities
• Increasing internal wage compliance audit team• Embedding wage compliance monitoring and employee
engagement process in new Field Service model• Refining audit initiation risk indicators• Enhancing franchisee employee engagement
> Ongoing engagement with NRA and Deloitte on compliance and regulation benchmarks
CURRENT & FUTURE STATE
For
per
sona
l use
onl
y

Outlook
1H18 RESULTS PRESENTATION PAGE 28
> RFG remains confident in the strength of its underlying business operations and ability to support brand systems and franchisees
> Expediting business-wide review and fast-tracking outcomes
• Includes broader brand strategy and portfolio review
• Ongoing structural improvements to enhance business model
> No full-year guidance provided
> The Company will keep the market informed on developments
For
per
sona
l use
onl
y

APPENDICES
For
per
sona
l use
onl
y

CAPITAL MANAGEMENT
1H18 RESULTS PRESENTATION PAGE 30
Shares Price Proceeds/Value ($m)
Shares on Issue 1 July 2017 176,736,066
Dividend Reinvestment Plan 1,015,648 $4.47 $4.5m
Dividend Reinvestment Plan Shortfall Placement 4,993,796 $4.40 $22.0m
Shares on issue 31 December 2017 182,745,510
Share value(1) $26.5m
(1) Before share issue costs & associated expenses of $0.3m
For
per
sona
l use
onl
y

DEFINITIONS
1H18 RESULTS PRESENTATION PAGE 31
ATV Average Transaction Value
BCD BAKERY/CAFÉ DIVISION: Donut King, Michel’s Patisserie, Brumby’s Bakery
C&AB COFFEE & ALLIED BEVERAGE: Franchise supply; specialty roasting; in-home/grocery; contract roasting
CRD COFFEE RETAIL DIVISION: Gloria Jean’s, Café2U, The Coffee Guy, It’s A Grind, bb’s Café, Esquires Coffee
COGs Cost of Goods Sold
COMMERCIAL Hudson Pacific Foodservice, Associated Foodservice, Bakery Fresh, Dairy Country
CPO Contribution Per Outlet (EBITDA)
GLA Gross Lettable Area
GFR Gross Franchise Revenue
JV Joint Venture
MAT Moving Annual Turnover
MOBILE Café2U, The Coffee Guy
NWS Network Sales
PCP Previous Corresponding Period
QSR QSR DIVISION: Crust Gourmet Pizza Bar, Pizza Capers
SSS Same Store Sales
For
per
sona
l use
onl
y

NO RESPONSIBILITY FORCONTENTS OF PRESENTATION:
To the maximum extent permitted by law, RFG, its related bodies corporate and their respective directors, officers, employees, agents, advisers & representatives:
• Make no representation, warranty or undertaking, & accept no responsibility or liability, express or implied, as to the adequacy, accuracy, completeness or reasonableness of this Presentation or any other written or verbal communication transmitted or made available to any recipient hereof;
• Make no representation, warranty or undertaking, express or implied, in connection with the existing or potential turnover or financial viability ofany particular existing or potential Donut King, Michel’s Patisserie, Brumby’s Bakery, bb’s café, Esquires Coffee, Gloria Jean’s Coffee, It’s A Grind, Cafe2U, The Coffee Guy, Pizza Capers Gourmet Kitchen or Crust Gourmet Pizza Bar outlet. Interested parties (including franchisees & potential franchisees) must make their own investigations & satisfy themselves as to the existing or potential turnover or financial viability of any existing or potential outlet as aforesaid (as the case may be) on the basis of their own investigations & independent legal, financial & commercial advice; &
• Accept no responsibility for any errors in, or omissions from, this Presentation, whether arising out of negligence or otherwise.
ACCURACY OFPROJECTIONS & FORECASTS:
This Presentation includes certain statements including but not limited to, opinions, estimates, projections, guidance & forward looking statements with respect to future earnings and performance of RFG as well as statements regarding RFG’s plans, strategies and the development of the market. Forward-looking statements include those containing words such as: ‘anticipate’, ‘believe’, ‘expect’, ‘project’, ‘forecast’, ‘estimate’, ‘likely’, ‘intend’, ‘should’, ‘could’, ‘may’, ‘target’, ‘plan’, ‘consider’, ‘foresee’, ‘aim’, ‘will’ and other similar expressions. These statements are not guarantees of future performance and are based on, & are made subject to, certain assumptions and contingencies which may not prove to be correct or appropriate. Actual results, performance or achievements may be materially affected by changes in economic & other circumstances which may be beyond the control of RFG. Readers are cautioned not to put undue reliance on forward- looking statements. Except to the extent implied by law, no representations or warranties are made by RFG, its related bodies corporate and their respective directors, officers, employees, agents, advisers and representatives that any projection, forecast, calculation, forward-looking statement, assumption or estimate contained in this Presentation should or will be achieved or that actual outcomes will not differ materially from any forward-looking statements. The forward-looking statements are based on information available to RFG as at the date of this Presentation. Except as required by law, RFG undertakes no obligation to publicly update or review any forward-looking statements, whether as a result of new information, future events or results or otherwise.
NO OFFER TO SELLOR INVITATION TO BUY:
This Presentation does not, & should not be considered to, constitute or form part of any offer to sell, or solicitation of an offer to buy, any shares in RFG in any jurisdiction, & no part of this Presentation forms the basis of any contract or commitment whatsoever with any person.
Distribution of this Presentation in or from certain jurisdictions may be restricted or prohibited by law. Recipients must inform themselves of & comply with all restrictions or prohibitions in such jurisdictions.
Nothing in this Presentation is intended to be relied upon as advice to investors or potential investors, who should consider seeking independent professional advice depending upon their specific investment objectives, financial situation or particular needs.
This Presentation contains summary information about the current activities of Retail Food Group Limited ACN 106 840 082 (RFG) and its subsidiaries as at the date of this Presentation, unless otherwise stated. The information in this Presentation is of a general nature and does not purport to contain all the information that a prospective investor may require in evaluating a possible investment. It should be read in conjunction with RFG’s other periodic and continuous disclosure announcements lodged with the Australian Securities Exchange, which are available at www.asx.com.au.
DISCLAIMER
For
per
sona
l use
onl
y