for personal use only - · pdf filethe deployment of four (4) ... was completed within the...
TRANSCRIPT
ABN 98 153 219 848
A N N U A L R E P O R T
For the year e nded 30 J une 2017
F
or p
erso
nal u
se o
nly

1
C O R P O R A T E D I R E C T O R Y
DIRECTORS Executive Director Mr Anthony Ho Executive Director Mr Michael Lynn Non-Executive Director Mr Suryandy Jahja REGISTERED OFFICE 79 Broadway NEDLANDS WA 6009 Telephone: (61 8) 6389 2688 Facsimile: (61 8) 6389 2588 PRINCIPAL PLACE OF BUSINESS 15 McCabe Street NORTH FREMANTLE WA 6159 Telephone: (61 8) 9389 8880 Facsimile: (61 8) 9389 8890 Email: [email protected] Website: www.newfieldresources.com.au AUDITOR BDO Audit (WA) Pty Ltd 38 Station Street SUBIACO WA 6008 BANKER National Australia Bank 1297 Hay Street WEST PERTH WA 6005
COMPANY SECRETARY Mr Kim Hogg SHARE REGISTRY Advanced Share Registry Limited 110 Stirling Highway NEDLANDS WA 6009 PO Box 1156 NEDLANDS WA 6909 Telephone: +61 8 9389 8033 Facsimile: +61 8 9262 3723 SOLICITOR Steinepreis Paganin Level 4, The Read Buildings 16 Milligan Street PERTH WA 6000 STOCK EXCHANGE ASX Limited Central Park 152-158 St George Terrace PERTH WA 6000 ASX Code: NWF
For
per
sona
l use
onl
y

2
C O N T E N T S
PAGE
Corporate Directory 1
Review of Activities 3
Directors' Report 28
Financial Statements 37
Directors' Declaration 65
Independent Auditor’s Report 66
Auditor’s Independence Declaration 70
Additional Information 71
Summary of Tenements 73
For
per
sona
l use
onl
y

3
R E V I E W O F A C T I V I T I E S
ALLOTROPES DIAMOND PROJECT – SIERRA LEONE (NEWFIELD 100%)
Newfield Resources Limited (“Newfield” or the “Company”) was active in all five of its exploration licences covering 1,002 km
2 of tenement holdings within the Bo, Bonthe, Moyamba,
Pujehun and Kenema Districts in the Southern Province of Sierra Leone (Figure 1). Alluvial exploration activities for the year saw the completion of various projects:
A Maiden JORC-compliant Diamond Resource statement for the Gboyeiya Alluvial Project, which lies within EL 15/2012 on the Sewa River south-bank. The average diamond size is significantly larger (0.66 carats per stone) than that recovered from trial-mining at the Golu Small-scale mining licence (0.33 carats per stone).
The deployment of four (4) new owner-built and operated suction dredge units to the Gbinima Project area, within EL 15/2012, where spectacular screened-grades were reported from localised trap-sites. The average recovered stone size currently is 0.96 cts/stn.
The completion of surface mapping exercises with associated pitting/trenching programmes in EL12/2014, EL 15/2012 and EL 19/2014.
Various auger drilling campaigns within EL15/2012 to determine gravel distribution were completed.
Terrace and river flat gravels from the Mamajo and Mokondo areas within EL12/2014 were bulk sampled.
An experimental ground penetrating radar (GPR) survey over lower terrace/river flat deposits was successfully concluded at the Hima-Mano Project in EL 19/2014.
The Company’s new 10 ton per hour (tph) DMS processing plant which arrived from South Africa in November 2016, was commissioned at the Sumbuya locality in EL 12/2014. The plant was acquired to service the requirements of alluvial bulk-sampling in the southern-most licences.
Regarding kimberlite exploration activities for the year, the following was conducted:
Follow-up ground-magnetometry (GM) and soil sampling anomalies generated by the 2016 airborne magnetometry (AM) survey were predominantly focused over three (3) licences, notably EL 11/2104, EL 12/2014 and EL 20/2014,
Three mega-GM surveys were completed. The first was an orientation survey over the known kimberlites in the Lake Popei area of EL 11/2014, a second, called the Manowo survey, was completed within the Yambama and Lower Sama area (Dumo-Yamabye River catchments) of EL 12/2014 and a third covering the Kponima greater area within EL20/2014.
A 180-ton bulk-sample was taken from the Lake Popei kimberlite. A small number of macro-diamonds was recovered but the kimberlite is assessed to be sub-economic.
Ongoing diamond drilling of geophysical anomalies saw the completion of fifty-three (53) diamond drill holes, with a cumulative depth of 2,245m. No kimberlite has yet been intersected and all causative bodies have been resolved.
Figure 1. Status of Exploration Licence (EL) holdings, Sierra Leone.
For
per
sona
l use
onl
y
4
R E V I E W O F A C T I V I T I E S
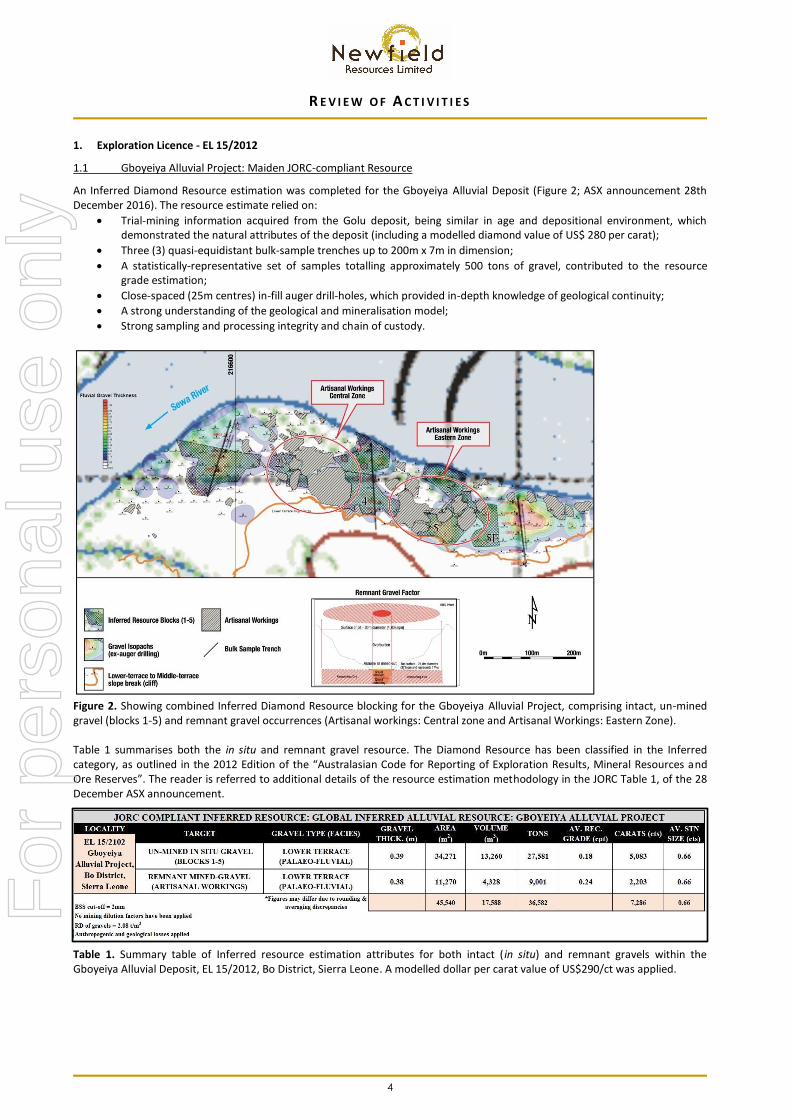
1. Exploration Licence - EL 15/2012
1.1 Gboyeiya Alluvial Project: Maiden JORC-compliant Resource
An Inferred Diamond Resource estimation was completed for the Gboyeiya Alluvial Deposit (Figure 2; ASX announcement 28th December 2016). The resource estimate relied on:
Trial-mining information acquired from the Golu deposit, being similar in age and depositional environment, which demonstrated the natural attributes of the deposit (including a modelled diamond value of US$ 280 per carat);
Three (3) quasi-equidistant bulk-sample trenches up to 200m x 7m in dimension;
A statistically-representative set of samples totalling approximately 500 tons of gravel, contributed to the resource grade estimation;
Close-spaced (25m centres) in-fill auger drill-holes, which provided in-depth knowledge of geological continuity;
A strong understanding of the geological and mineralisation model;
Strong sampling and processing integrity and chain of custody.
Figure 2. Showing combined Inferred Diamond Resource blocking for the Gboyeiya Alluvial Project, comprising intact, un-mined gravel (blocks 1-5) and remnant gravel occurrences (Artisanal workings: Central zone and Artisanal Workings: Eastern Zone). Table 1 summarises both the in situ and remnant gravel resource. The Diamond Resource has been classified in the Inferred category, as outlined in the 2012 Edition of the “Australasian Code for Reporting of Exploration Results, Mineral Resources and Ore Reserves”. The reader is referred to additional details of the resource estimation methodology in the JORC Table 1, of the 28 December ASX announcement.
Table 1. Summary table of Inferred resource estimation attributes for both intact (in situ) and remnant gravels within the Gboyeiya Alluvial Deposit, EL 15/2012, Bo District, Sierra Leone. A modelled dollar per carat value of US$290/ct was applied.
For
per
sona
l use
onl
y

5
R E V I E W O F A C T I V I T I E S
1.2 Dredging Activities
In May 2016, the Company commenced its inaugural dredge exploration activities in the Sewa River adjacent to the village of Gbinima (Figure 3). Initial results were encouraging, with large average stone sizes being recovered (range of 0.85-1.2 carats per stone), as well as batch grades in the range of 60-150 cpht from in situ basal gravels. To date, a total of four (4) dredges have been deployed to the Gbinima Dredging Project, which continues to deliver an exceptional average stone size ranging between 0.84-0.89 carat per stone (cts/stn). In addition, some spectacular spot grades-up to 940 carats per hundred tons-having been achieved, from selected trap sites. This essentially, ‘wet-mining’ prospecting method (of a submerged dry-land target), will allow the Company to continue its dredging activities throughout the wet season, in spite of the seasonal rise in the Sewa River’s level.
Figure 3. Gbinima dredging Project, EL 15/2012 (above, at left and inset). The planned dredge sites (red diamonds at left) have been preferentially selected on the basis of the Sewa River bedrock topography (e.g. dolerite dyke, at left) and suspected gravel fill from historic bathymetric and ground penetrating radar (GPR) survey results. Current dredging activities shown in dashed red line.
1.3 Sejeye River and Kenyema Alluvial Program
The Sejeye River is an interpreted palaeo-course of the ancestral Sewa River (Figure 4). At its north-eastern reach, artisanal miners have been exploiting it for decades, for both diamonds and gold.
Figure 4. Planned dredge sites along the Sejeye River, EL 15/2102. Coloured polygons indicate major river drainage catchments
Big Pit Blue Water
Washehun
For
per
sona
l use
onl
y

6
R E V I E W O F A C T I V I T I E S
Whist there is substantial surface disturbance, it was believed that basal gravel remnants may be present at depth, as demonstrated by the presence of large, water-worn quartz boulders (Figure 4, inset). The Company selected three (3) preliminary dredge test-sites for possible ‘wet-mining’ prospecting in the flooded artisanal workings (cf. Figure 4). The sites were chosen after the completion of a mapping exercise Auger drilling, comprising fifteen (15) completed holes around the pit perimeters, show no further intact gravel. No further work is anticipated at this stage. 1.4 Komende-Buma Alluvial Project Reconnaissance mapping of the Komende-Buma alluvial terrace and Sewa River flats, just east of the Golu small-scale mining licence (Figure 5), was completed in preparation for an auger-drilling program. A total of 59 holes have now been completed. In addition, nine (9) observation pits were completed to provide a comparison of geology with drill logs, as did the mapping of accessible artisanal pits in the area. An average basal gravel thickness of 0.5m has been estimated. This program will assist in the location of any follow-up bulk-sample sites, should these initial results warrant it.
Figure 5. Above-showing geology and collar positions of auger drilling, Komende-Buma Alluvial Project, EL 15/2012. At top right, showing location of the Komende area, relative to the Sewa River. At lower-right, power-auger at work.
1.5 Ngayayama Field Mapping A detail field mapping exercise was conducted on the Ngayayma area on the Sewa River south bank (Figure 6). This mapping exercise targeted the extent of the Sewa river flats to establish the degree of artisanal mining and locate possible remnants.
Figure 6. Field observations from the Ngayayama alluvial flat, Sewa River. The intense artisanal mining within the river flats, suggest that gravels at depth are diamond-bearing. The typical sedimentary sequence is shown at right.
For
per
sona
l use
onl
y

7
R E V I E W O F A C T I V I T I E S
1.6 Kokoye River-A Sewa River Tributary? The Kokoye River is a sub-parallel south-bank tributary of the Sewa River for much of its course. Its diamondiferous mineralisation and more significantly, its clast assemblage is reminiscent of fluvial basal gravels that is typical of the Modern Sewa River . The Kokoye has been intensely mined for its diamonds by the artisanal sector for many years, which still continues today, but at a much lower intensity. The mapping exercise (Figure 7) delineated old and active artisanal workings, as well as established gravel type and distribution.
Figure 7. Kokoye surface mapping updated May 2107. The river is being investigated as a potential ‘wet-mining’ dredge target. Historic large average diamond sizes (c. 1ct/stn) have been recovered from alluvial gravels bearing a Sewa River signature (above).
1.7 Kimberlite Exploration Activities An extensive GM survey was completed around the village of Gboyeiya, to further detail targets identified during the 2016 AM survey (Figure 8). Additional activities in the year included soil sampling, surface geology mapping and delineation of artisanal workings. During August 2016, airborne magnetometry (AM) anomalies on the southern bank of the Sewa River, were investigated and sampled. A total of 185 loam samples were collected manually at 20m intervals, over these anomalies. All samples were hand-gravitated to recover sample concentrates for kimberlite indicator mineral (KIM) analysis at the MSA Group laboratory in South Africa.
Figure 8. Magnetic image showing results of a high-resolution GM survey conducted at the Gboyeiya locality, EL 15/2012 (at right). The GM survey blocks (above), has been superimposed on the 2016 AM survey (40m elevation) background (TMI).
For
per
sona
l use
onl
y

8
R E V I E W O F A C T I V I T I E S
2. Exploration Licence - EL 20/2014: Kponima GM survey and Diamond Drilling Program During the year, activities in this EL were predominantly focused on the kimberlite exploration program, which included KIM sampling and diamond drilling adjacent to the Noniyei Swamp, near the village of Kponima (Figure. 11). The swamp is aligned with an AM interpreted kimberlite dyke anomaly which lies on the Sierra Leone kimberlite emplacement trend. During the period, activities included a large GM survey (Figures 9 and 10), conducted in tandem with diamond-drilling, as reported in the September 2016 Quarterly Report to the ASX. A drill-fence, straddling the anomaly (Figure 11), was drilled to completion and no holes intersected kimberlite.
Figure 9. GM survey completed near the village of Kponima, over AM targets associated with historical diamond diggings, with no apparent fluvial association. Image shows detail of the survey, with superimposed geology and artisanal workings.
Figure 10. An extended GM survey was also completed near the village of Kponima (Kponima Extension Block). Image at left, shows details of the survey, with superimposed geology and artisanal workings. For comparative purposes, the details of the GMS shown in Fig. 9, lie within the red block
For
per
sona
l use
onl
y

9
R E V I E W O F A C T I V I T I E S
.
Figure 11. Details of the drill-fence over the linear anomaly (cf. Fig. 13). A total of seven (7) boreholes were completed (note individual depths). The causative body was identified as magnetically susceptible amphibolite. In addition to the drill fence across the anomaly, two (2) additional holes were drilled at right angles to this trend. These holes were completed in order to ascertain whether the dolerite dykes may be hosting kimberlites. Figure 11 shows the planned layout. In all, a total of 404.4m of drilling from nine (9) boreholes, was completed in EL 20/2014 for the period. No kimberlite was intersected. In July 2016, a sample consignment of heavy minerals collected from ongoing KIM soil-sampling activities in EL 20/2014, was submitted to the MSA laboratory in South Africa. However, no favourable KIMs were identified. A mega-GM survey was conducted in H1/2017 in EL 12/2014, which encroached into this EL. The results of this mega-survey are reported with the EL 12/2014 results. 3. Exploration Licence - EL 19/2014:
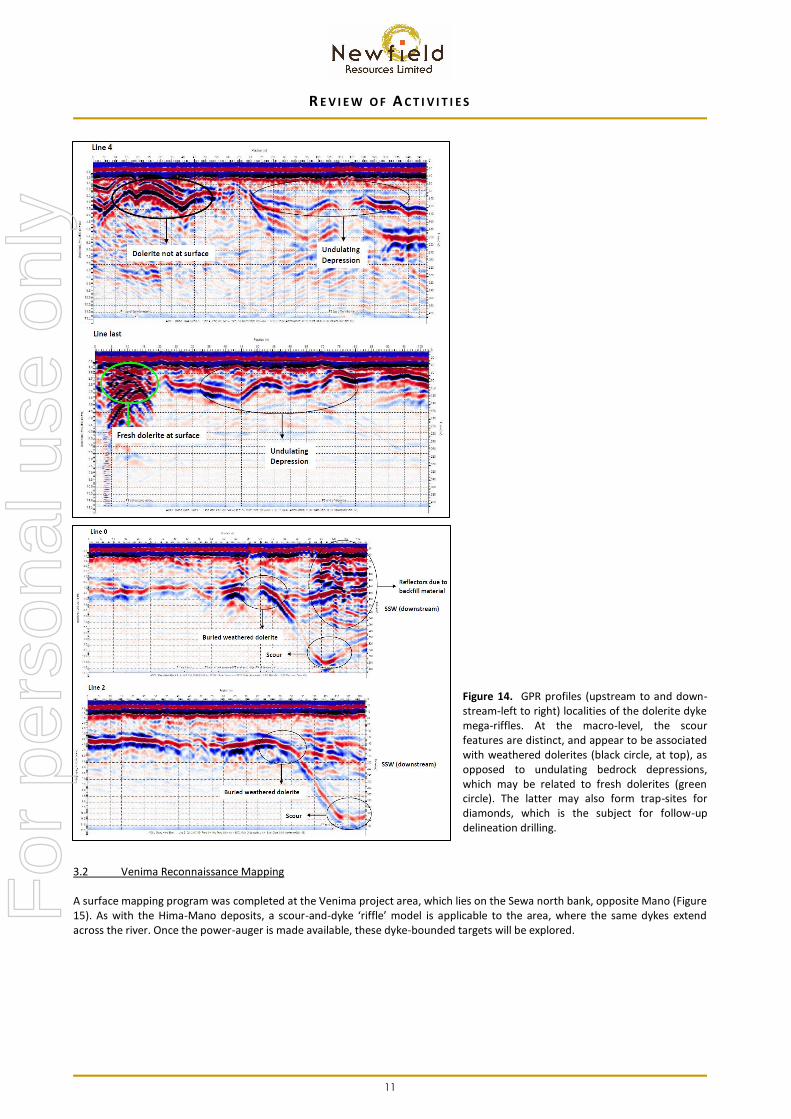
3.1 Hima-Mano Ground-penetrating Radar (GPR) Survey A 2016 bulk-sampling program in the Hima-Mano river flats, highlighted the importance of the dolerite riffle-and-scour depositional model for the Hima-Mano alluvial deposits (cf. Newfield Resource Ltd ASX Quarterly Report, 30 September 2016). A review of the proposed ground-penetrating radar (GPR) technique was completed with a Namibian-based consultant, Earth Maps Consulting, to assess the applicability of GPR in locating scour-features adjacent of dolerite dyke boundaries. The survey was conducted in March 2017 (Figure 12, Figure 13), where several test grids were surveyed, successfully locating two new scours (Figure 14). These features were ground-truthed (drilled-confirmed) with a motorised auger, validating the applicability of GPR within the Hima-Mano alluvial setting. The Hima-Mano alluvial exploration program has been put on hold until the next dry season.
For
per
sona
l use
onl
y

10
R E V I E W O F A C T I V I T I E S
Figure 12. Annotated Google Earth image showing the location of GPR survey blocks relative to previous bulk-sample localities (BLK09, BLK10) and auger holes (refer previous ASX announcements for information on bulk-sample results).
Figure 13. GPR survey in progress (deployment of 250 MHz GPR Antenna, at left; 100 MHz Antenna at right).
For
per
sona
l use
onl
y
11
R E V I E W O F A C T I V I T I E S
Figure 14. GPR profiles (upstream to and down-stream-left to right) localities of the dolerite dyke mega-riffles. At the macro-level, the scour features are distinct, and appear to be associated with weathered dolerites (black circle, at top), as opposed to undulating bedrock depressions, which may be related to fresh dolerites (green circle). The latter may also form trap-sites for diamonds, which is the subject for follow-up delineation drilling.
3.2 Venima Reconnaissance Mapping A surface mapping program was completed at the Venima project area, which lies on the Sewa north bank, opposite Mano (Figure 15). As with the Hima-Mano deposits, a scour-and-dyke ‘riffle’ model is applicable to the area, where the same dykes extend across the river. Once the power-auger is made available, these dyke-bounded targets will be explored.
For
per
sona
l use
onl
y

12
R E V I E W O F A C T I V I T I E S
Figure 15. Showing summary of field observations and proposed work planned for the Venima project area. Darker yellow polygons show extent of artisanal workings and light yellow demarcates the Sewa River alluvial flats. A new potential target situated at the Venima Project area, is the Mofindor Flats (Figure 16). The area comprises a virgin al luvial flat, nested amongst artisanal workings, and the area will be investigated further with a power-auger drilling campaign in the dry season. As with Hima-Mano, the Mofindor alluvial flats comprise deposits related to an ancestral Sewa River, which is time and depositional equivalent to the Hima-Mano deposits.
Figure 16. Showing geology and surface mapping conducted at the Mofindor Flat on the Venima terrace, lying just north-west of Mano on the Sewa north bank (true right-hand bank). The depositional and mineralisation model is thought to be identical to the Hima-Mano scour-and-dyke model. Image at right shows an abundance of rounded fluvial clasts.
For
per
sona
l use
onl
y

13
R E V I E W O F A C T I V I T I E S
3.3 Diamond Drilling Program During April 2017, five (5) holes were drilled over anomalies identified around the Kpatema and Kpumbu areas towards the SW boundary of EL 12/2014. A total of 192 m was completed. GM targets selected from an earlier survey flown by Allotropes in 201 6 (Figure 17), were drilled, intersecting no kimberlite. The GM anomalies were all resolved through drilling. In addition, a total of 16 soil samples were collected over selected GM targets from the surrounding artisanal workings.
Figure 17. At left-GMS coverage associated with AM geophysical anomalies (artisanal workings in blue dashed line-GMS blocks in red outline). Locality map at right, showing AM anomalies (inferred dolerite dykes in red). 4. Exploration Licence - EL 12/2014: Sumbuya Project
4.1 Momajo bulk-sampling and motorised-auger drilling program Surface mapping, exploratory pitting (42 pits) and motorised-auger drilling (7 holes), were undertaken to delineate the high-level Mamajo terrace. Following this, a bulk sample of some 900 tons from this large terrace was tested (Figure 18). The results showed that whilst these high-level gravels are mineralized, the diamond grade is low at 1.50 cpht with a small average stone size of 0.24 carats per stone. It thus assumed that other terraces of similar age and depositional character farther downstream, such as those at the Lake Popei kimberlite dyke, are likewise poorly mineralised.
Figure 18. Image depicting bulk-sampling positions (trench [red] and pits [green], inset) at the Momajo alluvial fluvial high-terrace locality, EL 12/2014. The terrace is relatively extensive and its edge has been mapped-out (orange line). Reconnaissance mapping conducted adjacent to the Momajo Village, is also depicted.
For
per
sona
l use
onl
y

14
170
000
R E V I E W O F A C T I V I T I E S
4.2 Mokombo-Pongolo Alluvial Program-Sumbuya Project Due to the 2016 wet season, much of the work associated with the low-lying fluvial terraces was limited, or put on hold. However, the fluvial high-level Pongolo Terrace remained accessible, and delineation-mapping (terrace edge, artisanal excavations and outcrop) of this down-wasted fluvial deposit was completed (Figure 19). The flank of this terrace, comprises a thick colluvium of texturally-mature fluvial clasts, which has been subjected to intermittent artisanal working over the years. Nonetheless, this terrace has been identified as a target, given the significant extent of in situ remnants. Bulk sampling sites are currently being planned, and the first of these excavations should commence toward the end of H2, 2017.
Figure 19. The Pongolo Terrace Alluvial Project, Sumbuya locality, EL 12/2014. The yellow hatching denotes the extent and distribution of the terrace colluvium, which has been intermittently worked by artisanal miners. The colluvium contains an inherited texturally-mature clast assemblage (inset), denoting the probable down-wasting of an older fluvial deposit. In addition, reconnaissance mapping of the lower terrace/river flat, comprising the Mokombo-Pongolo point-bar, was completed (Figure 20). This terrace has similar geological similarities to the Golu lower terrace.
Figure 20. The lower terrace occurrence of the Mokombo-Pongolo Terrace deposits, Sumbuya locality, EL 12/2014. The yellow polygon denotes the extent and distribution of the fluvial terrace, with respect to the higher-elevation colluvium (cf. Figure 14), which has been intermittently worked by artisanal miners.
For
per
sona
l use
onl
y

15
R E V I E W O F A C T I V I T I E S
4.3 Kamasu Alluvial Project The Kamasu Alluvial Project is located North of Sumbuya Town and on the west-bank of the Sewa River. An initial mapping exercise identified two fluvial terraces, comprising three (3) gravel sequences (Figure 21):
River flat gravel (fluvial gravel).
Colluvial gravel 1 (in situ down-wasted terrace gravels)).
Colluvial gravel 2 (redistributed terrace gravels) Mapping of the terrace edges coincided with the 50m (lower terrace) and 100m (upper terrace) contour intervals, and artisanal diggings show that the gravel sequences are diamond-bearing. Tributaries of the Sewa River also support intense artisanal activity, with the Yanoi River being the most productive.
Figure 21. Kamasu Terrace locality-EL 12/2014 (at right, after Hall, PK., 1972), showing geology of mapped area and fluvial terrace outlines. (The western boundary of the EL is shown as black and red lines respectively, on the maps). 4.4 Tima Island-Kamasu Alluvial Project Lying within the Sewa River, the adjacent Tima Island was also mapped in the period (Figure 22). This island is the site of extensive artisanal activity and mapping showed that gravel remnants are present, but their development is thin and sporadically distributed. No further work on this island is required.
Figure 22. Tima Island locality, adjacent to the Kamasu Terrace locality, showing mapped area (at left) and current artisanal activity (top).
For
per
sona
l use
onl
y
16
846000
17
00
0
0
R E V I E W O F A C T I V I T I E S
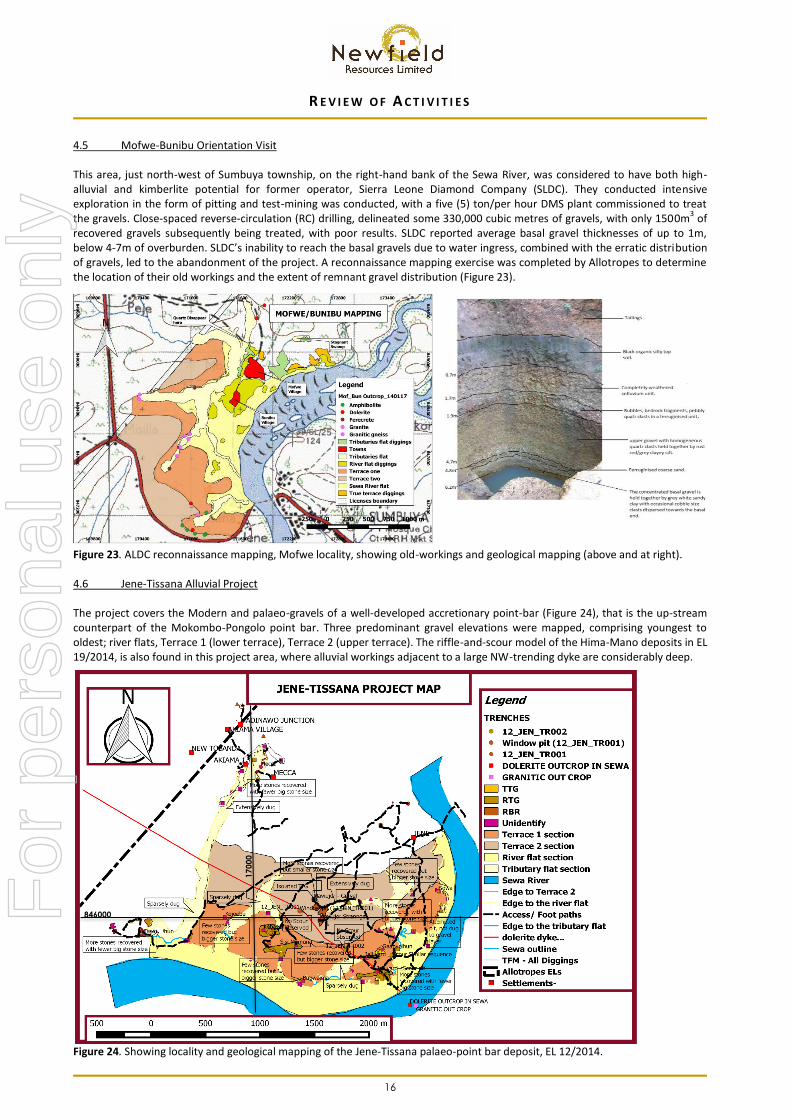
4.5 Mofwe-Bunibu Orientation Visit This area, just north-west of Sumbuya township, on the right-hand bank of the Sewa River, was considered to have both high-alluvial and kimberlite potential for former operator, Sierra Leone Diamond Company (SLDC). They conducted intensive exploration in the form of pitting and test-mining was conducted, with a five (5) ton/per hour DMS plant commissioned to treat the gravels. Close-spaced reverse-circulation (RC) drilling, delineated some 330,000 cubic metres of gravels, with only 1500m
3 of
recovered gravels subsequently being treated, with poor results. SLDC reported average basal gravel thicknesses of up to 1m, below 4-7m of overburden. SLDC’s inability to reach the basal gravels due to water ingress, combined with the erratic distribution of gravels, led to the abandonment of the project. A reconnaissance mapping exercise was completed by Allotropes to determine the location of their old workings and the extent of remnant gravel distribution (Figure 23).
Figure 23. ALDC reconnaissance mapping, Mofwe locality, showing old-workings and geological mapping (above and at right). 4.6 Jene-Tissana Alluvial Project The project covers the Modern and palaeo-gravels of a well-developed accretionary point-bar (Figure 24), that is the up-stream counterpart of the Mokombo-Pongolo point bar. Three predominant gravel elevations were mapped, comprising youngest to oldest; river flats, Terrace 1 (lower terrace), Terrace 2 (upper terrace). The riffle-and-scour model of the Hima-Mano deposits in EL 19/2014, is also found in this project area, where alluvial workings adjacent to a large NW-trending dyke are considerably deep.
Figure 24. Showing locality and geological mapping of the Jene-Tissana palaeo-point bar deposit, EL 12/2014.
For
per
sona
l use
onl
y

17
R E V I E W O F A C T I V I T I E S
4.7 Kimberlite Exploration Program Reconnaissance mapping of artisanal workings and reconnaissance soil-sampling for KIMs, was conducted within the EL during Q4 2016. In addition, several high-priority magnetic anomalies were investigated, adjacent to the village of Tawamaehun, just south of Sumbuya. Kimberlitic ilmenite was confirmed in this area from samples submitted to MSA in South Africa, and this supports results reported by previous operator SLDC, who also reported probe-positive kimberlitic ilmenites from this locality. It is pertinent to note that historic alluvial diamond diggings occur some 150m away from this anomaly. Thus, several ground-magnetometry (GM) blocks have been designed for follow up geophysical surveying within the EL (Figure 25).
Figure 25. An example of follow-up GM survey coverage completed over the period (inset) in EL 12/2014. The image shows detail in an area adjacent to AM dyke targets near the village of Tawamahehun (ALD046). Background is the analytical signal plot from the 2016 AM survey.
Sampling near the village of Yambama on the Dumbo River (Figure 26) reported indicator minerals which repeated results observed from reconnaissance pitting undertaken in 2015. These grains occurred in both the -2mm and +2mm fractions (Figure 27), complementing historical KIM results reported by previous explorer SLDC.
Figure 26. Map showing pits with ilmenite with visual KIM leucoxene and garnet locations, near the Dumbo River/Sewa confluence, EL 12/2014. These KIMs were recently confirmed as probe-positive from a reputable South African laboratory.
For
per
sona
l use
onl
y

18
EL 20/2014
EL 12/2014
R E V I E W O F A C T I V I T I E S
Figure 27. Numerous leucoxene coated ilmenites from -2mm (sample references: TYPT-088 (left) and TYPT- 095, at right). Microprobe results show the grains to be kimberlitic. A ground magnetic ‘mega-block’ survey (the Manowo mega-survey), was completed over the interfluve between the Dumbo and Yambaye Rivers (Figure 28), to identify possible sources of these indicator minerals. Artisanal diamond diggings in the vicinity, have angular bedrock fragments with no rounded fluvial pebbles, indicating that the grains are not of alluvial derivation.
Figure 28. Manowo mega-block GM survey, EL 12/2014. Smaller and earlier GM surveys shown as small red blocks. The data is currently being analysed for suitable drilling targets.
For
per
sona
l use
onl
y

19
R E V I E W O F A C T I V I T I E S
4.8 Diamond Drilling A total of three (3) boreholes were completed within the EL in the review period. These were drilled over the Lake Fula trench and Largo diggings for a total 135.7m completed (Figure 29). No kimberlite was intersected and all causative bodies resolved.
Figure 29. Locality map showing completed diamond drill boreholes in review period for EL 12/2104.
5. Exploration Licence - EL 11/2014: Alluvial and Kimberlite Exploration Program
5.1 Lake Popei High-level Alluvial Terrace Limited alluvial exploration was conducted within the EL in the period, as exploration activities centred on the kimberlite exploration program. However, a small working located at UTM29S 17895E: 827348N, comprising a fluvial high-level terrace adjacent to the Lake Popei kimberlite dyke (Figure 30), was mapped to ascertain any similarities in sedimentary architecture and elevation (erosion level), to the fluvial gravels delineated at the Momajo Terrace in EL 12/2104. It is uncertain whether the diamond content of these Lake Popei gravels bears any relationship to the nearby kimberlite dyke.
Figure 30. Showing artisanal excavation of fluvial terrace gravels adjacent to the Lake Popei kimberlite dyke, with detail of quartz-pebble conglomerate, at right.
For
per
sona
l use
onl
y

20
R E V I E W O F A C T I V I T I E S
5.2 Lake Popei Kimberlite Program A reconnaissance/calibrating mega-ground magnetometry (GM) survey was conducted over the latter part of FY2016 (Figure 31). Overseen by an experienced geophysical consultant, the Lake Popei Block survey was designed to cover all known high-interest AM anomalies in the EL, including the strike extension to the original dyke discovery (referred to as the Lake Popei Extension Survey). A first-pass plot (1VD) of the mega-block GM survey is shown in Figure 32. A GM survey was separately conducted over the Barle diggings to the east of the original dyke exposures, which aimed to generate new kimberlites targets as well as provide a geophysical trace of the eastern extent of the Lake Popei kimberlites (e.g. POD002). This survey was later extended SW, to merge with the Lake Popei Mega-block GM survey (cf. Figure 32).
Figure 31. Reference map showing Lake Popei kimberlite dyke targets and nomenclature, EL 11/2014. The original dyke discovery is situated between the blue crosses (POD001). The GMS blocks are red polygons. Drill-hole collars are denoted by green crosses. The detail of the mega-block is shown in Figure 32.
For
per
sona
l use
onl
y

21
Barle GM survey
Lake Popei mega-blco GM survey
R E V I E W O F A C T I V I T I E S
Figure 32. First-pass image (1VD) of the results of the ‘Lake Popei mega-block GM survey’, EL 11/2014. The Lake Popei kimberlite sits within the magnetically quieter background. POD001 (image centre), refers to the original Lake Popei kimberlite dyke discovery. The Barle survey to the east, was later merged with the Lake Popei mega-survey. Based on the GM survey results, there is little to suggest that the Lake Popei kimberlites extend as far as Barle, and the dyke seems limited in extent to a total strike length of c.3.6 km, which approximately coincides with the length of the soil sampling mineral train. To date, there have been no other targets indicative of kimberlite emplacement on the Lake Popei dyke trend, and the area is now considered to un-prospective in this regard. In addition to the Lake Popei mega-GMS survey, an additional 84 l/km was surveyed over the SEP074 AM anomaly, on the northern border of the EL. On the basis of this survey, a single drill hole was sited (cf. Figure 31, top of image). 5.2.1 Soil-sampling. A heavy minerals consignment sent to the MSA laboratories in South Africa returned probe-positive kimberlitic ilmenites for soil samples recovered from AM interpreted anomalies adjacent to the known Lake Popei kimberlite. In addition, KIMs were recovered from soil samples collected from directly over the Lake Popei kimberlite. These samples were included in the consignment to act as a sample-standard, and to test the efficacy of the other field sampling and laboratory results. A total of thirty-three (33) stream sediment samples, as well as two-hundred and twenty-six (226) soil samples were collected from the EL in the period under review. These samples were shipped to a reputable laboratory in South Africa for analysis. Forty-two (42) of the samples returned positive KIM indicators (Table 2). F
or p
erso
nal u
se o
nly

22
R E V I E W O F A C T I V I T I E S
Table 2. Summary of positive soil samples (KIM ilmenites) collected from EL 11/2014 and analysed in a reputable laboratory in South Africa. 5.2.2 Trenching A single observation trench of c.20m x 6m x 3m dimensions (Figure 33), was excavated in the period, over a probe-positive KIM soil sample recovered from AM anomaly POD011. The trench exposed a thin dolerite/diabase dyke, which was assumed to be a causative body of the GM anomaly. Whilst the GM anomaly has been resolved, the source of the indicators recovered from the overlying soil-samples is yet to be resolved.
SampleID Y_PROJ X_PROJ Locality Locations SampleType AnomalyID EL's Number Visual IL
POD011-15 827638 178601 Manjama Slope Soil POD004 EL11-2014 1
POD011-16 827659 178601 Manjama Flat Soil POD009 EL11-2014 1
POD011-17 827462 178700 Manjama Flat Soil POD009 EL11-2014 1
POD011-18 827480 178700 Manjama Slope Soil POD009 EL11-2014 1
POD011-19 827500 178699 Manjama Slope Soil POD011 EL11-2014 1
POD011-20 827521 178701 Manjama Swamp Stream POD013 EL11-2014 1
POD011-21 827539 178701 Manjama Flat Soil POD014 EL11-2014 1
POD011-22 827560 178699 Manjama Swamp Stream POD002 EL11-2014 2
POD011-23 827580 178699 Manjama Swamp Stream POD002 EL11-2014 2
POD011-24 827601 178700 Manjama Slope Soil POD004 EL11-2014 2
POD011-25 827620 178700 Manjama Flat Soil POD009 EL11-2014 2
POD011-26 827638 178700 Manjama Valley Soil POD009 EL11-2014 2
POD011-27 827659 178700 Manjama Crest Soil POD010 EL11-2014 2
POD011-28 827571 178701 Manjama Flat Soil POD014 EL11-2014 2
POD013-02 827684 176200 Moya Flat Soil POD014 EL11-2014 3
POD013-03 827445 175753 Moya Flat Soil POD014 EL11-2014 3
POD013-04 827650 175600 Moyia Hill Crest Soil POD011 EL11-2014 4
POD013-05 827670 175599 Moyia Flat Soil POD014 EL11-2014 4
POD013-06 827689 175600 Moyia Slope Soil POD011 EL11-2014 5
POD013-07 827710 175600 Moyia Slope Soil POD011 EL11-2014 5
POD013-08 827731 175600 Moyia Flat Soil POD014 EL11-2014 5
POD013-09 827750 175600 Moyia Flat Soil POD014 EL11-2014 5
POD013-10 827771 175600 Moyia Hill Crest Soil POD011 EL11-2014 6
POD013-11 827790 175601 Moyia Hill Crest Soil POD011 EL11-2014 6
POD013-12 827810 175600 Moyia Crest Soil POD010 EL11-2014 7
POD013-13 827830 175600 Moyia Hill Crest Soil POD011 EL11-2014 7
POD013-14 827850 175600 Moyia Hill Crest Soil POD011 EL11-2014 7
POD014-04 827301 177190 Moyawo Slope Soil POD011 EL11-2014 7
POD014-05 827320 177190 Moyawo Hill Crest Soil POD011 EL11-2014 9
POD014-06 827340 177190 Moyawo Hill Crest Soil POD011 EL11-2014 10
POD014-07 827360 177190 Moyawo Slope Soil POD011 EL11-2014 10
POD014-08 827380 177190 Moyawo Slope Soil POD011 EL11-2014 12
POD014-09 827400 177190 Moyawo Slope Soil POD011 EL11-2014 12
POD014-10 827421 177190 Moyawo Slope Soil POD011 EL11-2014 12
POD014-11 827440 177190 Moyawo Slope Soil POD011 EL11-2014 12
POD014-12 827460 177190 Moyawo Hill Crest Soil POD011 EL11-2014 13
POD014-13 827480 177190 Moyawo Hill Crest Soil POD011 EL11-2014 13
POD014-14 827500 177190 Moyawo Hill Crest Soil POD011 EL11-2014 13
SEP074-03 834053 177778 valley Slope Soil POD011 EL11-2014 14
SEP074-04 834015 177750 valley Hill Crest Soil POD011 EL11-2014 21
SEP074-05 834033 177429 valley Slope Soil POD011 EL11-2014 40
For
per
sona
l use
onl
y

23
R E V I E W O F A C T I V I T I E S
Figure 33. Excavation of trench (at left), over probe-positive KIM soil-sampling results for the POD011 AM geophysical anomaly, EL 11/2014. The causative magnetic body proved to be a diabase dyke (Elephant-skin alteration, at right). The source of the KIM ilmenites in the overlying soil horizon, is yet to be resolved. 5.2.3 Diamond Drilling Drilling for the period focused initially over ground magnetic anomalies generated from a GM mega-survey conducted within EL11/2014. A drilling program was initiated over selected targets adjacent to the Lake Popei kimberlite dyke discovery (e.g. Figure 34). Drilling was particularly focused on ground magnetic anomalies generated from the survey over POD002 (Lake Popei Eastern Extension) and the POD011 GM survey (Figure 35). A total of eight (8) holes were completed in EL 11/2014 with a cumulative depth of 347.5m. No kimberlite was intersected. A single hole was drilled over the SEP074 target to a depth of 25.85m (azimuth 7
0 and declination -60
0) (Figure 31, at top) and no
kimberlite was intersected. Figure 34. Company drill rig in action over follow-up GM anomalies in the Lake Popei area, EL 11/2014.
5.2.4 Bulk-sampling-Lake Popei Kimberlite A 180-ton kimberlite bulk sample from the Lake Popei kimberlite discovery (EL11/2014) was processed. A total of 0.3 carats (largest stone 0.21carats) was recovered from the processed material, which was not crushed (and hence probably contains a number of locked up diamonds). Despite the potential lock-up of diamonds, the result is clearly sub-economic, and prompted the decision to stop kimberlite exploration work in the area.
For
per
sona
l use
onl
y

24
R E V I E W O F A C T I V I T I E S
6. Sumbuya DMS Processing Plant, EL 12/2014. During the period, The Company reported the successful commissioning of a new 10 ton per hour (tph) DMS plant (Figure 35). The plant, complete with twin flowsort X-Ray recovery units, is fully mobile and will service the exploration and trial-mining bulk-sample material obtained from the southern-most Els.
Figure 35. The 10 tph plant (above) is the second to be successfully commissioned by the Company. It has been responsible for processing bulk-samples recovered from the southern licences, and is located near the town of Sumbuya (bottom, at left). The Sewa River is pictured at far left (bottom).
7. Community Initiatives and Public Relations During the year, as part of its ongoing social initiatives with communities’ resident in Allotrope’s exploration licences, the Company handed over structures and furniture to three communities/villages, viz: Gerihun, Nongoba and Golu, all situated within the Baoma Chiefdom (Figure 36). The following infrastructure development projects were completed within and adjacent to the Golu Alluvial Project, as part of the Company’s Community Development Action Plan (CDAP):
• Access road, bridge construction and ongoing road maintenance from the village of Gerihun to the mine site, passing through the villages of Konia and Golu (~USD 55,000 plus maintenance costs). This road provides greater market access for both producers and consumers in the villages of Golu, Konia and surrounding areas.
• Ferry at Kpatobu (~USD 10,000)
• Construction of Court Barre’s at Golu and Nongoba, and refurbishment of the Court Barre at Gerihun (~USD 35,000, Figure 24)
• Construction of a clinic in the village of Golu (USD 10,000; cf. Figure 24)
• Refurbishment of three hand pumps in Golu village (USD 3,500) Approximately eight-hundred (800) people attended the ceremony to mark the event and at which, Mike Lynn, CEO of Allotopes Diamond Company Ltd (ADCL), accepted an award of appreciation on behalf of the Company (Figure 37).
For
per
sona
l use
onl
y

25
R E V I E W O F A C T I V I T I E S
Figure 36. At left -Medical clinic constructed by ADCL at Golu Village. At right- A Court Barre built by ADCL at Nongoba Village, EL 15/2012.
Figure 37. At left-Mike Lynn, CEO of ADCL, accepting title of Honourary Chief by the people of the Baoma Chiefdom. At right-receiving certificate of appreciation from Paramount Chief on behalf of ADCL’s investment initiatives. In anticipation of the 2017 dry-season exploration activities, the Company has renewed/re-negotiated royalty contracts with those communities adjacent to its operations. The Company donated USD 5,400 to community projects in Baoma chiefdom. This money was a percentage of the valuation of diamonds from the recent export of diamonds recovered from EL15/2012. In H1, 2017, twenty-five (25) km of road between Jembe and Gbinima in EL 15/2012, was rehabilitated for access to the dredge sites, at a cost of approximately USD 20,000. This has opened access for commercial trucks to carry local produce, and has significantly boosted the local economy, as a result. In addition, the dredging program at Gbinima in EL 15/2012 has allowed the community to benefit from these activities. The overburden sand-fill that overlies the target basal gravels contains alluvial gold. The gold-rich dredge tailings (Figure 38), are not discharged into the river, but rather pumped ashore to allow the community an opportunity to derive some economic gain from the Company’s exploration dredging. This method of disposal is also environmentally more attractive.
For
per
sona
l use
onl
y

26
R E V I E W O F A C T I V I T I E S
Figure 38. Women from the near-by village of Gbinima, panning and sluicing gold-rich overburden sands recovered from the Company’s dredging operations in EL 15/2012. The Group derives no benefit from the gold panning activities, and the proceeds go entirely to the community.
REFERENCES Hall, P.K., (1972). The diamond fields of Sierra Leone. Geol. Surv. Sierra Leone Bull. 5 (1); 133 pp. COMPETENT PERSON’S STATEMENT- DIAMONDS The information in this report that relates to Exploration Results, Mineral Resources or Ore Reserves on the Allotropes Diamond’s Sierra Leone Diamond Project, I s based on information compiled by Mr Richard Hall (M.Sc. Geology, Cum Laude) who is a Fellow of the Australasian Institute of Mining and Metallurgy and a Member of the Geological Society of Australia. Mr Hall has sufficient experience which is relevant to the style of mineralisation and type of deposit under consideration and to the activity which he is undertaking, to qualify as a Competent Person as defined in the 2012 Edition of the “Australasian Code for Reporting of Exploration Results, Mineral Resources and Ore Reserves”. Mr Hall consents to the inclusion in this ASX release of this information in the form and context in which it appears.
For
per
sona
l use
onl
y
27
Figure 39
R E V I E W O F A C T I V I T I E S
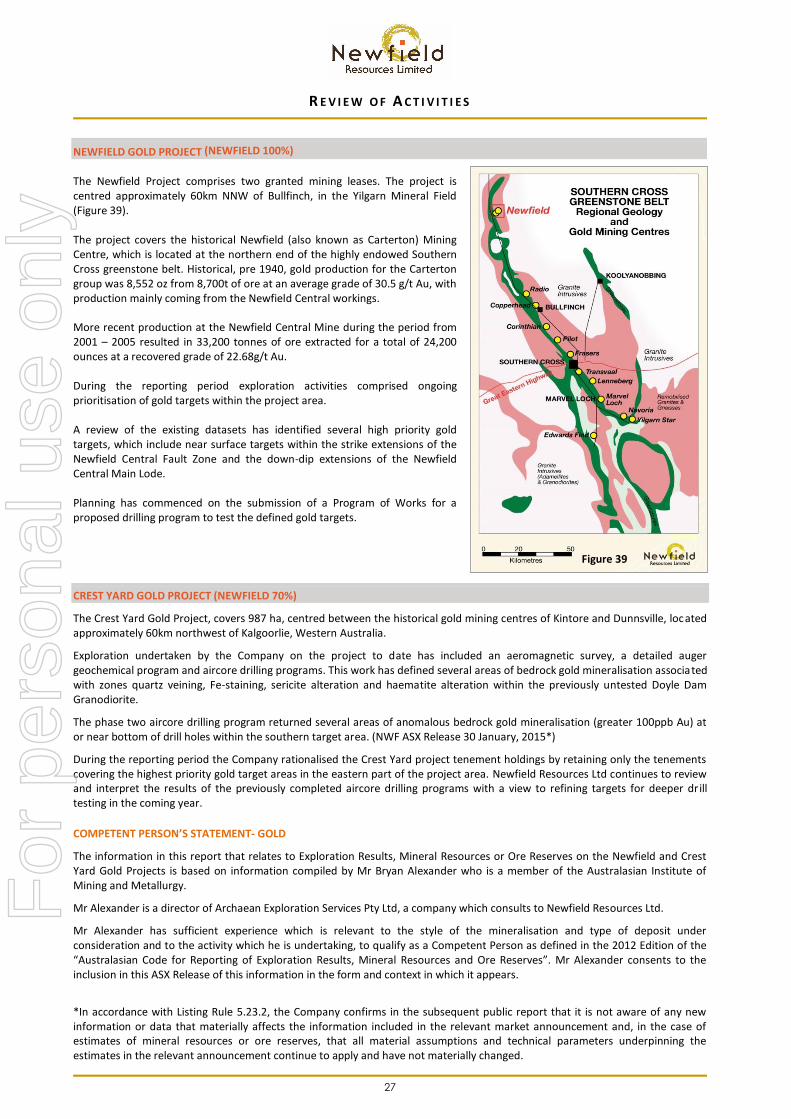
NEWFIELD GOLD PROJECT (NEWFIELD 100%) The Newfield Project comprises two granted mining leases. The project is centred approximately 60km NNW of Bullfinch, in the Yilgarn Mineral Field (Figure 39). The project covers the historical Newfield (also known as Carterton) Mining Centre, which is located at the northern end of the highly endowed Southern Cross greenstone belt. Historical, pre 1940, gold production for the Carterton group was 8,552 oz from 8,700t of ore at an average grade of 30.5 g/t Au, with production mainly coming from the Newfield Central workings. More recent production at the Newfield Central Mine during the period from 2001 – 2005 resulted in 33,200 tonnes of ore extracted for a total of 24,200 ounces at a recovered grade of 22.68g/t Au. During the reporting period exploration activities comprised ongoing prioritisation of gold targets within the project area. A review of the existing datasets has identified several high priority gold targets, which include near surface targets within the strike extensions of the Newfield Central Fault Zone and the down-dip extensions of the Newfield Central Main Lode. Planning has commenced on the submission of a Program of Works for a proposed drilling program to test the defined gold targets.
CREST YARD GOLD PROJECT (NEWFIELD 70%)
The Crest Yard Gold Project, covers 987 ha, centred between the historical gold mining centres of Kintore and Dunnsville, located approximately 60km northwest of Kalgoorlie, Western Australia.
Exploration undertaken by the Company on the project to date has included an aeromagnetic survey, a detailed auger geochemical program and aircore drilling programs. This work has defined several areas of bedrock gold mineralisation associated with zones quartz veining, Fe-staining, sericite alteration and haematite alteration within the previously untested Doyle Dam Granodiorite.
The phase two aircore drilling program returned several areas of anomalous bedrock gold mineralisation (greater 100ppb Au) at or near bottom of drill holes within the southern target area. (NWF ASX Release 30 January, 2015*)
During the reporting period the Company rationalised the Crest Yard project tenement holdings by retaining only the tenements covering the highest priority gold target areas in the eastern part of the project area. Newfield Resources Ltd continues to review and interpret the results of the previously completed aircore drilling programs with a view to refining targets for deeper drill testing in the coming year.
COMPETENT PERSON’S STATEMENT- GOLD
The information in this report that relates to Exploration Results, Mineral Resources or Ore Reserves on the Newfield and Crest Yard Gold Projects is based on information compiled by Mr Bryan Alexander who is a member of the Australasian Institute of Mining and Metallurgy.
Mr Alexander is a director of Archaean Exploration Services Pty Ltd, a company which consults to Newfield Resources Ltd.
Mr Alexander has sufficient experience which is relevant to the style of the mineralisation and type of deposit under consideration and to the activity which he is undertaking, to qualify as a Competent Person as defined in the 2012 Edition of the “Australasian Code for Reporting of Exploration Results, Mineral Resources and Ore Reserves”. Mr Alexander consents to the inclusion in this ASX Release of this information in the form and context in which it appears.
*In accordance with Listing Rule 5.23.2, the Company confirms in the subsequent public report that it is not aware of any new information or data that materially affects the information included in the relevant market announcement and, in the case of estimates of mineral resources or ore reserves, that all material assumptions and technical parameters underpinning the estimates in the relevant announcement continue to apply and have not materially changed.
For
per
sona
l use
onl
y

28
D I R E C T O R S ’ R E P O R T
The Directors present their report together with the consolidated financial statements of the Group comprising of Newfield Resources Limited (the Company or Newfield) and its subsidiaries (the Group or Consolidated Entity) for the year ended 30 June 2017 and the Auditor’s report thereon.
DIRECTORS AND KEY PERSONNEL Directors The Directors of the Company at any time during or since the end of the financial year are: Mr Anthony Ho Executive Director – appointed 14 September 2011 Mr Ho is a commerce graduate of the University of Western Australia. He qualified as a Chartered Accountant in 1983 with Deloitte and is presently the principal of a firm, Anthony Ho and Associates, specialising in providing corporate and financial services to ASX-listed companies. Prior to establishing his practice in 1991, he spent 7 years in a senior corporate role with a major investment and resource group in Western Australia. He is currently a director of a number of companies listed on the ASX. Mr Michael Lynn Executive Director – appointed 24 August 2015 Mr Lynn is a diamond geologist with over 30 years’ experience in the African Continent (including Sierra Leone, DRC, Tanzania, Guinea, and South Africa), as well as India, Canada and Brazil. After his undergraduate degree in geology in the UK, Mr Lynn gained a Masters in Geology (with distinction) from Rhodes University in South Africa. He is the author and co-author of numerous technical publications related to diamond exploration. His career included 11 years of senior exploration and management roles with the De Beers Group and 12 years with Anglo American Corporation. Mr Lynn is a Fellow of the Geological Society of South Africa and a member of the Society of Economic Geologists in South Africa. He was a member of the Committee for the South African code for the Reporting of Exploration Results, Mineral Resources and Mineral Reserves (SAMREC) which completed a recent review of the Code. Mr Lynn will retire by rotation and will be seeking re-election by shareholders at the 2017 Annual General Meeting. Mr Suryandy Jahja Non-Executive Director – appointed 6 August 2015 Mr Jahja is currently the Managing Director of PT Kresna Graha Investama Tbk ("Kresna"), a leading stockbroking and investment company based in Jakarta, Indonesia. In this role, he acts as head of Kresna's investment banking division. He co-founded Kresna in 1999 and was responsible for the establishment of the Kresna Asset Management Unit. Mr Jahja is a graduate of the University of NSW with first class honours in Computer Engineering and also holds a post graduate degree in Management and Information Technology. Company Secretary Mr Kim Hogg – appointed 14 September 2011 Mr Hogg completed his Bachelor of Commerce in 1984 at the University of Western Australia and has worked in a number of diverse industries in various senior management and accounting roles. He has been a principal of an accounting practice for more than 20 years with a specialist involvement in the preparation of prospectuses, coordinating the listing and due diligence processes and acting as company secretary for listed entities. Mr Hogg is currently the secretary of a number of ASX-listed companies and provides corporate and accounting advice and services to those clients.
For
per
sona
l use
onl
y

29
D I R E C T O R S ’ R E P O R T
DIRECTORSHIPS IN OTHER LISTED ENTITIES Directorships of other listed entities held by Directors of the Company during the last 3 years immediately before the end of the financial year are as follows:
Period of directorship
Director Company From To
Mr Anthony Ho Alchemy Resources Limited Australian Agricultural Projects Limited Mustera Property Group Ltd Glory Resources Limited (now de-listed) Siburan Resources Limited
2011 2003
April 2014 February 2014
November 2009
Present Present Present
March 2016 November 2014
Mr Michael Lynn Not Applicable - - Mr Suryandy Jahja PT Kresna Graha Investama Tbk 1999 Present DIRECTORS’ INTERESTS
The relevant interests of each director in the securities of the Company at the date of this report are as follows:
Director Shares Options
A Ho - 400,000 M Lynn 300,000 1,500,000 S Jahja 250,000 500,000
DIRECTORS’ MEETINGS The number of Directors’ meetings and the number of meetings attended by each of the Directors of the Company during the financial year are:
Board Meetings
Director Held while Director Attended
A Ho 4 4 M Lynn 4 4 S Jahja 4 4
PRINCIPAL ACTIVITY The principal activity of the Group during the financial year was mineral exploration. OPERATING AND FINANCIAL REVIEW Operating review A review of the operating activities undertaken by the Group during the year is contained in the section entitled Review of Activities in this Financial Report. Financial review
The Group incurred a loss of $1,399,735 after income tax for the financial year (2016: loss of $4,188,563). During the financial year, the Company successfully raised $3 million before costs through the exercise of options. As at 30 June 2017 the Group had net assets of $26,429,792 (2016: $25,543,512) including cash and cash equivalents of $1,068,249 (2016: $8,636,589).
For
per
sona
l use
onl
y

30
D I R E C T O R S ’ R E P O R T
SIGNIFICANT CHANGES IN THE STATE OF AFFAIRS Fully paid ordinary shares issued during the year are as follows:
(a) the issue of 5,134,065 shares at $0.30 per share to raise $1,540,220 before costs; and
(b) the issue of 4,865,935 shares at $0.30 per share to raise $1,459,780 before costs. Total shares on issue at 30 June 2017 are 235,583,335 (2016: 225,583,335). LIKELY DEVELOPMENTS The Group will continue to pursue its principal activity of mineral exploration, in particular, in its diamond project in Sierra Leone. More information on the Group’s near-term developments is included in the Review of Activities in this Financial Report. DIVIDENDS No dividend has been declared or paid by the Company to the date of this report. OPTIONS Options granted
The following options were granted since the end of the previous financial year:
Class Grant Date Expiry Date Exercise Price Number of Options
Unlisted Options 1 December 2016 30 December 2020 $0.50 6,000,000
Options exercised or expired
The following options were exercised during the year ended 30 June 2017:
Class Grant Date Expiry Date Exercise Price Number of Options
Unlisted Options 31 March 2014 15 June 2017 $0.30 5,134,065 The following options expired without being exercised* during the year ended 30 June 2017:
Class Grant Date Expiry Date Exercise Price Number of Options
Unlisted Options 31 March 2014 15 June 2017 $0.30 4,865,935
* the Company entered into an underwriting agreement to underwrite the above unlisted options, which ensured the Company received proceeds of $1,459,780 upon the issue of 4,865,935 shares in June 2017.
Options on issue
At the date of this report, unissued ordinary shares of the Company under option are:
Class Grant Date Expiry Date Exercise Price Number of Options
Unlisted Options 1 December 2016 30 December 2020 $0.50 6,000,000 These options do not entitle the holder to participate in any share issue of the Company or any other entity. F
or p
erso
nal u
se o
nly
31
D I R E C T O R S ’ R E P O R T
REMUNERATION REPORT - AUDITED The remuneration report, which has been audited, outlines the key management personnel remuneration arrangements for the Group, in accordance with the requirements of the Corporations Act 2001 and its Regulations. For the purposes of this report, key management personnel of the Group are defined as those persons having authority and responsibility for planning, directing and controlling the major activities of the Group, directly or indirectly, including any director (whether executive or otherwise) of the Company. Key management personnel
The following were key management personnel of the Group at any time during the financial year and unless otherwise indicated were key management personnel for the entire year:
Name Position held
Mr Anthony Ho Executive Director Mr Michael Lynn Executive Director Mr Suryandy Jahja Non-executive Director
Principles of remuneration
The remuneration structures explained below are competitively set to attract, motivate and retain suitably qualified and experienced candidates, reward the achievement of strategic objectives and achieve the broader outcome of creation of value for shareholders. The remuneration structures take into account:
o the capability and experience of the key management personnel; and
o the key management personnel’s ability to control the achievement of strategic objectives.
Given the evaluation and developmental nature of the Group’s principal activity, the overall level of remuneration is not linked to the financial performance of the Group.
Remuneration structure
In accordance with best practice corporate governance, the structure of non-executive directors’ remuneration is clearly distinguished from that of executives. Remuneration is determined by the Board as a whole as the Company has not yet established a remuneration committee.
Non-executive director remuneration
The Constitution and the ASX Listing Rules specify that the aggregate remuneration of non-executive directors shall be determined from time to time by shareholders in general meeting. Total remuneration for all non-executive directors, last voted upon by shareholders at a meeting held in December 2011, is not to exceed $350,000 per annum. Directors’ fees cover all main board activities and membership of committees if applicable.
Non-executive directors do not receive any retirement benefits, other than statutory superannuation, nor do they receive any performance-related compensation.
Executive remuneration
Remuneration for executives is set out in employment agreements. Details of the employment agreement with Executive Directors are provided below.
Executive directors may receive performance related compensation but do not receive any retirement benefits, other than statutory superannuation.
Fixed remuneration
Fixed remuneration consists of base compensation (which is calculated on a total cost basis and includes any FBT charges related to employee benefits) as well as employer contributions to superannuation funds.
Fixed remuneration is reviewed annually by the Board through a process that considers individual and overall performance of the Group.
For
per
sona
l use
onl
y

32
D I R E C T O R S ’ R E P O R T
REMUNERATION REPORT - AUDITED (continued) Long-term incentive
Long-term incentives (LTI) may be provided to key management personnel in the form of options over ordinary shares of the Company. LTI are considered to promote continuity of employment and provide additional incentive to recipients to increase shareholder wealth. Options may only be issued to directors subject to approval by shareholders in general meeting.
Following shareholder approval at the Company’s 2016 AGM, all directors were granted options over ordinary shares, details of which are shown later in this Remuneration Report.
The Company has introduced a policy that prohibits employees and Directors of the Company from entering into transactions that operate or are intended to operate to limit the economic risk or are designed or intended to hedge exposure to unvested Company securities. This includes entering into arrangements to hedge their exposure to LTI granted as part of their remuneration package. This policy may be enforced by requesting employees and Directors to confirm compliance.
Group performance and link to remuneration
The Group’s main activities are mineral exploration in Africa and Australia. The Group’s financial results are not considered to be a principal performance indicator. However, the overall level of key management personnel remuneration will take into account the achievement of strategic objectives, service criteria and growth in share price.
There were no performance related remuneration transactions during the financial year.
The earnings of the Group for the current financial year and the previous four financial years are summarised below:
2017 2016 2015 2014 2013
Net loss for the year $1,399,735 $4,188,563 $1,522,992 $1,209,904 $215,990
Dividends paid Nil Nil Nil Nil Nil
Change in share price ($0.05) ($0.49) $0.61 ($0.01) $0.03
Share price at beginning of the period $0.40 $0.89 $0.28 $0.29 $0.26
Share price at end of the period $0.35 $0.40 $0.89 $0.28 $0.29
Loss per share 0.62 cents 2.17 cents 0.95 cents 1.11 cents 0.22 cents
Use of remuneration consultants
The Group did not engage the services of a remuneration consultant during the year.
Voting and comments made at the Company's 2016 Annual General Meeting ('AGM')
At the 2016 AGM, 100% of the votes received supported the adoption of the remuneration report for the year ended 30 June 2016. The Company did not receive any specific feedback at the AGM regarding its remuneration practices.
Employment agreements
Remuneration and other terms of employment for the executives are formalised in service agreements. The service agreements specify the components of remuneration, benefits and notice periods. Other major provisions of the agreements relating to remuneration are set out below.
Termination benefits are within the limits set by the Corporations Act 2001 such that they do not require shareholder approval.
Name Term of agreement Notice period*
Base salary/fees including
superannuation Termination payments**
A Ho Executive Director No fixed term 3 months AUD$109,500 3 months
M Lynn Executive Director 12 months fixed term 3 months USD$165,000 3 months
* The notice period applies equally to either party.
** Base salary payable if the Company terminates employees with notice, and without cause (e.g. for reasons other than unsatisfactory performance).
For
per
sona
l use
onl
y

33
D I R E C T O R S ’ R E P O R T
Remuneration of key management personnel for the year ended 30 June 2017
SHORT-TERM
POST-EMPLOYMENT
SHARE-BASED
PAYMENTS
Salary & fees
$
Annual Leave
$
Superannuation benefits
$ Options
$ Total
$
Proportion of remuneration performance
related %
Value of options as proportion of
remuneration %
Directors
Non-executive
Mr S Jahja1
2017 24,000 - - 9,500 33,500 - 28% 2016 21,677 - - - 21,677 - - Mr M Kornweibel
2 2017 N/A N/A N/A N/A N/A N/A N/A
2016 3,653 - 347 - 4,000 - - Ms S Nanang
3 2017 N/A N/A N/A N/A N/A N/A N/A
2016 2,387 - - - 2,387 - -
Executive
Mr A Ho 2017 100,000 (2,202) 9,500 9,500 116,798 - 8% 2016 91,667 (4,257) 8,708 - 96,118 - - Mr M Lynn
4 2017 218,838 (5,670) - 28,500 241,668 - 12%
2016 179,833 8,973 - - 188,806 N/A - Mr B Alexander
5 2017 N/A N/A N/A N/A N/A N/A N/A
2016 34,819 (7,963) 2,458 - 29,314 - - Mr J Letcher
6 2017 N/A N/A N/A N/A N/A N/A N/A
2016 72,556 - - - 72,556 - -
Total, all KMPs 2017 342,838 (7,872) 9,500 47,500 391,966 - 12%
2016 406,592 (3,247) 11,513 - 414,858 - -
1. Appointed 6 August 2015
2. Resigned 19 August 2015
3. Resigned 6 August 2015
4. Appointed 24 August 2015
5. Resigned 24 August 2015
6. Resigned 16 November 2015
Share-based remuneration Details on options over ordinary shares in the Company that were granted as compensation to each key management person during the reporting period and details on options that vested during the reporting period are as follows:
Name of KMP Grant date Expiry date Exercise
Price
Fair value per option at
grant date
Number of options granted
Number of options vested
Mr Anthony Ho 1 December 2016 30 December 2020 $0.50 1.90 cents 500,000 500,000
Mr Michael Lynn 1 December 2016 30 December 2020 $0.50 1.90 cents 1,500,000 1,500,000
Mr Suryandy Jahja 1 December 2016 30 December 2020 $0.50 1.90 cents 500,000 500,000
The grant of the above options to key management person was not linked to any specific performance criteria and was granted at Directors’ discretion. None of the above options were exercised or forfeited during the financial year.
For
per
sona
l use
onl
y
34
D I R E C T O R S ’ R E P O R T
REMUNERATION REPORT - AUDITED (continued) Loans to key management personnel There were no loans provided to key management personnel of the Group or their close family members or entities related to them during the financial year. Other transactions with key management personnel A Director, Mr A Ho, is a director of the firm Anthony Ho & Associates. Anthony Ho & Associates has provided secretarial services to the Company during the financial year on normal commercial terms and conditions. The total amount recognised during the financial year relating to these transactions was $60,000.
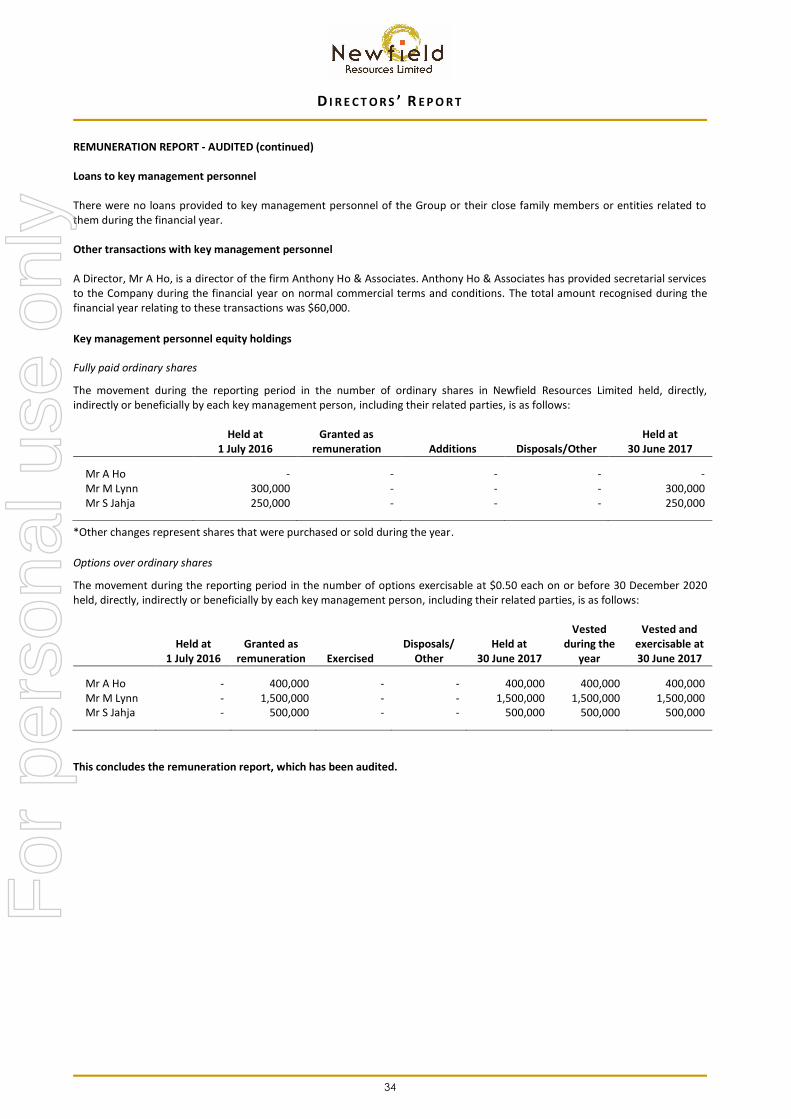
Key management personnel equity holdings Fully paid ordinary shares
The movement during the reporting period in the number of ordinary shares in Newfield Resources Limited held, directly, indirectly or beneficially by each key management person, including their related parties, is as follows:
Held at
1 July 2016 Granted as
remuneration Additions Disposals/Other Held at
30 June 2017
Mr A Ho - - - - - Mr M Lynn 300,000 - - - 300,000 Mr S Jahja 250,000 - - - 250,000
*Other changes represent shares that were purchased or sold during the year.
Options over ordinary shares
The movement during the reporting period in the number of options exercisable at $0.50 each on or before 30 December 2020 held, directly, indirectly or beneficially by each key management person, including their related parties, is as follows:
Held at
1 July 2016 Granted as
remuneration Exercised Disposals/
Other Held at
30 June 2017
Vested during the
year
Vested and exercisable at 30 June 2017
Mr A Ho - 400,000 - - 400,000 400,000 400,000 Mr M Lynn - 1,500,000 - - 1,500,000 1,500,000 1,500,000 Mr S Jahja - 500,000 - - 500,000 500,000 500,000
This concludes the remuneration report, which has been audited.
For
per
sona
l use
onl
y

35
D I R E C T O R S ’ R E P O R T
ENVIRONMENTAL REGULATION The Group’s exploration and mining activities in Australia are governed by a range of environmental legislation and regulations including the National Greenhouse and Energy Reporting Act 2007 and Mining Act 1978. As the Group is still in the development phase of its interests in exploration projects, it is not yet subject to the public reporting requirements of environmental legislation and regulations. The Group’s exploration and mining activities in Sierra Leone are governed by Sierra Leone environmental legislation and regulations, including Mines and Minerals Act, 2009. Environmental performance is reported from each site to management on a regular basis. Compliance with the requirements of environmental regulations was substantially achieved across all operations with no instance of non-compliance noted. To the best of the Directors’ knowledge, the Group has adequate systems in place to ensure compliance with the requirements of the applicable environmental legislation and is not aware of any breach of those requirements during the financial year and up to the date of the Directors’ Report. EVENTS SUBSEQUENT TO REPORTING DATE There has not arisen in the interval between the end of the financial year and the date of this report any item, transaction or event of a material and unusual nature likely, in the opinion of the Directors, to affect significantly the operations of the Group, the results of those operations, or the state of affairs of the Group in future financial years. INDEMNIFICATION AND INSURANCE OF OFFICERS
Indemnification The Company has agreed to indemnify the current Directors and company secretary of the Company against all liabilities to another person (other than the Company or a related body corporate) that may arise from their position as officers of the Company, except where the liability arises out of conduct involving a lack of good faith. The agreement stipulates that the Company will meet the full amount of any such liabilities, including costs and expenses. Insurance The Company paid a premium during the year in respect of a director and officer liability insurance policy, insuring the Directors of the Company, the company secretary, and all executive officers of the Company against a liability incurred as such a director, secretary or executive officer to the extent permitted by the Corporations Act 2001. The Directors have not included details of the nature of the liabilities covered or the amount of the premium paid in respect of the directors’ and officers’ liability and legal expenses’ insurance contracts, as such disclosure is prohibited under the terms of the contract. INDEMNIFICATION AND INSURANCE OF AUDITORS
The Company has not, during or since the end of the financial year, indemnified or agreed to indemnify the auditor of the Company or any related entity against liability incurred by the auditor. During the financial year, the Company did not pay a premium in respect of a contract to insure the auditor of the Company or any related entity. F
or p
erso
nal u
se o
nly

36
D I R E C T O R S ’ R E P O R T
NON-AUDIT SERVICES
During the year the Group’s auditor, BDO Audit (WA) Pty Ltd, has performed certain other services in addition to the audit and review of the financial statements. The Directors are satisfied that the provision of non-audit services is compatible with the general standard of independence for auditors imposed by the Corporations Act 2001. The nature and scope of each type of non-audit service provided means that auditor independence was not compromised. Details of the amount paid to the auditor of the parent entity, BDO Audit (WA) Pty Ltd, and its network firms for audit and non-audit services provided during the year are set out below:
2017 $
2016 $
Services other than audit and review of financial statements:
Tax compliance services 32,559 10,134
Total remuneration for non-audit services 32,559 10,134
LEAD AUDITOR’S INDEPENDENCE DECLARATION The lead auditor’s independence declaration is set out on page 70 and forms part of the Directors’ Report. PROCEEDINGS ON BEHALF OF THE COMPANY
No person has applied to the Court under section 237 of the Corporations Act 2001 for leave to bring proceedings on behalf of the Company, or to intervene in any proceedings to which the Company is a party for the purposes of taking responsibility on behalf of the Company for all or part of those proceedings. This Directors’ Report is made out in accordance with a resolution of the Directors:
Anthony Ho Executive Director Dated at Perth this 29
th day of September 2017.
For
per
sona
l use
onl
y

37
C O N S O L I D A T E D S T A T E M E N T O F P R O F I T O R L O S S A N D O T H E R C O M P R E H E N S I V E I N C O M E
for the year ended 30 June 2017
Note
2017 $
2016 $
Sales revenue 7 - 591,766 Other income 7 179,277 160,902 Cost of sales - (1,391,105) Exploration and evaluation expenses (726,070) (949,823) Corporate and administrative expenses 7 (846,341) (740,709) Provision for non-recovery of loans 10 - (140,970) Exploration and evaluation assets written off 14 (2,942) (908,748) Impairment of mine development - (805,258) Finance costs (3,659) (4,618)
Loss before income tax (1,399,735) (4,188,563) Income tax benefit / (expense) 8 - -
Net loss after income tax for the year (1,399,735) (4,188,563)
Other comprehensive income Items that will not be reclassified to profit or loss - - Items that may be reclassified subsequently to profit or loss
Foreign operations – foreign currency translation differences 19 (651,270) (5,481,543)
Other comprehensive loss for the year, net of tax (651,270) (5,481,543)
Total comprehensive loss for the year (2,051,005) (9,670,106)
Loss attributable to:
Owners of the Company (1,399,735) (4,188,563) Non-controlling interest - -
(1,399,735) (4,188,563)
Total comprehensive loss attributable to:
Owners of the Company (2,051,005) (9,670,106) Non-controlling interest -
(2,051,005) (9,670,106)
Basic loss per share (cents) 23 (0.62) (2.17)
Diluted loss per share is not shown as all potential ordinary shares on issue would decrease the loss per share and are thus not considered dilutive.
The Consolidated Statement of Profit or Loss and Other Comprehensive Income is to be read in conjunction with the accompanying notes.
For
per
sona
l use
onl
y

38
C O N S O L I D A T E D S T A T E M E N T O F F I N A N C I A L P O S I T I O N
as at 30 June 2017
Note 2017
$ 2016
$ CURRENT ASSETS Cash and cash equivalents 9 1,068,249 8,636,589 Trade and other receivables 10 1,817,404 62,001 Inventory 11 176,767 167,562 Other current assets 12 230,800 239,082
Total Current Assets 3,293,220 9,105,234 NON-CURRENT ASSETS Trade and other receivables 10 70,584 - Property, plant & equipment 13 3,170,781 2,619,132 Exploration and evaluation assets 14 20,300,092 14,824,010
Total Non-Current Assets 23,541,457 17,443,142
TOTAL ASSETS 26,834,677 26,548,376
CURRENT LIABILITIES Trade and other payables 15 225,784 773,077 Employee benefits 17 124,028 167,053 Loans and borrowings 16 22,301 31,962
Total Current Liabilities 372,113 972,092 NON-CURRENT LIABILITIES Income tax payable 32,772 32,772
Total Non-Current Liabilities 32,772 32,772
TOTAL LIABILITIES 404,885 1,004,864
NET ASSETS
26,429,792 25,543,512
EQUITY Contributed equity 18 38,964,752 36,141,400 Reserves 19 (3,849,294) (3,271,957) Accumulated losses 20 (8,685,732) (7,325,997) Non-controlling interest 66 66
TOTAL EQUITY
26,429,792 25,543,512
The Consolidated Statement of Financial Position is to be read in conjunction with the accompanying notes.
For
per
sona
l use
onl
y

39
C O N S O L I D A T E D S T A T E M E N T O F C H A N G E S I N E Q U I T Y
for the year ended 30 June 2017
Contributed Equity
$
Other
Reserves $
Accumulated Losses
$ Total
$
Non-controlling interests
$
Total Equity
$ Balance at 30 June 2016 36,141,400 (3,271,957) (7,325,997) 25,543,446 66 25,543,512 Loss for the year - - (1,399,735) (1,399,735) - (1,399,735) Other comprehensive income/(loss) - (651,270) - (651,270) - (651,270)
Total comprehensive loss for the year - (651,270) (1,399,735) (2,051,005) - (2,051,005)
Transactions with equity holders in their capacity as equity holders: Issue of ordinary shares, net of transaction costs 2,823,352 - - 2,823,352 - 2,823,352 Grant of options as remuneration to directors and employees - 113,933 - 113,933 - 113,933 Transfer of share-based payment reserve upon exercise/expiry of options - (40,000) 40,000 - - -
Balance at 30 June 2017 38,964,752 (3,849,294) (8,685,732) 26,429,726 66 26,429,792
Balance at 30 June 2015 18,211,624 2,209,586 (3,137,434) 17,283,776 66 17,283,842 Loss for the year - - (4,188,563) (4,188,563) - (4,188,563) Other comprehensive income/(loss) - (5,481,543) - (5,481,543) - (5,481,543)
Total comprehensive loss for the year - (5,481,543) (4,188,563) (9,670,106) - (9,670,106)
Transactions with equity holders in their capacity as equity holders: Issue of ordinary shares, net of transaction costs 17,929,776 - - 17,929,776 - 17,929,776
Balance at 30 June 2016 36,141,400 (3,271,957) (7,325,997) 25,543,446 66 25,543,512
The Consolidated Statement of Changes in Equity is to be read in conjunction with accompanying notes.
For
per
sona
l use
onl
y

40
C O N S O L I D A T E D S T A T E M E N T O F C A S H F L O W S
for the year ended 30 June 2017
Note 2017
$ 2016
$
Cash flows from operating activities Receipts from customers 49,901 589,372 Payments to suppliers and employees (748,688) (2,567,894) Interest received 139,201 54,831 Interest paid (3,659) (4,618)
Net cash (outflow) from operating activities 27 (563,245) (1,928,309) Cash flows from investing activities
Proceeds from disposal of property, plant and equipment 2,605 - Payments for property, plant and equipment (1,070,083) (708,400) Payments for exploration and evaluation assets (7,081,142) (9,021,864) Proceeds from sales of diamonds from exploration activities - 190,171 Payments for mine development - (193,260) Loan advanced to other entity (1,500,000) -
Net cash (outflow) from investing activities (9,648,620) (9,733,353) Cash flows from financing activities Proceeds from the issue of share capital 18 3,000,000 18,700,000 Payments of share issue costs (200,997) (745,875) Proceeds from borrowings 43,072 61,903 Repayment of borrowings (52,733) (68,012)
Net cash inflow from financing activities 2,789,342 17,948,016
Net increase/(decrease) in cash and cash equivalents (7,422,523) 6,286,354
Cash and cash equivalents at 1 July 8,636,589 2,425,929 Effects of exchange rate changes on cash and cash equivalents (145,817) (75,694)
Cash and cash equivalents at 30 June 9 1,068,249 8,636,589
Non-cash financing and investing activities 27
The Consolidated Statement of Cash Flows is to be read in conjunction with the accompanying notes.
For
per
sona
l use
onl
y

41
N O T E S T O T H E C O N S O L I D A T E D F I N A N C I A L S T A T E M E N T S for the year ended 30 June 2017
1. REPORTING ENTITY
Newfield is a public company limited by shares incorporated in Australia whose shares are traded on the Australian Securities Exchange.
These consolidated financial statements comprise the Company and its subsidiaries (collectively the “Group” and individually “Group companies”). They were authorised for issue by the Board of Directors on 29 September 2017.
The nature of the operations and principal activities of the Group is described in the Directors’ Report. 2. BASIS OF PREPARATION
Statement of compliance These general purpose financial statements have been prepared in accordance with the requirements of the Corporations Act 2001, Australian Accounting Standards and Interpretations issued by the Australian Accounting Standards Board and the Corporations Act 2001. Newfield is a for profit entity for the purpose of preparing the financial statements. The financial statements of the Group also comply with the International Financial Reporting Standards (IFRS) as issued by the International Accounting Standards Board (IASB). Basis of measurement These consolidated financial statements are prepared on the accruals basis and the historical cost basis. Going concern
For the year ended 30 June 2017 the entity recorded a loss of $1,399,735 and had net cash outflows from operating and investing activities of $10,211,865. The ability of the entity to continue as a going concern is dependent on securing additional funding through capital raising to continue to fund its operational activities.
These conditions indicate a material uncertainty that may cast a significant doubt about the entity’s ability to continue as a going concern and, therefore, that it may be unable to realise its assets and discharge its liabilities in the normal course of business.
The financial statements have been prepared on the basis that the entity is a going concern, which contemplates the continuity of normal business activity, realisation of assets and settlement of liabilities in the normal course of business for the following reasons:
During the year and subsequent to 30 June 2017, the Group has instigated a cost reduction program to achieve a more focused operation in Sierra Leone;
The Group expects realisation of receivables subsequent to 30 June 2017 in accordance with contractual terms;
The Group has the ability to continue to adjust its expenditure outlays subject to results of its exploration activities and the Group’s funding position;
The Group has consistently gained the support of its shareholders for funding and the Directors are confident that the Group will be able to raise further working capital as required by the issue of fresh equity.
Should the entity not be able to continue as a going concern, it may be required to realise its assets and discharge its liabilities other than in the ordinary course of business, and at amounts that differ from those stated in the financial statements. The financial report does not include any adjustments relating to the recoverability and classification of recorded asset amounts or liabilities that might be necessary should the entity not continue as a going concern. 3. FUNCTIONAL AND PRESENTATION CURRENCY
Items included in the financial statements of each of the Group’s entities are measured using the currency of the primary economic environment in which the entity operates (“the functional currency”).
From 1 July 2016, the Group’s subsidiaries in Sierra Leone changed their functional currency from Sierra Leonean leone to US dollars following reviews of their activities and estimate of future operations. The Directors believe that using USD as functional currency for the subsidiaries operating in Sierra Leone would most faithfully represent the economic effects of the operations of these subsidiaries.
The consolidated financial statements are presented in Australian dollars (AUD), which is the Group’s functional and presentational currency. All values are rounded to the nearest dollar unless otherwise stated.
For
per
sona
l use
onl
y

42
N O T E S T O T H E C O N S O L I D A T E D F I N A N C I A L S T A T E M E N T S for the year ended 30 June 2017
4. SUMMARY OF SIGNIFICANT ACCOUNTING POLICIES The accounting policies set out below have been applied consistently by the Group throughout the periods presented in these consolidated financial statements. Basis of consolidation Subsidiaries Subsidiaries are entities controlled by the Group. The group controls an entity when it is exposed to, or has rights to, variable returns from involvements with the entity and has the ability to affect those returns through its power over the entity. The financial statements of subsidiaries are included in the consolidated financial statements from the date on which control commences until the date on which control ceases. Transactions eliminated on consolidation Intra-group balances and transactions, and any unrealised income and expenses arising from intra-group transactions, are eliminated. Accounting policies of subsidiaries have been changed where necessary to ensure consistency with the policies adopted by the Group. Foreign currency translation (a) Foreign currency transactions Transactions in foreign currencies are translated to the respective functional currencies of Group companies at exchange rates at the dates of the transactions. Monetary assets and liabilities denominated in foreign currencies are translated to the functional currency at the exchange rate at the reporting date. Non-monetary assets and liabilities that are measured at fair value in foreign currency are translated to the functional currency at the exchange rate when the fair value was determined. Foreign currency differences are generally recognised in profit or loss. Non-monetary items that are measured based on historical cost in a foreign currency are not translated. (b) Foreign operations The assets and liabilities of foreign operations, including fair value adjustments arising on acquisition, are translated into AUD at the exchange rates at the reporting date. The income and expenses of foreign operations are translated into AUD at the dates of the transactions. Foreign currency differences are recognised in other comprehensive income and accumulated in the translation reserve. Goodwill and fair value adjustments arising on the acquisition of a foreign operation are treated as assets and liabilities of the foreign operation and translated at the closing rate. Segment reporting An operating segment is a component of an entity that engages in business activities from which it may earn revenues and incur expenses, whose operating results are regularly reviewed by the entity's chief operating decision maker to make decisions about resources to be allocated to the segment and assess its performance and for which discrete financial information is available. This includes start-up operations which are yet to earn revenues. Management will also consider other factors in determining operating segments such as the level of segment information presented to the Board of Directors. Operating segments have been identified based on the information provided to the chief operating decision makers – being the Board of Directors. Acquisition of assets
Acquisition of an asset or a group of assets (including any liabilities assumed) that does not constitute a business are accounted for as asset acquisition under which the Group measure the assets and liabilities acquired, and the corresponding increase in equity, directly, at the fair value of the assets and liabilities acquired, unless that fair value cannot be estimated reliably.
For
per
sona
l use
onl
y

43
N O T E S T O T H E C O N S O L I D A T E D F I N A N C I A L S T A T E M E N T S for the year ended 30 June 2017
4. SUMMARY OF SIGNIFICANT ACCOUNTING POLICIES (continued) Cash and cash equivalents Cash and cash equivalents in the Consolidated Statement of Financial Position comprise cash at bank and in hand and short-term deposits with an original maturity of three months or less that are readily convertible to known amounts of cash and which are subject to an insignificant risk of changes in value. For the purposes of the Consolidated Statement of Cash Flows, cash and cash equivalents consist of cash and cash equivalents as defined above. Trade and other receivables Trade receivables are recognised initially at fair value and subsequently at amortised cost less any impairment losses recognised. Collectability of trade receivables is reviewed on an ongoing basis. An allowance account (provision for impairment of trade receivables) is used when there is objective evidence that the Group will not be able to collect all amounts due. Receivables for which an impairment provision was recognised are written off against the provision when there is no expectation of recovering additional cash. Inventory Inventories are stated at the lower of cost and net realisable value on a 'first in first out' basis. Cost comprises direct materials and delivery costs, direct labour, import duties and other taxes and an appropriate proportion of variable and fixed overhead expenditure based on normal operating capacity. Net realisable value is the estimated selling price in the ordinary course of business less the estimated costs of completion and the estimated costs necessary to make the sale. Exploration and evaluation expenditure Exploration, evaluation and development expenditure incurred is accumulated in respect of each identifiable area of interest. These costs are only carried forward to the extent that they are expected to be recouped through the successful development of the area or where activities in the area have not yet reached a stage that permits reasonable assessment of the existence of economically recoverable reserves. Accumulated costs in relation to an abandoned area are written off in full against profit in the year in which the decision to abandon the area is made. When production commences, the accumulated costs for the relevant area of interest are amortised over the life of the area according to the rate of depletion of the economically recoverable reserves. A regular review is undertaken of each area of interest to determine the appropriateness of continuing to carry forward costs in relation to that area of interest. Depreciation of property, plant and equipment used for the purpose of exploration, evaluation and development activities are also capitalised as part of the exploration, evaluation and development costs and subsequently amortised over the life of the area. Small amount of diamonds may be recovered from the Group’s exploration activities. Income from sales of diamonds produced prior to the group commencing production (pre-production revenue) will be offset against the carrying value of exploration and evaluation assets and not recognised in the Statement of Profit or Loss and Other Comprehensive Income.
Exploration and evaluation costs have been capitalised on the basis that the consolidated entity will commence commercial production in the future, from which time the costs will be amortised in proportion to the depletion of the mineral resources. Key judgements are applied in considering costs to be capitalised which includes determining expenditures directly related to these activities and allocating overheads between those that are expensed and capitalised. In addition, costs are only capitalised that are expected to be recovered either through successful development or sale of the relevant mining interest. Factors that could impact the future commercial production at the mine include the level of reserves and resources, future technology changes, which could impact the cost of mining, future legal changes and changes in commodity prices. To the extent that capitalised costs are determined not to be recoverable in the future, they will be written off in the period in which this determination is made.
For
per
sona
l use
onl
y

44
N O T E S T O T H E C O N S O L I D A T E D F I N A N C I A L S T A T E M E N T S for the year ended 30 June 2017
4. SUMMARY OF SIGNIFICANT ACCOUNTING POLICIES (continued) Mining assets Capitalised mining development costs include expenditures incurred to develop new ore bodies to define further mineralisation in existing ore bodies, to expand the capacity of a mine and to maintain production. Mining development also includes costs transferred from exploration and evaluation phase once production commences in the area of interest. Amortisation of mining development is computed by the units of production basis over the estimated proved and probable reserves. Proved and probable mineral reserves reflect estimated quantities of economically recoverable reserves which can be recovered in the future from known mineral deposits. These reserves are amortised from the date on which production commences. The amortisation is calculated from recoverable proven and probable reserves and a predetermined percentage of the recoverable measured, indicated and inferred resource. This percentage is reviewed annually. Property, plant and equipment
Items of property, plant and equipment are measured at historical cost less accumulated depreciation and impairment. Historical cost includes expenditure that is directly attributable to the acquisition of the items.
Depreciation is calculated on a straight-line basis to write off the net cost of each item of property, plant and equipment (excluding land) over their expected useful lives as follows:
Furniture & fittings 5-10 years
Motor vehicles 3-5 years
Plant and equipment 2-12 years
The residual values, useful lives and depreciation methods are reviewed, and adjusted if appropriate, at each reporting date.
An item of property, plant and equipment is derecognised upon disposal or when there is no future economic benefit to the consolidated entity. Gains and losses between the carrying amount and the disposal proceeds are taken to profit or loss. Any revaluation surplus reserve relating to the item disposed of is transferred directly to retained profits.
The consolidated entity determines the estimated useful lives and related depreciation and amortisation charges for its property, plant and equipment. The useful lives could change significantly as a result of technical innovations or some other event. The depreciation and amortisation charge will increase where the useful lives are less than previously estimated lives, or technically obsolete or non-strategic assets that have been abandoned or sold will be written off or written down. Impairment of non-financial assets Goodwill and intangible assets that have an indefinite useful life are not subject to amortisation and are tested annually for impairment, or more frequently if events or changes in circumstances indicate that they might be impaired. Other assets are tested for impairment whenever events or changes in circumstances indicate that the carrying amount may not be recoverable. An impairment loss is recognised for the amount by which the asset’s carrying amount exceeds its recoverable amount. The recoverable amount is the higher of an asset’s fair value less costs to sell and value in use. For the purposes of assessing impairment, assets are grouped at the lowest levels for which there are separately identifiable cash flows which are largely independent of the cash inflows from other assets or groups of assets (cash-generating units). Non-financial assets other than goodwill that suffered an impairment are reviewed for possible reversal of the impairment at the end of each reporting period. Trade and other payables
Liabilities are recognised for amounts to be paid in the future for goods or services received, whether or not billed to the Group. Trade accounts payable are normally settled within 60 days. They are recognised initially at their fair value and subsequently measured at amortised cost using the effective interest method. Borrowings
Loans and borrowings are initially recognised at the fair value of the consideration received, net of transaction costs. They are subsequently measured at amortised cost using the effective interest method.
Where there is an unconditional right to defer settlement of the liability for at least 12 months after the reporting date, the loans or borrowings are classified as non-current.
For
per
sona
l use
onl
y

45
N O T E S T O T H E C O N S O L I D A T E D F I N A N C I A L S T A T E M E N T S for the year ended 30 June 2017
4. SUMMARY OF SIGNIFICANT ACCOUNTING POLICIES (continued) Employee benefits
(i) Short-term obligations
Liabilities for wages and salaries, including non-monetary benefits and accumulating sick leave that are expected to be settled wholly within 12 months after the end of the period in which the employees render the related service are recognised in respect of employees’ services up to the end of the reporting period and are measured at the amounts expected to be paid when the liabilities are settled. The liability for accumulating sick leave is recognised in the provision for employee benefits. All other short-term employee benefit obligations are presented as payables.
The obligations are presented as current liabilities in the Statement of Financial Position if the entity does not have an unconditional right to defer settlement for at least twelve months after the reporting period, regardless of when the actual settlement is expected to occur.
(ii) Other long-term employee benefit obligation
The liabilities for long service leave and annual leave are not expected to be settled wholly within 12 months after the end of the period in which the employees render the related service. They are therefore recognised in the provision for employee benefits and measured as the present value of expected future payments to be made in respect of services provided by employees up to the end of the reporting period using the projected unit credit method. Consideration is given to expected future wage and salary levels, experience of employee departures and periods of service. Expected future payments are discounted using market yields at the end of the reporting period of government bonds with terms and currencies that match, as closely as possible, the estimated future cash outflows. Remeasurements as a result of experience adjustments and changes in actuarial assumptions are recognised in profit or loss. Contributed equity
Ordinary shares are classified as equity. Incremental costs directly attributable to the issue of new shares are shown in equity as a deduction, net of tax, from the proceeds. Share based payments
Equity-settled share-based compensation benefits are provided to employees.
Equity-settled transactions are awards of shares, or options over shares, that are provided to employees in exchange for the rendering of services.
The cost of equity-settled transactions are measured at fair value on grant date. Fair value is independently determined using either the Binomial or Black-Scholes option pricing model that takes into account the exercise price, the term of the option, the impact of dilution, the share price at grant date and expected price volatility of the underlying share, the expected dividend yield and the risk free interest rate for the term of the option, together with non-vesting conditions that do not determine whether the consolidated entity receives the services that entitle the employees to receive payment. No account is taken of any other vesting conditions. The accounting estimates and assumptions relating to equity-settled share-based payments would have no impact on the carrying amounts of assets and liabilities within the next annual reporting periods but may impact profit or loss and equity.
The cost of equity-settled transactions are recognised as an expense with a corresponding increase in equity over the vesting period. The cumulative charge to profit or loss is calculated based on the grant date fair value of the award, the best estimate of the number of awards that are likely to vest and the expired portion of the vesting period. The amount recognised in profit or loss for the period is the cumulative amount calculated at each reporting date less amounts already recognised in previous periods.
Market conditions are taken into consideration in determining fair value. Therefore any awards subject to market conditions are considered to vest irrespective of whether or not that market condition has been met, provided all other conditions are satisfied.
If equity-settled awards are modified, as a minimum an expense is recognised as if the modification has not been made. An additional expense is recognised, over the remaining vesting period, for any modification that increases the total fair value of the share-based compensation benefit as at the date of modification.
If the non-vesting condition is within the control of the consolidated entity or employee, the failure to satisfy the condition is treated as a cancellation. If the condition is not within the control of the consolidated entity or employee and is not satisfied during the vesting period, any remaining expense for the award is recognised over the remaining vesting period, unless the award is forfeited.
If equity-settled awards are cancelled, it is treated as if it has vested on the date of cancellation, and any remaining expense is recognised immediately. If a new replacement award is substituted for the cancelled award, the cancelled and new award is treated as if they were a modification.
For
per
sona
l use
onl
y

46
N O T E S T O T H E C O N S O L I D A T E D F I N A N C I A L S T A T E M E N T S for the year ended 30 June 2017
4. SUMMARY OF SIGNIFICANT ACCOUNTING POLICIES (continued) Revenue recognition
All revenue is stated net of the amount of goods and services tax. Revenue is recognised when the amount of the revenue can be measured reliably, it is probable that economic benefits associated with the transaction will flow to the entity and specific criteria relating to the type of revenue as noted below, has been satisfied.
Sale of goods
Revenue is measured at the fair value of the consideration received or receivable and is presented net of returns, discounts and rebates.
Rent Income and recoverable outgoings
Rent revenue comprises rent received and receivable, and recoverable outgoings charged to tenants in accordance with the lease agreements. Rental revenue from investment properties and inventories is recognised on a straight-line basis over the lease term. Lease incentives granted are recognised as part of the rental revenue. Contingent rentals are recognised as income in the period when earned.
Interest
Interest revenue is recognised as interest accrues using the effective interest method. Leases
Leases of property, plant and equipment where the Group, as lessee, has substantially all the risks and rewards of ownership are classified as finance leases. Finance leases are capitalised at the lease’s inception at the fair value of the leased property or, if lower, the present value of the minimum lease payments. The corresponding rental obligations, net of finance charges, are included in other short-term and long-term payables. Each lease payment is allocated between the liability and finance cost. The finance cost is charged to the profit or loss over the lease period so as to produce a constant periodic rate of interest on the remaining balance of the liability for each period. The property, plant and equipment acquired under finance leases is depreciated over the asset’s useful life or over the shorter of the asset’s useful life and the lease term if there is no reasonable certainty that the group will obtain ownership at the end of the lease term.
Leases in which a significant portion of the risks and rewards of ownership are not transferred to the group as lessee are classified as operating leases. Payments made under operating leases (net of any incentives received from the lessor) are charged to profit or loss on a straight-line basis over the period of the lease. Earnings per share Basic earnings per share is calculated by dividing the net earnings attributable to members of the Company for the reporting period by the weighted average number of ordinary shares of the Company. Current and non-current classification
Assets and liabilities are presented in the Consolidated Statement of Financial Position based on current and non-current classification.
An asset is current when: it is expected to be realised or intended to be sold or consumed in normal operating cycle; it is held primarily for the purpose of trading; it is expected to be realised within twelve months after the reporting period; or the asset is cash or cash equivalent unless restricted from being exchanged or used to settle a liability for at least twelve months after the reporting period. All other assets are classified as non-current.
A liability is current when: it is expected to be settled in normal operating cycle; it is held primarily for the purpose of trading; it is due to be settled within twelve months after the reporting period; or there is no unconditional right to defer the settlement of the liability for at least twelve months after the reporting period. All other liabilities are classified as non-current.
For
per
sona
l use
onl
y
47
N O T E S T O T H E C O N S O L I D A T E D F I N A N C I A L S T A T E M E N T S for the year ended 30 June 2017
4. SUMMARY OF SIGNIFICANT ACCOUNTING POLICIES (continued) Income tax Deferred income tax is provided on all temporary differences at the reporting date between the tax bases of assets and liabil ities and their carrying amounts for financial reporting purposes. Deferred income tax liabilities are recognised for all taxable temporary differences:
(a) except where the deferred income tax liability arises from the initial recognition of an asset or liability in a transaction that is not a business combination and, at the time of the transaction, affects neither the accounting profit nor taxable profit or loss; and
(b) in respect of taxable temporary differences associated with investments in subsidiaries, associates and interests in joint ventures, except where the timing of the reversal of the temporary differences can be controlled and it is probable that the temporary differences will not reverse in the foreseeable future.
Deferred income tax assets are recognised for all deductible temporary differences, carry-forward of unused tax assets and unused tax losses, to the extent that it is probable that taxable profit will be available against which the deductible temporary differences, and the carry-forward of unused tax assets and unused tax losses can be utilised:
(a) except where the deferred income tax asset relating to the deductible temporary difference arises from the initial recognition of an asset or liability in a transaction that is not a business combination and, at the time of the transaction, affects neither the accounting profit nor taxable profit or loss; and
(b) in respect of deductible temporary differences associated with investments in subsidiaries, associates and interests in joint ventures, deferred tax assets are only recognised to the extent that it is probable that the temporary differences will reverse in the foreseeable future and taxable profit will be available against which the temporary differences can be utilised.
The carrying amount of deferred income tax assets is reviewed at each reporting date and reduced to the extent that it is no longer probable that sufficient taxable profit will be available to allow all or part of the deferred income tax asset to be utilised. Deferred income tax assets and liabilities are measured at the tax rates that are expected to apply to the year when the asset is realised or the liability is settled, based on tax rates (and tax laws) that have been enacted or substantively enacted at the reporting date. Income taxes relating to items recognised directly in equity are recognised in equity and not in the Statement of Profit or Loss and Other Comprehensive Income. The Group has unused tax losses. However, no deferred tax assets have been recognised as it is not considered probable that future taxable profits will be available against which they could be utilised. Goods and services tax Revenues, expenses and assets are recognised net of the amount of GST except:
When the GST incurred on a purchase of goods and services is not recoverable from the taxation authority, in which case the GST is recognised as part of the cost of acquisition of the asset or as part of the expense item as applicable.
Receivables and payables, which are stated with the amount of GST included. The net amount of GST recoverable from, or payable to, the taxation authority is included as part of receivables or payables in the Consolidated Statement of Financial Position. Cash flows are included in the Consolidated Statement of Cash Flows on a net basis and the GST component of cash flows arising from investing and financing activities, which is recoverable from, or payable to, the taxation authority is classified as part of operating cash flows. Commitments and contingencies are disclosed net of the amount of GST recoverable from, or payable to, the taxation authority.
For
per
sona
l use
onl
y

48
N O T E S T O T H E C O N S O L I D A T E D F I N A N C I A L S T A T E M E N T S for the year ended 30 June 2017
4. SUMMARY OF SIGNIFICANT ACCOUNTING POLICIES (continued)
Adoption of new or revised accounting standards and interpretations
The consolidated entity has adopted all of the new, revised or amending Accounting Standards and Interpretations issued by the Australian Accounting Standards Board ('AASB') that are mandatory for the current reporting period.
Any new, revised or amending Accounting Standards or Interpretations that are not yet mandatory have not been early adopted.
The adoption of these Accounting Standards and Interpretations did not have any significant impact on the financial performance or position of the consolidated entity. New accounting standards and interpretations that are not yet mandatory
The following standards, amendments to standards and interpretations have been identified as those which may impact the Group in the period of initial application. They have not been applied in preparing this financial report:
(i) AASB 9 Financial Instruments and its consequential amendments
This standard and its consequential amendments are applicable to annual reporting periods beginning on or after 1 January 2018 and completes phases I and III of the IASB's project to replace IAS 39 (AASB 139) 'Financial Instruments: Recognition and Measurement'. This standard introduces new classification and measurement models for financial assets, using a single approach to determine whether a financial asset is measured at amortised cost or fair value. The accounting for financial liabilities continues to be classified and measured in accordance with AASB 139, with one exception, being that the portion of a change of fair value relating to the entity's own credit risk is to be presented in other comprehensive income unless it would create an accounting mismatch. Chapter 6 'Hedge Accounting' supersedes the general hedge accounting requirements in AASB 139 and provides a new simpler approach to hedge accounting that is intended to more closely align with risk management activities undertaken by entities when hedging financial and non-financial risks. The consolidated entity will adopt this standard and the amendments from 1 July 2018 but the impact of its adoption is yet to be assessed by the consolidated entity.
(ii) AASB 15 Revenue from contracts with customers
This standard is applicable to annual reporting periods beginning on or after 1 January 2018 and an entity will recognise revenue to depict the transfer of promised good or services to customers in an amount that reflects the consideration to which the entity expects to be entitled. This means that revenue will be recognised when control of goods or services is transferred, rather than on transfer of risks and rewards. The consolidated entity is yet to fully assess the impact of this standard.
(iii) AASB 16 Leases
This standard is applicable to annual reporting periods beginning on or after 1 January 2019. AASB 16 removes the classification of lease as either operating leases or finance leases for the lessee, effectively treating all leases as finance leases. Short term leases (less than 12 months) and leases of a low value are exempt from the lease accounting requirements. An entity will be required to recognise a lease liability and a right of use of asset in the statement of financial position for most leases. Lessor accounting remains similar to current practice. Although the directors anticipate that the adoption of AASB 16 may have an impact on the Group’s financial statements, it is impracticable at this stage to provide a reasonable estimate of such impact.
(iv) AASB 2016-1 Amendments to Australian Accounting Standards - Recognition of Deferred Tax for Unrealised Losses
These amendments clarify some issues regarding recognition and measurement of deferred tax assets and are applicable to annual reporting periods beginning on or after 1 January 2017. The consolidated entity will adopt this standard from 1 July 2017 but the impact of its adoption is yet to be assessed.
(v) AASB 2016-2 Amendments to Australian Accounting Standards - Disclosure Initiative: Amendments to AASB 107
These amendments require entities to disclose a reconciliation of cash and non-cash movements in liabilities arising from financing activities and a reconciliation for movements in financial assets used to hedge liabilities arising from financing activities. The standard is applicable to annual reporting periods beginning on or after 1 January 2017. The consolidated entity will adopt this standard from 1 July 2017 but the impact of its adoption is yet to be assessed.
For
per
sona
l use
onl
y

49
N O T E S T O T H E C O N S O L I D A T E D F I N A N C I A L S T A T E M E N T S for the year ended 30 June 2017
5. FINANCIAL RISK MANAGEMENT Overview Risk management is carried out under policies set by the Board of Directors. The Board provides principles for overall risk management, as well as policies covering specific areas. Financial risk management objectives The Board monitors and manages the financial risk relating to the operations of the Group. The Group’s activities include exposure to market risk, credit risk and liquidity risk. The overall risk management strategy focuses on the unpredictability of the finance markets and seeks to minimise the potential adverse effects on the financial performance. Risk management is carried out under the direction of the Board. The Group holds the following financial instruments as at 30 June:
2017
$ 2016
$ Financial assets
Cash at bank and short-term bank deposits 1,068,249 8,636,589 Trade and other receivables 1,879,815 12,238
2,948,064 8,648,827
Financial liabilities
Trade and other payables 171,374 723,167 Loans and borrowings 22,300 31,962
193,674 755,129
Market risk Market risk is the risk that changes in market prices, such as foreign currency exchange rates, interest rates and commodity prices will affect the Group’s income or the value of its holdings of financial instruments. The objective of market risk management is to manage and control market risk exposures within acceptable parameters, while optimising return. There were no changes in the Group’s market risk management policies from previous years. Foreign currency risk The consolidated entity undertakes certain transactions denominated in foreign currency and is exposed to foreign currency risk through foreign exchange rate fluctuations. Foreign exchange risk arises from future commercial transactions and recognised financial assets and financial liabilities denominated in a currency that is not the entity's functional currency. The risk is measured using sensitivity analysis and cash flow forecasting. The Group’s exposure to foreign currency risk at the end of the reporting period, expressed in Australian dollars, was as follows:
Assets Liabilities 2017 2016 2017 2016 $ $ $ $ US dollars 535,730 602,865 84,346 352,913 British pound - - - 10,295 Euro - - - 16,693 South African rand - - 2,806 - Sierra Leonean leone 23,224 20,870 14,046 245,197
558,954 623,735 101,198 625,098
For
per
sona
l use
onl
y
50
N O T E S T O T H E C O N S O L I D A T E D F I N A N C I A L S T A T E M E N T S for the year ended 30 June 2017
5. FINANCIAL RISK MANAGEMENT (continued) The Group had net monetary assets denominated in foreign currencies of $457,756 (assets $558,954 less liabilities $101,198) as at 30 June 2017 (2016: net liabilities of $1,363). Based on this exposure, had the Australian dollar strengthened/weakened by 7% (2016: weakened by 10%/strengthened by 5%) against these foreign currencies with all other variables held constant, the Group's loss before tax for the year would have been $32,043 lower/higher (2016: $136 higher/$68 lower) and equity would have been $32,043 higher/lower (2016: $136 lower/$68 higher). The percentage change is the expected overall volatility of the significant currencies, which is based on management’s assessment of reasonable possible fluctuations taking into consideration movements over the last 6 months each year and the spot rate at each reporting date. The actual foreign exchange gain for the year ended 30 June 2017 was $38,605 (2016: gain of $104,640). Cash flow and interest rate risk Apart from the term deposits held at fixed rates, the Group also receives interest on its cash management accounts based on daily balances at variable rates. The Group’s operating accounts do not attract interest. At the reporting date the interest rate profile of the Group’s interest bearing financial instruments was:
2017
$ 2016
$ Variable rate instruments
Cash at bank 732,145 2,307,694 Fixed rate instruments
Term deposits 70,584 5,000,000 Loan to other entity (Note 10) 1,500,000 - Loans and borrowings (22,300) (31,962)
2,280,429 7,275,732
Cash flow sensitivity analysis for variable rate instruments
A change of 100 basis points in interest rates would increase or decrease the Group’s loss by $7,321 (2016: $23,077), based on the cash at bank at reporting date and calculated on an annual basis. The Board assessed a 100 basis point movement as being reasonably possible based on short term historical movements. This analysis assumes that all other variables remain constant. Market price risk The Group is involved in the exploration and development of mining tenements for minerals, including gold, diamonds and base metals. Should the Group successfully progress to a producer, revenues associated with mineral sales, and the ability to raise funds through equity and debt, will have some dependence upon commodity prices. Credit risk There is a limited amount of credit risk relating to the cash and cash equivalents that the Group holds in deposits. The Group does not presently have customers and consequently does not have credit exposure to trade receivables. The Group may in the future be exposed to interest rate risk should it borrow funds for acquisition and development. There is a limited amount of credit risk relating to loan to other entity as the loan was fully secured by first mortgage over several real estate properties owned by the borrower. Exposure to credit risk
The Group’s maximum exposure to credit risk at the reporting date was:
2017
$ 2016
$
Cash at bank and short-term bank deposits 1,062,224 8,636,441 Other receivables 1,879,815 12,238
2,942,039 8,648,679
For
per
sona
l use
onl
y

51
N O T E S T O T H E C O N S O L I D A T E D F I N A N C I A L S T A T E M E N T S for the year ended 30 June 2017
5. FINANCIAL RISK MANAGEMENT (continued) The credit quality of financial assets that are neither past due nor impaired can be assessed by reference to external credit ratings (if available) or to historical information about counterparty default rates:
Counterparties with external credit rating
1
Other third parties without external
credit rating
Total Credit quality of financial assets AA-(S&P) No default At 30 June 2017 Cash at bank
2 818,526 249,723 1,068,249
Other receivables from once-off transactions with third parties3
70,584 1,809,231 1,879,815
889,110 2,058,954 2,948,064
At 30 June 2016 Cash at bank and short-term bank deposits
2 6,023,661 2,612,780 8,636,441
Other receivables from once-off transactions with third parties3
1,430 10,808 12,238
6,025,091 2,623,588 8,648,679
1. The equivalent S&P rating of the financial assets represents that rating of the counterparty with whom the financial asset is held rather than the rating of the financial asset itself.
2. One of the Group’s subsidiaries operates in Sierra Leone and held cash at Sierra Leone financial institutions. No external credit rating was available for these Sierra Leone financial institutions as at the reporting date.
3. Other receivables represent bank term-deposit, sundry debtors and loan to employees and other entities. Allowance for impairment loss
A provision for impairment loss is recognised when there is objective evidence that an individual receivable is impaired. The group considers that there is evidence of impairment if any of the following indicators are present:
significant financial difficulties of the debtor
probability that the debtor will enter bankruptcy or financial reorganisation, and
default or delinquency in payments (more than 30 days overdue).
Receivables for which an impairment provision was recognised are written off against the provision when there is no expectation of recovering additional cash. Impairment losses are recognised in profit or loss within other expenses. Subsequent recoveries of amounts previously written off are credited against other expenses.
No impairment loss was recognised by the Group for the financial year (2016: $140,970). Liquidity risk management
Ultimate responsibility for liquidity risk management rests with the Board of Directors. The Board has determined an appropriate liquidity risk management framework for the management of the Group’s short, medium and long-term funding and liquidity management requirements. The Group manages liquidity risk by maintaining adequate reserves and continuously monitoring budgeted and actual cash flows and matching the maturity profiles of financial assets, expenditure commitments and liabilities.
The following are the contractual maturities of financial liabilities on an undiscounted basis, including estimated interest payments: Cash flows for liabilities without fixed amount or timing are based on conditions existing at year end.
Carrying amount
Contractual cash flows 1 year 2-5 years >5 years
2017 Trade and other payables 171,374 (171,374) (171,374) - - Loans and borrowings 22,300 (23,218) (23,218) - -
193,674 (194,592) (194,592) - -
2016 Trade and other payables 723,167 (723,167) (723,167) - - Loans and borrowings 31,962 (33,174) (33,174) - -
755,129 (756,341) (756,341) - -
For
per
sona
l use
onl
y

52
N O T E S T O T H E C O N S O L I D A T E D F I N A N C I A L S T A T E M E N T S for the year ended 30 June 2017
7. REVENUE AND OTHER INCOME AND EXPENSES
Diamond sales revenue* - 591,766
*The Group’s trial-mining activities in Sierra Leone commenced from September 2015 and were completed in May 2016.
Other income
Interest income 88,148 56,262 Rental income and recoverable outgoings 49,901 - Gain on sale of assets 2,623 - Foreign exchange gain 38,605 104,640
179,277 160,902
Corporate and administrative expenses include the following specific expenses:
(a) Depreciation
Furniture & Fittings 30,365 3,996
(b) Employee benefits expenses
Wages and salaries 115,193 125,990 Superannuation expense 9,500 9,178 Share-based payments (grant of options) (Note 28) 113,933 - Other employee benefits - 1,522
238,626 136,690
(c) Occupancy expenses 143,355 50,999
2017
$ 2016
$ 6. AUDITOR’S REMUNERATION
The following fees were paid or payable to the auditors and the auditors’ related practices:
Audit and review services
Auditors of the Company - BDO Audit (WA) Pty Ltd 43,107 44,144
Network firms of BDO Audit (WA) Pty Ltd 36,414 36,674
Audit and review of financial statements 79,521 80,818
Other Services
Auditors’ related practice – BDO Corporate Tax (WA) Pty Ltd - in relation to taxation services 6,630 10,134
Network firms of BDO Audit (WA) Pty Ltd - in relation to taxation services 25,929 -
32,559 10,134
For
per
sona
l use
onl
y

53
N O T E S T O T H E C O N S O L I D A T E D F I N A N C I A L S T A T E M E N T S for the year ended 30 June 2017
2017
$ 2016
$ 8. INCOME TAX
(a) Income tax expense Current tax expense - - Deferred tax expense - -
- -
(b) Numerical reconciliation between tax expense and pre-tax net loss
Loss before income tax expense (1,399,735) (4,188,563)
Income tax benefit calculated at rates at 27.5% (2016:30%) (384,927) (1,256,569) Effect of non-deductible items 31,624 (4,503) Timing difference not recognised 391,428 1,261,072 Differences in tax rate of subsidiaries operating in other jurisdictions (38,125) -
Income tax expense - -
(c) Deferred tax assets and liabilities not brought to account
The potential tax benefit for the following items for which no deferred tax asset has been recognised is as follows:
Carry forward tax losses 2,777,843 2,265,238 Capital raising costs 211,413 260,884 Provisions and accruals 128,387 78,227 Other 91,743 -
3,209,386 2,604,349
The tax benefits of the above deferred tax assets will only be obtained if: (a) the Group derives future assessable income of a nature and of an
amount sufficient to enable the benefits to be utilised; (b) the Group continues to comply with the conditions for deductibility
imposed by law; and (c) no changes in income tax legislation adversely affect the Group in
utilising the benefits.
The temporary difference relating to the following item for which no deferred tax liability has been recognised is as follows:
Other - (1,363,750) Exploration, evaluation and development costs (375,050) (385,640)
(375,050) (1,749,390)
9. CASH AND CASH EQUIVALENTS Cash at bank and in hand 1,068,249 8,636,589
The Group’s exposure to interest rate risk and a sensitivity analysis for financial assets and liabilities are disclosed in Note 5.
For
per
sona
l use
onl
y

54
N O T E S T O T H E C O N S O L I D A T E D F I N A N C I A L S T A T E M E N T S for the year ended 30 June 2017
2017
$ 2016
$ 10. TRADE AND OTHER RECEIVABLES
Current GST receivable 8,173 49,764 Sundry debtors 307,609 5,987 Interest receivable - 1,430 Loan to other entity (i) 1,500,000 - Loans to employees 1,622 433,965 Provision for impairment of loan to employees - (429,145)
1,817,404 62,001
Non-current Security Deposit – office Lease 70,584 -
(i) Loan to other entity
The Group provided a loan to other entity during the year for interest earning purpose. The loan was provided on 20 June 2017 for a term of 6 months at a fixed rate with interest payable wholly in advance. The loan is secured by first mortgage over several real-estate properties owned by the borrower.
There was no impairment loss booked to trade and other receivables for the financial year (2016: $140,970).
No receivables were past due but not impaired.
The Group’s exposure to credit risk related to trade and other receivables is disclosed in Note 5.
11. INVENTORY
Current Spare parts for processing plant at cost 176,767 167,562
176,767 167,562
There was no impairment loss booked to inventory for the financial year (2016: nil).
12. OTHER CURRENT ASSETS
Prepaid Insurance 109,839 116,090 Prepaid rent 20,548 9,489 Staff salary advance 1,820 941 Other advance payment to suppliers and contractor 98,593 112,562
230,800 239,082
For
per
sona
l use
onl
y

55
N O T E S T O T H E C O N S O L I D A T E D F I N A N C I A L S T A T E M E N T S for the year ended 30 June 2017
2017
$ 2016
$ 13. PROPERTY, PLANT & EQUIPMENT
Furniture & fittings – at cost 129,456 116,960 Less: Accumulated depreciation (78,409) (49,902)
51,047 67,058
Motor vehicles – at cost 440,693 448,381 Less: Accumulated depreciation (214,301) (121,283)
226,392 327,098
Plant & equipment – at cost 3,448,388 2,234,105 Less: Accumulated depreciation (686,955) (403,678)
2,761,433 1,830,427
Capital spares 13,383 13,823 Capital work in progress 118,526 380,726
3,170,781 2,619,132
Reconciliations of carrying amount
Furniture & Fittings
$
Motor vehicles
$
Plant & equipment
$
Capital spares & WIP
$
Total
$ Balance at 1 July 2015 77,417 238,605 3,077,986 35,328 3,429,336 Additions 36,626 251,610 29,230 382,629 700,095 Transfer between groups 2,001 - 9,720 (11,721) - Depreciation (30,244) (84,185) (268,289) - (382,718) Foreign exchange differences (18,742) (78,932) (1,018,220) (11,687) (1,127,581)
Balance at 30 June 2016 67,058 327,098 1,830,427 394,549 2,619,132
Balance at 1 July 2016 67,058 327,098 1,830,427 394,549 2,619,132 Additions 15,454 17,964 916,688 118,526 1,068,632 Transfer between groups - - 368,622 (368,622) - Depreciation (29,853) (108,271) (296,104) - (434,228) Foreign exchange differences (1,612) (10,399) (58,200) (12,544) (82,755)
Balance at 30 June 2017 51,047 226,392 2,761,433 131,909 3,170,781
2017
$ 2016
$ 14. EXPLORATION AND EVALUATION ASSETS
Exploration and evaluation costs carried forward in respect of areas of interest 20,300,092 14,824,010
Reconciliation
Carrying amount at beginning of the year 14,824,010 10,817,809 Exploration and evaluation 6,225,829 7,712,867 Sale of diamonds from exploration activities (304,620) (190,171) Tenement acquisition costs written off - (334,824) Exploration expenditure written off (2,942) (573,924) Foreign currency revaluation of Baoma tenement (38,837) 34,302 Foreign exchange differences in opening balances (403,348) (2,642,049)
Carrying amount at end of the year 20,300,092 14,824,010
The value of the exploration and evaluation costs carried forward is dependent upon the continuance of the Group’s rights to tenure of the areas of interest, the results of future exploration, and the recoupment of costs through successful development and exploitation of the areas of interest or alternatively by their sale.
For
per
sona
l use
onl
y

56
N O T E S T O T H E C O N S O L I D A T E D F I N A N C I A L S T A T E M E N T S for the year ended 30 June 2017
2017
$ 2016
$ 15. TRADE AND OTHER PAYABLES
Trade creditors 99,414 541,290 Other creditors and accruals 126,370 231,787
225,784 773,077
The Group’s exposure to credit and liquidity risks related to trade and other payables are disclosed in Note 5. The carrying amount of trade and other payables approximates its fair value.
16. LOANS & BORROWINGS
Insurance premium funding 22,301 31,962
The Group has an insurance premium funding arrangement with Hunter Premium Funding Limited (Hunter), under which the principal and interests will be repaid by ten equal monthly instalments. A flat interest rate of 7.81% (2016: 7.18%) was charged by Hunter. The Group’s exposure to credit and liquidity risks related to loans and borrowings are disclosed in Note 5. The carrying amount of loans and borrowings approximates its fair value.
17. EMPLOYEE BENEFITS
Provision for annual leave entitlements 30,434 82,145 Provision for employment termination benefits 93,594 84,908
124,028 167,053
The current provision for employee benefits includes all unconditional entitlements where employees have completed the required period of service and also those where employees are entitled to pro-rata payments in certain circumstances. The entire amount is presented as current, since the consolidated entity does not have an unconditional right to defer settlement. However, based on past experience, the consolidated entity does not expect all employees to take the full amount of accrued leave or require payment within the next 12 months.
18. CONTRIBUTED EQUITY
235,583,335 fully paid ordinary shares (2016: 225,583,335 fully paid ordinary shares) 38,964,752 36,141,400
(a) Ordinary shares
The following movements in ordinary share capital occurred during the financial year:
2017 Number
2016 Number
2017 $
2016 $
Balance at the beginning of the year 225,583,335 184,083,335 36,141,400 18,211,624
Issue of shares at $0.80 each for cash - 12,500,000 - 10,000,000
Exercise of options at $0.30 each 5,134,065 - 1,540,220 -
Issue of shares at $0.30 each per Option Underwriting Agreement 4,865,935 29,000,000 1,459,780 8,700,000
Share issue costs - - (176,648) (770,224)
Balance at the end of the year 235,583,335 225,583,335 38,964,752 36,141,400
For
per
sona
l use
onl
y

57
N O T E S T O T H E C O N S O L I D A T E D F I N A N C I A L S T A T E M E N T S for the year ended 30 June 2017
18. CONTRIBUTED EQUITY (continued)
Ordinary shares entitle the holder to participate in dividends and the proceeds from winding up of the Company in proportion to the number and amounts paid on the shares held.
On a show of hands every holder of ordinary securities present at a shareholder meeting in person or by proxy is, entitled to one vote, and upon a poll each share is entitled to one vote.
Ordinary shares have no par value and the Company does not have a limited amount of authorised capital. (b) Capital risk management
When managing capital, the Board’s objective is to ensure the entity continues as a going concern as well as to maintain optimal returns to shareholders and benefits for other stakeholders. The Board also aims to maintain a capital structure tha t ensures the lowest cost of capital available to the entity.
The Board is constantly adjusting the capital structure to take advantage of favourable costs of capital or high return on assets. As the market is constantly changing, management may issue new shares, sell assets to reduce debt or consider payment of dividends to shareholders.
The Board seeks to maintain a balance between the higher returns that might be possible with higher levels of borrowings and the advantages and security afforded by a sound capital position although there is no formal policy regarding gearing levels.
The Group has no formal financing and gearing policy or criteria during the year having regard to the early status of its development and low level of activity.
There were no changes in the Group’s approach to capital management during the year.
The Group is not subject to any externally imposed capital requirements.
2017 $
2016 $
19. OTHER RESERVES
Share Based Payments Reserve
Balance at beginning of year 40,000 40,000 Grant of options to directors and employees (Note 28) 113,933 - Exercise/expiry of options previously granted (40,000) -
Balance at end of year 113,933 40,000
Foreign Currency Translation Reserve
Balance at beginning of year (3,311,957) 2,169,586 Currency translation differences on translation of foreign operations (651,270) (5,481,543)
Balance at end of year (3,963,227) (3,311,957)
Total (3,849,294) (3,271,957)
Share based payments reserve
The reserve is used to recognise the values attributed to options over ordinary shares granted to consultants in consideration for the provision of services. Refer to Note 28 for details of share based payments during the year. Foreign currency translation reserve
The reserve is used to recognise exchange differences arising from translation of the financial statements of foreign operations to Australian dollars. The group has a fully owned subsidiary whose operations are located in Sierra Leone. The functional currency for the Group’s subsidiary operating in Sierra Leone is U.S. dollars (USD) (2016: Sierra Leonean Leone (SLL)). In accordance with the Group’s accounting policies as disclosed in Note 5, the assets and liabilities of foreign operations, including fair value adjustments arising on acquisition, are translated into AUD at the exchange rates at the reporting date. Exchange rate used by the Group for translation as at 30 June 2017 was AUD1 = USD0.7687 (30 June 2016: AUD1 = USD0.7443). The income and expenses of foreign operations are translated into AUD at the dates of the transactions.
For
per
sona
l use
onl
y

58
N O T E S T O T H E C O N S O L I D A T E D F I N A N C I A L S T A T E M E N T S for the year ended 30 June 2017
2017 $
2016 $
20. ACCUMULATED LOSSES
Accumulated losses at the beginning of the year (7,325,997) (3,137,434) Transfer from share-based payment reserve 40,000 - Net loss for the year (1,399,735) (4,188,563)
Accumulated losses at the end of the year (8,685,732) (7,325,997)
21. FAIR VALUE MEASUREMENT AASB 7 Financial Instruments Disclosures requires disclosure of fair value measurements by level of the following fair value measurement hierarchy:
(a) quoted prices (unadjusted) in active markets for identical assets or liabilities (level 1) (b) inputs other than quoted prices included within level 1 that are observable for the asset or liability, either directly (as
prices) or indirectly (derived from prices) (level 2), and (c) inputs for the asset or liability that are not based on observable market data (unobservable inputs) (level 3). None of the Group’s financial assets or liabilities are measured at fair value.
22. COMMITMENTS AND CONTINGENCIES Operating lease commitments
The Group leases various offices and accommodation houses under non-cancellable operating leases expiring within one to three years. The leases have varying terms, escalation clauses and renewal rights. On renewal, the terms of the leases are renegotiated. Commitments for minimum lease payments in relation to non-cancellable operating leases are payable as follows: 2017
$ 2016
$ Within one year 162,023 81,227 After one year but not more than five years 261,627 120,927
423,650 202,154
Service commitments
The Group has entered into various agreements with service providers to provide secretarial and accounting services in connection with the operations of the Group. Future payables arising from these service agreements as at 30 June are as follow: 2017
$ 2016
$ Within one year 140,333 144,000 After one year but not more than five years - 56,333
140,333 200,333
Exploration and project commitments
The Group has certain obligations to perform minimum exploration work on mining tenements held. These obligations may vary over time, depending on the Group’s exploration program and priorities. These obligations are also subject to variations by negotiation, joint venturing or relinquishing some of the relevant tenements.
As at reporting date, total exploration expenditure commitments in relation to tenements held by the Group which have not been provided for in the financial statements are as follows:
2017 $
2016 $
Within one year 437,380 643,804 After one year but not more than five years 3,005,362 5,786,831 More than five years 150,000 170,000
3,592,742 6,600,635
For
per
sona
l use
onl
y

59
N O T E S T O T H E C O N S O L I D A T E D F I N A N C I A L S T A T E M E N T S for the year ended 30 June 2017
22. COMMITMENTS AND CONTINGENCIES (continued) Contingencies
Pursuant to a tenement acquisition agreement entered into with Crest Metals Pty Ltd (Crest), the Company has agreed to pay Crest a 2% net smelter royalty in respect of all minerals produced from the tenements acquired. The Company has 70% interest in the tenements acquired from Crest.
Pursuant to a tenement acquisition agreement entered into with Anthony John Woodhill. Anthony William Kiernan, Archaean Exploration Services Pty Ltd, Woodline Pty Ltd, Plato Prospecting Pty Ltd, Carterton Holdings Pty Ltd and Newfield Central Pty Ltd (together, the Newfield Vendors), the Company has agreed to pay the Newfield Vendors a 2% net smelter royalty in respect of all minerals produced from the tenements acquired. In addition, a royalty of $10 per ounce of gold and 2% net smelter royalty on non-gold commodities produced on M77/422 and M77/846 is payable to Carterton Holdings Pty Ltd pursuant to a previous agreement in respect of those tenements.
Pursuant to an office lease agreement entered by the Company, the Company has provided a bank guarantee to the lessor for the amount of $70,584 (2016: nil), which has been cancelled subsequent to the balance date.
The Group does not have any other contingent liabilities at balance and reporting dates. 23. EARNINGS/(LOSS) PER SHARE
Basic and diluted earnings/(loss) per share The calculation of basic loss per share was based on the following:
2017
$ 2016
$ Loss attributable to ordinary shareholders of Newfield Resources Limited
Net loss for the year (1,399,735) (4,188,563)
Weighted average number of ordinary shares Number Number
Balance at beginning of year 225,583,335 184,083,335 Effect of shares issued during the financial year 265,049 8,908,470
225,848,384 192,991,805
Diluted earnings/(loss) per share must be calculated where potential ordinary shares on issue are dilutive. As the potential ordinary shares on issue would decrease the loss per share, they are not considered dilutive, and not shown. The number of potential ordinary shares is set out in Note 28.
For
per
sona
l use
onl
y

60
N O T E S T O T H E C O N S O L I D A T E D F I N A N C I A L S T A T E M E N T S for the year ended 30 June 2017
24. SEGMENT REPORTING
The Group operates predominantly in the mineral exploration industry in Australia and Sierra Leone. The Board has determined that the Group has three reportable segments, being mineral exploration Australia, mineral exploration Sierra Leone and corporate.
Mineral Exploration
Australia $
Mineral Exploration Sierra Leone
$
Corporate $
Group $
2017
Segment income - 41,228 138,049 179,277
Segment result (2,942) (684,717) (712,076) (1,399,735)
Segment assets 1,363,819 22,750,767 2,720,091 26,834,677
Segment liabilities (10,120) (245,283) (149,482) (404,885)
2016
Segment income - 591,766 56,261 648,027
Segment result (908,748) (2,314,499) (965,316) (4,188,563)
Segment assets 1,285,468 17,091,256 8,171,652 26,548,376
Segment liabilities (14,465) (845,655) (144,744) (1,004,864)
Geographical information
Income Geographical
non-current assets 2017
$ 2016
$ 2017
$ 2016
$ Australia 138,049 56,261 1,447,458 1,301,596 Sierra Leone 41,228 591,766 22,093,999 16,141,545
179,277 648,027 23,541,457 17,443,141
25. RELATED PARTY TRANSACTIONS
(a) Parent entity The Group is controlled by the following entity:
Place of Ownership interest Name Type incorporation 2017 2016
Newfield Resources Limited Ultimate Australian parent entity Australia 100% 100% (b) Subsidiaries Interests in subsidiaries are set out in Note 26.
For
per
sona
l use
onl
y

61
N O T E S T O T H E C O N S O L I D A T E D F I N A N C I A L S T A T E M E N T S for the year ended 30 June 2017
25. RELATED PARTY TRANSACTIONS (continued)
(c) Key management personnel compensation
2017
$ 2016
$
Short-term employee benefits 334,966 403,345 Post-employment benefits 9,500 11,513 Share-based payments 47,500 -
Total compensation 391,966 414,858
Detailed remuneration disclosures are provided in the Remuneration Report on pages 31 to 34. (d) Other transactions with key management personnel Some of the key management personnel hold positions in other entities that result in then having control or significant influence over the financial or operating policies of those entities. One of those entities transacted with the Group during the year. The terms and conditions of those transactions were no more favourable than those available, or which might reasonably be expected to be available, on similar transactions to unrelated entities on an arm’s length basis. The aggregate amounts recognised during the year relating to those transactions were as follows:
Transactions value year ended 30 June
Balance outstanding as at 30 June
Director Transaction 2017 $
2016 $
2017 $
2016 $
Mr A Ho Secretarial and accounting fees
60,000 60,000 5,500 5,500
Outstanding balances are unsecured and are repayable in cash.
26. INTERESTS IN SUBSIDIARIES The consolidated financial statements incorporate the assets, liabilities and results of the following wholly-owned subsidiaries in accordance with the accounting policy described in Note 4:
Name of entity
Place of business/country of
incorporation
Ownership interest held by the Group
Principal activities 2017 2016
Allotropes Diamonds Pty Ltd Australia 100% 100% Mineral Exploration
Allotropes Diamond Company Ltd Sierra Leone 100% 100% Mineral Exploration The consolidated financial statements incorporate the assets, liabilities and results of the following subsidiary with non-controlling interests in accordance with the accounting policy described in Note 4:
Name of entity
Place of business/country of
incorporation
Ownership interest held by the Group
Principal activities 2017 2016
Allotropes Mining Company Ltd* Sierra Leone 100% 100% Mineral Exploration * The non-controlling interest holds 25% of the voting rights of Allotropes Mining Company Ltd.
For
per
sona
l use
onl
y

62
N O T E S T O T H E C O N S O L I D A T E D F I N A N C I A L S T A T E M E N T S for the year ended 30 June 2017
2017
$ 2016
$ 27. RECONCILIATION OF CASH FLOWS USED IN OPERATING ACTIVITIES
(a) Cash flows from operating activities
Loss for the year (1,399,735) (4,188,563) Adjustments of non-cash/non-operating items: Depreciation 30,365 59,652 Share-based payments 113,933 - Gain on sale of assets (2,623) - Unrealised foreign exchange losses 1,050 3,148 Exploration expenditure written off 2,942 908,748 Impairment of mine development - 805,258 Other exploration and evaluation expenditure 658,999 822,659
Operating loss before changes in working capital and provisions (595,069) (1,589,098)
Change in trade and other receivables (69,154) (5,578) Change in other assets 20,639 (13,599) Change in trade and other payables 89,146 (316,401) Change in provisions (8,807) (3,633)
Net cash used in operating activities (563,245) (1,928,309)
(b) Non-cash investing and financing activities There were no non-cash investing or financing activities during the financial year.
28. SHARE BASED PAYMENTS
The following options were granted to directors and employees of the Group during the year:
Class Grant Date Expiry Date Exercise Price Number of Options
Unlisted Options 1 December 2016 30 December 2020 $0.50 6,000,000 Fair value of options granted The fair value of options granted during the half year was calculated at the date of grant using the Black-Scholes option-pricing model. The following table gives the assumptions made in determining the fair value of options on grant date:
Fair value per option 1.90 cents
Grant date 30 November 2016 Number of options 6,000,000 Expiry date 30 December 2020 Expected average exercise period 2.04 years Exercise price $0.50 30-day VWAP* $0.2305 Estimated volatility 50.65% Risk-free interest rate 2.30% Dividend yield 0%
*The calculation of 30-day VWAP includes share trading prices for both on-market and off-market trades.
The expected price volatility is based on the historical volatility (based on the remaining life of the options), adjusted for any expected changes to future volatility due to public available information. These options have no vesting conditions attached to them and are expensed in full on issue. Total expense recognised as share-based payments for the year was $113,933 (2016: nil).
For
per
sona
l use
onl
y

63
N O T E S T O T H E C O N S O L I D A T E D F I N A N C I A L S T A T E M E N T S for the year ended 30 June 2017
28. SHARE BASED PAYMENTS (continued)
Set out below are summaries of options granted by the Company:
Grant date Exercise
price Expiry date
Balance at start of the
year Number
Granted during the
year Number
Exercised/lapsed during the
year Number
Balance at end of the year
Number
Vested and exercisable at
end of the year
Number
2017
1 December 2016 $0.50 30 December 2020 - 6,000,000 - 6,000,000 6,000,000 31 March 2014 $0.30 15 June 2017 10,000,000 - (10,000,000) - -
10,000,000 6,000,000 (10,000,000) 6,000,000 6,000,000
Weighted Average exercise price $0.30 $0.50 $0.30 $0.50 $0.50
2016
31 March 2014 $0.30 15 June 2016 29,000,000 - (29,000,000) - - 31 March 2014 $0.30 15 June 2017 10,000,000 - - 10,000,000 10,000,000
39,000,000 - (29,000,000) 10,000,000 10,000,000
Weighted Average exercise price $0.30 - $0.30 $0.30 $0.30
The options outstanding at 30 June 2017 have a weighted average remaining contractual life of 42 months (2016: 11.5 months).
29 PARENT ENTITY DISCLOSURES
As at and throughout the financial year ended 30 June 2017 the parent entity of the Group was Newfield Resources Limited. (a) Summary financial information
Set out below is the supplementary information about the parent entity.
Statement of profit or loss and other comprehensive income
Parent 2017 2016 $ $
Loss after income tax (2,398,563) (6,772,876) Total comprehensive loss (2,398,563) (6,772,876)
Statement of financial position
Current assets 2,714,453 8,483,248
Total assets 25,654,110 25,114,995
Current liabilities 159,602 159,209
Total liabilities 159,602 159,209
Shareholder’s equity Issued capital 38,964,752 36,141,400 Share based payments reserves 113,933 40,000 Accumulated losses (13,584,177) (11,225,614)
Total equity 25,494,508 24,955,786
(b) Guarantees entered into by the parent entity
The parent entity did not provide any guarantees during the financial year (2016: nil).
For
per
sona
l use
onl
y

64
(c) Contingent liabilities of the parent entity Other than the contingencies disclosed in Note 22, the parent entity did not have any other contingent liabilities at year end (2016: nil).
(d) Contractual commitments for capital expenditure The parent entity did not have any commitment in relation to capital expenditure contracted but not recognised as liabilities as at reporting date (2016: nil).
30. EVENTS SUBSEQUENT TO REPORTING DATE
There has not arisen in the interval between the end of the year and the date of these financial statements any item, transaction or event of a material and unusual nature likely, in the opinion of the directors, to affect significantly the operations of the Group, the results of those operations, or the state of affairs of the Group in future financial years.
For
per
sona
l use
onl
y

65
D I R E C T O R S ’ D E C L A R A T I O N
In the opinion of the Directors of Newfield Resources Limited: (a) the financial statements and notes set out on pages 37 to 64, are in accordance with the Corporations Act 2001, including:
(i) giving a true and fair view of the Group’s financial position as at 30 June 2017 and of its performance, for the financial year ended on that date; and
(ii) complying with Accounting Standards, the Corporations Regulations 2001 and other mandatory professional
reporting requirements; and (b) the financial report also complies with International Financial Reporting Standards as issued by the International
Accounting Standards Board; and (c) there are reasonable grounds to believe that the Company will be able to pay its debts as and when they become due and
payable. Signed in accordance with a resolution of directors made pursuant to section 295(5)(a) of the Corporations Act 2001.
Anthony Ho Executive Director 29 September 2017 Perth
For
per
sona
l use
onl
y

BDO Audit (WA) Pty Ltd ABN 79 112 284 787 is a member of a national association of independent entities which are all members of BDO Australia Ltd ABN 77 050 110 275,an Australian company limited by guarantee. BDO Audit (WA) Pty Ltd and BDO Australia Ltd are members of BDO International Ltd, a UK company limited by guarantee, andform part of the international BDO network of independent member firms. Liability limited by a scheme approved under Professional Standards Legislation other than forthe acts or omissions of financial services licensees
Tel: +61 8 6382 4600Fax: +61 8 6382 4601www.bdo.com.au
38 Station StreetSubiaco, WA 6008PO Box 700 West Perth WA 6872Australia
INDEPENDENT AUDITOR'S REPORT
To the members of Newfield Resources Limited
Report on the Audit of the Financial Report
Opinion
We have audited the financial report of Newfield Resources Limited and its subsidiaries (the Group),which comprises the consolidated statement of financial position as at 30 June 2017, the consolidatedstatement of profit or loss and other comprehensive income, the consolidated statement of changes inequity and the consolidated statement of cash flows for the year then ended, and notes to thefinancial report, including a summary of significant accounting policies and the directors’ declaration.
In our opinion the accompanying financial report of the Group, is in accordance with the CorporationsAct 2001, including:
(i) Giving a true and fair view of the Group’s financial position as at 30 June 2017 and of itsfinancial performance for the year ended on that date; and
(ii) Complying with Australian Accounting Standards and the Corporations Regulations 2001.
Basis for opinion
We conducted our audit in accordance with Australian Auditing Standards. Our responsibilities underthose standards are further described in the Auditor’s responsibilities for the audit of the FinancialReport section of our report. We are independent of the Group in accordance with the CorporationsAct 2001 and the ethical requirements of the Accounting Professional and Ethical Standards Board’sAPES 110 Code of Ethics for Professional Accountants (the Code) that are relevant to our audit of thefinancial report in Australia. We have also fulfilled our other ethical responsibilities in accordance withthe Code.
We confirm that the independence declaration required by the Corporations Act 2001, which has beengiven to the directors of the Company, would be in the same terms if given to the directors as at thetime of this auditor’s report.
We believe that the audit evidence we have obtained is sufficient and appropriate to provide a basisfor our opinion.
Material uncertainty related to going concern
We draw attention to Note 2 in the financial report which describes the events and/or conditions whichgive rise to the existence of a material uncertainty that may cast significant doubt about the group’sability to continue as a going concern and therefore the group may be unable to realise its assets anddischarge its liabilities in the normal course of business. Our opinion is not modified in respect of thismatter.F
or p
erso
nal u
se o
nly
Key audit matters
Key audit matters are those matters that, in our professional judgement, were of most significance inour audit of the financial report of the current period. These matters were addressed in the context ofour audit of the financial report as a whole, and in forming our opinion thereon, and we do not providea separate opinion on these matters. In addition to the matter described in the Material uncertaintyrelated to going concern section, we have determined the matters described below to be the key auditmatters to be communicated in our report.
Accounting for Exploration and Evaluation Assets
Key audit matter How the matter was addressed in our audit
At 30 June 2017 the carrying value of thecapitalised exploration and evaluation asset was$20,300,092 (30 June 2016: $14,824,010), asdisclosed in Note 14. The Groups accountingpolicy with respect to Exploration and EvaluationAssets is disclosed in Note 4.
As the carrying value of the Exploration andEvaluation Asset represents a significant asset ofthe Group, we considered it necessary to assesswhether any facts or circumstances exist tosuggest that the carrying amount of this assetmay exceed its recoverable amount.
Judgement is applied in determining thetreatment of exploration expenditure inaccordance with Australian Accounting StandardAASB 6 Exploration for and Evaluation of MineralResources. In particular:
· Whether the conditions for capitalisationare satisfied;
· Which elements of exploration andevaluation expenditures qualify forrecognition; and
· Whether facts and circumstances indicatethat the exploration and expenditureassets should be tested for impairment.
As a result, this is considered a key audit matter.
Our procedures included, but were not limitedto:
• Obtaining a schedule of the areas ofinterest held by the Group and assessingwhether the rights to tenure of those areasof interest remained current at balancedate;
• Considering the status of the ongoingexploration programmes in the respectiveareas of interest by holding discussionswith management, and reviewing theGroup’s exploration budgets, ASXannouncements and director’s minutes;
• Considering whether any such areas ofinterest had reached a stage where areasonable assessment of economicallyrecoverable reserves existed;
• Verifying, on a sample basis, explorationand evaluation expenditure capitalisedduring the year for compliance with therecognition and measurement criteria ofAASB 6;
• Considering whether there are any otherfacts or circumstances existing to suggestimpairment testing was required; and
• Assessing the adequacy of the relateddisclosures in Note 14 to the FinancialStatements.
For
per
sona
l use
onl
y

Other information
The directors are responsible for the other information. The other information comprises theinformation in the Group’s annual report for the year ended 30 June 2017 but does not include thefinancial report and the auditor’s report thereon.
Our opinion on the financial report does not cover the other information and we do not express anyform of assurance conclusion thereon.
In connection with our audit of the financial report, our responsibility is to read the other informationand, in doing so, consider whether the other information is materially inconsistent with the financialreport or our knowledge obtained in the audit or otherwise appears to be materially misstated.
If, based on the work we have performed, we conclude that there is a material misstatement of thisother information, we are required to report that fact. We have nothing to report in this regard.
Responsibilities of the directors for the Financial Report
The directors of the Company are responsible for the preparation of the financial report that gives atrue and fair view in accordance with Australian Accounting Standards and the Corporations Act 2001and for such internal control as the directors determine is necessary to enable the preparation of thefinancial report that gives a true and fair view and is free from material misstatement, whether due tofraud or error.
In preparing the financial report, the directors are responsible for assessing the ability of the group tocontinue as a going concern, disclosing, as applicable, matters related to going concern and using thegoing concern basis of accounting unless the directors either intend to liquidate the Group or to ceaseoperations, or has no realistic alternative but to do so.
Auditor’s responsibilities for the audit of the Financial Report
Our objectives are to obtain reasonable assurance about whether the financial report as a whole is freefrom material misstatement, whether due to fraud or error, and to issue an auditor’s report thatincludes our opinion. Reasonable assurance is a high level of assurance, but is not a guarantee that anaudit conducted in accordance with the Australian Auditing Standards will always detect a materialmisstatement when it exists. Misstatements can arise from fraud or error and are considered materialif, individually or in the aggregate, they could reasonably be expected to influence the economicdecisions of users taken on the basis of this financial report.
A further description of our responsibilities for the audit of the financial report is located at theAuditing and Assurance Standards Board website at:
http://www.auasb.gov.au/auditors_responsibilities/ar1.pdf
This description forms part of our auditor’s report.
For
per
sona
l use
onl
y
Report on the Remuneration Report
Opinion on the Remuneration Report
We have audited the Remuneration Report included in pages 31 to 34 of the directors’ report for theyear ended 30 June 2017.
In our opinion, the Remuneration Report of Newfield Resources Limited, for the year ended 30 June2017, complies with section 300A of the Corporations Act 2001.
Responsibilities
The directors of the Company are responsible for the preparation and presentation of theRemuneration Report in accordance with section 300A of the Corporations Act 2001. Our responsibilityis to express an opinion on the Remuneration Report, based on our audit conducted in accordance withAustralian Auditing Standards.
BDO Audit (WA) Pty Ltd
Glyn O'Brien
Director
Perth, 29 September 2017
For
per
sona
l use
onl
y

BDO Audit (WA) Pty Ltd ABN 79 112 284 787 is a member of a national association of independent entities which are all members of BDO Australia Ltd ABN 77 050 110 275,an Australian company limited by guarantee. BDO Audit (WA) Pty Ltd and BDO Australia Ltd are members of BDO International Ltd, a UK company limited by guarantee, andform part of the international BDO network of independent member firms. Liability limited by a scheme approved under Professional Standards Legislation other than forthe acts or omissions of financial services licensees
38 Station StreetSubiaco, WA 6008PO Box 700 West Perth WA 6872Australia
Tel: +61 8 6382 4600Fax: +61 8 6382 4601www.bdo.com.au
DECLARATION OF INDEPENDENCE BY GLYN O’BRIEN TO THE DIRECTORS OF NEWFIELD RESOURCESLIMITED
As lead auditor of Newfield Resources Limited for the year ended 30 June 2017, I declare that, to thebest of my knowledge and belief, there have been:
1. No contraventions of the auditor independence requirements of the Corporations Act 2001 inrelation to the audit; and
2. No contraventions of any applicable code of professional conduct in relation to the audit.
This declaration is in respect of Newfield Resources Limited and the entities it controlled during theperiod.
Glyn O'Brien
Director
BDO Audit (WA) Pty Ltd
Perth, 29 September 2017
For
per
sona
l use
onl
y

71
S H A R E H O L D E R I N F O R M A T I O N
Details of shares and options as at 25 September 2017: Top holders The 20 largest registered holders of each class of quoted equity security as at 25 September 2017 were:
Fully paid ordinary shares – quoted
Name No. of Shares %
1. Citicorp Nominees Pty Limited 50,960,630 21.63 2. Rustiyan Oen 30,958,028 13.14 3. PT Griyainsani Cakrasadaya 25,000,000 10.61 4. Wonder Holding Pty Ltd 19,833,334 8.42 5. QP & Co Pty Ltd <Quppi Family A/C> 10,500,000 4.46 6. Anrinza Future Pty Ltd 10,418,185 4.42 7. Ka Bio Ong 8,200,000 3.48 8. Serng Yee Liew 5,556,090 2.36 9. HSBC Custody Nominees (Australia) Limited 4,877,674 2.07 10. Renewable Holdings Pty Ltd <Letcher Family A/C> 4,873,311 2.07 11. Chewkart Super Pty Ltd 4,660,000 1.98 12. Goodrich Capital Pty Ltd 4,150,000 1.76 13. BNP Paribas Nominees Pty Ltd <IB AU Noms Retail Client DRP> 3,038,977 1.29 14. Mr Octavianus Budiyanto 2,973,819 1.26 15. Mr James Aripin 2,973,819 1.26 16. David Pursell 2,800,000 1.19 17. Robert Ang 2,660,300 1.13 18. Kingsfield Pty Ltd 2,000,000 0.85 19. Mr Giap Chng Ooi 1,865,000 0.79 20. Mr Leonard Hartana 1,626,771 0.69
199,925,938 84.86
Registered holders holding 20% or more of each class of unquoted equity security as at 25 September 2017 were:
Options exercisable at $0.50 on or before 30 December 2020 – unquoted
Name No. of Options %
Michael David Lynn 1,500,000 25.00
Distribution schedules A distribution schedule of each class of equity security as at 25 September 2017:
Fully paid ordinary shares Options exercisable at $0.50 on or before 30 December 2020
Range Holders Units % Range Holders Units %
1 - 1,000 44 7,824 0.00 1 - 1,000 0 0 0 1,001 - 5,000 20 67,916 0.03 1,001 - 5,000 0 0 0 5,001 - 10,000 69 646,692 0.28 5,001 - 10,000 0 0 0
10,001 - 100,000 62 2,659,736 1.13 10,001 - 100,000 5 500,000 8.33 100,001 - Over 75 232,201,167 98.56 100,001 - Over 14 5,500,000 91.67
Total 270 235,583,335 100.00 Total 19 6,000,000 100.00
For
per
sona
l use
onl
y

72
S H A R E H O L D E R I N F O R M A T I O N
Substantial shareholders The names of substantial shareholders and the number of shares to which each substantial shareholder and their associates have a relevant interest, as disclosed in substantial shareholding notices given to the Company, are set out below:
Substantial shareholder Number of Shares
Asia Pacific Horizon Capital 37,140,236 Rustiyan Oen 29,665,558 PT Griyainsani Cakrasadaya 25,000,000 Wonder Holdings Pty Ltd 16,858,334
Restricted securities or securities subject to voluntary escrow As at 25 September 2017, the Company had no restricted securities on issue.
Unmarketable parcels Holdings less than a marketable parcel of ordinary shares (being 1,587 shares as at 25 September 2017):
Holders Units
46 9,984
Voting Rights The voting rights attaching to ordinary shares are: On a show of hands, every member present in person or by proxy shall have one vote, and upon a poll, each share shall have one vote. Options do not carry any voting rights.
On-Market Buy Back There is no current on-market buy-back. Principles of Good Corporate Governance and Recommendations The Board has adopted and approved the Company’s Corporate Governance Statement, which can be found on the Company’s website at www.newfieldresources.com.au.
For
per
sona
l use
onl
y

73
S U M M A R Y O F T E N E M E N T S
Summary of tenements as at 29 September 2017
Projects Licence Number
Area (km²)
Status Newfield’s
Interest
Western Australia
Newfield M77/0422
0.85 Granted 100%
Newfield M77/0846
0.39 Granted 100%
Crest Yard P16/2722
2.00 Granted 70% Crest Yard P16/2726 1.66 Granted 70% Crest Yard P16/2728 0.82 Granted 70% Crest Yard P16/2729 1.89 Granted 70% Crest Yard P16/2730 1.60 Granted 70% Crest Yard P16/2731 1.90 Granted 70% Sierra Leone
Baoma EL15/2012
101.50 Granted 100%
Sumboya EL12/2014
162.82 Granted 100% Hima EL19/2014 249.50 Granted 100% Jomu EL20/2014 212.25 Granted 100%
For
per
sona
l use
onl
y