for personal use only fy20 full year results...this slide must be copied from pre-formatted slide to...
TRANSCRIPT

This slide must be copied from pre-formatted slide to retain the lines and logo.
FY20 Full Year Results22 June 2020
For
per
sona
l use
onl
y

1 FY20 Full Year ResultsFY20 Full Year Results 1
Jeff AdamsGroup Chief Executive Officer
Group update and divisional results
For
per
sona
l use
onl
y

2FY20 Full Year Results
Championing SuccessfulIndependents
FY20 Full Year Results 2
Our purpose Our vision Our values
We believe:Independence is worth fighting for; in treating our people, retailers and suppliers the way we like to be treated; and in giving back to the communities where we live and work
Best store in town
Passionate about independents
A favourite place to work
Business partner of choice
Support thriving communities
For
per
sona
l use
onl
y

3FY20 Full Year Results
Championing the success of our independent retailers
FY20 – an unprecedented year
A year of challenges
• The year included significant challenges including devastating bushfires and the global COVID-19 pandemic
• These challenges highlighted the vital role our independent retailers play in supporting their local communities
• We proudly supported our independent retailers through these difficult times
Bushfires
• Our strong presence in rural and regional Australia meant the bushfires impacted many of our independent retailers
• Support was focused on ensuring our retailers were safe and supplied with emergency items
• Worked closely with government and emergency services to ensure isolated retailers received appropriate supplies
• Established ‘Tool Libraries’ in affected communities to provide access to trade quality tools to assist with rebuilding
• Metcash, together with the retailer network donated ~$1.3m to support impacted communities
• Stories of extraordinary efforts by our retailers to support their community are available at www.metcash.com
NSW Rural Fire Service collecting items donated by Crookwell IGA
Volunteers unloading items donated by Donges Supa IGA Young at the Tumut Recovery Centre
For
per
sona
l use
onl
y

4FY20 Full Year Results
Championing the success of our independent retailers
FY20 – an unprecedented year continued
COVID-19 pandemic
• Reset business priorities early in response to COVID-19 pandemic• Protecting the health and wellbeing of our people• Keeping our supply chains open to ensure delivery of essential goods• Keeping our business financially strong by protecting our balance sheet
• We managed these key priorities despite extraordinary demand across our businesses, particularly Food, and the closure of a portion of our Liquor business• Invested in COVID-19 safe work procedures and PPE which enabled all our facilities to remain operating throughout the crisis period• Our Food distribution centres operated 24/7 during the initial period of the crisis, working the equivalent of an additional ~11,000 person days• Worked closely with government to ensure supply of product, particularly to country and remote locations• Accelerated expansion of digital capability and launched online offers in Food and Liquor• Supported Liquor customers impacted by government shutdown of the Australian ‘on-premise’ market and our New Zealand operations• Assisted retailers to implement COVID-19 safe operating environment in stores • Strengthened financial position through equity raising
• Impact on reported results• Significant uplift in sales in Food as well as in DIY in Hardware• Liquor negatively impacted by closures in New Zealand and ‘on premise’ in Australia (these account for ~20% of total Liquor sales)• Incremental operating costs to deliver priorities • Impairment of $10.9m (after tax) reported as a significant itemF
or p
erso
nal u
se o
nly

5FY20 Full Year Results
• Group revenue increased 2.9% to $13.0bn and, including charge through sales, was up 2.0% to $14.9bn
• All Pillars responded well to service our retailers in a very challenged environment impacted by both bushfires and COVID-19
• Food delivered sales growth, even if the positive uplift in sales due to COVID-19 in March and April is excluded. Supermarkets wholesale sales (ex-tobacco) reported underlying sales growth for the first time since FY12, confirming our strategic initiatives are delivering positive results
• Liquor delivered its seventh consecutive year of sales growth despite the COVID-19 related closure of Australian ‘on-premise’ businesses and our New Zealand operations
• Hardware returned to positive sales growth in 2H20 with strong DIY sales
• Underlying Group EBIT (pre AASB16) was $324.2m. Excluding the impact of the loss of Drakes and a lower contribution from lease resolutions, this is an improvement of ~$12m on last year
• Statutory loss after tax (post AASB16) of $56.8m includes impairment to goodwill and other assets in 1H20 of $242.4m (post tax)
• Strengthened financial position through equity raising
• Strong start to FY21 with continued sales growth in the first seven weeks of the new year
• Proposed acquisition of Total Tools Holdings
Group highlightsF
or p
erso
nal u
se o
nly

6FY20 Full Year Results
Results overview by pillar
61%25%
14%
Sales revenue (%)(including charge through)
Food
Liquor
Hardware
54%
21%
25%
Underlying EBIT (%)
Food
Liquor
Hardware
FY20$m
FY19$m
Change%
Sales revenue (including charge through sales)
Food 9,103.7 8,794.3 3.5%
Liquor 3,678.4 3,666.9 0.3%
Hardware 2,075.0 2,102.0 (1.3%)
Total sales revenue (including charge through sales) 14,857.1 14,563.2 2.0%
Less: Charge through sales (1,831.7) (1,902.9) (3.7%)
Total sales revenue (Statutory Accounts) 13,025.4 12,660.3 2.9%
FY20Pre AASB16
$m
FY19Pre AASB16
$mChange
%
Underlying EBIT
Food 177.5 182.7 (2.8%)
Liquor 70.6 71.2 (0.8%)
Hardware 81.2 81.2 -
Business Pillars 329.3 335.1 (1.7%)
Corporate (5.1) (5.1) -
Total underlying EBIT (pre AASB16) 324.2 330.0 (1.8%)
Add: AASB16 adjustment1 10.7 - -
Total EBIT (Statutory Accounts) 334.9 330.0 1.5%
1. An analysis of AASB16 adjustments by Pillar is shown in Appendix 2.
For
per
sona
l use
onl
y
7FY20 Full Year Results
-3.8%-3.5%
-1.9% -1.3% -0.3% -1.6%
8.0%0.3% 2.5%
12.3%
-4.0%
-2.0%
0.0%
2.0%
4.0%
6.0%
8.0%
10.0%
12.0%
14.0%
1H18 2H18 1H19 2H19 1H20 Nov19 -Feb20
2H20
Rate
of c
hang
e (%
)
Wholesale sales (ex-tobacco)
As reported Excluding Drakes (SA)
Supermarkets
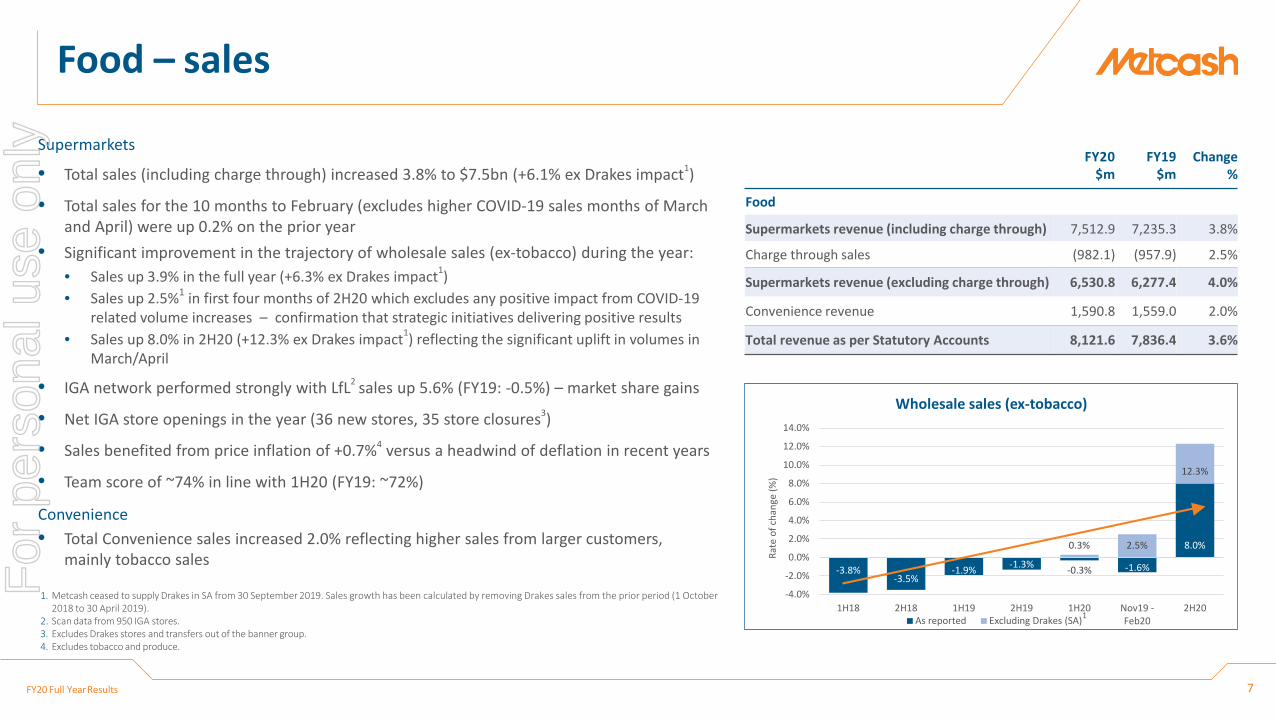
• Total sales (including charge through) increased 3.8% to $7.5bn (+6.1% ex Drakes impact1)
• Total sales for the 10 months to February (excludes higher COVID-19 sales months of March and April) were up 0.2% on the prior year
• Significant improvement in the trajectory of wholesale sales (ex-tobacco) during the year:• Sales up 3.9% in the full year (+6.3% ex Drakes impact1) • Sales up 2.5%1 in first four months of 2H20 which excludes any positive impact from COVID-19
related volume increases – confirmation that strategic initiatives delivering positive results• Sales up 8.0% in 2H20 (+12.3% ex Drakes impact1) reflecting the significant uplift in volumes in
March/April
• IGA network performed strongly with LfL2 sales up 5.6% (FY19: -0.5%) – market share gains
• Net IGA store openings in the year (36 new stores, 35 store closures3)
• Sales benefited from price inflation of +0.7%4 versus a headwind of deflation in recent years
• Team score of ~74% in line with 1H20 (FY19: ~72%)
Convenience • Total Convenience sales increased 2.0% reflecting higher sales from larger customers,
mainly tobacco sales
Food – sales
1. Metcash ceased to supply Drakes in SA from 30 September 2019. Sales growth has been calculated by removing Drakes sales from the prior period (1 October 2018 to 30 April 2019).
2. Scan data from 950 IGA stores.3. Excludes Drakes stores and transfers out of the banner group.4. Excludes tobacco and produce.
FY20$m
FY19$m
Change%
Food
Supermarkets revenue (including charge through) 7,512.9 7,235.3 3.8%
Charge through sales (982.1) (957.9) 2.5%
Supermarkets revenue (excluding charge through) 6,530.8 6,277.4 4.0%
Convenience revenue 1,590.8 1,559.0 2.0%
Total revenue as per Statutory Accounts 8,121.6 7,836.4 3.6%
1
For
per
sona
l use
onl
y

8FY20 Full Year Results
• Reported EBIT of $182.7m includes a positive AASB16 adjustment of $5.2m
• EBIT (pre AASB16) declined $5.2m (2.8%) to $177.5m
• Underlying EBIT (pre AASB16) improved by ~$12m after adjusting for:• A decline in the contribution from the resolution of onerous lease obligations
• The impact of ceasing to supply Drakes in SA from 30 September 2019
• The movement in underlying EBIT (pre AASB16) reflects: • The contribution from increased sales, particularly in March/April
• Marginally higher costs were incurred in March/April to deliver the spike in sales and manage COVID-19 impacts
• EBIT margin declined 20bps due to the additional cost to service customers as a result of COVID-19 restrictions and an investment in price, in part driven by higher volume rebates to retailers
• Continued focus on operating costs helped offset the impact of inflation
• Improved earnings from joint ventures
Food – EBIT
1. Total revenue includes charge through sales of $982.1m (FY19: $957.9m).2. EBIT margin: EBIT (pre AASB16) / Total revenue (including charge through sales).
FY20$m
FY19$m
Change%
Total revenue1 (including charge through) 9,103.7 8,794.3 3.5%
EBIT (Statutory Accounts) 182.7 182.7 -
Less: AASB16 adjustment (5.2) - -
EBIT (Pre AASB16) 177.5 182.7 (2.8%)
EBIT margin² 1.9% 2.1% (20bps)
Ritchies IGA, Rowville, VIC
For
per
sona
l use
onl
y

9FY20 Full Year Results
COVID-19 change Impact on Food pillar and response
• Change in consumer behaviour• Increase in number of people cooking at home• Preference for local neighbourhood shopping
• Food sales up ~18% in March and April• Increase in new customer visits• Increase in average basket size• Decrease in frequency of customer visits
• Increase in online shopping • Launched ‘IGA Shop Online’ in May with initial range of 1,800 SKUs
• Importance of supply to regional and remote communities • Worked with governments and local authorities to supply regional and remote communities
• Safety of employees and customers a key priority• Support for elderly, vulnerable, isolated and essential service workers
• Invested in COVID safe work practices and PPE in our DCs and support for our retailers through provision at no cost of sanitisers and protective equipment
• Launched ‘IGA Priority Shop’• Provision of weekly grocery packs to doctors and nurses at St Vincent’s
Hospital, Sydney
Food – COVID-19
Look to retain market share gains from new customers who have shifted to IGA
Increase in competitiveness of independent retailers through new online offer
Continued strong focus on safety and community support
Effective supply to regional and remote communities (~45% of store network)
For
per
sona
l use
onl
y

10FY20 Full Year Results
Food – MFuture Initiatives
• Small format store trial completed with learnings being rolled out to Xpress network
• First ‘SupaValu’ large format store opened at Doonside, NSW
• Current focus on core IGA brand, stores and standards
• Roll out of ‘Low Prices Every Day’ improving price competitiveness and driving sales growth
• DSA program remains key driver of improvement in quality of store network
• Further 124 stores completed DSA program resulting in ~40% of network now being upgraded. Average retail sales growth ~15%
• Increased retailer confidence – 36 new IGA storesopened in FY20
• Community Co well received by retailers and customers
• New ranges launched in ready meals, delivering value to customers and better returns to retailers
• Further range expansion expected in FY21
• New Distribution Centre in South Australia to be completed by end of CY20
• Suppliers re-entering network included Bulla & Manassen –supports drive to be broad-range low cost distribution provider
• Warehouse efficiency and cost-out initiatives delivered significant savingsSTORE NETWORK
PRIVATE LABELSTORE CLARITY
LOW COST OPERATOR
Focus is on further improving competitiveness of retailer network
For
per
sona
l use
onl
y

11FY20 Full Year Results
• Total sales (including charge through) increased 0.3% to $3.7bn, despite being adversely impacted by COVID-19 restrictions in March/April
• Total sales for the 10 months to February (pre COVID-19 impact) increased 2.2% due to:• Value growth from continuation of ‘premiumisation’ trend• Increase in ‘on-premise’ sales
• March/April sales impacted by:• Government shutdown of Australian ‘on-premise’ market and New Zealand
operations from 23 March (represents ~20% of total Liquor pillar sales)• Consumers shifting away from ‘premiumisation’ trend • An increase in volumes in Australian retailer network due to:
• Buying in anticipation of government shutdowns• Increased demand following shutdown of Australian ‘on-premise’ market • Increased preference for local neighbourhood shopping
• IBA LfL1 retail sales increased 3.2% in the year supported by continued network investment and increased demand in March/April
• Percentage of sales through IBA bannered network in-line with prior year at ~53%
Liquor – sales
Porters Liquor store, Narrabeen, NSW1. Scan data from 584 stores.
FY20$m
FY19$m
Change%
Total revenue as per Statutory Accounts 3,670.3 3,658.8 0.3%
Charge through sales 8.1 8.1 -
Total revenue (including charge through) 3,678.4 3,666.9 0.3%
For
per
sona
l use
onl
y

12FY20 Full Year Results
• Reported EBIT of $72.8m includes a positive AASB16 adjustment of $2.2m
• EBIT (pre AASB16) decreased $0.6m to $70.6m reflecting the impact of COVID-19 restrictions• Australian ‘on-premise’ and New Zealand businesses were unable to trade for five
weeks in March/April due to government shut-downs. These two businesses account for ~20% of Liquor pillar sales
• Additional costs associated with managing impacted Australian ‘on-premise’ and New Zealand customers
• Additional costs associated with managing health and safety risks
• EBIT margin2 maintained at 1.9%
Liquor – EBIT
1. Total revenue includes charge through sales of $8.1m (FY19: $8.1m).2. EBIT margin: EBIT (pre AASB16) / Total revenue (including charge through).
FY20$m
FY19$m
Change%
Total revenue1 (including charge through) 3,678.4 3,666.9 0.3%
EBIT (Statutory Accounts) 72.8 71.2 2.2%
Less: AASB16 adjustment (2.2) - -
EBIT (Pre AASB16) 70.6 71.2 (0.8%)
EBIT margin2 1.9% 1.9% -
IGA Liquor store, Strathfieldsaye, VIC
For
per
sona
l use
onl
y
13FY20 Full Year Results
Liquor – COVID-19
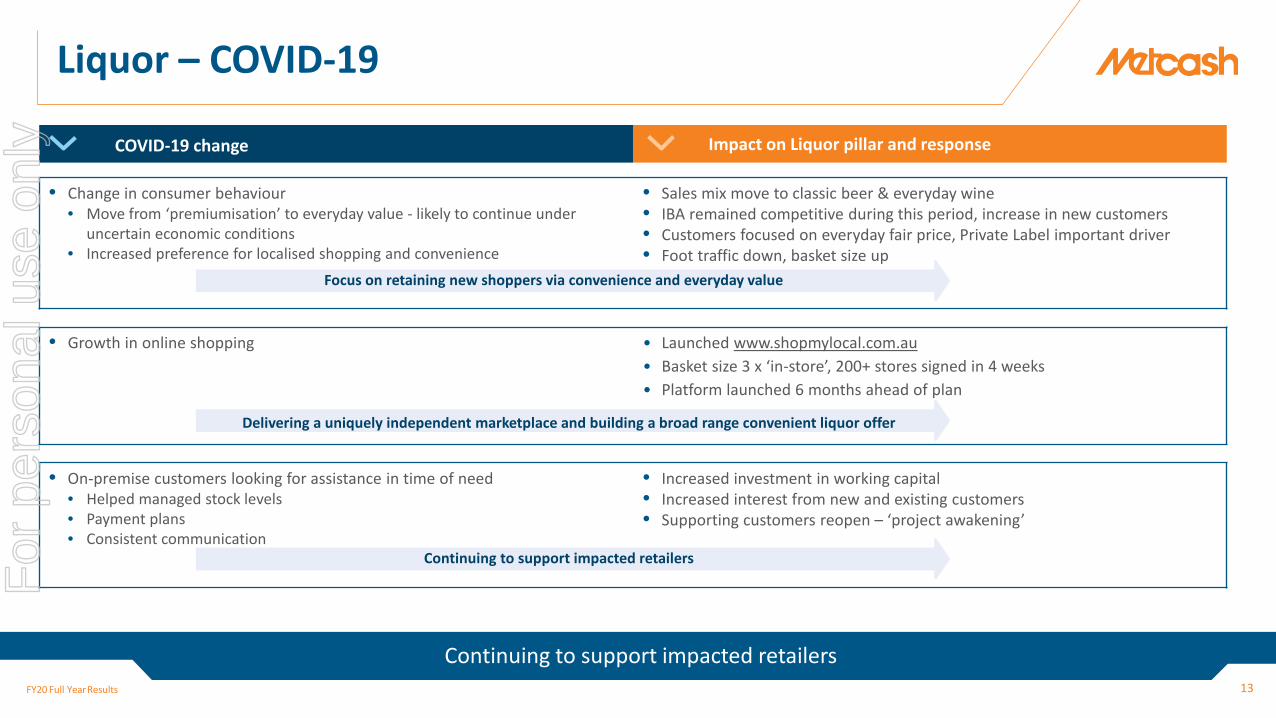
COVID-19 change Impact on Liquor pillar and response
• Change in consumer behaviour• Move from ‘premiumisation’ to everyday value - likely to continue under
uncertain economic conditions• Increased preference for localised shopping and convenience
• Sales mix move to classic beer & everyday wine • IBA remained competitive during this period, increase in new customers • Customers focused on everyday fair price, Private Label important driver • Foot traffic down, basket size up
• Growth in online shopping • Launched www.shopmylocal.com.au• Basket size 3 x ‘in-store’, 200+ stores signed in 4 weeks• Platform launched 6 months ahead of plan
• On-premise customers looking for assistance in time of need• Helped managed stock levels• Payment plans• Consistent communication
• Increased investment in working capital• Increased interest from new and existing customers• Supporting customers reopen – ‘project awakening’
Delivering a uniquely independent marketplace and building a broad range convenient liquor offer
Focus on retaining new shoppers via convenience and everyday value
Continuing to support impacted retailers
Continuing to support impacted retailers
For
per
sona
l use
onl
y

14FY20 Full Year Results
Liquor – MFuture initiatives
• Accelerating growth opportunities through expansion of digital capability• Launched new e-commerce platform ‘Shop My Local’ in April with 200+ stores• Significant retailer engagement and support for Loyalty program• Integrated POS program underway• Data excellence program to enhance quality of legacy data
• Continued to enhance the quality of the network through investment in stores and cool room upgrades• Further expansion of private and exclusive label range available to the network• Acquired private label brand portfolio from Kollaras – key accelerator of private label growth strategy• Expansion of Porters network slowed due to COVID-19• Successfully renewed supply agreement with large contract customer
• Good progress in addressing historical under-indexing in ‘on-premise’ market pre COVID-19• ~650 new customers added in FY20 which helped deliver ‘on-premise’ sales growth of 10% pre COVID-19• Investment in supporting customers impacted by COVID-19 restrictions• Launched ALM Agora online market place connecting on-premise venues directly with suppliers
STORE NETWORK
ON-PREMISE
DIGITAL
Prioritising growth opportunities in digital, private label
For
per
sona
l use
onl
y

15FY20 Full Year Results
• Total sales (including charge through) decreased 1.3% to $2.08bn reflecting the impact of the slowdown in construction activity on Trade sales and the loss of a large HTH customer in QLD in 1H19
• Total sales were down 2.8% for the 10 months to February (pre COVID-19 impact), reflecting a decline in Trade sales and loss of a large HTH customer in QLD in 1H19
• Significant improvement in 2H20 with sales up 1.8% (1H20: -4.2%) buoyed by positive impact of COVID-19 in March/April
• Strong demand in DIY categories, particularly paint and garden• Some forward purchasing in Trade in anticipation of restrictions• Benefit from strengthening retail store network
• Total wholesale LfL1 sales to IHG banner group were flat in 2H20 (1H20: -2.6%) resulting in a full year decline of 1.1%
• Retail LfL2 sales increased 1.6% in 2H20 (1H20: -3.2%) resulting in a full year decline of 0.7%
• Higher margin DIY sales increased to 37% of sales mix (FY19: 35%)
• Online sales increased ~40%, albeit from a relatively low base
• Supply agreements signed with two new large customers in QLD and SA
Hardware – sales
Tait Mitre 10 Mt Waverly, VIC1. Includes sales to independent retailers and company-owned stores.2. Based on a sample of 198 network stores that provide scan data (represents >50% of sales).
FY20$m
FY19$m
Change%
Total revenue as per Statutory Accounts 1,233.5 1,165.1 5.9%
Charge through sales 841.5 936.9 (10.2%)
Total revenue (including charge through) 2,075.0 2,102.0 (1.3%)
For
per
sona
l use
onl
y

16FY20 Full Year Results
• Reported EBIT of $84.2m includes a positive AASB16 adjustment of $3.0m
• EBIT (pre AASB16) was in line with FY19 at $81.2m
• The impact of the decline in sales was offset by: • Higher contribution from an increase in proportion of DIY sales • Cost savings (further rationalisation of DC network and a reduction in company store
costs)• Acquisitions including G. Gay & Co (Vic) and Keith Timber (SA)
• IHG wholesale EBIT margin of 3.0%
• Total IHG EBIT margin maintained at 3.9%
Hardware – EBIT
1. Total revenue includes charge through sales of $841.5m (FY19: $936.9m). 2. EBIT margin: EBIT (pre AASB16) / Total revenue (including charge through). Versatile Mitre 10, Malaga, WA
FY20$m
FY19$m
Change%
Total revenue1 (including charge through) 2,075.0 2,102.0 (1.3%)
EBIT (Statutory Accounts) 84.2 81.2 3.7%
Less: AASB16 adjustment (3.0) - -
EBIT (Pre AASB16) 81.2 81.2 -
EBIT margin² 3.9% 3.9% -
For
per
sona
l use
onl
y
17FY20 Full Year Results
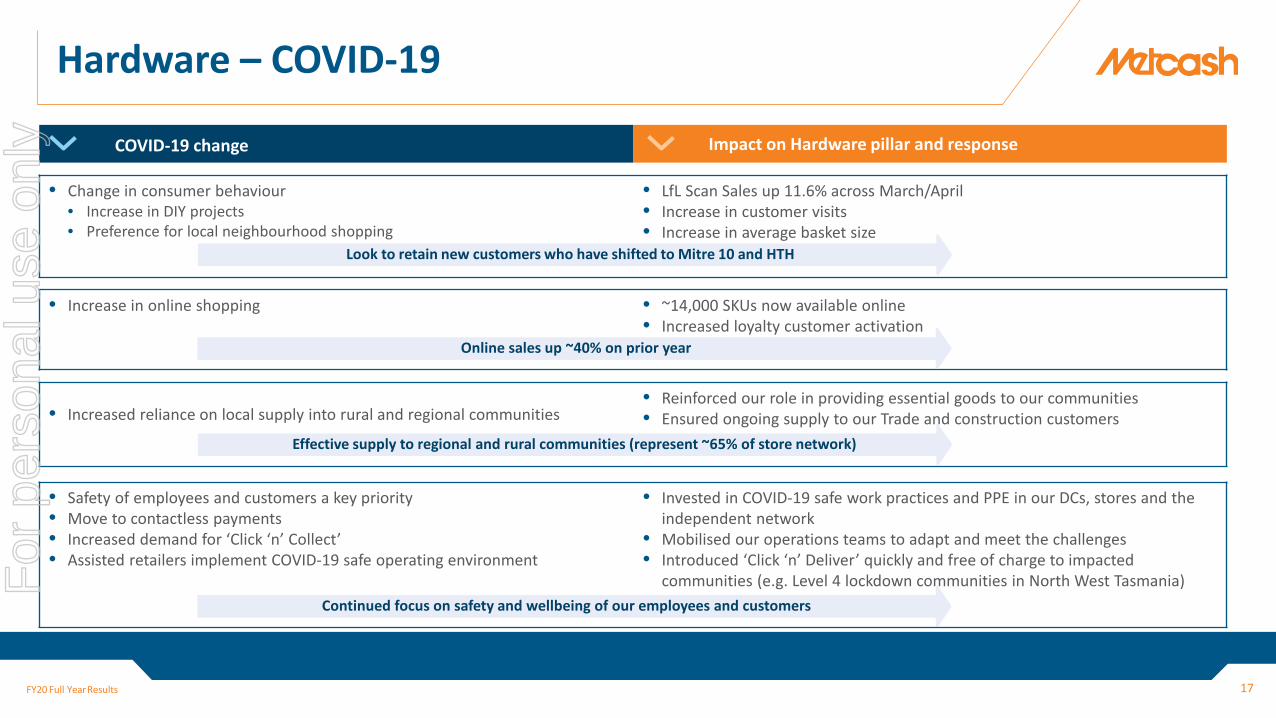
Continued focus on safety and wellbeing of our employees and customers
Hardware – COVID-19
COVID-19 change Impact on Hardware pillar and response
• Change in consumer behaviour• Increase in DIY projects• Preference for local neighbourhood shopping
• LfL Scan Sales up 11.6% across March/April• Increase in customer visits• Increase in average basket size
• Increase in online shopping • ~14,000 SKUs now available online• Increased loyalty customer activation
• Increased reliance on local supply into rural and regional communities• Reinforced our role in providing essential goods to our communities• Ensured ongoing supply to our Trade and construction customers
• Safety of employees and customers a key priority• Move to contactless payments• Increased demand for ‘Click ‘n’ Collect’• Assisted retailers implement COVID-19 safe operating environment
• Invested in COVID-19 safe work practices and PPE in our DCs, stores and the independent network
• Mobilised our operations teams to adapt and meet the challenges• Introduced ‘Click ‘n’ Deliver’ quickly and free of charge to impacted
communities (e.g. Level 4 lockdown communities in North West Tasmania)
Online sales up ~40% on prior year
Look to retain new customers who have shifted to Mitre 10 and HTH
Effective supply to regional and rural communities (represent ~65% of store network)
For
per
sona
l use
onl
y

18FY20 Full Year Results
Hardware – MFuture initiatives
• Sapphire store upgrades continuing to improve the quality of the network. 90 stores have completed the program delivering average retail sales growth of >15%
• Significant support of the program by Independents reinvesting into their business and their communities
• Number of Trade Only stores increased to 19, with plans to increase to 40 by 2022
• Progressing ‘Whole of House’ strategy with frame & truss facilities in place, alliances established and staff training completed
• New supply agreements with large trade customers, QLD and SA
• Proposed acquisition of Total Tools Holdings
• Further advanced leading Trade technology including: Truck Tracker, Trade Online and Trade+
• Significant increase in SKUs available online to ~14,000 (FY19: ~3,000)
• Average online retail sale ~$200 which is four times larger than ‘in store’
• Online sales growth of 40% in FY20
• Company-owned retail network core to ensuring a strong independent model
• Six acquisitions (17 sites) in FY20 increased network of retail stores to 105
• Retail network represents ~15% of total stores and ~40% of total IHG sales
• Closed NSW DC and opened new state-of-the-art DC in QLD (NSW served out of VIC and QLD)
• DC consolidation in WA planned for Q1 FY21
• Continued strong focus on costs
• Cost resets in company-owned retail network most exposed to slowdown in construction activity
BUILD TRADE
SAPPHIRE PROGRAM
DIGITAL & TRADE TECHNOLOGY
GROW RETAIL NETWORK
GROW RETAIL NETWORK
COSTS
IHG remains well positioned as the second largest player in the market
For
per
sona
l use
onl
y

19 FY20 Full Year ResultsFY20 Full Year Results 19
Brad SollerGroup Chief Financial Officer
Financials
For
per
sona
l use
onl
y

20FY20 Full Year Results
Metcash adopted AASB16 on 1 May 2019 which has resulted in the recognition of ‘right of use’ assets, lease receivables and lease liabilities.
Balance Sheet• Initial recognition of ‘right of use’ asset, sublease receivable and offsetting liability
• Asset value of $936.8m (includes ‘right of use’ assets of $601.5m and sublease receivable of $335.3m)
• Liability of $939.1m (includes both Metcash occupied properties and back to back retail lease obligations)
Profit and Loss• The new standard results in an increase in EBIT of $10.7m and an increase in EBITDA of $108.5m in FY20
• This is offset by higher depreciation of $97.8m and net finance costs of $26.1m
• The impact on Net Profit After Tax in FY20 was to reduce profit by $10.9m
Cashflows• No impact on net cashflows
• Increase in reported operating cashflows offset by higher investing and financing cashflows
Comparatives
The prior comparative year has not been restated in the statutory accounts
AASB16 Leases
Further details are contained in Appendix A of the FY20 statutory financial report
For
per
sona
l use
onl
y

21FY20 Full Year Results
FY20(Post AASB16)
$m
FY20(Pre AASB16)
$m
FY19(Pre AASB16)
$m
Sales revenue 13,025.4 13,025.4 12,660.3
EBITDA 492.1 383.6 386.4Depreciation and amortisation (157.2) (59.4) (56.4)EBIT 334.9 324.2 330.0Net finance costs (52.0) (25.9) (28.9)Profit before tax and NCI 282.9 298.3 301.1Tax (82.5) (87.0) (88.5)Non-controlling interests (1.6) (1.6) (2.3)Underlying profit after tax 198.8 209.7 210.3Significant items (post tax) (255.6) (255.6) (17.5)Reported (loss)/profit after tax (56.8) (45.9) 192.8
EPS based on underlying profit after tax 21.8c 23.0c 22.6c
ROFE1 24.9% N/A 27.7%
Profit & Loss
1. ROFE based on underlying EBIT and the average of opening and closing funds employed.
For
per
sona
l use
onl
y

22FY20 Full Year Results
FY20$m
1H20$m
FY19$m
Impairment of goodwill and other assets 242.4 242.4 -
COVID-19 related impairment 15.6 - -
MFuture restructure costs and South Australia DC costs 10.5 6.9 5.6Working Smarter and HTH restructure costs - - 19.4Total significant items before tax 268.5 249.3 25.0Tax (12.9) (7.1) (7.5)Significant items after tax 255.6 242.2 17.5
Significant items
• Impairment of goodwill and other assets – impairment of goodwill in the Food pillar in 1H20 related to advice from 7-Eleven that it does not intend to renew its current supply agreement which concludes on 12 August 2020
• COVID-19 related impairment primarily relates to provisions for losses on receivables from customers impacted by COVID-19 restrictions and the write off of prepaid commitments for events
• MFuture restructure and South Australia DC costs of $3.6m were incurred in 2H20
For
per
sona
l use
onl
y

23FY20 Full Year Results
Cashflows
FY20(Post AASB16)
$m
FY20(Pre AASB16)
$m
FY19(Pre AASB16)
$mNet cash from operating activities 117.5 33.0 244.9Net cash used in investing activities (36.4) (81.6) (47.9)
Capital expenditure (61.5) (61.5) (54.2)Acquisitions of businesses (29.7) (29.7) (11.8)Proceeds from sale of businesses/assets and net loan movements 9.6 9.6 18.1Receipts from subleases 45.2 - -
Dividends paid (118.2) (118.2) (127.4)Payments for lease liabilities (129.7) - -Proceeds from equity raising 294.3 294.3 -Off-market share buy-back - - (150.3)Other financing activities (5.3) (5.3) (2.9)Reduction/(increase) in net debt 122.2 122.2 (83.6)
Cash realisation ratio (CRR)1 33.0% 12.3% 91.8%
Adjusted cash realisation ratio (CRR) 2 68.1% 58.7% 91.8%
1. Cash realisation ratio (CRR) = Cash flow from operations/underlying NPATDA (depreciation and amortisation not tax effected).
AASB16 has no impact on net cashflows but does require significant reclassifications. FY19 is presented on a pre AASB16 basis except for net debt which has been revised to comply with AASB16
Operating cashflows in FY20 negatively impacted by a $209m increase in working capital, of which ~$125m is related to COVID-19 Capital expenditure broadly in line with depreciation and amortisation (pre AASB16) The outflow from acquisitions of businesses primarily relates to acquisitions in the Hardware pillar Metcash raised $294.3m of equity in April 2020, net of costs
.2. Adjusted for $125m increase in working capital related to COVID-19 restrictions.
For
per
sona
l use
onl
y

24FY20 Full Year Results
Balance Sheet
1. The Group revised the presentation of lease balances on its Balance Sheet upon adoption of AASB16. Comparative information has been reclassified to align with the current presentation.
30 April 2020 (Post AASB16)
$m
30 April 20191
(Pre AASB16)$m
Trade receivables and prepayments 1,559.0 1,472.5Inventories 1,032.2 779.3
Trade payables and provisions (2,181.9) (2,051.5)Net working capital 409.3 200.3Intangible assets 581.8 793.5Property, plant and equipment 214.0 218.0Equity accounted investments 77.6 87.7Customer loans and assets held for resale 56.3 48.2Capital investments 929.7 1,147.4Total funds employed 1,339.0 1,347.7Lease receivables 292.7 -‘Right of use’ assets 485.4 7.8Lease provisions (58.1) (159.0)Lease liabilities (886.1) (7.4)Lease balances (166.1) (158.6)
Net cash/(debt) 86.7 (35.5)Tax, put options and derivatives 112.0 96.5Net Assets/Equity 1,371.6 1,250.1
For
per
sona
l use
onl
y

25FY20 Full Year Results
Capital management
• Steps taken to strengthen balance sheet in April due to uncertainty associated with COVID-19
• Raised ~$300m of equity
• Secured additional $180m of committed short term debt facilities
• Additional financial flexibility has enabled the Group to:
• Support the retailer network during COVID-19 restrictions
• Invest in growth opportunities
• Continued investment in MFuture growth program
• Three bolt-on acquisitions (~$45m)
• Liquor Centre in NZ completed
• Kollaras private label liquor brand portfolio
• Large Hardware independent retailer – in progress
• Proposed acquisition of 70% of Total Tools Holdings for ~$57m – in final negotiations
For
per
sona
l use
onl
y

26FY20 Full Year Results
Total Tools
About Total Tools • Total Tools Holdings Pty Ltd (“Total Tools”) is the franchisor to the largest tool retail network in Australia • 81 stores nationwide generating sales of ~$555m1
• Differentiated by targeting professional tradespeople (“tradies”) who require high quality tools for commercial use
• Total Tools’ offer:• Range: A broad range of tools, accessories, consumables and specialist trade equipment• Brands: Leading local and global professional tool brands as well as a successful own brand offering• Service: Professional services, solutions and advice to help customers get the most out of their tools and
improve onsite efficiency• Operating for over 30 years
Metcash believes the rationale for acquiring Total Tools is compelling as the acquisition would:• Align with Metcash’s strategy to be the leading supplier to independents in each of its three Pillars
• Enhance Metcash’s position in the Australian hardware market which will benefit independent retailers in both Total Tools and the Independent Hardware Group
• Increase the Hardware pillar’s exposure to trade customers
• Support Total Tools’ vision to remain a leading professional tool retail network
• Strengthen both Metcash’s and Total Tools’ existing independent networks
• Provide Metcash with a more balanced mix of earnings across its operating pillars
• Result in significant value creation opportunities and synergies
81 National Stores Network
69
18
18
26
2
1
1
22 25 30 33 41 4959
6879 81
FY11 FY12 FY13 FY14 FY15 FY16 FY17 FY18 FY19 Current
Growth in store network
1. 12 months ended 31 December 2019.
For
per
sona
l use
onl
y

27FY20 Full Year Results
Total Tools continued
Proposed acquisition
• To acquire 70% of Total Tools for ~$57m1
• Consistent with Metcash’s successful approach in its Hardware pillar, Metcash would look, over time, to have a mix of store ownership, including both independently owned and joint venture retail stores
• The proposal includes Metcash having a clear pathway to acquire the remaining 30% stake in Total Tools via a put and call option
• Metcash will provide Total Tools with a $35m debt facility as part of the acquisition to support its growth plans and the potential future acquisition of interests in a select number of stores
• The proposed acquisition is subject to negotiation of final binding transaction documentation, which will be undertaken under a period of exclusivity. Metcash can give no assurances at this stage as to whether these discussions will lead to a binding transaction
• The proposed acquisition is subject to approval by the ACCC
1. Calculated with reference to 70% of the headline Enterprise Value on a cash free, debt free basis and assuming a normal level of working capital on completion.
For
per
sona
l use
onl
y

28FY20 Full Year Results
• Net cash of $86.7m (FY19: Net debt $35.5m)• Average net debt of ~$345m (FY19: ~$300m)• Average tenor of debt 1.8 years• Refinanced $85m of existing debt facilities • Secured additional $180m of committed short-term debt facilities • Balanced debt maturity profile• Looking to refinance $225m of debt facilities in 1H21 (matures 08/21)
Net debt
1. The Group revised the presentation of net debt on its Balance Sheet upon adoption of AASB16. Net debt excludes all liabilities related to AASB16 and lease liabilities. Finance lease obligations which were previously classified as net debt are now separately disclosed as Lease Liabilities on the Balance Sheet under the new standard (FY19: $7.4m)
2. Weighted average cost of debt over the period (excludes line fees)3. Underlying EBITDA/Net Interest Expense (pre AASB16)4. Net Debt/(Shareholders’ Equity + Net Debt)5. Underlying EBITDAR/(Net Interest Expense + Net Rent Expense) (pre AASB16)6. Gross Debt/Underlying EBITDA (pre AASB16)
FY20 $m
FY19$m
Net debt1
Gross debt (188.4) (178.1)
Cash and cash equivalents 275.1 142.6
Net cash / (debt) 86.7 (35.5)
Debt metrics and ratios
Weighted average debt maturity 1.8 years 2.9 years
Weighted average cost of debt2 2.8% 3.4%
% Fixed debt 68% 50%
Interest coverage3 25.9x 25.2x
Gearing ratio4 (6.7%) 2.8%
Underlying EBITDAR coverage5 3.8x 3.8x
Gross debt coverage6 0.5x 0.5x
0
50
100
150
200
250
300
350
400
FY21 FY22 FY23 FY24 FY25
$m
Debt Maturity Profile
Working capital New facility Syndicated facility
For
per
sona
l use
onl
y

29FY20 Full Year Results
• FY20 final dividend• 6.5 cents per share, fully franked• Ex-dividend date: 7 July 2020• Record date: 8 July 2020• Payment date: 5 August 2020
• Total dividends for FY20 12.5 cents per share, fully franked
• Dividend payout ratio of ~60% of underlying earnings per share
DividendsF
or p
erso
nal u
se o
nly
30 FY20 Full Year ResultsFY20 Full Year Results 30
Jeff AdamsGroup Chief Executive Officer
Group Outlook
For
per
sona
l use
onl
y

31FY20 Full Year Results
Food
• Sales in the first seven weeks of FY21 continued to benefit from a change in consumer behaviour with total Food sales up 9.3%, and Supermarkets wholesale sales (ex-tobacco) up 16.7% (ex Drakes impact)
• The earnings benefit from the increase in sales continues to be marginally offset by higher costs to service the elevated demand and manage health and safety risks
• As previously advised, there will be no sales to Drakes in South Australia in FY21 and there will be lower sales to 7-Eleven
• The business is continuing to progress its growth initiatives focused on further improving the competitiveness of its retailer network and its strong focus on costs to help offset the impact of inflation and other cost pressures
Liquor
• Sales for the first seven weeks of FY21 increased 5.5% despite customers in New Zealand and ‘on premise’ customers in Australia being impacted by COVID-19 trading restrictions
• New Zealand and Australia ‘on-premise’ trading restrictions were partially lifted in May and early June, and all trading restrictions in New Zealand lifted on 9 June 2020
• The increase in sales for the first seven weeks, excluding customers impacted by the trading restrictions, was ~15%
• The business is focused on managing through the changed external environment while also progressing its strategic initiatives including private label and accelerating the rollout of its new ‘Shop My Local’ online offer across the network
OutlookF
or p
erso
nal u
se o
nly
32FY20 Full Year Results
Hardware
• Hardware sales for the first seven weeks of FY21 have increased 9.4% underpinned by continuing strong demand in DIY categories
• Trade sales in FY21 are expected to continue to be impacted by a slowdown in construction activity. Weak indicators of future residential construction suggest further weakness in the Trade sector is likely from the second half of FY21. However, the Government’s recently announced stimulus package to boost residential construction and renovations activity is expected to help mitigate this weakness
• The business is continuing to progress its growth initiatives in Trade, DIY and digital, and has a strong focus on costs to help offset the impact of any reduction in sales volumes
COVID-19
• There is uncertainty over the timing of further lifting of COVID-19 restrictions in Australia and the extent that our businesses will continue to benefit from the favourable change in consumer behaviour
Outlook continuedF
or p
erso
nal u
se o
nly
FY20 Full Year Results ‹#›
1. Financial history
2. AASB16 reconciliation
3. Bannered store numbers
Appendices
For
per
sona
l use
onl
y

34FY20 Full Year Results
FY20 (Post AASB16)
FY20(Pre AASB16)
FY191
(Pre AASB16)FY181
(Pre AASB16)FY171
(Pre AASB16)FY161
(Pre AASB16)
Financial PerformanceSales revenue ($m) 13,025.4 13,025.4 12,660.3 12,442.2 12,293.0 11,716.5EBIT2($m) 334.9 324.2 330.0 334.6 304.8 286.7Net finance costs ($m) (52.0) (25.9) (28.9) (26.4) (33.6) (38.3)Underlying profit after tax2 ($m) 198.8 209.7 210.3 216.9 194.8 178.3Reported (loss)/profit after tax2 ($m) (56.8) (45.9) 192.8 (148.2) 171.9 216.5Operating cash flows ($m) 117.5 33.0 244.9 276.3 304.6 165.8Cash realisation ratio3 (%) 33% 12% 92% 101% 118% 70%
Financial PositionShareholder’s equity2 ($m) 1,371.6 N/A 1,250.1 1,334.2 1,583.2 1,369.1Net cash/(debt) ($m) 86.7 N/A (42.9) 42.8 (80.8) (275.5)Gearing ratio4 (%) (6.7%) N/A 3.3% (3.2%) 4.7% 16.8%Return on funds employed5 (%) 24.9% N/A 27.7% 24.4% 19.0% 17.2%
Share StatisticsFully paid ordinary shares 1,016.4 1,016.4 909.3 975.6 975.6 928.4Weighted average ordinary shares 910.1 910.1 928.6 975.6 958.8 928.4Underlying earnings per share2 (cents) 21.8 23.0 22.6 22.2 20.3 19.2Reported (loss)/earnings per share2 (cents) (6.2) (5.0) 20.8 (15.2) 17.9 23.3Dividends declared per share (cents) 12.5 12.5 13.5 13.0 4.5 -
1. Financial history
1. No prior periods have been restated for the impact of AASB162. EBIT, profit after tax, shareholder’s equity and EPS have been adjusted to reflect AASB15 in FY19 and FY18 and not in earlier
periods
3. Cash flows from operations / Underlying NPAT + Depreciation and Amortisation (depreciation and amortisation not tax effected)4. Net Debt / (Shareholders’ Equity + Net Debt)5. Underlying EBIT / Average funds employed
For
per
sona
l use
onl
y

35FY20 Full Year Results
2. Impact of AASB16 – Profit & Loss
1. Details relating to the change are included in Appendix A of the FY20 statutory financial report.
FY20
Pre AASB16$m
AASB16adjustment¹
$mPost AASB16
$mFood 177.5 5.2 182.7Liquor 70.6 2.2 72.8Hardware 81.2 3.0 84.2Total Pillar EBIT 329.3 10.4 339.7Corporate (5.1) 0.3 (4.8)Total underlying EBIT 324.2 10.7 334.9Net finance costs (25.9) (26.1) (52.0)Tax (87.0) 4.5 (82.5)Non-controlling interest (1.6) - (1.6)Underlying profit after tax 209.7 (10.9) 198.8
FY20$m
Total underlying EBIT pre AASB16 324.2Add: Net rent 110.4Less: Depreciation of ‘Right of Use’ assets (97.8)Less: Other movements (1.9)Total underlying EBIT post AASB16 334.9
For
per
sona
l use
onl
y

36FY20 Full Year Results
2. Impact of AASB16 – Balance Sheet
30 April 2019(As reported)
$m
AASB16 reclassifications
$m
AASB16 adjustments
$m
1 May 2019(Post transition)
$m
Trade receivables and prepayments 1,472.5 - - 1,472.5Inventories 779.3 - - 779.3Trade payables and provisions (2,210.5) 159.0 - (2,051.5)Net working capital 41.3 159.0 - 200.3Intangible assets 793.5 - - 793.5Property, plant and equipment 225.8 (7.8) - 218.0Equity accounted investments 87.7 - - 87.7Customer loans and assets held for resale 48.2 - - 48.2Capital investments 1,155.2 (7.8) - 1,147.4Total funds employed 1,196.5 151.2 - 1,347.7Lease receivables - - 316.0 316.0‘Right of use’ assets - 7.8 546.7 554.5Lease provisions - (159.0) 74.1 (84.9)Lease liabilities - (7.4) (939.1) (946.5)Lease balances - (158.6) (2.3) (160.9)
Net debt (42.9) 7.4 - (35.5)Tax, put options and derivatives 96.5 - 0.7 97.2Net Assets / Equity 1,250.1 - (1.6) 1,248.5
For
per
sona
l use
onl
y

37FY20 Full Year Results
3. Bannered store numbers
April2020
April2019
PillarSupermarkets 1,623 1,673Campbells 16 17Liquor 2,679 2,667Hardware 650 668Total 4,968 5,025
Supermarkets Campbells Liquor Hardware TotalStore movementNumber of stores at April 2019 1,673 17 2,667 668 5,025Stores opened / joined banner group during the period 49 - 227 7 283Stores closed / left banner group during the period (99) (1) (215) (25) (340)Number of stores at April 2020 1,623 16 2,679 650 4,968
For
per
sona
l use
onl
y

38FY20 Full Year Results
3. Bannered store numbers
April April2020 2019
SupermarketsSupa IGA 323 373IGA 789 792IGA-Xpress 225 220Total IGA bannered stores 1,337 1,385Friendly Grocer / Eziway 286 288Total Supermarkets 1,623 1,673
LiquorCellarbrations 543 557Bottle-O & Bottle-O Neighbourhood 232 237IGA Liquor 471 467Porters 26 22Thirsty Camel (NSW/ACT, QLD, TAS, SA/NT) 141 150Big Bargain 47 54Other 1,219 1,180Total Liquor 2,679 2,667
HardwareMitre 10 321 308Home Timber & Hardware 168 196True Value Hardware and Thrifty-Link 161 164Total Hardware 650 668
For
per
sona
l use
onl
y

39FY20 Full Year Results
Disclaimer
Visit our website: www.metcash.com
For additional information contact:
Contact detailsSteve AsheHead of Corporate Affairs & Investor RelationsPhone: +61 408 164 011E-mail: [email protected]
Merrin HodgeInvestor Relations ManagerPhone: +61 429 235 104Email: [email protected]
This presentation contains summary information about Metcash Limited (ABN 32 112 073 480) (Metcash) and its activities current as at the date of this presentation. The information in this presentation is of general background and does not purport to be complete. It should be read in conjunction with Metcash’s other periodic and continuous disclosure announcements filed with the Australian Securities Exchange, which are available at www.asx.com.au.
This presentation is for information purposes only and is not a prospectus or product disclosure statement, financial product or investment advice or a recommendation to acquire Metcash shares or other securities. It has been prepared without taking into account the objectives, financial situation or needs of individuals. Before making an investment decision, prospective investors should consider the appropriateness of the information having regard to their own objectives, financial situation and needs and seek legal and taxation advice appropriate to their jurisdiction. Metcash is not licensed to provide financial product advice in respect of Metcash shares or other securities. Past performance is no guarantee of future performance.
No representation or warranty, expressed or implied, is made as to the fairness, accuracy, completeness or correctness of the information, opinions and conclusions contained in this presentation. To the maximum extent permitted by law, none of Metcash and its related bodies corporate, or their respective directors, employees or agents, nor any other person accepts liability for any loss arising from the use of this presentation or its contents or otherwise arising in connection with it, including, without limitation, any liability from fault or negligence on the part of Metcash, its related bodies corporate, or any of their respective directors, employees or agents.
This presentation may contain forward-looking statements including statements regarding our intent, belief or current expectations with respect to Metcash’s business and operations, market conditions, results of operations and financial condition, specific provisions and risk management practices. When used in this presentation, the words “likely”, “estimate”, “project”, “intend”, “forecast”, “anticipate” ,”believe”, “expect”, “may”, “aim”, “should”, “potential” and similar expressions, as they relate to Metcash and its management, are intended to identify forward-looking statements. Forward looking statements involve known and unknown risks, uncertainties and assumptions and other important factors that could cause the actual results, performance or achievements of Metcash to be materially different from future results, performance or achievements expressed or implied by such statements. Readers are cautioned not to place undue reliance on these forward-looking statements, which speak only as of the date thereof.
For
per
sona
l use
onl
y
