for personal use only - asx · local agent finder property management and sales referrals anne...
TRANSCRIPT

The online home for property investors
Analyst Presentation
March 2016(ASX:REV)
For
per
sona
l use
onl
y

Important Notice and Disclaimer
2March 2016 Market Update
This presentation includes “forward-looking statements.” These can be identified by words such as “may”, “should”, “anticipate”, “believe”, “intend”,“estimate” and “expect”. Statements which are not based on historic or current facts may be forward-looking statements.
Forward-looking statements are based on assumptions regarding the Real Estate Investar Group’s financial position, business strategies, plans andobjectives of management for future operations and development and the environment in which the Real Estate Investar Group will operate.
Forward-looking statements are based on current views, expectations and beliefs as at the date they are expressed and which are subject to var iousrisks and uncertainties. Actual results , performance or achievements of the Real Estate Investar Group could be materially different from thoseexpressed in, or implied by, these forward-looking statements. The forward-looking statements contained in this presentation are not guarantees orassurances of future performance and involve known and unknown risks, uncertainties and other factors, many of which are beyond the control ofthe Real Estate Investar Group, which may cause the actual results, performance or achievements of the Real Estate Investar Group to differmaterially from those expressed or implied by the forward-looking statements. For example, the factors that are likely to affect the results of the RealEstate Investar Group include general economic conditions in Australia; exchange rates; competition in the markets in which the Real Estate InvestarGroup does and will operate and the inherent regulatory risks in the businesses of the Real Estate Investar Group. The forward-looking statementscontained in this presentation should not be taken as implying that the assumptions on which the projections have been prepared are correct orexhaustive.
The Real Estate Investar Group disclaims any responsibil ity for the accuracy or completeness of any forward-looking statement. The Real EstateInvestar Group disclaims any responsibility to update or revise any forward-looking statement to reflect any change in the Real Estate InvestarGroup’s financial condition, status or affairs or any change in the events, conditions or circumstances on which a statement is based, except asrequired by law.
The projections or forecasts included in this presentation have not been audited, examined or otherwise reviewed by the independent auditors of theReal Estate Investar Group. Unless otherwise stated, all amounts are based on A-IFRS and are in Australian Dollars. Certain figures may be subject torounding differences. Any market share information in this presentation is based on management estimates based on internally availableinformation unless otherwise indicated.
You must not place undue reliance on these forward-looking statements.
This presentation is not an offer or invitation for subscription or purchase of, or a recommendation of securities. The securities referred to in thesematerials have not been and will not be registered under the United States Securities Act of 1933 (as amended) and may not be offered or sold in theUnited States absent registration or an exemption from registration.
This presentation is unaudited.
For
per
sona
l use
onl
y
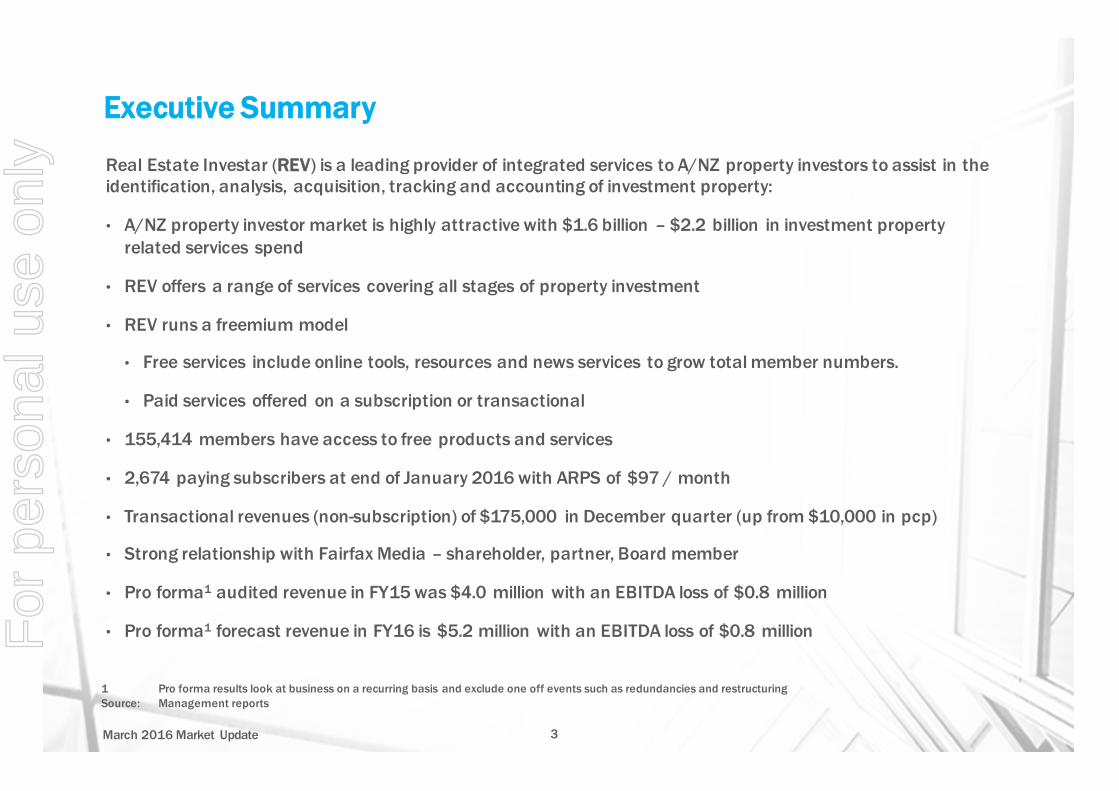
Executive Summary
Real Estate Investar (REV) is a leading provider of integrated services to A/NZ property investors to assist in the identification, analysis, acquisition, tracking and accounting of investment property:
• A/NZ property investor market is highly attractive with $1.6 billion – $2.2 billion in investment property related services spend
• REV offers a range of services covering all stages of property investment
• REV runs a freemium model
• Free services include online tools, resources and news services to grow total member numbers.
• Paid services offered on a subscription or transactional
• 155,414 members have access to free products and services
• 2,674 paying subscribers at end of January 2016 with ARPS of $97 / month
• Transactional revenues (non-subscription) of $175,000 in December quarter (up from $10,000 in pcp)
• Strong relationship with Fairfax Media – shareholder, partner, Board member
• Pro forma1 audited revenue in FY15 was $4.0 million with an EBITDA loss of $0.8 million
• Pro forma1 forecast revenue in FY16 is $5.2 million with an EBITDA loss of $0.8 million
3March 2016 Market Update
1 Pro forma results look at business on a recurring basis and exclude one off events such as redundancies and restructuring Source: Management reports
For
per
sona
l use
onl
y

Agenda
4
1 2 3 4
The Opportunity
Growth Opportunity
and Forecasts
KPI’s and Financials
Business Overview
March 2016 Market Update
For
per
sona
l use
onl
y

A/NZ Residential Real Estate Market
Residential property market
• 11.2 million residential dwellings
• 2.8 million rented properties (25% of total)
Residential real estate sales per year
• 550,000+ sales
• $320+ billion by value
New development sales (subset of residential)
• 80,000 – 100,000 sales per year
• 4 – 5% in commission
• $400,000 average sale price
• $1.2 – $2.0 billion in commission from new development sales
5March 2016 Market Update
Source: Australian Bureau of Statistics (ABS), Residential Dwellings: Values, Mean Price and Number by State and Territories; ABS, Yearbook of Australia 2012; ABS, Perspectives on Regional Australia: Housing Arrangements - Home Ownership in Local Government Areas; Statistics New Zealand, 2013 Census QuickStats about Housing.
Investment property sales
• Approximately 40% of all sales to property investors (~220,000)
• 50% of new development sales to investors (40,000 – 50,000 transactions)
• A/NZ based investors account for 80 – 90% sales
For
per
sona
l use
onl
y
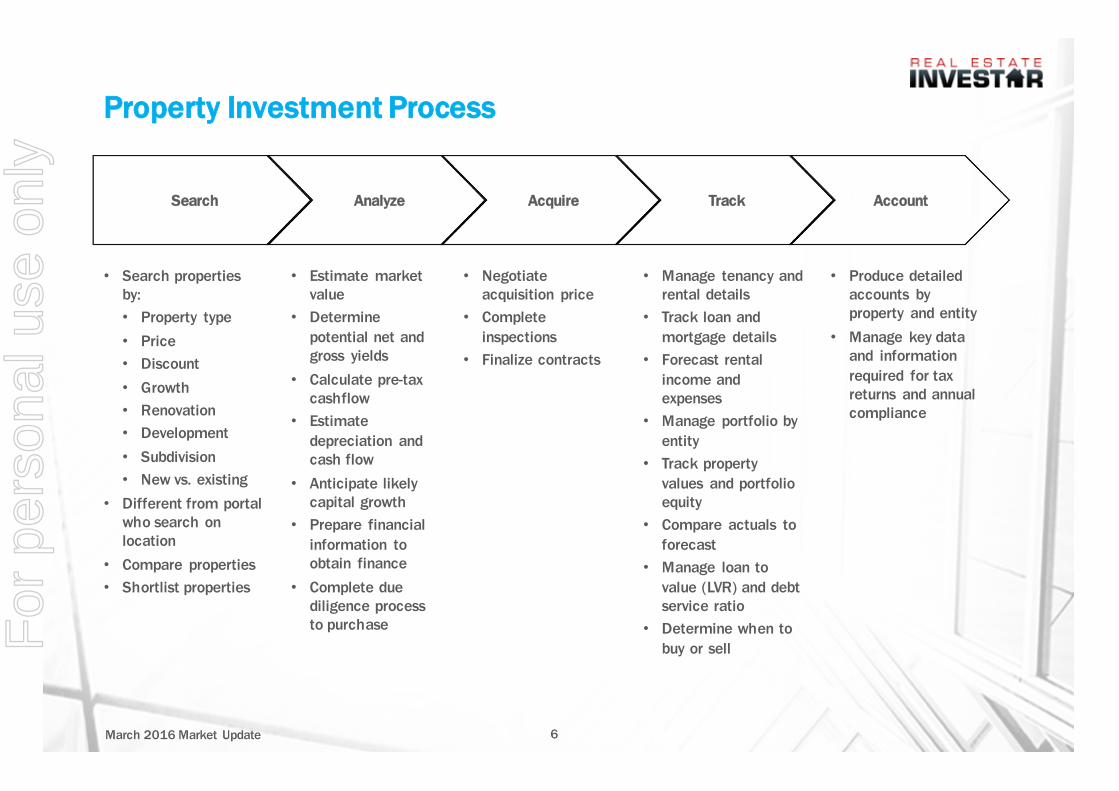
Property Investment Process
6
Search Analyze Acquire Track Account
March 2016 Market Update
• Estimate market value
• Determine potential net and gross yields
• Calculate pre-tax cashflow
• Estimate depreciation and cash flow
• Anticipate likely capital growth
• Prepare financial information to obtain finance
• Complete due diligence process to purchase
• Search properties by:• Property type• Price• Discount• Growth• Renovation• Development• Subdivision• New vs. existing
• Different from portal who search on location
• Compare properties• Shortlist properties
• Manage tenancy and rental details
• Track loan and mortgage details
• Forecast rental income and expenses
• Manage portfolio by entity
• Track property values and portfolio equity
• Compare actuals to forecast
• Manage loan to value (LVR) and debt service ratio
• Determine when to buy or sell
• Produce detailed accounts by property and entity
• Manage key data and information required for tax returns and annual compliance
• Negotiate acquisition price
• Complete inspections
• Finalize contracts
For
per
sona
l use
onl
y

Current Providers of Tools / Services
7March 2016 Market Update
• Banks and property marketers provide basic calculators
• Property portals provide property and suburb data / statistics
• Data companies (e.g. APM / RP Data) provide suburb and property reports
• Basic search tools provided by property portals (e.g. domain / REA) are suburb based and targeted to home buyers
• Spreadsheets
• Some software providers provide basic tracking products but not integrated with valuation data or banking platforms
• Usually services provided by an accountant
• Minimal / no real time accounting of actuals vs. forecasts
No integrated end to end set of tools to assist property investors throughout the process
Search Analyze Acquire Track Account
• New property developers / project marketers
• Real estate agents
For
per
sona
l use
onl
y
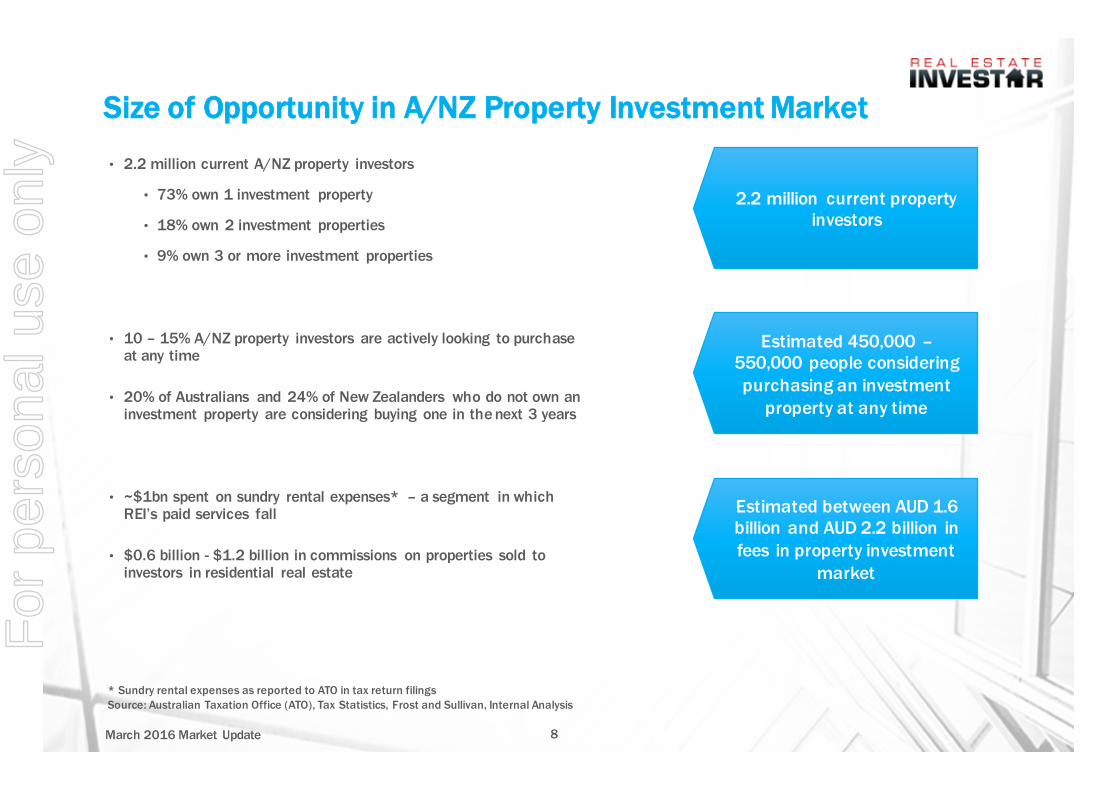
Size of Opportunity in A/NZ Property Investment Market
8March 2016 Market Update
* Sundry rental expenses as reported to ATO in tax return filingsSource: Australian Taxation Office (ATO), Tax Statistics, Frost and Sullivan, Internal Analysis
• 2.2 million current A/NZ property investors
• 73% own 1 investment property
• 18% own 2 investment properties
• 9% own 3 or more investment properties
• 10 – 15% A/NZ property investors are actively looking to purchase at any time
• 20% of Australians and 24% of New Zealanders who do not own an investment property are considering buying one in the next 3 years
• ~$1bn spent on sundry rental expenses* – a segment in which REI’s paid services fall
• $0.6 billion - $1.2 billion in commissions on properties sold to investors in residential real estate
Estimated between AUD 1.6 billion and AUD 2.2 billion in fees in property investment
market
Estimated 450,000 –550,000 people considering purchasing an investment
property at any time
2.2 million current property investors
For
per
sona
l use
onl
y

Agenda
March 2016 Market Update 9
1 2 3 4
The Opportunity
Growth Opportunity
and Forecasts
KPI’s and Financials
Business Overview
For
per
sona
l use
onl
y

Real Estate Investar’s Mission
10March 2016 Market Update
Real Estate Investar’s mission is to provide property investors around the
world with the best advice, guidance, products and services to enable them
to create wealth through property investment.
For
per
sona
l use
onl
y
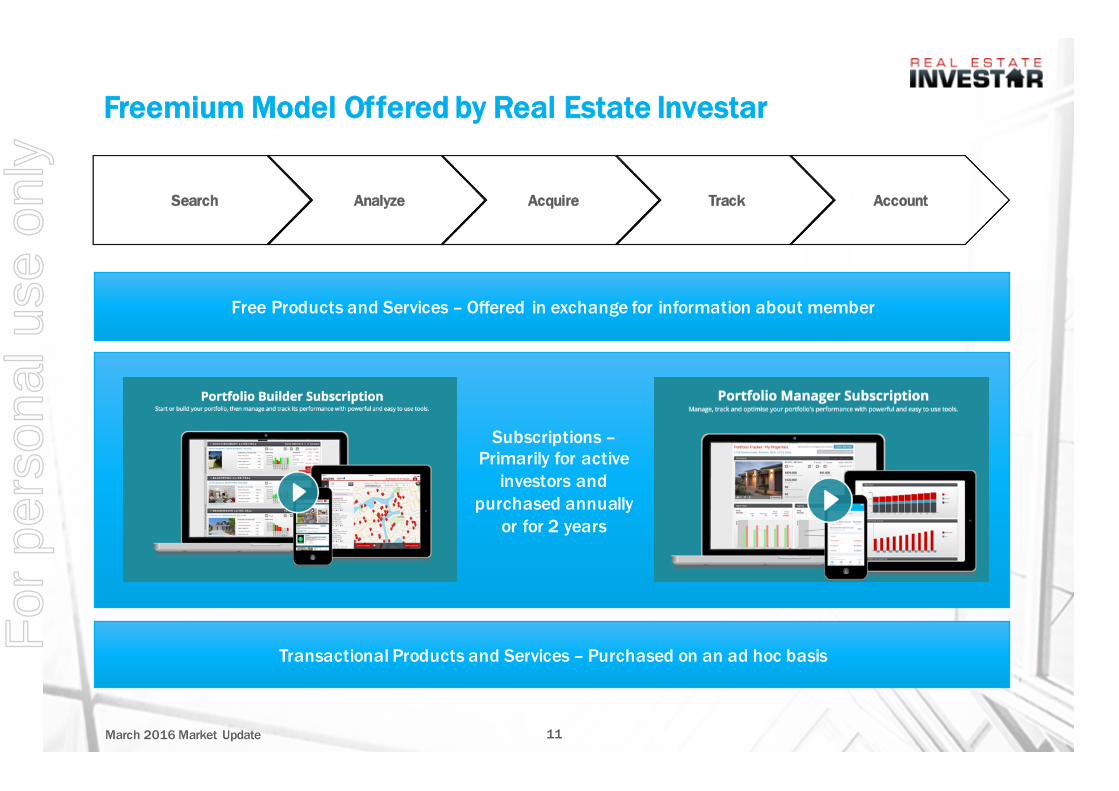
Subscriptions –Primarily for active
investors and purchased annually
or for 2 years
Freemium Model Offered by Real Estate Investar
11March 2016 Market Update
Search Analyze Acquire Track Account
Free Products and Services – Offered in exchange for information about member
Transactional Products and Services – Purchased on an ad hoc basis For
per
sona
l use
onl
y

Free Products Offered to Members
12March 2016 Market Update
• Finance Calculators
• Depreciation Calculators
• Renovation Calculators
• Newsletters & Blogs
• My Knowledge• Master Class
Content
• Suburb Performance Reports
• Suburb Statistic SEO / SEM Pages
• Development Search
• Newsletters & Blogs• My Knowledge• Master Class
Content
• Newsletters & Blogs
• My Knowledge
• Master Class Content
• Newsletters & Blogs
• My Knowledge
• Master Class Content
• Advisor Directory
Objective – build a large database members and then based on the information collected about these members, target them with subscription and transactional
services based on their profile
Search Analyze Acquire Track Account
• Off-the-plan apartment and house & land sales
For
per
sona
l use
onl
y
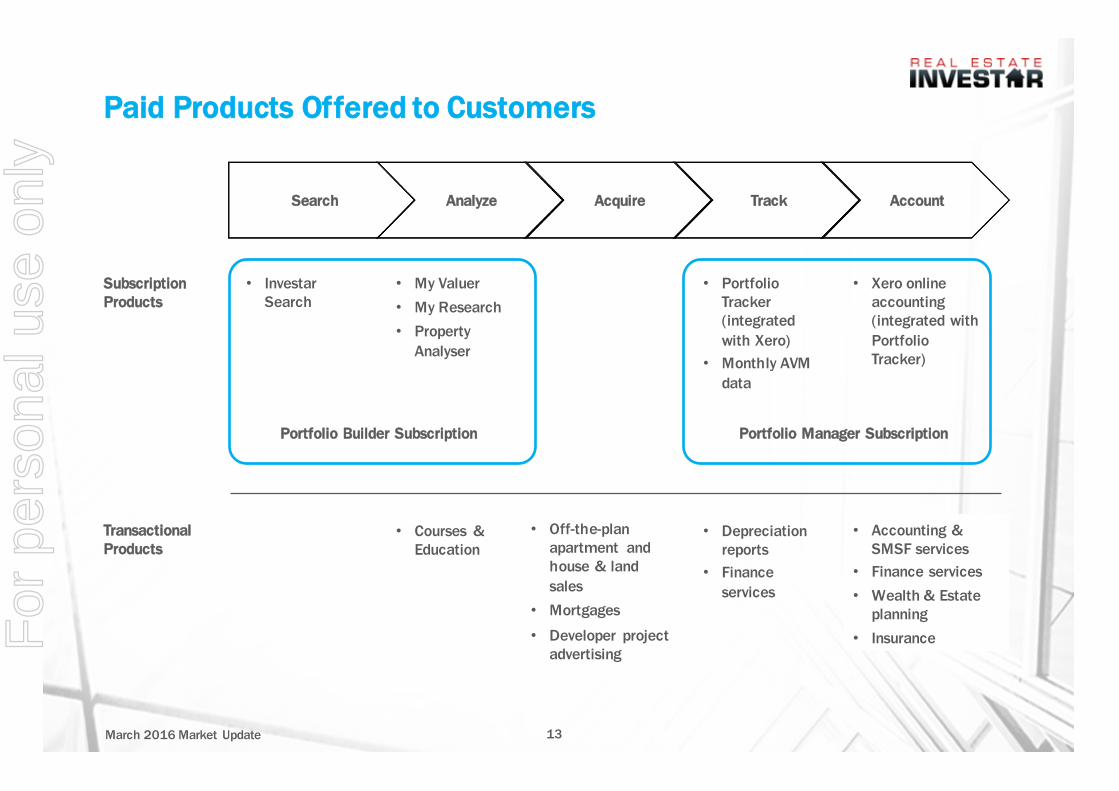
Paid Products Offered to Customers
13March 2016 Market Update
Subscription Products
• My Valuer• My Research• Property
Analyser
• Investar Search
• Portfolio Tracker (integrated with Xero)
• Monthly AVM data
• Xero online accounting (integrated with Portfolio Tracker)
• Off-the-plan apartment and house & land sales
• Mortgages
• Developer project advertising
Transactional Products
• Courses & Education
• Depreciation reports
• Finance services
• Accounting & SMSF services
• Finance services• Wealth & Estate
planning• Insurance
Search Analyze Acquire Track Account
Portfolio Builder Subscription Portfolio Manager Subscription
For
per
sona
l use
onl
y

Real Estate Investar Product and Service Breakdown
14March 2016 Market Update
• Property Analyser
• Renovation Calculators
• Finance Calculators
• Master Class Content
• Suburb Performance Reports
• Suburb Statistic SEO / SEM Pages
• Investar Search
• Portfolio Tracker (integrated with Xero)
• Portfolio Tracker• Xero
Onboarding and Support
• My Valuer• My Research• Depreciation
Calculators & Reports
• Finance Calculators
• Development Search
• Apartment and House & Land services
• Monthly AVM data (integrated with Portfolio Tracker)
• Xero Online Accounting (integrated with Portfolio Tracker)
• Accounting & SMSF Services
• Finance and Wealth Management Services
• Off-the-plan and House & Land Properties
REV Products
Partner Products
Search Analyze Acquire Track Account
• Off the plan sales (referrals)
• Development marketing (with Domain)
• Direct off the plan sales
• Mortgages
For
per
sona
l use
onl
y

Key Industry Partners
15
Partner Product
APM Pricefinder My Valuer / My Research / AVM data integrated into REV platform
Domain Investar Search (Listings) / Developer advertising packages
CoreLogic NZ My Valuer / My Research / AVM data integrated into REV platform
Xero Portfolio Tracker
Washington Brown Depreciation calculators / Property Analyser / Portfolio Tracker / Depreciation reports
Valuit Depreciation calculators / Property Analyser / Portfolio Tracker / Depreciation reports
Investorist Development Search
Connective Finance
Local Agent Finder Property management and sales referrals
Anne Street Partners Finance / Accounting & SMSF / Off-the-plan sales / Insurance / Wealth & Estate planning
Positive Real Estate Finance / Courses & education / Off-the-plan sales
Resicert Building reports
March 2016 Market Update
For
per
sona
l use
onl
y

Fairfax PartnershipFairfax is a key strategic partner for Real Estate Investar as a major shareholder, data and listings partner, and significant media and promotion channel.
16March 2016 Market Update
• APM (part of Domain Group / Fairfax Media) owns 12.6% of REV
• Antony Catalano, CEO of Domain Group, is a non-executive director of REV
• Finalizing contract with Domain with the objective to:
• Integrate REV investor centric content and events into Domain investor section
• Integrate REV Investor Search to Domain
• Jointly sponsored investor events, webinars and services
• Pricefinder APM property data (historical sales information and AVMs) integrated into REV platform
• Domain direct listings feeds (sales and rentals) to REV Investar Search
• REV drives investor traffic back to Domain
• Domain sells advertising (via eDM’s) to REV audience
Corporate Content and Promotion Product
For
per
sona
l use
onl
y
Go to Market Model
17March 2016 Market Update
• Suburb performance reports
• Newsletters, tools and calculators
• Partner promotions and giveaways
• Webinars, blogs and Master Class videos
• Increase knowledge of members based on services used and profiles completed
• Dedicated marketing team
• Partner with industry leaders that already have access to 2.0+ m investors as clients• Property portals
(Domain)• Accountants• Brokers
• Publishers• Provide investor centric
content for large media partners
• SEO / SEM with 8,000+ suburb data sites and main REV site
• Dedicated team
• Free 21 day subscription trials
• Access in exchange for additional information
• Dedicated Trial Conversion team
• Xero onboarding / portfolio setup
• User engagement and workflows
• Dedicated Retention team
• Offers for referral products based on unique member profiling
• Discounts and customer only offers
• Property• Finance• Accounting & SMSF
• Depreciation• Insurance
• Courses and education
Market to 2m+ property investors
Sign up to free products
Convert to paying subscriptions
Upsell to additional services
Property Investors Members Subscribers Customers
For
per
sona
l use
onl
y
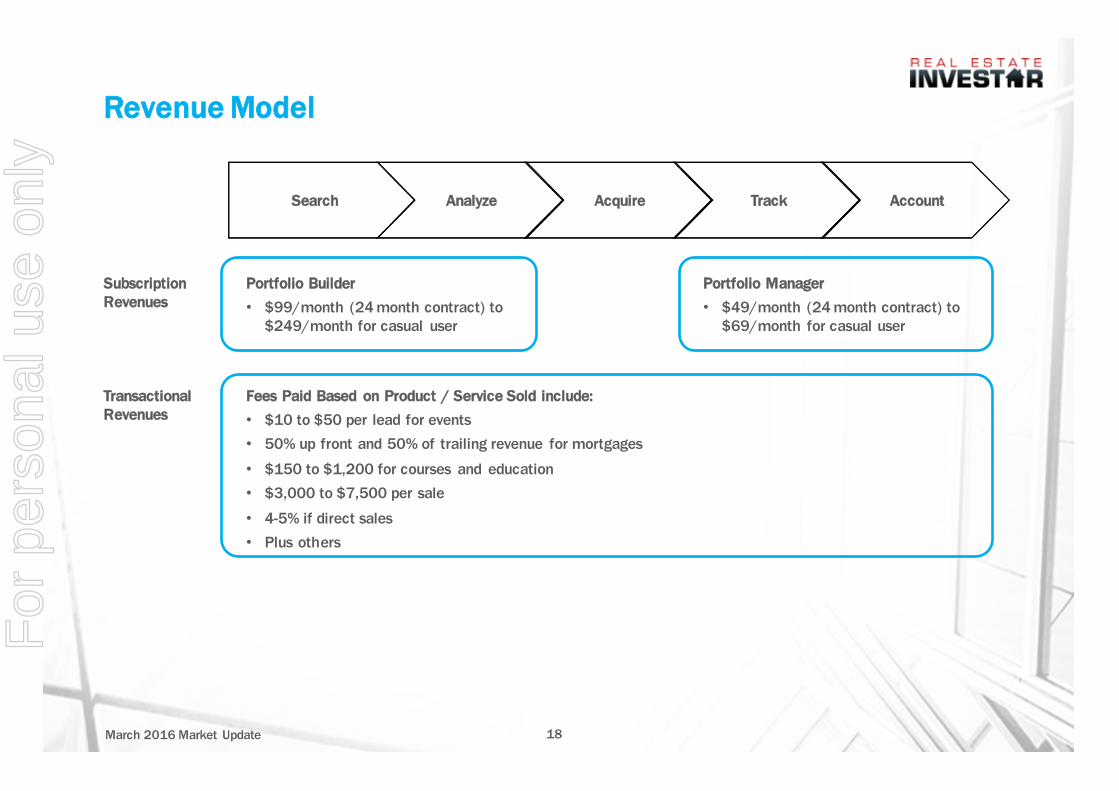
Revenue Model
18March 2016 Market Update
Subscription Revenues
Portfolio Builder • $99/month (24 month contract) to
$249/month for casual user
Transactional Revenues
Portfolio Manager • $49/month (24 month contract) to
$69/month for casual user
Fees Paid Based on Product / Service Sold include:• $10 to $50 per lead for events • 50% up front and 50% of trailing revenue for mortgages
• $150 to $1,200 for courses and education• $3,000 to $7,500 per sale
• 4-5% if direct sales• Plus others
Search Analyze Acquire Track Account
For
per
sona
l use
onl
y

Board
Simon BakerChairman & Investor
• Former CEO & MD of REA Group 2001-08 (ASX:REA)
• Former Chairman & investor in iProperty Group 2009-12 (ASX:IPP)
• Chairman of & investor in the Mitula Group (ASX:MUA)
• Investor in Vertical Networks Group, RedBubble, CarAdvice, VivaReal, RESEM, Zameen, ListGlobally, Transmit Data and others
• Joined REV in 2010
• 16 years senior management experience in finance and operational roles in Australia, NZ and the UK
• 12 years management experience in Australian and NZ real estate industries
• 14 years investing experience in property market including residential and commercial developments
19
Clint GreavesManaging Director & CEO
Total business headcount (excl. Board) - 20
March 2016 Market Update
Antony CatalanoNon-Executive Director
• CEO of Domain (Fairfax Media ASX:FXJ) and Director of MMP since 2013
• Prior to that, founder, CEO and Publisher at MMP
• Long career with Fairfax Media in a number of director and senior management roles
For
per
sona
l use
onl
y

Board (continued)
20
Total business headcount (excl. Board) - 20
March 2016 Market Update
• 18 years with IBM in Australia, US and Europe
• 15 years as Head of Compaq Computer Corporation in Australia
• More recently, Ian was CEO of Volante Group
Ian PenmanNon-Executive Director
Joe HannaNon-Executive Director
• Director of & investor in the Mitula Group (ASX:MUA)
• Extensive experience in online classifieds and search and founder of behavioral classifieds recommendation engine Predictive Match
• Co-founder and current CEO of xLabs Pty Ltd
• 8 years at Fairfax Media Limited in senior product and technology roles
For
per
sona
l use
onl
y
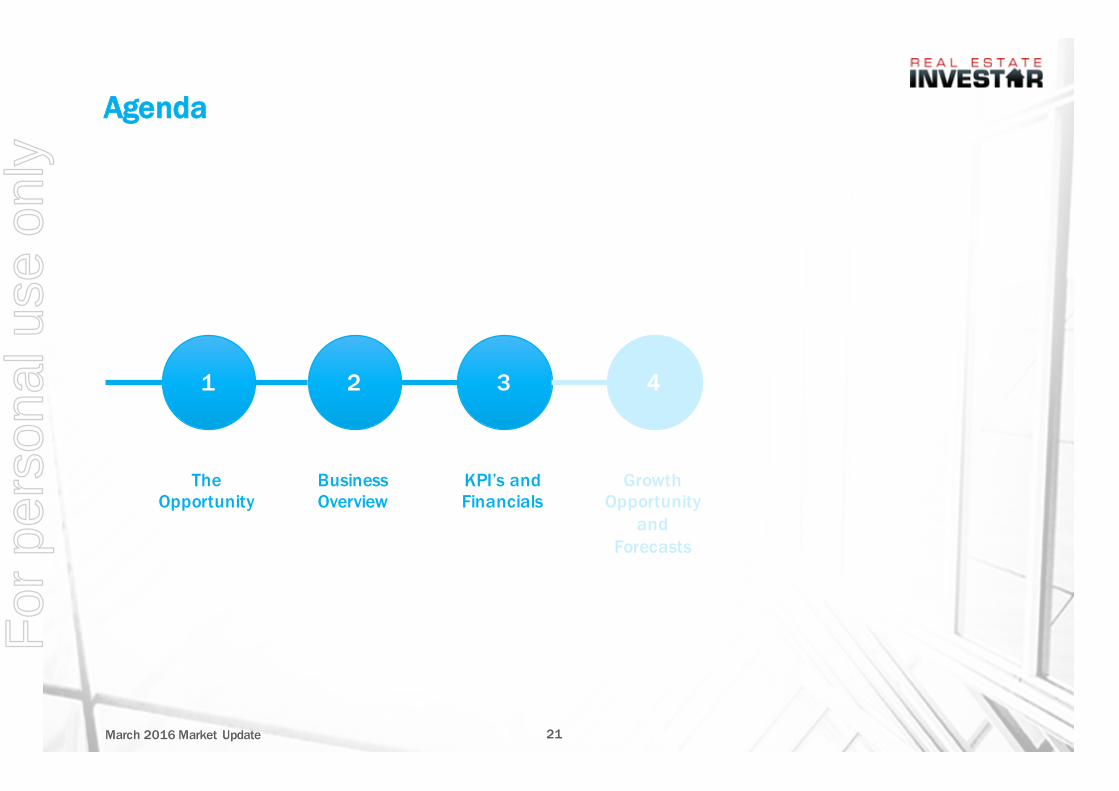
Agenda
March 2016 Market Update 21
1 2 3 4
The Opportunity
Growth Opportunity
and Forecasts
KPI’s and Financials
Business Overview
For
per
sona
l use
onl
y
0
20,000
40,000
60,000
80,000
100,000
120,000
140,000
160,000
22
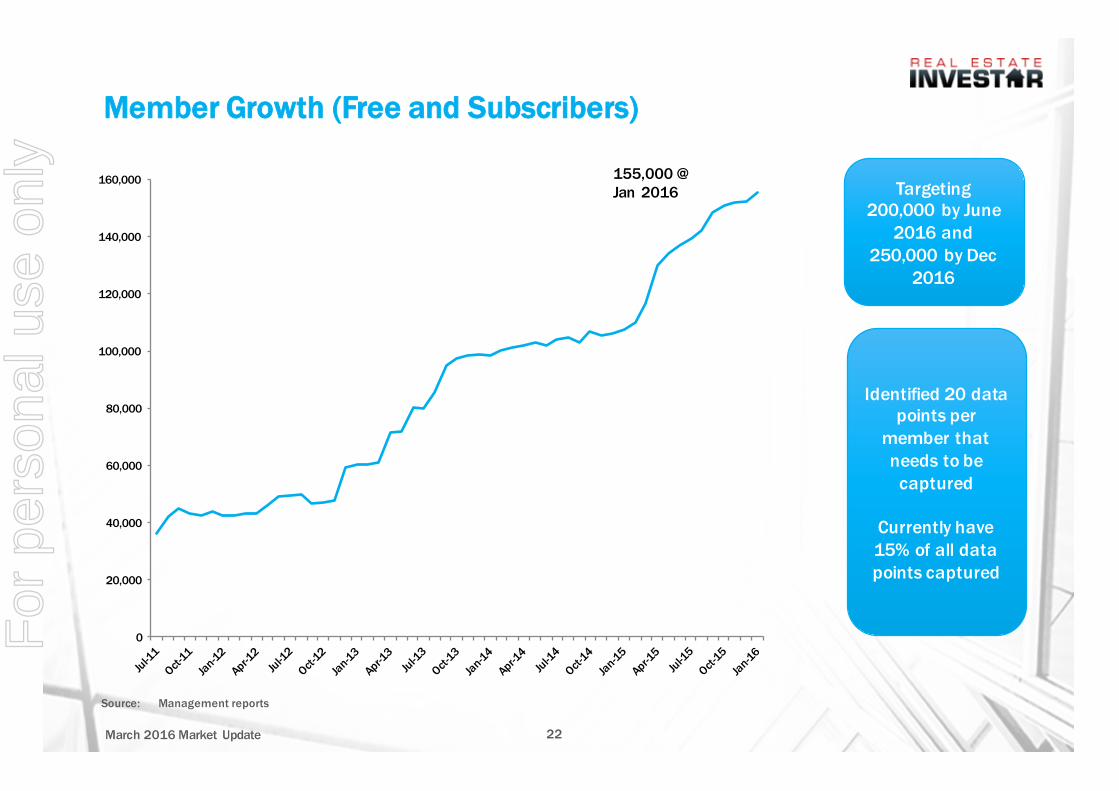
Member Growth (Free and Subscribers)
March 2016 Market Update
Targeting 200,000 by June
2016 and 250,000 by Dec
2016
155,000 @ Jan 2016
Identified 20 data points per
member that needs to be captured
Currently have 15% of all data points captured
Source: Management reports
For
per
sona
l use
onl
y

23
Paid Subscriber and ARPS Growth
March 2016 Market Update
-
500
1,000
1,500
2,000
2,500
3,000
$0
$20
$40
$60
$80
$100
$120
$140
Recently revamped
subscription team and subscription
offering
Target is 4-5% of members
Decrease due to new product
structure and long term discounts
Target is AUD 100/month
Subscriber Growth Average Revenue per Subscriber
Source: Management reports
For
per
sona
l use
onl
y
24
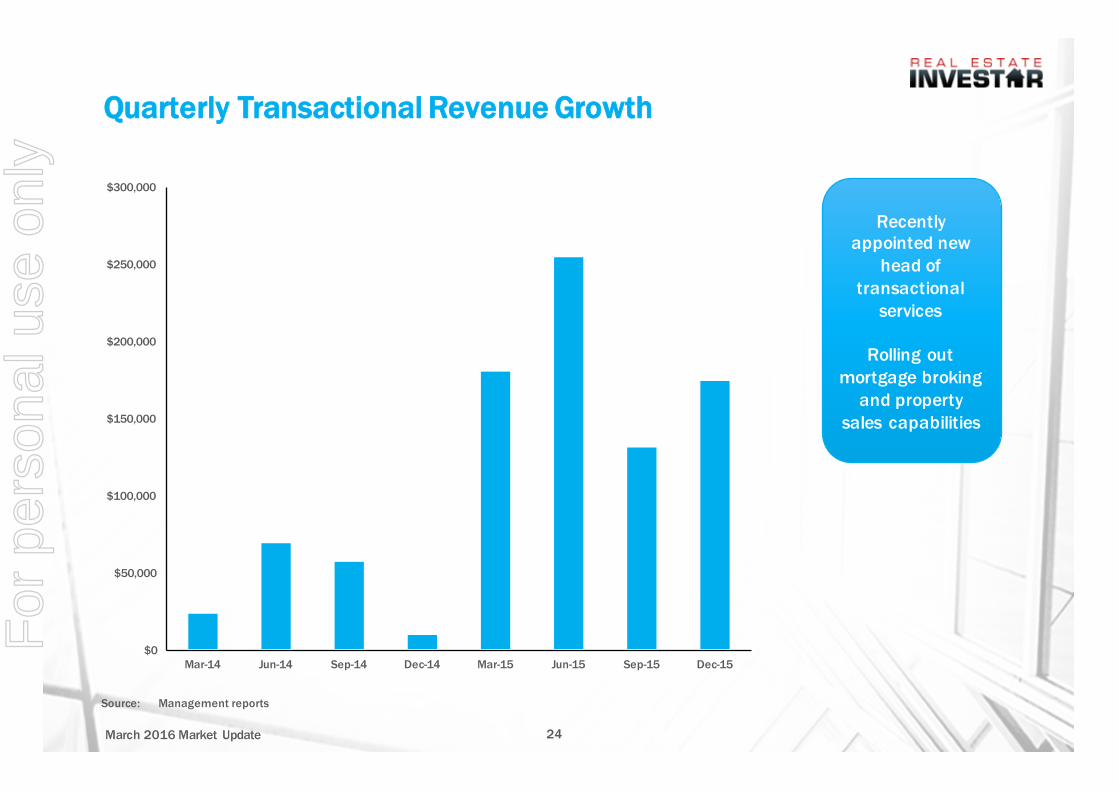
Quarterly Transactional Revenue Growth
March 2016 Market Update
$0
$50,000
$100,000
$150,000
$200,000
$250,000
$300,000
Mar-14 Jun-14 Sep-14 Dec-14 Mar-15 Jun-15 Sep-15 Dec-15
Recently appointed new
head of transactional
services
Rolling out mortgage broking
and property sales capabilities
Source: Management reports
For
per
sona
l use
onl
y

Historic Pro Forma Financials
25March 2016 Market Update
FY10 FY11 FY12 FY13 FY14 FY15
Membership Revenue 951,297 1,653,682 2,593,820 3,717,141 3,963,247 3,446,899
Referral and Other Income - - - 87,945 162,643 575,906
Total Revenue 951,297 1,653,682 2,593,820 3,805,086 4,125,890 4,022,805
Cost of Sales 609,604 939,978 1,336,938 2,112,828 2,214,617 2,137,305
GP 341,693 713,704 1,256,882 1,692,258 1,911,273 1,855,503
GP% 35.9% 43.2% 48.5% 44.5% 46.3% 46.9%
Employment Expenses 1,189,086 1,570,025 1,908,639
Operational Expenses 860,433 589,625 605,043
Premises Expenses 126,895 142,907 145,161
Total Operating Expenses 1,373,941 1,897,797 1,981,374 2,716,414 2,302,557 2,658,843
EBITDA -1,032,248 -1,184,093 -724,492 -484,156 -391,284 -773,340
Key contributor to flat revenues and high costs was an investment of $2m in rebuilding the products / platform in FY 2014 and H1 FY 2015
Note: Pro forma results look at business on a recurring basis and exclude one off events such as IPO, redundancies and restructuring Source: Management reports
For
per
sona
l use
onl
y
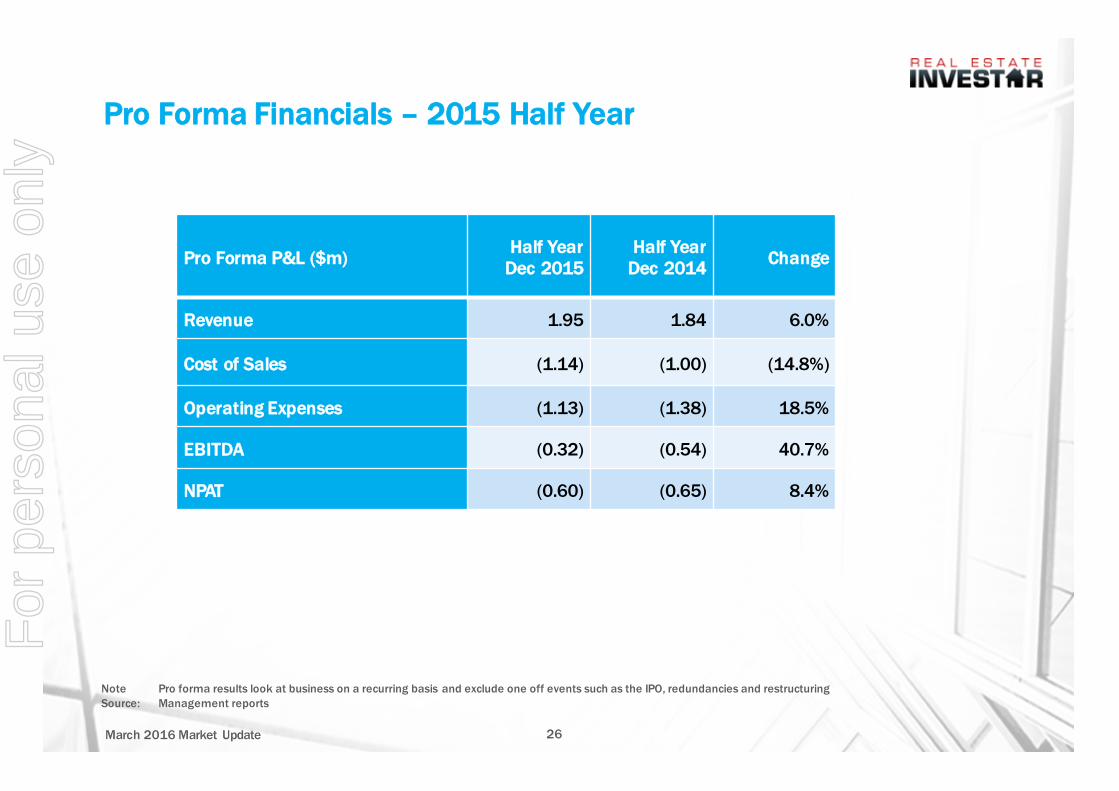
Pro Forma Financials – 2015 Half Year
26March 2016 Market Update
Pro Forma P&L ($m) Half Year Dec 2015
Half Year Dec 2014 Change
Revenue 1.95 1.84 6.0%
Cost of Sales (1.14) (1.00) (14.8%)
Operating Expenses (1.13) (1.38) 18.5%
EBITDA (0.32) (0.54) 40.7%
NPAT (0.60) (0.65) 8.4%
Note Pro forma results look at business on a recurring basis and exclude one off events such as the IPO, redundancies and restructuring Source: Management reports
For
per
sona
l use
onl
y

Agenda
March 2016 Market Update 27
1 2 3 4
The Opportunity
Growth Opportunity
and Forecasts
KPI’s and Financials
Business Overview
For
per
sona
l use
onl
y
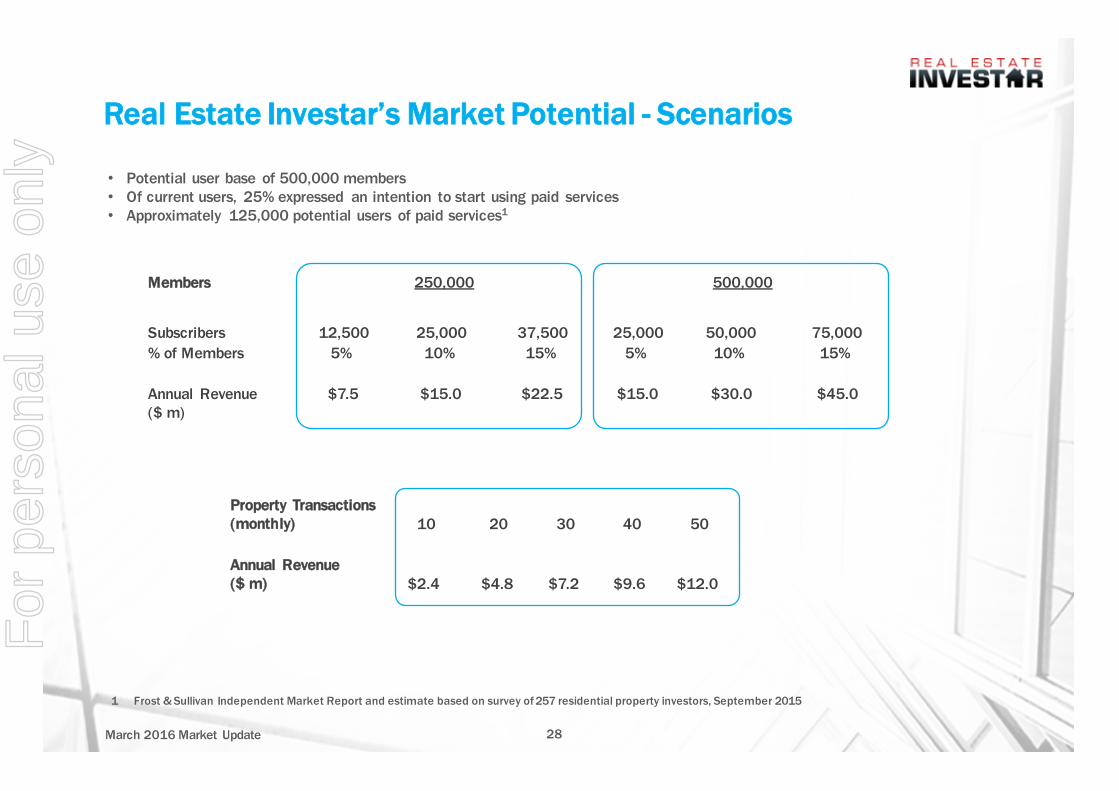
Real Estate Investar’s Market Potential - Scenarios
28March 2016 Market Update
• Potential user base of 500,000 members• Of current users, 25% expressed an intention to start using paid services • Approximately 125,000 potential users of paid services1
1 Frost & Sullivan Independent Market Report and estimate based on survey of 257 residential property investors, September 2015
Members 250,000 500,000
Subscribers 12,500 25,000 37,500 25,000 50,000 75,000 % of Members 5% 10% 15% 5% 10% 15%
Annual Revenue ($ m)
$7.5 $15.0 $22.5 $15.0 $30.0 $45.0
Property Transactions (monthly) 10 20 30 40 50
Annual Revenue ($ m) $2.4 $4.8 $7.2 $9.6 $12.0
For
per
sona
l use
onl
y

Top 4 Growth Priorities
29
Growth approach
Increase Members & Knowledge of Members
Increase members
Ensure usage of products and services
Increase knowledge of members
Increase Subscribers Target market subscriptions
Increase Transactional Revenues Target market transactional services
International expansion
Target overseas investors into A/NZ
Licensing to other property portals
March 2016 Market Update
1
2
3
4
For
per
sona
l use
onl
y
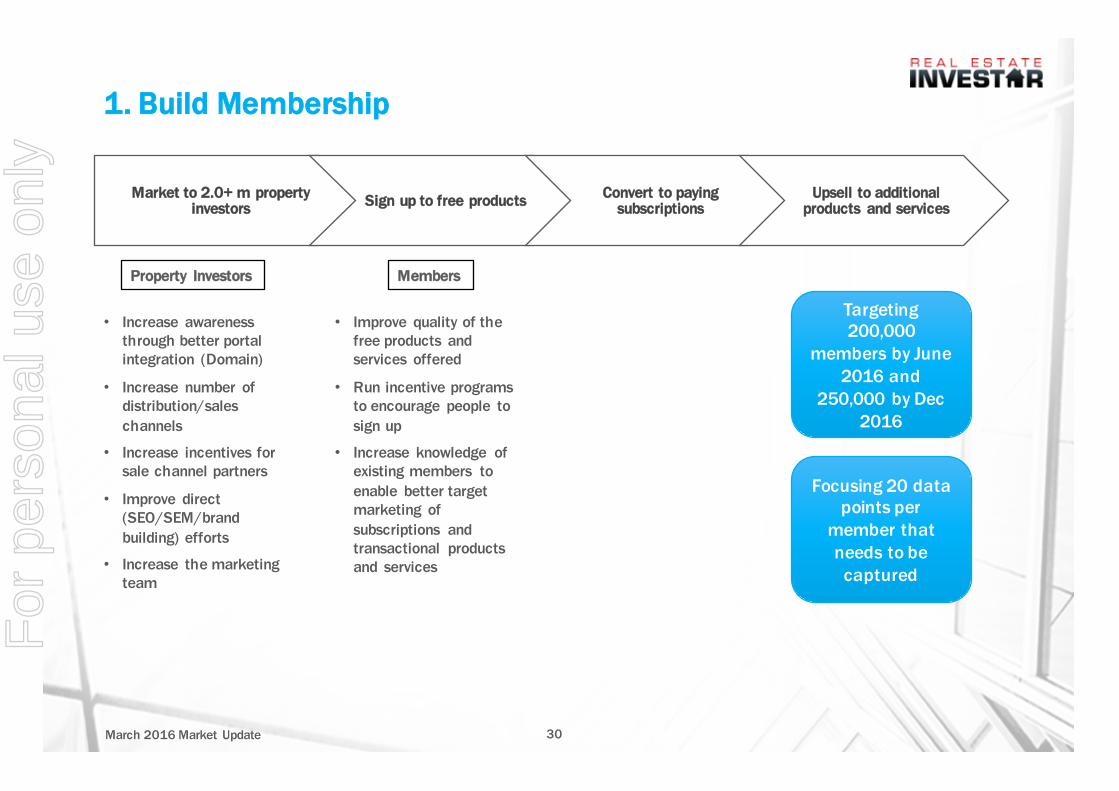
1. Build Membership
30March 2016 Market Update
• Improve quality of the free products and services offered
• Run incentive programs to encourage people to sign up
• Increase knowledge of existing members to enable better target marketing of subscriptions and transactional products and services
• Increase awareness through better portal integration (Domain)
• Increase number of distribution/sales channels
• Increase incentives for sale channel partners
• Improve direct (SEO/SEM/brand building) efforts
• Increase the marketing team
Market to 2.0+ m property investors Sign up to free products Convert to paying
subscriptionsUpsell to additional
products and services
Property Investors Members
Targeting 200,000
members by June 2016 and
250,000 by Dec 2016
Focusing 20 data points per
member that needs to be captured
For
per
sona
l use
onl
y
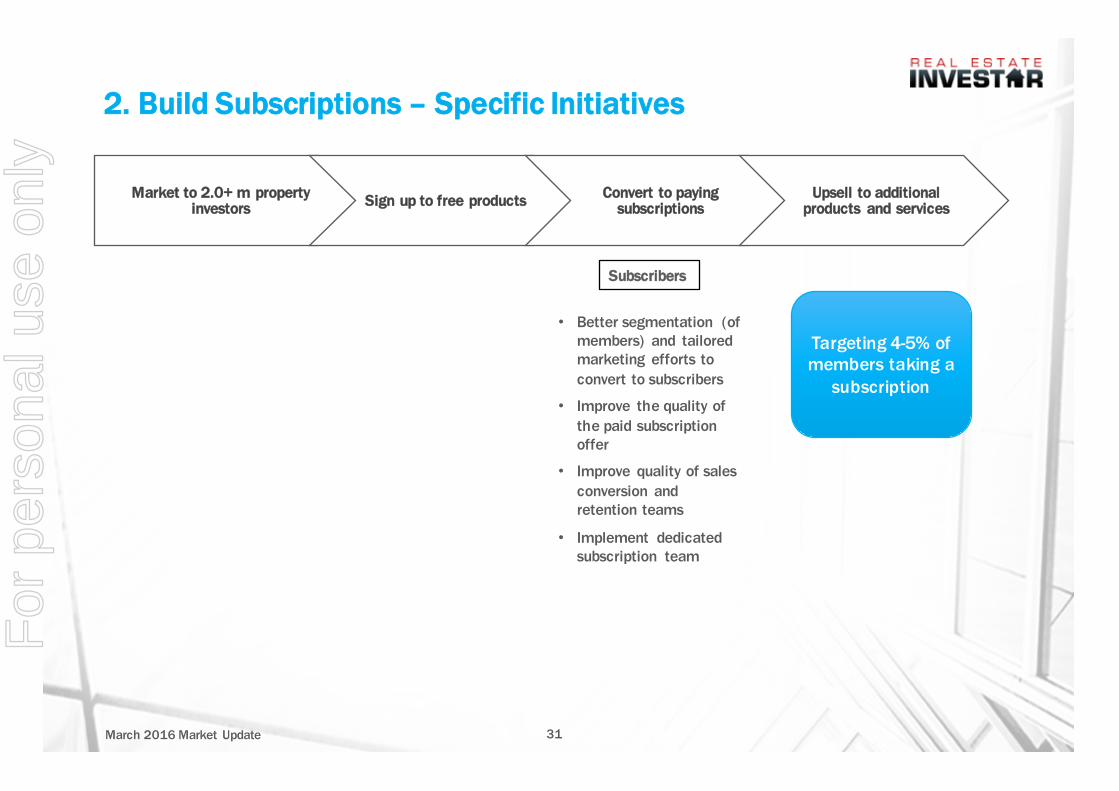
2. Build Subscriptions – Specific Initiatives
31March 2016 Market Update
• Better segmentation (of members) and tailored marketing efforts to convert to subscribers
• Improve the quality of the paid subscription offer
• Improve quality of sales conversion and retention teams
• Implement dedicated subscription team
Market to 2.0+ m property investors Sign up to free products Convert to paying
subscriptionsUpsell to additional
products and services
Subscribers
Targeting 4-5% of members taking a
subscription
For
per
sona
l use
onl
y
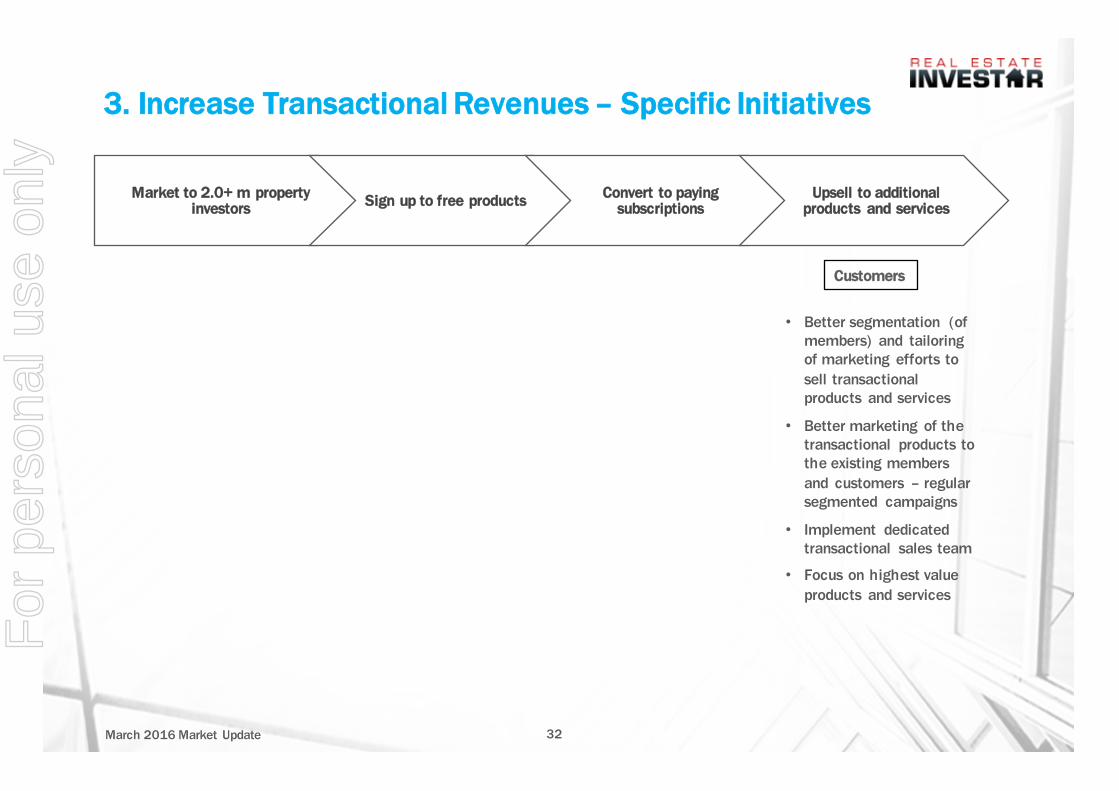
3. Increase Transactional Revenues – Specific Initiatives
32March 2016 Market Update
• Better segmentation (of members) and tailoring of marketing efforts to sell transactional products and services
• Better marketing of the transactional products to the existing members and customers – regular segmented campaigns
• Implement dedicated transactional sales team
• Focus on highest value products and services
Market to 2.0+ m property investors Sign up to free products Convert to paying
subscriptionsUpsell to additional
products and services
Customers
For
per
sona
l use
onl
y
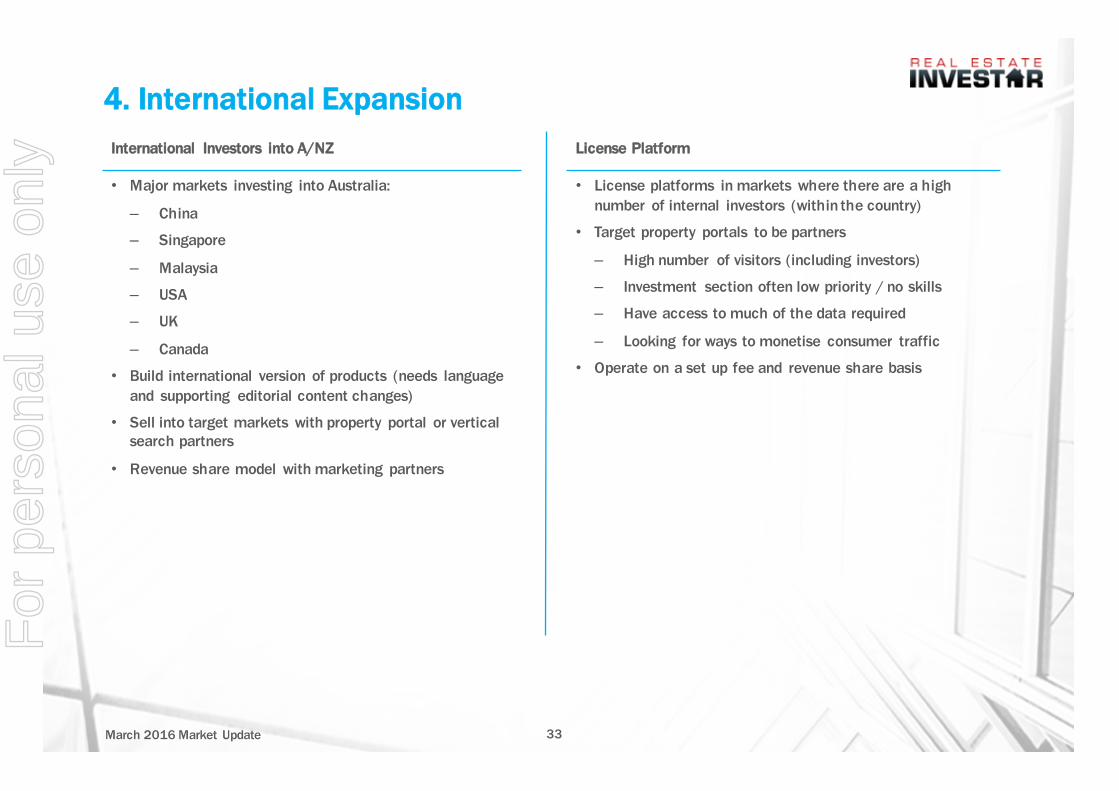
4. International ExpansionInternational Investors into A/NZ
• Major markets investing into Australia:
– China
– Singapore
– Malaysia
– USA
– UK
– Canada
• Build international version of products (needs language and supporting editorial content changes)
• Sell into target markets with property portal or vertical search partners
• Revenue share model with marketing partners
License Platform
• License platforms in markets where there are a high number of internal investors (within the country)
• Target property portals to be partners
– High number of visitors (including investors)
– Investment section often low priority / no skills
– Have access to much of the data required
– Looking for ways to monetise consumer traffic
• Operate on a set up fee and revenue share basis
33March 2016 Market Update
For
per
sona
l use
onl
y
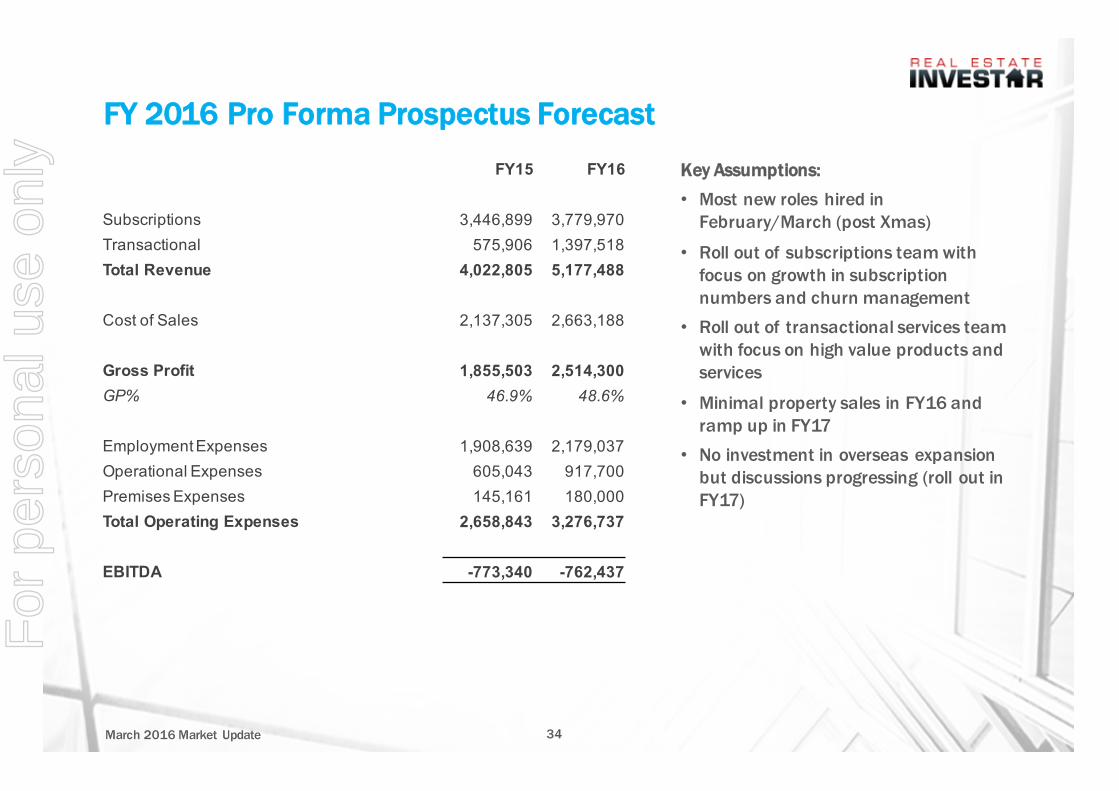
FY 2016 Pro Forma Prospectus Forecast
34March 2016 Market Update
Key Assumptions:• Most new roles hired in
February/March (post Xmas)
• Roll out of subscriptions team with focus on growth in subscription numbers and churn management
• Roll out of transactional services team with focus on high value products and services
• Minimal property sales in FY16 and ramp up in FY17
• No investment in overseas expansion but discussions progressing (roll out in FY17)
FY15 FY16
Subscriptions 3,446,899 3,779,970Transactional 575,906 1,397,518Total Revenue 4,022,805 5,177,488
Cost of Sales 2,137,305 2,663,188
Gross Profit 1,855,503 2,514,300GP% 46.9% 48.6%
Employment Expenses 1,908,639 2,179,037Operational Expenses 605,043 917,700Premises Expenses 145,161 180,000Total Operating Expenses 2,658,843 3,276,737
EBITDA -773,340 -762,437
For
per
sona
l use
onl
y