for personal use only - asx · provide additional assistance to help them regain control of their...
TRANSCRIPT

Collection House Limited ABN 74 010 230 716
Strong structurefor future
growthAnnual Report 2019F
or p
erso
nal u
se o
nly

Collection House Limited Annual Report 2019
Our Brands
Provision of financial hardship services for third parties
Founded in 1994 and listed on the Australian Securities Exchange in 2000, the Group is made up of a number of brands offering a range of professional, ethical and effective products and services:
Tailored debt collection services, specialising in Local Government
Debt collection and receivables management for third parties
Customer service outsourcing for third parties
Legal services including insolvency administration
Debt purchasing and recovery
Nationally recognised training provider in financial services and leadership
Licensed specialist finance broker for the provision of credit
New Zealand supplier of receivables and debt management
Collection House Limited (ASX: CLH) is Australia’s leading end-to-end receivables management company. We provide solutions to organisations and individuals that span the entire credit management lifecycle and beyond.
With 786 staff in offices across Brisbane, Sydney, Victoria and New Zealand, and 135 in the Philippines, the Collection House Group offers stakeholders a range of professional, ethical and effective products and services.
We enjoy strong business relationships with major Australian and international banks, financial institutions, large corporations, local Councils, public utilities, SMEs and Government agencies.
Our ongoing success is a result of the breadth of our service offering, our deeply ingrained approach to ethical debt recovery, and our commitment to technology to continually evolve our service and capabilities.
For
per
sona
l use
onl
y

1
Collection House Limited Annual Report 2019
Overview Corporate Governance Financial Report Additional Information Overview
2 Chairman’s Report4 Managing Director and Chief Executive
Officer’s Report6 Board of Directors8 Executive Management Team9 FY19 Financial Results10 Corporate Governance11 Directors’ Report30 Auditor’s Independence Declaration31 Income Statement32 Statement of Comprehensive Income33 Balance Sheet34 Statement of Changes in Equity35 Statement of Cash Flows36 Notes to the Financial Statements76 Directors’ Declaration77 Independent Auditor’s Report81 Shareholder Information83 Corporate Directory
Notice of Annual General Meeting The AGM of Collection House Limited will be held on 01 November 2019 at 12:00pm at Pullman and Mercure, King George Square, Corner of Ann and Roma Streets, Brisbane, Queensland.
ContentsF
or p
erso
nal u
se o
nly

2
Collection House Limited Annual Report 2019
Capital for new investmentsFY19 was a record year for us on PDL investments. We have continued to look carefully at our capital structure and borrowing, so we can take advantage of the opportunities ahead in terms of expected market growth in FY20 and the potential to further increase our market share.
During FY19, we completed the second transaction under our partnership with global investment house Balbec Capital LP. This transaction provided us with $25 million of unencumbered cash up front, which we are investing in new, higher yielding PDL books.
In addition, the Group also retains in principle access to $100 million in off balance sheet finance through the partnership with Balbec. At this stage the facility remains undrawn, and we expect to hit our $80-100m guidance on PDL purchases without drawing down on this facility.
The Balbec relationship is an illustration of how Collection House is moving to a less capital intensive and more innovative capital structure, with stable cash flows being moved off balance sheet and recycled into higher yielding portfolios, where we can apply our skills and further lift the return on shareholder funds.
Investing in TechnologyInvestment in leading technology is a core strength of our business, and we are positioning Collection House to adopt competencies and capabilities from the fintech industry.
Our data analytics capability provides us with a competitive advantage in terms of modelling the cost to collect, the likelihood of recovery and most efficient strategy down to account level, and places us in a strong position to buy debt at the right price and successfully assess affordable payment arrangements for our customers.
Using machine learning and data analytics to streamline debt collection, we are able to analyse consumer behaviour and determine when and how they should be contacted about their debt, as well as the best payment options to offer. This is making our offers of financial resolution more manageable for people in debt, and I am excited to see the new version of our customer portal, Kash AI, approaching launch. Kash AI will
Chairman’s Report
Leigh Berkley Chairman
“ We remain committed to redefining the debt collections industry through putting our customers at the heart of everything we do, helping them get back on the road to financial freedom.”
A year of growth I am pleased to present another consistent result for our shareholders in FY19, with the Company posting an 8% increase in net profit, and record Purchase Debt Ledger (PDL) purchases of $133m, up 63% on last year.
Our performance has been underpinned by the customer-centric approach we adopt across the business, the expansion of our quality PDL purchases, and our ongoing commitment to superior data analytics and leading edge technology.
During the past year, we continued to grow the business, with the strategic acquisitions of New Zealand-based Receivables Management (NZ) Ltd (RML), and the PDL book and selected assets of ACM Group in Sydney. We welcome our new colleagues from RML and ACM to the team, and it is good to see the integration of the businesses going so well.
The results for the Collection Services segment were 2% down in FY19, largely due to delayed referrals from some clients due to the Financial Services Royal Commission and the federal elections. These issues have now resolved, with referrals and collections trending well so far in FY20.
We remain committed to redefining the debt collections industry through putting our customers at the heart of everything we do, helping them get back on the road to financial freedom. We are a highly compliance-driven Company, and we maintain excellent relationships with our clients as a result of our exemplary track record on complaints and regulatory compliance.
This ethical approach has also seen us move into new areas, and has driven our strategic investment in Australian digital bank, Volt. We are proud of the work we are doing with Volt, because there is a strong alignment in our values and vision to make Australians’ financial journeys simpler and better. More news will follow as Volt launches its new products.
For
per
sona
l use
onl
y

Overview Corporate Governance Financial Report Additional Information 3
Collection House Limited Annual Report 2019
Chairman’s Report (continued)
be able to interact with our customers like never before, with the ability to sense upset or distress, allowing us to direct the customer to a member of our highly skilled Resolutions team.
While service channels continue to move online, the majority of our customers still require personal relationships with us, and we continue to invest in training and skills development for our people, in order to provide them with all the necessary competencies to further grow in our organisation.
The BoardI was pleased to be re-elected to the Board at last year’s AGM along with the election of Non-Executive Directors Sandra Birkensleigh and Catherine McDowell. Sandra and Catherine have brought a wealth of experience from the accountancy, banking, financial services and investment industries. Together with Non-Executive Director Michael Knox and CEO and Managing Director Anthony Rivas, your Board has a diverse and relevant range of talent, skills and experience that will ensure the effective governance of Collection House in achieving its strategic goals into the future.
During the year, the Board also announced the reappointment of Anthony Rivas as our CEO and Managing Director for a further three years. The renewal of Anthony’s contract recognises the contribution he has made to the continued success of the company and building shareholder value.
Collection House also welcomed a new Chief Financial Officer and Company Secretary Doug McAlpine following the departure of Kristine May, who had been with the company for seventeen years in a range of roles. Doug has previously held similar roles in the resources, property and general investment sectors, and we are already seeing the benefits of his experience and contribution to the Executive Leadership Team. The Board and I would also like to extend our sincere thanks to Kristine for her valuable contribution over many years, and wish her well for her future endeavours.
On a personal note, I am very proud to have been granted Australian residency earlier this year, allowing me to work ever closer with the Board and executive team of Collection House as we continue to grow the business.
Looking aheadThe outlook for Collection House in FY20 is positive as we continue to grow our market share in Australia and New Zealand through the acquisition of debt portfolios at the right price. For the first time, we have provided Cash Collections guidance for the PDL segment at $145-155m, including PDL purchases of $80-100m in FY20.
On the PDL supply side things look very healthy for the year ahead, particularly in the context of expected market growth, our conservative implementation of AASB 9, and developments in the sector potentially leading to a reduced pool of trusted buyers for PDLs. The brief headwinds we encountered in the Collection Services segment are now behind us, with collections returning to 2018 levels.
Our partnership with Balbec puts us in a strong position to take advantage of opportunities as they arise. We also anticipate a positive contribution from our alliance with Volt. We are confident that our strong client relationships, tied
to the data-driven and customer-centric approach we take to our business, are positioning us well for the changes which are occurring in our industry, and for the expected growth ahead.
In conclusion, on behalf of the Board, I would like to thank our shareholders for their continued support, and all our colleagues in the business for their hard work and dedication over the past year. I would also like to thank my fellow Board members for their wise counsel and commitment, and Anthony and the Executive Leadership Team for the numerous successful projects and improvements they have brought about during the year. I look forward to working together in FY20 to achieve our goals and to deliver enhanced value to our shareholders, our customers, and the wider stakeholder community.
Leigh Berkley Chairman
For
per
sona
l use
onl
y
4
Collection House Limited Annual Report 2019
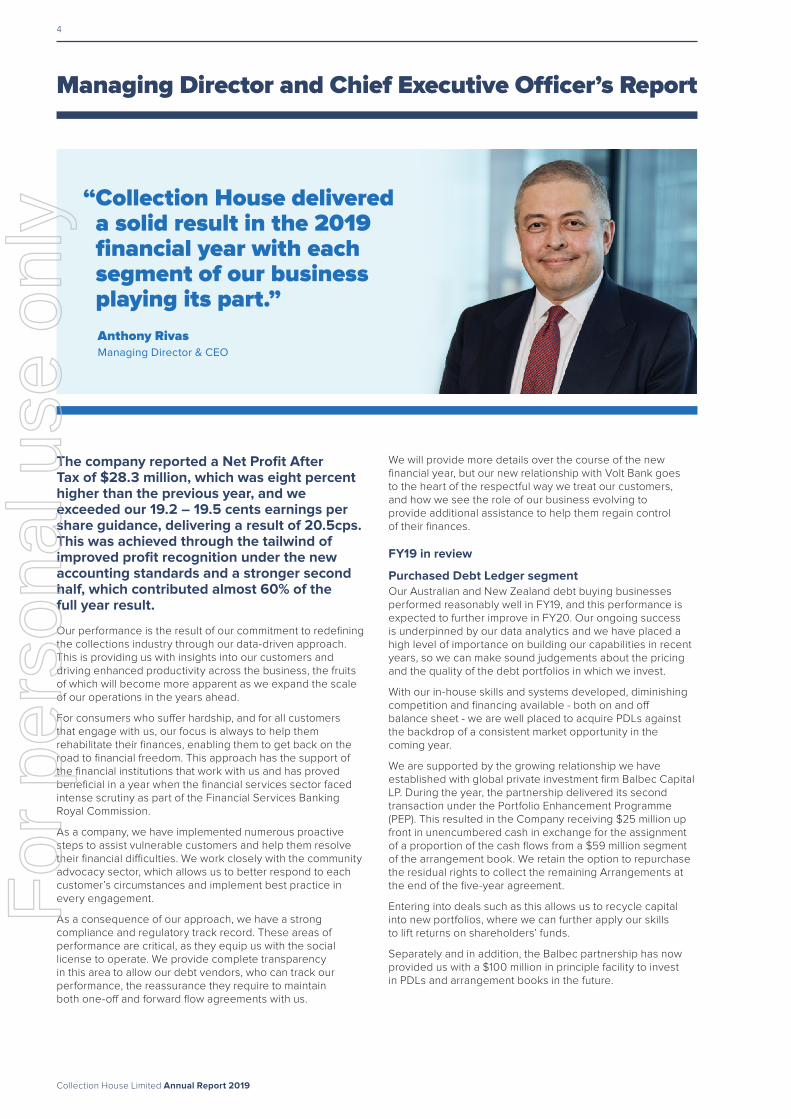
Managing Director and Chief Executive Officer’s Report
Anthony Rivas Managing Director & CEO
“ Collection House delivered a solid result in the 2019 financial year with each segment of our business playing its part.”
We will provide more details over the course of the new financial year, but our new relationship with Volt Bank goes to the heart of the respectful way we treat our customers, and how we see the role of our business evolving to provide additional assistance to help them regain control of their finances.
FY19 in review
Purchased Debt Ledger segmentOur Australian and New Zealand debt buying businesses performed reasonably well in FY19, and this performance is expected to further improve in FY20. Our ongoing success is underpinned by our data analytics and we have placed a high level of importance on building our capabilities in recent years, so we can make sound judgements about the pricing and the quality of the debt portfolios in which we invest.
With our in-house skills and systems developed, diminishing competition and financing available - both on and off balance sheet - we are well placed to acquire PDLs against the backdrop of a consistent market opportunity in the coming year.
We are supported by the growing relationship we have established with global private investment firm Balbec Capital LP. During the year, the partnership delivered its second transaction under the Portfolio Enhancement Programme (PEP). This resulted in the Company receiving $25 million up front in unencumbered cash in exchange for the assignment of a proportion of the cash flows from a $59 million segment of the arrangement book. We retain the option to repurchase the residual rights to collect the remaining Arrangements at the end of the five-year agreement.
Entering into deals such as this allows us to recycle capital into new portfolios, where we can further apply our skills to lift returns on shareholders’ funds.
Separately and in addition, the Balbec partnership has now provided us with a $100 million in principle facility to invest in PDLs and arrangement books in the future.
The company reported a Net Profit After Tax of $28.3 million, which was eight percent higher than the previous year, and we exceeded our 19.2 – 19.5 cents earnings per share guidance, delivering a result of 20.5cps. This was achieved through the tailwind of improved profit recognition under the new accounting standards and a stronger second half, which contributed almost 60% of the full year result.
Our performance is the result of our commitment to redefining the collections industry through our data-driven approach. This is providing us with insights into our customers and driving enhanced productivity across the business, the fruits of which will become more apparent as we expand the scale of our operations in the years ahead.
For consumers who suffer hardship, and for all customers that engage with us, our focus is always to help them rehabilitate their finances, enabling them to get back on the road to financial freedom. This approach has the support of the financial institutions that work with us and has proved beneficial in a year when the financial services sector faced intense scrutiny as part of the Financial Services Banking Royal Commission.
As a company, we have implemented numerous proactive steps to assist vulnerable customers and help them resolve their financial difficulties. We work closely with the community advocacy sector, which allows us to better respond to each customer’s circumstances and implement best practice in every engagement.
As a consequence of our approach, we have a strong compliance and regulatory track record. These areas of performance are critical, as they equip us with the social license to operate. We provide complete transparency in this area to allow our debt vendors, who can track our performance, the reassurance they require to maintain both one-off and forward flow agreements with us.
For
per
sona
l use
onl
y

Overview Corporate Governance Financial Report Additional Information 5
Collection House Limited Annual Report 2019
Managing Director and Chief Executive Officer’s Report (continued)
Anthony Rivas Managing Director & CEO
Given these positive developments we were able to achieve a record level of purchasing in FY19, up 63 percent on the previous year. Our investment in technology and the skills development of our people has also supported our collection process. This has helped to deliver productivity increases and collections growth of seven percent, which should accelerate to at least 30 percent in FY20.
The investment in our platform and capabilities provided us with significant confidence to seek out opportunities for acquisitive expansion, and during the year we acquired the PDLs of ACM Group in Australia and Receivable Management (NZ) Ltd. Both the ACM portfolio and Receivables Management business will greatly benefit from the application of our technology and analytical skills.
The ACM acquisition provided us with increased volumes, diversification into the telecommunication sector, as well as expanding our capacity in Sydney.
The Receivables Management acquisition positions us to become a leading acquirer of PDLs in New Zealand, given the company’s 30 year history in that country. The New Zealand PDL market remains nascent compared to Australia and we expect it to develop in a similar way in coming years.
Collection Services segmentCollection Services revenue was $67.6 million down 2% on prior year. This was below our original budget, with short term factors, being the timing of the federal election and the Financial
Services Royal Commission, having impacted client and consumer activity. We were not overly alarmed, in light of the significant disruption for our clients, and are pleased to report that since the year end there has been a return to normal activity levels.
We continue to broaden the services we offer our clients through extending our Collection Services platform. As always, we are committed to a rigorous compliance regime and customer rehabilitation and support.
TechnologyThe online portal we have developed to assist our customers who prefer a self-service option, continues to grow well, and in the second half accounted for over eight percent of Cash Collections in Lion Finance. Given the success of the portal, we are now partnering with a leader in Artificial Intelligence and Emotional Intelligence to turn our avatars Kash and soon Kara into digital humans.
Ultimately, our aim is to help create better services and experiences for our customers and to help us grow a better and more innovative Collection House. Our systems and processes have also led to an increase in the number of individuals who are entering into recurring payment arrangements.
Our collaborations and investment in Volt Bank are also part of our ongoing digital transformation strategy, and we are working together to develop analytical tools and resources that will be available when Volt Bank launches its products.
Key areas of interest for us both are the digitisation of hardship identification, assessment and treatment programmes and the integration of components of our customer portal. This collaboration will deliver innovative products which will support our customers, but it will also accelerate the pace of our digital transformation.
FY20 and beyondWe will continue to leverage our technology investments to gain operating advantage from an expanding revenue base. Our portal and the Volt relationship offer significant growth potential beyond the scope of our normal business.
Our outlook for FY20 is positive as we have a structural opportunity to gain market share, against the backdrop of a positive cyclical outlook in the debt purchasing industry in Australia and New Zealand.
We expect FY20 to be a record year for the Company, and we look forward to sharing that success with all our clients, employees and shareholders.
In closing, I would like to express my thanks to the Board of Directors for their collaboration and involvement in the strategic initiatives during FY19. Of particular note has been the wise counsel and participation of our Chairman Leigh Berkley, whose industry and regulatory experience have been an invaluable asset this year.
I would also like to thank my talented Executive Leadership Team members for their determination, persistence and overall support. I am delighted with our appointment of Doug McAlpine as our new Chief Financial Officer. His experience adds further strength to our already well-rounded team.
Finally, I would like to acknowledge our fantastic group of employees at Collection House. Their job is not easy, and it requires a great deal of resilience and empathy to execute the role well. The success we deliver to all our stakeholders is as a direct result of their commitment.F
or p
erso
nal u
se o
nly

Leigh Berkley Chairman
Michael Knox Non-executive Director
Anthony RivasManaging Director & CEO
Appointed: July 2016
Having qualified as a Chartered Accountant, Mr Berkley has more than 25 years’ experience in the collections and debt purchase industry, is immediate past President of the Credit Services Association (CSA) in the UK and assisted the Australian Collectors & Debt Buyers Association (ACDBA) develop their Code of Practice.
Having been granted Australian residency this year, Leigh stepped down from his role as Director of External Affairs and Development of Arrow Global Group Plc, one of the UK’s largest consumer debt purchasers engaging with government and regulators, trade bodies and consumer advice organisations.
Prior to this, he was the CEO and main shareholder of Tessera Credit Group, a debt purchaser and collection agency, which he led for over 16 years before successfully negotiating a sale of its assets to Arrow Global in December 2014.
Leigh is the Vice President of the European trade body FENCA where he is leading the development of a Code of Conduct for GDPR for the Collections industry across Europe, and regularly presents at conferences and trade body forums around the world. Leigh was also the 2019 President of the International Collectors Group and a Trustee of the FairLife Charity, and is a former Director of the Money Advice Liaison Group in the UK.
Appointed: March 2017
Mr Knox was an Australian Trade Commissioner serving in Saudi Arabia and Indonesia. He joined Morgans (now Morgans Financial Limited) in Sydney in 1988. He was Chief Institutional Options Dealer until moving to Brisbane in 1990 as Economist and Strategist. He joined the Board of Morgan Stockbroking in 1996. He became Director of Strategy and Chief Economist in 1998. Michael remained on the Board of Morgans until 2012.
Michael has served on many Queensland Government advisory committees. He was Chairman of the Queensland Food Industry Strategy Committee in 1992, a Member of the Consultative Committee of the Ipswich Development Board in 1993, a Member of the Queensland Tourism Strategy Committee in 1994 and a Member of the Ministerial Advisory Committee on Economic Development in 1997. From 2003 to 2012, he was Chairman of the Advisory Committee of School of Economics and Finance at the Queensland University of Technology. He has been a Governor of the American Chamber of Commerce from 1997 to 2007. In 2008, Michael joined the Board of The City of Brisbane Investment Corporation Pty Ltd. Michael remained on the Board until 2016. Michael was the President of the Economic Society of Australia (Qld) Inc from 2009 to 2013.
Appointed: November 2017
Anthony Rivas has over 25 years’ experience in the area of credit and collections, and extensive international experience in three continents.
Anthony served as Managing Director of Australian Receivables Limited until July 2016, after joining the company in 2013.
With an initial mandate to optimise costs, Anthony successfully led the team to achieve EBITDA targets each year under his leadership and improved staff turnover rates.
Anthony joined NCO/EGS in 2011, and led the Mexican operations for the company as Vice President of Operations. Here he was responsible for five facilities across Mexico, including collection agents, visitor agents, field attorneys and legal services.
Prior to joining NCO/EGS, Anthony worked and consulted in India, Australia, UK, and the USA. His accomplishments included:
- Assisting companies to bring purchased debt portfolios to India for the first time
- Vice President of Operations/Training for Global Vantedge (an OSI company) in the USA and India
- VP Operations at a 1000+ FTE facility, and surpassing US benchmarks for various clients in Bankcard and Telecommunications
Anthony has managed debt portfolios for a major international debt purchaser and successfully participated in the sale and transition of the portfolios to international investors. His technical developments include building automated skip waterfall systems, leveraging fetch technology to the internet with no agent involvement; system upgrades to enhance collector and reporting efficiency, enabling real time reporting; and helping lead Performance Management System training for OSI’s markets in the USA.
6
Collection House Limited Annual Report 2019
Board of Directors
See pages 15 to 17 for further information on the Board of Directors.
For
per
sona
l use
onl
y

Catherine McDowellNon-executive Director
Sandra Birkensleigh Non-executive Director
Overview Corporate Governance Financial Report Additional Information 7
Collection House Limited Annual Report 2019
Appointed: September 2018
Catherine McDowell has more than 30 years’ experience in the investment and financial services industry in senior executive and advisory roles, predominantly with Barclays Bank, and more recently with ANZ.
In Catherine’s role with Barclays International as Managing Director, she oversaw a substantial international wealth business before moving to New Zealand in 2005.
Catherine was the Managing Director at ANZ and the National Bank Private Banking and Wealth business (New Zealand). She was responsible for integrating these two businesses and creating a significant wealth business.
Catherine subsequently moved to Australia to build the Private Bank and Trust business while managing E-Trade. During her career Catherine spent 10 years in New York, 15 years in London and 8 years in New Zealand and Australia.
She has more than 15 years of Board experience with not for profit, listed and non-listed companies. Her current roles include Non-Executive Director of the National Provident Fund and Chair of the Investment Committee and Independent Director for the Todd Family Office. Catherine was recently appointed to the AMP Superannuation Board.
Appointed: September 2018
Sandra Birkensleigh is a Non-Executive Director of MLC Limited, Chair of the Audit Committte and a member of the Risk Committee and Disclosure Committee.
Sandra is also a Non-Executive Director of Auswide Bank, Chair of their Audit Committee and member of the Risk and Remuneration committees. She is a Non-Executive Director of 7 Eleven, and Chair of their Audit and Risk committee, and a Non-Executive Director of Horizon Oil Limited, Chair of their Audit Committee and a member of the Risk and Remuneration and Nomination Committees.
Sandra is also an independent member of the Audit Committee for the Reserve Bank of Australia, a Council Member and Chair of the Audit and Risk Committee of the University of the Sunshine Coast.
She is also a Non-Executive Director of the National Disability Insurance Agency and Chair of the Audit and Risk Committees and member of the People and Remuneration Committee. She is a member of the Investment Committee for the Public Trustee of Queensland. Sandra also sits on the boards of the Tasmanian Finance Corporation (Tascorp) and is Chair of the Audit Committee. She was recently appointed as Chair of the Financial Services Committee for the Institute of Internal Auditors of Australia.
Previously, Sandra held the role of Senior Partner of PwC until February 2013 and was the Global Head of Governance Risk and Compliance Services for PwC for five years. Sandra has a Bachelor of Commerce from University of New South Wales, is a Chartered Accountant, a Graduate of the Australian Institute of Company Directors and a Certified Compliance Professional (Fellow).
Board of Directors (continued)F
or p
erso
nal u
se o
nly

Anand Adusumilli Chief Data Scientist
Appointed: July 2017
Anand joined the Group on 26 July 2017, bringing over 15 years’ experience in the field of data science and predictive analytics for the financial services domain, primarily focussed on accounts receivables and debt collection.
Working with the US market leader in the debt collection industry for the last 12 years, he has vast experience in building pricing models, forecasting models, and optimisation models for operations in the financial services sector.
He has a proven track record in bridging strong symbiotic relationships between analytics and operations that are quintessential to be successful in our business.
Doug McAlpine CFO and Company Secretary
Appointed: July 2019
Doug was previously with Silver Chef Limited where he served most recently as the EGM of Australia and New Zealand and prior to that, CFO. Doug has previously held similar roles in the resources, property and general investment sectors. In addition to strong financial and commercial capability, Doug has a solid grounding in receivables financing and extensive experience working with the professional investment community.
Doug began his career at Ernst & Young. He is a Chartered Accountant with twenty years of accounting and finance experience, fifteen of which have been as CFO with listed public companies in Australia.
Jonathon Idas Chief Legal Officer
Appointed: September 2017
Jonathon joined Collection House Group on 6 September 2017, bringing over 16 years’ experience as a solicitor in Sydney and London including being the Chief Legal Officer for Australian Receivables Limited and Forbes Dowling Lawyers (FDL).
Since joining Collection House, he has had oversight of all legal matters, compliance, securities law and provides direction on corporate governance. He advised the company and was key in negotiations for the acquisition of Receivables Management (NZ) Limited and the assets of ACM Group, investment in Australian neo-bank Volt, the Portfolio Enhancement Program Agreements with Balbec Capital LP and completed the merger of company’s two legal practices MCC Legal and CLH Lawyers.
As Chief Legal Officer of Australian Receivables Limited Jonathon successfully acquired Turnbull Bowles Lawyers, strengthening FDL’s position and expanding legal services, client engagement and productivity.
As a solicitor in the United Kingdom his focus was helping clients navigate successfully through the global financial crisis, acting on large scale litigation and pursuing cross boarder insolvency matters.
Denica Saunders Chief Operating Officer
Appointed: July 2018
Denica joined the group in July 2015, following an extensive career in the financial services industry and operational management. Denica has worked in senior roles leading large-scale change programs specialising in business transformation, contact centre optimisation for global organisations, industry, peak bodies, Local and Federal Government agencies.
Denica leads our operational teams across Australia, New Zealand and the Philippines. Drawing on over 15 years leadership experience at both the operational and executive level, Denica is instrumental in shaping and executing CLH’s operational strategy, delivering best-in-class solutions for our clients and customers.
8
Collection House Limited Annual Report 2019
Executive Management TeamF
or p
erso
nal u
se o
nly
9
Collection House Limited Annual Report 2019
Overview Corporate Governance Financial Report Additional Information Overview
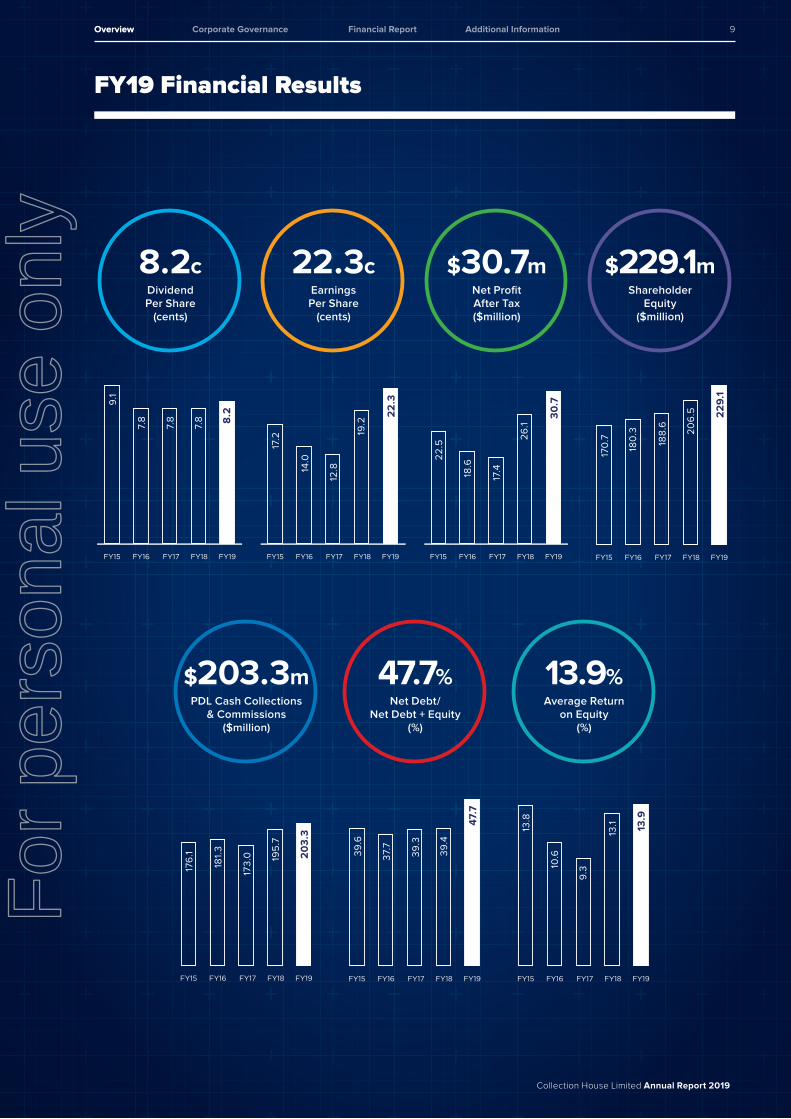
8.2c Dividend Per Share
(cents)
22.3c Earnings Per Share
(cents)
$30.7m Net ProfitAfter Tax($million)
$229.1m Shareholder
Equity($million)
$203.3m PDL Cash Collections
& Commissions($million)
47.7% Net Debt/
Net Debt + Equity(%)
13.9% Average Return
on Equity(%)
0
2
4
6
8
10
FY15 FY18 FY19FY16 FY17
8.2
7.8
7.8
7.8
9.1
0
5
10
15
20
25
FY15 FY18 FY19FY16 FY17
22
.3
19.2
14.0
12.8
17.2
0
5
10
15
20
25
30
35
FY15 FY18 FY19FY16 FY173
0.7
26.1
18.6
17.4
22
.5
0
50
100
150
200
250
FY15 FY18 FY19FY16 FY17
22
9.1
206
.5
180
.3
188
.6
170
.7
0
50
100
150
200
250
FY15 FY18 FY19FY16 FY17
20
3.3
195
.7
181.
3
173.
0
176
.1
0
10
20
30
40
50
FY15 FY18 FY19FY16 FY17
47.7
39.4
37.7
39.3
39.6
0
3
6
9
12
15
FY15 FY18 FY19FY16 FY17
10.6
9.3
13.8
13.9
13.1
FY19 Financial ResultsF
or p
erso
nal u
se o
nly

10
Collection House Limited Annual Report 2019
Corporate Governance
Collection House Limited’s Board and its Senior Executives are committed to achieving and demonstrating the highest standard of good corporate governance practices, and fostering a culture that values ethical behaviour and integrity.
The Board keeps the governance system under regular review to ensure that it reflects changes in law and keeps pace with best practice developments in corporate governance.
Board Composition As at 30 June 2019, the Board comprised of five Directors (including the Chair), four of whom are Independent Non-Executive Directors.
On 1 July 2018, the Board comprised of three Directors (including the Chair), two of whom were Independent Non-Executive Directors
During the reporting period, two additional directors, Catherine McDowell and Sandra Birkensleigh were appointed and stood for election at the AGM. Both were returned as Directors.
The Board considers its current members to have an appropriate mix of skills that enable the Board to discharge its responsibilities, and deliver the Company’s strategy and corporate objectives.
Board CommitteesOn 17 September 2018, the following Committees, each with its own Charter, were reinstated by the Board, together with its functions, powers and delegations:
– Audit and Risk Management Committee
– PDL Investment Committee
– Remuneration and Nomination Committee
Communication with ShareholdersCollection House Limited uses a range of methods to communicate with shareholders, including written and electronic communications. Shareholders are able to make enquiries with the Group at any time through the Investor Enquiries page on the Group’s website.
The Corporate Governance Statement is available onlineThe Company’s listing on the Australian Securities Exchange means it must comply with the Corporations Act 2001, the ASX Listing Rules and other Australian laws.
As part of this Compliance, Collection House Limited (the Group) is required to disclose how it has applied the recommendations contained in the ASX Corporate Governance Council’s Principles and Recommendations – 3rd Edition (the Principles and Recommendations) during the financial year ending 30 June 2019, explaining any departures from them.
The Group has, unless otherwise stated, followed the Principles and Recommendations throughout the year.
More information about Collection House Limited’s Board and Management, corporate governance policies, procedures and practices is in the Corporate Governance Statement available on the website at www.collectionhouse.com.au under the heading Investors – Corporate Governance.
Board of Directors
Chief Executive
O�cer
Executive Management
Team
Audit & Risk Management Committee
Internal Audit
PDLInvestment Committee
Remunerationand Nomination
Committee
For
per
sona
l use
onl
y

11
Collection House Limited Annual Report 2019
Directors’ Report
Overview Corporate Governance Financial Report Additional Information
The Directors present their report on the consolidated entity (referred to hereafter as the Company or the Group) consisting of Collection House Limited and the entities it controlled for the financial year ended 30 June 2019.
DirectorsThe following persons were Directors of the Group during the whole of the financial period and up to the date of this report, unless stated otherwise:
– Leigh Berkley - Chairman
– Michael Knox
– Anthony Rivas
– Sandra Birkensleigh (appointed 17 September 2018)
– Catherine McDowell (appointed 17 September 2018)
See pages 6 to 7 for profile information on the Directors.
Principal activitiesThe Company has two reportable segments: Purchased Debt Ledgers (PDLs), and Collection Services.
The principal activities of the Group were the provision of debt collection services and the purchase of consumer debt. There were no significant changes in the nature of the activities of the Group during the year.
Overview of Group operations and financial results
Key Information30 June 2019
$’00030 June 2018
$’000Change
%
Revenue 161,057 143,863 12
Net Profit after tax for the year 30,690 26,123 18
Earnings per share (EPS) 22.3 19.2 16
Dividends for the year * 8.2 7.8 5
* Total dividends for the year of 8.2 cents (interim 4.1 cents paid 28 March 2019, final 4.1 cents to be paid 25 October 2019), fully franked. The Dividend reinvestment plan remains in place at a discount of 5%
The headline numbers reflect a mixed story with strong PDL growth a lower than expected performance in cash collection and offset by a positive change from the adoption of AASB 9 Financial Instruments which favourably impacted interest income recognised during the period. Overall, trading conditions for both the Collection Services and PDL segments were challenging, as financial services sector clients, from whom the Group purchases or manages debt, had to deal with a rapidly changing regulatory environment and general disruption leading into the federal election. While there was short term disruption, the Group is well positioned to deliver an improved FY20 result through substantially higher cash and accounting earnings from the Company’s enlarged portfolio of PDL assets.
The Directors are of the view that the business is not performing at the level expected with Cash Collection initiatives not delivering until late in the period due to significant late growth and the Collection Services division disrupted by external factors. The Company is focussed on ensuring we are maximising every opportunity to engage with customers and work collaboratively to remedy their financial circumstances. Pleasingly, our process and technology initiatives are delivering improvements initial evidence of which is apparent post year end.
The Company is committed to its strategy of being early adopters of technology and being innovative in our utilisation of capital through strategically optimising our PDL portfolio. The Company delivered significant growth in its PDL asset base and strong growth in the rate at which customers are moving to payment arrangements. The RML acquisition in New Zealand significantly strengthens the Group’s presence in that market. The Company’s enlarged customer base and its technology initiatives are expected to deliver improved value to both customers and shareholders in FY20.
Directors’ ReportF
or p
erso
nal u
se o
nly

12
Collection House Limited Annual Report 2019
Directors’ Report
Key financial results – by segment – Audited ($’000)
Collection ServicesPurchased Debt Ledgers (PDLs) Consolidated
30 June 2019$ ‘000
30 June 2018$ ‘000
30 June 2019 $ ‘000
30 June 2018 $ ‘000
30 June 2019 $ ‘000
30 June 2018 $ ‘000
Revenue
Sales 67,604 69,038 – – 67,604 69,038
Interest and other income – – 93,660 75,002 93,660 75,002
Total segment revenue 67,604 69,038 93,660 75,002 161,264 144,040
Intersegment elimination (207) (177)
Consolidated revenue 67,604 69,038 93,660 75,002 161,057 143,863
Results
Segment result 9,264 12,564 52,090 36,695 61,354 49,259
Interest expense and borrowing costs (7,658) (5,778)
Unallocated revenue less unallocated expenses (10,093) (5,887)
Profit before tax 43,603 37,594
Taxation (12,913) (11,471)
NPAT 30,690 26,123
Adoption of AASB 9 Financial InstrumentsThe Group adopted AASB 9 in full for the first time in FY19, including applying the effective interest rate (“EIR”) method of revenue recognition and the new requirement to recognise both revaluation gains and losses on its portfolio of PDLs at each reporting date through profit and loss. At 30 June 2019, no revaluation gains or losses were recognised in respect of the Company’s PDL portfolio.
Purchased Debt Ledger (PDL) SegmentThe Purchase Debt Ledger segment reported revenue of $93.7 million, up 25% on FY18. This includes a $9.8 million pre-tax profit from the PEP transaction with Balbec previously announced. This transaction liberated capital from mature payment arrangements, lessening our requirement for additional debt capital to fund investments in new PDL acquisitions to drive growth and improved financial returns. The Group anticipates a year of lower acquisitive growth in FY20 after the exceptional expansion ($133m) in FY19.
Collection Services SegmentCollection Services revenue was $67.6 million down 2% on prior year. This decline was driven by short term external factors, being the timing of the federal election and the Financial Services Royal Commission which both impacted client activity. As this reflected a short term aberration, overheads were maintained during the year. The fixed cost nature of the operation meant EBIT fell to $9.3 million (FY18: $12.9 million), below our initial expectations of a flat economic performance on the prior period. Although disappointing, management considers this a reasonable result during a period of significant market disruption for our clients.
Cost StructureDirectly attributable variable costs exhibited only a minor increase year on year, reflective of continually improving operating initiatives and system efficiencies. Employee costs were up substantially on prior year reflecting ongoing investment in agent and legal teams, but also in IT and business intelligence support functions. There was an element of employee cost growth in FY19 linked to the integration of the ACM and RML businesses acquired during the year which is non-recurring.
Corporate and administrative costs also increased, but similar to employee costs, there was some level of cost linked to the ACM and RML transactions which is non-recurring. Finance costs were up year on year as a result of debt drawn to fund PDL acquisitions, but remain generally proportionate to revenue. The effective income tax rate will be close to 30% as no material permanent differences exist.
For
per
sona
l use
onl
y

13
Collection House Limited Annual Report 2019
Directors’ Report
Overview Corporate Governance Financial Report Additional Information
Capital ManagementThe Group’s total assets at 30 June 2019 were $471 million, up 27% on prior year. No material change to working capital and gross assets are up in line with PDL acquisition activity during the year. Total debt was up in line with PDL growth.
Net gearing at year end was 48%. The Group continues to generate strong operational cash flow, a significant proportion of which is reinvested into the asset base. The Group is working within its facilities and gearing framework and the step-up in cash collections expected in FY20 will provide adequate funding for the Company to continue to be active in the market for PDL books. The Group also retains in principle access to $100 million in off balance sheet finance through the partnership with Balbec.
People and CultureThe Company is focused on running its business within a framework of values which commits us to make a contribution across a range of stakeholders, including shareholders, clients, customers, employees and the wider community. During FY19, we formalised strategies for better supporting our employees and our customers, reducing our environmental impact and creating more meaningful engagement with wider community initiatives. The Company recognises that its social license to operate is dependent on continually displaying a culture of transparency and integrity which its clients, customers and the wider community can rely upon. The Group takes these obligations seriously and has comprehensive policies and procedures in place to ensure these high standards of behaviour are achieved.
Technology and InnovationThe Company reaffirms its strategy of becoming an industry leader in the development and implementation of technology solutions which improve employee, client and customer experience, but also generate operating efficiencies. The Group continues to invest each year in the improvement to C5, its underlying collection and customer management platform. During FY19, 8% of collections were generated from the online customer portal.
Business strategies and prospects for future financial yearsOur core business strategy is to grow the business by:
– Continuing to invest in our existing business
– Continuing to expand into new business segments within Collection Services
– Creating and building complementary business model adjacencies
Key RisksOur key risks are:
– Overpaying on PDL investments
– Failing to collect PDLs in accordance with our pricing models
– Changes to regulations governing our activities or breaching of compliance obligations
– Failure to retain existing and acquire new agency clients
– Availability of appropriately priced capital to support the Company’s growth objectives
– Disruption to systems and operation due to cyber breach or privacy breaches
– Failure to maintain appropriate level of investment in information systems to improve customer experience
The Audit and Risk Management Committee provides Board oversight to the management of risk mitigation strategies that are implemented for the Group.
For
per
sona
l use
onl
y

14
Collection House Limited Annual Report 2019
Directors’ Report
DividendsDividends paid or declared by the Company to members since the end of the previous financial year were:
Declared and paid during the year 2018Cents per
shareTotal amount
$’000Date of
payment
Final 2018 ordinary 3.9 5,349 26 October 2018
Interim 2019 ordinary 4.1 5,665 28 March 2019
After balance date the following dividends were proposed by the Directors. The dividends have not been provided for, and there are no income tax consequences:
Declared after end of yearCents per
shareTotal amount
$’000Date of
payment
Final 2019 ordinary 4.1 5,710 25 October 2019
Significant changes in the state of affairsThere were no significant changes in the state of affairs of the Group during the financial year.
Matters subsequent to the end of the financial yearThe Directors have recommended the payment of a final fully franked ordinary dividend of 4.1 cents per fully paid share to be paid on 25 October 2019 out of retained profits and a positive net asset balance as at 30 June 2019.
Other than the matters discussed above, no matter or circumstance has arisen since 30 June 2019 that has significantly affected, or may significantly affect:
(a) the Group’s operations in future financial years, or
(b) the results of those operations in future financial years, or
(c) the Group’s state of affairs in future financial years.
Environmental regulationThe Group’s operations are not regulated by any significant environmental regulation under a law of the Commonwealth or of a state or territory.
For
per
sona
l use
onl
y

15
Collection House Limited Annual Report 2019
Directors’ Report
Overview Corporate Governance Financial Report Additional Information
Information on directors
Leigh Berkley Independent, Chairman
Experience Having qualified as a Chartered Accountant, Mr Berkley has more than 25 years’ experience in the collections and debt purchase industry, is immediate past President of the Credit Services Association (CSA) in the UK and assisted the Australian Collectors & Debt Buyers Association (ACDBA) develop their Code of Practice.
Having been granted Australian residency this year, Leigh stepped down from his role as Director of External Affairs and Development of Arrow Global Group Plc, one of the UK’s largest consumer debt purchasers engaging with government and regulators, trade bodies and consumer advice organisations.
Prior to this, he was the CEO and main shareholder of Tessera Credit Group, a debt purchaser and collection agency, which he led for over 16 years before successfully negotiating a sale of its assets to Arrow Global in December 2014.
Leigh is the Vice President of the European trade body FENCA where he is leading the development of a Code of Conduct for GDPR for the Collections industry across Europe, and regularly presents at conferences and trade body forums around the world. Leigh was also the 2019 President of the International Collectors Group and a Trustee of the FairLife Charity, and is a former Director of the Money Advice Liaison Group in the UK.
Mr Berkley was appointed to the Board of Collection House Limited on 1 July 2016.
Mr Berkley was appointed Chairman of Collection House Limited on 29 November 2017.
Special responsibilities Chair of the PDL Investment Committee
Interest in shares 71,200 ordinary shares in CLH
Michael Knox Independent, Non-executive Director
Experience Mr Knox was an Australian Trade Commissioner serving in Saudi Arabia and Indonesia. He joined Morgans (now Morgans Financial Limited) in Sydney in 1988. He was Chief Institutional Options Dealer until moving to Brisbane in 1990 as Economist and Strategist. He joined the Board of Morgan Stockbroking in 1996. He became Director of Strategy and Chief Economist in 1998. Michael remained on the Board of Morgans until 2012.
Michael has served on many Queensland Government advisory committees. He was Chairman of the Queensland Food Industry Strategy Committee in 1992, a Member of the Consultative Committee of the Ipswich Development Board in 1993, a Member of the Queensland Tourism Strategy Committee in 1994 and a Member of the Ministerial Advisory Committee on Economic Development in 1997. From 2003 to 2012, he was Chairman of the Advisory Committee of School of Economics and Finance at the Queensland University of Technology. He has been a Governor of the American Chamber of Commerce from 1997 to 2007. In 2008, Michael joined the Board of The City of Brisbane Investment Corporation Pty Ltd. Michael remained on the Board until 2016. Michael was the President of the Economic Society of Australia (Qld) Inc from 2009 to 2013.
Mr Knox was appointed to the Board of Collection House Limited on 24 March 2017.
Special responsibilities Nil
Interest in shares 60,000 ordinary shares in CLH
For
per
sona
l use
onl
y

16
Collection House Limited Annual Report 2019
Directors’ Report
Anthony Rivas Managing Director
Experience Anthony Rivas has over 25 years’ experience in the area of Credit and Collections, and extensive international experience in three continents.
Anthony has served as Managing Director of Australian Receivables Limited until July 2016, after joining the company in 2013.
With an initial mandate to optimise costs, Anthony successfully led the team to achieve EBITDA targets each year under his leadership and improved staff turnover rates.
Anthony joined NCO/EGS in 2011, and led the Mexican operations for the company as Vice President of Operations. Here he was responsible for five facilities across Mexico, including collection agents, visitor agents, field attorneys and legal services.
Prior to joining NCO/EGS, Anthony worked and consulted in India, Australia, UK, and the USA. His accomplishments included:
– Assisting companies to bring purchased debt portfolios to India for the first time
– Vice President of Operations/Training for Global Vantedge (an OSI company) in the USA and India
– VP Operations at a 1000+ FTE facility, and surpassing US benchmarks for various clients in Bankcard and Telecommunications
Anthony has managed debt portfolios for a major international debt purchaser and successfully participated in the sale and transition of the portfolios to International investors. His technical developments include building automated skip waterfall systems, leveraging fetch technology to the internet with no agent involvement; system upgrades to enhance collector and reporting efficiency, enabling real time reporting; and helping lead Performance Management System training for OSI’s markets in the USA.
Mr Rivas was appointed Managing Director on 24 November 2017.
Special responsibilities Nil
Interest in shares 6,690 ordinary shares in CLH
71,409 FY17 deferred shares in CLH
77,584 FY18 deferred shares in CLH
95,796 FY19 deferred shares in CLH
Catherine McDowell Independent, Non-executive Director
Experience Catherine McDowell has more than 30 years’ experience in the investment and financial services industry in senior executive and advisory roles, predominantly with Barclays Bank, and more recently with ANZ.
In Catherine’s role with Barclays International as Managing Director, she oversaw a substantial international wealth business before moving to New Zealand in 2005.
Catherine was the Managing Director at ANZ and the National Bank Private Banking and Wealth business (New Zealand). She was responsible for integrating these two businesses and creating a significant wealth business.
Catherine subsequently moved to Australia to build the Private Bank and Trust business while managing E-Trade. During her career Catherine spent 10 years in New York, 15 years in London and 8 years in New Zealand and Australia.
She has more than 15 years of Board experience with not for profit, listed and non-listed companies. Her current roles include Non-Executive Director of the National Provident Fund and Chair of the Investment Committee and Independent Director for the Todd Family Office. Catherine she was recently appointed to the AMP Superannuation Board.
Catherine was appointed to the Board of Collection House on 17 September 2018.
Special responsibilities Chair of the Remuneration and Nomination Committee
Interest in shares No ordinary shares in CLH
For
per
sona
l use
onl
y

17
Collection House Limited Annual Report 2019
Directors’ Report
Overview Corporate Governance Financial Report Additional Information
Sandra Birkensleigh Independent, Non-executive Director
Experience Sandra Birkensleigh is a Non-Executive Director of MLC Limited, Chair of the Audit Committte and a member of the Risk Committee and Disclosure Committee.
Sandra is also a non-executive Director of Auswide Bank, Chair of their Audit Committee and member of the Risk and Remuneration committees. She is a Non-Executive Director of 7 Eleven, and Chair of their Audit and Risk committee, and a Non-executive Director of Horizon Oil Limited, Chair of their Audit Committee and a member of the Risk and Remuneration and Nomination Committees.
Sandra is also an independent member of the Audit Committee for the Reserve Bank of Australia, a Council Member and Chair of the Audit and Risk Committee of the University of the Sunshine Coast.
She is also a Non-executive Director of the National Disability Insurance Agency and Chair of the Audit and Risk Committees and member of the People and Remuneration Committee. She is a member of the Investment Committee for the Public Trustee of Queensland. Sandra also sits on the boards of the Tasmanian Finance Corporation (Tascorp) and is Chair of the Audit Committee. She was recently appointed as Chair of the Financial Services Committee for the Institute of Internal Auditors of Australia.
Previously, Sandra held the role of Senior Partner of PwC until February 2013 and was the Global Head of Governance Risk and Compliance Services for PwC for five years. Sandra has a Bachelor of Commerce from University of New South Wales, is a Chartered Accountant, a Graduate of the Australian Institute of Company Directors and a Certified Compliance Professional (Fellow).
Sandra was appointed to the Board of Collection House on 17 September 2018.
Special responsibilities Chair of the Audit and Risk Management Committee
Interest in shares No ordinary shares in CLH
Company SecretaryDoug McAlpine was appointed as the Chief Financial Officer (“CFO”) and Company Secretary on 1 July 2019.
Doug was previously with Silver Chef Limited where he served most recently as the EGM of Australia and New Zealand and prior to that, CFO. Doug has previously held similar roles in the resources, property and general investment sectors. In addition to strong financial and commercial capability, Doug has a solid grounding in receivables financing and extensive experience working with the professional investment community.
Doug began his career at Ernst & Young. He is a Chartered Accountant with twenty years of accounting and finance experience, fifteen of which have been as CFO with listed public companies in Australia.
Meetings of DirectorsThe number of meetings of the Group’s Board of Directors and of each board committee held during the year ended 30 June 2019, and the number of meetings attended by each Director were:
2019
Meetings of committees
DirectorsAudit and Risk Management PDL Investment
Remuneration and Nomination
Attended Held Attended Held Attended Held Attended Held
Leigh Berkley 10 10 7 7 10 10 5 5
Michael Knox 9 10 6 7 3 10 4 5
Anthony Rivas 10 10 7 7 10 10 5 5
Sandra Birkensleigh (Appointed on 17 September 2018) 8 8 7 7 4 10 5 5
Catherine McDowell (Appointed on 17 September 2018) 7 8 7 7 4 10 5 5
All committees were reconstituted effective 17 September 2018. Prior to that date, all committee matters were considered by the Board of Directors.
For
per
sona
l use
onl
y

18
Collection House Limited Annual Report 2019
Directors’ Report
Remuneration Report – AUDITEDThis Remuneration Report outlines the overall remuneration strategy, framework and practices adopted by the Group for FY19 for Non-Executive Directors (NEDs), the Chief Executive Officer and other Key Management Personnel (KMP). It has been prepared in accordance with the requirements of the Corporations Act 2001 (Cth), as amended (the Act) and its regulations. The information provided in this Remuneration Report has been audited as required by Section 308(3C) of the Act. The Remuneration Report contains the following sections:
A Directors and other Key Management Personnel disclosed in this report
B Remuneration governance
C Executive remuneration policy and framework
D Relationship between remuneration and the Group’s performance
E Non-executive Director remuneration policy
F Details of remuneration of Directors and Key Management Personnel
G Service agreements
H Share-based compensation
I Equity instruments held by Key Management Personnel
J Additional information
Director and Executive Remuneration
A Directors and other key management personnel disclosed in this reportThe key management personnel include those who have the authority and responsibility, directly or indirectly, to plan, direct and control the major activities of the Group.
The Group’s Directors and key management personnel for FY19
Board of Directors
Leigh Berkley Chairman (Non-Executive)
Michael Knox Director (Non-Executive)
Anthony Rivas Managing Director and Chief Executive Officer
Sandra Birkensleigh Director (Non-Executive) (appointed 17 September 2018)
Catherine McDowell Director (Non-Executive) (appointed 17 September 2018)
Executive Leadership Team (ELT)
Anthony Rivas Chief Executive Officer (CEO)
Kristine May Chief Financial Officer (CFO) and Company Secretary (resigned 30 June 2019)
Anand Adusumilli Chief Data Scientist
Jonathon Idas Chief Legal Officer
Denica Saunders Chief Operating Officer (COO) (appointed 1 July 2018)
Doug McAlpine Chief Financial Officer (CFO) and Company Secretary (appointed 1 July 2019)
For
per
sona
l use
onl
y

19
Collection House Limited Annual Report 2019
Directors’ Report
Overview Corporate Governance Financial Report Additional Information
B Remuneration governanceOverall remuneration strategy, framework and practices adopted by the Group are governed by the Board and the Remuneration and Nomination Committee. These functions include consideration of the following:
– How the remuneration policies are applied to members of the ELT
– The basis of short and long-term performance-based incentive payments for members of the ELT
– The appropriate fees for NEDs.
Fundamental to all arrangements is that all KMP must contribute to the achievement of short and long-term objectives, enhance shareholder value, avoid unnecessary or excessive risk taking and discourage behaviour that is contrary to the Group’s values.
Details of the short and long-term incentive schemes are set out below in the Section C: ‘Executive Remuneration Policy and Framework’ section of the Remuneration Report.
The objectives of the Group’s remuneration policies are to ensure remuneration packages for KMP reflect their duties, responsibilities and level of performance – as well as to ensure all KMP are motivated to pursue the long-term growth and success of the Group.
In determining the remuneration of all KMP, the Board aims to ensure that the remuneration policies and framework:
– Are fair and competitive and align with the long-term interests of the Group
– Incentivise all KMP to pursue the short and long-term growth and success of the Group within an appropriate risk control framework
– Are competitive and reasonable, enabling the Group to attract and retain key talent, knowledge and experience
– Are aligned to the Group’s strategic and business objectives and the creation of shareholder value
– Have a transparent reward structure with a risk proposition that is linked to the achievement of pre-determined performance targets.
Use of external advisorsIn performing its role, the Remuneration and Nominations Committee may directly commission and receive information, advice and recommendations from independent, external advisers. This is done to ensure the Group’s remuneration packages are appropriate, reflect industry standards and help achieve the objectives of the Group’s remuneration strategy. External benchmarking of executive and director remuneration arrangements were provided by PricewaterhouseCoopers (PwC) during the period the fees for which were $47,212. Results of the external remuneration advisors include the hiring of high calibre non- executive directors and the performance of an independent review on the Directors and Executives remuneration package.
Securities Trading PolicyThe trading of shares issued to eligible employees under any of the Group’s employee equity plans was subject to, and conditional upon, compliance with the Group’s Securities Trading Policy. Members of the ELT are prohibited from entering into any hedging arrangements over unvested performance rights under the Group’s Performance Rights Plan (PRP). The Group would consider a breach of this policy as misconduct, which may lead to disciplinary action and potentially dismissal.
C Executive remuneration policy and frameworkThe Group’s executive remuneration strategy is designed to attract, motivate and retain high performing individuals and align the interests of executives with shareholders.
The Remuneration and Nomination Committee and the Board reviews the remuneration packages for members of the ELT annually by reference to individual performance against key individual objectives, the Group’s consolidated results and market data. The performance review of the CEO is undertaken by the Chair of the Board who then makes a recommendation to the Board. The performance review of the other members of the ELT is undertaken by the CEO and approved by the Board.
The Group aims to reward members of the ELT with a level of remuneration commensurate with their responsibilities and position within the Group, and their ability to influence shareholder value creation. The remuneration framework links rewards with the strategic objectives and performance of the Group.
The ELT pay and reward framework has three components:
– Total fixed remuneration (TFR) including superannuation and benefits
– Short-term incentives (STIs), paid in cash or shares
– Long-term incentives (LTIs) through participation in the Performance Rights Plan (PRP), which has been approved by the Board.
The combination of these components amount to the total remuneration package or total employment cost for members of the ELT including the CEO.
For
per
sona
l use
onl
y

20
Collection House Limited Annual Report 2019
Directors’ Report
Total fixed remunerationStructured as a total employment cost package, the total fixed remuneration (TFR) may be delivered as a combination of cash and prescribed non-financial benefits at the discretion of the ELT member. Members of the ELT are offered a competitive TFR that comprises the cash salary, superannuation and non-monetary benefits. The TFR for ELT members is reviewed annually to ensure the pay is in line with the role, experience and performance and remains competitive with the market. Group and individual performance are considered during the annual remuneration review. The TFR is usually fixed for a 12-month period with any changes effective from 1 September each financial year. An ELT member’s remuneration is also reviewed upon any change of duties.
Retirement benefits for ELTThere are no additional retirement benefits made available to members of the ELT, other than those required by statute or by law and under the shareholder approved performance rights plans.
Short-term incentives (STIs)To ensure that remuneration for members of the ELT are aligned to the Group’s performance, a portion of their remuneration, in line with their ability to influence results, is performance based and, therefore, ‘at risk’.
ELT members have the opportunity to earn an annual STI if pre-defined targets are achieved. The CEO had a target STI opportunity of 75 percent of TFR, with 60 percent of the determined amount to be paid in cash and 40 percent deferred payment to be provided in shares at the end of the contract period. Other ELT personnel each have a cash-based STI opportunity of up to 25 percent of TFR.
STIs for the ELT in FY19 were based on scorecard measures and weightings. The CEO key performance objective targets were set by the Board at the beginning of the financial year and aligned to the Group’s strategic and business objectives, as outlined below.
The STIs for other members of the ELT are recommended by the CEO to the Board based on the ELT meeting financial and non- financial target performance objectives set by the CEO.
There is a high degree of alignment between the Company strategy and the ELT’s STI performance objective targets. The relative weights of financial versus non-financial performance targets for each executive are detailed below and are based on their position and influence on the financial results. The weightings strive to provide a balance between the Company’s overall financial goals and the ability of the individual executives to influence these and other strategic outcomes.
Position
Financial Performance
Objectives
Non-Financial Performance
Objectives
Chief Executive Officer 80% 20%
Chief Financial Officer/Company Secretary 80% 20%
Chief Data Scientist 80% 20%
Chief Legal Officer 80% 20%
Chief Operating Officer (appointed 1 July 2018) 80% 20%
The financial performance objectives are the same for all Senior Executives, providing a common objective for the ELT.
The non-financial ELTs have a high degree of variability between technology projects, people and culture, and processes that reflect the individual roles, and include measures such as achieving strategic outcomes, developing people and culture, growth, business development, differentiation, innovation, digital development and other key initiatives during the financial year.
Each executive has a high degree of clarity on their individual performance objectives and priorities, as established by their scorecard. They also have an understanding of the inter-relationship of their individual performance objectives to the objectives of the other members of the ELT.
For
per
sona
l use
onl
y

21
Collection House Limited Annual Report 2019
Directors’ Report
Overview Corporate Governance Financial Report Additional Information
CEO STI targets for FY19 and FY18Payment of the STI is discretionary and subject to the requirement to achieve a minimum of 5% growth in EPS in a financial year, as well as the achievement of the individual personal objectives outlined below:
Performance category Metrics Weighting (%)
Financial – Earnings per share (EPS) 80
Non-Financial – Compliance 10
– Innovative Solutions implemented 5
– Improvement of Corporate Culture 5
A summary of the actual STI Financial outcomes achieved is included in Section D.
Deferred Shares – CEO short-term incentive schemeUnder the Group’s short-term incentive (STI) scheme, the CEO is entitled to receive 60% of his annual STI achieved in cash, and 40% in the form of rights to deferred shares of Collection House Limited, issuable at the end of his contract period, subject to him being employed by the Group at the end of the contract period. The rights will automatically convert into one ordinary share each on vesting, at an exercise price of nil. The CEO will not receive dividends, or be entitled to vote in relation to the deferred shares prior to the vesting date of 1 July 2019. The number of rights to be granted is determined based on the amount of the STI awarded divided by the weighted average price at which the Company’s shares are traded on the Australian Securities Exchange over the five trading days preceding the date of issue.
The maximum value of deferred shares issuable in relation to 30 June 2019 was $154,551. The Board has determined that the CEO is entitled to 75% of the maximum entitlement and shares to the value of $115,913 will be issued post year end.
Cessation of employment For resignation or termination for cause, any STI is forfeited, unless otherwise determined by the Board.
For any other reason, the Board may award STI on a pro-rata basis taking into account time and the current level of performance against performance hurdles.
Long-term incentives (LTIs)LTIs are awarded to the Group’s ELT by way of performance rights via the Performance Rights Plan (PRP). The LTI program has the objective of delivering long-term shareholder value by incentivising members of the ELT to achieve sustained financial performance over a three-year period (with no opportunity to retest).
Annual grants of performance rights are proposed to be made to the Group’s ELT under the PRP. The number of performance rights granted is calculated based on the weighted average share price over the five trading days before the grant date. Sections H and I provide details of performance rights granted, vested, exercised and lapsed during the year.
Performance rights were awarded to various eligible employees pursuant to the PRP, at a nil exercise price and subject to a three-year tenure hurdle. This is contingent on the achievement of certain financial performance hurdles, which are approved by the Board each financial period.
The performance rights will not vest unless the Group’s financial performance meet these hurdles. The Board set these hurdles to ensure that the ELT and eligible employees were focused on the delivery of increased shareholder value through the achievement of the short and long-term goals of the Group. Participants in the PRP do not receive distributions or dividends on unvested LTI grants.
FY19 Performance Rights AwardedNo unlisted performance rights over ordinary shares in the Company were granted during the current year under the PRP to the ELT and other eligible employees.
For
per
sona
l use
onl
y

22
Collection House Limited Annual Report 2019
Directors’ Report
FY18 Performance Rights AwardedFor the FY18 performance rights the Board chose Earnings Per Share (EPS) as the key financial measurement as EPS growth will ensure that long-term shareholder value is achieved. The hurdles and the proportion of performance rights that will vest as a percentage if the target is achieved, are outlined below:
Performance Hurdles – Compound EPS Growth % of Pool
0% – 5.00% Nil
5.01% – 7.50% 33.33%
7.51% – 10.00% 66.66%
More than 10.01% 100%
For the period, 341,071 unlisted performance rights over ordinary shares in the Company were granted under the PRP to the ELT and other eligible employees. The performance rights will vest (and therefore be capable of being exercised) depending on the Group achieving certain performance hurdles as at 30 June 2020 as highlighted above.
As announced at 25th June 2019, the CEO has been reappointed for a further 3 year term. As part of his commitment to the Group and its shareholders, the CEO has forgone 2,000,000 of his 3,000,000 performance rights as at FY19.
For the period 1 July 2016 to 30 June 2019, 1,403,513 unlisted performance rights over ordinary shares in the Company were granted to the ELT and other eligible employees. The performance rights will vest (and therefore be capable of being exercised) depending on the Group achieving certain performance hurdles as at 30 June 2019 as highlighted above.
A summary of the actual LTI Financial outcomes achieved is included in Section D.
Cessation of employmentFor ‘uncontrollable events’ (including death, serious injury and disability and forced early retirement, retrenchment or redundancy), any LTI that is capable of becoming exercisable if performance hurdles are met at the next test date will become vested performance rights. The Board, at its discretion, may determine the extent to which any other unvested performance rights, that have not lapsed, will become vested performance rights.
For any other reason, all unvested LTI awards will lapse immediately, unless otherwise determined by the Board.
Change of controlWhere a proposal is publicly announced in relation to the Group which the Board reasonably believes may lead to a change in control event, all unvested LTI awards that have not lapsed, will vest and become exercisable.
ClawbackThe Group will reduce, cancel or clawback any performance-based remuneration in the event of serious misconduct or a material misstatement of the Group’s financial statements.
DiscretionThe Board has absolute discretion in relation to payments under both the STI and LTI schemes.
D Relationship between remuneration and the Group’s performanceGroup performance and its link to LTIThe overall level of reward for members of the ELT takes into account the performance of the Group over a number of years, with greater emphasis given to the current and previous year. Details of the relationship between the remuneration policy and Group’s performance over the last five years is detailed below.
2015 2016 2017 2018 2019
Net profit after tax ($m) $22.5 $18.6 $17.4 $26.1 $30.7
Dividends declared (franked) 9.1 cents 7.8 cents 7.8 cents 7.8 cents 8.2 cents
Share price commenced $1.88 $2.23 $1.10 $1.16 $1.49
Share price ended $2.23 $1.10 $1.16 $1.49 $1.21
Basic EPS (including discontinued operations) 17.2 cents 14.0 cents 12.8 cents 19.2 cents 22.3 cents
For
per
sona
l use
onl
y

23
Collection House Limited Annual Report 2019
Directors’ Report
Overview Corporate Governance Financial Report Additional Information
Details of remuneration: cash bonuses and performance rightsFor each cash bonus and grant of performance rights included in the table on page 28 the percentage of the available bonus or grant that was paid, or that vested, in the financial year, and the percentage that was forfeited because the person did not meet the service and performance criteria, is set out below. Other than the deferred payment shares, no part of the STI is payable in future years. No performance rights will vest unless the vesting conditions are met, hence the minimum value of the performance rights yet to vest is nil. The maximum value of the performance rights in the options reserve has been determined as the fair value of the performance rights at grant date.
Cash bonusDeferred Payment
Shares Performance rights
Awarded %
Forfeited %
Awarded %
Forfeited %
Financial year
grantedVested
%Forfeited
%Lapsed
%
Financial years in
which performance
rights may be vested
(subject to certain qualifying
hurdles)
Maximum total
value of performance
rights in options reserve
Anthony Rivas* 75% 25% 75% 25% 2019 – – – –
80% 20% 80% 20% 2018 – – – – –
80% 20% 80% 20% 2017 – 66% – 2020 1,294,470
Kristine May (resigned 30 June 2019)
– 100% – – 2018 – 100% – 2021 –
– 100% – – 2017 – 100% – 2020 –
Anand Adusumilli
75% 25% – – 2019 – – – – –
80% 20% – – 2018 – – – 2021 27,047
Jonathon Idas
80% 20% 2019 – –
80% 20% – – 2018 – – – 2021 27,375
Denica Saunders 90% 10% – – 2019 – – – – –
* Under the terms of the CEO’s employment agreement, 40% of the FY17 STI is payable in shares at the end of the employment contract, and is contingent upon the CEO being employed by the Company at the end of the contract period.
For
per
sona
l use
onl
y

24
Collection House Limited Annual Report 2019
Directors’ Report
E Non-Executive Director remuneration policyNon-Executive Director’s (“NEDs”) fees are determined within an aggregate Directors’ fee pool limit, which is periodically recommended for approval by shareholders. NEDs do not receive share options or performance rights. The maximum aggregate fee pool and the fee structure is reviewed annually against fees paid to NEDs of comparable companies. The Board considers advice from external advisors when undertaking the annual review process.
The maximum annual aggregate NED fee pool limit is $900,000 per annum, as approved by shareholders at the Group’s Annual General Meeting as at 25 October 2013. The FY19 aggregate total NED fees distribution is $512,900 (including superannuation).
Payments are allowed for additional responsibilities for the Chair of each Board Committee. Fees and payments to NED reflect the demands that are made on, and the responsibilities of, the Directors.
The table below summarises the NED fees for FY19 (exclusive of superannuation):
FEES FY19* FY18
Base fees
Chair $175,000 $165,000
Other Non-Executive Directors $95,000 $90,000
Additional fees
Audit and Risk Management Committee Chair $25,000 $15,000
Audit and Risk Management Committee Member $Nil $Nil
Remuneration and Nomination Committee Chair $25,000 $15,000
Remuneration and Nomination Committee Member $Nil $Nil
PDL Investment Committee Chair $25,000 $15,000
PDL Investment Committee Member $Nil $Nil
* Change in Directors’ remuneration was effective as at 1/1/2019.
For further information in relation to Directors’ remuneration, including fees paid in accordance with statutory rules and applicable accounting standards, refer to Section F below.
Note that the changes in the NED fee structure do not require an increase in the Directors’ fee pool limit.
Retirement allowances for DirectorsThere are no retirement allowances paid to Non-Executive Directors.
For
per
sona
l use
onl
y

25
Collection House Limited Annual Report 2019
Directors’ Report
Overview Corporate Governance Financial Report Additional Information
F Details of remuneration of Directors and Key Management PersonnelAmounts of remuneration Details of the remuneration of Directors and all other key management personnel (as defined in AASB 124 Related Party Disclosures) of the Group are set out below.
In Dollars
Short-term Post-
employmentOther long
term
Termination benefits
Share-based payments
Total
Proportion of remuneration performance
relatedSalary
and feesSTI Cash
bonus
Non-monetary
benefits Total
Super-annuation
benefits
Annual and long
service leave Rights
Non-Executive Directors
Leigh Berkley Chairman
2019 194,098 – 12,569 206,667 7,213 – – – 213,880
2018 182,326 – – 182,326 4,396 – – – 186,722
2017 106,650 – – 106,650 2,850 – – – 109,500
Michael Knox Non-Executive Director
2019 92,500 – – 92,500 8,788 101,288
2018 90,000 – – 90,000 8,550 98,550
2017 24,557 – – 24,557 2,302 – – – 26,879
Sandra Birkensleigh Non-Executive Director (appointed 17 September 2018)
2019 90,288 – – 90,288 8,577 98,865
Catherine McDowell Non-Executive Director (appointed 17 September 2018)
2019 90,288 – – 90,288 8,577 98,865
In Dollars
Short-term Post-
employmentOther long
term
Termination benefits
Share-based payments
Total
Proportion of remuneration performance
relatedSalary
and feesSTI Cash
bonus
Non-monetary
benefits Total
Super-annuation
benefits
Annual and long
service leave Rights **
Deferred Shares*
Executive Director and other Key Management Personnel
Anthony Rivas Managing Director/Chief Executive Officer
2019 484,921 173,870 33,569 692,360 46,067 26,067 – 431,490 115,913 1,311,897 55%
2018 433,418 173,400 32,126 638,944 38,788 31,284 – 431,490 115,600 1,256,106 57%
2017 421,731 159,600 51,536 632,867 40,064 22,237 – 431,490 106,400 1,233,058 57%
Kristine May Chief Financial Officer/Company Secretary (resigned 30 June 2019)
2019 247,029 – 4,705 251,734 23,468 – 208,938 – – 484,140 0%
2018 234,556 63,000 4,549 302,105 22,283 13,844 – 56,214 – 394,446 30%
2017 158,276 62,000 2,938 223,214 15,036 5,876 – 8,542 – 252,668 28%
Anand Adusumilli Chief Data Scientist
2019 279,567 59,027 9,034 347,628 26,559 14,683 – 8,892 – 397,762 17%
2018 248,124 49,000 – 297,124 23,572 1,445 – 1,066 – 323,207 15%
Jonathon Idas Chief Legal Officer
2019 278,439 61,200 4,902 344,541 26,452 – – 9,000 – 379,993 18%
2018 205,721 50,000 – 255,721 19,543 11,802 – 1,079 – 288,145 18%
Denica Saunders Chief Operating Officer (appointed 1 July 2018)
2019 287,644 70,833 4,705 363,182 27,326 13,299 – – – 403,807 18%
- For recently appointed ELT, the remuneration information provided in the table relates to the period from the date of appointment as ELT to 30 June 2019, unless otherwise stated.
* Deferred shares represent 40 percent of STI, payable to the CEO at the end of his contract term.** FY19 Performance rights (LTI) were not approved by the Board at the date of this report.
For
per
sona
l use
onl
y

26
Collection House Limited Annual Report 2019
Directors’ Report
G Service agreementsRemuneration and other terms of employment for the CEO and other Key Management Personnel are also formalised in service agreements. Except for the CEO who has a six month notice period, all contracts with members of the ELT may be terminated early by either party with three months’ notice. The Company, at its full discretion, may make a payment in lieu of the notice period, either partially or in full. Major provisions of the agreements relating to remuneration are set out below.
Anthony RivasCEO & Managing Director
Annual fixed remuneration
Performance bonus
Performance rights
Contract period
$692,360 inclusive of superannuation and non-monetary benefits for FY19.
$386,376 was the maximum STI opportunity in relation to FY19 (60% cash, 40% deferred payment in shares at the end of the contract period (deferred payment shares), provided the CEO remains employed by the Company at the end of the contract period).
3,000,000 at risk performance rights were granted during FY17, of which 2,000,000 were foregone during FY19. No performance rights granted in FY19.
3 years to 30 June 2022.
Kristine MayCFO & Company Secretary(resigned 30 June 2019)
Annual fixed remuneration
Performance cash bonus
Performance rights
$251,734 inclusive of superannuation and non-monetary benefits for FY19.
There is no STI opportunity in relation to FY19.
FY18 & FY17 performance rights have forfeited.
Anand AdusumilliChief Data Scientist
Annual fixed remuneration
Performance cash bonus
Performance rights
$347,628 inclusive of superannuation and non-monetary benefits for FY19.
$78,703 was the maximum STI opportunity in relation to FY19, actual was $59,027.
17,559 at risk performance rights were granted during FY18.
No performance rights granted in FY19.
Jonathon IdasChief Legal Officer
Annual fixed remuneration
Performance cash bonus
Performance rights
$344,541 inclusive of superannuation and non-monetary benefits for FY19.
$76,499 was the maximum STI opportunity in relation to FY19, actual was $61,200.
17,772 at risk performance rights were granted during FY18.
No performance rights granted in FY19.
Denica SaundersChief Operating Officer(appointed 1 July 2018)
Annual fixed remuneration
Performance cash bonus
Performance rights
$363,182 inclusive of superannuation and non-monetary benefits for FY19.
$62,963 was the maximum STI opportunity in relation to FY19, actual was $70,833.
No performance rights granted in FY19.
For
per
sona
l use
onl
y

27
Collection House Limited Annual Report 2019
Directors’ Report
Overview Corporate Governance Financial Report Additional Information
H Share-based compensationPerformance rightsPerformance rights have been granted to certain eligible employees under the Company’s Performance Rights Plan (PRP).
Performance rights granted under the PRP carry no dividend or voting rights. When exercisable, each performance right is convertible into one ordinary share of Collection House Limited.
Details of performance rights over ordinary shares in the Group provided as remuneration to members of the ELT are set out below.
Name
Number of performance rights granted/issued
during the year
Number of performance rights vested/issuable
during the year
2019 2018 2019 2018
Anthony Rivas – – – –
Kristine May (resigned 30 June 2019) – 62,286 – –
Anand Adusumilli – 17,599 – –
Jonathon Idas – 17,772 – –
Denica Saunders (appointed 1 July 2018) – – – –
The assessed fair value at grant date of performance rights compensation granted to members of the ELT has been calculated using the five day volume weighted average price (VWAP) of one ordinary share over the five days preceding the grant. The expense is recognised over the vesting period. The expense for each relevant financial year will require an assessment at each reporting date of the probability that each performance hurdle will be achieved.
I Equity instruments held by key management personnelPerformance rightsDetails of performance rights over ordinary shares in the Company provided as remuneration to each Director of Collection House Limited and other key management personnel of the Group, are set out below.
2019
Name
Balance at start of the
yearGranted as
compensation Vested Lapsed
Balance at end of the
yearVested and
issuable Un-vested
Anthony Rivas 3,000,000 – – (2,000,000) 1,000,000 1,000,000 –
Kristine May (resigned 30 June 2019) 121,673 – – (121,673) – – –
Anand Adusumilli 17,599 – – – 17,599 – 17,599
Jonathon Idas 17,722 – – – 17,722 – 17,722
Denica Saunders (appointed 1 July 2018) – – – – – – –
For
per
sona
l use
onl
y

28
Collection House Limited Annual Report 2019
Directors’ Report
Share holdingsThe number of shares in the Company held during the financial year by each Director of Collection House Limited and other key management personnel of the Group, including their personally related parties, are set out below.
2019
Non-Executive Directors Category
Balance at start of the year, or on
appointment
Other changes
during the year
Balance at the end of
the year
Leigh Berkley Ordinary Shares 3,700 67,500 71,200
Michael Knox Ordinary Shares – 60,000 60,000
Sandra Birkensleigh Ordinary Shares – – –
Catherine McDowell Ordinary Shares – – –
2019
Executive Director and other key management personnel Category
Balance at start of the
year
Other changes
during the year
Balance at the end of
the year
Anthony Rivas Ordinary Shares 3,690 3,000 6,690
Deferred payment shares 71,409 173,380 244,789
Kristine May (resigned 30 June 2019) Ordinary Shares – – –
Anand Adusumilli Ordinary Shares – – –
Jonathon Idas Ordinary Shares – – –
Denica Saunders (appointed 1 July 2018) Ordinary Shares – – –
J Additional informationLoans to Directors and ExecutivesThere were no loans to Directors or members of the ELT during FY19.
Shares under performance rightsLTIs are provided to certain eligible employees via the PRP. Total un-issued ordinary shares of the Group under performance rights at the date of this report are detailed below.
Performance rights
Date rights
effective
Number of rights
granted/to be issued
Issue price of shares
No of shares issued
2017
No of unvested
shares and vested but
not yet issued shares
under rights Expiry date
PRP 1/7/16 3,747,550 Nil Nil 1,141,738 30 September 2019
PRP 1/7/17 341,071 Nil Nil 261,775 30 September 2020
Additional information – Unaudited
Insurance of officersDuring the financial year the Group paid premiums in respect of Directors’ and Officers’ liability and legal expenses and insurance. This was for current and former Directors and Officers, including senior executives of the Group and Directors, Senior Executives and Secretaries of its controlled entities.
The liabilities insured are legal costs that may be incurred in defending civil or criminal proceedings that may be brought against the Directors or Officers in their capacity as Directors or Officers of entities in the Group, and any other payments arising from liabilities incurred by the Directors or Officers in connection with such proceedings. This does not include such liabilities that arise from conduct involving a wilful breach of duty by the Directors or Officers or the improper use by the Directors or Officers of their position or of information to gain advantage for themselves or someone else or to cause detriment to the Group.
For
per
sona
l use
onl
y

29
Collection House Limited Annual Report 2019
Directors’ Report
Overview Corporate Governance Financial Report Additional Information
Proceedings On 15 March 2019, the Group was provided with a copy of a claim and statement of claim, which had been filed in the Supreme Court of Queensland on the same date. The claim for damages is for $2,800,000 and proceedings are still being defended by the Group.
No proceedings have been brought or intervened in on behalf of the Group with leave of the Court under section 237 of the Corporations Act 2001.
Non-audit servicesDuring the year KPMG, the Group’s auditor, has performed certain other services in addition to the audit and review of financial statements.
The Board has considered the non-audit services provided during the year by the auditor, and the Audit and Risk Management Committee is satisfied that the provision of those non-audit services during the year by the auditor is compatible with, and did not compromise, the auditor independence requirements of the Corporations Act 2001 for the following reasons:
– all non-audit services were subject to the corporate governance procedures adopted by the Group and have been reviewed by the Audit and Risk Management Committee to ensure they do not impact the integrity and objectivity of the auditor
– the non-audit services provided do not undermine the general principles relating to auditor independence as set out in APES 110 Code of Ethics for Processional Accountants, as they did not involve reviewing or auditing the auditor’s own work, acting in a management or decision making capacity for the Group, acting as an advocate for the Group or jointly sharing risks and rewards.
Details of the amounts paid and payable to Group’s auditor, KPMG, are set out below.
Services other than audit and review of financial statements: 2019
Other regulatory audit services $
Trust account audits 66,700
Loan covenant compliance 3,100
Other services
Taxation compliance services 120,700
Accounting advice and due diligence services 196,690
387,190
Audit and review of financial statements 258,280
Total paid or payable to KPMG 645,470
Auditor’s independence declarationA copy of the auditor’s independence declaration as required under section 307C of the Corporations Act 2001 is set out on page 30.
Rounding of amountsThe Group is of a kind referred to in ASIC Corporations (Rounding in Financial/Directors’ Report) Instrument 2016/191, issued by the Australian Securities and Investments Commission, relating to the ‘rounding off’ of amounts in the Directors’ report. Amounts in the Directors’ report have been rounded off in accordance with that Corporations’ Instrument to the nearest thousand dollars, or in certain cases, to the nearest dollar.
This report is made in accordance with a resolution of Directors.
Collection House Limited
Leigh Berkley Chairman
30 August 2019
For
per
sona
l use
onl
y

30
Collection House Limited Annual Report 2019
Auditor’s Independence Declaration
30
KPMG, an Australian partnership and a member firm of the KPMG network of independent member firms affiliated with KPMG International Cooperative (“KPMG International”), a Swiss entity.
Liability limited by a scheme approved under Professional Standards Legislation.
Lead Auditor’s Independence Declaration under
Section 307C of the Corporations Act 2001
To the Directors of Collection House Limited
I declare that, to the best of my knowledge and belief, in relation to the audit of Collection House Limited for the financial year ended 30 June 2019 there have been:
i. no contraventions of the auditor independence requirements as set out in the CorporationsAct 2001 in relation to the audit; and
ii. no contraventions of any applicable code of professional conduct in relation to the audit.
KPMG Scott Guse Partner
Brisbane 30 August 2019
For
per
sona
l use
onl
y

31
for the year ended 30 June 2019
Overview Corporate Governance Financial Report Additional Information
Collection House Limited Annual Report 2019
Income Statement
Consolidated
Notes30 June 2019
$’00030 June 2018
$’000
Revenue 5 161,057 143,863
Revenue from continuing operations 161,057 143,863
Direct collection costs (25,968) (24,793)
Employee expenses (57,100) (52,115)
Depreciation and amortisation expense 6 (4,624) (4,820)
Operating lease rental expense 6 (8,189) (7,666)
Restructuring expenses (775) (1,082)
Other expenses (13,140) (10,015)
Finance costs 6 (7,658) (5,778)
Profit before income tax 43,603 37,594
Income tax expense 7 (12,913) (11,471)
Profit from continuing operations 30,690 26,123
Profit for the year attributable to equity holders of Collection House Limited 30,690 26,123
Cents Cents
Earnings per share for profit attributable to the equity holders of the Company:
Basic earnings per share 29 22.3 19.2
Diluted earnings per share 29 22.0 18.8
The above income statement should be read in conjunction with the accompanying notes.
For
per
sona
l use
onl
y

32
for the year ended 30 June 2019
Collection House Limited Annual Report 2019
Statement of Comprehensive Income
Consolidated
Notes30 June 2019
$’00030 June 2018
$’000
Profit for the year 30,690 26,123
Other comprehensive income, net of income tax
Items that may be reclassified subsequently to profit or loss
Exchange differences on translation of foreign operations 21(a) (642) (77)
Other comprehensive income for the year, net of income tax (642) (77)
Total comprehensive income for the year attributable to equity holders of Collection House Limited 30,048 26,046
The above statement of comprehensive income should be read in conjunction with the accompanying notes.
For
per
sona
l use
onl
y

33
as at 30 June 2019
Overview Corporate Governance Financial Report Additional Information
Collection House Limited Annual Report 2019
Balance Sheet
Consolidated
Notes30 June 2019
$’00030 June 2018
$’000
ASSETS
Current assets
Cash and cash equivalents 8 1,596 509
Receivables 9 12,871 20,382
Purchased debt ledgers 10 52,466 54,215
Other assets 11 167 42
Total current assets 67,100 75,148
Non-current assets
Purchased debt ledgers 10 357,837 259,192
Equity investments 12 8,500 –
Property, plant and equipment 13 2,710 2,084
Intangible assets 14 33,842 34,041
Receivables 9 558 498
Total non-current assets 403,447 295,815
Total assets 470,547 370,963
LIABILITIES
Current liabilities
Bank Overdraft 8 – 2,601
Payables 15 14,609 14,404
Borrowings 18 14,667 –
Current tax liabilities 3,782 2,714
Provisions 16 3,810 3,290
Other financial liabilities 17 1,937 2,660
Total current liabilities 38,805 25,669
Non-current liabilities
Borrowings 18 195,933 131,900
Deferred tax liabilities 19 1,505 616
Provisions 16 103 190
Other financial liabilities 17 5,053 6,011
Total non-current liabilities 202,594 138,717
Total liabilities 241,399 164,386
Net assets 229,148 206,577
EQUITY
Contributed equity 20 116,413 113,727
Reserves 21(a) 365 157
Retained profits 21(b) 112,370 92,693
Total equity 229,148 206,577
The above balance sheet should be read in conjunction with the accompanying notes.
For
per
sona
l use
onl
y
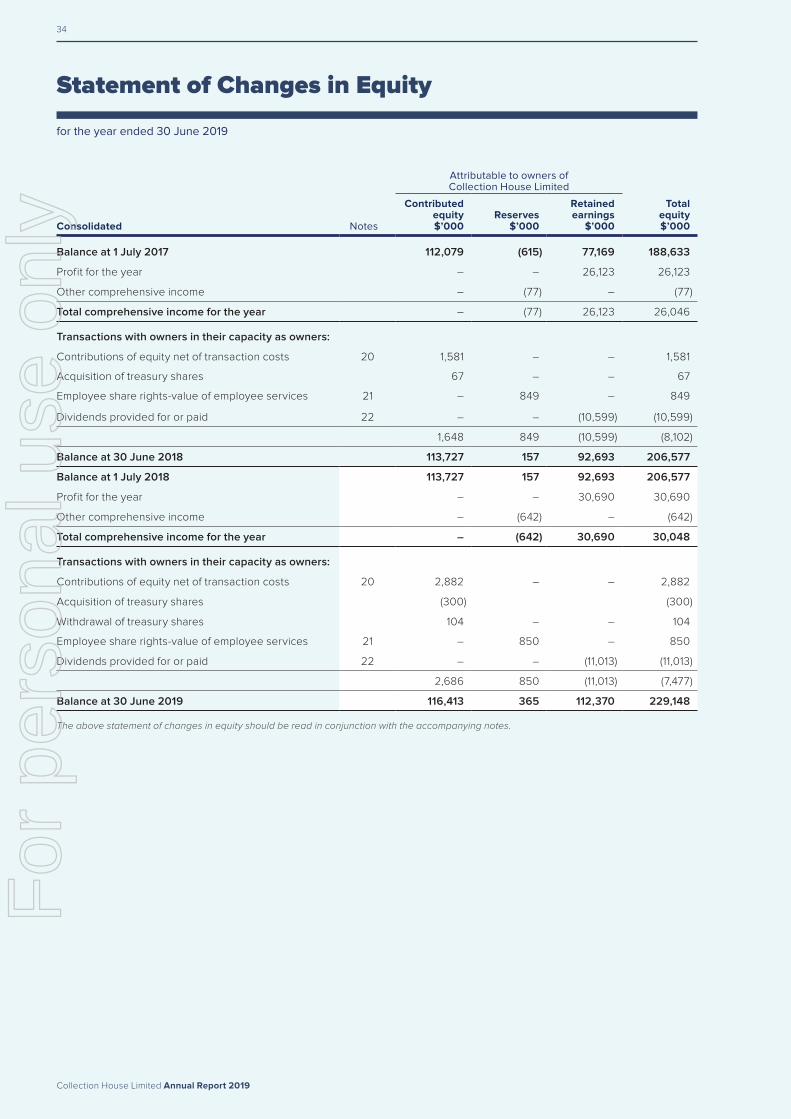
34
for the year ended 30 June 2019
Collection House Limited Annual Report 2019
Statement of Changes in Equity
Attributable to owners of Collection House Limited
Consolidated Notes
Contributed equity $’000
Reserves $’000
Retained earnings
$’000
Totalequity $’000
Balance at 1 July 2017 112,079 (615) 77,169 188,633
Profit for the year – – 26,123 26,123
Other comprehensive income – (77) – (77)
Total comprehensive income for the year – (77) 26,123 26,046
Transactions with owners in their capacity as owners:
Contributions of equity net of transaction costs 20 1,581 – – 1,581
Acquisition of treasury shares 67 – – 67
Employee share rights-value of employee services 21 – 849 – 849
Dividends provided for or paid 22 – – (10,599) (10,599)
1,648 849 (10,599) (8,102)
Balance at 30 June 2018 113,727 157 92,693 206,577
Balance at 1 July 2018 113,727 157 92,693 206,577
Profit for the year – – 30,690 30,690
Other comprehensive income – (642) – (642)
Total comprehensive income for the year – (642) 30,690 30,048
Transactions with owners in their capacity as owners:
Contributions of equity net of transaction costs 20 2,882 – – 2,882
Acquisition of treasury shares (300) (300)
Withdrawal of treasury shares 104 – – 104
Employee share rights-value of employee services 21 – 850 – 850
Dividends provided for or paid 22 – – (11,013) (11,013)
2,686 850 (11,013) (7,477)
Balance at 30 June 2019 116,413 365 112,370 229,148
The above statement of changes in equity should be read in conjunction with the accompanying notes.
For
per
sona
l use
onl
y

35
Collection House Limited Annual Report 2019
for the year ended 30 June 2019
Overview Corporate Governance Financial Report Additional Information
Statement of Cash Flows
Consolidated
Notes30 June 2019
$’00030 June 2018
$’000
Cash flows from operating activities
Receipts from customers and debtors (inclusive of goods and services tax) 213,402 191,304
Payments to suppliers and employees (inclusive of goods and services tax) (115,625) (95,663)
97,777 95,641
Income taxes paid (10,956) (9,778)
Net cash inflow (outflow) from operating activities 31 86,821 85,863
Cash flows from investing activities
Payments for property, plant and equipment (1,086) (431)
Payment for leasehold improvements (714) 5
Payments for purchased debt ledgers (132,633) (81,324)
Payment for equity instrument (8,500) –
Payments for intangible assets (2,901) (966)
Net cash (outflow) inflow from investing activities (145,834) (82,716)
Cash flows from financing activities
Proceeds from borrowings 78,702 8,700
Repayment of borrowings (837) (139)
Borrowing costs (1,591) (1,452)
Interest paid (5,618) (4,550)
Dividends paid to Company’s shareholders 22 (11,013) (10,599)
Proceeds from issues of shares and other equity securities 2,882 1,581
Purchase of treasury shares (300) –
Net cash (outflow) inflow from financing activities 62,225 (6,459)
Net increase (decrease) in cash and cash equivalents 3,212 (3,312)
Cash and cash equivalents at the beginning of the financial year (2,092) 1,151
Effects of exchange rate changes on cash and cash equivalents 476 69
Cash and cash equivalents at end of year 8 1,596 (2,092)
Cash at bank and on hand 1,596 509
Bank Overdraft – (2,601)
Cash and cash equivalent at end of year 1,596 (2,092)
The above statement of cash flows should be read in conjunction with the accompanying notes.
For
per
sona
l use
onl
y

36
Collection House Limited Annual Report 2019
Notes to the Financial Statements
1 Summary of significant accounting policiesThe principal accounting policies adopted in the preparation of these consolidated financial statements are set out below. These policies have been consistently applied to all the years presented, unless otherwise stated.
(a) Basis of preparationThese financial statements are for the consolidated entity consisting of Collection House Limited (the Company) and its subsidiaries (the Group). Collection House Limited is a public company incorporated and domiciled in Australia.
The financial statements were authorised for issue on 30 August 2019 by the Directors of the Company.
These general purpose financial statements have been prepared in accordance with Australian Accounting Standards and interpretations issued by the Australian Accounting Standards Board and the Corporations Act 2001. Collection House Limited is a for-profit entity for the purpose of preparing the financial statements.
(i) Compliance with IFRSThe consolidated financial statements of the Collection House Limited Group also comply with International Financial Reporting Standards (IFRS) as issued by the International Accounting Standards Board (IASB).
(ii) New and amended standards adopted by the GroupThe new standards and amendments to standards mandatory for the first time in the annual reporting period commencing 1 July 2018 do not impact amounts recognised in the current or prior period, and are not likely to affect future periods.
Refer to Note 1(z) for further details.
(iii) Historical cost conventionThese financial statements have been prepared under the historical cost convention, as modified by the revaluation of financial assets, financial assets and liabilities (including derivative instruments) at fair value through profit or loss, and certain classes of property, plant and equipment.
(iv) Critical accounting estimatesThe preparation of financial statements requires the use of certain critical accounting estimates. It also requires management to exercise its judgement in the process of applying the Group’s accounting policies. The areas involving a higher degree of judgement or complexity, or areas where assumptions and estimates are significant to the financial statements are disclosed in Note 3.
(b) Principles of consolidation
(i) SubsidiariesSubsidiaries are all entities over which the Group has control. The Group controls an entity when the Group is exposed to, or has rights to, variable returns from its involvement with the entity and has the ability to affect those returns through its power to direct the activities of the entity.
Subsidiaries are fully consolidated from the date on which control is transferred to the Group. They are de-consolidated from the date that control ceases.
The acquisition method of accounting is used to account for business combinations by the Group (refer to Note 1(z)).
Intercompany transactions, balances and unrealised gains on transactions between Group companies are eliminated. Unrealised losses are also eliminated unless the transaction provides evidence of the impairment of the asset transferred. Accounting policies of subsidiaries have been changed where necessary to ensure consistency with the policies adopted by the Group.
There are currently no non-controlling interests in the Group.
(c) Segment reportingOperating segments are reported in a manner consistent with the internal reporting provided to the chief operating decision maker. The chief operating decision maker, who is responsible for allocating resources and assessing performance of the operating segments, has been identified as the Managing Director.
(d) Foreign currency translation
(i) Functional and presentation currencyItems included in the financial statements of each of the Group’s entities are measured using the currency of the primary economic environment in which it operates (‘the functional currency’). The consolidated financial statements are presented in Australian dollars, which is Collection House Limited’s functional and presentation currency.
(ii) Transactions and balancesForeign currency transactions are translated into the functional currency using the exchange rates prevailing at the dates of the transactions. Foreign exchange gains and losses resulting from the settlement of such transactions and from the translation at year end exchange rates of monetary assets and liabilities denominated in foreign currencies are recognised in profit or loss, except when they are deferred in equity as qualifying cash flow hedges and qualifying net investment hedges or are attributable to part of the net investment in a foreign operation.
Non-monetary items that are measured at fair value in a foreign currency are translated using the exchange rates at the date when the fair value was determined. Translation differences on assets and liabilities carried at fair value are reported as part of the fair value gain or loss.
(iii) Group companiesThe results and financial position of foreign operations that have a functional currency different from the presentation currency are translated into the presentation currency as follows:
– assets and liabilities for each balance sheet presented are translated at the closing rate at the date of that balance sheet;
– income and expenses for each income statement and statement of comprehensive income are translated at average exchange rates (unless this is not a reasonable approximation of the cumulative effect of the rates prevailing on the transaction dates, in which case income and expenses are translated at the dates of the transactions), and
– all resulting exchange differences are recognised in other comprehensive income.
for the year ended 30 June 2019
For
per
sona
l use
onl
y
37
Collection House Limited Annual Report 2019
Notes to the Financial Statements
continued
Overview Corporate Governance Financial Report Additional Information
1 Summary of significant accounting policies (continued)
(d) Foreign currency translation (continued)On consolidation, exchange differences arising from the translation of any net investment in foreign entities, and of borrowings and other financial instruments designated as hedges of such investments, are recognised in other comprehensive income. When a foreign operation is sold or any borrowings forming part of the net investment are repaid, the associated exchange differences are reclassified to profit or loss, as part of the gain or loss on sale.
Goodwill and fair value adjustments arising on the acquisition of a foreign operation are treated as assets and liabilities of the foreign operation and translated at the closing rate.
(e) Revenue recognitionRevenue is measured at the fair value of the consideration received or receivable. Amounts disclosed as revenue are net of returns, trade allowances, rebates and amounts collected on behalf of third parties.
The Group recognises revenue when the amount of revenue can be reliably measured, it is probable that future economic benefits will flow to the Group and specific criteria have been met for each of the Group’s activities as described below.
Revenue is recognised for the major business activities as follows:
(i) Interest income – Purchased Debt Ledgers (PDL’s)Interest income is recognised using the application of the credit-adjusted effective interest rate (“EIR”) to the amortised cost of the PDLs under AASB 9 Financial Instruments. Interest is shown net of any adjustments to the carrying amount of PDLs as a result of changes in estimated cash flows. The EIR is the rate that discounts estimated future cash receipts of the PDLs to the net carrying amount (i.e. the price paid to acquire the asset).
(ii) Call option income – reflects the revenue the company earns by selling the right to purchase future collections of an eligible portfolio of PDLs to a third party.
Revenue is recognised for accounting purposes when a call option contract is signed, as from the date the third party receives a substantial portion of the cash flows and the Group has no future rights or entitlement to the collections on that portfolio.
(iii) Rendering of services – commission revenueRevenue from rendering services is recognised to the extent that the performance obligation has been met, revenue benefits is expected to flow to the Group and the revenue can be reliably measured.
(iv) Sale of non-current assetsThe net gain or loss on disposal of non-current assets is included as either income or an expense at the date control of the asset passes to the buyer, usually when an unconditional contract of sale is signed.
The gain or loss on disposal is calculated as the difference between the carrying amount of the asset at the time of disposal and the net proceeds on disposal.
(v) DividendsRevenue from dividends and distributions from controlled entities is recognised by the Parent Entity when they are declared by the controlled entities.
Revenue from dividends from other investments is recognised when received.
(f) Income taxThe income tax expense or revenue for the period is the tax payable on the current period’s taxable income based on the applicable income tax rate for each jurisdiction adjusted by changes in deferred tax assets and liabilities attributable to temporary differences and to unused tax losses.
The current income tax charge is calculated on the basis of the tax laws enacted or substantively enacted at the end of the reporting period in the countries where the Company’s subsidiaries and associates operate and generate taxable income. Management periodically evaluates positions taken in tax returns with respect to situations in which applicable tax regulation is subject to interpretation. It establishes provisions where appropriate on the basis of amounts expected to be paid to the tax authorities.
Deferred income tax is provided in full, using the liability method, on temporary differences arising between the tax bases of assets and liabilities and their carrying amounts in the consolidated financial statements. However, deferred tax liabilities are not recognised if they arise from the initial recognition of goodwill. Deferred income tax is also not accounted for if it arises from initial recognition of an asset or liability in a transaction other than a business combination that at the time of the transaction affects neither accounting nor taxable profit or loss. Deferred income tax is determined using tax rates (and laws) that have been enacted or substantially enacted by the end of the reporting period and are expected to apply when the related deferred income tax asset is realised or the deferred income tax liability is settled.
Deferred tax assets are recognised for deductible temporary differences and unused tax losses only if it is probable that future taxable amounts will be available to utilise those temporary differences and losses.
Deferred tax liabilities and assets are not recognised for temporary differences between the carrying amount and tax bases of investments in foreign operations where the company is able to control the timing of the reversal of the temporary differences and it is probable that the differences will not reverse in the foreseeable future.
Deferred tax assets and liabilities are offset when there is a legally enforceable right to offset current tax assets and liabilities and when the deferred tax balances relate to the same taxation authority. Current tax assets and tax liabilities are offset where the entity has a legally enforceable right to offset and intends either to settle on a net basis, or to realise the asset and settle the liability simultaneously.
Collection House Limited and its wholly-owned Australian controlled entities have implemented the tax consolidation legislation. As a consequence, these entities are taxed as a single entity and the deferred tax assets and liabilities of these entities are set off in the consolidated financial statements.
For
per
sona
l use
onl
y

38
Collection House Limited Annual Report 2019
Notes to the Financial Statements
continued
1 Summary of significant accounting policies (continued)
(f) Income tax (continued)Current and deferred tax is recognised in profit or loss, except to the extent that it relates to items recognised in other comprehensive income or directly in equity. In this case, the tax is also recognised in other comprehensive income or directly in equity, respectively.
(g) LeasesLeases of property, plant and equipment where the Group, as lessee, has substantially all the risks and rewards of ownership are classified as finance leases (Note 17). Finance leases are capitalised at the lease’s inception at the fair value of the leased property or, if lower, the present value of the minimum lease payments. The corresponding rental obligations, net of finance charges, are included in other current financial liabilities and other non-current financial liabilities. Each lease payment is allocated between the liability and finance costs. The finance cost is charged to the profit or loss over the lease period so as to produce a constant periodic rate of interest on the remaining balance of the liability for each period. The property, plant and equipment acquired under finance leases is depreciated over the asset’s useful life or over the shorter of the asset’s useful life and the lease term if there is no reasonable certainty that the Group will obtain ownership at the end of the lease term.
Leases in which a significant portion of the risks and rewards of ownership are not transferred to the Group as lessee are classified as operating leases (Note 25). Payments made under operating leases (net of any incentives received from the lessor) are charged to profit or loss on a straight-line basis over the period of the lease.
(h) Business combinationsThe acquisition method of accounting is used to account for all business combinations, regardless of whether equity instruments or other assets are acquired. The consideration transferred for the acquisition of a subsidiary comprises the fair values of the assets transferred, the liabilities incurred and the equity interests issued by the Group. The consideration transferred also includes the fair value of any asset or liability resulting from a contingent consideration arrangement and the fair value of any pre-existing equity interest in the subsidiary. Acquisition-related costs are expensed as incurred. Identifiable assets acquired and liabilities and contingent liabilities assumed in a business combination are measured initially at their fair values at the acquisition date.
The excess of the consideration transferred over the fair value of the Group’s share of the net identifiable assets acquired is recorded as goodwill. If this amount is less than the fair value of the net identifiable assets of the subsidiary acquired and the measurement of all amounts has been reviewed, the difference is recognised directly in profit or loss as a bargain purchase.
Where settlement of any part of cash consideration is deferred, the amounts payable in the future are discounted to their present value as at the date of exchange. The discount rate used is the entity’s incremental borrowing rate, being the rate at which a similar borrowing could be obtained from an independent financier under comparable terms and conditions.
(i) Impairment of assetsGoodwill is not subject to amortisation and is tested annually for impairment, or more frequently if events or changes in circumstances indicate that it might be impaired. Other assets are reviewed for impairment whenever events or changes in circumstances indicate that the carrying amount may not be recoverable. An impairment loss is recognised for the amount by which the asset’s carrying amount exceeds its recoverable amount. The recoverable amount is the higher of an asset’s fair value less costs to sell and value-in-use (refer to Note 14). For the purposes of assessing impairment, assets are grouped at the lowest levels for which there are separately identifiable cash inflows which are largely independent of the cash inflows from other assets or groups of assets (cash-generating units).
( j) Cash and cash equivalentsFor the purpose of presentation in the cash flow statement, cash and cash equivalents includes cash on hand, deposits held at call with financial institutions, other short-term, highly liquid investments with original maturities of three months or less that are readily convertible to known amounts of cash and which are subject to an insignificant risk of changes in value, and where applicable bank overdrafts. Where applicable, bank overdrafts are shown within borrowings in current liabilities in the consolidated balance sheet.
(k) Trade receivablesTrade receivables are recognised initially at fair value and subsequently carried at amortised cost using the effective interest method.
Recognition and derecognitionRegular way purchases and sales of financial assets are recognised on trade-date i.e. the date on which the Group commits to purchase or sell the asset. Financial assets are derecognised when the rights to receive cash flows from the financial assets have expired or have been transferred and the Group has transferred substantially all the risks and rewards of ownership.
(l) Other financial assets
ClassificationThe Group classifies financial assets as subsequently measured at either amortised cost or fair value on the basis of both the Group’s business model for managing the financial assets and the contractual cash flow characteristics of the financial asset.
The classification depends on the purpose for which the financial assets were acquired. Management determines the classification of its financial assets at initial recognition and re-evaluates this designation at each reporting date.
(i) Financial assets subsequently measured at amortised cost - PDLs
ClassificationPDLs have been included in this category of financial assets as the Group’s business model for managing the PDLs and the characteristics of the contractual cash flows of the financial asset are consistent with this measurement approach.
PDLs are included as non-current assets, except for the amount of the ledger that is expected to be realised within 12 months of the balance sheet date, which is classified as a current asset.
For
per
sona
l use
onl
y

39
Collection House Limited Annual Report 2019
Notes to the Financial Statements
continued
Overview Corporate Governance Financial Report Additional Information
1 Summary of significant accounting policies (continued)
(l) Other financial assets (continued)
Subsequent MeasurementPDLs are initially recognised at cost, as cost reflects fair value plus any incidental costs of acquisition and thereafter measured at amortised cost using the credit-adjusted effective interest method, less any impairment losses.
ImpairmentThe carrying amount of the PDLs is continuously reviewed to ensure that the carrying amount is not impaired. Due to the characteristics of the Group’s investment in PDLs, they are considered as purchased or originated credit impaired (“POCI”) assets under AASB 9. Where the carrying amount exceeds the present value of the estimated future cash flows discounted at the asset’s original Effective Interest Rate (“EIR”), the Group recognises an impairment loss. Favourable changes in lifetime expected credit lossess are recognised as an impairment gain, even if the favourable change is more than the amount previously recognised in profit or loss.
(ii) Equity investmentsAt the initial recognition, the Group will measure a financial asset at fair value with the transaction costs that are directly attributable to the acquisition. The Group will make the designation whether the investments meet fair value through other comprehensive income (FVOCI) criteria based on the strategic purpose to hold the equity investment for long term rather than short term trading.
After subsequent recognition, any gains or losses on these instruments are recognised in other comprehensive income and not the profit and loss.
(m) Fair value estimation of financial assets and liabilitiesThe fair value of financial assets and financial liabilities must be estimated for recognition and measurement or for disclosure purposes.
The fair value of financial instruments that are not traded in an active market is determined using valuation techniques. The Group uses estimated discounted cash flows to determine fair value.
(n) Property, plant and equipmentAll items of property, plant and equipment are initially recorded at cost at the date of acquisition, being the fair value of the consideration provided plus incidental costs directly attributable to the acquisition. Subsequent costs are included in the assets carrying amount, or recognised as a separate asset as appropriate, only when it is probable that future economic benefits associated with the item will flow to the Group, and the cost of the item can be measured reliably.
Where settlement of any part of cash consideration is deferred, the amounts payable are recorded at their present value, discounted at the rate applicable to the Company if similar borrowings were obtained from an independent financier under comparable terms and conditions.
The costs of assets constructed or internally generated by the Group, other than goodwill, include the cost of materials and direct labour. Directly attributable overheads and other incidental costs are also capitalised to the asset. Borrowing costs are capitalised to qualifying assets as set out in Note 1(r).
Expenditure, including that on internally generated assets, is only recognised as an asset when the Group controls future economic benefits as a result of the costs incurred, it is probable that those future economic benefits will eventuate, and the costs can be measured reliably. Costs attributable to feasibility and alternative approach assessments are expensed as incurred.
All assets are depreciated using the straight-line method over their estimated useful lives taking into account estimated residual values, with the exception of leased assets, which are depreciated over the shorter of the lease term and their useful lives.
Assets are depreciated or amortised from the date of acquisition or, in respect of internally constructed assets, from the time an asset is completed and held ready for use.
The estimated useful lives of property, plant and equipment for current and comparative periods are as follows:
– Plant and equipment 4-12 years
– Computer equipment 3-5 years
– Leased plant and equipment Term of Lease
The assets’ residual values and useful lives are reviewed, and adjusted if appropriate, at the end of each reporting period. When changes are made, adjustments are reflected prospectively in current and future periods only.
An asset’s carrying amount is written down immediately to its recoverable amount if the asset’s carrying amount is greater than its estimated recoverable amount (Note 1(i)).
Gains and losses on disposals are determined by comparing proceeds with carrying amount. These are included in profit or loss.
(o) Intangible assets
(i) GoodwillGoodwill is measured as described in Note 1(h). Goodwill on acquisitions of subsidiaries is included in intangible assets. Goodwill is not amortised but it is tested for impairment annually, or more frequently if events or changes in circumstances indicate that it might be impaired, and is carried at cost less accumulated impairment losses. Gains and losses on the disposal of an entity include the carrying amount of goodwill relating to the entity sold.
Goodwill is allocated to cash-generating units for the purpose of impairment testing. The allocation is made to those cash-generating units or groups of cash-generating units that are expected to benefit from the business combination in which the goodwill arose, identified according to operating segments (Note 4).
For
per
sona
l use
onl
y

40
Collection House Limited Annual Report 2019
Notes to the Financial Statements
continued
1 Summary of significant accounting policies (continued)
(o) Intangible assets (continued)
(ii) IT development and softwareCosts incurred in developing products or systems and costs incurred in acquiring software and licenses that will contribute to future period financial benefits through revenue generation and/or cost reduction are capitalised to software and systems. Costs capitalised include external direct costs of materials and service and direct payroll and payroll related costs of employees’ time spent on the project. Amortisation commences from the point at which the asset is ready for use, and is calculated on a straight-line basis over periods generally ranging from 2 to 10 years. Useful lives are reviewed at each reporting date and adjusted if appropriate.
IT development costs include only those costs directly attributable to the development phase and are only recognised following completion of technical feasibility and where the Group has an intention and ability to use the asset.
(iii) Customer contractsThe customer contracts were acquired as part of a business combination. They are recognised at their fair value at the date of acquisition and are subsequently amortised on a straight-line basis over periods ranging from 2 to 10 years.
(iv) Other intangible assetsLicences and intellectual property are considered to have a definite useful life and are carried at cost less accumulated amortisation. All costs associated with the maintenance and protection of these assets are expensed in the period consumed.
(p) Trade and other payablesThese amounts represent liabilities for goods and services provided to the Group prior to the end of financial year which are unpaid. The amounts are unsecured and are usually paid within 30 days of recognition. Trade and other payables are presented as current liabilities unless payment is not due within 12 months from the reporting date.
(q) BorrowingsAll borrowings are recognised at their principal amounts subject to set off arrangements which represent the present value of future cash flows associated with servicing the debt. Where interest is payable in arrears the interest expense is accrued over the period it becomes due and it is recorded at the contracted rate as part of “Other payables”.
Where interest is paid in advance, the interest expense is recorded as a part of “Prepayments” and released over the period to maturity.
Borrowings are removed from the consolidated balance sheet when the obligation specified in the contract is discharged, cancelled or expired. The difference between the carrying amount of a financial liability that has been extinguished or transferred to another party and the consideration paid, including any non-cash assets transferred or liabilities assumed, is recognised in profit or loss as other income or finance costs.
Borrowings are classified as current liabilities unless the Group has an unconditional right to defer settlement of the liability for at least 12 months after the reporting period.
(r) Borrowing costsBorrowing costs incurred for the construction of any qualifying asset are capitalised during the period of time that is required to complete and prepare the asset for its intended use or sale. Other borrowing costs are expensed.
Borrowing costs include interest, amortisation of discounts or premiums relating to borrowings, amortisation of ancillary costs incurred in connection with arrangement of borrowings, foreign exchange losses net of any hedged amounts on borrowings, including trade creditors and lease finance charges.
Ancillary costs incurred in connection with the arrangement of borrowings are capitalised and amortised over the life of the borrowings.
(s) Provisions
(i) Make goodThe Group is required to restore the leased premises for a number of its premises to their original condition at the end of the respective lease terms. A provision has been recognised for the estimated expenditure required to remove any leasehold improvements. These costs have been capitalised as part of the cost of leasehold improvements and are amortised over the shorter of the term of the lease or the useful life of the assets.
(ii) Legal provisionsProvisions for legal claims are recognised when the Group has a present legal or constructive obligation as a result of past events, it is probable that an outflow of resources will be required to settle the obligation and the amount has been reliably estimated. Provisions are not recognised for future operating losses.
Where there are a number of similar obligations, the likelihood that an outflow will be required in settlement is determined by considering the class of obligations as a whole. A provision is recognised even if the likelihood of an outflow with respect to any one item included in the same class of obligations may be small.
(iii) Recognition and measurementProvisions are measured at the present value of management’s best estimate of the expenditure required to settle the present obligation at the end of each reporting period. The discount rate used to determine the present value is a pre-tax rate that reflects current market assessments of the time value of money and the risks specific to the liability. The increase in the provision due to the passage of time is recognised as interest expense.
(t) Employee benefits
(i) Short-term obligationsLiabilities for wages and salaries, including non-monetary benefits and annual leave expected to be settled within 12 months after the end of the period in which the employees render the related service are recognised in respect of employees’ services up to the end of the reporting period and are measured at the amounts expected to be paid when the liabilities are settled. The liability for annual leave is recognised in the provision for employee benefits. All other short-term employee benefit obligations are presented as payables.
For
per
sona
l use
onl
y

41
Collection House Limited Annual Report 2019
Notes to the Financial Statements
continued
Overview Corporate Governance Financial Report Additional Information
1 Summary of significant accounting policies (continued)
(t) Employee benefits (continued)
(ii) Long-term employee benefit obligationsThe liability for long service leave and annual leave which is not expected to be settled within 12 months after the end of the period in which the employees render the related service is recognised in the provision for employee benefits and measured as the present value of expected future payments to be made in respect of services provided by employees up to the end of the reporting period. Consideration is given to expected future wage and salary levels, experience of employee departures and periods of service. Expected future payments are discounted using market yields at the end of the reporting period on national government bonds with terms to maturity and currency that match, as closely as possible, the estimated future cash outflows.
The obligations are presented as current liabilities in the consolidated balance sheet if the entity does not have an unconditional right to defer settlement for at least twelve months after the reporting date, regardless of when the actual settlement is expected to occur.
(iii) Superannuation PlansThe Company and other controlled entities make statutory contributions to several superannuation funds in accordance with the directions of its employees. Contributions are expensed in the period to which they relate.
(iv) Share-based paymentsShare-based compensation benefits are provided to the Chief Executive Officer via the employment agreement between the Company and the Chief Executive Officer.
Share-based compensation benefits are provided to employees other than the Chief Executive Officer via the Collection House Limited Performance Rights Plan. Further details are set out in Note 30.
The fair value of the performance rights granted under the PRP was independently determined. The fair value at grant date has been calculated using the five day volume weighted average price (VWAP). The expense is recognised over the vesting period. The expense for each relevant financial year will require an assessment at each reporting date of the probability that each performance hurdle will be achieved. This probability factor will then be multiplied by the total number of rights apportioned to each performance hurdle to determine the number used in calculating the charge to profit and loss. Further details are set out in Note 30.
(v) Termination benefitsTermination benefits are payable when employment is terminated before the normal retirement date, or when an employee accepts voluntary redundancy in exchange for these benefits. The Group recognises termination benefits when it is demonstrably committed to either terminating the employment of current employees according to a detailed formal plan without possibility of withdrawal or to providing termination benefits as a result of an offer made to encourage voluntary redundancy. Benefits falling due more than 12 months after the end of the reporting period are discounted to present value.
(u) Contributed equityOrdinary shares are classified as equity.
Incremental costs directly attributable to the issue of new shares are shown in equity as a deduction, net of tax, from the proceeds.
Where any Group entity purchases the Company’s equity instruments, for example as the result of a share buy-back or a share-based payment plan, the consideration paid, including any directly attributable incremental costs (net of income taxes) is deducted from equity attributable to the equity holders of Collection House Limited as treasury shares until the shares are cancelled or reissued. Where such ordinary shares are subsequently reissued, any consideration received, net of any directly attributable incremental transaction costs and the related income tax effects, is included in equity attributable to the equity holders of Collection House Limited.
(v) DividendsProvision is made for the amount of any dividend declared, being appropriately authorised and no longer at the discretion of the entity, on or before the end of the reporting period but not distributed at the end of the reporting period.
(w) Earnings per share
(i) Basic earnings per shareBasic earnings per share is calculated by dividing:
– the profit attributable to owners of the Company, excluding any costs of servicing equity other than ordinary shares
– by the weighted average number of ordinary shares outstanding during the financial year, adjusted for bonus elements in ordinary shares issued during the year and excluding treasury shares (Note 29).
(ii) Diluted earnings per shareDiluted earnings per share adjusts the figures used in the determination of basic earnings per share to take into account:
– the after income tax effect of interest and other financing costs associated with dilutive potential ordinary shares, and
– the weighted average number of additional ordinary shares that would have been outstanding assuming the conversion of all dilutive potential ordinary shares.
(x) Goods and Services Tax (GST)Revenues, expenses and assets are recognised net of the amount of associated GST, unless the GST incurred is not recoverable from the taxation authority. In this case it is recognised as part of the cost of acquisition of the asset or as part of the expense.
Receivables and payables are stated inclusive of the amount of GST receivable or payable. The net amount of GST recoverable from, or payable to, the taxation authority is included with other receivables or payables in the consolidated balance sheet.
Cash flows are presented on a gross basis. The GST components of cash flows arising from investing or financing activities which are recoverable from, or payable to the taxation authority, are presented as operating cash flows.
For
per
sona
l use
onl
y

42
Collection House Limited Annual Report 2019
Notes to the Financial Statements
continued
1 Summary of significant accounting policies (continued)
(y) Rounding of amountsThe Company is of a kind referred to in ASIC Corporations Instrument 2016/191, issued by the Australian Securities and Investments Commission, relating to the ‘rounding off’ of amounts in the financial statements. Amounts in the financial statements have been rounded off in accordance with that Corporations Instrument to the nearest thousand dollars, or in certain cases, the nearest dollar.
(z) New accounting standards and interpretationsThe Group’s assessment of the impact of new standards and interpretations is set out below.
AASB 9 Financial InstrumentsAASB 9 Financial Instruments (“AASB 9”) addresses the classification, measurement and derecognition of financial assets and liabilities, introduces new rules for hedge accounting and a new impairment model for financial assets. This standard replaces AASB 139 Financial Instruments: Recognition and Measurement.
The details of new significant accounting policies and the nature and effect of the changes to previous accounting policies are set out below.
Classification and measurement of financial assets and financial liabilities The Group adopted the classification of financial asset requirements of the standard by early adopting AASB 9 Financial Instruments (December 2010) (“AASB 9 (2010)”) and associated amending standards. Therefore the adoption of AASB 9 has not had an impact on the Group’s accounting policies relating to the classification and measurement of financial assets and financial liabilities.
Impairment of financial assetsAASB 9 replaces the ‘incurred loss’ model in AASB 139 with an ‘expected credit loss’ (“ECL”) model. The new impairment model applies to financial assets classified at amortised cost, debt instruments measured at fair value through other comprehensive income (“FVOCI”), contract assets under AASB 15 Revenue from Contracts with Customers, lease receivables, loan commitments and certain financial guarantee contracts.
ECLs are a probability-weighted estimate of credit losses. Credit losses are measured as the present value of all cash shortfalls (i.e. the difference between the cash flows due to the entity in accordance with the contract and the cash flows that the Group expects to receive).
The Group measures the loss allowance for a financial instrument at an amount equal to the lifetime ECL if the credit risk on that financial instrument has increased significantly since initial recognition, or if the financial instrument is a purchased or originated credit impaired (“POCI”) asset. If the credit risk on a financial instrument has not increased significantly since initial recognition (except for a POCI asset), the Group measures the loss allowance for that financial instrument at an amount equal to a 12 month ECL. When determining whether the credit risk of a financial asset has increased significantly since initial recognition and when estimating ECLs, the Group considers reasonable and supportable information that is relevant and available.
This includes both quantitative and qualitative information and analysis, based on the Group’s historical experience and informed credit assessment and including forward-looking information. The maximum period considered when estimating ECLs is the maximum contractual period over which the Group is exposed to credit risk.
Impairment of financial assets: Purchase Debt Ledgers (“PDLs”)Due to the characteristics of the Group’s investment in PDLs, they are considered POCI assets under AASB 9. The Group measures ECLs for PDLs at an amount equal to lifetime expected credit losses and are incorporated into the calculation of the Effective Interest Rate (“EIR”). Where the carrying amount exceeds the present value of the estimated future cash flows discounted at the asset’s original EIR, the Group recognises an impairment loss. Favourable changes in lifetime expected credit losses are recognised as an impairment gain, even if the favourable changes are more than the amount previously recognised in profit or loss as an impairment loss. The estimation of ECL’s includes an assessment of forward-looking economic assumptions which are determined on a probability-weighted basis based on reasonable and supportable forecasts.
For the assessment of forward-looking assumptions, the Group considers a number of indicators which impact the recoverability of PDLs and degradation of forecast expected cash flows.
The estimation and application of this forward-looking information requires significant judgment and is subject to appropriate internal governance and scrutiny. The Group leverages its existing cash flow models to inform these ECLs.
Upward impairments (write-ups) are increases to carrying values, discounted at the credit-adjusted EIR rate, of the acquired debt portfolios as a result of reassessments to their estimated future cash flows and are recognised in the line item impairment gains on portfolio investments at amortised cost. Any subsequent reversals to write-up are also recorded as impairment loss on portfolio investments.
Impairment of financial assets: Other financial assetsThe Group applies the simplified approach for measuring the loss allowance at an amount equal to lifetime ECL for trade receivables, contract assets and lease receivables.
The Group has applied the low credit risk exemption to cash and cash equivalents and the simplified approach to trade and other receivables. Neither of these approaches has resulted in a significant impact for the carrying value or these items, and no transition adjustment has been made to opening retained earnings.
Transitional impact on implementation of AASB 9The implementation of AASB 9 resulted in the following financial assets and liabilities being reclassified or remeasured:
– The impairment allowance for PDLs was remeasured due to the adoption of the ECL model. There was no material variance between the carrying value of the portfolio and present value of the estimated future cash flows discounted at the credit-adjusted EIR. As such, no adjustments were recorded upon transition.
– Interest income is recognised using the effective interest rate method applying a credit-adjusted EIR under AASB 9.
For
per
sona
l use
onl
y

43
Collection House Limited Annual Report 2019
Notes to the Financial Statements
continued
Overview Corporate Governance Financial Report Additional Information
1 Summary of significant accounting policies (continued)(z) New accounting standards and interpretations (continued)
AASB 15 Revenue from Contracts with CustomersAASB 15 Revenue from Contracts with Customers (“AASB 15”) became effective for the reporting period beginning on 1 July 2018. AASB 15 establishes a comprehensive framework for determining whether, and how much and when revenue is recognised. It replaced AASB 118 Revenue, AASB 111 Construction Contracts and related interpretations.
The Group has adopted AASB 15 using the cumulative effect method (without practical expedients), with the effect of initially applying this standard recognised at the date of initial application (i.e. 1 July 2018). Accordingly, comparative information has not been restated. Based on the Group’s assessment of revenue streams, there is no impact on the Group’s financial statements and no transition adjustment has been made to opening retained earnings.
Below is a summary of the major services provided and the Group’s accounting policy on recognition as a result of adopting AASB 15. Under AASB 15, revenue is recognised when a customer obtains control of the goods or services. Determining the timing of the transfer of control – at a point in time or over time – requires judgement.
Category RecognitionNature and timing of satisfaction of Performance Obligations
Revenue Recognition under AASB 15
Impact of AASB 15
Rendering of services: Commission Revenue
Over time The Group receives commissions for the provision of debt collection services. Commission structures are based on contract terms and include;
– Percentage based on the value of collections;
– Fees for collection activities;
– Fees for full time equivalents (FTE); and
– Fees for other collection related services.
The Group is also entitled to receive performance incentives, bonuses and rebates for various contracts.
Where activities are performed by third parties, and are on-charged to the customer at cost or with a margin, the Group recognises revenue for these services as the Principal.
Under AASB 15, income is recognised over time with the relevant measure of progress being the collections output at the end of each period.
Re-estimation of variable consideration is completed at each reporting date.
AASB 15 did not have a significant impact on the Group’s accounting policies.
New accounting standards issued but not yet effective(i) AASB 16 Leases (applicable to annual reporting periods commencing on or after 1 January 2019)
AASB 16 will result in the majority of leases being recognised on balance sheet, as the distinction between operating and finance leases is removed. Under the new standard, a lessee initially recognises and measures a right-of-use asset representing its right to use the underlying asset, and a lease liability representing its obligation to make lease payments on a present value basis taking into consideration the contractual lease period and likely periods subject to optional extension. Subsequently, a leasee measures a right-of-use asset similarly to other non-financial assets and lease liabilities similarly to other financial liabilities. The only exceptions are short-term and low-value leases.
The Group has undergone an assessment of the impact on its consolidated financial statements. The Group will recognise right-of-use assets and lease liabilities for the operating lease agreements in place for its office premises. Based on the Group’s calculations to date, the value of the lease liability on date of transition is expected to be $40,168,890. In addition, the nature of expenses related to those leases will now change, as AASB 16 replaces the straight-line operating lease expense with a depreciation charge for right-of-use assets and interest expense on lease liabilities.
The Group plans to apply AASB 16 initially on 1 July 2019, using a modified retrospective approach. Therefore, the cumulative effect of adopting AASB 16 will be recognised as an adjustment to the opening balance of retained earnings at 1 July 2019, with no restatement of comparative information. When applying a modified retrospective approach to leases previously classified as operating leases under AASB 117, the lessee can elect, on a lease-by-lease basis, whether to apply a number of practical expedients on transition. The Group is assessing the potential impact of using these practical expedients.
(ii) AASB 3 Business Combinations (applicable to annual reporting periods commencing on or after 1 January 2020)
The Group has elected to adopt the recent amendment to AASB3, which provides an alternative regime to simplify the assessment of whether a transaction should be accounted for as a business combination or an asset acquisition. The recent amendment enables the acquirer to apply a concentration test, which evaluates whether the majority of the fair value of assets acquired is concentrated into a single identifiable asset or group of assets. If this test is satisfied, the acquirer can elect to treat the entire transaction as an asset acquisition and avoid the accounting and disclosure obligations applicable to a business acquisition.
No restatement to comparatives required as this will only impact transactions in the current financial year.
For
per
sona
l use
onl
y

44
Collection House Limited Annual Report 2019
Notes to the Financial Statements
continued
1 Summary of significant accounting policies (continued)
(aa) Parent entity financial informationThe financial information for the parent entity, Collection House Limited, disclosed in Note 27 has been prepared on the same basis as the consolidated financial statements, except as set out below.
(i) Investments in subsidiaries, associates and joint venture entities
Investments in subsidiaries, associates and joint venture entities are accounted for at cost in the financial statements of Collection House Limited. Dividends received from associates are recognised in the parent entity’s profit or loss, rather than being deducted from the carrying amount of these investments.
(ii) Tax consolidation legislationCollection House Limited and its wholly-owned Australian controlled entities have implemented the tax consolidation legislation.
The head entity, Collection House Limited, and the controlled entities in the tax consolidated group account for their own current and deferred tax amounts. These tax amounts are measured as if each entity in the tax consolidated group continues to be a stand alone taxpayer in its own right.
In addition to its own current and deferred tax amounts, Collection House Limited also recognises the current tax liabilities (or assets) and the deferred tax assets arising from unused tax losses and unused tax credits assumed from controlled entities in the tax consolidated group.
The entities have also entered into a tax funding agreement under which the wholly-owned entities fully compensate Collection House Limited for any current tax payable assumed and are compensated by Collection House Limited for any current tax receivable and deferred tax assets relating to unused tax losses or unused tax credits that are transferred to Collection House Limited under the tax consolidation legislation. The funding amounts are determined by reference to the amounts recognised in the wholly-owned entities’ financial statements.
The amounts receivable/payable under the tax funding agreement are due upon receipt of the funding advice from the head entity, which is issued as soon as practicable after the end of each financial year. The head entity may also require payment of interim funding amounts to assist with its obligations to pay tax instalments.
Assets or liabilities arising under tax funding agreements with the tax consolidated entities are recognised as current amounts receivable from or payable to other entities in the group.
Any difference between the amounts assumed and amounts receivable or payable under the tax funding agreement are recognised as a contribution to (or distribution from) wholly-owned tax consolidated entities.
2 Financial risk managementThe Group’s financial assets and liabilities consist mainly of PDLs, deposits with banks, trade and other receivables, payables and borrowings.
The Group’s activities expose it to a variety of financial risks: market risk (including currency risk and interest rate risk), credit risk and liquidity risk. The Group’s overall risk management program focuses on the unpredictability of financial markets and seeks to minimise potential adverse effects on the financial performance of the Group. The Group uses different methods to measure different types of risk to which it is exposed. These methods include sensitivity analysis in the case of interest rate and foreign exchange risks, and aging analysis for credit risk.
Risk management is carried out by the Finance Team under policies approved by the Audit and Risk Management Committee of the Board. Under the authority of the Board of Directors the Audit and Risk Management Committee ensures that the total risk exposure of the Group is consistent with the Business Strategy and within the risk tolerance of the Group. Regular risk reports are tabled before the Audit and Risk Management Committee.
Within this framework, the Finance Team identifies, evaluates and manages financial risks in close co-operation with the Group’s operating units.
(a) Market riskMarket risk is the risk that changes in market prices such as foreign exchange rates and interest rates will affect the Group’s income.
(i) Foreign exchange riskThe Group operates internationally and is exposed to foreign exchange risk arising from various currency exposures, primarily with respect to the New Zealand (NZ) Dollar and the Philippine Peso. Fluctuations in either of these currencies may impact the Group’s results.
Foreign exchange risk arises from future commercial transactions and recognised assets and liabilities denominated in a currency that is not the entity’s functional currency.
SensitivityAt 30 June 2019, had the Australian Dollar weakened/strengthened by 10% against the NZ Dollar or the Philippine Peso with all other variables held constant, the impact for the year would have been immaterial to both profit for the year and equity.
(ii) Cash flow and fair value interest rate riskAs the Group has no significant interest bearing assets, the Group’s income and operating cash flows are not materially exposed to changes in market interest rates.
The Group’s main interest rate risk arises from long-term borrowings. Borrowings issued at variable rates expose the Group to cash flow interest rate risk. During 2019 and 2018, the Group borrowings at variable rates were denominated in Australian Dollars only.
Group finance facilities are a combination of overdraft and short-term commercial bill facilities, all of which are on a variable interest rate basis. In the current interest rate environment, this approach maximises available cash with minimal exposure to interest rate movements. All aspects of the financing arrangements, including interest rate structuring can be reviewed as required during the life of the facility.
For
per
sona
l use
onl
y
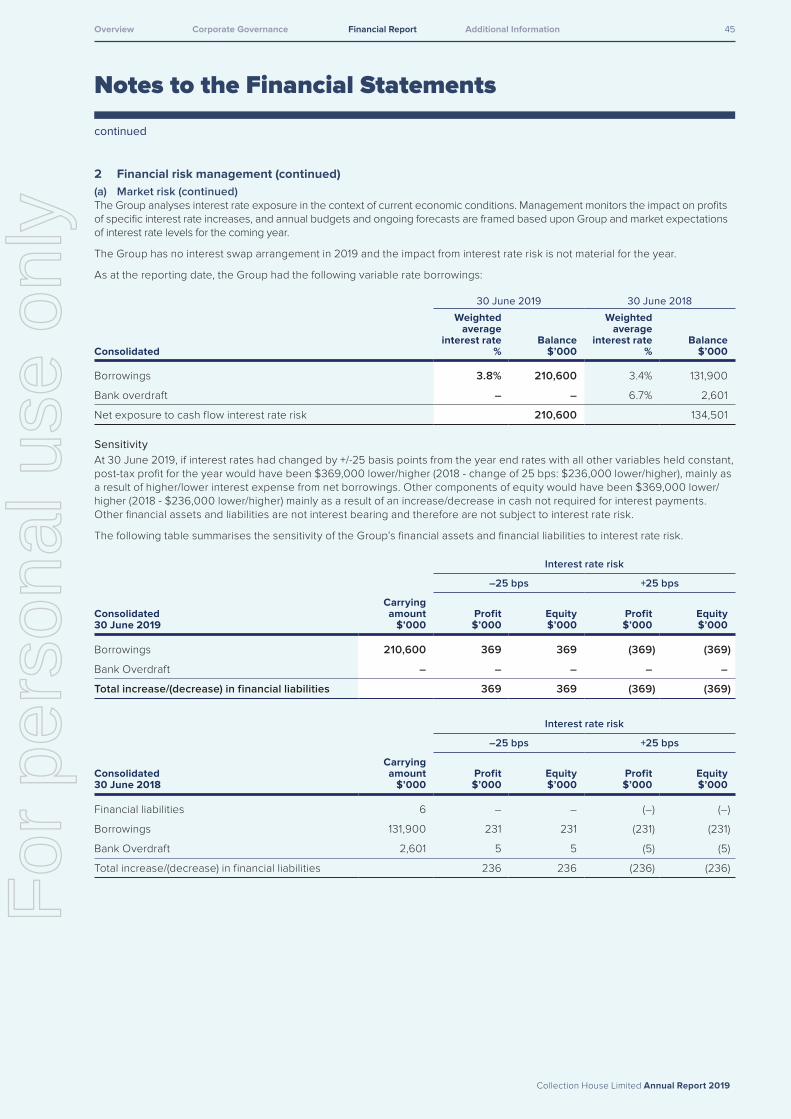
45
Collection House Limited Annual Report 2019
Notes to the Financial Statements
continued
Overview Corporate Governance Financial Report Additional Information
2 Financial risk management (continued)(a) Market risk (continued)The Group analyses interest rate exposure in the context of current economic conditions. Management monitors the impact on profits of specific interest rate increases, and annual budgets and ongoing forecasts are framed based upon Group and market expectations of interest rate levels for the coming year.
The Group has no interest swap arrangement in 2019 and the impact from interest rate risk is not material for the year.
As at the reporting date, the Group had the following variable rate borrowings:
Consolidated
30 June 2019 30 June 2018
Weighted average
interest rate %
Balance $’000
Weighted average
interest rate %
Balance $’000
Borrowings 3.8% 210,600 3.4% 131,900
Bank overdraft – – 6.7% 2,601
Net exposure to cash flow interest rate risk 210,600 134,501
SensitivityAt 30 June 2019, if interest rates had changed by +/-25 basis points from the year end rates with all other variables held constant, post-tax profit for the year would have been $369,000 lower/higher (2018 - change of 25 bps: $236,000 lower/higher), mainly as a result of higher/lower interest expense from net borrowings. Other components of equity would have been $369,000 lower/higher (2018 - $236,000 lower/higher) mainly as a result of an increase/decrease in cash not required for interest payments. Other financial assets and liabilities are not interest bearing and therefore are not subject to interest rate risk.
The following table summarises the sensitivity of the Group’s financial assets and financial liabilities to interest rate risk.
Interest rate risk
–25 bps +25 bps
Consolidated 30 June 2019
Carrying amount
$’000Profit$’000
Equity$’000
Profit$’000
Equity$’000
Borrowings 210,600 369 369 (369) (369)
Bank Overdraft – – – – –
Total increase/(decrease) in financial liabilities 369 369 (369) (369)
Interest rate risk
–25 bps +25 bps
Consolidated 30 June 2018
Carrying amount
$’000Profit$’000
Equity$’000
Profit$’000
Equity$’000
Financial liabilities 6 – – (–) (–)
Borrowings 131,900 231 231 (231) (231)
Bank Overdraft 2,601 5 5 (5) (5)
Total increase/(decrease) in financial liabilities 236 236 (236) (236)
For
per
sona
l use
onl
y
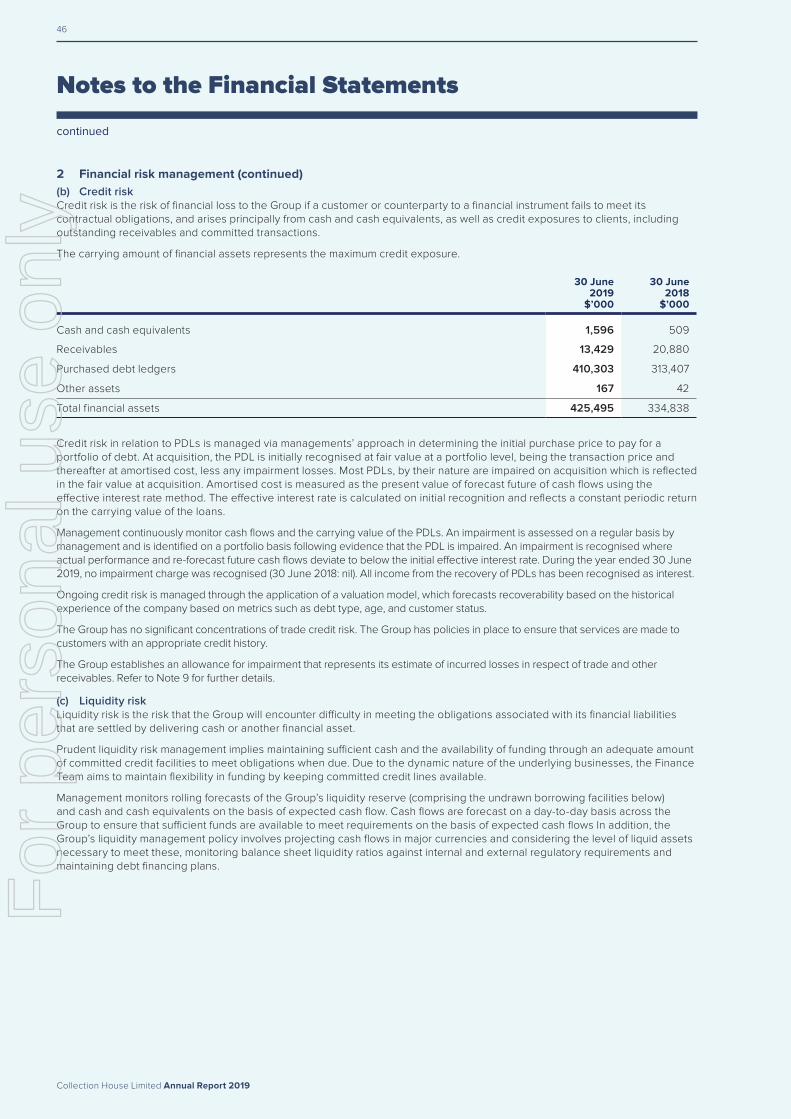
46
Collection House Limited Annual Report 2019
Notes to the Financial Statements
continued
2 Financial risk management (continued)(b) Credit riskCredit risk is the risk of financial loss to the Group if a customer or counterparty to a financial instrument fails to meet its contractual obligations, and arises principally from cash and cash equivalents, as well as credit exposures to clients, including outstanding receivables and committed transactions.
The carrying amount of financial assets represents the maximum credit exposure.
30 June 2019
$’000
30 June 2018
$’000
Cash and cash equivalents 1,596 509
Receivables 13,429 20,880
Purchased debt ledgers 410,303 313,407
Other assets 167 42
Total financial assets 425,495 334,838
Credit risk in relation to PDLs is managed via managements’ approach in determining the initial purchase price to pay for a portfolio of debt. At acquisition, the PDL is initially recognised at fair value at a portfolio level, being the transaction price and thereafter at amortised cost, less any impairment losses. Most PDLs, by their nature are impaired on acquisition which is reflected in the fair value at acquisition. Amortised cost is measured as the present value of forecast future of cash flows using the effective interest rate method. The effective interest rate is calculated on initial recognition and reflects a constant periodic return on the carrying value of the loans.
Management continuously monitor cash flows and the carrying value of the PDLs. An impairment is assessed on a regular basis by management and is identified on a portfolio basis following evidence that the PDL is impaired. An impairment is recognised where actual performance and re-forecast future cash flows deviate to below the initial effective interest rate. During the year ended 30 June 2019, no impairment charge was recognised (30 June 2018: nil). All income from the recovery of PDLs has been recognised as interest.
Ongoing credit risk is managed through the application of a valuation model, which forecasts recoverability based on the historical experience of the company based on metrics such as debt type, age, and customer status.
The Group has no significant concentrations of trade credit risk. The Group has policies in place to ensure that services are made to customers with an appropriate credit history.
The Group establishes an allowance for impairment that represents its estimate of incurred losses in respect of trade and other receivables. Refer to Note 9 for further details.
(c) Liquidity riskLiquidity risk is the risk that the Group will encounter difficulty in meeting the obligations associated with its financial liabilities that are settled by delivering cash or another financial asset.
Prudent liquidity risk management implies maintaining sufficient cash and the availability of funding through an adequate amount of committed credit facilities to meet obligations when due. Due to the dynamic nature of the underlying businesses, the Finance Team aims to maintain flexibility in funding by keeping committed credit lines available.
Management monitors rolling forecasts of the Group’s liquidity reserve (comprising the undrawn borrowing facilities below) and cash and cash equivalents on the basis of expected cash flow. Cash flows are forecast on a day-to-day basis across the Group to ensure that sufficient funds are available to meet requirements on the basis of expected cash flows In addition, the Group’s liquidity management policy involves projecting cash flows in major currencies and considering the level of liquid assets necessary to meet these, monitoring balance sheet liquidity ratios against internal and external regulatory requirements and maintaining debt financing plans.
For
per
sona
l use
onl
y

47
Collection House Limited Annual Report 2019
Notes to the Financial Statements
continued
Overview Corporate Governance Financial Report Additional Information
2 Financial risk management (continued)(c) Liquidity risk (continued)
Financing arrangements The Group had access to the following undrawn borrowing facilities at the end of the reporting period:
Consolidated
30 June 2019
$’000
30 June 2018
$’000
Term debt facility 14,400 43,100
Group set off 12,500 10,408
The group set off can be drawn upon at any time and the term debt option can be drawn upon within 2 days. The group set off is repayable on demand, and the term debt is repayable at the end of the term.
The facility was subject to meeting a number of financial undertakings. The undertakings are reviewed by the Audit and Risk Management Committee quarterly, and are reported on to the finance provider bi-annually. All companies within the Group are required to notify the finance provider of any event of default as soon as it becomes aware of them.
In addition to the above the Group is required to keep the finance provider fully informed of relevant details of the Group as they arise.
Further details of the banking facility are set out in Note 18.
Maturities of financial liabilitiesThe table below analyses the Group’s financial liabilities into relevant maturity groupings based on the remaining period at the reporting date to the contractual maturity date. The amounts disclosed in the table are the contractual undiscounted cash flows. Balances due within 12 months equal their carrying balances, as the impact of discounting is not significant.
Contractual maturities of financial liabilitiesAt 30 June 2019
Less than 6 months
$’000
6 – 12 months
$’000
Between 1 and 2 years
$’000
Between 2 and 5 years
$’000Over 5 years
$’000
Total contractualcash flows
$’000
Non-derivatives
Non-interest bearing 14,609 – – – – 14,609
Fixed rate – – – – – –
Variable rate – 14,667 12,567 183,366 – 210,600
Total non-derivatives 14,609 – 14,667 195,933 – 225,209
At 30 June 2018
Less than 6 months
$’000
6 – 12 months
$’000
Between 1 and 2 years
$’000
Between 2 and 5 years
$’000
Over 5 years
$’000
Total contractualcash flows
$’000
Non-derivatives
Non-interest bearing 14,404 – – – – 14,404
Fixed rate 2,601 – – – – 2,601
Variable rate – – 6 131,900 – 131,906
Total non-derivatives 17,005 – 6 131,900 – 148,911For
per
sona
l use
onl
y

48
Collection House Limited Annual Report 2019
Notes to the Financial Statements
continued
3 Critical accounting estimates and judgements Estimates and judgements are continually evaluated and are based on historical experience and other factors, including expectations of future events that may have a financial impact on the Group and that are believed to be reasonable under the circumstances.
(a) Critical accounting estimates and assumptionsThe Group makes estimates and assumptions concerning the future. The resulting accounting estimates will, by definition, seldom equal the related actual results. The estimates and assumptions that have a significant risk of causing a material adjustment to the carrying amounts of assets and liabilities within the next financial year are discussed below.
(i) Estimated impairment of goodwillAnnually the Group tests whether goodwill has suffered any impairment, in accordance with the accounting policy stated in Note 1(x). The recoverable amounts of cash-generating units have been determined based on value-in-use calculations. These calculations require the use of assumptions. Refer to Note 14 for details of these assumptions and the potential impact of changes to the assumptions.
(ii) PDLsPDLs are considered as purchased or originated credit impaired (“POCI”) assets and are initially recognised at fair value plus any directly attributable acquisition costs. Subsequent to initial recognition, PDLs are measured at amortised cost using the credit-adjusted effective interest method, less/plus any impairment losses/gains. Management continue to monitor the performance and key estimates used in determining whether any objective evidence exists that a PDL may be impaired. This includes:
– re-forecasting expected future cash flows every six months. An impairment is recognised where actual performance and re-forecast future cash flows deviate to below the initial effective interest rate. Refer to Note 10 for further details.
– assessment of the credit-adjusted effective interest rate, which is the implicit interest rate based on forecast collections determined in the period of acquisition of an individual PDL and equates to the Internal Rate of Return (IRR) of the forecast cash flows without any consideration of collection costs.
(iii) Estimated impairment of non-financial assets and intangible assets other than goodwill
Annually the Group tests whether the non-financial assets or intangible assets of the Group (other than goodwill) have suffered any impairment, in accordance with the accounting policy stated in Note 1(i). The recoverable amounts of cash-generating units have been determined based on value-in-use calculations. These calculations require the use of assumptions.
(iv) Performance rightsThe Group determines the amount to be posted to the share based payments reserve based on management’s best estimate of employees meeting their performance hurdles. The value of performance rights could change if the number of employees that meet their performance hurdles differs significantly from managements estimate.
(b) Critical judgements in applying the entity’s accounting policies
(i) Employee benefitsManagement judgment is applied in determining the key assumptions used in the calculation of long service leave at balance date, including future increases in wages and salaries, future on-cost rates, discount rates, and experience of employee departures and period of service.
(ii) Useful lives of property, plant and equipment, and intangible assets other than goodwill
The Group’s management determines the estimated useful lives and related depreciation and amortisation charges for property, plant and equipment at the time of acquisition. As described in Note 1(n) useful lives are reviewed regularly throughout the year for appropriateness.
For
per
sona
l use
onl
y

49
Collection House Limited Annual Report 2019
Notes to the Financial Statements
continued
Overview Corporate Governance Financial Report Additional Information
4 Segment information(a) Description of segmentsIndividual business segments are identified on the basis of grouping individual products or services subject to similar risks and returns. The business segments reported are: Collection Services and Purchased Debt Ledgers. The Group has identified its operating segments based on the internal reports that are reviewed and used by the Chief Executive Officer in assessing performance and determining the allocation of resources.
The consolidated entity is organised on a global basis into the following divisions by product and service type.
Collection ServicesThe earning of commissions on the collection of debts for clients.
Purchased Debt LedgersThe collection of debts from client ledgers acquired by the Group.
All other segmentsAll other segments includes unallocated revenue and expenses, intersegment eliminations, interest, borrowings, and income tax expenses.
(b) Segment information provided to the Board
2019
Collection services
$’000
Purchased debt ledgers
$’000
All other segments
$’000Consolidated
$’000
Segment revenue
Sales to external customers 67,085 140 – 67,225
Intersegment sales 519 191 (207) 503
Total sales revenue 67,604 331 (207) 67,728
Interest and other income – 93,329 – 93,329
Total segment revenue 67,604 93,660 (207) 161,057
Segment result
Segment result 9,264 52,090 (10,093) 51,261
Interest expense and borrowing costs (7,658) (7,658)
Profit before income tax 43,603
Income tax expense (12,913)
Profit for the year 30,690
Segment assets and liabilities
Segment assets 56,423 416,862 (2,738) 470,547
Segment liabilities 30,598 207,722 (919) 241,399
Other segment information
Acquisitions of property, plant and equipment, intangibles and other non-current segment assets 4,627 139,033 – 143,660
Total acquisitions 143,660
Depreciation and amortisation expense 2,229 1,624 771 4,624
Total depreciation and amortisation 4,624
Other non-cash expenses 241 80 1,346 1,667For
per
sona
l use
onl
y

50
Collection House Limited Annual Report 2019
Notes to the Financial Statements
continued
4 Segment information (continued)(b) Segment information provided to the Board (continued)
2018
Collection services
$’000
Purchased debt ledgers
$’000
All other segments
$’000Consolidated
$’000
Segment revenue
Sales to external customers 68,652 106 – 68,758
Intersegment sales 386 – (177) 209
Total sales revenue 69,038 106 (177) 68,967
Interest and other income – 74,896 – 74,896
Total segment revenue 69,038 75,002 (177) 143,863
Segment result
Segment result 12,564 36,695 (5,887) 43,372
Interest expense and borrowing costs (5,778) (5,778)
Profit before income tax 37,594
Income tax expense (11,471) (11,471)
Profit for the year 26,123
Segment assets and liabilities
Segment assets 49,835 321,618 (490) 370,963
Segment liabilities 28,468 136,543 (625) 164,386
Other segment information
Acquisitions of property, plant and equipment, intangibles and other non-current segment assets 1,208 83,047 – 84,255
Total acquisitions 84,255
Depreciation and amortisation expense 3,162 1,383 275 4,820
Total depreciation and amortisation 4,820
Other non-cash expenses 451 51,920 1,071 53,442
(c) Geographical informationThe consolidated entity operates in two main geographical areas, Australia and New Zealand.
Segment revenues from sales to external customers Segment assets
Acquisitions of property, plant and equipment, intangibles
and other non-current segment assets
30 June2019
$’000
30 June2018
$’000
30 June2019
$’000
30 June2018
$’000
30 June2019
$’000
30 June2018
$’000
Australia 148,913 138,484 447,845 358,964 116,058 81,796
New Zealand 11,595 5,037 20,208 9,822 26,688 2,459
Philippines 549 209 2,494 2,177 914 –
161,057 143,730 470,547 370,963 143,660 84,255
Segment revenues are allocated based on the country in which the customer is located. Segment assets and capital expenditure are allocated based on where the assets are located.
For
per
sona
l use
onl
y

51
Collection House Limited Annual Report 2019
Notes to the Financial Statements
continued
Overview Corporate Governance Financial Report Additional Information
4 Segment information (continued)(c) Geographical information (continued)
(i) Accounting policiesSegment information is prepared in conformity with the accounting policies of the entity as disclosed in Note 1 (c) and AASB 8 Operating Segments.
Segment revenues, expenses, assets and liabilities are those that are directly attributable to a segment and the relevant portion that can be allocated to the segment on a reasonable basis. Segment assets include all assets used by a segment and consist primarily of operating cash, receivables, property, plant and equipment and goodwill and other intangible assets, net of related provisions. While most of these assets can be directly attributable to individual segments, the carrying amounts of certain assets used jointly by segments are allocated based on reasonable estimates of usage. Segment liabilities consist primarily of trade and other payables, employee benefits and interest bearing liabilities. Segment assets and liabilities do not include income taxes.
Unallocated items mainly comprise interest or dividend-earning assets and revenue, interest bearing loans, borrowing costs and corporate assets and expenses.
Segment capital expenditure is the total cost incurred during the period to acquire segment assets that are expected to be used for more than one period.
(ii) Segment margins
Collection services
Purchased debt ledgers
30 June 2019
%
30 June 2018
%
30 June 2019
%
30 June 2018
%
Margin on segment revenue 14 18 56 49
(d) Other segment informationFees for services provided between segments are carried out at arm’s length and are eliminated on consolidation. The revenue from external parties reported to the chief operating decision maker is consistent with that in the income statement.
5 Revenue
Consolidated
30 June2019
$’000
30 June2018
$’000
Interest income 75,419 58,935
Commission 67,232 68,637
Gain on sale of PDLs 14,500 10,119
Call option income 3,409 5,645
Other revenue 497 527
Revenue from continuing operations 161,057 143,863
For
per
sona
l use
onl
y
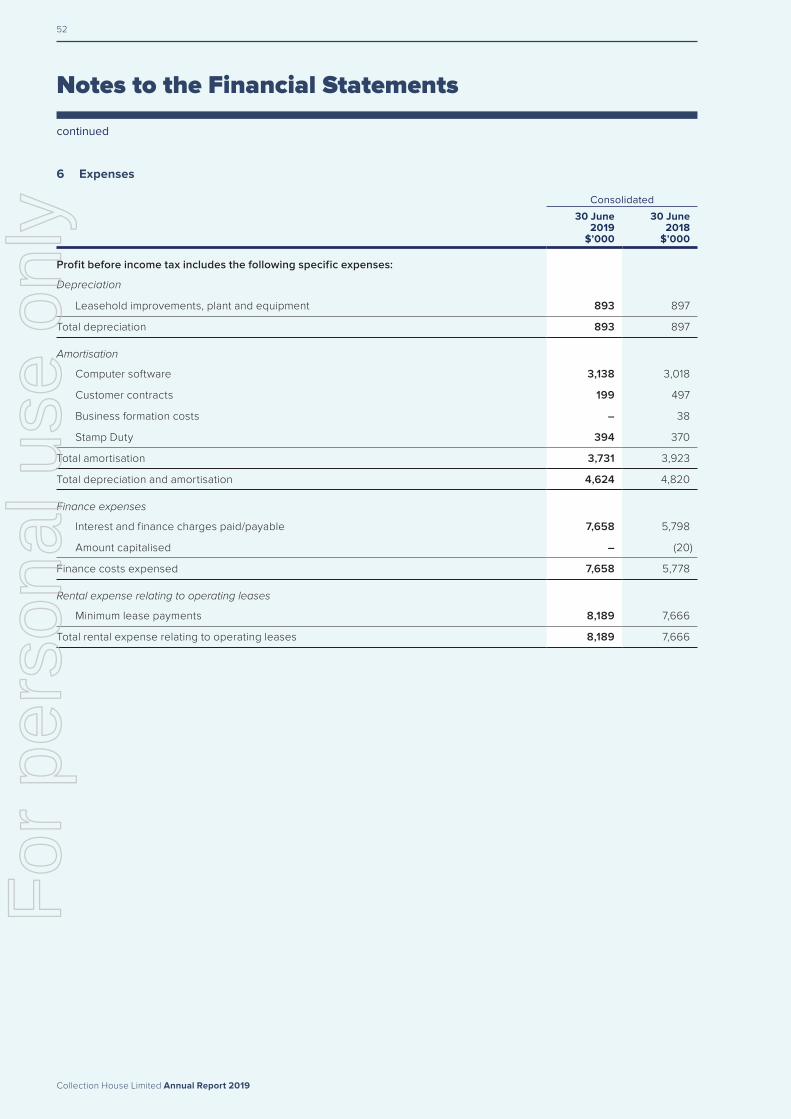
52
Collection House Limited Annual Report 2019
Notes to the Financial Statements
continued
6 Expenses
Consolidated
30 June2019
$’000
30 June2018
$’000
Profit before income tax includes the following specific expenses:
Depreciation
Leasehold improvements, plant and equipment 893 897
Total depreciation 893 897
Amortisation
Computer software 3,138 3,018
Customer contracts 199 497
Business formation costs – 38
Stamp Duty 394 370
Total amortisation 3,731 3,923
Total depreciation and amortisation 4,624 4,820
Finance expenses
Interest and finance charges paid/payable 7,658 5,798
Amount capitalised – (20)
Finance costs expensed 7,658 5,778
Rental expense relating to operating leases
Minimum lease payments 8,189 7,666
Total rental expense relating to operating leases 8,189 7,666
For
per
sona
l use
onl
y

53
Collection House Limited Annual Report 2019
Notes to the Financial Statements
continued
Overview Corporate Governance Financial Report Additional Information
7 Income tax expense
Consolidated
30 June2019
$’000
30 June2018
$’000
(a) Income tax expense
Income tax expense – Profit from continuing operations 12,913 11,471
Income tax expense is attributable to:
Current tax 11,999 11,815
Deferred tax 1,034 (523)
Under (over) provided in previous years (120) 179
Aggregate income tax expense 12,913 11,471
Deferred income tax (revenue) expense included in income tax expense comprises:
Decrease (increase) in deferred tax assets (Note 19) (456) (277)
(Decrease) increase in deferred tax liabilities (Note 19) 1,490 (246)
1,034 (523)
(b) Numerical reconciliation of income tax expense to prima facie tax payable
Profit from continuing operations before income tax expense 43,603 37,594
Tax at the Australian tax rate of 30% (2018 – 30%) 13,080 11,278
Tax effect of amounts which are not deductible (taxable) in calculating taxable income:
Non-deductible expenses 21 228
Effect of tax rates in foreign jurisdictions 7 (10)
Tax exempt (income)/loss (51)
13,108 11,445
Adjustments for current tax of prior periods (195) 26
(195) 11,471
Income tax expense 12,913 11,471
8 Cash and cash equivalents(a) Reconciliation of cash at the end of the yearThe above figures are reconciled to cash at the end of the financial year as shown in the statement of cash flows as follows:
Consolidated
30 June2019
$’000
30 June2018
$’000
Bank Overdraft – (2,601)
Cash at bank and on hand 1,596 509
Balances per statement of cash flows 1,596 (2,092)
(b) Bank overdraft right of set-offWith effect from 1 July 2004, the Company holds a contractual right of set-off between the current overdraft balance and the cash at bank balances.
For
per
sona
l use
onl
y

54
Collection House Limited Annual Report 2019
Notes to the Financial Statements
continued
9 Trade and other receivables
Consolidated
30 June2019
$’000
30 June2018
$’000
Current
Net trade receivables
Trade receivables 6,434 12,253
Provision for impairment of receivables (a) (146) (163)
6,288 12,090
Accrued revenue 3,039 4,752
Other assets 938 869
Prepaid expenses 2,606 2,671
12,871 20,382
Non-current
Prepaid expenses 558 498
13,429 20,880
(a) Impaired trade receivablesAs at 30 June 2019 current trade receivables of the Group with a value of $359,000 (2018: $241,000) were assessed as potentially impaired. The amount of the provision was $146,000 (2018: $163,000). The individually impaired receivables mainly relate to debtors which have been outstanding for more than 90 days. It has been assessed that a portion of these receivables are expected to be recovered.
The ageing of these receivables is as follows:
Consolidated
30 June2019
$’000
30 June2018
$’000
Over 3 months 359 241
359 241
Movements in the provision for impairment of receivables are as follows:
Consolidated
30 June2019
$’000
30 June2018
$’000
At 1 July 163 81
Provision for impairment recognised during the year 318 449
Receivables written off during the year as uncollectible (42) (95)
Unused amount reversed (293) (272)
146 163
The creation and release of the provision for impaired receivables has been included in ‘other expenses’ in the income statement. Amounts charged to the allowance account are generally written off when there is no expectation of recovering additional cash.
The other classes within trade and other receivables do not contain impaired assets and are not past due. Based on the credit history of these other classes, it is expected that these amounts will be received when due. The Group does not hold any collateral in relation to these receivables.
For
per
sona
l use
onl
y
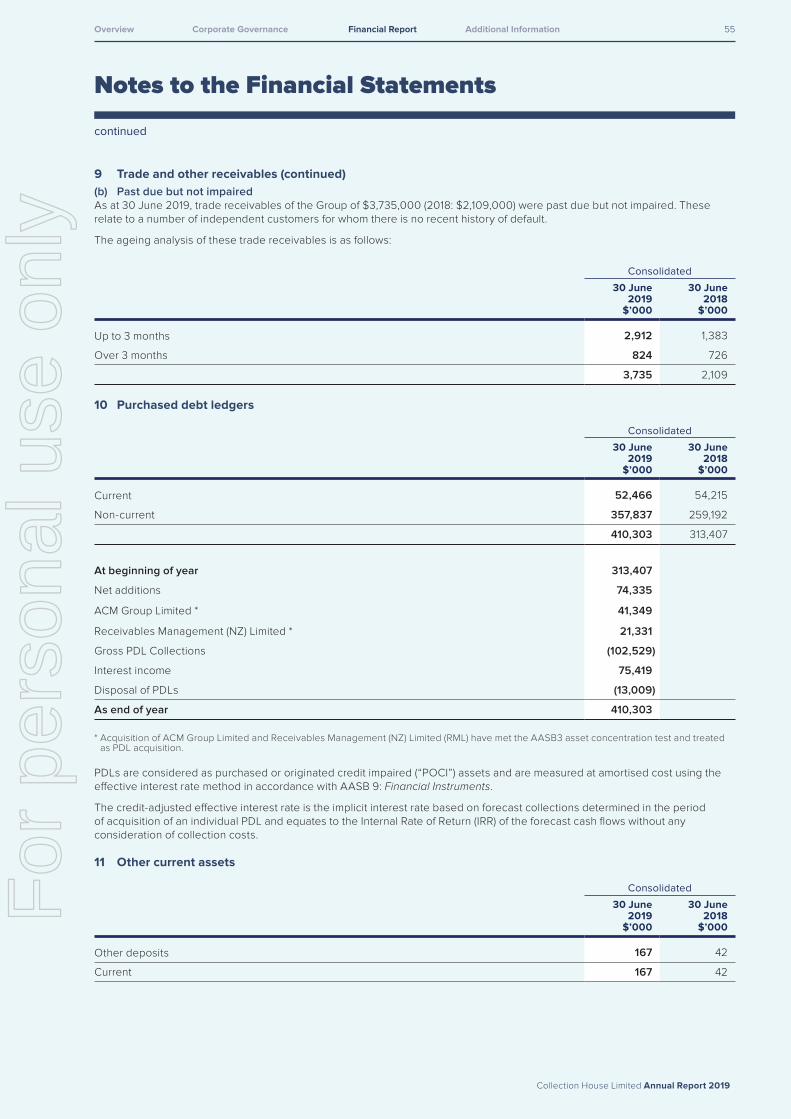
55
Collection House Limited Annual Report 2019
Notes to the Financial Statements
continued
Overview Corporate Governance Financial Report Additional Information
9 Trade and other receivables (continued)(b) Past due but not impairedAs at 30 June 2019, trade receivables of the Group of $3,735,000 (2018: $2,109,000) were past due but not impaired. These relate to a number of independent customers for whom there is no recent history of default.
The ageing analysis of these trade receivables is as follows:
Consolidated
30 June2019
$’000
30 June2018
$’000
Up to 3 months 2,912 1,383
Over 3 months 824 726
3,735 2,109
10 Purchased debt ledgers
Consolidated
30 June2019
$’000
30 June2018
$’000
Current 52,466 54,215
Non-current 357,837 259,192
410,303 313,407
At beginning of year 313,407
Net additions 74,335
ACM Group Limited * 41,349
Receivables Management (NZ) Limited * 21,331
Gross PDL Collections (102,529)
Interest income 75,419
Disposal of PDLs (13,009)
As end of year 410,303
* Acquisition of ACM Group Limited and Receivables Management (NZ) Limited (RML) have met the AASB3 asset concentration test and treated as PDL acquisition.
PDLs are considered as purchased or originated credit impaired (“POCI”) assets and are measured at amortised cost using the effective interest rate method in accordance with AASB 9: Financial Instruments.
The credit-adjusted effective interest rate is the implicit interest rate based on forecast collections determined in the period of acquisition of an individual PDL and equates to the Internal Rate of Return (IRR) of the forecast cash flows without any consideration of collection costs.
11 Other current assets
Consolidated
30 June2019
$’000
30 June2018
$’000
Other deposits 167 42
Current 167 42
For
per
sona
l use
onl
y
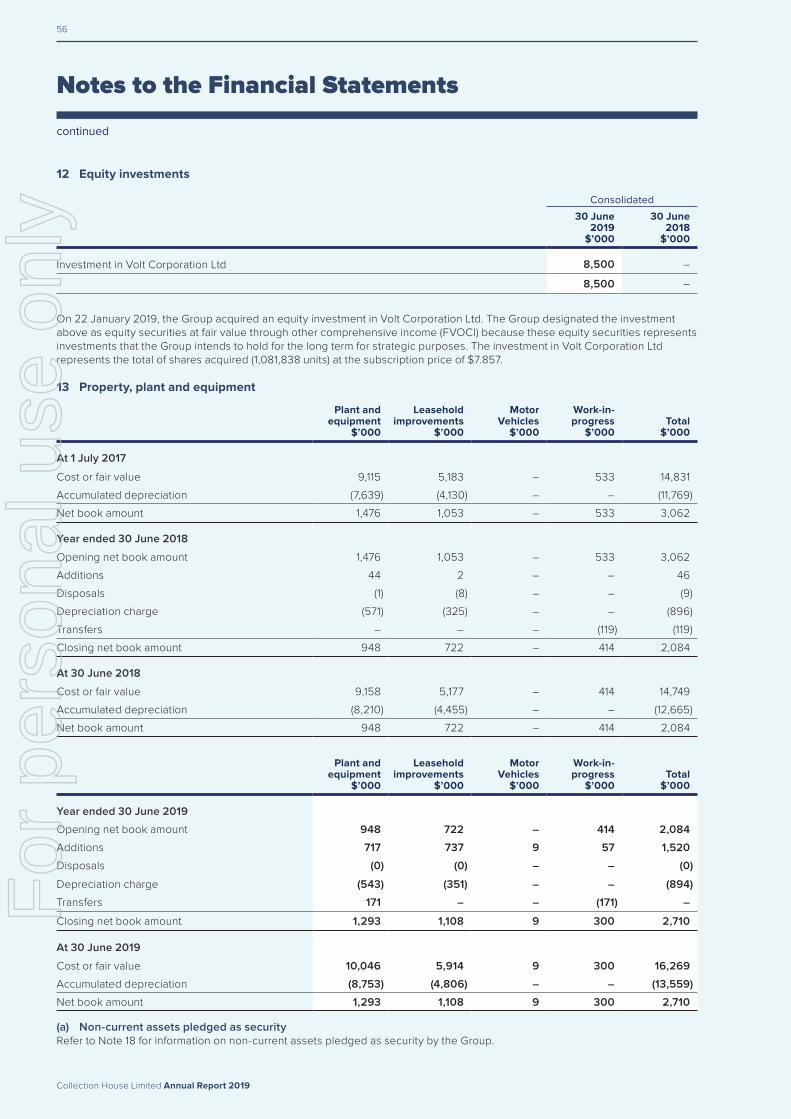
56
Collection House Limited Annual Report 2019
Notes to the Financial Statements
continued
12 Equity investments
Consolidated
30 June2019
$’000
30 June2018
$’000
Investment in Volt Corporation Ltd 8,500 –
8,500 –
On 22 January 2019, the Group acquired an equity investment in Volt Corporation Ltd. The Group designated the investment above as equity securities at fair value through other comprehensive income (FVOCI) because these equity securities represents investments that the Group intends to hold for the long term for strategic purposes. The investment in Volt Corporation Ltd represents the total of shares acquired (1,081,838 units) at the subscription price of $7.857.
13 Property, plant and equipment
Plant and equipment
$’000
Leasehold improvements
$’000
Motor Vehicles
$’000
Work-in-progress
$’000Total
$’000
At 1 July 2017
Cost or fair value 9,115 5,183 – 533 14,831
Accumulated depreciation (7,639) (4,130) – – (11,769)
Net book amount 1,476 1,053 – 533 3,062
Year ended 30 June 2018
Opening net book amount 1,476 1,053 – 533 3,062
Additions 44 2 – – 46
Disposals (1) (8) – – (9)
Depreciation charge (571) (325) – – (896)
Transfers – – – (119) (119)
Closing net book amount 948 722 – 414 2,084
At 30 June 2018
Cost or fair value 9,158 5,177 – 414 14,749
Accumulated depreciation (8,210) (4,455) – – (12,665)
Net book amount 948 722 – 414 2,084
Plant and equipment
$’000
Leasehold improvements
$’000
Motor Vehicles
$’000
Work-in-progress
$’000Total
$’000
Year ended 30 June 2019
Opening net book amount 948 722 – 414 2,084
Additions 717 737 9 57 1,520
Disposals (0) (0) – – (0)
Depreciation charge (543) (351) – – (894)
Transfers 171 – – (171) –
Closing net book amount 1,293 1,108 9 300 2,710
At 30 June 2019
Cost or fair value 10,046 5,914 9 300 16,269
Accumulated depreciation (8,753) (4,806) – – (13,559)
Net book amount 1,293 1,108 9 300 2,710
(a) Non-current assets pledged as securityRefer to Note 18 for information on non-current assets pledged as security by the Group.
For
per
sona
l use
onl
y

57
Collection House Limited Annual Report 2019
Notes to the Financial Statements
continued
Overview Corporate Governance Financial Report Additional Information
14 Intangible assets
Goodwill$’000
Computer software
$’000
Customer contracts
$’000
Other intangible
assets$’000
Work-in-progress –
cost*$’000
Total$’000
At 1 July 2017
Cost 23,490 25,305 2,487 184 1,648 53,114
Accumulated amortisation and impairment (3,763) (11,702) (1,180) (133) – (16,778)
Net book amount 19,727 13,603 1,307 51 1,648 36,336
Year ended 30 June 2018
Opening net book amount 19,727 13,603 1,307 51 1,648 36,336
Exchange differences (5) – – – – (5)
Additions - internal development – 125 – – 1,156 1,281
Amortisation charge – (3,018) (497) (38) – (3,553)
Impairment charge – – – – (124) (124)
Disposals – – – (13) – (13)
Transfers – 2,096 – – (1,977) 119
Closing net book amount 19,722 12,806 810 0 703 34,041
At 30 June 2018
Cost 23,490 27,526 2,487 171 827 54,501
Accumulated amortisation and impairment (3,768) (14,720) (1,677) (171) (124) (20,460)
Net book amount 19,722 12,806 810 – 703 34,041
Goodwill$’000
Computer software
$’000
Customer contracts
$’000
Other intangible
assets$’000
Work-in-progress –
cost*$’000
Total$’000
Year ended 30 June 2019
Opening net book amount 19,722 12,806 810 – 703 34,041
Exchange differences 4 – – – – 4
Additions - internal development – 378 – – 2,753 3,131
Amortisation charge – (3,100) (199) – – (3,299)
Impairment charge – – – – – –
Disposals – (10) – – – (10)
Transfers – 1,891 – – (1,916) (25)
Closing net book amount 19,726 11,965 611 – 1,540 33,842
At 30 June 2019
Cost 23,490 29,785 2.487 171 1,664 57,597
Accumulated amortisation and impairment (3,764) (17,820) (1,876) (171) (124) (23,755)
Net book amount 19,726 11,965 611 – 1,540 33,842
* Work-in-progress includes capitalised development costs of an internally generated intangible asset which is under development.
(a) Impairment tests for goodwillAll goodwill is allocated to the Company’s Collection Services cash-generating unit (CGU).
The recoverable amount of the CGU is determined based on value-in-use calculations. These calculations use cash flow projections based on financial budgets approved by management covering a five-year period, and include a terminal value calculation. The growth rate does not exceed the long-term average growth rate for the business in which the CGU operates.
For
per
sona
l use
onl
y
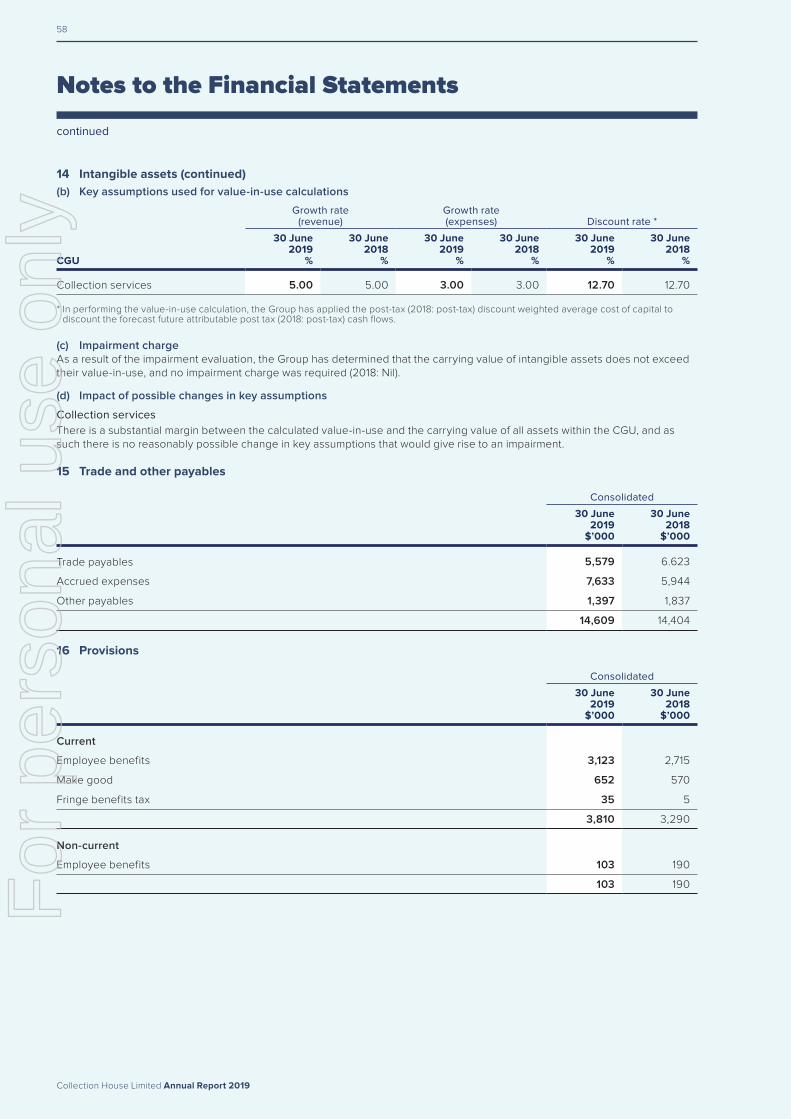
58
Collection House Limited Annual Report 2019
Notes to the Financial Statements
continued
14 Intangible assets (continued)(b) Key assumptions used for value-in-use calculations
Growth rate(revenue)
Growth rate (expenses) Discount rate *
CGU
30 June2019
%
30 June2018
%
30 June2019
%
30 June2018
%
30 June2019
%
30 June2018
%
Collection services 5.00 5.00 3.00 3.00 12.70 12.70
* In performing the value-in-use calculation, the Group has applied the post-tax (2018: post-tax) discount weighted average cost of capital to discount the forecast future attributable post tax (2018: post-tax) cash flows.
(c) Impairment chargeAs a result of the impairment evaluation, the Group has determined that the carrying value of intangible assets does not exceed their value-in-use, and no impairment charge was required (2018: Nil).
(d) Impact of possible changes in key assumptions
Collection servicesThere is a substantial margin between the calculated value-in-use and the carrying value of all assets within the CGU, and as such there is no reasonably possible change in key assumptions that would give rise to an impairment.
15 Trade and other payables
Consolidated
30 June2019
$’000
30 June2018
$’000
Trade payables 5,579 6.623
Accrued expenses 7,633 5,944
Other payables 1,397 1,837
14,609 14,404
16 Provisions
Consolidated
30 June2019
$’000
30 June2018
$’000
Current
Employee benefits 3,123 2,715
Make good 652 570
Fringe benefits tax 35 5
3,810 3,290
Non-current
Employee benefits 103 190
103 190For
per
sona
l use
onl
y

59
Collection House Limited Annual Report 2019
Notes to the Financial Statements
continued
Overview Corporate Governance Financial Report Additional Information
16 Provisions (continued)(a) Movements in provisionsMovements in each class of provision during the financial year, other than employee benefits, are set out below:
Make good
$’000
Fringe benefits tax
$’000
2019
Current
Carrying amount at start of year 570 5
– additional provisions recognised 82 201
– payments/other sacrifices of economic benefits – (171)
Carrying amount at end of year 652 35
2018
Current
Carrying amount at start of year 570 47
– additional provisions recognised – 149
– payments/other sacrifices of economic benefits – (191)
Carrying amount at end of year 570 5
(b) Superannuation plansAll employees are entitled to varying levels of benefits on retirement, disability or death. The superannuation plans provide accumulated benefits. Employees contribute to the plans at various percentages of their wages and salaries. Where there is a legal requirement the Company contributes the appropriate statutory percentage of employees’ salaries and wages.
17 Other financial liabilities
Consolidated
30 June2019
$’000
30 June2018
$’000
Current
Finance lease liabilities – 6
Lease incentive liabilities 572 572
Other current financial liabilities 1,365 2,082
1,937 2,660
Non-current
Lease incentive liabilities 5,053 5,197
Other non-current financial liabilities – 814
5,053 6,011
18 Borrowings
Consolidated
30 June2019
$’000
30 June2018
$’000
Secured
Bank loans – current 14,667 –
Bank loans – non-current 195,933 131,900
Total secured borrowings 210,600 131,900
For
per
sona
l use
onl
y

60
Collection House Limited Annual Report 2019
Notes to the Financial Statements
continued
18 Borrowings (continued)(a) Secured liabilities and assets pledged as security
Consolidated
30 June 2019
$’000
30 June 2018
$’000
The total secured liabilities are as follows:
Bank loans – current 14,667 –Bank loans – non-current 195,933 131,900
Total secured liabilities 210,600 131,900
All bank loans are denominated in Australian dollars and are secured by a fixed and floating charge over all of the assets and any uncalled capital of the parent entity and of its Australian-owned entities.
The carrying amounts of assets pledged as security for borrowings are:
Consolidated
Notes
30 June 2019
$’000
30 June 2018
$’000
Current
Floating charge
Cash and cash equivalents 8 1,596 509
Receivables 9 12,871 20,382
Purchased debt ledgers 10 52,466 54,215
Total current assets pledged as security 66,933 75,106
Non-current
Floating charge
Receivables 9 558 498
Purchased debt ledgers 10 357,837 259,192
Plant and equipment 13 2,710 2,084
Total non-current assets pledged as security 361,105 261,774
Total assets pledged as security 428,038 336,880
(b) Fair valueThe carrying amounts and fair values of borrowings at the end of reporting period are:
30 June 2019 30 June 2018
Group
Carrying amount
$’000Fair value
$’000
Carrying amount
$’000Fair value
$’000
On-balance sheet (i)
Non-traded financial liabilities
Bank loans – current 14,667 14,667 – –
Bank loans – non-current 195,933 195,933 131,900 131,900
210,600 210,600 131,900 131,900
As noted, none of the classes of liabilities are readily traded on organised markets in standardised form.
(i) On-balance sheetThe fair value of current borrowings equals their carrying amount. The facility is structured as a series of loan instruments which are repriced on a regular basis with terms of less than six months, and the impact of discounting on such instruments is not material. The rolling nature of the loan instruments is designed to provide the Group with maximum flexibility within the overall facility, however the overall facility is classified as non-current, as it is not due for renewal until January 2020.
(c) Risk exposuresInformation about the Group’s exposure to interest rate and foreign currency changes is provided in Note 2.
For an analysis of the sensitivity of borrowings to interest rate risk and foreign exchange risk refer to Note 2.
For
per
sona
l use
onl
y

61
Collection House Limited Annual Report 2019
Notes to the Financial Statements
continued
Overview Corporate Governance Financial Report Additional Information
19 Deferred tax balances
Consolidated
30 June2019
$’000
30 June2018
$’000
(a) Deferred tax assets
The balance comprises temporary differences attributable to:
Tax losses 161 73
Provisions and employee benefits 1,578 1,356
Lease incentives 1,688 1,731
Accruals 77 80
Share based payments 156 –
Doubtful debts 44 49
Future deductible windup costs – –
Other – (41)
3,704 3,248
Set-off of deferred tax liabilities pursuant to set-off provisions (b) (3,704) (3,248)
Net deferred tax assets – –
Movements:
Opening balance at 1 July 3,248 2,971
Credited/(charged) to the income statement (Note 7) 456 277
Closing balance at 30 June 3,704 3,248
Movements –Consolidated
Tax losses$’000
Provisions and
employee benefits
$’000
Lease incentive
$’000Accruals
$’000
Share based
payments$’000
Doubtful debts$’000
Total$’000
At 30 June 2017 190 1,185 1,509 47 – 24 2,971
– to profit or loss (117) 171 222 33 – 25 277
At 30 June 2018 73 1,356 1,731 80 – 49 3,248
Movements – Consolidated
Tax losses$’000
Provisions and
employee benefits
$’000
Lease incentive
$’000Accruals
$’000
Share based
payments$’000
Doubtful debts$’000
Total$’000
At 30 June 2018 73 1,356 1,731 80 – 49 3,289
– to profit or loss 88 222 (43) (3) 156 (5) 415
At 30 June 2019 161 1,578 1,688 77 156 44 3,704
For
per
sona
l use
onl
y

62
Collection House Limited Annual Report 2019
Notes to the Financial Statements
continued
19 Deferred tax balances (continued)
Consolidated
30 June2019
$’000
30 June2018
$’000
(b) Deferred tax liabilities
The balance comprises temporary differences attributable to:
Property, plant and equipment 2,600 3,115
Purchased debt 2,602 743
Prepayments 7 6
Other – –
5,209 3,864
Total deferred tax liabilities 5,209 3,864
Set-off of deferred tax liabilities pursuant to set-off provisions (a) (3,704) (3,248)
Net deferred tax liabilities 1,505 616
Consolidated
30 June2019
$’000
30 June2018
$’000
Movements:
Opening balance at 1 July 3,864 4,110
Charged/(credited) to the income statement (Note 7) 1,345 (246)
Closing balance at 30 June 5,209 3,864
Movements – Consolidated
Property, plant and
equipment$’000
Purchased debt
$’000Prepayments
$’000Other$’000
Total$’000
At 30 June 2017 3,451 653 6 – 4,110
– to profit or loss (336) 90 – – (246)
At 30 June 2018 3,115 743 6 – 3,864
Movements – Consolidated
Property, plant and
equipment$’000
Purchased debt
$’000Prepayments
$’000Other$’000
Total$’000
At 30 June 2018 3,115 743 6 – 3,864
– to profit or loss (515) 1,859 1 – 1,345
At 30 June 2019 2,600 2,602 7 – 5,209For
per
sona
l use
onl
y

63
Collection House Limited Annual Report 2019
Notes to the Financial Statements
continued
Overview Corporate Governance Financial Report Additional Information
20 Contributed equity
Company Company
2019Shares
2018Shares
2019$’000
2018$’000
(a) Share capital
Ordinary shares – fully paid 139,279,060 137,152,058 117,077 114,195
Treasury shares (467,482) (354,286) (664) (468)
Total contributed equity 138,822,752 136,797,772 116,413 113,727
(b) Movements in ordinary share capitalIssues of ordinary shares during the year
Date DetailsNumber of
shares $’000
1 July 2017 Opening balance 135,889,764 112,614
29 March 2018 Dividend reinvestment plan issues 1,262,294 1,589
Less: Transaction costs arising on share issues – (8)
30 June 2018 Closing balance 137,152,058 114,195
1 July 2017 Opening balance 137,152,058 114,195
26 October 2018 Dividend reinvestment plan issues 1,018,199 1,468
Less: Transaction costs arising on share issues (8)
28 March 2019 Dividend reinvestment plan issues 1,108,803 1,429
Less: Transaction costs arising on share issues – (7)
30 June 2019 Closing balance 139,279,060 117,077
(c) Ordinary sharesOrdinary shares entitle the holder to participate in dividends and the proceeds on winding up of the company in proportion to the number of and amounts paid on the shares held.
On a show of hands every holder of ordinary shares present at a meeting in person or by proxy, is entitled to one vote, and upon a poll each share is entitled to one vote.
Ordinary shares have no par value and the Company does not have a limited amount of authorised capital.
(d) Treasury sharesWhen share capital recognised as equity is repurchased or held by employee share plans and subject to vesting conditions, the amount of the consideration paid, including directly attributable costs, is recognised as a deduction from equity. When treasury shares are sold or reissued subsequently, the amount received is recognised as an increase in equity.
(e) Dividend reinvestment planThe Company has established a dividend reinvestment plan under which holders of ordinary shares may elect to have all or part of their dividend entitlements satisfied by the issue of new ordinary shares rather than by being paid in cash. Shares are issued under the plan at a 5% discount to the market price.
(f) Employee share schemeInformation relating to the employee share scheme, including details of shares issued under the scheme, is set out in Note 30.
(g) Performance rightsInformation relating to the performance rights plan adopted as a means of rewarding and incentivising key employees, including details of rights issued during the financial year, is set out in Note 30.
(h) Capital risk managementThe Group’s objectives when managing capital are to safeguard their ability to continue as a going concern, and to provide adequate returns for shareholders and benefits for other stakeholders.
“Capital” includes all funding provided under the Group’s funding facility (net of cash balances for which a right of offset is held) plus equity as shown in the balance sheet.
For
per
sona
l use
onl
y
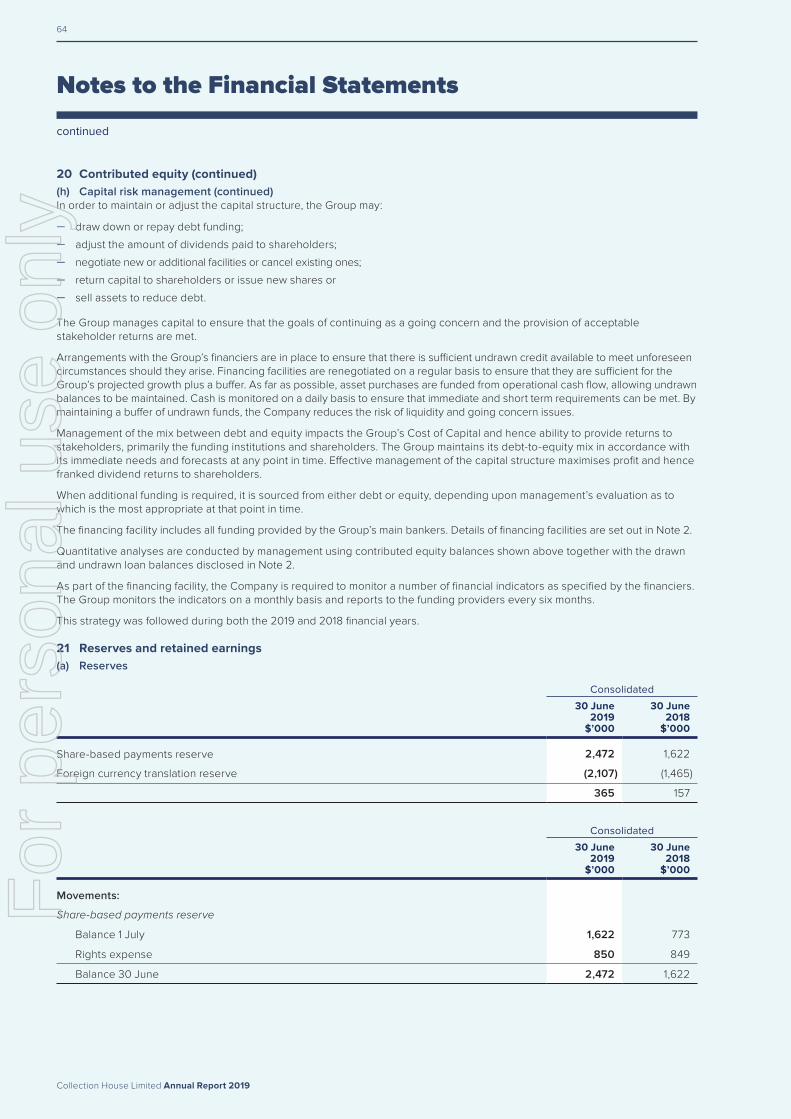
64
Collection House Limited Annual Report 2019
Notes to the Financial Statements
continued
20 Contributed equity (continued)(h) Capital risk management (continued)In order to maintain or adjust the capital structure, the Group may:
– draw down or repay debt funding;
– adjust the amount of dividends paid to shareholders;
– negotiate new or additional facilities or cancel existing ones;
– return capital to shareholders or issue new shares or
– sell assets to reduce debt.
The Group manages capital to ensure that the goals of continuing as a going concern and the provision of acceptable stakeholder returns are met.
Arrangements with the Group’s financiers are in place to ensure that there is sufficient undrawn credit available to meet unforeseen circumstances should they arise. Financing facilities are renegotiated on a regular basis to ensure that they are sufficient for the Group’s projected growth plus a buffer. As far as possible, asset purchases are funded from operational cash flow, allowing undrawn balances to be maintained. Cash is monitored on a daily basis to ensure that immediate and short term requirements can be met. By maintaining a buffer of undrawn funds, the Company reduces the risk of liquidity and going concern issues.
Management of the mix between debt and equity impacts the Group’s Cost of Capital and hence ability to provide returns to stakeholders, primarily the funding institutions and shareholders. The Group maintains its debt-to-equity mix in accordance with its immediate needs and forecasts at any point in time. Effective management of the capital structure maximises profit and hence franked dividend returns to shareholders.
When additional funding is required, it is sourced from either debt or equity, depending upon management’s evaluation as to which is the most appropriate at that point in time.
The financing facility includes all funding provided by the Group’s main bankers. Details of financing facilities are set out in Note 2.
Quantitative analyses are conducted by management using contributed equity balances shown above together with the drawn and undrawn loan balances disclosed in Note 2.
As part of the financing facility, the Company is required to monitor a number of financial indicators as specified by the financiers. The Group monitors the indicators on a monthly basis and reports to the funding providers every six months.
This strategy was followed during both the 2019 and 2018 financial years.
21 Reserves and retained earnings(a) Reserves
Consolidated
30 June2019
$’000
30 June2018
$’000
Share-based payments reserve 2,472 1,622
Foreign currency translation reserve (2,107) (1,465)
365 157
Consolidated
30 June2019
$’000
30 June2018
$’000
Movements:
Share-based payments reserve
Balance 1 July 1,622 773
Rights expense 850 849
Balance 30 June 2,472 1,622
For
per
sona
l use
onl
y

65
Collection House Limited Annual Report 2019
Notes to the Financial Statements
continued
Overview Corporate Governance Financial Report Additional Information
21 Reserves and retained earnings (continued)(a) Reserves (continued)
Consolidated
30 June2019
$’000
30 June2018
$’000
Movements:
Foreign currency translation reserve
Balance 1 July (1,465) (1,388)
Currency translation differences arising during the year (642) (77)
Balance 30 June (2,107) (1,465)
(b) Retained earningsMovements in retained earnings were as follows:
Consolidated
30 June2019
$’000
30 June2018
$’000
Balance 1 July 92,693 77,169
Net profit for the year 30,690 26,123
Dividends (11,013) (10,599)
Balance 30 June 112,370 92,693
(c) Nature and purpose of reserves
(i) Share-based payments reserveThe share based payments reserve is used to recognise the fair value of performance rights issued to employees that have not yet vested, or those that have vested at year end but not yet been issued as shares.
(ii) Foreign currency translation reserveExchange differences arising on translation of the foreign operations are recognised in other comprehensive income as described in Note 1(d) and accumulated in a separate reserve within equity. The cumulative amount is reclassified to profit or loss when the net investment is disposed of.
22 Dividends
Consolidated
30 June 2019
$’000
30 June 2018
$’000
(a) Ordinary shares
Fully franked final dividend for the year ended 30 June 2018 – 3.9 cents per share (2017 – 3.9 cents) 5,348 5,300
Fully franked interim dividend for the year ended 30 June 2019 – 4.1 cents per share (2018 – 3.9 cents) 5,665 5,299
11,013 10,599
Dividends paid in cash or satisfied by the issue of shares under the dividend reinvestment plan during the years ended 30 June 2019 and 2018 were as follows:
Paid in cash 8,116 9,018
Satisfied under the Dividend Reinvestment Plan 2,897 1,581
11,013 10,599
For
per
sona
l use
onl
y

66
Collection House Limited Annual Report 2019
Notes to the Financial Statements
continued
22 Dividends (continued)Consolidated
30 June 2019
$’000
30 June 2018
$’000
(b) Dividends not recognised at the end of the reporting period
In addition to the above dividends, since year end the directors have recommended the payment of a fully franked final dividend of 4.1 cents per fully paid ordinary share (2018 – 3.9 cents, fully franked). The aggregate amount of the proposed dividend expected to be paid on 25 October 2019 out of retained profits and a positive net balance sheet at 30 June 2019, but not recognised as a liability at year end, is 5,710 5,349
5,710 5,349
(c) Franked dividendsThe franked portions of the final dividends recommended after 30 June 2019 will be franked out of existing franking credits or out of franking credits arising from the payment of income tax in the year ending 30 June 2019.
The financial effect of this dividend has not been brought to account in the financial statements for the year ended 30 June 2019 and will be recognised in subsequent financial reports.
Consolidated
30 June 2019
$’000
30 June 2018
$’000
Franking credits available for subsequent financial years based on a tax rate of 30% (2018 – 30%) 48,178 42,083
48,178 42,083
The above amounts represent the balance of the franking account as at the end of the reporting period, adjusted for:
(a) franking credits that will arise from the payment of the amount of the provision for income tax;
(b) franking debits that will arise from the payment of dividends recognised as a liability at the reporting date;
(c) franking credits that will arise from the receipt of dividends recognised as receivables at the reporting date; and
(d) franking credits that may be prevented from being distributed in subsequent financial years.
The consolidated amounts include franking credits that would be available to the parent entity if distributable profits of subsidiaries were paid as dividends.
23 Remuneration of auditorsDuring the year the following fees were paid or payable for services provided by the auditor of the parent entity, its related practices and non-related audit firms:
Consolidated
30 June 2019
$
30 June 2018
$
Audit and review services
(a) Auditors of the Company – KPMG
Audit and review of the financial statements 258,280 278,465
Other regulatory audit services 69,800 68,470
Total auditors’ remuneration 328,080 346,935
(b) Other auditors – Villaruz, Villaruz & Co (“VVC”)
Audit and review of the financial statements - Manila 5,105 3,898
Total auditors’ remuneration 5,105 3,898
Other services
Auditors of the Company – KPMG
In relation to accounting advice and due diligence services 196,690 47,962
In relation to taxation services 120,700 200,393
317,390 248,355
For
per
sona
l use
onl
y

67
Collection House Limited Annual Report 2019
Notes to the Financial Statements
continued
Overview Corporate Governance Financial Report Additional Information
24 Contingencies(a) Contingent liabilitiesThe Group had contingent liabilities at 30 June 2019 in respect of:
ClaimsOn 15 March 2019, the Group was provided with a copy of a claim and statement of claim, which had been filed in the Supreme Court of Queensland on the same date. The claim for damages is for $2,800,000 and proceedings are still being defended by the Group.
Purchase Agreement with Put & Call Option with Insolve Capital Australia Pty Ltd (Balbec Capital LP)(a) The Group had assigned five years’ cash flow to Insolve Capital Australia Pty Ltd (Balbec Capital LP) through a put and call
option agreement.
(b) The Group has the option to repurchase the residual rights to collect the remaining arrangements at the end of the five-year agreement, at a market price determined by the performance of the accounts during the term of the agreement.
The two purchase agreements with Put & Call option have the following expiry dates:
– 3 November 2023 – 2 December 2024
Guarantees(a) Bank Guarantees (secured) exist in respect of satisfying contract terms amounting to $6,732,334 (2018: $6,032,045). During
the period, the increase is mainly contributed by new Bank Guarantees that were required to secure performance of new Lease premises.
(b) Guarantees and Indemnities (secured) given by the Company and certain of its subsidiaries in support of the existing Syndicated Loan Facility provided by Westpac Banking Corporation and Commonwealth Bank of Australia, are currently in place.
Paragraphs (a) and (b) above are secured by a Fixed and Floating charge over the assets of the Company and certain of its subsidiaries of the Group and may give rise to liabilities in the Group, if the associates do not meet their respective obligations under the terms of the contracts, subject to the guarantees.
No material losses are anticipated in respect of any of the above contingent liabilities.
25 Commitments(a) Capital commitmentsCapital expenditure contracted for in relation to purchased debt commitments at the reporting date but not recognised as liabilities is as follows:
Consolidated
30 June2019
$’000
30 June2018
$’000
Within one year 38,387 32,040
Later than one year, but not later than five years 4,616 210
43,003 32,250
(b) Non-cancellable operating leasesThe Group leases its offices under non-cancellable operating leases expiring at various times during the next eleven years. The leases have varying terms, escalation clauses and renewal rights. On renewal, the terms of the leases are renegotiated.
Consolidated
30 June2019
$’000
30 June2018
$’000
Commitments for minimum lease payments in relation to non-cancellable operating leases are payable as follows:
Within one year 3,236 6,684
Later than one year but not later than five years 31,605 25,906
Later than five years 5,328 20,548
40,169 53,138
For
per
sona
l use
onl
y

68
Collection House Limited Annual Report 2019
Notes to the Financial Statements
continued
25 Commitments (continued)(c) Non-cancellable finance leasesThe Group leases items of plant and equipment and intangibles under finance leases expiring within three years.
Consolidated
30 June2019
$’000
30 June2018
$’000
Commitments for minimum lease payments in relation to non-cancellable finance leases are payable as follows:
Within one year – 6
Later than one year but not later than five years – –
Later than five years – –
Minimum lease payments – –
Less: Future finance charges – –
Recognised as a liability – 6
26 Related party transactions(a) Group companies Details of the parent company, the ultimate parent company and interests in subsidiaries are set out in Note 28.
(b) Key management personnel compensation
Consolidated
30 June2019
$
30 June2018
$
Short-term employee benefits 2,479,189 1,877,336
Post-employment benefits 183,028 127,687
Other long-term benefits 54,049 58,375
Termination benefits 208,938 –
Share-based payments 565,295 605,450
3,490,499 2,668,848
Detailed remuneration disclosures are provided in sections A-J of the remuneration report on pages 18 to 28.
(c) Other transactions with key management personnel or entities related to themNo other transactions were made with key management personnel or entities related to them other than as appropriate payments for performance of their duties.
(d) Transactions with other related partiesThe classes of non director-related parties are:
– wholly owned controlled entities;
– directors of related parties and their director-related entities.
TransactionsThere were no transactions with directors of related parties and their director-related entities. Transactions with wholly owned related parties are eliminated on consolidation.F
or p
erso
nal u
se o
nly

69
Collection House Limited Annual Report 2019
Notes to the Financial Statements
continued
Overview Corporate Governance Financial Report Additional Information
27 Parent entity financial information(a) Summary financial informationThe individual financial statements for the parent entity show the following aggregate amounts:
Company
30 June2019
$’000
30 June2018
$’000
Balance sheet
Current assets 6,612 9,334
Non-current assets 431,439 338,436
Total assets 438,051 347,770
Current liabilities 26,790 22,144
Non-current liabilities 248,695 174,451
Total liabilities 275,485 196,595
Shareholders’ equity
Contributed equity 116,413 113,727
Reserves 2,475 1,625
Retained earnings 43,677 35,823
Capital and reserves attributable to owners of Collection House Limited 162,565 151,175
Profit or loss for the year 18,868 20,380
Total comprehensive income 18,868 20,380
(b) Guarantees entered into by the parent entityThe parent entity has entered into guarantees with certain of its subsidiaries as set out in Note 24.
No liability was recognised by the parent entity or the consolidated entity in relation to this guarantee, as the fair value is immaterial.
(c) Contingent liabilities of the parent entityRefer to Note 24 for contingent liabilities entered into by the Group. For information about guarantees given by the parent entity, please see above.
For
per
sona
l use
onl
y

70
Collection House Limited Annual Report 2019
Notes to the Financial Statements
continued
28 SubsidiariesThe consolidated financial statements incorporate the assets, liabilities and results of the following subsidiaries in accordance with the accounting policy described in Note 1(b):
2019%
2018%
Parent and Ultimate Parent company:
Collection House Limited
Controlled entities – incorporated in Australia
Safe Horizons Pty Ltd (formerly Cashflow Accelerator Pty Ltd) 100 100
ThinkMe Finance Pty Ltd 100 100
Collective Learning and Development Pty Ltd 100 100
CLH Legal Group Pty Ltd 100 100
Lion Finance Pty Ltd 100 100
Midstate CreditCollect Pty Ltd 100 100
CLH Business Services Pty Ltd 100 100
Collection House Limited Employee Share Plan Trust 100 100
Controlled entities – incorporated in New Zealand
Collection House (NZ) Limited 100 100
Lion Finance Limited 100 100
Receivables Management (NZ) Limited 100 –
Receivables Management (International) Limited 100 –
Creditnet International Limited 100 –
Receivables Finance Limited 100 –
Southern Receivables Limited ** 100 –
R.J.K Receivables Limited ** 100 –
Allied Recoveries Limited ** 100 –
Controlled entities – incorporated in Philippines
Collection House International BPO, Inc * 100 100
* Collection House International BPO, Inc started up on 10 May 2012 and commenced business operations on 1 April 2013. While Collection House Limited holds legal and beneficial ownership of 9,995 issued shares in the subsidiary, it has beneficial ownership of 5 issued shares in the subsidiary, held on trust for Collection House Limited by each of the five appointed directors of the subsidiary, in accordance with Philippines law, representing all of the issued shares in the subsidiary currently.
** As of 28 June 2019, Allied Recoveries Limited and R.J.K. Receivables Limited have been amalgamated to become Southern Receivables Limited.
29 Earnings per share
Consolidated
30 June2019
Cents
30 June2018
Cents
(a) Basic earnings per share
From continuing operations attributable to the ordinary equity holders of the Company 22.3 19.2
Total basic earnings per share attributable to the ordinary equity holders of the Company 22.3 19.2
(b) Diluted earnings per share
From continuing operations attributable to the ordinary equity holders of the Company 22.0 18.8
Total diluted earnings per share attributable to the ordinary equity holders of the Company 22.0 18.8
For
per
sona
l use
onl
y

71
Collection House Limited Annual Report 2019
Notes to the Financial Statements
continued
Overview Corporate Governance Financial Report Additional Information
29 Earnings per share (continued)
(c) Reconciliations of earnings used in calculating earnings per share
Consolidated
30 June2019
$’000
30 June2018
$’000
Basic earnings per share
Profit attributable to the ordinary equity holders of the Company used in calculating basic earnings per share 30,690 26,123
30,690 26,123
Diluted earnings per share
Profit attributable to the ordinary equity holders of the Company used in calculating diluted earnings per share 30,690 26,123
30,690 26,123
(d) Weighted average number of shares used as the denominator
Consolidated
30 June2019
Number
30 June2018
Number
Weighted average number of ordinary shares used as the denominator in calculating basic earnings per share 137,637,841 135,831,985
Adjustments for calculation of diluted earnings per share:
Performance Rights 1,972,323 3,281,896
Weighted average number of ordinary shares and potential ordinary shares used as the denominator in calculating diluted earnings per share 139,610,164 139,113,881
(e) Information concerning the classification of securities
(i) Performance rightsPerformance rights issued to employees under the Performance Rights Plan (PRP) are considered to be potential ordinary shares and have been included at the probability rate of 100% in the determination of diluted earnings per share to the extent to which they are dilutive. The performance rights have not been included in the determination of basic earnings per share. Details relating to the performance rights are set out in Note 30.
30 Share-based payments(a) Performance Rights PlanIn line with the executive remuneration framework, the Board approved and adopted the Performance Rights Plan (PRP), effective on and from 1 July 2012, as a means of rewarding and incentivising its key employees.
The PRP was extended to the then Chief Executive Officer (CEO), and to eligible employees.
Future performance rights may be issued by the Board pursuant to the PRP. The board determines the value of shares granted based on the individual’s performance. Future performance rights may vest at the discretion of the Board, subject to not only individual service conditions being met, but also, Company performance hurdles being achieved.
During the reporting period ending 30 June 2019, there are no unlisted performance rights were issued to a number of eligible employees as these rights have been deferred to FY20.F
or p
erso
nal u
se o
nly

72
Collection House Limited Annual Report 2019
Notes to the Financial Statements
continued
30 Share-based payments (continued)(a) Performance Rights Plan (continued)During the reporting period ending 30 June 2018, 341,071 unlisted performance rights were issued to a number of eligible employees pursuant to the PRP. A summary of these performance rights is identified below as PR2018.
PR2018
Effective date 1 July 2017
Earliest possible Vesting date The performance rights cannot vest earlier than the Test Date(1)
Performance hurdles based on the satisfactory achievement of performance conditions approved by the Board
Performance Conditions % off Pool
Compound EPS growth over performance period of:
0% to 5.00% Nil
5.01% to 7.50% 33.33%
7.51% to 10% 66.66%
More than 10.01% 100%
Performance between 5% to 10% will be assessed on a sliding scale basis up to a maximum of 341,071 shares.
Exercise conditions and Vesting Date The Performance Rights Test Date will be 30 June 2020 (Test Date) after which, the Board will determine whether or not the Performance Hurdles have been achieved.
As soon as reasonably practicable after each Test Date applicable to any Performance Period, the Board shall determine in respect of each eligible employee, as at that Test Date:
(a) whether, and to what extent, the Performance Hurdles applicable as at the Test Date have been satisfied;
(b) the number of Performance Rights (if any) that will become Vested Performance Rights as at the Test Date; and
(c) the number of Performance Rights (if any) that will lapse as a result of the non-satisfaction of Performance Hurdles as at the Test Date,
and shall provide written notification to each eligible employee as to that determination.
Exercise price Nil
Expiry date 30 September 2020
A Performance Right lapses, to the extent it has not been exercised, on the earlier to occur of:
(a) where Performance Hurdles have not been satisfied as at the relevant Test Date;
(b) if an eligible employee’s employment with the Company or Related Body Corporate ceases before the Vesting Date;
(c) the day the Board makes a determination that the Performance Rights lapses because of breach, fraud or dishonesty; and
(d) 30 September 2020.
5 Day volume weighted average Share price
$1.5404
(1) Test Date: the date at which assessment against the Performance Conditions are made by the Board. For PR2018, the Test Date will be 30 June 2020.F
or p
erso
nal u
se o
nly

73
Collection House Limited Annual Report 2019
Notes to the Financial Statements
continued
Overview Corporate Governance Financial Report Additional Information
30 Share-based payments (continued)(a) Performance Rights Plan (continued)During the reporting period ending 30 June 2017, 3,747,550 unlisted performance rights were issued to a number of eligible employees pursuant to the PRP. A summary of these performance rights is identified below as PR2017.
PR2017
Effective date 1 July 2016
Earliest possible Vesting date The performance rights cannot vest earlier than the Test Date(1)
Performance hurdles based on the satisfactory achievement of performance conditions approved by the Board
Performance Conditions % off Pool
Compound EPS growth over performance period of:
0% to 5.00% Nil
5.01% to 7.50% 33.33%
7.51% to 10% 66.66%
More than 10.01% 100%
Performance between 5% to 10% will be assessed on a sliding scale basis up to a maximum of 3,747,550 shares.
Exercise conditions and Vesting Date The Performance Rights Test Date will be 30 June 2019 (Test Date) after which, the Board will determine whether or not the Performance Hurdles have been achieved.
As soon as reasonably practicable after each Test Date applicable to any Performance Period, the Board shall determine in respect of each eligible employee, as at that Test Date:
(d) whether, and to what extent, the Performance Hurdles applicable as at the Test Date have been satisfied;
(e) the number of Performance Rights (if any) that will become Vested Performance Rights as at the Test Date; and
(f ) the number of Performance Rights (if any) that will lapse as a result of the non-satisfaction of Performance Hurdles as at the Test Date,
and shall provide written notification to each eligible employee as to that determination.
Exercise price Nil
Expiry date 30 September 2019
A Performance Right lapses, to the extent it has not been exercised, on the earlier to occur of:
(e) where Performance Hurdles have not been satisfied as at the relevant Test Date;
(f ) if an eligible employee’s employment with the Company or Related Body Corporate ceases before the Vesting Date;
(g) the day the Board makes a determination that the Performance Rights lapses because of breach, fraud or dishonesty; and
(h) 30 September 2019.
5 Day volume weighted average Share price
$1.2945
(1) Test Date: the date at which assessment against the Performance Conditions are made by the Board. For PR2017, the Test Date will be 30 June 2019.F
or p
erso
nal u
se o
nly

74
Collection House Limited Annual Report 2019
Notes to the Financial Statements
continued
30 Share-based payments (continued)(a) Performance Rights Plan (continued)Set out below are summaries of rights issued under the plan:
Effective Date Expiry dateExercise
price
Balance at start of the
year
Granted during the
year
Vested during the
year
Lapsed during the
year
Balance at end of the
year
Vested and issuable at end of the
year
Number Number Number Number Number Number
Company – 2019
1 July 2016 30 September 2019 Nil 3,213,133 – – 2,071,395 1,141,738 –
1 July 2017 30 September 2020 Nil 341,071 – – 79,296 261,775 –
Total 3,554,204 – – 2,150,691 1,403,513 –
Effective Date Expiry dateExercise
price
Balance at start of the
year
Granted during the
year
Vested during the
year
Lapsed during the
year
Balance at end of the
year
Vested and issuable at end of the
year
Number Number Number Number Number Number
Company – 2018
1 July 2016 30 September 2019 Nil 3,260,657 – – 47,524 3,213,133 –
1 July 2017 30 September 2020 Nil – 341,071 – – 341,071 –
Total 3,260,657 341,071 – 47,524 3,554,204 –
Fair Value of Performance Rights IssuedThe assessed fair value at issue date of all performance rights is set out above. The fair value at issue date is determined based on the five day volume weighted average share price prior to issue date.
(c) Employee Share PlanThe Group introduced the Collection House Limited Exempt Employee Share Plan, providing eligible employees with an opportunity to acquire a beneficial ownership of shares in the Company. The Plan is administered by CPU Share Plans Pty Limited. This Trust is consolidated in accordance with Note 1 (b) and Note 28.
All Australian and New Zealand resident employees were entitled to participate in the Plan subject to meeting certain eligibility criteria. Employees eligible to participate in the Group’s Performance Rights Plans detailed at (a) above where not eligible to participate in the Plan. Eligible employees may elect not to participate in the Plan.
Shares issued by the Trust to employees are acquired on-market prior to issue. Shares held by the Trust and not yet issued to employees at the end of the reporting period are shown as treasury shares in the financial statements (refer Note 20).
Under the Plan, eligible employees may be granted up to $1,000 worth of fully paid ordinary shares in Collection House Limited annually for no cash consideration. The number of shares issued to participants is the offer amount divided by the average price of the shares acquired on the Australian Securities Exchange during the on-market purchase period. The shares are recognised at the closing share price on the grant date, as an issue of treasury shares, and as part of employee benefit costs in the period the shares are granted.
For
per
sona
l use
onl
y

75
Collection House Limited Annual Report 2019
Notes to the Financial Statements
continued
Overview Corporate Governance Financial Report Additional Information
30 Share-based payments (continued)(c) Employee Share Plan (continued)Shares issued under the scheme may not be sold until the earlier of three years after issue, or cessation of employment by the Group. In all other respects, shares rank equally with other fully paid ordinary shares on issue.
The total number of shares granted to participating employees on 28 September 2018 was 133,390. The trade price of the shares issued as at grant date was $1.61, and the shares had a grant date fair value of $1.58.
(d) Expenses arising from share-based payment transactionsTotal expenses arising from share-based payment transactions recognised during the period as part of employee benefit expense were as follows:
Consolidated
30 June2019
$’000
30 June2018
$’000
Performance rights plan 620 599
Deferred shares – CEO short-term incentive 124 80
Employee share plan 107 237
Total expenses arising from share-based payment transactions 851 916
31 Reconciliation of profit after income tax to net cash inflow from operating activities
Consolidated
30 June2019
$’000
30 June2018
$’000
Profit for the year 30,690 26,123
Depreciation and amortisation 6,326 7,439
Amortisation of purchased debt ledgers 42,041 51,807
Asset write offs 29 211
Non-cash employee benefits expense – share-based payments 955 916
Provision for doubtful debts (18) 83
Other non-cash expenses 411 124
Borrowing costs 1,591 1,452
Interest paid 6,067 4,326
Change in operating assets and liabilities
(Increase)/decrease in trade debtors and bills of exchange 749 (1,913)
(Increase)/decrease in sundry debtors 3,910 (6,638)
(Increase)/decrease in other non-current assets (7,720) (2,988)
Increase/(decrease) in trade creditors (1,043) 2,695
Increase/(decrease) in sundry creditors and accruals 876 533
Increase/(decrease) in current tax liability 1,068 2,211
Increase/(decrease) in deferred tax liabilities 889 (518)
Net cash inflow (outflow) from operating activities 86,821 85,863
32 Events occurring after the reporting period(a) DividendA fully franked final dividend of 4.1 cents, totalling $5.7 million, has been declared, payable on 25 October 2019. No provision has been raised in these accounts for this amount.
For
per
sona
l use
onl
y

76
Collection House Limited Annual Report 2019
for the year ended 30 June 2019
Directors’ Declaration
In the directors’ opinion:(a) the financial statements and notes set out on pages 31 to 75 are in accordance with the Corporations Act 2001, including:
(i) complying with Accounting Standards, the Corporations Regulations 2001 and other mandatory professional reporting requirements, and
(ii) giving a true and fair view of the consolidated entity’s financial position as at 30 June 2019 and of its performance for the financial year ended on that date,
(b) there are reasonable grounds to believe that the company will be able to pay its debts as and when they become due and payable, and
Note 1(a) confirms that the financial statements also comply with International Financial Reporting Standards as issued by the International Accounting Standards Board.
The directors have been given the declarations by the chief executive officer and chief financial officer required by section 295A of the Corporations Act 2001.
This declaration is made in accordance with a resolution of the directors.
Leigh Berkley Chairman
Brisbane 30 August 2019
For
per
sona
l use
onl
y

77
Collection House Limited Annual Report 2019
Overview Corporate Governance Financial Report Additional Information
Independent Auditor’s Report
89
KPMG, an Australian partnership and a member firm of the KPMG network of independent member firms affiliated with KPMG International Cooperative (“KPMG International”), a Swiss entity.
Liability limited by a scheme approved under Professional Standards Legislation.
Independent Auditor’s Report
To the shareholders of Collection House Limited
Report on the audit of the Financial Report
Opinion
We have audited the Financial Report of Collection House Limited (the Company).
In our opinion, the accompanying Financial Report of the Company is in accordance with the Corporations Act 2001, including:
• giving a true and fair view of the Group's financial position as at 30 June 2019 and of its financial performance for the year ended on that date; and
• complying with Australian Accounting Standards and the Corporations Regulations 2001.
The Financial Report comprises:
• Consolidated Balance Sheet as at 30 June 2019;
• Consolidated Income Statement, Consolidated Statement of Comprehensive Income, Consolidated Statement of Changes in Equity, and Consolidated Statement of Cash Flows for the year then ended;
• Notes including a summary of significant accounting policies;
• Directors' Declaration.
The Group consists of the Company and the entities it controlled at the year-end or from time to time during the financial year.
Basis for opinion
We conducted our audit in accordance with Australian Auditing Standards. We believe that the audit evidence we have obtained is sufficient and appropriate to provide a basis for our opinion.
Our responsibilities under those standards are further described in the Auditor’s responsibilities for the audit of the Financial Report section of our report.
We are independent of the Group in accordance with the Corporations Act 2001 and the ethical requirements of the Accounting Professional and Ethical Standards Board’s APES 110 Code of Ethics for Professional Accountants (the Code) that are relevant to our audit of the Financial Report in Australia. We have fulfilled our other ethical responsibilities in accordance with the Code.
Key Audit Matters
Key Audit Matters are those matters that, in our professional judgement, were of most significance in our audit of the Financial Report of the current period.
This matter was addressed in the context of our audit of the Financial Report as a whole, and in forming our opinion thereon, and we do not provide a separate opinion on this matter.
to the Members
For
per
sona
l use
onl
y

78
Collection House Limited Annual Report 2019
Independent Auditor’s Report
continued
90
Value of the Purchased Debt Ledger portfolio ($410,303,000)
Refer to Note 10 to the Financial Report
The key audit matter How the matter was addressed in our audit
The Purchased Debt Ledgers (PDL) portfolio recognised by the Group consists of a portfolio of credit-impaired receivables. We consider this a key audit matter given the: • significance of the PDLs to the Group’s
financial position; • valuation of PDLs is a complex area and we
are required to exercise a high level of judgement in considering the recoverability of the carrying value of PDLs; and
• the Group has invested considerable time and effort in developing its PDL impairment model during the year.
The Group utilises a PDL impairment model for the purpose of calculating the present value of the PDLs. Under AASB 9 Financial Instruments a PDL is considered to be purchased or originated credit-impaired financial assets and at each reporting date, the Group recognises in profit or loss the estimated change in lifetime expected credit losses (ECL) as an impairment gain or loss. Favourable changes in lifetime ECL are recognised as an impairment gain. Favourable changes arise when actual cash collections exceed those initially forecast for the portfolio. For example, this could include higher collections from payment arrangements or legal action compared to what was anticipated when the portfolio was acquired. An impairment loss arises when there is a deficiency in cash collections compared to that initially forecast and reflected in the credit-adjusted effective interest rate (EIR). The PDL impairment model incorporates a number of judgements such as the following specific recoverability characteristics of PDLs: • age and type of debt (i.e. utilities, credit card,
personal loan); • payment history and the current repayment
status of customers; • historical debt collection statistics and the
credit-adjusted effective interest rate; • future collection estimates generated using a
combination of both internal and external information; and
• estimated term to maturity. We focused on the significant assumptions applied in the impairment model, including the Group’s assumptions at which expected cash flows will be recovered from customers and
Working with our valuation and modelling specialists, our audit procedures included: • Testing key internal controls in the debt
collection process, including the collection call centre process and related information technology system controls.
• Challenging assumptions used by the Group in determining the value of the PDL portfolio, with a view to identifying areas of management bias. Our challenge of key assumptions was based on: – the accuracy of previous estimates applied
by the Group in the prior year model, including debt collection forecasting, credit-adjusted effective interest rate, and estimated PDL life, when compared to actual historical data;
– identifying unusual ratios and trends in key estimates when compared to actual historical experience;
– analysing the credit-adjusted effective interest rate applied by comparing with historical cash collections and amortisation rates; and
– assessing forecast collection estimates by performing sensitivity analysis and for a sample of PDLs, compared their classification type to the underlying account history and characteristics.
For
per
sona
l use
onl
y

79
Collection House Limited Annual Report 2019
Independent Auditor’s Report
continued
Overview Corporate Governance Financial Report Additional Information
91
Other Information is financial and non-financial information in Collection House Limited’s annual reporting which is provided in addition to the Financial Report and the Auditor’s Report. The Directors are responsible for the Other Information.
Our opinion on the Financial Report does not cover the Other Information and, accordingly, we do not express an audit opinion or any form of assurance conclusion thereon, with the exception of the Remuneration Report and our related assurance opinion.
In connection with our audit of the Financial Report, our responsibility is to read the Other Information. In doing so, we consider whether the Other Information is materially inconsistent with the Financial Report or our knowledge obtained in the audit, or otherwise appears to be materially misstated.
We are required to report if we conclude that there is a material misstatement of this Other Information, and based on the work we have performed on the Other Information that we obtained prior to the date of this Auditor’s Report we have nothing to report.
Responsibilities of the Directors for the Financial Report
The Directors are responsible for:
• preparing the Financial Report that gives a true and fair view in accordance with Australian Accounting Standards and the Corporations Act 2001
• implementing necessary internal control to enable the preparation of a Financial Report that gives a true and fair view and is free from material misstatement, whether due to fraud or error
• assessing the Group and Company's ability to continue as a going concern and whether the use of the going concern basis of accounting is appropriate. This includes disclosing, as applicable, matters related to going concern and using the going concern basis of accounting unless they either intend to liquidate the Group and Company or to cease operations, or have no realistic alternative but to do so.
Auditor’s responsibilities for the audit of the Financial Report
Our objective is:
• to obtain reasonable assurance about whether the Financial Report as a whole is free from material misstatement, whether due to fraud or error; and
• to issue an Auditor’s Report that includes our opinion.
Reasonable assurance is a high level of assurance, but is not a guarantee that an audit conducted in accordance with Australian Auditing Standards will always detect a material misstatement when it exists.
Misstatements can arise from fraud or error. They are considered material if, individually or in the aggregate, they could reasonably be expected to influence the economic decisions of users taken on the basis of this Financial Report.
A further description of our responsibilities for the audit of the Financial Report is located at the Auditing and Assurance Standards Board website at: http://www.auasb.gov.au/auditors_responsibilities/ar1.pdf. This description forms part of our Auditor’s Report.
implicit interest rate (“credit-adjusted effective interest rate”). We involved our specialists in the areas of valuation, model logic and integrity and various cash flow assumptions when assessing this Key Audit Matter.
Other Information
For
per
sona
l use
onl
y

80
Collection House Limited Annual Report 2019
Independent Auditor’s Report
continued
92
Report on the Remuneration Report
Opinion
In our opinion, the Remuneration Report of Collection House Limited for the year ended 30 June 2019, complies with Section 300A of the Corporations Act 2001.
Directors’ responsibilities
The Directors of the Company are responsible for the preparation and presentation of the Remuneration Report in accordance with Section 300A of the Corporations Act 2001.
Our responsibilities
We have audited Sections A to J of the Remuneration Report which is contained in the Directors’ report for the year ended 30 June 2019.
Our responsibility is to express an opinion on the Remuneration Report, based on our audit conducted in accordance with Australian Auditing Standards.
KPMG Scott Guse Partner
Brisbane 30 August 2019
For
per
sona
l use
onl
y

81
Collection House Limited Annual Report 2019
Overview Corporate Governance Financial Report Additional Information
Shareholder Information
The shareholder information set out below was applicable as at 30 August 2019.
A. Distribution of equity securitiesAnalysis of numbers of equity security holders by size of holding:
Class of equity security Ordinary shares
Holders Shares
1 - 1,000 3,859 2,301,075
1,001 - 5,000 7,224 19,835,319
5,001 - 10,000 2,543 19,107,812
10,001 - 100,000 2,249 52,989,548
100,001 and over 89 45,045,306
Total 15,964 139,279,060
There were 1,070 holders of less than a marketable parcel of ordinary shares.
B. Equity security holdersTwenty largest quoted equity security holdersThe names of the twenty largest holders of quoted equity securities are listed below:
Name Units% of issued
capital
1. Ankla Pty Ltd 7,396,220 5.31
2. Citicorp Nominees Pty Limited 7,026,930 5.05
3. HSBC Custody Nominees (Australia) Limited 5,898,858 4.24
4. JP Morgan Nominees Australia Limited 3,454,418 2.48
5. Neweconomy com au Nominees Pty Limited <900 Account> 2,075,655 1.49
6. Mr Frederick Benjamin Warmbrand (FB & LJ Warmbrand Super A/C) 1,399,037 1.00
7. Durbin Superannuation Pty Ltd (Durbin Family S Fund A/C) 1,056,934 0.76
8. National Nominees Limited (DB A/C) 798,974 0.57
9. Kemp SMSF Pty Ltd (Kemp Super Fund A/C) 649,395 0.47
10. BNP Paribas Nominees Pty Ltd <IB AU NOMS RETAILCLIENT DRP> 638,157 0.46
11. BNP Paribas Nominees Pty Ltd (DRP) 553,811 0.40
12. NSR Investments Pty Ltd <NSR SUPER FUND A/C> 520,000 0.37
13. Rollee Pty Ltd 500,000 0.36
14. Selem Investments Pty Ltd 384,598 0.28
15. Mrs Lilian Jeanette Warmbrand 333,882 0.24
16. CS Third Nominees Pty Limited (HSBC Cust Nom AU Ltd 13 A/C) 303,277 0.22
17. Candide Investments Pty Ltd <CANDIDE SUPER FUND A/C> 300,000 0.22
18. Gailforce Marketing & PR Pty Limited <HALE AGENCY SUPER FUND A/C> 300,000 0.22
19. Mr David Francis Rayner & Mr Michael Charles Rayner 300,000 0.22
20. CPU Share Plans Pty Ltd <CLH EXE CONTROL A/C> 293,703 0. 21
Total 34,183,849 24.57
For
per
sona
l use
onl
y

82
Collection House Limited Annual Report 2019
Shareholder Information
B. Equity security holders (continued)Unquoted equity securitiesDetails of these Performance Rights are set out at Note 30 of the financial statements.
Effective Date Expiry dateExercise
price
Balance at start of the
year
Granted during the
year
Vested during the
year
Lapsed during the
year
Balance at end of the
year
Vested and issuable at end of the
year
Number Number Number Number Number Number
Company – 2019
1 July 2016 30 September 2019 Nil 3,213,133 – – 2,071,395 1,141,738 –
1 July 2017 30 September 2020 Nil 341,071 – – 79,296 261,775 –
Total 3,554,204 – – 2,150,691 1,403,513 –
Details of the Deferred Shares are set out in page 16 of the financial statements.
Indeterminate Rights
Number heldNumber of
holders
Mr Anthony Rivas
FY2017 71,409
FY2018 77,584
FY2019 95,796
Total 244,789 1
Restricted securitiesAll issued shares in Collection House Limited are quoted on the ASX and there are no shares subject to escrow or other regulated restrictions.
C. Substantial holdersSubstantial shareholders of ordinary shares in the Company are set out below:
Holder Units% of issued
capital
1. Ankla Pty Ltd, Izmo Pty Ltd (Simiz A/C), Mizi Superannuation Pty Ltd (Mizi Super Fund a/c) & Rollee Pty Ltd 8,006,220 5.75
2. Citicorp Nominees Pty Limited 7,026,930 5.05
D. Voting rightsThe voting rights attaching to each class of equity securities are set out below:
(a) Ordinary sharesOn a show of hands, every member present at a meeting in person or by proxy shall have one vote and upon a poll each share shall have one vote.
(b) Performance rightsNo voting rights.
(c) Deferred SharesNo voting rights.
continued
For
per
sona
l use
onl
y

83
Collection House Limited Annual Report 2019
Overview Corporate Governance Financial Report Additional Information
Corporate Directory
DirectorsLeigh Berkley Chairman (Non-Executive) Michael Knox Director (Non-Executive) Anthony Rivas Managing Director and Chief Executive Officer (Executive) Sandra Birkensleigh Director (Non-Executive) (appointed 17 September 2018) Catherine McDowell Director (Non-Executive) (appointed 17 September 2018)
Company SecretaryDoug McAlpine
Executive Management TeamAnthony Rivas Managing Director and Chief Executive Officer Doug McAlpine Chief Financial Officer & Company Secretary (appointed 1 July 2019) Anand Adusumilli Chief Data Scientist Jonathan Idas Chief Legal Officer Denica Saunders Chief Operating Officer (appointed 1 July 2018)
Main contactDoug McAlpine Company Secretary
T: +61 7 3017 3410 E: [email protected]
Principal registered office in AustraliaLevel 12, 100 Skyring Terrace Newstead Qld 4006
T: +61 7 3292 1000 F: +61 7 3832 0222 W: www.collectionhouse.com.au
Postal addressPO Box 2247 Fortitude Valley BC Qld 4006
Share registerComputershare Investor Services Pty Ltd GPO Box 2975 Melbourne Vic 3000
T: 1300 850 505 F: +61 7 3237 2152 W: www.computershare.com.au
AuditorKPMG71 Eagle Street Brisbane Qld 4000
Stock exchange listingCollection House Limited shares are listed on the Australian Securities Exchange (ASX). The home exchange is Sydney.
ASX codeCLH
Investor and client presentationThe Group’s latest investor and client presentation is available at www.collectionhouse.com.au.
For
per
sona
l use
onl
y

www.collectionhouse.com.au
HEAD OFFICE:Level 12, 100 Skyring Terrace, Newstead QLD 4006
T: +61 7 3292 1000 | F: +61 7 3832 0222
For
per
sona
l use
onl
y