for personal use only - thorneytechnologies€¦ · bpl acquisition to an average of over 3.5...
TRANSCRIPT

Annual Financial Report 2012 1
ABN 66 096 782 188
Annual financial report for the year ended 30 June 2012
For
per
sona
l use
onl
y

Directors’ report
2 AUSTRALIAN RENEWABLE FUELS LIMITED
The Directors of Australian Renewable Fuels Limited (ARfuels) present their annual financial report of the Company for the
year ended 30 June 2012. The Directors report as follows:
The names and particulars of the Directors of the Company during or since the end of the financial year are:
Name Particulars
Philip Garling Mr Garling was appointed as Non-Executive Director on 5 May 2011 and Non-Executive Chairman on 30 November 2011. Philip has 25 years experience in Infrastructure Construction, Development, Operations and Investment Management, most recently as Global Head of Infrastructure at AMP Capital Investors. He has also been Chief Executive Officer of Tenix Infrastructure and prior to that he was a long term Senior Executive at Lend Lease Corporation culminating in his role as Chief Executive of Lend Lease Capital Services (the Development Capital, Infrastructure Development and Project Finance arm of Lend Lease).
Philip is a former member of the Federal Government Environment Industry Action Agenda, and a former Councilor of Environment Business Australia. Philip has a Bachelor of Building from the University of NSW. He also completed an Advanced Management Program at the Australian Institute of Management and an Advanced Diploma from the Australian Institute of Company Directors and is a Fellow of the Australian Institute of Company Directors, Australian Institute of Building and Institution of Engineers, Australia.
Philip was the foundation Chair and remains a Director of the ASX listed DUET Group Limited. He is also a Director of Downer EDI Limited.
Andrew White
Mr White was appointed to the Board on 1 July 2011. Andrew was most recently a Director and Chief Operating Officer of Infrastructure Capital Group Limited, an investment management business with over $1 billion of equity funds under management and invested in infrastructure across Australia.
He led Biodiesel Producers Limited (BPL), an unlisted public Company that manufactures biodiesel from tallow and waste cooking oil as the Managing Director. With contracts established with Shell, Finemores, Border Express, Greenfreight and other large users of fuels, BPL’s acquisition has ensured that ARfuels geographic reach extends into the east-coast of Australia.
Andrew has sat on the Board and Management Committees for various large energy projects including Neerabup Power Station (330mW), Kwinana Power Station (320mW) and the Esperance Energy Project (336km Kambalda to Esperance Gas Pipeline and energy station).
With a chartered accounting background, Mr White also worked for 8 years with Arthur Andersen and 9 years in senior executive roles including Finance Director and Strategic Planning Director with Mars Inc. in Australia and New Zealand.
Michael Costello AO
Mr Costello was appointed as Non-Executive Director on 5 May 2011. Before his appointment to ActewAGL in 2008, Michael was Managing Director of ACTEW Corporation, a member of the ACTEW Board and a member of the ActewAGL Joint Venture Partnerships Board from 2003. Michael is a member of the Advisory Council of the Australian National University’s Crawford School of Economics and Government.
Michael was previously Deputy-Managing Director of the Australian Stock Exchange. He was Chief of Staff to the Hon Kim Beazley AC, the former Labor Opposition Leader and to the Hon Bill Hayden AC when he was the Minister for Foreign Affairs. Michael has been the Secretary of the Department of Foreign Affairs and Trade and the Department of Industrial Relations. He has held a number of diplomatic posts including Ambassador to the United Nations.
Michael holds degrees in arts and law. He is a Fellow of the Australian Institute of Company Directors. He received an Order of Australia in 1996 for international relations.
Deborah Page AM
Ms Page was appointed as Non-Executive Director and Chair of the Company’s Audit Committee on 21 March 2012. Deborah has extensive financial experience from a diverse range of Finance and Operational Executive roles, as well as external audit and corporate advisory roles.
Deborah was a partner at Touche Ross/KPMG Peat Marwick until 1992 and subsequently held Senior Executive positions with the Lend Lease Group, Allen Allen and Hemsley and the Commonwealth Bank. Deborah has considerable corporate governance experience and is currently on the Boards of several listed and unlisted companies including Service Stream Limited, Investa Listed Funds Management Limited (responsible entity of Investa Office Fund), The Colonial Mutual Life Assurance Society Limited and Commonwealth Insurance Limited.
Deborah is a Fellow of the Institute of Chartered Accountants, a member of the Institute of Company Directors and holds a Bachelor of Economics from Sydney University.
For
per
sona
l use
onl
y
Annual Financial Report 2012 3
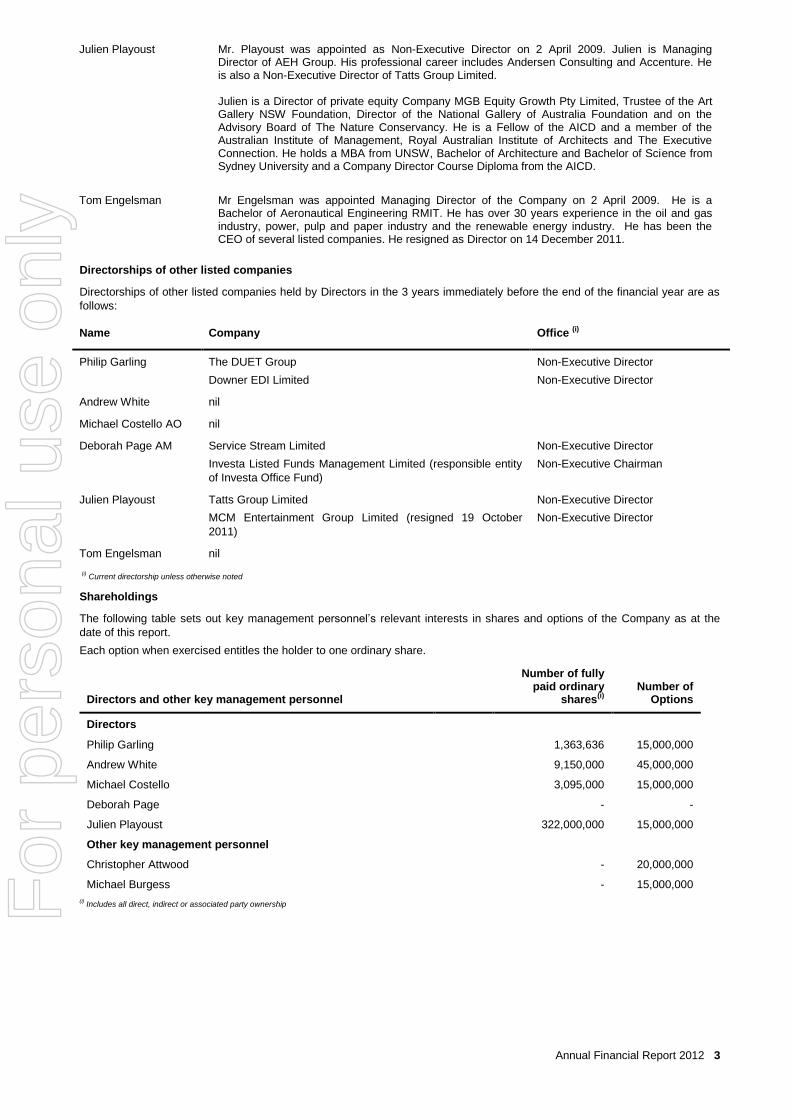
Directorships of other listed companies
Directorships of other listed companies held by Directors in the 3 years immediately before the end of the financial year are as
follows:
Name Company Office (i)
Philip Garling The DUET Group
Downer EDI Limited
Non-Executive Director
Non-Executive Director
Andrew White nil
Michael Costello AO nil
Deborah Page AM Service Stream Limited
Investa Listed Funds Management Limited (responsible entity
of Investa Office Fund)
Non-Executive Director
Non-Executive Chairman
Julien Playoust Tatts Group Limited
MCM Entertainment Group Limited (resigned 19 October
2011)
Non-Executive Director
Non-Executive Director
Tom Engelsman nil
(i)
Current directorship unless otherwise noted
Shareholdings
The following table sets out key management personnel’s relevant interests in shares and options of the Company as at the
date of this report.
Each option when exercised entitles the holder to one ordinary share.
Directors and other key management personnel
Number of fully
paid ordinary shares(i)
Number of
Options
Directors
Philip Garling
1,363,636 15,000,000
Andrew White
9,150,000 45,000,000
Michael Costello
3,095,000 15,000,000
Deborah Page
- -
Julien Playoust
322,000,000 15,000,000
Other key management personnel
Christopher Attwood
- 20,000,000
Michael Burgess
- 15,000,000
(i) Includes all direct, indirect or associated party ownership
Julien Playoust Mr. Playoust was appointed as Non-Executive Director on 2 April 2009. Julien is Managing Director of AEH Group. His professional career includes Andersen Consulting and Accenture. He is also a Non-Executive Director of Tatts Group Limited.
Julien is a Director of private equity Company MGB Equity Growth Pty Limited, Trustee of the Art Gallery NSW Foundation, Director of the National Gallery of Australia Foundation and on the Advisory Board of The Nature Conservancy. He is a Fellow of the AICD and a member of the Australian Institute of Management, Royal Australian Institute of Architects and The Executive Connection. He holds a MBA from UNSW, Bachelor of Architecture and Bachelor of Science from Sydney University and a Company Director Course Diploma from the AICD.
Tom Engelsman
Mr Engelsman was appointed Managing Director of the Company on 2 April 2009. He is a Bachelor of Aeronautical Engineering RMIT. He has over 30 years experience in the oil and gas industry, power, pulp and paper industry and the renewable energy industry. He has been the CEO of several listed companies. He resigned as Director on 14 December 2011.
For
per
sona
l use
onl
y

Directors’ report (continued)
4 AUSTRALIAN RENEWABLE FUELS LIMITED
During and since the end of the financial year an aggregate of 120,000,000 share options (2011: 7,500,000) were granted to the
following officers of the Company as part of their remuneration:
Directors and other Key Management personnel
Number of
options granted
Number of ordinary shares
under option
Directors
Philip Garling
15,000,000 15,000,000
Andrew White
45,000,000 45,000,000
Michael Costello
15,000,000 15,000,000
Deborah Page
- -
Julien Playoust
10,000,000 10,000,000
Other key management personnel
Christopher Attwood
20,000,000 20,000,000
Michael Burgess
15,000,000 15,000,000
Directors’ meetings
The number of Directors’ meetings (including meetings of Board Committees) and the number of meetings attended by each of
the Directors of the Company held during the financial year are detailed in the following table:
Name
Board of Directors Audit Committee Remuneration Committee
Held Attended Held Attended Held Attended
Philip Garling 12 12 3 3 2 2
Andrew White 12 12 3 3 2 1
Michael Costello 12 11 3 3 2 2
Deborah Page(i) 4 4 - - - -
Julien Playoust 12 12 3 3 2 2
Tom Engelsman(i) 4 4 1 1 2 2
(i)Deborah Page and Tom Engelsman attended all meetings for which they were eligible.
Company secretary
The names and particulars of the Company Secretaries during or since the end of the financial year are:
Name
Andrew Metcalfe
Stephan Scheffer
Mr Andrew Metcalfe was appointed as Company Secretary on 11 August 2011
Mr Stephan Scheffer was appointed as Company Secretary on 15 November 2010 and resigned on 11 August 2011
Principal activities
The principal activities of the Company continued to be the production and sale of Biodiesel. The acquisition of Biodiesel Producers Limited (BPL) on 1 November 2011 has enhanced the production capabilities of the Company but has not changed the Principal activities. Since the acquisition of BPL the nameplate production capacity for the Company has grown from 90 million litres per annum to 150 million litres per annum.
Review of operations
The highlight of the year was the completion of the acquisition of BPL. The BPL business became part of the ARfuels Group on 1 November 2011. Alongside this significant event, other material changes that occurred within the Company during the financial year included:
- Appointment of Andrew White as Managing Director and Chief Executive Officer;
- New Management team in place;
- Increase in average monthly biodiesel produced from over 500,000 litres per month for the 10 months preceding the
BPL acquisition to an average of over 3.5 million litres per month since the BPL acquisition. This average monthly rate
has continued to increase in the new financial year;
- ARfuels annual sales grew to $38,297,052, with BPL contributing $28,089,019 to that amount;
For
per
sona
l use
onl
y

Annual Financial Report 2012 5
- Successful processing of 15 tonnes of Recycled Mill Oil (RMO) into biodiesel at the Barnawartha Plant;
- Completing over 8 million litres in export sales for the year; and
- The second half of the financial year being cash positive.
The fire at Largs Bay was a disappointing occurrence but the restitution project is now well underway and the Plant is expected to be back up and running by November 2012.
Financial results
The financial result for the year is disappointing. The Board and management have set clear targets to improve the Group’s financial performance in the year ending 30 June 2013.
The following table provides an overview of the Group’s performance for the two half year periods to 30 June 2012, together with a reconciliation between EBITDA and net loss after tax:
The final six months of the financial year has delivered a small EBITDA loss of ($49,007) and net loss of ($2,481,578). This result is a material improvement in comparison to the 6 months to 31 December 2011 and the previous financial performance of ARfuels.
The improved second half trading is also reflected in cash flow. The Net Operating Cash Outflow for 30 June 2011 was $6,844,697, whereas the Net Operating Cash Outflow for the 30 June 2012 financial year was $1,531,809. The material slowdown in operating outflows occurred in the final six months of the financial year where ARfuels earned positive operating cash inflow of $4,330,501. Whilst the levels of cash flow remain inconsistent, the turnaround was a satisfying result.
The average Gross Margin for the year was 11.6%. This was primarily due to low margins achieved by Picton and Largs Bay early in the financial year and the fall in the Oil price (and hence the sales price of biodiesel) late in the financial year. This negative effect of the fall in the Oil price was compounded by a rise in the cost of feedstock at around the same time, thereby further diminishing margins across the April to May period. There has been a correction in both the Oil price and feedstock price which has improved margins since then. Management of gross margin will remain an ongoing challenge for the Company.
Management has worked diligently to limit expenditure. Despite the addition of a new trading business and the subsequent addition of over 20 staff from BPL and their related costs, ARfuels’ total Direct Costs, Staff Costs and Other Expenses have remained at levels similar to that incurred for the year ended 30 June 2011. Cost control will remain a focus for Management.
Sales
Sales and Marketing remain a major priority with progress having been made in the Mining and Fuel distribution areas. The acquisition of BPL has given ARfuels a national footprint which bodes well for the future. Positive Federal Government action on Anti-dumping Legislation, Fuel Tax Legislation and the introduction of the Carbon Reduction Scheme has installed a level of certainty which should benefit the Company going forward.
Sales grew to $38,297,052 for the financial year.
Feedstocks
The Company continues to work to bring Recycled Mill Oil (RMO) into our feedstock mix. For the 30 June 2012 year the average feedstock cost ranged between $750 and $850 per tonne. We are still investigating overseas sources of feedstock that may enhance future margins. Cost of goods sold for the year was $33,872,312. Gross Profit was $4,424,740 or an 11.6% margin.
Financial and capital structure
With the acquisition of BPL and the December 2011 capital raising, the capital profile of ARfuels has changed. The key events contributing to this were:
- $5.1 million raised in December 2011 through a 1 cent share placement of 13,000,000 shares and through the
conversion of 494,659,338 options into ordinary shares at 1 cent;
- $13,650,000 in Convertible Notes issued as part of the acquisition of BPL;
- Access to a Bank Overdraft facility with a limit of $10,000,000 through the acquisition of BPL;
- Equity of $2,000,000 at 1 cent per share contributed by Global Biofuels Trading Inc (GBTI). The contribution was
made as part of the agreement with GBTI whereby:
GBTI has committed to supply feedstock in the form of RMO to ARfuels, at a fixed price plus cartage;
ARfuels has committed to supply a minimum of 30 million litres of biodiesel per annum to GBTI;
GBTI to assist in funding the capital works to enable the processing of RMO;
The agreement has a 5 year term with an option to renew for a further 5 years.
Year Ended
30 June 2012
6 Months to
31 December 2011
6 Months to
30 June 2012
$ $ $
Revenue 38,297,052 13,912,050 24,385,002
EBITDA (3,536,332) (3,487,325) (49,007)
Depreciation and amortisation expenses (2,355,295) (927,127) (1,428,168)
Net f inance income/(costs) (1,344,166) (339,763) (1,004,403)
Net Profit/(loss) after tax (7,235,793) (4,754,215) (2,481,578)
For
per
sona
l use
onl
y

Directors’ report (continued)
6 AUSTRALIAN RENEWABLE FUELS LIMITED
Issuing entity
Number of
shares under
option
Class of
shares
Exercise price
of options
Expiry date of
options
Australian Renew able Fuels Limited 4,000,000 Ordinary 3 cents 31 December 2012
Australian Renew able Fuels Limited 150,000 Ordinary 10 cents 26 March 2013
Australian Renew able Fuels Limited 200,000,000 Ordinary 1 cent 15 March 2013
Australian Renew able Fuels Limited 190,000 Ordinary 10 cents 22 September 2013
Australian Renew able Fuels Limited 10,500,000 Ordinary 2 cents 30 September 2014
Australian Renew able Fuels Limited 45,000,000 Ordinary 3 cents 15 December 2014
Australian Renew able Fuels Limited 57,500,000 Ordinary 3 cents 28 February 2015
Australian Renew able Fuels Limited 40,000,000 Ordinary 4 cents 15 March 2015
Changes in state of affairs
There have been no significant changes in the state of affairs of the consolidated entity at the date of this report other than as already noted.
Subsequent events
There have been no significant subsequent events in the affairs of the consolidated entity at the date of this report other than as already noted.
Future developments
Disclosure of information regarding likely developments in the operations of the consolidated entity in future years and the
expected results of those operations may result in unreasonable prejudice to the consolidated entity and therefore have not
been disclosed in this report.
To date, work is progressing on the restitution work at the Largs Bay Plant following the fire in December 2011. This work is
being fully funded under the damages claim submitted to Insurers. It is expected that the Plant will be operational by November
2012.
Environmental regulations
The consolidated entity’s operations are subject to environmental regulation under both Commonwealth and State legislation.
There have been no significant known breaches of these regulations by the consolidated entity.
Dividends
No dividends have been paid or declared since the start of the year.
Shares under option or issued on exercise of options
Details of unissued shares or interest under option as at the date of this report:
Details of shares or interests issued during or since the end of the financial year as a result of exercise of options are:
Issuing Entity
Number of
shares under
option
Class
of shares
Amount paid
for shares
Amount
unpaid
Australian Renewable Fuels Limited 494,659,338 Ordinary $4,946,593 Nil
Indemnification of officers and auditors
The Company has entered into agreements to indemnify all the Directors and Officers named in this report against all liabilities
to persons (other than the Company), which arise out of the Directors and Officers conduct unless the liability relates to conduct
involving a lack of good faith or is otherwise prohibited by law. The Company has agreed to indemnify the Directors and Officers
against all costs and expenses incurred in defending an action that falls within the scope of the indemnity and any resulting
payments.
In accordance with common commercial practice, the insurance policy prohibits disclosure of the nature of the liability insured
against and the amount of the premium.
The Company has not during or since the end of the year indemnified or agreed to indemnify an auditor of the Company against
a liability incurred as auditor.
Non-audit services
Details of amounts paid or payable to the auditor for non-audit services provided during the year by the auditor are outlined in
note 29 to the financial statements.
The Directors are satisfied that the provision of non-audit services, during the year, by the auditor (or by another person or firm
on the auditor’s behalf) is compatible with the general standard of independence for auditors imposed by the Corporations Act
2001.
For
per
sona
l use
onl
y

Annual Financial Report 2012 7
The Directors are of the opinion that the services as disclosed in note 29 to the financial statements do not compromise the
external auditor’s independence, based on advice received from the Audit Committee, for the following reasons:
i. all non-audit services have been reviewed and approved to ensure that they do not impact the integrity and objectivity
of the auditor, and
ii. none of the services undermine the general principles relating to auditor independence as set out in Code of Conduct
APES 110 Code of Ethics for Professional Accountants issued by the Accounting Professional and Ethical Standards
Board, including reviewing or auditing the auditor’s own work, acting in a management or decision-making capacity for
the Company, acting as advocate for the Company or jointly sharing economic risks and rewards.
Auditor’s independence declaration
The Auditor’s independence declaration is included on page 21 of this report.
For
per
sona
l use
onl
y
Directors’ report (continued)
Remuneration report – audited
8 AUSTRALIAN RENEWABLE FUELS LIMITED
This remuneration report, which forms part of the Directors’ report, sets out information regarding the remuneration of ARfuels Directors and its key management personnel for the financial year ended 30 June 2012. The prescribed details for each person covered by this report are detailed below under the following headings:
i. key management personnel details;
ii. principles of remuneration;
iii. relationship between the remuneration policy and Company performance;
iv. remuneration of Directors and key management personnel; and
v. key terms of service agreements.
The terms ’remuneration’ and ‘compensation’ are used interchangeably throughout this report.
i. key management personnel details
The following persons acted as Directors of the Company during or since the end of the financial year:
Non-Executive Directors
- Philip Garling (Non-Executive Chairman - appointed Chairman 30 November 2011)
- Julien Playoust (Non-Executive Director)
- Michael Costello (Non-Executive Director)
- Deborah Page (Non-Executive Director – appointed 21 March 2012)
- Tom Engelsman (Non-Executive Chairman – appointed 29 August 2011, resigned as Non-Executive Chairman 30 November 2011, resigned as Non-Executive Director 14 December 2011)
The term ‘key management’ is used in this remuneration report to refer to the following personnel. Except as noted, the named key management personnel held their current position for the whole of the financial year and since the end of the financial year:
Executive Directors and Key management personnel
- Andrew White (Managing Director – appointed 1 July 2011)
- Tom Engelsman (Executive Chairman – resigned as Executive Chairman 29 August 2011)
Key management personnel
- Christopher Attwood (Chief Operating Officer – appointed 1 November 2011)
- Michael Burgess (Chief Financial Officer – appointed 6 February 2012)
- Stephan Scheffer (Chief Financial Officer – departed 11 January 2012, Company Secretary – appointed 15 November 2010, resigned 11 August 2011)
ii. Principles of remuneration
The Board policy for determining the nature and amount of key management personnel and other remuneration is agreed by the Board of Directors after review, approval and recommendation by the Remuneration Committee. After the acquisition of Biodiesel Producers Limited on 1 November 2011, Key Management remuneration was reviewed by the Board pursuant to recommendations from the Managing Director. Subsequent to the review, Employment Services Agreements were completed and signed with Key Management. The Managing Director’s contract and remuneration is dealt with by the Board.
Key management personnel have authority and responsibility for planning, directing and controlling the activities of the Company.
Compensation levels and structures for Key Management and other employees of the Company are competitively set to attract and retain appropriately qualified and experienced people and to reward the achievement of strategic objectives, and achieve the broader outcome of protecting and enhancing shareholder value. The compensation structures take into account the capability and experience of Key Management and other employees and the ability of Key Management and other employees to control areas of their respective responsibilities.
The Remuneration Committee has access to independent advice and uses market data to assess the appropriateness of compensation packages in the Company given trends in comparative companies, and the objectives of the Company’s compensation strategy.
The principles used to determine the nature and amount of remuneration are as follows:
Alignment to shareholder interests:
i. level of achieved net profit is a key criteria;
ii. controllable financial drivers of the businesses including revenues, cash, margin, earnings per share, and capital management improvement are important criteria; and
iii. remuneration is set at a level to attract and retain high calibre executives.
For
per
sona
l use
onl
y

Annual Financial Report 2012 9
Alignment to the key management interests:
i. rewards capability and experience;
ii. provides a clear structure for earning rewards; and
iii. provides recognition for contribution.
The framework provides a mix of fixed and variable pay, and a blend of short and long term incentives. In terms of long term incentives, as executives gain seniority they can be rewarded by gaining exposure to growth in the value of the Company through access to the Employee Share Option Plan.
Remuneration committee
The Board has established a Remuneration Committee which provides recommendations to the Board on remuneration and incentive policies and practices. The committee provides specific recommendations on remuneration packages and other terms of employment for Executive Directors, other senior executives and Non-Executive Directors. The Remuneration Committee assesses the appropriateness of the nature and amount of remuneration of Directors and senior executives on a periodic basis by reference to relevant employment market conditions with an overall objective of the retention of a high quality Board and Executive team.
Non-Executive Director remuneration
The Board seeks to set aggregate remuneration at a level that provides the Company with the ability to attract and retain Directors of the appropriate calibre.
The ASX Listing Rules specify that the aggregate remuneration of Non-Executive Directors shall be determined from time to time by a General Meeting. As previously approved by shareholders, the approved maximum aggregate annual remuneration of Non-Executive Directors is currently $300,000. Each Non-Executive Director receives a fee for being a Director of the Company. During the financial year the Board amended the Remuneration Structure for Non-Executive Directors. The Chairman now receives a fee of $110,000 per annum, and all other Non-Executive Directors receive a fee of $60,000 per annum. The Chair of the Audit and Risk Committee receives an additional $15,000 per annum whilst the Chair of the Remuneration Committee receives an extra $10,000 per annum. Also, at the General Meeting on 7 March 2012, Shareholders approved the issue of 40,000,000 options with an exercise price of 4c to three Non-Executive Directors. This option issue is detailed later in this report. Any future issue of new options will be subject to shareholder approval.
The amount of aggregate remuneration sought to be approved by shareholders and the manner in which it is apportioned amongst Directors is reviewed annually. The Board can access independent advice and industry benchmarks on fees paid to Non-Executive Directors of comparable companies when undertaking the annual review process. During the year no independent advice was obtained, however reference was made to public information.
Executive pay
The Executive pay and reward framework has three components: base pay and benefits, including superannuation (which comprise the fixed remuneration); short term at risk variable performance incentives; and long term incentives through participation in the Company’s Employee Share Option Plan. The combination of these comprises an Executive’s total remuneration.
Remuneration is structured as a total employment cost package. Executives are offered a competitive base pay that comprises the fixed component of pay and at risk variable rewards. Base pay is set to reflect the market for a comparable role and is reviewed annually to ensure the Executive’s pay is competitive with the market. An Executive’s pay is also reviewed on promotion.
Fixed remuneration
Fixed remuneration is reviewed annually by the Remuneration Committee. The process consists of a review of relevant comparative remuneration in the market and internally and, where appropriate, external advice on policies and practices. The Committee has access to external, independent advice where necessary.
Variable remuneration
The Company’s variable remuneration comprises short term and long term incentives. The objective of the short term incentive program is to link the achievement of the Company's operational targets with the remuneration received by the executives charged with the responsibility of meeting those targets.
The short term incentives, comprised of annual cash bonuses, are paid if certain Key Performance Indicators (KPI’s) are attained in the relevant period as approved by the Remuneration Committee and the Board. Long term incentives comprise equity instruments where the incentive involves the time-based vesting of options on the basis that the employee continues to be employed by the Company and is eligible under the Company’s Employee Share Option Plan.
Actual payments granted to each senior manager depend on the extent to which specific operating targets or KPI’s set at the beginning of the financial year are met and can also be awarded at the discretion of the Board of Directors.
The aggregate of annual payments available for executives across the Company is subject to the approval of the Remuneration Committee and the Board. Payments made are delivered as a cash bonus in the following reporting period or in the case of an equity component, it is pursuant to the employment contract terms and as approved by shareholders.
The Company rewards its management and executives by way of employee share options, with an exercise price typically greater than the market price of shares at the date of the issue of the options. The issue of options is not linked to performance conditions because by setting the option price at a level above the current share price at the time the options are granted provides incentive for management to improve the Company’s performance.
For
per
sona
l use
onl
y

Directors’ report (continued)
Remuneration report – audited (continued)
10 AUSTRALIAN RENEWABLE FUELS LIMITED
Performance criteria
Performance criteria are linked to the short term incentive program through the setting of key performance indicators relevant to each management position. The performance criteria are set by the Board and may include, but are not limited to:
i. Financial and Operational targets linked to achievement of the Company’s annual profit budgets as determined by the
Board from time to time;
ii. Strategic initiatives that provide for specific opportunities to be presented to the board by management from time to
time such as mergers and acquisitions that are value-accretive, and the successful implementation of those initiatives;
iii. Corporate development matters including employment, retention and remuneration of core personnel, leadership and
succession, cultural development and communication activities; and
iv. Risk management, including management and monitoring of material business risks. This includes maintaining a
sound framework and controls in regards to safety and environmental issues.
iii. Relationship between the remuneration policy and Company performance
The achievement of Company strategic objectives is the key focus of the efforts of the Company. As indicated above, over the course of each financial year, the Board, through the Remuneration Committee reviews the Company’s Executive remuneration policy to ensure the remuneration framework remains focused on driving and rewarding Executive performance, while being closely aligned to the achievement of Company strategic objectives and the creation of shareholder value.
Total Shareholder Return is normally measured by the movement in share price from the start to the end of each financial year and dividends paid. No dividends have been declared in the past five financial years or for the current financial year. As the Company remains in the growth phase of its life cycle, shareholder returns do not correlate with revenues and losses reported in any of the recent financial years. Shareholder returns are more dependent on the future expectation of Company performance rather than Company earnings.
The table below sets out summary information regarding the consolidated entity’s earnings and movement in shareholder wealth for the five years to 30 June 2012.
6 Months to 6 Months to 12 Months to 12 Months to 12 Months to 12 Months to 12 Months to
30 June 12 31 December 11 30 June 12 30 June 11 30 June 10 30 June 09 30 June 08
Revenue 24,385,002 13,912,050 38,297,052 6,426,355 2,867,263 2,006,498 5,312,017
Net (loss) before tax (2,481,578) (4,754,215) (7,235,793) (8,128,336) (3,356,922) (6,269,779) (61,822,762)
Net (loss) after tax (2,481,578) (4,754,215) (7,235,793) (8,128,336) (3,356,922) (6,269,779) (61,822,762)
Share price at start of
year (cents)- - 2.2 1.2 1.2 2.6 25.3
Share price at end of
year (cents)- - 1.1 2.2 1.1 1.2 2.6
Dividends paid (cents) - - - - - - -
Loss per share from continuing operations (cents)
Basic (0.13) (0.26) (0.34) (0.71) (0.53) (1.93) (22.02)
Diluted (0.13) (0.26) (0.34) (0.71) (0.53) (1.93) (22.02)
For
per
sona
l use
onl
y

Annual Financial Report 2012 11
iv. Remuneration of Directors and key management personnel
Equity instruments - options (note 31)
During the financial year the Board of Directors approved and the Company issued 120,000,000 options to key management personnel. The holders of these options and unallocated shares entitle the holder to acquire one share by way of issue.
Modification of terms of equity-settled share-based payment transactions
No terms of equity-settled share-based payment transactions (including options granted as compensation to key management personnel) have been altered or modified by the issuing entity during the reporting period or prior period.
Post
Employment
2012
Salary &
Fees
Short
term
incentives Allowance
Termination
Payments
Super-
annuation
Options
expensed
in year (i)
Options as
proportion of
total
remuneration Total
$ $ $ $ $ $ % $
Andrew White(ii) 300,000 275,000 - - 27,000 38,387 6.0 640,387
Tom Engelsman(iii) 125,000 50,000 7,500 280,937 11,385 147,878 23.7 622,700
Julien Playoust(iv) 55,000 - - - - 5,605 9.2 60,605
Michael Costello 50,000 - - - 5,061 8,408 13.2 63,469
Philip Garling 79,425 - - - - 8,408 9.6 87,833
Deborah Page(v) 21,169 - - - 1,905 - - 23,074
Other key management personnel
Christopher Attw ood(vi) 133,223 50,000 - - 10,525 15,841 7.6 209,589
Michael Burgess (vii) 78,172 20,125 - - 6,504 11,881 10.2 116,682
Stephan Scheffer(viii) 87,498 20,000 - 223,091 17,063 - - 347,652
929,487 415,125 7,500 504,028 79,443 236,408 2,171,991
(i ) During the 2012 f inancial year 120,000,000 opt ions were issued to key management personnel.
(i i ) Andrew White was appointed
as M anaging Director on 1 July (i i i ) Tom Engelsman resigned on 14 December 2011.
(i v) Julien Playoust was remunerated via a service company.
(v) Deborah Page was appointed as Non-Execut ive Director on 21 M arch 2012.
(v i ) Christopher Attwood was appointed as Chief Operat ing Off icer on 1 November 2011.
(v i i ) M ichael Burgess was appointed as Chief Financial Off icer on 6 February 2012.
Post
Employment
2011
Salary &
Fees
Short
term
incentives Allowance
Termination
Payments
Super-
annuation
Options
expensed
in year (i)
Options as
proportion of
total
remuneration Total
$ $ $ $ $ $ % $
Executive director
Tom Engelsman(ii) 227,084 - 18,000 - 20,573 185,482 41.1 451,138
Non-executive directors
Robert Scott 100,000 - - - - 46,505 31.7 146,505
Julien Playoust 30,000 - - - - 46,505 60.8 76,505
Charles Gullotta 70,000 - - - - 46,505 39.9 116,505
Michael Costello 6,246 - - - - - - 6,246
Philip Garling 6,246 - - - - - - 6,246
Other key management personnel
Stephan Scheffer(iii) 155,833 - - - 13,125 15,432 8.4 184,390
William Day 98,957 - - - 7,554 37,180 25.9 143,691
Emil de Graaf 120,000 - 2,278 - 10,800 - - 133,078
Lorin Sole - - - 42,250 - - - 42,250
814,366 - 20,278 42,250 52,051 377,609 1,306,554
(i ) During the 2011 f inancial year 7,500,000 opt ions were issued to key management personnel.
(i i ) Tom Engelsman resigned on 14 December 2011.
(i i i ) Stephan Scheffer resigned as Company Secretary on 11 August 2011 and departed as Chief Financial Off icer on 11 January 2012.
Equity (long term)
(v i i i ) Stephan Scheffer resigned as Company Secretary on 11 August 2011 and departed as Chief Financial Off icer on 11 January 2012.
Equity (long term)
Executive directors
Non-executive directors
Short-term benefits
Short term employee benefits
For
per
sona
l use
onl
y

Directors’ report (continued)
Remuneration report – audited (continued)
12 AUSTRALIAN RENEWABLE FUELS LIMITED
Analysis of options over equity instruments granted as compensation
Details of vesting profiles of the options granted as remuneration to each key management person of the Company are summarised in the table below.
The options were provided during the financial year at no cost to the recipients. In general, upon vesting, the holder will be entitled to exercise their options and acquire one fully paid ordinary share in the Company for each option. 3.0 cents is payable upon exercise of each option by other Key Management personnel and 4.0 cents is payable upon exercise of each option by Non-Executive Directors granted during the financial year. During the year, 47,545,000 options expired or lapsed in accordance with the respective Employee Services Agreements and or the Employee Share Option Plan. During the year no Key Management personnel or Directors exercised any options that were granted to them as part of their compensation. Including the share-based payments granted during the year as set out above, the details of all share-based payment arrangements in existence for key management during the current and comparative reporting periods are summarised below.
NameNumber
granted
Number
vested
Expensed in
year
Value of
options granted
at grant date (i), (ii)
Value of
options lapsed
at the date of
lapse (iii)
$ $ $
Directors
Andrew White 45,000,000 - 38,387 180,109 -
Tom Engelsman(iv) - 30,000,000 147,878 441,093 441,093
Julien Playoust 10,000,000 - 5,605 117,725 -
Michael Costello 15,000,000 - 8,408 66,315 -
Philip Garling 15,000,000 - 8,408 66,315 -
Other key management personnel
Chris Attw ood 20,000,000 - 15,841 111,542 -
Michael Burgess 15,000,000 - 11,881 83,657 -
Stephan Scheffer - - - 43,496 43,496
(i i ) The fair value of the opt ions at grant date was based on the market price at grant date.
(i i i ) Value of opt ions lapsing during the period due to the failure to exercise the opt ions before the expiry date.
(i v) Tom Engelsman resigned on 14 December 2011. 30,000,000 opt ions expired on 14 April 2012.
(i ) The value of opt ions granted is recognised in compensation on a straight line basis over the vest ing period of the grant, in accordance with Australian accounting standards.
During the financial year
Exercise
price
Fair value at
grant date
$ $
July 2007 45,000 June 2012 0.60 0.03
March 2008 5,360,000 March 2013 0.10 0.03
September 2008 1,500,000 September 2013 0.10 0.03
August 2009 1,750,000 September 2014 0.02 0.01
November 2009 50,000,000 September 2014 0.02 0.01
December 2011 45,000,000 December 2014 0.03 0.01
January 2012 4,000,000 December 2012 0.02 0.01
March 2012 57,500,000 February 2015 0.03 0.01
March 2012 40,000,000 March 2015 0.04 0.01
Option series grant date
Number of
options
Expiry
date
For
per
sona
l use
onl
y

Annual Financial Report 2012 13
Term
Duration of contract
Termination by Company for cause
3 years
Conditions
Employment may be terminated
immediately w ithout notice if the
Executive commits any act or
omission justifying summary
dismissal at common law
6 months’ notice
12 months’ notice
6 months’ notice
6 months’ noticeVoluntary termination by Executive
Termination by Company w ithout cause
Managing Director and key
management
Key management
Managing Director
Key management
Managing Director
Managing Director, and key
management
Position
v. Key terms of service agreements
The remuneration and other terms of employment for the Managing Director and Key Management are formalised in service agreements. Each of these agreements makes provision for a fixed remuneration component, a short-term cash incentive and options as a long-term incentive. The material terms of the service agreements are set out below.
Signed in accordance with a resolution of the Directors made pursuant to section 298(2) of the Corporations Act 2001.
On behalf of the Directors
Philip Garling
Chairman
Melbourne, 6 September 2012
For
per
sona
l use
onl
y

Corporate Governance Statement
Annual Report 14
The Board of Directors of Australian Renewable Fuels Limited is responsible for the corporate governance of the Company. The Board guides and monitors the business and affairs of Australian Renewable Fuels Limited on behalf of the shareholders by whom they are elected and to whom they are accountable. The table below summarises the Company's compliance with the ASX Corporate Governance Council's Principles and Recommendations.
Principles and Recommendations Compliance Comply
Principle 1 – Lay solid foundations for management and oversight
1.1 Establish the functions reserved to the Board of Directors (Board) of Australian Renewable Fuels Limited (Company) and those delegated to manage and disclose those functions.
The Board is responsible for the overall corporate governance of the Company.
Complies.
The Board has adopted a Board Charter that formalises its roles and responsibilities and defines the matters that are reserved for the Board and specific matters that are delegated to management.
The Board has adopted a Delegations of Authority that sets limits of authority for senior executives.
On appointment of a Director, the Company issues a letter of appointment setting out the terms and conditions of their appointment to the Board.
1.2 Disclose the process for evaluating the performance of senior executives.
Senior executives prepare strategic objectives that are reviewed and signed off by the Board. These objectives must then be met by senior executives as part of their key performance targets. The MD then reviews the performance of the senior executives against those objectives. The Board reviews the Managing Director’s (MD’s) compliance against his and the Company’s objectives. These reviews occur annually.
Complies.
1.3 Provide the information indicated in Guide to reporting on Principle 1.
A Board Charter has been disclosed on the Company’s website and is summarised in this Corporate Governance Statement.
Complies.
The performance evaluation of the Board is carried out annually by the Chair however is not documented in a policy.
Does not Comply. Whilst an evaluation process will be undertaken; details have not yet been documented in a policy.
The Board conducted a performance evaluation for senior executives in the financial year in accordance with the process above.
Complies.
Principle 2 – Structure the Board to add value
2.1 A majority of the Board should be independent Directors.
The majority of the Board’s Directors are independent. Complies.
Philip Garling is an independent Non-Executive Director. Andrew White is an Executive Director. Michael Costello is an independent Non- Executive Director. Deborah Page is an independent Non-Executive Director. Julien Playoust is a non-independent Non-Executive Director.
2.2 The Chair should be an independent Director.
Philip Garling is an independent Non-Executive Director of the Board.
Complies.
2.3 The roles of Chair and Managing Director should not be exercised by the same individual.
Philip Garling is the Chairman and Andrew White is the Managing Director.
Complies.
2.4 The Board should establish a nomination committee.
Given the small size of the Board, the full Board serves as the Nomination Committee.
Complies.
The Board has undertaken a review of the mix of skills and experience on the Board in light of the Company’s principal activities and direction, and has considered diversity in succession planning. The Board considers the current mix of skills and experience of members of the Board and its key management is currently appropriate to meet the requirements of the Company.
For
per
sona
l use
onl
y

Annual Financial Report 2012 15
Principles and Recommendations Compliance Comply
The Board supports the nomination and re-election of the Directors at the Company’s forthcoming Annual General Meeting.
2.5 Disclose the process for evaluating the performance of the Board, its committees and individual Directors.
The Company conducts the process for evaluating the performance of the Board, its committees and individual Directors as outlined in the Board Charter which is available on the Company’s website.
Complies.
The Board’s induction program provides incoming Directors with information that will enable them to carry out their duties in the best interests of the Company. This includes supporting ongoing education of Directors for the benefit of the Company.
2.6 Provide the information indicated in the Guide to reporting on Principle 2.
This information has been disclosed (where applicable) in the Directors’ Report attached to this Corporate Governance Statement.
Complies.
Philip Garling, Michael Costello and Deborah Page are independent Directors of the Company. A Director is considered independent when he/she substantially satisfies the test for independence as set out in the ASX Corporate Governance Recommendations.
The Board has sought external legal opinion of its Independence and the Independence of Directors. In addition, an Independence Policy has been established.
Members of the Board are able to take independent professional advice at the expense of the Company.
The Company has established a Remuneration Committee. The Board has undertaken a review of the mix of skills and experience on the Board in light of the Company’s principal activities and direction, and has considered diversity in succession planning. The Board considers the current mix of skills and experience of members of the Board and its key management is sufficient to meet the requirements of the Company.
In accordance with the information suggested in Guide to Reporting on Principle 2, the Company has disclosed full details of its Directors in the Director’s Report attached to this Corporate Governance Statement. Other disclosure material on the Structure of the Board has been made available on the Company’s website.
Principle 3 – Promote ethical and responsible decision making
3.1 Establish a code of conduct and disclose the code or a summary of the code.
The Board has adopted a code of conduct. The code establishes a clear set of values that emphasise a culture encompassing strong corporate governance, sound business practices and good ethical conduct. The code is available on the Company’s website.
Complies.
3.2 Companies should establish a policy concerning diversity and disclose the policy or a summary of that policy. The policy should include requirements for the Board to establish measurable objectives for achieving gender diversity and to assess annually both the objectives and progress in achieving them.
The Board has undertaken a review of the mix of skills and experience on the Board in light of the Company’s principal activities and direction.
Complies.
The Company has adopted a Diversity Policy that considers the benefits of diversity, ways to promote a culture of diversity, factors to be taken into account in the selection process of candidates for Board and key management positions in the Company, education programs to develop skills and experience in preparation for Board and key management positions.
Complies.
3.3 Provide the information indicated in Guide to reporting on Principle 3.
The Board has adopted a Diversity Policy Complies.
The Board supports diversity of employees with differing skills, values and backgrounds and experiences.
This Corporate Governance Statement does not include a statement of the measurable objectives for achieving gender diversity.
However as a measurement of gender diversity, the proportion of women employees in the consolidated entity as at 30 June 2012 are as follows:
For
per
sona
l use
onl
y

Corporate governance statement (continued)
16 AUSTRALIAN RENEWABLE FUELS LIMITED
Principles and Recommendations Compliance Comply
Women on the Board: 20%
Women in senior Executive roles: 0% Does not Comply.
Women in management position: 0% With respect to a Diversity Policy, the measurable objectives for achieving greater gender diversity have not been established.
Women in the organisation: 10% However the Board is aware of the disclosure requirements and is in the process of establishing these objectives.
Principle 4 – Safeguard integrity in financial reporting
4.1 The Board should establish an audit committee.
The Board has established an audit and risk committee which operates under an audit and risk committee Charter to focus on issues relevant to the integrity of the Company’s financial reporting.
Complies.
4.2 The audit committee should be structured so that it consists of only Non-Executive Directors, a majority of independent Directors, is chaired by an independent Director who is not chair of the Board and have at least 3 members.
- The Committee has four members, three of which
are Non-Executive independent Directors.
Complies.
- Deborah Page, an independent Non-Executive
Director, is the Chair.
4.3 The audit committee should have a formal Charter.
The Board has adopted an audit and risk Charter. Complies.
This Charter is available on the Company’s website.
4.4 Provide the information indicated in Guide to reporting on Principle 4.
In accordance with the information suggested in Guide to Reporting on Principle 2, this has been disclosed in the Directors’ Report attached to this Corporate Governance Statement and is summarised in this Corporate Governance Statement.
Complies.
The members of the audit and risk committee are appointed by the Board and recommendations from the committee are presented to the Board for further discussion and resolution. The audit and risk committee held three meetings during the period to the date of the Directors Report and meets at least twice per annum.
The audit and risk Charter, and information on procedures for the selection and appointment of the external auditor, and for the rotation of external audit engagement partners (which is determined by the audit committee), is available on the Company’s website.
Principle 5 – Make timely and balanced disclosure
5.1 Establish written policies designed to ensure compliance with ASX Listing Rules disclosure requirements and to ensure accountability at a senior Executive level for that compliance and disclose those policies or a summary of those policies.
The Company has adopted a continuous disclosure policy, to ensure that it complies with the continuous disclosure regime under the ASX Listing Rules and the Corporations Act 2001.
Complies.
This policy is available on the Company’s website.
5.2 Provide the information indicated in the Guide to reporting on Principle 5.
The Company’s continuous disclosure policy is available on the Company’s website.
Complies. For
per
sona
l use
onl
y

Annual Financial Report 2012 17
Principles and Recommendations Compliance Comply
Principle 6 – Respect the rights of shareholders
6.1 Design a communications policy for promoting effective communication with shareholders and encouraging their participation at general meetings and disclose that policy or a summary of that policy.
The Company has adopted a Shareholder Communications Policy. The Company uses its website (www.ARfuels.com.au), annual report, market announcements, media disclosures and webcasting to communicate with its shareholders, as well as encourages participation at general meetings.
Complies.
6.2 Provide the information indicated in the Guide to reporting on Principle 6.
The Company’s Shareholder Communications Policy is available on the Company’s website.
Complies.
Principle 7 – Recognise and manage risk
7.1 Establish policies for the oversight and management of material business risks and disclose a summary of these policies.
The Company has adopted a risk management statement within the Audit and Risk Committee Charter.
Does Not Comply. A summary statement regarding Risk Management has been published on the website; a full policy will be completed during the year. Risk Management is discussed at each Board Meeting.
The Audit and Risk Charter is available on the Company’s website and is summarised in this Corporate Governance Statement.
7.2 The Board should require management to design and implement the risk management and internal control system to manage the Company’s material business risks and report to it on whether those risks are being managed effectively. The Board should disclose that management has reported to it as to the effectiveness of the Company’s management of its material business risks.
The Company has identified key risks within the business. In the ordinary course of business, management monitor and manage these risks.
Complies.
Key operational and financial risks are presented to and reviewed by the Board at each Board meeting.
7.3 The Board should disclose whether it has received assurance from the Managing Director and Chief Financial Officer that the declaration provided in accordance with section 295A of the Corporations Act is founded on a sound system of risk management and internal control and that the system is operating efficiently and effectively in all material respects in relation to the financial reporting risks.
The Board has received a statement from the Managing Director and Chief Financial Officer that the declaration provided in accordance with section 295A of the Corporations Act 2001 is founded on a sound system of risk management and internal control and that the system is operating efficiently and effectively in all material respects in relation to the financial reporting risks.
Complies.
7.4 Provide the information indicated in Guide to reporting on Principle 7.
The Board has adopted an Audit and Risk Charter which includes a statement of the Company’s risk policies.
Complies.
This Charter is available on the Company’s website and is summarised in this Corporate Governance Statement.
The Company has identified key risks within the business and has received a statement of assurance from the Managing Director and Chief Financial Officer.
Principle 8 – Remunerate fairly and responsibly
8.1 The Board should establish a remuneration committee.
The Board has established a Remuneration Committee and has adopted a remuneration Charter.
Complies.
The remuneration committee:
- consists of a majority of independent Directors; - is chaired by a Non-Executive Director; and - has four members.
8.2 Clearly distinguish the structure of Non-Executive Directors’ remuneration from that of Executive Directors and senior executives.
The Company complies with the guidelines for Executive remuneration packages and Non-Executive Director remuneration.
Complies.
No senior Executive is involved directly in deciding their own remuneration.
For
per
sona
l use
onl
y

Corporate governance statement (continued)
18 AUSTRALIAN RENEWABLE FUELS LIMITED
Principles and Recommendations Compliance Comply
8.3 Provide the information indicated in the Guide to reporting on Principle 8.
The Board has adopted a Remuneration Committee Charter.
Complies.
The Company does not have any schemes for retirement benefits other than statutory superannuation for Directors.
ARfuels’ corporate governance practices were in place for the financial year ended 30 June 2012 and to the date of signing the Directors’ Report.
Various corporate governance practices are discussed within this statement. For further information on corporate governance policies adopted by ARfuels, refer to our website: www.ARfuels.com.au
Board functions
The role of the Board of ARfuels is as follows:
- Representing and serving the interests of shareholders by overseeing and appraising the strategies, policies and performance of the Company. This includes overviewing the financial and human resources the Company has in place to meet its objectives and the review of management performance;
- Protecting and optimising Company performance and building sustainable value for shareholders in accordance with any duties and obligations imposed on the Board by law and the Company’s constitution and within a framework of prudent and effective controls that enable risk to be assessed and managed;
- Responsible for the overall Corporate Governance of ARfuels and its controlled entities, including monitoring the strategic direction of the Company and those entities, formulating goals for management and monitoring the achievement of those goals;
- Setting, reviewing and ensuring compliance with the Company’s values (including the establishment and observance of high ethical standards); and
- Ensuring shareholders are kept informed of the Company’s performance and major developments affecting its state of affairs.
Responsibilities/functions of the Board include:
- selecting, appointing and evaluating from time to time the performance of, determining the remuneration of, and
planning for the successor of the Managing Director (MD);
- reviewing procedures in place for appointment of key management and monitoring of its performance, and for
succession planning. This includes ratifying the appointment and the removal of the Chief Financial Officer and the
Company Secretary;
- input into and final approval of management development of corporate strategy, including setting performance
objectives and approving operating budgets;
- reviewing and guiding systems of risk management and internal control and legal compliance. This includes reviewing
procedures in place to identify the main risks associated with the Company’s businesses and the implementation of
appropriate systems to manage these risks;
- monitoring corporate performance and implementation of strategy and policy;
- approving major capital expenditure, acquisitions and divestitures, and monitoring capital management;
- monitoring and reviewing management processes in place aimed at ensuring the integrity of financial and other
reporting;
- monitoring and reviewing policies and processes in place relating to work health and safety, compliance with laws, and
the maintenance of high ethical standards; and
- performing such other functions as are prescribed by law or are assigned to the Board.
In carrying out its responsibilities and functions, the Board may delegate any of its powers to a Board committee, a Director, employee or other person subject to ultimate responsibility of the Directors under the Corporations Act 2001.
Matters which are specifically reserved for the Board or its committees include the following:
- appointment of a Chair;
- appointment and removal of the MD;
- appointment of Directors to fill a vacancy or as additional Directors;
- establishment of Board committees, their membership and delegated authorities;
- approval of dividends;
- development and review of corporate governance principles and policies;
- approval of major capital expenditure, acquisitions and divestitures in excess of authority levels delegated to
management;
- calling of meetings of shareholders and;
- any other specific matters nominated by the Board from time to time.
For
per
sona
l use
onl
y

Annual Financial Report 2012 19
Structure of the Board
The Company’s constitution governs the regulation of meetings and proceedings of the Board.
The Board determines its size and composition, subject to the terms of the constitution. The Board does not believe that it should establish a limit on tenure other than stipulated in the Company constitution.
While tenure limits can help to ensure that there are fresh ideas and viewpoints available to the Board, they hold the disadvantage of losing the contribution of Directors who have been able to develop, over a period of time, increasing insight in the Company and its operation and, therefore, an increasing contribution to the Board as a whole. It is intended that the Board should comprise a majority of independent Non-Executive Directors and comprise Directors with a broad range of skills, expertise and experience from a diverse range of backgrounds. It is also intended that the Chair should be an independent Non-Executive Director. The Board regularly reviews the independence of each Director in light of the interests disclosed to the Board.
The Board only considers Directors to be independent where they are independent of management and free of any business or other relationship that could materially interfere with, or could reasonably be perceived to interfere with, the exercise of their unfettered and independent judgment. The Board has adopted a definition of independence based on that set out in Principle 2 of the ASX Corporate Governance Revised Principles and Recommendations. The Board will review the independence of each Director in light of interests disclosed to the Board from time to time.
In accordance with the definition of independence above, and the materiality thresholds set, the following Directors of ARfuels are considered to be independent:
Name Position
Philip Garling Non-Executive Director, Chairman
Michael Costello Non-Executive Director
Deborah Page Non-Executive Director
There are procedures in place, agreed by the Board, to enable Directors in furtherance of their duties to seek independent professional advice at the Company's expense.
The appointment date of each Director in office at the date of this report is as follows:
Name Position Appointment date
Philip Garling Non-Executive Director, Chairman Appointed May 2011 and Chairman November 2011
Andrew White Managing Director Appointed July 2011
Michael Costello Non-Executive Director Appointed May 2011
Deborah Page Non-Executive Director Appointed March 2012
Julien Playoust Non-Executive Director Appointed April 2009
Further details on each Director can be found in the Directors’ Report attached to this Corporate Governance Statement.
Trading in Company Securities Policy
Under the Company's Guidelines for Dealing in Securities Policy, Directors, officers and employees of the Company should not trade in the Company’s securities when he or she is in possession of price sensitive information that is not generally available to the market.
Directors and key management are likely to be in possession of unpublished price sensitive information concerning the Company by virtue of their position within the Company. Therefore those persons are restricted from dealing in the Company’s securities whilst in possession of price sensitive information before release to the ASX (Non-Trading Period).
In addition, Directors, officers and employees can only deal in the Company’s securities after having first obtained clearance from the Company, and must notify the Company Secretary when a trade has occurred.
As required by the ASX Listing Rules, the Company notifies the ASX of any transaction conducted by Directors in the securities of the Company within five days of the transaction taking place.
The Company’s Trading in Company Securities Policy has been issued to ASX and can be found on the Company’s website.
For
per
sona
l use
onl
y

Corporate governance statement (continued)
20 AUSTRALIAN RENEWABLE FUELS LIMITED
Audit and Risk Committee
The Board has established an Audit and Risk Committee which operates under a Charter approved by the Board. It is the Board’s responsibility to ensure that an effective internal control framework exists within the entity. This includes internal controls to deal with both the effectiveness and efficiency of significant business processes, the safeguarding of assets, the maintenance of proper accounting records, and the reliability of financial information as well as non-financial considerations such as the benchmarking of operational key performance indicators. The Board has delegated responsibility for establishing and maintaining a framework of internal control and ethical standards to the Audit and Risk Committee.
The Committee also provides the Board with additional assurance regarding the reliability of financial information for inclusion in the financial reports.
All Non-Executive members of the Board are members of the Audit Committee. The Audit Committee is Chaired by Ms Deborah Page.
Whilst operating as a separate Committee, the Audit and Risk Committee provide the Board with additional assurance regarding the reliability of financial information for inclusion in the financial reports.
For details on the number of meetings of the Audit and Risk Committee held during the year and the attendees at those meetings, refer to the Directors’ Report.
Risk
The responsibility of overseeing risk falls within the Charter of the Audit and Risk Committee. The Company identifies areas of risk within the Company and management and the Board continuously undertake a risk assessment of the Company’s operations, procedures and processes. The risk assessment is aimed at identifying the following:
- a culture of risk control and the minimisation of risk throughout the Company, identified through natural or instinctive process by employees of the Company;
- a culture of risk control that can easily identify risks as they arise and amend practices;
- the installation of practices and procedures in all areas of the business that are designed to minimise an event or incident that could have a financial or other effect on the business and its day to day management; and
- adoption of these practices and procedures to minimise many of the standard commercial risks, i.e. taking out the appropriate insurance policies, or ensuring compliance reporting is up to date.
Managing Director and CFO certification
The Managing Director and Chief Financial Officer have given a written declaration to the Board required by section 295A of the Corporations Act 2001 that in their view:
- the Company’s financial report is founded on a sound system of risk management and internal compliance and control which implements the financial policies adopted by the Board; and
- the Company’s risk management and internal compliance and control system is operating effectively in all material respects.
Performance
The performance of the Board and key Executives is reviewed regularly using both measurable and qualitative indicators, as noted in performance criteria in section (a).
On an annual basis, the Chair undertakes an assessment of the Board in light of their performance and contribution to the Company.
The Board assess the performance of the Managing Director against an agreed set of performance targets.
Remuneration
It is the Company’s objective to provide maximum stakeholder benefit from the retention of a high quality Board and Executive team by remunerating Directors and key Executives fairly and appropriately with reference to relevant employment market conditions. To assist in achieving this objective, the Board, in assuming the responsibilities of assessing remuneration to employees, links the nature and amount of Executive Directors’ and officers’ remuneration to the Company’s financial and operational performance. The expected outcomes of the remuneration structure are:
- retention and motivation of key Executives;
- attraction of high quality management to the Company; and
- performance incentives that allow Executives to share in the success of ARfuels.
For a more comprehensive explanation of the Company’s remuneration framework and the remuneration received by Directors and key Executives in the current period, please refer to the Remuneration Report, which is contained within the Directors’ Report.
There is no scheme to provide retirement benefits to Non-Executive (or Executive) Directors, other than statutory superannuation.
The Remuneration Committee is responsible for determining and reviewing compensation arrangements for the Directors themselves and the Managing Director and Executive team.
For
per
sona
l use
onl
y

Declaration of Auditor’s independence
Annual Report 21
6 September 2012
The Board of Directors
Australian Renewable Fuels Limited
Level 5, 409 St Kilda Road
MELBOURNE VIC 3000
Dear Board Members
Australian Renewable Fuels Limited
In accordance with section 307C of the Corporations Act 2001, I am pleased to provide the following
declaration of independence to the directors of Australian Renewable Fuels Limited.
As lead audit partner for the audit of the financial statements of Australian Renewable Fuels Limited for the
year ended 30 June 2012, I declare that to the best of my knowledge and belief, there have been no
contraventions of:
(i) the auditor independence requirements of the Corporations Act 2001 in relation to the audit; and
(ii) any applicable code of professional conduct in relation to the audit.
Yours sincerely,
DELOITTE TOUCHE TOHMATSU
Ian Sanders
Partner
Chartered Accountant
Liability limited by a scheme approved under Professional Standards Legislation.
Member of Deloitte Touche Tohmatsu Limited
Deloitte Touche Tohmatsu
ABN 74 490 121 060
550 Bourke Street
Melbourne VIC 3000
GPO Box 78
Melbourne VIC 3001 Australia
DX: 111
Tel: +61 3 9671 7000
Fax: +61 3 9671 7001
www.deloitte.com.au
For
per
sona
l use
onl
y

22 AUSTRALIAN RENEWABLE FUELS LIMITED
Statement of comprehensive income for the financial year ended 30 June 2012
The Statement of comprehensive income should be read in conjunction with the accompanying notes.
Note 2012 2011
$ $
Revenue from operations 3 38,297,052 6,426,355
Cost of goods sold (33,872,312) (4,506,719)
Inventory w rite off - (526,697)
Gross profit 4,424,740 1,392,939
Direct costs (3,858,696) (3,810,478)
Corporate and administration expenses (2,870,083) (2,496,479)
Staff costs (3,013,175) (2,303,879)
Other revenue 3 1,780,882 141,688
Finance income 3 87,211 69,884
Depreciation and amortisation expenses 4 (2,355,295) (1,015,948)
Finance costs 5 (1,431,377) (106,063)
Loss before tax (7,235,793) (8,128,336)
Income tax (expense) 6 - -
Loss for the year (7,235,793) (8,128,336)
Attributed to:
Owners of the parent (7,172,034) (8,063,938)
Non-controlling interest (63,759) (64,398)
(7,235,793) (8,128,336)
Other comprehensive income
Exchange reserve arising on translation of foreign operations (810) 2,447
Other comprehensive income for the year net of tax (810) 2,447
Total comprehensive income for the year (7,236,603) (8,125,889)
Total comprehensive income attributable to:
Ow ners of the parent (7,172,844) (8,061,491)
Non-controlling interest 20 (63,759) (64,398)
(7,236,603) (8,125,889)
Gain/(Loss) per share
From continuing and continued operations:
Basic (cents per share) 30 (0.34) (0.71)
Diluted (cents per share) 30 (0.34) (0.71)
Consolidated
For
per
sona
l use
onl
y

Annual Financial Report 2012 23
Statement of financial position as at 30 June 2012
The Statement of financial position should be read in conjunction with the accompanying notes.
Note 2012 2011
$ $
Current assets
Cash and cash equivalents 24 1,981,163 3,528,363
Trade and other receivables 7 4,067,325 871,945
Inventories 8 3,255,265 1,741,747
Other 9 2,595,245 436,621
Total current assets 11,898,998 6,578,676
Non-current assets
Property, plant and equipment 10 33,529,391 5,212,986
Intangible assets 11 - 90
Other 12 678,901 720,930
Total non-current assets 34,208,292 5,934,006
Total assets 46,107,290 12,512,682
Current liabilities
Bank overdraft 15, 24 5,862,547 -
Trade and other payables 13 11,335,568 2,812,832
Provisions 14 302,389 182,010
Amounts payable on acquisition 16 4,142,875 -
Total current liabilities 21,643,379 2,994,842
Non-current liabilities
Amounts payable on acquisition 16 1,301,000 -
Provisions 14 123,860 -
Other 15 13,650,000 -
Total non-current liabilities 15,074,860 -
Total liabilities 36,718,239 2,994,842
Net assets 9,389,051 9,517,840
Equity
Issued capital 17 124,176,890 114,576,984
Reserves 18 1,515,136 4,008,038
Accumulated losses 19 (116,101,098) (108,929,064)
Equity attributable to ow ners of the company 9,590,928 9,655,958
Non-controlling interests 20 (201,877) (138,118)
Total equity 9,389,051 9,517,840
Consolidated
For
per
sona
l use
onl
y

24 AUSTRALIAN RENEWABLE FUELS LIMITED
Statement of changes in equity for the financial year ended 30 June 2012
The Statement of changes in equity should be read in conjunction with the accompanying notes.
$ $ $ $ $ $ $ $ $
Balance at 1 July 2010 104,561,260 225,162 (471,008) 1,469,904 - (100,865,126) 4,920,192 (73,720) 4,846,472
Movement in foreign exchange values - - 2,447 - - - 2,447 - 2,447
Loss for the year - - - - - (8,063,938) (8,063,938) (64,398) (8,128,336)
Total comprehensive income for the
Period - - 2,447 - - (8,063,938) (8,061,491) (64,398) (8,125,889)
Shares issued during the year 5,027,714 - - - - - 5,027,714 - 5,027,714
Options issued during the year - - - 4,492,920 - - 4,492,920 - 4,492,920
Recognition of share-based payments - 386,266 - - - - 386,266 - 386,266
Advances from GBTI - - - - 250,000 - 250,000 - 250,000
Exercise of options 5,638,193 - - (2,347,653) - - 3,290,540 - 3,290,540
Share issue costs (650,183) - - - - - (650,183) - (650,183)
Balance at 30 June 2011 114,576,984 611,428 (468,561) 3,615,171 250,000 (108,929,064) 9,655,958 (138,118) 9,517,840
Balance at 1 July 2011 114,576,984 611,428 (468,561) 3,615,171 250,000 (108,929,064) 9,655,958 (138,118) 9,517,840
Movement in foreign exchange values - - (810) - - - (810) (810)
Loss for the year - - - - - (7,172,034) (7,172,034) (63,759) (7,235,793)
Total comprehensive income for the
Period - - (810) - - (7,172,034) (7,172,844) (63,759) (7,236,603)
Shares issued during the year 272,000 - - - - - 272,000 - 272,000
Options issued during the year - - - - - - - - -
Recognition of share-based payments - 267,373 - - - - 267,373 - 267,373
Advances from GBTI - - - - 1,750,000 - 1,750,000 - 1,750,000
Advances from GBTI converted to equity 913,981 - - 1,086,019 (2,000,000) - - - -
Exercise of options 8,542,077 - - (3,595,484) - - 4,946,593 - 4,946,593
Share issue costs (128,152) - - - - - (128,152) - (128,152)
Balance at 30 June 2012 124,176,890 878,801 (469,371) 1,105,706 - (116,101,098) 9,590,928 (201,877) 9,389,051
Accumulated
losses
Attributable
to owners of
the parent
Non-
controlling
interests Total
Issued
capital and
contributed
equity
Employee
share option
reserve
Foreign
currency
translation
reserve
General
options
reserve
Other
reserve
For
per
sona
l use
onl
y

Annual Financial Report 2012 25
Cash flow statement for the financial year ended 30 June 2012
The Cash flow statement should be read in conjunction with the accompanying notes.
2012 2011
$ $
Cash flows from operating activities
Receipts from customers 44,086,649 6,849,863
Receipts from R&D grant 868,483 357,768
Payments to suppliers and employees (45,980,721) (13,882,539)
Interest paid (506,220) (169,789)
Net cash (used in) operating activities 24 (1,531,809) (6,844,697)
Cash flows from investing activities
Interest received 91,490 85,604
Payment for plant and equipment (3,594,971) (142,640)
Net overdraft acquired on acquisition 32 (9,181,245) -
Net cash provided by / (used) in investing activities (12,684,726) (57,036)
Cash flows from financing activities
Proceeds from issue of shares 5,133,403 11,405,704
Proceeds from borrow ings - -
Advances from GBTI 1,685,000 250,000
Payment on loans from related parties - (1,350,751)
Payments for share issue costs - (650,183)
Finance lease payments (10,805) (5,910)
Net cash provided by f inancing activities 6,807,598 9,648,860
Net increase / (decrease) in cash and cash equivalents (7,408,937) 2,747,127
Cash and cash equivalents at the beginning of the financial year 3,528,363 778,789
Effect of movement in exchange rates on cash balances (810) 2,447
Cash and cash equivalents at the end of the financial year 24 (3,881,384) 3,528,363
Note
Consolidated
For
per
sona
l use
onl
y

26 AUSTRALIAN RENEWABLE FUELS LIMITED
Notes to the financial statements for the financial year ended 30 June 2012
Note Contents
1 Summary of accounting policies
2 Segment information
3 Revenue
4 Depreciation and amortisation expenses
5 Finance costs
6 Income taxes
7 Trade and other receivables – current
8 Inventories
9 Other current assets
10 Property, plant and equipment
11 Intangibles
12 Other non-current assets
13 Trade and other payables
14 Provisions
15 Borrowings
16 Amounts payable on acquisition
17 Issued capital and contributed equity
18 Reserves
19 Retained earnings
20 Non-controlling interest
21 Commitments
22 Contingent assets and liabilities
23 Subsidiaries
24 Cash flows from operations
25 Non-cash transactions
26 Financial instruments
27 Key management personnel compensation
28 Related party transactions
29 Remuneration of auditors
30 Earnings per share
31 Share-based payments
32 Business combination
33 Subsequent events
34 Parent entity information
For
per
sona
l use
onl
y

Annual Financial Report 2012 27
1. Summary of accounting policies
Statement of compliance
The financial report is a general purpose financial report which has been prepared in accordance with the Corporations Act
2001, Accounting Standards and Interpretations, and complies with other requirements of the law.
The financial statements comprise the consolidated financial statements of the Group.
The financial report has been prepared in accordance with Accounting Standards and Interpretations. Accounting Standards
include Australian equivalents to International Financial Reporting Standards (‘A-IFRS’). Compliance with A-IFRS ensures
that the financial statements and notes of the Group comply with International Financial Reporting Standards ( ‘IFRS’).
Basis of preparation
The financial report has been prepared on the basis of historical cost, except for the revaluation of certain non-current
assets and financial instruments that are measured at revalued amounts or fair values, as explained in the accounting
policies below. Historical cost is based on the fair values of the consideration given in exchange for assets. All amounts are
presented in Australian dollars, unless otherwise noted.
The Group has retained the presentation and classification of items in the financial statements from one period to the next
unless:
i. it is apparent, following a significant change in the nature of the entity’s operations or a review of its financial
statements, that another presentation or classification would be more appropriate having regard to the criteria for
the selection and application of accounting policies in AASB 108; or
ii. an Australian Accounting Standard requires a change in presentation.
The financial statements were authorised for issue by the Directors on 6 September 2012.
Going concern
For the year ended 30 June 2012, the consolidated entity incurred a net loss of $7,235,793 (2011: $8,128,336) and had net
cash outflows from operating activities of $1,531,809 (2011: $6,844,697). As at 30 June 2012 current liabilities exceed
current assets by $9,744,381. As at 30 June 2012 a breach of one covenant with respect to the Groups banking facility
occurred which has been subsequently noted by the bank. It must also be noted however, that for the period 1 January 2012
to 30 June 2012 the Group delivered $4,330,501 in positive operating cash flow which contributed to an overall improvement
in the consolidated cash balance by $2,080,849 for that six month period to a consolidated overdraft (net of cash balances)
position of $3,881,384 as at 30 June 2012.
Notwithstanding the losses incurred from normal operations, the Directors consider it appropriate to prepare the financial
report on a going concern basis, which assumes the continuity of normal business activities and the realisation of assets
and settlement of liabilities in the ordinary course of the business, but will be dependent on the following being achieved:
- Securing new and significant sales contracts;
- Finalising access to cheaper feedstock and when combined with planned capital improvements to the Plants,
supply biodiesel to the market at materially improved margins; and
- The continued availability of the bank facility as detailed in note 15.
The Company is confident of delivering on these strategies throughout the financial year ending 30 June 2013 due to:
- The recent track record of sales success, and pipeline of tenders and sales enquiries;
- The success to date in executing more key sales contracts and successfully finalising negotiations for additional
sales agreements which, when combined with the current strategies to utilise alternative feedstock types, will
provide the Company with higher gross margins and therefore deliver improving cash flows;
- The recent improvement in consolidated cash flow; and
- The improved production output and increase in sales activity from the Barnawartha Plant.
At the date of this report and having considered the above factors, the Directors believe that the consolidated entity will be
able to continue as a going concern. If the assumptions above are not realised, then there may be material uncertainty
whether the consolidated entity will continue as a going concern and, therefore, whether it will realise its assets and
discharge its liabilities in the normal course of business.
The financial report does not include adjustments relating to the recoverability and classification of recorded asset amounts
nor to the amounts and classification of liabilities that might be necessary should the consolidated entity not continue as a
going concern.
Critical accounting estimates and judgements
In the application of the Group’s accounting policies, management is required to make judgments, estimates and
assumptions about carrying values of assets and liabilities that are not readily apparent from other sources. The estimates
and associated assumptions are based on historical experience and various other factors that are believed to be reasonable
under the circumstance, the results of which form the basis of making the judgments. Actual results may differ from these
estimates.
The estimates and underlying assumptions are reviewed on an ongoing basis. Revisions to accounting estimates are
recognised in the period in which the estimate is revised if the revision affects only that period or in the period of the revision
and future periods if the revision affects both current and future periods.
For
per
sona
l use
onl
y

Notes to the financial statements
for the financial year ended 30 June 2012 (continued)
Summary of accounting policies (continued)
28 AUSTRALIAN RENEWABLE FUELS LIMITED
The key critical accounting estimates and judgments are:
Impairment of tangible assets
At each reporting date, the Group reviews the carrying amounts of its tangible assets to determine whether there is any
indication that those assets have suffered an impairment loss. If any such indication of impairment exists, the recoverable
amount of the asset is estimated in order to determine the extent of the impairment loss (if any).
Recoverable amount is the higher of fair value less costs to sell and value in use. In assessing value is use, estimated
future cash flows are discounted to present value using a pre-tax discount rate that reflects current market assessments of
the time value of money and the risks specific to the asset for which the estimates of future cash flows have not been
adjusted.
The determination of fair value and value in use requires management to make estimates and assumptions about items
such as expected production and sales volumes, prices, capacity, operating costs and discount rates. These estimates are
subject to uncertainty and changes to these factors would impact the recoverable amount of the assets.
Useful lives of tangible assets
The Group reviews the useful lives, depreciation method and estimated residual value of all tangible assets at the end of the
reporting period.
Share Based Payments
The Group measures the cost of equity settled share-based payments at fair value at the grant date using an appropriate
valuation model taking into account the terms and conditions upon which the instruments were granted and expected
vesting period.
Employee Entitlements
Management judgement is applied in determining the following key assumptions used in the calculation of long service leave
at balance date:
- Future increases in wages and salaries;
- Future on cost rates; and
- Experience of employee departures and period of service
Inventories
The net realisable value of inventories is the estimated selling price in the ordinary course of business less estimated costs
to sell which approximates fair value less costs to sell. The key assumptions require the use of management judgement and
are reviewed annually. These key assumptions are the variables affecting the estimated costs to sell and the expected
selling price. Any reassessment of costs to sell or selling price in a particular year will affect the costs of goods sold.
Adoption of new and revised accounting standards
In the current year, the Group has adopted all of the new and revised Standards and Interpretations issued by the Australian
Accounting Standards Board (the AASB) that are relevant to its operations and effective for the current annual reporting
period beginning 1 July 2011. Details of the impact of the adoption of these new accounting standards are set out in the
individual accounting policy notes set out below.
AASB 124 Related Party Disclosures (2009), AASB 2009-12Amendments to Australian Accounting Standards
Amends the requirements of the previous version of AASB 124 to: (a) Provide a
partial exemption from related party disclosure requirements for government-
related entities; (b) Clarify the definition of a related party; (c) Include an explicit
requirement to disclose commitments involving related parties.
AASB 1054 Australian Additional Disclosures, AASB 2011-1Amendments to Australian Accounting Standards arising from the Trans-Tasman Convergence Project and AASB 2011-2 Amendments to Australian Accounting Standards arising from the Trans-Tasman Convergence Project – Reduced Disclosure Requirements
AASB 1054 sets out the Australian-specific disclosures for entities that have
adopted Australian Accounting Standards. This Standard contains disclosure
requirements that are additional to IFRSs in areas such as compliance with
Australian Accounting Standards, the nature of financial statements (general
purpose or special purpose), audit fees, imputation (franking) credits and the
reconciliation of net operating cash flow to profit (loss).
AASB 2011-1 makes amendments to a range of Australian Accounting Standards
and Interpretations for the purpose of closer alignment to IFRSs and harmonisation
between Australian and New Zealand Standards. The Standard deletes various
Australian-specific guidance and disclosures from other Standards (Australian-
specific disclosures retained are now contained in AASB 1054), and aligns the
wording used to that adopted in IFRSs. The 'true and fair override' is introduced
into AASB 101 Presentation of Financial Statements, but its application in the
Australian context is limited by an additional 'Aus' paragraph.
AASB 2010-5 Amendments to Australian Accounting Standards
This Standard makes numerous editorial amendments to a range of Australian
Accounting Standards and Interpretations, including amendments to reflect
changes made to the text of IFRSs by the IASB.
These amendments have no major impact on the requirements of the amended
pronouncements.
For
per
sona
l use
onl
y

Annual Financial Report 2012 29
AASB 2010-6 Amendments to Australian Accounting Standards – Disclosures on Transfers of Financial Assets
The amendments introduce additional disclosures, designed to allow users of
financial statements to improve their understanding of transfer transactions of
financial assets (for example, securitisations), including understanding the possible
effects of any risks that may remain with the entity that transferred the assets.
The amendments also require additional disclosures if a disproportionate amount of
transfer transactions are undertaken around the end of a reporting period.
Standards and Interpretations adopted with no effect on financial statements
The following new and revised Standards and interpretations have also been adopted in these financial statements. Their
adoption has not had any significant impact on the amounts reported in these financial statements but may affect the
accounting for future transactions or arrangements.
Standards and interpretations issued not yet effective
At the date of authorisation of the financial statement, the Standards and Interpretations listed below were in issue but not
yet effective. The impact of the initial application of the following Standards and Interpretations to the financial report of the
Group has not been assessed:
AASB 2009-12 ‘Amendments to Australian Accounting Standards’
The application of AASB 2009-12 makes amendments to AASB 8 ‘Operating
Segments’ as a result of the issuance of AASB 124 ‘Related Party Disclosures’
(2009). The amendment to AASB 8 requires an entity to exercise judgement in
assessing whether a government and entities known to be under the control of that
government are considered a single customer for the purposes of certain operating
segment disclosures. The Standard also makes numerous editorial amendments to
a range of Australian Accounting Standards and Interpretations. The application of
AASB 2009-12 has not had any material effect on amounts reported in the
Company’s financial statements.
AASB 2010-5 ‘Amendments to Australian Accounting Standards’
The Standard makes numerous editorial amendments to a range of Australian
Accounting Standards and Interpretations.
The application of AASB 2010-5 has not had any material effect on amounts
reported in the Company’s financial statements.
AASB 2010-6 ‘Amendments to Australian Accounting Standards – Disclosures on Transfers of Financial Assets’
The application of AASB 2010-6 makes amendments to AASB 7 ‘Financial
Instruments – Disclosures’ to introduce additional disclosure requirements for
transactions involving transfer of financial assets. These amendments are intended
to provide greater transparency around risk exposures when a financial asset is
transferred and derecognised but the transferor retains some level of continuing
exposure in the asset.
To date, the Company has not entered into any transfer arrangements of financial
assets that are derecognised but with some level of continuing exposure in the
asset. Therefore, the application of the amendments has not had any material
effect on the disclosures made in the consolidated financial statements.
AASB 1054 Australian Additional Disclosures
AASB 1054 sets out the Australian-specific disclosures for entities that have
adopted Australian Accounting Standards. This Standard contains disclosure
requirements that are additional to IFRSs in areas such as compliance with
Australian Accounting Standards, the nature of financial statements (general
purpose or special purpose), audit fees, imputation (franking) credits and the
reconciliation of net operating cash flow to profit (loss).
AASB 2010-4 Further Amendments to Australian Accounting Standards arising from the Annual Improvements Project
Amends a number of pronouncements as a result of the IASB's 2008-2010 cycle of
annual improvements. Key amendments include:
- Financial statement disclosures - clarification of content of statement of
changes in equity (AASB 101), financial instrument disclosures (AASB 7) and
significant events and transactions in interim reports (AASB 134)
Standards/Interpretations Effective for annual reporting periods beginning on or after
Expected to be initially applied in the financial year ending
AASB 9 ‘Financial Instruments’, AASB 200911 ‘Amendments to Australian Accounting Standards arising from AASB 9’ and AASB 2010-7 ‘Amendments to Australian Accounting Standards arising from AASB 9 (December 2010)’
1 January 2013 30 June 2014
AASB 10 ‘Consolidated Financial Statements’ 1 January 2013 30 June 2014
For
per
sona
l use
onl
y

Notes to the financial statements
for the financial year ended 30 June 2012 (continued)
Summary of accounting policies (continued)
30 AUSTRALIAN RENEWABLE FUELS LIMITED
The following significant accounting policies have been adopted in the preparation and presentation of the financial report:
(a) Basis of consolidation
The consolidated financial statements incorporate the financial statements of the Company and entities controlled by the
Company (its subsidiaries) (referred to as ‘the Group’ in these financial statements). A controlled entity is any Company in
which Australian Renewable Fuels Limited has the power to control the financial and operating policies of the entity so as to
obtain benefits from its activities.
Income and expense of subsidiaries acquired or disposed of during the year are included in the consolidated statement of
comprehensive income from the effective date of acquisition and up to the effective date of disposal, as appropriate. Total
comprehensive income of subsidiaries is attributed to the owners of the Company and to the non-controlling interests even if
this results in the non-controlling interests having a deficit balance.
All inter-Company balances and transactions between entities in the consolidated entity, including any unrealised profits or
losses, have been eliminated on consolidation. Accounting policies of subsidiaries have been changed where necessary to
ensure consistencies with those policies applied by the Company.
(b) Borrowing costs
All borrowing costs, except to the extent that they are directly attributable to the acquisition, construction or production of
qualifying assets, are recognised in profit or loss in the period in which they are incurred.
(c) Cash and cash equivalents
Cash comprises cash on hand, cash at call, short-term deposits and cash in secured fixed term deposits held as security for
the provision of bank guarantees. Cash equivalents are short-term, highly liquid investments that are readily convertible to
known amounts of cash and which are subject to an insignificant risk of changes in value.
(d) Employee benefits
A liability is recognised for benefits accruing to employees in respect of wages and salaries, annual leave and long service
leave when it is probable that settlement will be required and they are capable of being measured reliably.
Standards/Interpretations Effective for annual reporting periods beginning on or after
Expected to be initially applied in the financial year ending
AASB 12 ‘Disclosure of Interests in Other Entities’ 1 January 2013 30 June 2014
AASB 127 ‘Separate Financial Statements’ (2011) 1 January 2013 30 June 2014
AASB 13 ‘Fair Value Measurement’ and AASB 2011-8 ‘Amendments to Australian
1 January 2013 30 June 2014
AASB 119 ‘Employee Benefits’ (2011) and AASB 2011-10 ‘Amendments to Australian Accounting Standards arising from AASB 119 (2011)’
1 January 2013 30 June 2014
AASB 2010-8 ‘Amendments to Australian Accounting Standards – Deferred Tax: Recovery of Underlying Assets’
1 January 2012 30 June 2013
AASB 2011-4 ‘Amendments to Australian Accounting Standards to Remove Individual Key Management Personnel Disclosure Requirements’
1 July 2013 30 June 2014
AASB 2011-7 ‘Amendments to Australian Accounting Standards arising from the Consolidation and Joint Arrangements standards’
1 January 2013 30 June 2014
AASB 2011-9 ‘Amendments to Australian Accounting Standards – Presentation of Items of Other Comprehensive Income’
1 July 2012 30 June 2013
AASB 2012-2 Amendments to Australian Accounting Standards – Disclosures – Offsetting Financial Assets and Financial Liabilities (Amendments to AASB 7)
1 January 2013 30 June 2014
AASB 2012-3 Amendments to Australian Accounting Standards – Offsetting Financial Assets and Financial Liabilities (Amendments to AASB 132)
1 January 2014 30 June 2015
AASB 2012-5 Amendments to Australian Accounting Standards arising from Annual Improvements 2009–2011 Cycle
1 January 2013 30 June 2014
For
per
sona
l use
onl
y

Annual Financial Report 2012 31
Liabilities recognised in respect of employee benefits expected to be settled within 12 months, are measured at their
nominal values using the remuneration rate expected to apply at the time of settlement.
Liabilities recognised in respect of employee benefits which are not expected to be settled within 12 months are measured
as the present value of the estimated future cash outflows to be made by the Group in respect of services provided by
employees up to reporting date.
(e) Financial assets
Investments are recognised and derecognised on trade date where the purchase order or sale of an investment is under a
contract whose terms require delivery of the investment within the timeframe established by the market concerned, and are
initially measured at fair value, net of transaction costs except for those financial assets classified as at fair value through
profit or loss which are initially measured at fair value.
Subsequent to initial recognition, investments in subsidiaries are measured at cost in the Company financial statements.
Other financial assets are classified in the following categories: financial assets ‘at fair value through profit or loss’, ‘held-to-
maturity investments’, ‘available-for-sale’ financial assets, and ‘loans and receivables’. The classification depends on the
nature and purpose of the financial assets and is determined at the time of initial recognition.
Effective interest method
The effective interest method is a method of calculating the amortised cost of a debt instrument and of allocating interest
income over the relevant period. The effective interest rate is the rate that exactly discounts estimated future cash receipts
(including all fees on points paid or received that form an integral part of the effective interest rate, transaction costs and
other premiums or discounts) through the expected life of the debt instrument, or (where appropriate) a shorter period, to the
net carrying amount on initial recognition.
Income is recognised on an effective interest basis for debt instruments other than those financial assets classified as at fair
value through profit or loss.
At fair value through profit or loss
An instrument is classified as at fair value through profit or loss if it is held for trading or is designated as such upon initial
recognition. Financial Instruments are designated at fair value through profit or loss if the Company manages such
investments and makes purchase and sale decisions based on their fair value in accordance with the Company’s investment
strategy. Upon initial recognition, the attributable transaction costs are recognised in profit or loss when incurred. Financial
instruments that are at fair value through profit or loss are measured at fair value, and changes therein are recognised in
profit or loss.
Available-for-sale financial assets
Listed investments in equity securities are classified as available-for-sale financial assets. Subsequent to initial recognition,
they are measured at fair value and changes therein, other than impairment losses, and foreign exchange gains and losses
are recognised as a separate component of equity. When an investment is derecognised, the cumulative gain or loss in
equity is transferred to profit or loss.
Loans and receivables
Trade receivables, loans, and other receivables that have fixed or determinable payments that are not quoted in an active
market are classified as ‘loans and receivables’. Loans and receivables are measured at amortised cost using the effective
interest rate method less impairment. Interest is recognised by applying the effective interest rate.
Impairment of financial assets
Financial assets, other than those at fair value through profit or loss (FVTPL), are assessed for indicators of impairment at
the end of each reporting period. Financial assets are considered to be impaired when there is objective evidence that, as a
result of one or more events that occurred after the initial recognition of the financial asset, the estimated future cash flows
of the investment have been affected.
(f) Financial liabilities and equity instruments issued by the Company
Interest and dividends
Interest and dividends are classified as expenses or as distributions of profit consistent with the balance sheet classificat ion
of the related debt or equity instruments. Borrowings are classified as Financial Liabilities measured at amortised cost.
Classification as debt or equity
Debt and equity instruments are classified as either financial liabilities or as equity in accordance with the substance of the
contractual arrangement.
Equity instruments
An equity instrument is any contract that evidences a residual interest in the assets of an entity after deducting all of its
liabilities. Equity instruments issued by the Group are recognised at the proceeds received, net of direct issue costs.
For
per
sona
l use
onl
y
Notes to the financial statements
for the financial year ended 30 June 2012 (continued)
Summary of accounting policies (continued)
32 AUSTRALIAN RENEWABLE FUELS LIMITED
(g) Foreign currency
The individual financial statements of each Group entity are presented in the currency of the primary economic environment
in which the entity operates (its functional currency). For the purpose of the consolidated financial statements, the results
and financial position of each entity are expressed in Australian dollars, which is the functional currency of Australian
Renewable Fuels Limited, and the presentation currency for the consolidated financial statements.
In preparing the financial statements of the individual entities, transactions in currencies other than the entity’s functional
currency (foreign currencies) are recorded at the rates of exchange prevailing on the dates of the transactions. At each
balance sheet date, monetary items denominated in foreign currencies are retranslated at the rates prevailing on the
balance sheet date. Non-monetary items carried at fair value that are denominated in foreign currencies are retranslated at
the rates prevailing on the date when the fair value was determined. Non-monetary items that are measured in terms of
historical cost in a foreign currency are not retranslated.
Exchange differences are recognised in the foreign exchange reserve in the period in which they arise.
(h) Impairment of tangible and intangible assets
At each reporting date, the Group reviews the carrying amounts of its tangible and intangible assets to determine whether
there is any indication that those assets have suffered an impairment loss. During the financial year, independent advice
was used to assist in this process. If any such indication of impairment exists, the recoverable amount of the asset is
estimated in order to determine the extent of the impairment loss (if any). When the asset does not generate cash flows that
are independent from other assets, the Group estimates the recoverable amount of the cash-generating unit to which the
asset belongs. Where a reasonable and consistent basis of allocation can be identified, corporate assets are also allocated
to individual cash-generating units, or otherwise they are allocated to the smallest Group of cash-generating units for which
a reasonable and consistent allocation basis can be identified.
Intangible assets with indefinite useful lives and intangible assets not yet available for use are tested for impairment annually
and whenever there is an indication that the asset may be impaired.
Recoverable amount is the higher of fair value less costs to sell and value in use. In assessing value in use, the estimated
future cash flows are discounted to their present value using a pre-tax discount rate that reflects current market
assessments of the time value of money and the risks specific to the asset for which the estimates of future cash flows have
not been adjusted. If the recoverable amount of the asset (or cash-generating unit) is estimated to be less than its carrying
amount, the carrying amount of the asset (or cash-generating unit) is reduced to its recoverable amount. An impairment loss
is recognised in the profit or loss immediately.
Where an impairment loss subsequently reverses, the carrying amount of the asset (or cash-generating unit) is increased to
the revised estimate of its recoverable amount, but only to the extent that the increased carrying amount does not exceed
the carrying amount that would have been determined had no impairment loss been recognised for the asset (or cash
generating unit) in prior years. A reversal of an impairment loss is recognised in profit or loss immediately.
(i) Income taxes
Current tax
Current tax is calculated by reference to the amount of income taxes payable or recoverable in respect of the taxable profit
or tax loss for the period. It is calculated using tax rates and tax laws that have been enacted or substantively enacted by
reporting date. Current tax for current and prior periods is recognised as a liability (or asset) to the extent that it is unpaid (or
refundable).
Deferred tax
Deferred tax is accounted for using the statement of financial position liability method. Temporary differences are differences
between the tax base of an asset or liability and its carrying amount in the balance sheet. The tax base of an asset or liabi lity
is the amount attributed to that asset or liability for tax purposes.
In principle, deferred tax liabilities are recognised for all taxable temporary differences. Deferred tax assets are recognised
to the extent that it is probable that sufficient taxable amounts will be available against which deductible temporary
differences or unused tax losses and tax offsets can be utilised. However, deferred tax assets and liabilities are not
recognised if the temporary differences giving rise to them arise from the initial recognition of assets and liabilities (other
than as a result of a business combination) which affects neither taxable income nor accounting profit. Furthermore, a
deferred tax liability is not recognised in relation to taxable temporary differences arising from the initial recognition of
goodwill.
Deferred tax liabilities are recognised for taxable temporary differences associated with investments in subsidiaries,
branches and associates, and interests in joint ventures except where the Group is able to control the reversal of the
temporary differences and it is probable that the temporary differences will not reverse in the foreseeable future. Deferred
tax assets arising from deductible temporary differences associated with these investments and interests are only
recognised to the extent that it is probable that there will be sufficient taxable profits against which to utilise the benefits of
the temporary differences and they are expected to reverse in the foreseeable future.
Deferred tax assets and liabilities are measured at the tax rates that are expected to apply to the period(s) when the asset
and liability giving rise to them are realised or settled, based on tax rates (and tax laws) that have been enacted or
substantively enacted by reporting date. The measurement of deferred tax liabilities and assets reflects the tax
For
per
sona
l use
onl
y

Annual Financial Report 2012 33
consequences that would follow from the manner in which the Group expects, at the reporting date, to recover or settle the
carrying amount of its assets and liabilities.
Deferred tax assets and liabilities are offset when they relate to income taxes levied by the same taxation authority and the
Company/Group intends to settle its current tax assets and liabilities on a net basis.
Current and deferred tax for the period
Current and deferred tax is recognised as an expense or income in the income statement, except when it relates to items
credited or debited directly to equity, in which case the deferred tax is also recognised directly in equity, or where it arises
from the initial accounting for a business combination, in which case it is taken into account in the determination of goodwi ll
or excess.
Tax consolidation
Australian Renewable Fuels Limited and its 100% owned Australian resident subsidiaries have implemented the tax
consolidation legislation. Current and deferred tax amounts are accounted for in each individual entity as if each entity
continued to act as a taxpayer in its own right.
(j) Inventories
Inventories of consumable supplies and spare parts are valued at lower of cost and net realisable value. Costs, including an
appropriate portion of fixed and variable overhead expenses, are assigned to inventory on hand by the method most
appropriate to each particular class of inventory, with the majority being valued on a first in first out basis. Net realisable
value represents the estimated selling price less all estimated costs of completion and costs to be incurred in marketing,
selling and distribution
(k) Buildings and property, plant and equipment
Buildings and property, plant and equipment
Buildings and property, plant and equipment are stated at cost less accumulated depreciation and impairment. Cost includes
expenditure that is directly attributable to the acquisition of the item. In the event that settlement of all or part of the purchase
consideration is deferred, cost is determined by discounting the amounts payable in the future to their present value as at
the date of acquisition.
Depreciation
Depreciation is provided on property, plant and equipment, including freehold buildings but excluding land. Depreciation is
calculated on a straight line basis so as to write off the net cost of each asset over its expected useful life to its estimated
residual value. The estimated useful lives, residual values and depreciation method are reviewed at the end of each annual
reporting period, with the effect of any changes recognised on a prospective basis.
The depreciation rates used for each class of depreciable assets are:
Buildings 40 years
Vehicles 8 years
Furniture, fittings and office equipment 7 years
Computer hardware and manufacturing equipment 4 years
Computer software 2.5 years
Manufacturing plant 13 years
Laboratory equipment 10 years
(l) Intangible assets
Intangible assets are carried at cost less accumulated amortisation and accumulated impairment losses (where applicable).
Amortisation is recognised on a straight-line basis over their estimated useful lives. The estimated useful life and
amortisation method are reviewed at the end of each annual reporting period, with the effect of any changes in estimates
being accounted for on a prospective basis.
(m) Non-current assets held for sale
Non-current assets and disposal groups are classified as held for sale if their carrying amount will be recovered principally
through a sale transaction rather than through continuing use. This condition is regarded as met only when the sale is highly
probable and the non-current asset (or disposal Group) is available for immediate sale in its present condition. Management
must be committed to the sale, which should be expected to qualify for recognition as a completed sale within one year from
the date of classification.
(n) Provisions
Provisions are recognised when the Group has a present obligation (legal or constructive) as a result of a past event, it is
probable that the Group will be required to settle the obligation, and a reliable estimate can be made of the amount of the
obligation.
The amount recognised as a provision is the best estimate of the consideration required to settle the present obligation at
reporting date, taking into account the risks and uncertainties surrounding the obligation. Where a provision is measured
using the cash flows estimated to settle the present obligation, its carrying amount is the present value of those cash flows.
For
per
sona
l use
onl
y

Notes to the financial statements
for the financial year ended 30 June 2012 (continued)
Summary of accounting policies (continued)
34 AUSTRALIAN RENEWABLE FUELS LIMITED
(o) Revenue
Revenue is measured at the fair value of the consideration received or receivable, and is recognised to the extent that it is
probable that the economic benefits will flow to the entity and the revenue can be reliably measured.
Sale of goods
Revenue from the sale of goods is recognised when all the following conditions are satisfied:
i. the Group has transferred to the buyer the significant risks and rewards of ownership of the goods;
ii. the Group retains neither continuing managerial involvement to the degree usually associated with ownership nor
effective control over the goods sold;
iii. the amount of revenue can be measured reliably;
iv. it is probable that the economic benefits associated with the transaction will flow to the entity; and
v. the costs incurred or to be incurred in respect of the transaction can be measured reliably.
The method of recognising revenue has differed from the financial statements as at 31 December 2011. The method adopted for the full year to 30 June 2012 notes the substance of the transaction before it is deemed as Revenue. As a result mineral diesel sales have been offset against the purchase of the same product for the same amount. Mineral diesel is acquired and re-sold as part of the blending process with biodiesel.
Rendering of services
Revenue from a contract to provide services is recognised by reference to the stage of completion of the contract. The stage
of completion of the contract is determined as follows;
i. installation fees are recognised by reference to the stage of completion of the installation, determined as the
proportion of the total time expected to install that has elapsed at the end of the reporting period;
ii. servicing fees included in the price of products sold are recognised by reference to the proportion of the total cost
of providing the servicing for the product sold, taking into account historical trends in the number of services
actually provided on past goods sold; and
iii. revenue from time and material contracts is recognised at the contractual rates as labour hours are delivered and
direct expenses are incurred.
Royalties
Royalty revenue is recognised on an accrual basis in accordance with the substance of the relevant agreement (provided
that it is probable that the economic benefits will flow to the Group and the amount of revenue can be measured reliably).
Royalties determined on a time basis are recognised on a straight-line basis over the period of the agreement. Royalty
arrangements that are based on production, sales and other measures are recognised by reference to the underlying
arrangement.
Interest revenue
Interest revenue is recognised when it is probable that the economic benefits will flow to the Group and the amount of
revenue can be measured reliably. Interest revenue is accrued on a time basis, by reference to the principal outstanding and
at the effective interest rate applicable, which is the rate that exactly discounts estimated future cash receipts through the
expected life of the financial asset to that asset’s net carrying amount at initial recognition.
Research and development tax concession revenue
The Australian Federal Government provides the Research and Development Tax Concession scheme which is a broad-
based tax concession scheme which allows companies to deduct certain levels of qualifying expenditure incurred on
research and development activities in the calculation of their tax obligations. For small companies which satisfy certain
turnover and expenditure based criteria, a facility is also provided whereby the concession, which would otherwise be
included within their carried-forward tax losses, can be paid in a cash refund. The Group had qualified for this treatment and
received a payment. The payment was recognised as revenue at that point.
Government grants
Government grants are not recognised until there is reasonable assurance that the Group will comply with the conditions
attaching to them and that the grants will be received.
The benefit of a government loan at a below-market rate of interest is treated as a government grant, measured as the
difference between proceeds received and the fair value of the loan based on prevailing market interest rates unless there
are specific performance conditions which must be met before the loan will convert into a grant, in which case the
unconverted portion of the loan will be treated as a loan.
Government grants whose primary condition is that the Group should purchase, construct or otherwise acquire non-current
assets are recognised as deferred revenue in the statement of financial position and transferred to profit or loss on a
systematic and rational basis over the useful lives of the related assets.
Other government grants are recognised as revenue over the periods necessary to match them with the costs for which they
are intended to compensate, on a systematic basis. Government grants that are receivable as compensation for expenses
For
per
sona
l use
onl
y
Annual Financial Report 2012 35
or losses already incurred or for the purpose of giving immediate financial support to the Group with no future related costs
are recognised in profit or loss in the period in which they become receivable.
Government assistance which does not have conditions attached specifically relating to the operating activities of the entity
is recognised in accordance with the accounting policies above.
(p) Goods and services tax
Revenues, expenses and assets are recognised net of the amount of goods and services tax (‘GST’), except:
i. where the amount of GST incurred is not recoverable from the Australian Taxation Office, it is recognised as part
of the cost of acquisition of an asset or as part of an item of expense; or
ii. for receivables and payables with are recognised inclusive of GST.
The net amount of GST recoverable from, or payable to, the Australian Taxation Office is included as part of receivables or
payables.
Cash flows are included in the cash flow statement on a gross basis. The GST component of cash flows arising from
investing and financing activities which is recoverable from, or payable to, the Australian Taxation Authority is classified as
operating cash flows.
(q) Investments in associates
An associate is an entity over which the Group has significant influence and that is neither a subsidiary nor an interest in a
joint venture. Significant influence is the power to participate in the financial and operating policy decisions of the investee
but is not control or joint control over those policies.
The results and assets and liabilities of associates are incorporated in these financial statements using the equity method of
accounting, except when the investment is classified as held for sale, in which case it is accounted for in accordance with
AASB 5 ‘Non-current Assets Held for Sale and Discontinued Operations’. Under the equity method, investments in
associates are carried in the consolidated balance sheet at cost as adjusted for post-acquisition changes in the Group’s
share of the net assets of the associate, less any impairment in the value of individual investments.
Losses of an associate in excess of the Group’s interest in that associate (which includes any long-term interests that, in
substance, form part of the Group’s net investment in the associate) are recognised only to the extent that the Group has
incurred legal or constructive obligations or made payments on behalf of the associate.
Any excess of the cost of acquisition over the Group’s share of the net fair value of the identifiab le assets, liabilities and
contingent liabilities of the associate recognised at the date of the acquisition is recognised as goodwill. The goodwill is
included within the carrying amount of the investment and is assessed for impairment as part of that investment. Any excess
of the Group’s share of the net fair value of the identifiable assets, liabilities and contingent liabilities over the cost o f the
acquisition, after reassessment, is recognised immediately in profit or loss.
Where a Group entity transacts with an associate of the Group, profits and losses are eliminated to the extent of the Group’s
interest in the relevant associate.
(r) Share-based payments
Equity-settled share-based payments with employees and others providing similar services are measured at the fair value of
the equity instrument at the grant date. Fair value is measured by use of a Black-Scholes pricing model. The expected life
used in the model has been adjusted, based on management’s best estimate, for the effects of non-transferability, exercise
restrictions, and behavioural considerations. Further details on how the fair value of equity-settled share-based transactions
has been determined can be found in note 31.
The fair value determined at the grant date of the equity-settled share-based payments is expensed on a straight-line basis
over the vesting period, based on the Group’s estimate of equity instruments that will eventually vest.
At each reporting date, the Group revises its estimate of the number of equity instruments expected to vest. The impact of
the revision of the original estimates, if any, is recognised in profit or loss over the remaining vesting period, with
corresponding adjustment to the equity-settled employee benefits reserve.
Equity-settled share-based payment transactions with other parties are measured at the fair value of the goods and services
received, except where the fair value cannot be estimated reliably, in which case they are measured at the fair value of the
equity instruments granted, measured at the date the entity obtains the goods or the counterparty renders the service.
For cash-settled share-based payments, a liability equal to the portion of the goods or services received is recognised at the
current fair value determined at each reporting date.
(s) Earnings per share
The Group presents basic and diluted earnings per share (EPS) data for its ordinary shares. Basic EPS is calculated by
dividing the profit or loss attributable to ordinary shareholders of the Company by the weighted average number of ordinary
shares outstanding during the period. Diluted EPS is determined by adjusting the profit or loss attributable to ordinary
shareholders and the weighted average number of ordinary shares outstanding for the effects of all dilutive potential
ordinary shares.
(t) Lease payments
Assets held under finance leases are initially recognised as assets of the Group at their fair value at the inception of the
lease or, if lower, at the present value of the minimum lease payments. The corresponding liability to the lessor is included in
the statement of financial position as a finance lease obligation.
For
per
sona
l use
onl
y

Notes to the financial statements
for the financial year ended 30 June 2012 (continued)
Summary of accounting policies (continued)
36 AUSTRALIAN RENEWABLE FUELS LIMITED
Lease payments are apportioned between finance expenses and reduction of the lease obligation so as to achieve a
constant rate of interest on the remaining balance of the liability. Finance expenses are recognised immediately in profit or
loss, unless they are directly attributable to qualifying assets, in which case they are capitalised in accordance with the
Group’s general policy on borrowing costs. Contingent rentals are recognised as expenses in the periods in which they are
incurred.
Operating lease payments are recognised as an expense on a straight-line basis over the lease term, except where another
systematic basis is more representative of the time pattern in which economic benefits from the leased asset are consumed.
Contingent rentals arising under operating leases are recognised as an expense in the period in which they are incurred.
In the event that lease incentives are received to enter into operating leases, such incentives are recognised as a liability.
The aggregate benefits of incentives are recognised as a reduction of rental expense on a straight-line basis, except where
another systematic basis is more representative of the time pattern in which economic benefits from the leased asset are
consumed.
For
per
sona
l use
onl
y

Annual Financial Report 2012 37
2. Segment information
AASB 8 requires operating segments to be identified on the basis of internal reports about components of the Group that are
regularly reviewed by the chief operating decision maker in order to allocate resources to the segment and to assess its
performance.
Information reported to chief operating decision maker for the purposes of resource allocation and assessment of
performance is focused on three key reportable segments. The Group’s reportable segments under AASB 8 are therefore:
i. Western Australia – Biodiesel Plant located at Picton
ii. South Australia – Biodiesel Plant located at Largs Bay
iii. Victoria – Biodiesel Plant located at Barnawartha
The accounting policies of the new reportable segments are the same as the Group’s accounting policies.
(i) Revenue and results
The following is an analysis of the Group’s revenue and results from continuing operations by reportable operating segments for the periods under review:
The revenue reported above represents the revenue generated from external customers. The method of recognising revenue has differed from the financial statements as at 31 December 2011. The method adopted for the full year to 30 June 2012 notes the substance of the transaction before it is deemed as Revenue. As a result $20,175,158 in mineral diesel sales has been offset against the purchase of the same product for the same amount. Mineral diesel is acquired and re-sold as part of the blending process with biodiesel.
Revenue for South Australia was affected by the fire at the Largs Bay Plant. Since the fire on 24 December 2011 there have been no material sales of biodiesel from the Plant. The segment result for South Australia includes an insurance recovery of $876,642.
Included in revenue for 2012 are sales from the Group’s two largest customers of:
i. Customer 1 $12,420,409 ($5,572,774 South Australia, $6,847,635 Victoria)
ii. Customer 2 $12,041,432 (Victoria)
Included in revenue for 2011 are sales from the Group’s three largest customers of:
i. Customer 3 $2,469,353 (South Australia)
ii. Customer 4 $1,747,023 (South Australia)
iii. Customer 5 $978,381 (Western Australia)
No other single customer contributed 10% or more to the Group’s revenue for both 2012 and 2011.
Segment result represents the profit or loss incurred by each segment without the allocation of interest revenue, finance costs, income tax expense and inter-segment transactions. This is the measure reported to the chief operating decision maker for the purpose of resource allocation and assessment of segment performance.
2012 2011 2012 2011
$ $ $ $
Continuing operations
Western Australia 1,448,994 2,600,106 (1,524,802) (1,422,946)
South Australia 8,759,039 3,826,249 (1,505,142) (3,003,620)
Victoria 28,089,019 - 1,151,373 -
Total of all segments 38,297,052 6,426,355 (1,878,571) (4,426,566)
Corporate (4,013,056) (3,665,591)
Interest revenue 87,211 69,884
Finance costs (1,431,377) (106,063)
Gain on disposal of land - -
Total loss before tax (7,235,793) (8,128,336)
Segment revenue Segment result
For
per
sona
l use
onl
y

Notes to the financial statements
for the financial year ended 30 June 2012 (continued)
38 AUSTRALIAN RENEWABLE FUELS LIMITED
ii Segment assets
2012 2011
$ $
Western Australia 4,963,371 4,465,067
South Australia 4,124,127 4,390,255
Victoria 29,958,269 -
Segments Total 39,045,767 8,855,322
Unallocated 7,061,523 3,657,360
46,107,290 12,512,682
iii Segment liabilities
Western Australia 169,268 343,505
South Australia 1,339,466 1,297,239
Victoria 10,932,038 -
Segments total 12,440,772 1,640,744
Unallocated 24,277,467 1,354,098
36,718,239 2,994,842
2012 2011 2012 2011
$ $ $ $
Western Australia 521,382 512,314 101,791 32,845
South Australia 371,611 465,936 2,671,189 70,392
Victoria 1,366,802 - 697,838 -
Segments Total 2,259,795 978,250 3,470,818 103,237
Unallocated 95,500 37,698 103,877 216,010
2,355,295 1,015,948 3,574,695 319,247
Depreciation & amortisation Additions to non-current
Consolidated
3. Revenue
2012 2011
$ $
(a) Revenue from continuing operations 38,297,052 6,426,355
(b) Finance income
Bank interest received 87,211 69,884
(c) Other income
Grant income - 100,000
Research and development tax credit 868,483 -
Business interruption insurance 876,642 -
Other 35,757 41,688
1,780,882 141,688
Consolidated
The revenue reported above represents the revenue generated from external customers. The method of recognising revenue
has differed from the f inancial statements as at 31 December 2011. The method adopted for the full year to 30 June 2012 notes
the substance of the transaction before it is deemed as Revenue. As a result $20,175,158 in mineral diesel sales has been offset
against the purchase of the same product for the same amount. Mineral diesel is acquired and re-sold as part of the blending
process w ith biodiesel.
For
per
sona
l use
onl
y

Annual Financial Report 2012 39
4. Depreciation and amortisation expenses
5. Finance costs
Weighted average interest rate on funds borrowed is 9.5% (2011 – 3.0%)
6. Income taxes
2012 2011
$ $
Property, plant and equipment 2,313,176 941,210
Intangible assets 90 32,824
Other assets 42,029 41,914
2,355,295 1,015,948
Consolidated
2012 2011
$ $
- 479
Interest on w orking capital facility 525,107 105,584
Interest on convertible notes 906,270 -
1,431,377 106,063
Finance charges payable under finance leases and hire purchase contracts
Consolidated
2012 2011
$ $
Deferred tax benefit / (expense) relating to the
origination and reversal of temporary timing
differences and tax losses
- -
Total tax benefit / (expense) - -
Loss before tax from continuing operations (7,235,793) (8,128,336)
Loss before tax from discontinued operations - -
Accounting loss before income tax (7,235,793) (8,128,336)
Income tax benefit calculated at 30% (2,170,738) (2,438,501)
Effect of expenses that are not deductible in determining taxable income 138,234 307,382
Effect of temporary differences not recognised (443,978) (513,105)
Effect of tax losses not recognised 2,556,694 2,738,504
Share based payments and impairment charges (80,212) (94,280)
- -
Unrecognised deferred tax balances
The follow ing deferred tax assets have not been recognised:
- deductible temporary differences 10,446,065 10,114,318
- tax losses 19,413,986 17,874,607
29,860,051 27,988,925
The follow ing deferred tax balances have been recognised:
Deferred tax assets
- Provisions 3,313 1,838
- Other assets - -
Deferred tax liabilities
- Accrued income - (1,284)
- Prepayments (3,313) (554)
- -
Consolidated
The prima facie income tax expense on pre-tax accounting profit/(loss) from operations reconciles to the income tax expense in
the f inancial statements as follow s:
Recognised deferred assets and tax liabilities
Income tax credit recognised in profit or loss
For
per
sona
l use
onl
y

Notes to the financial statements
for the financial year ended 30 June 2012 (continued)
40 AUSTRALIAN RENEWABLE FUELS LIMITED
2012 2011
$ $
Trade receivables 3,893,907 524,653
Provision for impairment of doubtful debts (13,168) (13,168)
GST receivables 169,586 234,756
Other debtors 17,000 125,704
4,067,325 871,945
Aging of past-due but not impaired receivables
90 -150 days 413,853 20,067
413,853 20,067
Consolidated
2012 2011
$ $
Raw materials – at cost 846,044 708,206
Consumables – at cost 275,683 21,240
Finished goods – at net realisable value 1,668,546 993,654
By products – at cost 53,570 18,647
Spare parts - at cost 411,422 -
3,255,265 1,741,747
Consolidated
2012 2011
$ $
Income accrued - 4,279
Prepaid rent 76,212 -
Prepaid insurance 452,839 239,308
Prepayment for raw materials 556,164 88,185
Prepaid lease reclassif ied as current (note 12) 41,914 41,914
Insurance proceeds receivable 941,084 -
Other 527,032 62,935
2,595,245 436,621
Consolidated
Tax consolidation
Australian Renewable Fuels Limited and its 100% owned Australian resident subsidiaries have implemented the tax
consolidation legislation. The accounting policy for the implementation of the tax consolidation legislation is set out in Note
1(i).
The entities in the tax consolidated Group entered into a tax sharing agreement on adoption of the tax consolidation
legislation which, in the opinion of the Directors, limits the joint and several liability of the controlled entities in the case of a
default by the head entity, Australian Renewable Fuels Limited.
The allocation of taxes under the tax funding agreement is recognised as an increase/decrease in the subsidiaries’ inter-
Company accounts with the tax consolidated Group head Company Australian Renewable Fuels Limited. The difference
between the current tax amount that is allocated under the tax funding agreement and the amount that is allocated under an
acceptable method is recognised as a contribution/distribution of the subsidiaries’ equity accounts. The Group has applied
the Group allocation approach in determining the appropriate distribution of current taxes to allocate to members to the tax
consolidation Group.
7. Trade and other receivables: current
Trade receivables are non-interest bearing and are generally on 7 to 30 day terms. An allowance is made when there is
objective evidence that a trade receivable is impaired.
8. Inventories
9. Other current assets
For
per
sona
l use
onl
y

Annual Financial Report 2012 41
Manufacturing
licenseTotal
$ $
Gross carrying amount
Balance at 1 July 2010 164,119 164,119
Additions/disposals - -
Balance at 30 June 2011 164,119 164,119
Additions/disposals - -
Balance at 30 June 2012 164,119 164,119
Accumulated amortisation
Balance at 1 July 2010 (131,205) (131,205)
Amortisation expense (note 4) (32,824) (32,824)
Balance at 30 June 2011 (164,029) (164,029)
Amortisation expense (note 4) (90) (90)
Balance at 30 June 2012 (164,119) (164,119)
Net book value
As at 30 June 2011 90 90
As at 30 June 2012 - -
Consolidated
10. Property, plant and equipment
During the year an independent valuation was conducted on property, plant and equipment at all three operating business sites.
11. Intangible Assets
ConsolidatedFreehold land
and buildings
Plant and
equipment at
cost
Total
$ $ $
Gross carrying amount
Balance at 1 July 2010 - 12,088,279 12,088,279
Additions - 319,247 319,247
Balance at 1 July 2011 - 12,407,526 12,407,526
Additions - 3,574,695 3,574,695
Disposals - (2,985) (2,985)
Write dow n due to f ire damage to Larg's Bay - (3,382,000) (3,382,000)
Acquisition of BPL (note 32) 3,899,535 23,346,608 27,246,143
Balance at 30 June 2012 3,899,535 35,943,844 39,843,379
Accumulated depreciation
Balance at 1 July 2010 - (6,253,114) (6,253,114)
Adjustment - (216) (216)
Depreciation expense (note 4) - (941,210) (941,210)
Balance at 1 July 2011 - (7,194,540) (7,194,540)
Depreciation expense (note 4) - (2,313,176) (2,313,176)
Disposal - 1,728 1,728
Write dow n due to f ire damage to Larg's Bay - 3,192,000 3,192,000
Balance at 30 June 2012 - (6,313,988) (6,313,988)
Net book value
As at 30 June 2011 - 5,212,986 5,212,986
As at 30 June 2012 3,899,535 29,629,856 33,529,391
For
per
sona
l use
onl
y

Notes to the financial statements
for the financial year ended 30 June 2012 (continued)
42 AUSTRALIAN RENEWABLE FUELS LIMITED
2012 2011
$ $
Current:
Trade payables (i) 7,647,290 2,103,325
Lease liability (ii) - 10,800
WA Government grant(iii) 300,000 300,000
Insurance premium funding 361,903 -
Accrued costs 2,382,082 -
Insurance damages claims received in advance 427,143 -
Other payables 217,150 398,707
11,335,568 2,812,832
Consolidated
2012 2011
$ $
Prepaid lease on Picton land (i) 838,290 838,290
Reclassif ied as current (41,914) (41,914)
Accumulated amortisation (note 4) (117,475) (75,446)
678,901 720,930
Consolidated
12. Other non-current assets
13. Trade and other payables
(i) Trade payables are non-interest bearing and are normally settled on 0-60 day terms.
(ii) In prior years the Company leased a motor vehicle under a finance lease. During the 2012 year it exercised its option to purchase the vehicle at the end of the lease term.
No finance lease arrangements were in place at 30 June 2012.
(iii) The WA Government advance is convertible to a grant when certain performance conditions are met. The Government advance was awarded in 2005 with a convertible
period of 5 years. The advance is non-interest-bearing and any unconverted and outstanding amounts as at June 2012 are repayable at that time. In the 2011 financial year
$100,000 was converted to a grant. The amount to be converted for the 2012 year is currently being determined at which point the final amount repayable (if any) will be
calculated.
14. Provisions
2012 2011
$ $
Employee leave
Current 302,389 182,010
Non –current 123,860 -
426,249 182,010
Consolidated
(i) In the 2010 financial year, the Group entered into an agreement for the sale of its Picton land to Kingslane Pty Limited for a total consideration of $3,000,000 and agreed to
lease back a portion of the land (approximately 25% of the total property) for a fixed fee of $838,290 (included stamp duty of $58,290) paid up front.
For
per
sona
l use
onl
y

Annual Financial Report 2012 43
15. Borrowings
Attached to the bank overdraft facility are covenants. As at 30 June 2012 a breach of one covenant occurred. The bank has been advised of the breach and has reserved their rights, but taken no action. The debt facility remains in place.
16. Amounts payable on acquisition
2012 2011
$ $
Convertible notes (note 32) 8,218,661 -
Derivative component 5,431,339 -
13,650,000 -
Disclosed in the f inancial statements as:
Other non-current liabilities 13,650,000 -
13,650,000 -
Total facilities:
Bank overdraft 10,000,000 -
Guarantee facility 581,358 559,900
10,581,358 559,900
Facilities used at reporting date:
Bank overdraft 5,862,547 -
Guarantee facility 581,358 -
6,443,905 -
Facilities unused at reporting date:
Bank overdraft 4,137,453 -
Guarantee facility - 559,900
Other - -
4,137,453 559,900
Consolidated
At reporting date, the Group had the follow ing f inancing facilities in place w ith
HSBC Bank Australia Limited and Suncorp Group Limited:
2012 2011
$ $
Current:
Cash fee payable (i) 3,443,875 -
Contingent consideration (ii) 699,000 -
4,142,875 -
Non current:
Contingent consideration (ii) 1,301,000 -
5,443,875 -
(i ) The cash fees to be paid have been recognised as current liabilit ies in the statement of f inancial posit ion and are due for payment on 31 December 2012.
(i i ) The Contingent considerat ion is a further payment to holders of the convert ible notes that may be triggered subject to certain criteria being achieved. Earn-out payments
can be made to the noteholders if the plant at Barnawartha achieves production levels greater than 43.5 million lit res per annum in each of the f irst three years from 1 November
2011. These payments will be 16.33 cents per lit re for each lit re of production in excess of 43.5 million lit res per annum for each year the excess is achieved. Should the average
level of production over the f irst three years from 1 November 2011 exceed 49.3 million lit res per annum, the potent ial earn-out payments period will extend for a further two
years, taking the earn out program to f ive years. M anagement has assessed the likelihood of the earn-out payments and applied discount cashf low rate against the quantum of
the payout to determine the Contingent considerat ion. This amount will be reviewed on an annual basis.
Consolidated
For
per
sona
l use
onl
y

Notes to the financial statements
for the financial year ended 30 June 2012 (continued)
44 AUSTRALIAN RENEWABLE FUELS LIMITED
2012 2011
$ $
Fully paid ordinary shares:
124,176,890 114,576,984
Consolidated
30 June 2012: 2,441,300,361 (30 June 2011: 1,732,641,023)
No. $ No. $
Balance at beginning of year 1,732,641,023 114,576,984 631,523,384 104,561,260
Issue of shares from rights issue - - 772,063,390 5,027,714
Issue of shares from private placements 214,000,000 1,185,981 - -
Exercise of options 494,659,338 8,542,077 329,054,249 5,638,193
Share issue costs - (128,152) - (650,183)
Balance at end of f inancial year 2,441,300,361 124,176,890 1,732,641,023 114,576,984
20112012
Consolidated Consolidated
2012 2011
$ $
(469,371) (468,561)
878,801 611,428
1,105,706 3,615,171
- 250,000
1,515,136 4,008,038
Foreign currency translation reserve
Other reserve
General options reserve
Employee share options reserve
Consolidated
2012 2011
$ $
(468,561) (471,008)
(810) 2,447
(469,371) (468,561)
Consolidated
Balance at end of year
Exchange differences arising on translating the net assets of foreign operations
Balance at beginning of year
17. Issued capital and contributed equity
17.1 Ordinary shares
Ordinary shares carry one vote per share and carry the right to dividends.
17.2 Options
18. Reserves
18.1 Foreign currency translation reserve
No. $ No. $
Balance at beginning of the year 565,849,207 4,226,599 309,318,675 1,695,066
Issue of options 200,000,000 1,086,019 578,084,781 4,492,920
Exercise of options (494,659,338) (3,595,484) (329,054,249) (2,347,653)
Share based payments 146,500,000 267,373 7,500,000 386,266
Options expired/forfeited (60,349,869) - - -
Balance at end of f inancial year 357,340,000 1,984,507 565,849,207 4,226,599
2012 2011
Consolidated Consolidated
Changes to the then Corporations Law abolished the authorised capital and par value concept in relation to share capital
from 1 July 1998. Therefore, the Company does not have a limited amount of authorised capital and issued shares do not
have a par value.
For
per
sona
l use
onl
y

Annual Financial Report 2012 45
2012 2011
$ $
Balance at beginning of year 611,428 225,162
Share based payments 267,373 386,266
Balance at end of year 878,801 611,428
Consolidated
2012 2011
$ $
Balance at beginning of year 3,615,171 1,469,904
Options issued 1,086,019 4,492,920
Options exercised (3,595,484) (2,347,653)
Balance at end of year 1,105,706 3,615,171
Consolidated
2012 2011
$ $
Balance at beginning of year 250,000 -
Advances from GBTI 1,750,000 250,000
Conversion to equity (2,000,000) -
Balance at end of year - 250,000
Consolidated
2012 2011
$ $
Balance at beginning of year (108,929,064) (100,865,126)
Net (loss) attributable to members of the parent
entity(7,172,034) (8,063,938)
Balance at end of year (116,101,098) (108,929,064)
Consolidated
Exchange differences relating to the translation of the net assets of the Group’s foreign operations from their functional
currencies to the Group’s presentation currency (i.e. Australian dollars) are recognised directly in other comprehensive
income and accumulated in the foreign currency translation reserve. Exchange differences previously accumulated in the
foreign currency translation reserve are reclassified to profit or loss on the disposal or partial disposal of the foreign
operation.
18.2 Employee share options reserve
The employee share options reserve arises on the grant of options to Directors and employees under the share plan.
Amounts are recognised in accordance with note 1 (r). Amounts are transferred out of the reserve and into issued capital
when the options are exercised. Further information about share based payment to employees is made in note 31 to the
financial statements.
18.3 General options reserve
The general options reserve arose on:
i. The grant of options to shareholders in November 2010 under the rights issue. Amounts are transferred out of the
reserve and into issued capital if the options were exercised by the expiry date. Options were valued at 0.8 cents
per option using the Black-Scholes method and all that were not exercised by the expiry date have now expired.
ii. The grant of options to Global Biofuels Trading Inc (GBTI) on 24 March 2012 under which one option was granted
for nil consideration for every share subscribed under the GBTI investment in the Group once the contribution of $2
million to equity was satisfied. Amounts will be transferred out of the reserve and into issued capital if the options
are exercised. Options are valued at 0.5 cents using the Black-Scholes method.
18.4 Other reserve
The other reserve initially arose in the 2011 year on advances made by Global Biofuels Trading (GBTI) to Besok Fuels Pty Limited
under which GBTI would provide $2 million funding with the funds to be used towards capital works. Under the arrangement the
complete draw down of the $2 million triggered Australian Renewable Fuels Limited to grant shares and options to GBTI as
consideration for this funding. No amounts remain in this reserve.
19. Accumulated losses
For
per
sona
l use
onl
y

Notes to the financial statements
for the financial year ended 30 June 2012 (continued)
46 AUSTRALIAN RENEWABLE FUELS LIMITED
2012 2011
$ $
Balance at beginning of year (138,118) (73,720)
Share of loss for the year (63,759) (64,398)
Balance at end of year (201,877) (138,118)
Consolidated
2012 2011
$ $
Not longer than 1 year 224,972 25,957
862,328 11,947
Longer than 5 years 1,824,633 -
2,911,933 37,904
Consolidated
Longer than 1 year and not longer than 5 years
20. Non-controlling interest
21. Commitments
The Group has entered into the following lease arrangements:
i. A 20 year lease of the land on which the Largs Bay facility is located which terminates on 31 October 2031;
ii. A five year lease on the Group’s corporate headquarters in St Kilda Road, Melbourne which terminates on 31 October
2016;
iii. Various leases of office equipment for terms not exceeding 5 years.
The Group had also previously entered into a commercial lease in relation to the former Perth head office but was terminated
during the year.
The following obligations relating to the leases are not provided for in the financial report and are payable.
22. Contingent assets and liabilities
i. Contingent asset – Picton land sale contingent consideration
In September 2009, the Group sold its land at the Picton site as part of a wider agreement for the development of an industrial
development in the area with additional deferred consideration being contingent on the successful sub-division of the land by the
purchaser. If formal sub-division of the land is completed, the Group will become the beneficiary of an asset in the form of one of the
sub-divided lots or additional proceeds from the sale of the lot. The nature of the deferred consideration is at the option of the
purchaser once sub-division has occurred.
ii. Legal claims
The Group is negotiating with a former Company officer to recover funds paid to him to which the Group considers he was not
entitled. This may result in a legal claim being made. There were no other outstanding legal claims at reporting date.
For
per
sona
l use
onl
y

Annual Financial Report 2012 47
23. Subsidiaries
All 100% owned Australian entities are part of the tax consolidated Group.
24. Cash flows from operations reconciliation
24.1 Cash balances not available for use
2012 2011
% %
Parent entity
Australian Renew able Fuels Limited Australia
Subsidiaries
Biodiesel Producers Limited Australia 100 -
Australian Renew able Fuels Picton Pty Ltd Australia 100 100
Australian Renew able Fuels Adelaide Pty Ltd Australia 100 100
ARF Global Pty Ltd Australia 100 100
Shelly Nominees Pty Ltd Australia 100 100
Besok Fuels Pty Ltd Australia 100 100
ARF Plantations Pty Ltd Australia 100 100
ASG Analytik Pty Ltd Australia 50 50
American Renew able Fuels Inc USA 63 63
Name of entityCountry of
incorporation
Ownership interest
2012 2011
$ $
Cash and bank balances 1,981,163 3,528,363
Bank overdraft (5,862,547) -
(3,881,384) 3,528,363
Consolidated
2012 2011
$ $
Security for bank guarantee 581,358 -
581,358 -
Consolidated
For
per
sona
l use
onl
y

Notes to the financial statements
for the financial year ended 30 June 2012 (continued)
48 AUSTRALIAN RENEWABLE FUELS LIMITED
24.2 Cash flows from operations reconciliation
25. Non-cash transactions
There were no non-cash transactions during the year ending 30 June 2012.
26. Financial instruments
26.1 Capital risk management
The Group manages its capital to ensure that all entities in the Group will be able to continue as a going concern while
maximising the return to stakeholders through the optimisation of the debt and equity balance. The Group’s overall strategy
remains unchanged from 2011. The capital structure of the Group can, at various times, consist of debt, cash and cash
equivalents and equity attributable to equity holders, comprising issued capital, reserves and accumulated losses. None of
the Group’s entities are subject to externally imposed capital requirements. Operating cash flows are used to maintain and
expand operations, as well as to make routine expenditures including tax and general administrative outgoings.
Gearing levels are reviewed by the Board on a regular and ongoing basis after consideration of the cost of capital and the
risks associated with each class of capital.
The gearing ratio at year end was as follows:
(i) Debt is defined as current and non-current borrowings as defined in note 15 which represents the convertible notes and derivatives issued as a component of the acquisition of
Biodiesel Producers Limited. The convertible notes are subordinated debt. (ii)
Includes bank overdraft facility drawn to $5,862,547 at 30 June 2012. (iii)
Equity includes all capital, reserves and accumulated losses.
2012 2011
$ $
Loss for the year: (7,235,793) (8,128,336)
Non cash items:
(Gain) / loss on disposal of f ixed assets and land - -
Interest expense on equity settled loan - -
(Gain) / loss on derivative liability - -
Interest income (87,211) (69,884)
Depreciation and amortisation of property, plant
and equipment2,355,295 1,015,948
Reclassif ied borrow ings to grant - (100,000)
Share-based payments expense 267,373 386,266
Employee share scheme options forfeited - -
Impairment / (reversal of impairment) of doubtful
debts- -
Impairment of non-current assets - -
Inventory w rite off - (526,697)
Net foreign exchange loss - -
Changes in net assets and liabilities:
(Increase) / decrease in assets:
Trade and other receivables 1,148,660 (246,173)
Inventories 1,605,908 (251,933)
Other assets (1,813,190) 271,371
Increase / (decrease) in liabilities :
Trade and other payables 1,989,325 743,440
Provisions 237,824 61,301
Net cash from operating activities (1,531,809) (6,844,697)
Consolidated
2012 2011
$ $
Debt (i) 13,650,000 -
Net (Cash and cash equivalents)/ Overdraft (ii) 3,881,384 (3,528,363)
17,531,384 (3,528,363)
Equity (iii) 9,389,051 9,517,840
Net debt to equity ratio 1.86:1 N/A
Consolidated
For
per
sona
l use
onl
y

Annual Financial Report 2012 49
26.2 Significant accounting policies relating to financial instruments
Details of the significant accounting policies and methods adopted, including the criteria for recognition, the basis of
measurement and the basis on which income and expenses are recognised, in respect of each class of financial asset,
financial liability and equity instrument are disclosed in note 1 to the financial statements.
26.3 Categories of financial instruments
The carrying amount reflected above represents the Group’s maximum exposure to credit risk on the principle amounts for such credit.
26.4 Financial risk management objectives
The Group is exposed to market risk (including currency risk, fair value interest rate risk and price risk), credit risk, liquidity
risk and cash flow interest rate risk.
The Group does not enter into or trade financial instruments, including derivative financial instruments, for speculative
purposes.
26.5 Market risk
The Group’s activities expose it primarily to the financial risks of changes in foreign currency exchange rates, commodity
prices and interest rates. The Group manages its exposure to foreign currency on an individual transaction basis and may
include entering into contracts in foreign currency when exchange rates are more favourable to the Company.
There has been no change to the nature of the Group’s exposure to market risks or the manner in which it manages and
measures the risk from the previous period.
26.6 Foreign currency risk management
The Group undertakes certain transactions denominated in foreign currencies, hence exposures to exchange rate fluctuations
arise. At the end of the year the Group was exposed to US Dollar (USD) currency fluctuations. Exchange rate exposures are
managed within approved internal policy parameters.
The carrying amount of the Parent’s foreign currency denominated monetary assets and liabilities at the reporting date were:
Foreign currency sensitivity analysis
Based on the financial instruments held at 30 June 2012 the Group’s post tax loss and equity would have been $30
higher/lower (2011: $2 higher/lower) with a 10% decrease/increase in the Australian dollar against the US dollar.
10% is the sensitivity rate used when reporting foreign currency risk internally to key management personnel and represents
management’s assessment of the possible change in foreign exchange rates in the short term.
The parent entity’s risk exposure to foreign exchange is therefore considered to be immaterial. Notwithstanding this, the
Group seeks to mitigate the effect of its foreign currency exposure by limiting the outflow of Group funds for activities outside
Australia. It should be noted that activities in the US are currently at minimal levels, as was the case throughout the reporting
period.
26.7 Interest rate risk management
The Group may, from time to time, be exposed to interest rate risk as entities in the Group borrow funds or enter into
structured debt facilities at both fixed and floating interest rates. The risk is managed by the Group by maintaining an
appropriate mix between fixed and floating rate borrowings. At June 2012, all borrowings were on a fixed rate basis and the
2012 2011
$ $
Financial assets
Cash and cash equivalents 1,981,163 3,528,363
Trade and other receivables 4,067,325 871,945
6,048,488 4,400,308
Financial liabilities
Bank overdraft 5,862,547 -
Trade and other payables 10,908,425 2,802,032
Finance lease liabilities - 10,800
Amounts payable on acquisition of BPL 5,443,875 -
Convertible notes 8,218,661 -
Derivative component of convertible note 5,431,339 -
35,864,847 2,812,832
Consolidated
2012 2011 2012 2011
$ $ $ $
US dollars (Australian dollars equivalent) 644,139 620,337 - -
AssetsLiabilities
For
per
sona
l use
onl
y
Notes to the financial statements
for the financial year ended 30 June 2012 (continued)
50 AUSTRALIAN RENEWABLE FUELS LIMITED
Group’s overdraft facility was on a floating basis. The Group’s exposures to interest rate on financial assets and financial
liabilities are detailed in the liquidity risk management section of this note.
Interest rate risk sensitivity analysis
The sensitivity analyses below have been determined based on the exposure to interest rates for derivative and non-
derivative instruments at the reporting date and the stipulated change taking place at the beginning of the financial year and
held constant throughout the reporting period. A 50 basis point increase or decrease is used when reporting interest rate risk
internally to key management personnel and represents management’s assessment of the possible change in interest rates
in the short term.
At reporting date, if interest rates had been 50 basis points higher or lower and all other variables were held constant, the
Group’s net profit increase/decrease would be $29,313 lower/higher on an annualised basis (30 June 2011: nil) due to the
variable nature of the overdraft facility. Being on a fixed rate basis, there would be no impact on the other borrowings. Other
equity reserves increase/decrease would be nil (30 June 2011: nil).
The Group’s sensitivity to interest rates has increased during the current period due to the introduction of the overdraft facility.
26.8 Credit risk management
Credit risk refers to the risk that counterparty will default on its contractual obligations resulting in financial loss to the Group.
The Group has adopted a policy of only dealing with creditworthy counterparties and obtaining sufficient collateral where
appropriate, as a means of mitigating the risk of financial loss from defaults. The Group’s exposure and the credit ratings of
its counterparties are continuously monitored and the aggregate value of transactions concluded is spread amongst
approved counterparties. Credit exposure is controlled by counterparty limits that are reviewed and approved on an ongoing
basis.
The Group does not have any significant credit risk exposure to any single counterparty or any Group of counterparties
having similar characteristics. The credit risk on liquid funds is limited because the counterparties are banks with high credit
ratings assigned by international credit rating agencies. All non-bank credit is subordinate to bank credit.
The carrying amount of financial assets recorded in the financial statements, net of any allowance for losses, represents the Group’s maximum exposure to credit risk without taking account of the value of any collateral obtained.
26.9 Liquidity risk management
Ultimate responsibility for liquidity risk management rests with the Board, which has built an appropriate liquidity risk
management framework for the management of the Group’s short, medium and long-term funding and liquidity
management requirements. The Group manages liquidity risk by maintaining adequate reserves, banking facilities and
reserve borrowing facilities by continuously monitoring forecast and actual cash flows and matching the maturity profiles
of financial assets and liabilities.
The following table details the Group’s contractual maturity for its non-derivative financial assets and liabilities. The table
has been drawn up based on the undiscounted cash flows of financial assets and liabilities based on the earliest date on
which the Group can be required to pay. The table includes both interest and principal cash flows.
For
per
sona
l use
onl
y

Annual Financial Report 2012 51
Level 1 Level 2 Level 3
$ $ $
Derivative financial liabilities - - 5,431,339
26.10 Financial liabilities at fair value through profit and loss
The fair value of derivative instruments are calculated using quoted prices. Where such prices are not available and the
derivative contains an option, option pricing models are used.
27. Key management personnel compensation
Details of Key management personnel
Key management is defined as Directors and other key management personnel as referred to in the
remuneration report.
Less than 1 1 – 3 3 months to 1-3 5+
month months 1 year years years
$ $ $ $ $
2012
Financial assets
Trade and other - 4,067,325 - - - -
receivables
Cash and cash 1.7% 1,981,163 - - - -
equivalents
6,048,488 - - - -
Financial liabilities
Overdraft (8.3%) 5,862,547
Trade and other
payables- 10,546,522 - - - -
Insurance premium
financing(4.7%) 361,903
Amounts payable on
acquisition of BPL- 3,443,875 - - 2,000,000 -
Convertible Notes (10.0%) - - - - 8,218,661
- Derivative component (10.0%) - - - - 5,431,339
20,214,847 - - 2,000,000 13,650,000
2011
Financial assets
Trade and other - 871,945 - - - -
receivables
Cash and cash 3.8% 3,528,363 - - - -
equivalents
4,400,308 - - - -
Financial liabilities
Trade and other - 2,502,032 - 300,000 - -
payables
Other - 10,800 - - - -
2,512,832 - 300,000 - -
Weighted
Average
Effective
Interest Rate
For
per
sona
l use
onl
y
Notes to the financial statements
for the financial year ended 30 June 2012 (continued)
52 AUSTRALIAN RENEWABLE FUELS LIMITED
2012 2011
$ $
Short-term employee benefits 1,352,112 834,644
Post-employment benefits - superannuation 79,443 52,051
Termination benefits 504,028 42,250
Share-based payments 236,408 377,609
2,171,991 1,306,554
Consolidated
2012
Balance at 01
July 2011
Received
through
rights issue
Acquired
through open
trading
Received
through
exercise of
options
Balance at 30
June 2012
Number Number Number Number Number
Directors
A. White(i) - - 9,150,000 - 9,150,000
J. Playoust(i) 203,545,809 - (7,964,132) 126,418,323 322,000,000
M. Costello(i) - - 3,095,000 - 3,095,000
P. Garling(i) 1,363,636 - - - 1,363,636
D. Page - - - - -
Other key management personnel -
C. Attw ood - - - - -
M. Burgess - - - - -
(i ) Includes all direct, indirect or associated party ownership.
2011
Balance at 01
July 2010
Received
through
rights issue
Acquired
through open
trading
Received
through
exercise of
options
Balance at 30
June 2011
Number Number Number Number Number
Directors
M. Costello - - - - -
P. Garling - - 1,363,636 - 1,363,636
R. Scott - 4,134,639 - - 4,134,639
T. Engelsman - - - - -
J. Playoust 120,127,486 42,673,284 - 40,745,039 203,545,809
C. Gullotta 3,400,000 2,266,666 - - 5,666,666
Other key management personnel
E. de Graaff 680,000 453,333 238,095 - 1,371,428
27.1 Key management personnel compensation
The aggregate compensation made to Directors and other members of key management personnel of the
Company and the Group is set out below:
27.2 Key management personnel equity holdings
Fully paid ordinary shares of Australian Renewable Fuels Limited
No other key personnel held or traded ordinary shares during the year. F
or p
erso
nal u
se o
nly

Annual Financial Report 2012 53
2012
Balance at 1
July 2011
Granted as
compensation
Granted
through
rights issue
or loan
conversion
Exercised or
Expired
Bal at 30
June 2012
Bal vested at
30 June 2012
Vested and
exercise-
able
Rights
vested
during year
Number Number Number Number Number Number Number Number
Directors
A. White - 45,000,000 - - 45,000,000 - - -
T. Engelsman 30,000,000 - - 30,000,000 - - - -
J. Playoust 131,418,323 10,000,000 - 126,418,323 15,000,000 5,000,000 5,000,000 -
M. Costello - 15,000,000 - - 15,000,000 - - -
P. Garling - 15,000,000 - - 15,000,000 - - -
D. Page - - - - - - - -
Other key management personnel
C. Attw ood - 20,000,000 - - 20,000,000 - - -
M. Burgess - 15,000,000 - - 15,000,000 - - -
2011
Balance at 1
July 2010
Granted as
compensation
Granted
through
rights issue
or loan
conversion
Exercised or
Expired
Bal at 30
June 2011
Bal vested at
30 June 2011
Vested and
exercise-
able
Rights
vested
during year
Number Number Number Number Number Number Number Number
Directors
M. Costello - - - - - - - -
P. Garling - - - - - - - -
R. Scott 5,000,000 - 4,134,639 - 9,134,639 9,134,639 9,134,639 2,500,000
T. Engelsman 30,000,000 - - - 30,000,000 15,000,000 15,000,000 7,500,000
J. Playoust 72,745,039 - 99,418,323 40,745,039 131,418,323 131,418,323 131,418,323 2,500,000
C. Gullotta 8,400,000 - 2,266,666 - 10,666,666 10,666,666 10,666,666 2,500,000
Other key management personnel
S.Scheffer - 7,500,000 - - 7,500,000 750,000 750,000 750,000
W. Day 5,000,000 - - 1,250,000 3,750,000 3,750,000 3,750,000 2,500,000
E. de Graaff - - 453,333 - 453,333 453,333 453,333 -
Options in Australian Renewable Fuels Limited
During the financial year 126,418,323 options (2011: 40,745,039) were exercised by key management personnel and Directors;
no options expired due to termination of senior management (2011: 1,250,000). Further details of the employee share plan and
of options granted during the 2012 and 2011 financial years are contained in note 31 to the financial statements.
For
per
sona
l use
onl
y

Notes to the financial statements
for the financial year ended 30 June 2012 (continued)
54 AUSTRALIAN RENEWABLE FUELS LIMITED
28. Related party transactions
(a) Equity interests in related parties
i. Equity interests in subsidiaries
Details of the percentage of ordinary shares held in subsidiaries are disclosed in note 23 to the financial statements.
(b) Transactions with key management personnel
i. Key management personnel compensation
Details of key management personnel compensation are disclosed in note 27 to the financial statements.
ii. Loans to key management personnel
There were no loans to key management personnel during the financial year.
iii. Other transactions with key management personnel of the Group
There were no other transactions with key management personnel of the Group during the financial year or in the
prior year.
(c) Transactions between Australian Renewable Fuels Limited and its related parties
i. Related parties
In the 2012 year the Company transacted with Global Biofuels Trading Inc (GBTI). GBTI are a substantial shareholder in the
Company and considered to be a related party.
During the year the following related parties of Directors exercised options: Michelle Playoust – exercised 4,666,666 options at 1c, converting into 4,666,666 ordinary shares.
The following entities with which the Group transacted throughout the prior financial year are considered to be related parties:
a. Wasabi Energy Limited – a substantial shareholder of Australian Renewable Fuels Limited which had a common
Company secretary (Alwyn Davey – resigned on 15 November 2010).
b. AGD Mining Pty Limited - which has a Director (Alwyn Davey) who is the Company secretary (resigned 15
November 2010) of Australian Renewable Fuels Limited.
ii. Trading transactions
During the financial year, Group entities entered into the following transactions with related parties that are not members of
the Group. All transactions were conducted on a commercial basis.
2012 2011
Wasabi Energy Limited: $ $
- corporate and administrative services - 208,639
- interest expense on loans provided - 95,602
AGD Mining Pty Limited:
- corporate and administrative services - 10,491
Global Biofuels Trading Inc
- sales 10,484,552 -
- feedstock 71,200
- throughput and freight costs 217,291 -
Consolidated
For
per
sona
l use
onl
y

Annual Financial Report 2012 55
2012 2011
$ $
Audit and review of the f inancial report 133,975 85,050
Non-audit services:
- Due diligence on BPL acquisition - 56,000
- Accounting treatment advice 2,500 -
Audit 878 -
Non-audit services:
- Tax lodgements 5,400 -
142,753 141,050
Consolidated
Auditor of the parent entity (Deloitte Touche Tohmatsu):
Former auditor of the Biodiesel Producers Limited subsidiary acquired by the Group on 1 November 2011 (WHK Group Limited):
2012 2011
Cents Cents
per share per share
Basic earnings (loss) per share (i) (0.34) (0.71)
Diluted earnings (loss) per share (ii) (0.34) (0.71)
i Basic earnings per share
(7,172,034) (8,063,938)
2012 2011
Number Number
2,088,286,443 1,143,771,562
Net Loss from continued and continuing operations
Weighted average number of ordinary shares for the purposes of basic earnings per share
Consolidated
29. Remuneration of auditors
30. Earnings per share
ii. Diluted earnings/(loss) per share
The options on issue have not been included in the weighted average number of ordinary shares for the purposes of
calculating diluted EPS as they do not meet the requirements for inclusion in AASB 133 “Earnings per Share”. The rights are
non-dilutive as they do not increase loss per share for continuing operations.
31. Share-based payments
31.1 Employee share option plan
Share options are granted to executives and staff as part of their remuneration package under the Employee Share Option
Plan. There are no cash settlement alternatives. The Employee Share Option Plan is designed to provide long term
incentives for senior managers and above (including Directors) to deliver long term shareholder returns. Participation in the
plan is at the Board’s discretion and there is no individual contractual right to participate in the plan or to receive any
guaranteed benefits.
During the financial year the Company issued 146,500,000 options to employees.
For
per
sona
l use
onl
y

Notes to the financial statements
for the financial year ended 30 June 2012 (continued)
56 AUSTRALIAN RENEWABLE FUELS LIMITED
Exercise
price
Fair value at
grant date
$ $
July 2007 45,000 June 2012 0.60 0.03
March 2008 5,360,000 March 2013 0.10 0.03
September 2008 1,500,000 September 2013 0.10 0.03
August 2009 1,750,000 September 2014 0.02 0.01
November 2009 50,000,000 September 2014 0.02 0.01
December 2011 45,000,000 December 2014 0.03 0.01
January 2012 4,000,000 December 2012 0.02 0.01
March 2012 57,500,000 February 2015 0.03 0.01
March 2012 40,000,000 March 2015 0.04 0.01
Option series grant date
Number of
options
Expiry
date
Inputs into the model
Option series grant date Grant date
share price
Exercise price Expected
volatility
Risk-free
interest rate
Option life
July 2007 3.4 cents 60.0 cents 180% 6.00% 60 months
March 2008 3.2 cents 10.0 cents 180% 6.40% 60 months
September 2008 2.9 cents 10.0 cents 217% 5.70% 60 months
August 2009 1.4 cents 2.0 cents 220% 4.90% 61 months
November 2009 2.0 cents 2.0 cents 208% 4.60% 58 months
December 2011 1.4 cents 3.0 cents 92% 3.02% 36 months
January 2012 1.4 cents 2.0 cents 94% 3.14% 12 months
March 2012 1.6 cents 3.0 cents 93% 3.70% 36 months
March 2012 1.5 cents 4.0 cents 93% 3.55% 36 months
The following share-based payment arrangements were in existence during the current and comparative reporting periods:
31.2 Fair value of share options granted in the year
The weighted average fair value of the options granted during the financial year is 0.47 cents (2011: 0.58 cents). They were
priced using a Black-Scholes valuation model. The inputs into this model were:
For
per
sona
l use
onl
y

Annual Financial Report 2012 57
Weighted
average
exercise price
Weighted
average
exercise price
cents cents
Balance at beginning of the f inancial year 58,385,000 2.1 52,135,000 2.1
Granted during the f inancial year 146,500,000 3.2 7,500,000 2.0
Exercised during the f inancial year (i) - - - -
Forfeited during the f inancial year (47,500,000) 2.0 (1,250,000) 2.0
Expired during the f inancial year (45,000) 60.0 - -
Balance at end of the f inancial year (ii) 157,340,000 3.1 58,385,000 2.1
Exercisable at end of the financial year 10,840,000 7.5 34,885,000 2.0
2012 2011
Number of
rights
Number of
rights
Consideration transferred
$
Cash fee to be paid (i)3,443,875
Contingent Consideration (ii) 2,000,000
Convertible notes issued - including derivative component (iii)13,650,000
Total Consideration 19,093,875
(iii) secured by charges and mortgages over assets and undertakings of BPL, Australian Renewable Fuels Adelaide Pty Limited and Australian Renewable Fuels Limited. These
securit ies are subordinate to the charge against the Group overdraft
(i i ) The Contingent considerat ion is a further payment to holders of the convert ible notes that may be triggered subject to certain criteria being achieved. Earn-out payments
can be made to the noteholders if the plant at Barnawartha achieves production levels greater than 43.5 million lit res per annum in each of the f irst three years from 1 November
2011. These payments will be 16.33 cents per lit re for each lit re of production in excess of 43.5 million lit res per annum for each year the excess is achieved. Should the average
level of production over the f irst three years from 1 November 2011 exceed 49.3 million lit res per annum, the potent ial earn-out payments period will extend for a further two
years, taking the earn out program to f ive years. M anagement has assessed the likelihood of the earn-out payments and applied discount cashf low rate against the quantum of
the payout to determine the Contingent considerat ion. This amount will be reviewed on an annual basis.
(i ) The cash fees to be paid have been recognised as current liabilit ies in the statement of f inancial posit ion and are due for payment on 31 December 2012. Convert ible notes
issued by the parent are recognised as non-current liabilit ies in the statement of f inancial posit ion. Acquisit ion-related costs have been excluded from the considerat ion
transferred and have been recognised as an expense in the statement of comprehensive income.
31.3 Movements in employee share options during the year
The following reconciles the outstanding options granted under the employee share option plan at the beginning and end of
the financial year:
(i) There were no options granted under the employee share option plan that were exercised during the financial year.
(ii) The share options outstanding at the end of the financial year had a weighted average exercise price of 3.1 cents (2011: 2.1 cents), and a weighted average remaining
contractual life of 2.5 years (2011: 3.2 years).
32. Business combination
On 1 November 2011, the Group acquired Biodiesel Producers Limited (“BPL”), a biodiesel producer with capacity of
approximately 60 million litres per annum. Details of the purchase are as follows:
Subsidiary acquired: Biodiesel Producers Limited
Principal activity: Producer of biodiesel
Date of acquisition: 1 November 2011
Proportion of shares acquired: 100%
For
per
sona
l use
onl
y
Notes to the financial statements
for the financial year ended 30 June 2012 (continued)
58 AUSTRALIAN RENEWABLE FUELS LIMITED
Assets acquired and liabilities assumed at the date of acquisition
$
Current assets
Trade and other receivables 4,450,741
Inventory 2,708,001
Other 235,202
7,393,944
Non-current assets
Property, plant and equipment 27,246,143
Current liabilities
Net Cash Overdraft (9,181,245)
Trade and other payables (6,365,349)
(15,546,594)
Consideration Transferred 19,093,493
$
Consideration paid in cash during the period -
Less: cash and cash equivalent balances acquired (overdraft) (i)(9,181,245)
(9,181,245)
(i ) overdraft carries a secured charge over the assets and undertakings of Australian Renewable Fuels Limited, Australian Renewable Fuels Adelaide Pty Limited, Australian
Renewable Fuels Picton Pty Limited and Biodiesel Producers Limited)
BPL became a wholly owned subsidiary on acquisition and has joined the Company’s tax-consolidated Group. For tax
purposes, the tax values of BPL’s assets are required to be reset based on market values of the assets. At the date of finalisation of these consolidated financial statements, the necessary market valuations and other calculations had not been finalised and the adjustment to deferred taxes, other intangibles and other liabilities has therefore only been provisionally
determined based on the Directors’ best estimate of the likely fair values.
Net cash outflow on acquisition of subsidiaries
Impact of acquisitions on the results of the Group
Included in the Group’s loss for the period is $1,151,373 profit attributable to the additional business generated by BPL.
Revenue for the year includes an additional $28,089,019 generated by BPL. Had the business combination been effected at 1 July 2011, the revenue of the Group would have been $52,341,561 and the Group’s net loss would have been $6,660,106.
33. Subsequent events
There has not been any matter, or circumstance other than has already been noted, that has arisen since the end of the
financial period that has significantly affected, or may significantly affect, the operations of the Group.
For
per
sona
l use
onl
y
Annual Financial Report 2012 59
Financial position
2012 2011
$ $
Assets
Current assets 1,382,503 3,198,510
Non-current assets 27,735,907 7,193,449
Total assets 29,118,410 10,391,959
Liabilities
Current liabilities 7,940,758 1,124,086
Non-current liabilities 13,726,169 -
Total liabilities 21,666,927 1,124,086
Equity
Issued capital 124,176,890 114,576,984
Retained earnings (118,709,914) (109,535,710)
Reserves 1,984,507 4,226,599
Total equity 7,451,483 9,267,873
Financial performance
2012 2011
$ $
Profit/(loss) for the year (9,174,204) (8,150,383)
Other comprehensive income - -
Total comprehensive income (9,174,204) (8,150,383)
Consolidated
Consolidated
34. Parent entity information
The accounting policies of the parent entity, which have been applied in determining the financial information shown below, are the same as those applied in the consolidated financial statements. Refer to note 1 for a summary of the significant
accounting policies relating to the Group.
For
per
sona
l use
onl
y

60 AUSTRALIAN RENEWABLE FUELS LIMITED
Directors’ declaration
The Directors declare that:
i. in the Directors’ opinion, there are reasonable grounds to believe that the Company will be able to pay its debts as
and when they become due and payable;
ii. in the Directors’ opinion, the attached financial statements are in compliance with International Financial Reporting
Standards as stated in note 1 to the financial statements;
iii. in the Directors’ opinion, the attached financial statements and notes thereto are in compliance with the
Corporations Act 2001, including compliance with accounting standards and give a true and fair view of the
financial position and performance of the Company and the consolidated entity; and
iv. the Directors have been given the declarations required by section 295A of the Corporations Act 2001.
Signed in accordance with a resolution of the Directors made pursuant to section 295(5) of the Corporations Act 2001.
On behalf of the Directors,
Philip Garling
Chairman
Melbourne, 6 September 2012
For
per
sona
l use
onl
y
Independent Auditor’s report
Annual Financial Report 2012 61
Independent Auditor’s Report
to the members of Australian Renewable Fuels Limited
Report on the Financial Report
We have audited the accompanying financial report of Australian Renewable Fuels Limited, which
comprises the statement of financial position as at 30 June 2012, the statement of comprehensive income,
the cash flow statement and the statement of changes in equity for the year ended on that date, notes
comprising a summary of significant accounting policies and other explanatory information, and the
directors’ declaration of the consolidated entity, comprising the company and the entities it controlled at
the year’s end or from time to time during the financial year as set out on pages 22 to 60.
Directors’ Responsibility for the Financial Report
The directors of the company are responsible for the preparation of the financial report that gives a true
and fair view in accordance with Australian Accounting Standards and the Corporations Act 2001 and for
such internal control as the directors determine is necessary to enable the preparation of the financial
report that gives a true and fair view and is free from material misstatement, whether due to fraud or error.
In Note 1, the directors also state, in accordance with Accounting Standard AASB 101 Presentation of
Financial Statements, that the consolidated financial statements comply with International Financial
Reporting Standards.
Auditor’s Responsibility
Our responsibility is to express an opinion on the financial report based on our audit. We conducted our
audit in accordance with Australian Auditing Standards. Those standards require that we comply with
relevant ethical requirements relating to audit engagements and plan and perform the audit to obtain
reasonable assurance whether the financial report is free from material misstatement.
An audit involves performing procedures to obtain audit evidence about the amounts and disclosures in
the financial report. The procedures selected depend on the auditor’s judgement, including the assessment
of the risks of material misstatement of the financial report, whether due to fraud or error. In making those
risk assessments, the auditor considers internal control, relevant to the company’s preparation of the
financial report that gives a true and fair view, in order to design audit procedures that are appropriate in
the circumstances, but not for the purpose of expressing an opinion on the effectiveness of the company’s
internal control. An audit also includes evaluating the appropriateness of accounting policies used and the
reasonableness of accounting estimates made by the directors, as well as evaluating the overall
presentation of the financial report.
We believe that the audit evidence we have obtained is sufficient and appropriate to provide a basis for our
audit opinion.
Liability limited by a scheme approved under Professional Standards Legislation.
Member of Deloitte Touche Tohmatsu Limited
Deloitte Touche Tohmatsu
ABN 74 490 121 060
550 Bourke Street
Melbourne VIC 3000
GPO Box 78
Melbourne VIC 3001 Australia
DX: 111
Tel: +61 3 9671 7000
Fax: +61 3 9671 7001
www.deloitte.com.au
For
per
sona
l use
onl
y

62 AUSTRALIAN RENEWABLE FUELS LIMITED
Auditor’s Independence Declaration
In conducting our audit, we have complied with the independence requirements of the Corporations Act
2001. We confirm that the independence declaration required by the Corporations Act 2001, which has
been given to the directors of Australian Renewable Fuels Limited, would be in the same terms if given to
the directors as at the time of this auditor’s report.
Opinion
In our opinion:
(a) the financial report of Australian Renewable Fuels Limited is in accordance with the Corporations Act
2001, including:
(i) giving a true and fair view of the consolidated entity’s financial position as at 30 June 2012 and of
its performance for the year ended on that date; and
(ii) complying with Australian Accounting Standards and the Corporations Regulations 2001; and
(b) the consolidated financial statements also comply with International Financial Reporting Standards as
disclosed in Note 1.
Material Uncertainty Regarding Continuation as a Going Concern
Without qualifying our opinion, we draw attention to Note 1 in the financial report which indicates that the
consolidated entity incurred a net loss of $7,235,793 with net cash outflows from operating activities of
$1,531,809 for the year ended 30 June 2012. As at that date, the consolidated entity also had a defiency in
net current assets of $9,744,381 These conditions, along with other matters as set forth in Note 1, indicate
the existence of a material uncertainty which may cast significant doubt about the ability of the company
and consolidated entity to continue as going concerns and whether they will realise their assets and
extinguish their liabilities in the normal course of business and at the amounts stated in the financial
report.
Report on the Remuneration Report
We have audited the Remuneration Report included in pages 8 to 13 of the directors’ report for the year
ended 30 June 2012. The directors of the company are responsible for the preparation and presentation of
the Remuneration Report in accordance with section 300A of the Corporations Act 2001. Our
responsibility is to express an opinion on the Remuneration Report, based on our audit conducted in
accordance with Australian Auditing Standards.
Opinion
In our opinion the Remuneration Report of Australian Renewable Fuels Limited for the year ended 30
June 2012, complies with section 300A of the Corporations Act 2001.
DELOITTE TOUCHE TOHMATSU
Ian Sanders
Partner
Chartered Accountants
Melbourne, 6 September 2012
For
per
sona
l use
onl
y

Additional shareholder information
Annual Financial Report 2012 63
Shareholder Shares Held
% of Issued
Capital
WASABI ENERGY LTD 291,811,381 11.95
UBS NOMINEES PTY LTD 233,670,951 9.57
AUSTRALIAN ENTERPRISE HOLDINGS PTY LTD <PLAYOUST FAMILY TR A/C> 200,000,000 8.19
GLOBAL BIOFUELS TRADING (MIDDLEAST) INC 200,000,000 8.19
ABN AMRO CLEARING SYDNEY NOMINEES PTY LTD <CUSTODIAN A/C> 58,475,002 2.4
THIRTY-FIFTH CELEBRATION PTY LTD <JC MCBAIN SUPER FUND A/C> 56,605,217 2.32
SEASPIN PTY LTD <APHRODITE A/C> 53,811,532 2.2
SWEET WATER PTY LTD <FARMOCEAN SUPER FUND A/C> 50,000,000 2.05
HARLEY CLARKE ENTERPRISES PTY LTD 48,000,000 1.97
ARCOURT RESOURCES NL 47,644,353 1.95
J & M PLAYOUST SUPERANNUATION PTY LTD <J & M PLAYOUST S/F A/C> 40,000,000 1.64
MINING & RURAL INVESTMENTS LTD 37,383,332 1.53
DIXSON TRUST PTY LTD 34,817,536 1.43
JP MORGAN NOMINEES AUSTRALIA LIMITED <CASH INCOME A/C> 29,551,525 1.21
REEF SECURITIES LIMITED 26,403,917 1.08
DHARMA KARTA PTY LTD 23,037,586 0.94
MR IAN JOHN JAMES 23,034,617 0.94
CVC LIMITED 22,702,161 0.93
HOTLAKE PTY LTD <HALCYON SUPER FUND A/C> 22,000,000 0.9
MR JOHN JOSEPH FERNAND PLAYOUST + MRS MARIE THERESE PLAYOUST <PLAYOUST SUPERFUND
A/C> 20,745,039 0.85
Total shareholding of the 20 largest shareholders 1,519,694,149 62.24
Shareholder Shares Held
% of Issued
Capital
WASABI ENERGY LTD 291,811,381 11.95
UBS NOMINEES PTY LTD 233,670,951 9.57
AUSTRALIAN ENTERPRISE HOLDINGS PTY LTD <PLAYOUST FAMILY TR A/C> 200,000,000 8.19
GLOBAL BIOFUELS TRADING (MIDDLEAST) INC 200,000,000 8.19
Additional information required by the ASX Listing Rules not disclosed elsewhere in the full year report is set out below.
The shareholder information set out below was applicable as at 31 August 2012.
1. Distribution of Shareholders
Distribution of ordinary shareholders and shareholdings is set out in the table below.
Voting rights as governed by the Constitution of the Company provide that each ordinary shareholder present in person or by
proxy at a meeting shall have:
i. on a show of hands, one vote only; and
ii. on a poll, one vote for every fully paid ordinary share held.
2. Largest shareholders
The names of the twenty largest holders by account holding of ordinary shares are listed below:
3. Option holders
The Company has no listed options.
4. Register of substantial shareholders
The names of substantial shareholders in the Company and the number of fully paid ordinary shares in which each has an
interest, as disclosed in substantial shareholder notices to the Company on the respective dates shown, are as follows:
5. Restricted Securities
The Company had no securities subject to escrow arrangement.
For
per
sona
l use
onl
y

64 AUSTRALIAN RENEWABLE FUELS LIMITED
6. General
Company Secretary:
Andrew Metcalfe (appointed 11 August 2011)
Stephan Scheffer (appointed 15 November 2010 and resigned 11 August 2011)
Principal Registered Office:
Level 5, 409 St Kilda Road
Melbourne VIC 3004
Postal Address:
Level 5, 409 St Kilda Road
Melbourne VIC 3004
Share Registry:
Computershare Investor Services Pty Limited
Yarra Falls
452 Johnston Street
Abbotsford VIC 3067
ASX Code:
ARW
Solicitors:
Gadens Lawyers
Level 25, Bourke Place
600 Bourke Street
Melbourne VIC 3000
Bankers:
HSBC Bank Australia Limited
188-190 St Georges Terrace
Perth WA 6000
National Australia Bank
500 Bourke Street
Melbourne VIC 3000
Suncorp Bank
Suncorp Centre
Corner Albert and Turbot Street
Brisbane QLD 4000
Auditors:
Deloitte Touche Tohmatsu
550 Bourke Street
Melbourne VIC 3000
For
per
sona
l use
onl
y