for reference losalamosscientific laboratory
TRANSCRIPT

I LA-86110-MS
as.—
.——
w-0
‘%
Oxidation of Depleted Uranium Penetrators and
Aerosol Dispersal at High Temperatures
For Reference
Not to be taken from this room
LOSALAMOS SCIENTIFIC LABORATORYPost Office Box 1663 Los Alamos, New Mexico 87545

An Affumative Action/~qual Opportunity Employer
A
.
This report was not edited by the TechnicalInformation staff.
This study was conducted on the recommendati-on of the Joint Technical Coordinating Groupfor Munitions Effectiveness, Working Group onDepleted UraniumMunitions, and was supportedby the Office of the AssistantProject Managerfor Tank Main Armament Development, XMITank System, under Army Project No.1L663608D060. The technical monitors werethe Working Group Chairman,E. W. Bloore, andE. F. Wilsey, both of the U.S. Army ArmamentResearch and Development Command, Dover,New Jersey.
DISCLAIMER
l%is report was prepued as an account of work sponsored by an agency of the United States Govern.
ment. Neither the United States Government nor any agency thereof, nor any of thek employees,
nukes any wdrranty, ehptm$ or implied. or assumes any Icgal liability or responsibility for the acc’ur-
acy, mmpleteness, or usefulness of any information, appar~tus, product, or process disclosed, or rep.resents that its use would not infringe privately owned rights. Reference herein m any spec’i!lc tom.mercial product, process, or service by trade name, trademark, manufacturer, or otherwise, does not
necessarily rnnstitute or imply its endorsement, recommendation, or favoring by the United StatesC.wxnment or any agency thereof. The views and opinions of authors expressed herein do not nec-essarily state or reflect those of the United States Government ox any agency thereof.
UNITED STATES
DEPARTMENT OF ENERGY
CONTRACT W-7405 -ENG. 36

LA-861O-MS
UC41Issued: December 1980
.
1
.
.
Oxidation of Depleted Uranium Penetrators and
Aerosol Dispersal at High Temperatures
J. C. ElderM. C. Tinkle
-.
-. .- .,.,. . .,
L
. .
.. ...- -.-s .– +.... .-
L

ABSTRACT . . . . . . . . . . . . . . . . . . . . . . . . . . . . . . . . . . . . . . . . . . . . . . . . . . . . . . . . . . . . . . . . . . . . . . . .
I. INTRODUCTION . . . . . . . . . . . . . . . . . . . . . . . . . . . . . . . . . . . . . . . . . . . . . . . . . . . . . . . . . . .
II. EXPERIMENTAL APPARATUSAND TECHNIQLA. AnalysisTechniques . . . . . . . . . . . . . . . . . . . . . . . .
1. GravimetricAnalysisofOxidation . . . . . . . . .2. High Volume Air Sampling and Analysis . . .3. Aerosol Size Analysis . . . . . . . . . . . . . . . . . . . .
ES . . . . . . . . . . . . . . . . . . . . . . . . . .. . . . . . . . . . . . . . . . . . . . . . . . . . . . .
. . . . . . . . . . . . . . . . . . . . . . . . . . . . .
. . . . . . . . . . . . . . . . . . . . . . . . . . . . .
. . . . . . . . . . . . . . . . . . . . . . . . . . . . .
4. ParticleSizingby Sievingand Sedimentation . . . . . . . . . . . . . . . . . . . . . . . . . . . . .
B. OutdoorBurnTesta . . . . . . . . . . . . . . . . . . . . . . . . . . . . . . . . . . . . . . . . . . . . . . . . . . . . . . .
C. Laboratory Oxidation and Aerosol Experiments . . . . . . . . . . . . . . . . . . . . . . . . . . . . . . .
1
1
24445667
III. RESULTSANDDISCUS SION . . . . . . . . . . . . . . . . . . . . . . . . . . . . . . . . . . . . . . . . . . . . . . . . 12
A. OutdoorBurnTests . . . . . . . . . . . . . . . . . . . . . . . . . . . . . . . . . . . . . . . . . . . . . . . . . . . . . . . 12
1. Burnl,2,and3 . . . . . . . . . . . . . . . . . . . . . . . . . . . . . . . . . . . . . . . . . . . . . . . . . . . . . . . 12
2. Burn4 . . . . . . . . . . . . . . . . . . . . . . . . . . . . . . . . . . . . . . . . . . . . . . . . . . . . . . . . . . . . . . . . 12
B. LaboratoryOxidationandAerosol Experiments . . . . . . . . . . . . . . . . . . . . . . . . . . . . . . . 18
1.
2.3.4.5.
6.7.8.9.
PenetratorOxidation byMassLoss . . . . . . . . . . . . . . . . . . . . . . . . . . . . . . . . . . . . . . 18
Penetratorand OxideDescription . . . . . . . . . . . . . . . . . . . . . . . . . . . . . . . . . . . . . . . 19
Aerosol Sizing Results . . . . . . . . . . . . . . . . . . . . . . . . . . . . . . . . . . . . . . . . . . . . . . . . . . 19
Effects of Temperature Change During the Run . . . . . . . . . . . . . . . . . . . . . . . . . . . 31
Aerosol Production as a Function of Time . . . . . . . . . . . . . . . . . . . . . . . . . . . . . . . . . 32
Particle Size Analysis by Sieving . . . . . . . . . . . . . . . . . . . . . . . . . . . . . . . . . . . . . . . . 32
Particle Size Analysis by Sedimentation . . . . . . . . . . . . . . . . . . . . . . . . . . . . . . . . . . 33
X-Ray Diffraction Analysis of DU Oxide . . . . . . . . . . . . . . . . . . . . . . . . . . . . . . . . . . 34
Scanning Electron Microscopy (SEM) of DU Oxide . . . . . . . . . . . . . . . . . . . . . ...34
IV. SUMMARY AND CONCLUSIONS . . . . . . . . . . . . . . . . . . . . . . . . . . . . . . . . . . . . . . . . . . . . 35
ACKNOWLEDGMENTS . . . . . . . . . . . . . . . . . . . . . . . . . . . . . . . . . . . . . . . . . . . . . . . . . . . . . . . . . . . 37
REFERENCES . . . . . . . . . . . . . . . . . . . . . . . . . . . . . . . . . . . . . . . . . . . . . . . . . . . . . . . . . . . . . . . . . . . . . 37
ADDENDUM A . . . . . . . . . . . . . . . . . . . . . . . . . . . . . . . . . . . . . . . . . . . . . . . . . . . . . . . . . . . . . . . . . . . . 38
ADDENDUMB . . . . . . . . . . . . . . . . . . . . . . . . . . . . . . . . . . . . . . . . . . . . . . . . . . . . . . . . . . . . . . . . . . . . 40
iv

.
.*
OXIDATION OF DEPLETED
AND AEROSOL DISPERSALURANIUM PENETRATORSAT HIGH TEMPERATURES
by
J. C. Elder and M. C. Tinkle
ABSTRACT
Aerosols dispersed from depleted uranium penetrators exposed to air and
air-COz mixtures at temperatures ranging from 500 to 1000”Cfor 2- or 4-hperiods were characterized. These experiments indicated dispersal of low
concentrations of aerosols in the respirable size range [typically <10-870of
penetrator mass at 223cm./s(5 mph) windspeed]. Oxidation was maximum
at 700”C in air and 800”Cin 5070air-50% COZ, indicating some self-protectiondeveloped at higher temperatures. No evidence of self-sustained burningwas observed, although complete oxidation can be expected in firessignificantly exceeding 4 h, the longest exposure of this series. An outdoorburning experiment using 10 batches of pine wood and paper packingmaterial as fuel caused the highest oxidation rate, probably accelerated by
disruption of the oxide layer accompanying broad temperature fluctuation
as each fuel batch was added.
I. INTRODUCTION
This report describes a series of experiments requested by the U.S. Army Armament Researchand Development Command (ARRADCOM) and performed jointly by Groups H-5 (IndustrialHygiene) and CMB-8 (Physical Chemistry and Metallurgy) of Los Alamos Scientific Laboratory(LASL). The primary purpose of the experiments was to characterize the nature and amount ofuranium particles dispersed if depleted uranium (DU) metal penetrators in anti-tank’ munitions(designated XM774) were subjected to fire in a storage depot or during transport. Normal storagecondition for DU munitions is within a large covered bunker (igloo) in the presence of excess air,soft pine wood storage boxes, paper-base packing tubes, and artillery propellant within the shellcasings. These materials are all combustible. Uranium is a pyrophoric material but sustains bur-ning only in finely divided form, that is, dispersed small fragments or fine turnings.1 Sincepublished data were limited on the dispersion of aerosols from large DU metal rods similar to the
1

penetrators, these experiments were initiated to simulate, in semi-controlled conditions, the ex-posure of the penetrators to high temperature, oxidizing atmosphere, and an intermediate windspeed of 223 m/s (5 mph).
The first phase of these experiments consisted of three simplified outdoor burn tests in whichburning DU turnings or artillery propellant provided the heat source. The second phase consisted .
of laboratory experiments in which penetrators were exposed to temperatures from 500 to 1000”C(all under the 1132°C theoretical melting point of DU metal) in a tube furnace under dynamic -flow conditions of air or an air-CO, mixture. The third phase consisted of a prolonged outdoor
%
burn within a wind tunnel apparatus. The heat source was the combustion of soft pine wood andpaper packing tube material in a 2.5 to 1 ratio by weight to simulate packing conditions of theXM774 round. The determination of characteristics of DU aerosols under violent conditions suchas combined wood fire and rapid propellant burning by which penetrators could be displaced intoor out of high temperature regions was considered beyond the scope of this test series.
Coleman and Schwcmdiman2 investigated particulate release from 0.69- by 1.9-cm longuranium cylinders at furnace temperatures from 400 to 1200”C. They observed a general increasein oxide particle size with increasing temperature. Less than 4% of the oxide formed was in the< 10-~m aerodynamic equivalent diameter (Da.) particle size range in any of the cases they in-vestigated. The air velocities over the cylinders were 8.3, 33.2, and 66.4 cm/s (significantly lowerthan the 223 cm/s suggested by ARRADCOM for our study). Effect of air velocity on theaerodynamic entrainment of uranium oxide particles was not clearly deduced in the referenced
study, although the authors expected air velocity effects to be more significant in entraining thesmaller particles formed at lower temperatures (400 -800” C). The specimens generally remainedintact until significant temperature change occurred to cause flaking during thermal contraction.
In another study, Megaw, et ala oxidized one kilogram uranium slugs at temperatures up to1000”C in air and pure C02. Air velocities ranged from 85 to 260 cm/s. Increasing particle sizewith increasing temperature was observed, as in the Coleman experiment. Average particle size
decreased with increasing velocity, probably indicative of some breaking up of oxide particles byincreasing turbulence. In the Megaw experiment, the specimens were heated in a high frequencyeddy current furnace rather than by heating coils external to the furnace. A sharp increase in ox-idation rate was noted between 750 and 800”C and was attributed to beta-gamma phase transi-tion at 771 “C. Slightly higher oxidation rates occurred in pure C02 than in air.
IL EXPERIMENTAL APPARATUS AND TECHNIQUES
The XM774 penetrator is shown in Fig. 1. This pointed rod is 34.5-cm long, 2.59-cm nominaldiameter, and weighs 3355 + 3 g. Its surfaces are smooth except for the 12.7-cm section of buttressgrooves (2.94-cm maximum diameter, 2.59-cm minimum diameter) located approximatelymidway and the 2. l-cm threaded length on one end. In its normal storage and deployment con-figuration, the penetrator is covered by a thin aluminum windscreen and a thicker three-piecealuminum sabot which joina the penetrator ta the shell casing and an aluminum tail tin threadedonto the rear of the penetrator. None of the experiments described here employed the aluminum
pieces to evaluate the fire protection the aluminum might offer the penetrator. Aluminum melts m
at approximately 650°C and would only offer protection to a penetrator at the periphery of a fue.
Techniques used to evaluate oxidation and measure particle size characteristics were consis-tent among the various experiments and are described below. In general, exposure times wereselected as follows:
(1) Fuel was expended, concluding the burn test;(2) 2-h run time was arbitrarily selected in the early laboratory experiments as producing a
desired effect on the penetrator; and
2

.
~ —. . . . . .
,-—L.
??!=5
-—=—_----—
.—— .
.——.—
..-—
----.,
-.
—
,.
_.
,-
.-
,.--,
.Fig. 1.
Pendrator XM774.
i
3
(3) 4-h runs were conducted in the later laboratory runs at DARCOM request.
The 223 cm./s (5 mph) gas velocity was selected as a reasonable compromise between the twoextremes of no wind and heavy wind. In all the experiments the 223 cm/s velocity was provided atthe plane immediately ahead of the penetrator. In all cases, some change in gas velocity occurred .
due to the presence of the penetrator and fuel and support structures causing reduced cross-sectional area in the flow channel. These changes were not investigated.
None of the experimental conditions was expected to produce an oxygen-deficient atmosphere,Half of the laboratory experiments were conducted using 50% air-50% CO, to simulate an at-mosphere containing a combustion product but this was by no means a reducing atmosphere.
A. Analysis Techniques
1. GravimetrioAnalysis of Oxidation. Penetrators were cleaned and weighed before each ex-periment on a Mettler beam balance capable of weighing 4 kg within +0.1 g. After exposure, eachpenetrator was cleaned by light mechanical work and motor-driven wire brushing. The penetratorwas then weighed on the same balance to determine the oxidation of metal caused by the ex-posure. Mass balances were performed in the laboratory experiments by separately weighing alloxide removed from the penetrator after the experiment. The penetrator was weighed after thelight mechanical work. To account for the nonrecoverable oxide mass removed by brushing, thedifference between this prebrushing penetrator weight and the post-brushing penetrator weightwas multiplied by a ptoichiometnc factor of 1.1829 and added to the oxide weight to yield thetotal oxide mass. The factor of 1.1829 is the theoretical conversion factor for the uranium-titanium alloy reaction to USOa - TiO,.
2. High Volume Air Sampling and Analysis. Mass concentration of DU aerosol was deter-mined by mass analysis of samples collected by high volume air samplers with flow rates up to0.038 ma/s (80 ft’/min). These samplers held a glass fiber filter [MSA1106BH (Mine Safety Ap-
pliances, Pittsburgh, Pennsylvania)] nominally 20 by 25 cm (8 by 10 in.) and were operated atvarious flow rates controlled by variable resistor on the blower motor. Gas flow rates werecalibrated in advance by pitot tube traverses of the duct. The DU mass collected on each filterwas determined by gamma counting one-fourth of the filter with a 10- by 10-cm (4- by 4-in.)thallium-drifted sodium iodide scintillation detector. Minimum detectable level of DU with thiscounter was 0.040 + 0.010 mg. Amounts smaller than 0.040 mg were acid leached from the glassfiber filters using an HC1 acid leach-ion exchange procedure (with about 40% recovery) and sub-mitted for separate analysis by delayed neutron counting technique.’ The acid leach removedcollected DU and the ion exchange removed sodium which interfered with the delayed neutroncounting analysis. Delayed neutron analysis requires the samples to be placed in a 25-cma vial,exposed to a high thermal neutron flux, and counted for delayed neutrons produced from fissionof the residual 2S’Uin the DU. Minimum detectable level of DU by this method was 0.02 Kg. DUstandarda were prepared for each set of samples.
The first sets of DU samples (Burns 1,2, and 3) were not successfully analyzed due to erroneous ~
scaling of DU mass on the firat samples. These samples were submitted for analysis by themethod routinely used for urinalysis, which was scaled for much lower concentrations, and weredisposed of after one count. Thereafter, special analysis procedures were initiated to preventfuture mishandling of samples.
4

3. Aerosol Size Analysis. Particle size characterization obtained during most of the experi-ments was obtained using one of two configurations of an inertial cascade impactor [Anderseneight-stage ambient sampler with 10-pm Da, precutter (Andersen Samplers, Inc., Atlanta,Georgia)]. Normal impactor sampling flow rate was 28.3 L/rein (1 ft8/min) at ambient conditions(approximately 775 mb and 20°C). Effective cutoff diameters (D,+) for each stage in the two con-figurations were:
CompleteImpactor Short Irnpactor
Stage
Precuttero1234567
Backup filter
D,, @m)
1095.84.73.32.11.10.70.4
Stage D,, (pm)
Precutter 100 9
Backup filter
The short impactor provided < 10-~m information with fewer samples. Stage Owas included onlyto provide mechanical transition between the precutter and the backup filter. An 8.2-cm glassfiber backup filter collected all particles passing the impactm stages.
Impactor mass data were analyzed by a computerized least-squares curve fitting routine inwhich a lognormal distribution of particle aerodynamic diameters was assumed. This distribution
is described by two parameters, mass median aerodynamic diameter (mmad) and geometric stan-dard deviation (a.). The data analysis technique included only the stage masses (not the precut-ter mass) owing to the predominance of the precutter mass in most samples. Including the precut-ter mass as an additional stage of the impactor resulted in mmada larger than 20 ~m, which waswell beyond the meaningful range of the impactor. Separate reporting of the precutter mass andstage masses was considered more appropriate. Sample substrates covering the impaction plateswere membrane filters [Millipore Type AA (Millipore Corporation, Bedford, Massachusetts)]throughout the laboratory experiments and in Burns 1, 2, and 3. Substrates were changed to glassfiber filters on inverted impaction plates to allow for heavier loading in Burn 4.
The effect of gas temperature on impactor calibration was not corrected for, owing to expecteddifficulty in measuring gas temperature at each impaction stage in each experiment. The max-imum error in D50 (largest at the precutter and stage O) would be proportional to (viscosity) l/zwhere viscosity of air increases from 183 micropoises at 18.”C (calibration temperature) to 211micropoises at 75° C (estimated maximum at Stage 1 during the laboratory experiments). Themaximum correction factor applied to the precutter and the first few impactor stages in this casewould be approximately 1.07 or <10% error in Dm, which is not significant in this instance.
Analysis of mass collected on impactor stages was initiated by screening each sample with thegamma counter. When the deposit was too small for gamma counting analysis, the sample wasarmlyzed by delayed neutron counting, either directly if a membrane falter sample or after ,acidleaching and ion exchange if a glass fiber sample. Membrane filters were folded and deposited in25 cm’ vials for delayed neutron counting analysis described earlier.

4. Particle Sizing by Sieving and Sedimentation. The oxide material collected from the tubefurnace in the laboratory experiments was subjected to sieve analysis to separate size fractionsdown to U.S. Standard No. 400 sieve (38 ~m) .’ The below 400-sieve material was then subjectedto sedimentation size analysis. The total oxide from each run was first sieved by hand on a U.S.Standard No. 12 sieve to remove very large pieces from the gross powder. Approximately 100 g of .
the DU oxide passing the No. 12 sieve was weighed to the closest 0.1 g and analyzed in a set ofnested sieves of the U.S. Standard series No. 16, 20, 30, 40, 50, 70, 100, 140, 200, 270, and 400. ATyler (W. S. Tyler, Inc., Mentor, Ohio) Ro-Tap shaker accommodated six standard sieves at atime, requiring two sieve runs for each analysis. The sieving time was 15 min. The mass fractionsretained by each sieve were weighed to the nearest 0.1 g and plotted as cumulative percent vsmesh opening on Tyler Screen Scale diagrams. Midpoint (50Yo) values from these plots providedan indication of central tendency, that is, a mass median diameter of nonairborne particles.
Particles passing through the U.S. Standard No. 400 sieve were submitted for size analysis bythe Sartorius Sedibal method.’ This method records mass increase vs time on a microbalance panat the bottom of an ethylene glycol column. Oxide particles were prepared for analysis by ul-trasonically agitating a suspension of 0.6 g oxide in ethylene glycol for 10 min to separateaggregated particles. The suspension was then introduced into the column and stirred. Mass set-tling on the microbalance was then recorded over appropriate time intervals. Sedimentationtechniques describe the particle size characteristics of the batch powder in terms of Stokesdiameter, which is the diameter of a sphere of the given density of the material which, in the samesuspension media and force field, has the same terminal settling velocity. Stokes diameter (STK)can be converted to D.., the diameter of a unit density sphere with the same terminal settlingvelocity in air, by multiplying by (particle density x slip correctional’2. If the particle size of in-terest is larger than approximately 1.5-~m geometric diameter, the slip correction is 1.0 and maybe neglected in this conversion. As will be noted in describing the sedimentation results later inthis report, this conversion was applied to sedimentation results to allow comparison with impac-tor results.
B. Outdoor Burn Tests
The four burning experiments described in this report were conducted at R-Site, Los AlamosScientific Laboratory, an unforested area used extensively over the paat 25 years for experimentsinvolving uranium. Background uranium was a potential problem in the first three burning ex-periments due to their proximity to heavy soil contamination at firing points E-F. This ex-
perience prompted moving the Burn 4 apparatus to a paved, low background area nearby.Burns 1,2, and 3 were simple preliminary experiments to determine if the penetrators could be
ignited. The penetrators were exposed to heat under expeditious, yet descriptive conditions of ox-idation in excess air. Figure 2 summarizes the conditions and general configuration of each burntest. Figures 3 and 4 show the arrangement of the Burn 2 apparatus, which differed from Burn 1and 3 only in the airflow path through the fuel-penetrator stack. All effluent gas from the hood inBurns 1 and 2 passed through the high volume air sampler. Burn 3 permitted open burning of thepropellant followed promptly by placement of hood and samplers. Burn 4 permitted release of the
.
smoke plume to the atmosphere. Occasional samples of Burn 4 effluent taken isokinetically withgross filter and eight-stage impactor with precutter collected aerosol for particle size characteriza-tion.
Thermocouples were added to measure penetrator temperatures after Burn 1. Chromel-alumelthermocouples were installed on the Burn 2 and 3 apparatus. Temperatures of the Burn 4penetrators were monitored by platinum-platinum-rhodium thermocouples attached to eachpenetrator. Each new batch of wood-paper fuel (10 total) was added to the fhrnace through a side
6

.—
.$
..—
..
Bum 1. . 1
%“Hi* vol”mmtmwkc0010 m3h
3 Pln9tr,to,,
Ou lunlw
t
I 0“,” 2 1 I Iluin3 1
H@! “dullw un~l.,
0,010IIPls
3 Pmel,,t.rs
DUwnirqi
Fl,cMcklccm 6..
h“ &HighUol”m,“msw0.038 m3h
3 %!ntraton
M.W votilm
Pm
T9nwmu. Memxmnmnc. .. . . .
Heed.mplm, m-dmm) II&mum phad3 dwonml alumd TIC: 13CO”Cr- ,ftsr !kn” did (!-
E awn 41
. .
.,
..
0.64-an Id.llc&i”ell, Pr.h
To
k-WnOYdl. r. —..
47m
-+&l
i
IIGOII
%
R.nd Tic
fm”-F+,,
WANmmm
a~m~l~.lo. mmlwdow
‘%3.05. ~h cub. std
t. X3070mx43cmMl hcf.r
Fig. 2.
Summary of outdoor burning experiments, general layout,
port. The side port was normally closed by a Pyrex glass window which allowed observation of thefire. A view of the penetrators ‘and furnace c&@-&ation
C. Laboratory Oxidation and Aerosol Experiments
The laboratory experiments were conducted at Wing 4,
is presented in Fig. 5.
basement of the CMR Building, LosAl{~mos Scientific Laboratory. Production of uranium compounds and other activities inv&inguranium are routinely performed in this laboratory.
Arrangement of the tube furnace and air samplers used in the laboratory experiments is shownin Fig. 6. The tube fiunace was a quartz tube 90-mm id. and 122 cm in length. Each penetratorwas located on the center line of the tube and was centered in the heat zone of the nichrome wirefurnace. The penetrator was supported on two lavite (soap stone) pedestals that were 1.3-cmwide, approximately 23 cm apart, and contacted the penetrator over a 120°arc. The pedestalswere perforated with large holes to permit gas flow on the underside of the penetrator; however,some obstruction of gas flow probably occurred. A smaller support was located midway betweenthe larger supports to limit sag of the penetrator at the higher temperatures.
The nose of the penetrator was usually pointed into the flow of gas; however, during the firstthree experiments the penetrator was positioned with the blunt end pointing into the gas streamto allow insertion of a thermocouple (T/C 2) into the 3-mm-diam hole at the blunt end of the

.
.
.
.
Fig. 3.
Burn 2 apparatus before assembly.
8

.,-
9

.
.
.
.
Fig. 5.
Interior setup of Burn 4 furnace box.
10

.AIR-IN
+
u
HE PAFILTER
AIRSUPPLY
co ~SUPRY FILTER
iii
.
*
.
‘WSTALS4:.-HIkza,, /m+cm+36cm_+ _ ~ ~pLAvlTE8 18 58 cm
. QvACPuMP
Fig. 6.
Laboratory experimental apparatus.
penetrator. When this proved unsatisfactory, the thermocouple
:.
% ‘)’’&’’”.,.’s. I
.
[IL/ ‘1 I ‘~’ (m
JAC FSNtTRATCR&BLOWER
D@&i ‘-”wi’
THERMO-I JIMWN
IMPACTOR COUPLESUPPLY
HIGH SAMPLERVOLUME-SAMPLER THERMO- 9omn 10
Cy:l :
RoTAMETER
(1-/czl
was placed alongside thepenetrator and the penetrator was reversed to direct its nose into the gas flow. Thermocouple T/C2 was placed in contact with the penetrator approximately 2.5 cm downstream of the first but-treis groove. T/C 2 provided consistent indication early in the run but drifted later as oxide beganto jorm on the penetrator, changing airflow around the thermocouple, or as the oxide sloughed offthe penetrator, leaving the thermocouple more exposed to cooling. Therefore, data from T/C 2during its stable period was used to determine the desired “nominal” temperature at its position;thereafter, T/C 1 controlled furnace temperature at the nominal temperature. Since incoming gascoaled the upstream end of the penetrator and caused a temperature gradient along its length, thenominal temperature should be considered an average temperature approximately 15 cm fromthe upstream end of the penetrator. Although total temperature gradient along the penetratorwa~snot measured, it probably was as high as 100” C in the high temperature runs.
In all experimental runs using air as the oxidizing gas, room air was drawn through a high-efficiency particulate air (HEPA) filter before entering the system. Airflow rate was determinedby measuring the differential pressure across a calibrated sharp-edged orifice using a micro-manometer. Gas flow of the air-COz mixtures was measured by rotameters calibrated against adry test meter. The gas mixture was based on equal volumes of CO, added from gas cylinders andfiltered air added from the building compressed air system. These gas streams were mixed in achamber and allowed to equilibrate at room temperature before being introduced into the tubefurnace. Oxidation of the penetrator during heating and cooling periods was retarded by purgingthe tube furnace with argon gas.,
A sample of the aerosol entrained in the gas stream downstream of the penetrator was collectedby an eight-stage Andersen impactor for particle size analysis. The remainder of the gas flowpassed through a high volume sampler that provided primary suction for the test system. Flowthrough the high volume sampler ranged from 147 ambient L/rein at test conditions of 1000”C inthe tube furnace to 242 ambient L/rein at 500”C.
Air samples from each run submitted for DU mass analysis consisted of a glass fiber filter carry-ing the contents of the precutter; eight Millipore filter impactor stage substrates; the gl~ss fiberbackup filter; a 10-by 12-cm glass fiber filter used to swipe the inlet tube to the high volume sam-pleir; a similar swipe of the high volume sampler holder; and four quarters of the 20-by 25-cm highvolume sampler filter,
11

A GCA portable respirable mass monitor (GCAnechnology Division, Bedford, Massachusetts)Model 101-1, was connected by flexible tube to the high volume filter holder on 12 of 15 ex-perimental runs to detect the time of onset of aerosol production. Sampling flow rate for this in-strument was only 2 ambient L/rein, not enough to interfere with the high volume sample. Sen-sit ivity of the instrument was approximately 0.1 mg/mS. Only a qualitative indication of the .
presence of aerosol was expected from this instrument.
.
III. RESULTS AND DISCUSSION
A. Outdoor Burn Tests
1. Burn 1, 2, and 3. Gravimetric analysis results of these preliminary burn tests are listed inTable I. Aerosol size characteristics data were not successfully obtained in these tests. Exposureof three penetrators to heat horn burning uranium turnings in still air (Burn 1) caused negligibleweight change or visually detectable surface change. Uranium from the turnings was recoveredwithin 0.5 g. The presence of aerosol was indicated only by light discoloration of the high volume
sample.Burn 2 results showed significant mass loss from all three penetrators (total 71.0 g). The forced
draft condition apparently caused significantly higher local heating. Although full time tem-perature measurements were attempted, thermocouples at the center of the DU turnings bundlewent off-scale at 12000C within 5 s of ignition and remained off-scale until 5 rein, 15 s into theburn. The 347 stainless steel sheath of one thermocouple melted near its tip; this metal melts at1400-1425”C. Two of the three penetrators were slightly bent, indicating that some softening oc-
curred. The melting point of pure uranium is 1132”C, which is below the estimated maximumtemperature for this run. However, the massive size of the penetrators and the lack of uniformheating over their full length probably prevented general melting.
Burn 3 demonstrated that exposure of penetrators to a short, but intense fire did not have asignificant effect as indicated by an observable surface change. Thermocouples and air samplersplaced over the fire pan after propellant burnout indicated low temperature (approximately
100”C) 1 min after the propellant burn and little aerosol as indicated by slight discoloration of thehigh volume sample. This test might have been more descriptive if thermocouples of adequaterange (> 1200° C) had been located in the propellant during the burn.
The general results of Burns 1,2, and 3 showed (1) self-sustained burning of the penetrators didnot occur, (2) oxidation of the penetrators occurred only in the forced-draft case (Burn 2), and (3)airborne material was produced in Burn 2.
2. Burn 4. The results of Burns 1, 2, and 3 led to further investigation of the forced-draft casein Burn 4. Direct exposure to the packing material fire, fanned by a 223 Cm/S (5 mph) wind for 3 hwas expected to represent a severe exposure condition. Since conditions of time, temperature, andwind velocity in a storage fire have not been postulated, it can only be surmised that these testconditions equaled or exceeded those of a storage fire.
Temperature cycles between each of 10 batches of fuel ranged from 700 to 900”C (see chart-
records in Addendum A). T/C No. 1 on the bottom penetrator was broken during installation andexhibited erratic performance. Highest temperatures were noted at the top penetrator (No. 3);11OO”C was exceeded during burning of 4 of the 10 batches.
Final penetrator weights after approximately 3 h exposure in the furnace box are shown inTable II. The middle penetrator was oxidized the most (47%). The least oxidation occurred at thebottom penetrator (42%), which was probably shielded somewhat by the ashes collected in the
12

TABLE I,---
.—
Burn Penetrator
. ~ jer ial No.
1 F0596091 F0592011 F045305.
F059609; F0592012 F045305
3 F0452073 F0452213 F045501
BURN 1, 2, ANO 3
Gravimetric Results
Mass Before Mass AfterTest 9) ~
3354.0 3354.la3355.6 3355 .8a3354.0 3354.1~
3354.1 3342.7a3355.8 3336 .2a3354.1 3313.3a
3357.8 3357.9b3353.5 3353.8b3356.7 3356 .8b
Gain or
&%!@
+0.1+0.2+0.1
-11.4-19.6-40.8
+0.1+0.3+0.1
TABLE II
BURN 4
Final Penetrator Ueights
Serial FinalLocation Number Number— . . ~
ToP 3 045313 1B74Middle 2 045109 17728ottom 1 045108 1947
%Oxide
$5:f Originalg Weight\
:;42
aAfter cleaning to bare metal .
bAfter scrLbbing with water to remove 2-3 g prOpell.Mt residue
bottom of the box. These penetrators are shown in Fig. 7 with the oxide layers still intact after ex-posure. After removal from the furnace box the penetrators continued to oxidize as they cooled, as
shown in Fig. 8. The penetrators were cleaned by wire brushing to remove all oxidized material, asshown in Fig. 9. Each sagged noticeably between the two supports of the frame.
The relatively high loss of material from the penetrators in this 3-h burn, 45% vs 25% on theaverage in the 4-h lab runs (7000C and above from Table IV) probably resulted from rapid tem-perature fluctuations causing the protective oxide layer to break away and expose fresh metal sur-face to be oxidized.
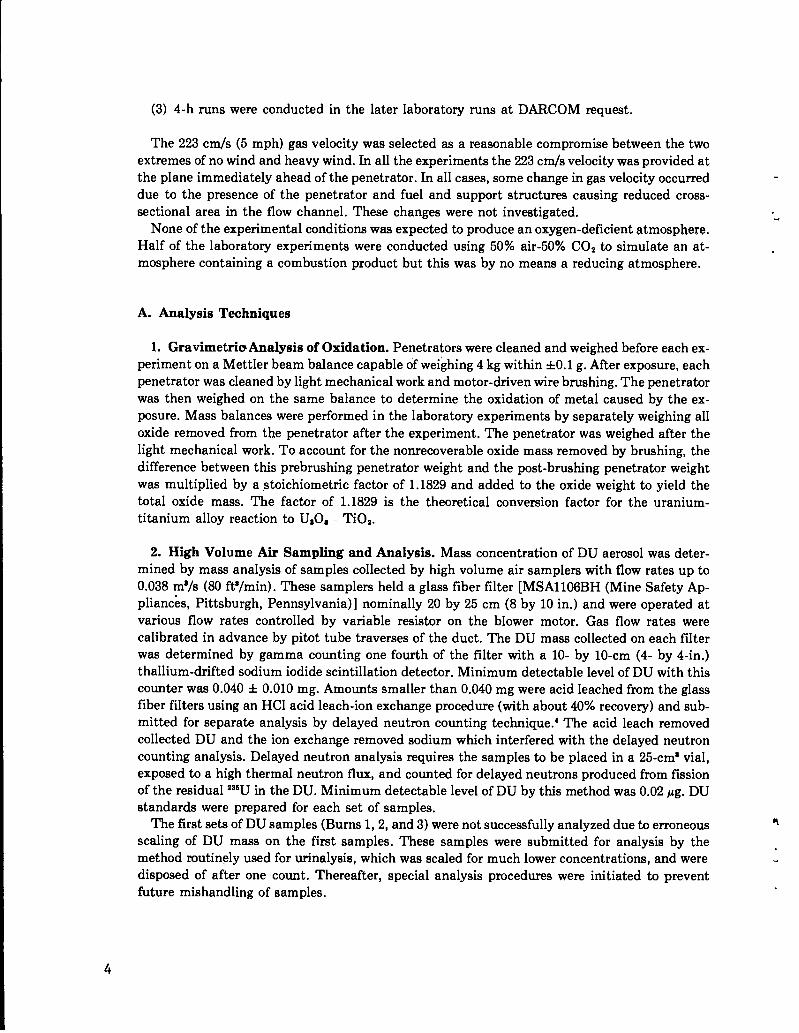
Air sampling results from Burn 4 are summarized in Table III. Oxide mass concentrations inthe tailpipe effluent ranged from 4.2 mg/ms during Batch 1 to 782 mg/mS during Batch 8. Theseail samples were initiated after the new batch of fuel was actively rekindled (4 to 5 min afterrestart of the blower). Variation of mass concentration among the four samples is probably at-tributable to temperature cycles of 700-9000C in progress during the 5-rein sampling periods. Dif-ferential thermal expansion of the base metal with respect to the oxide layer could cause materialto be dispersed, much of it small enough to remain airborne along the tailpipe. The air samplingperiods were selected during periods when this material dispersal was probably maximum. Con-centrations as high as 782 mg/mS (plus some wood smoke) should have been visually detected as aplume. However, visible smoke occurred only briefly upon restart of the blower, a time when thesalmplers were not operating.
The weight percent associated with particles <10 ~m listed in Table III ranged from 20 to 62%.This indicates a high fraction of aerosol mass was in the size range where lung deposition can oc-cur. The 20% < 10-~m mass result obtained during Batch 4 was the only sample obtained with allstages in the impactor and appears artificially low with respect to the other three results. Sinceflow calibrations were made for both impactor configurations and the proper flow ratespresumably used, this difference cannot be readily explained. If the same higher flow setting hadbeen erroneously used for all runs, the precutter-backup filter configuration of Batches 1,8, and10 would have sampled at 32.4 L/rein rather than 28 L/rein, causing a sample volume 16% higherthan expected and a precutter cutpoint shift downward of <1 ~m. This possible error is not largeenough to account for the much wider discrepancy in the weight percent <10 ~m from Batch 4.

...
14

..

———
.
r—-=——
—-
-_
.*.
.
—...
..
.,.,.
7
coo99—
d-
w
.
16
*
.
TABLE III
BURN 4 AIR SAhlPLJNGMASSES
Sample
Gross (47 rmn) (Vg)
Andersen Impactor
Precutter (U9)Stage O (U9)Stage 1 (119)Stage 2 (U9)Stage 3 (119)Stage 4 (V9)Stage 5 (U9)Stage 6 (119)
Backup Filt~;g~pg)Stage 7
Impactor Totalc (ug)
Batch 1
931
482aaaaaaa
4:9971
50
2;
4.2
Batch 4
15062
5695lo42b
58b34b
g.8b
13.5b405b5ogb5.4b
nob7138
20
2;
108
8atch 8
109407
13998aaaaaaa
21;9535993
615
28
782
Batch 10
45749
14980aaaaaaa
24;0839388
625
28
327
. .
percent <10 pmdSampling Time min)e
[Sampling Rate L/rein)Ouct OU Ma s Cone
(mg/m3)7
%ample- not taken (short impactor used).
bparticle size characteristics could notdue to preponderance of mass on Stage O.
cIncludes mass collected by PrecIJtter.
be analyzed from these data
dpercent <1o pm =Impactor Total - Precutterx 1oo.
Impactor TotaleSare sample rate for impactor and gross sampler.
fcalculated from gross 47-nMI sampler mass. Mass concentration based onthe sum of nine masses ‘on impactor stages is not considered as reliableas a single mass on the gross filter.
. ..”. . . . .
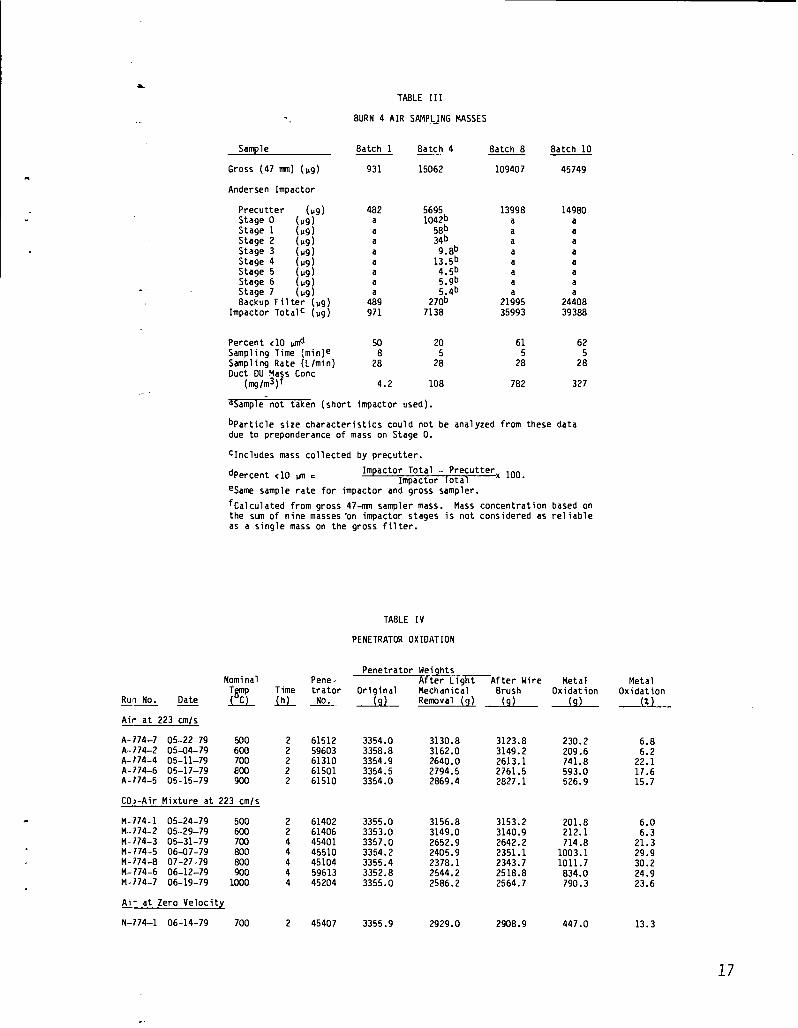
lWSLt. 1V
PENETRATOR OX IOATION
Penetrator k4ei@ts_~fter L i g~Af ter Wire
Original Mechanical Brush
-Ql_ Re~val (g) ~
Nominal Pene- MetalOxidation
9)
MetalOxidation
~
6.8
2!::17.615.7
6.06.3
21.329.930.224.923.6
T~PRU,I No. Oate .Ql-
trator~
~ at 223 cmls
A- 774-7 05-22-?9 500A- 774-2 05-04-79 600A- 774-4 05-11-79 700A- 774-6 05-17-79 800A- 774-5 05-15-79 900
CO_~-Air Mixture at 223 cm/s
6151259603613106150161510
3354.0 3130.8 3123.83358.8 3162.0 3149.23354.9 2640.0 2613.13354.5 2794.5 2761.53354.0 2869.4 2827.1
230.2209.6741.8593.0526.9
M-774-1 05-24-79M-774-2 05-29-79M- 774-3 05-31-79!4-774-5 06-07-79t4-774-8 07-27-7’9H-774-6 06-12-79M-774-7 06-19-79
&- at Zero Velocity
N-774-1 06-14-79
500600700800800900
1000
700
61402614064540145510451045961345204
3355.0 3156.8 3153.23353.0 3149.0 3140.93357.0 2652.9 2642.23354.2 2405.9 2351.13355.4 2378.1 2343.73352.8 2544.2 2518.83355.0 2586.2 2564.7
201.8212.1714.8
1003.11011.7834.0790.3
45407 3355.9 2929.0 2908.9 447.0 13.3
. .

B. Laboratory Oxidation and Aerosol Experiments
This series of experiments examined the effect of high temperature exposure of barepenetrators under various conditions of air-only and 50’%. air-50% CO, atmosphere at 223 cm/svelocity and zero velocity over time intervals of 2 or 4 h. General results of these experiments in-dicated (1) absence of self-sustained oxidation of the penetrators after external heat was
r
removed; (2) major effect of temperature fluctuation on the production of aerosol; and (3) produc-tion of aerosol in the respirable size range. .
At the end of runs with as-planned temperature histories, substantial amounts of fine black ox-ide (UaOs) were noted on the bottom of the furnace tube and all penetrators were coated with anapparently intact layer of black oxide. Only during the cool down period under inert atmospheredid large portions of the oxide layer span off due to thermal stress. Since this occurred after sam-plers were stopped, it is unknown if large amounts of this layered oxide was dispersed as anaerosol during the cool down period.
1. Penetrator Oxidation by Mass Loss. Penetrator to oxidation in the 13 experimentalruns of the laboratory series are summarized in Table IV. Three other runs, excluded from TableIV due to abnormal temperature fluctuations during the runs, are discussed separately in a later
section. Figure 10 shows amount of DU metal oxide after the high temperature exposures. Lightmechanical work and wire brushing was used to remove the oxide. Maximum oxidation in air oc-
curred at 700”C (22.1 ~. in 2 h) and in the air-COZ mixture at 800”C (30.2% in 4 h). At 500 and600”C, oxidation was approximately equal for the 2-h runs for both air and air-CO,. At 800 and900”C, the effect of extending the exposure time from 2 to 4 h was apparent; doubling the ex-posure time caused oxidation to increase by a factor of 1.6 to 1.7. The gas mixture had a minor ef-fect on oxidation rate at 500 and 600”C. This is not clearcut at 700”C, where the mass oxidized inair equaled the mass in air-COz in only half the exposure time. On the possibility that this dis-
parity was caused by chemical or heat treatment dissimilarity in the penetrator material, themanufacturer was provided serial numbers for review of chemical analysis. No significant dif-ference was apparent in either the chemical analysis or the heat treatment of the two batches.
Megati noted a sharp increase in oxidation rate between 750 and 850”C in both air and pureCO,. The general shape of the temperature vs oxidized metal relationship corresponds to Megaw’sresults. These results could have been compared more closely if tests at narrower temperature in-tervals had provided more detail in the vicinity of the phase transition temperature. A decrease in
l!.o
40 1 I I 1❑ AIR ONLY (2h)
I I6 ~Y. AIR-60% C02
x)
1>-(4h: 2hc 500 AND600 “C) +,
,/‘n
20
10 != +_U_L—d
5~ 600 700 800 900 low 1100
NOMINAL TEMPERATURE(%)
Fig. 10.Oxidation as a function of temperature.
18

I
clxidation at higher temperatures indicated (I) a degree of self-protection occurred as a harder ox-ide layer formed or (2) the gamma phase was not as susceptible to oxidation as the alpha phase,a.s suggested by Megaw.8
2. Penetrator and oxide Description. Photographs of penetrators and oxide samples after ex-posure and cleaning were delivered to ARRADCOM as part of the experimental documentation.The photographs included with the following descriptions were selected as typical or mostdescriptive of significant results. Unless noted otherwise, the physical appearance of a penetratorexposed to air-COz mixture was the same as the penetrator exposed to air at the same tem-
.perature.
Exposure at 500”C (2 h). The sharp edges of the buttress grooves and threads were oxidizedand surfaces roughened by a 2-h exposure at 500”C. The oxide came off in long fragile, blacklayered fragments, some as long as 10 cm (Fig. 11). Round disks of oxide with holes in the centercame from the blunt end of the penetrator, which had a 0.32-cm hole in it.
Exposure at 600”C (2 h). Buttress grooves were oxidized but were still visible after 2-h ex-posure at 600”C. The oxide came off in long black layered fragments, which were more resistant tobreakage than the 500”C oxide as shown in Fig. 12.
Exposure at 700°C (2 h). The penetrator exposed to air at 700”C for 2 h is shown in Fig. 13a.The buttress grooves were completely oxidized and deep imprints appeared where the lavite sup-ports conducted heat from the furnace to the penetrator. The effect of temperature gradient alongthe penetrator was also apparent with only minimal metal oxidation occurring at the blunt end.The black oxide contained fewer large fragments and was broken easily into small pieces as shownin Fig. 14.
The effect of air velocity on the oxidation of DU was investigated in one air run at 700”C withno flow. The penetrator experienced much lower oxidation (447 g vs 742 g) under no-flow condi-tions. Difference in the oxides of the two cases could not be visually detected.
Exposure at 800”C (2 and 4 h). Sagging of the penetrator was apparent at 800”C, particularlyalter 4-h exposure (Figs. 13b and 15a). Large pits appeared in the surface over the full length,which was distinctive of this temperature. The black oxides were similar in the 2-h air run (Fig.16) and the 4-h air-CO, run (Fig. 17), being composed of smaller particles and a few intermediate-size fragments.
Exposure at 900°C (2 and 4 h). The penetrators exposed to 900°C appeared in better conditionthan the penetrator exposed at 700 and 800”C (Figs. 13c and 15b). Remnanti of buttress groovesw,we apparent after 2-h exposure in air. Large pits appeared in the cooler portion of the penetratorexposed for 4 h. The trailing end showed hard, shiny surfaces after wire brushing. The black oxidefr,~m the 4 h air-co, run was composed of larger,generally hard, shiny, and dense fragments (Fig.
18), compared to somewhat finer particles from the 2-h run shown in Fig. 19.
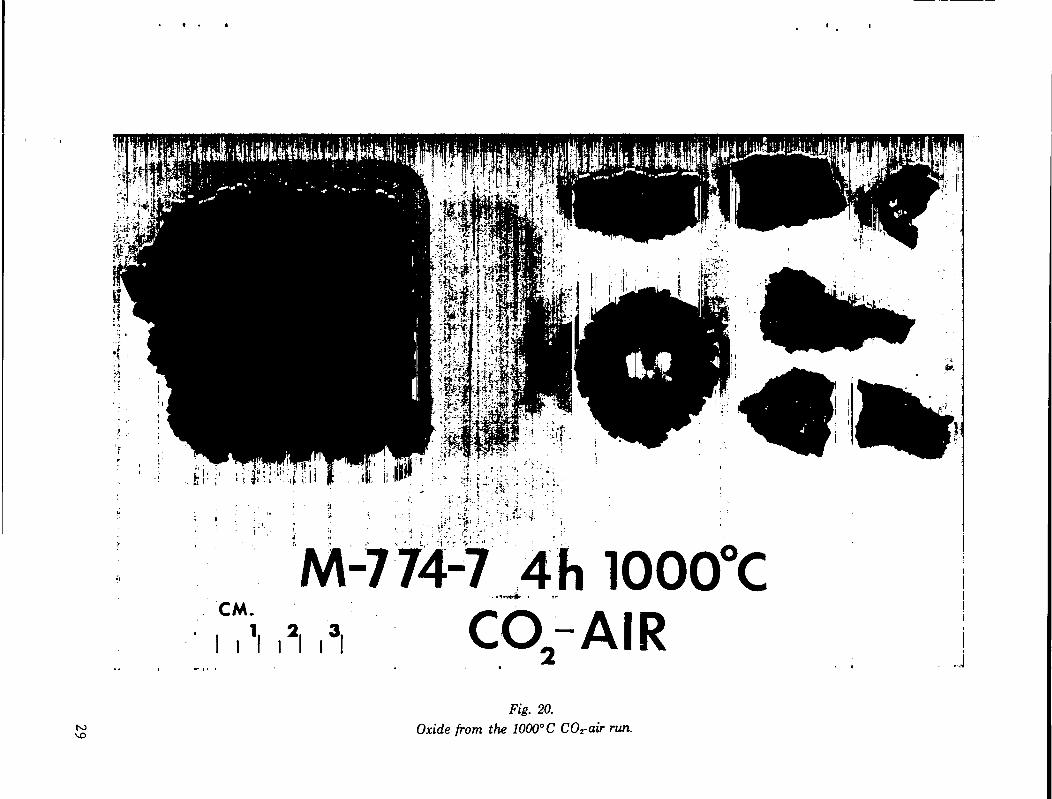
Exposure at 1000”C (4 h). The penetrator exposed to 1000”C for 4 h (Fig. 15c) was quitesi;milar to the 900° C penetrator, except for slightly more evidence of buttress grooves. The bulk ofits black oxide was also composed of large, hard, dense fragments (Fig. 20).
3. Aerosol Sizing Results. Aerosol size expressed as mass median aerodynamic diameter(mmad) of particles passing the precutter is displayed as a function of temperature in Fig. 21.
Geometric standard deviation (a.) of these aerosols ranged from 1.7 to 3.6 and indicated a

-...—
,..—
-.——
——-
,_-
—.—
--—....
....,..
uo
0
--..’:
~o...a
...
.
.0
g.._-.,.
.....
...,4--,..
,-,..->,.=.
\...=,.._~.,
—.
,..
.....-
..--.-,;=
—
—.
I
a0—
—
N——
.
20

——
........
....-
a-.-.&
_..
..
._.
i
uo0—
o
.::.....-
i-”,””....
..
...-
.-*.
.
“...,“
,-..!..
_..
,,,.<
,,..
..h1acr——N
—--
..
,,,
,....”..-.
-.,.,
........
!...
.,”.
21

u00~
22
~uo000
.m
-a
.
m—
a—
.——
.

.
..
.-
-.-&..l_
-—~..__—
.—-——
——
&@
.=
.—————.=—..
.—.—-.——
-...
.—.
——
..—
.—.=.-=
..
●
W-.1
f9—
N——
——
23
,!..

u‘oo00
..0
yo00cr—
r4-
-aIN
0uo
.
.CJ
24

.:._.-—
-.——
....
..,.,
~=
i=–.=
,_
,,,.,,,
It:
-..,r
---
.-L.
...
..
..
..
..
..
..—
-.—
.—
——
..
E------”
——$.-
=-:
-“—”-
“’“:’
‘“ ,.,,...
.J
’——
—..
....-..’
k==
=-.
“:’:.““-k
““
s
...
..
1.
—
,
..
‘7X..
=
..——
o00--
W%
&.
“--“”*
..‘?
@=qgg&___
‘:-..:”;,+-,
~,;:i,
....’-jj~.:-.‘
+2.;.,’;-....
...—.-
-..‘:-—
”.:.
-...
‘-:”:”
..!-+
..-—”.
.=..=.+O..-,-.
;—<
...”’;.s.
,..,.
-..+
..~
,.,....
>~.!:
I-*
@i—
25
-.

=@E
===—
—A
~...f,r.
.
.=
r.
..
.-.
..
....?
4~..
”“:”:.;...-
E==
“----
——
—-–.
..–-=--—.
.
k“
“.
:Y-<
uo00
.,.$“*
,&.
...)+
”‘.
●~“.
..’-,;:f.,.
.....
..
.—
-.
..-.=
..-.
........
.......-.
.......,-, LG-+
,.,.VJL
*.!
--
...--.=.-..
,,.—
..-...-:
.,_,,
...
..
.--
...=..+..
..
..
..
..
-..
..
..
G-T
“=%2+:’”’:
‘:‘
‘:.!:.:.-=:-2.-..:!:”’””
“=::.’:-”-’””:
=’2-.’-’:‘.”
‘.:’:,..
..
.
aI
N
ou
——
@i—
.
—
------.
....----
—.
.F
=—
x–
u_
.
26

.
F 1’<:---
1
.-..
:“”’-
...--—
;.,
.7”
.
F3
—---
—.
..-
●
u0B&
‘tulmk%
Iik--:.j“
:,_‘““”s~-~-”
“-%:,’.,
;;::.::..:,?$..:.?;!.+%
-*“
—-.
&[email protected]!i&,.
,“- w
d=
‘,’:.”,;:”+:’.?-~?““”
-‘..
,“.;.
J.-.
...
+,
.,..,
-i
+&L
.U
.._;i*;‘.,,.,
..
...
.-%
$....-,,,:
.“t
1?.
--..W
..
u)
{,~~.:::.,,,<;..<. -“:--.--’
.,““.’
‘::,,;,,
,.-
k----
:
,:-””.
..,-.
s
c7r——
er—
i
27

* —E5
->~.
Ej!!!
-----.
...
..-——-—
.---
+.
,,,—
-.-6
..
..
..
..Q
-
—-.
-.~
--..-—.
..
...
..
,-
F.
-=.—
.-.=
.G
-.
——
———
.c——
-
—.
—.—
=--.7
—.,—
-
-—,.:-
~..
..
...
-.
-—.
..=,
=
~—
—.–
—-
.–—..—
4?.
..
#
uo-,............
““o....
0
....
....
.,.
—-----.—
.-.— m
!_____ ..-,
-_.<
$—
...,.
”‘---.
+-w
-.—
L.
..
..
.-
-
L
m.-u
,,..
......
.69
.%-.,.
....
-.-.-..:–
.--.J—
.-
-...
4.
.
..I
wt%l’%“9am
—
@i——
.P
—
z–
u_
-.-
—..
—
28
,-
*..
—.—
.--—
——
.-
v,.
..-
0000.-,:.-.s,
...
....
.:.
.,.
~(”+
#~.;;.:
w..*:7T
“:“-i
,.).,..
:,.>
..“”,
;...-1
!:..:,
.....:.
,....
m.--t.?
.>Q
V;,;;.
~..:~~.
‘.+,:
;,.,”;,.’.”
i..
............
““’=1-....
,1
,/._,-
.“,..
.T
-.
-i-.“.
.>,
......,
~.-..,,-
..-.
a
4r—
N——
●P
,...
.5
>....
..
29

121 1 I I I I I I
A
A
AIR ONLY(2h)50% AIR-5”% (X12(4h;2ho 500 ANO-600 “c)
n
“~400 500 800 900 Icoo Ilco
NOMINAL TEMPERATURE (“C)
Fig. 21.Size of aerosol <lO-pm as a function of tem-perature.
somewhat broader size distribution at the 500 to 700°C temperatures than at the 800 to 1000”Ctemperatures. The mmads for the air runs dropped uniformly from 9 pm to 4.5 pm as temperaturewas increased from 500 to 9000C. The air-COZ results were not consistent with the air-only resultaat all temperatures, although the mmads remained generally in the same range (4-10 Vm). Fewerdata made it more difficult to establish a trend for the air-CO, results (the 600°C point was omit-ted because of insufficient mass collected; the 9000C point, because low mass collection in theprecutter made the result suspect). Of the four data remaining, only the 800”C result (9.5 Km) dif-fers significantly from the air-only result (5.3 pm). A possible source of variation in the air-CO,runs not present in the air runs was a COZ bottle change operation, which induced a 75-1OO”Ctemperature rise lasting about 1 min. This temperature change may have caused unusual aerosolproduction because of thermal expansion and contraction at the penetrator surface. Each run hadat least one COZ bottle change; the 900”C and 1000” C runs each had two changes.
Total aerosol mass collected on all impactor stages, the precutter, and in the high volume sam-pler is expressed as percent of penetrator mass in Fig. 22. The total mass of aerosol collectedranged between 10-4and 10-2~0of penetrator mass, the maximum occurring in the 1000” C air-COZrun. The scatter present in the data and different test durations do not permit a clearcut iden-tification of whether there is an effect on aerosol production when CO, is added to the at-mosphere. The trend of aerosol mass vs temperature was generally the same for the two gas at-mospheres if the time differential between 2 and 4 h is taken into account. Aerosol mass waslowest at 500-600°C, increased sharply at 700”C, decreased somewhat at 800°C, and increasedagain in the 9OO-1OOOOCrange. The 9000C point from the air-COZ runs was not omitted from Fig.22 as it was from Fig. 21 since the impactor mass had a negligible effect on the results described inFig. 22.
An estimate of aerosol mass associated with particles smaller than 10 pm as a percent ofpenetrator mass was obtained by multiplying the fraction of collected aerosol passing the precut-ter by the total aerosol mass as a percent of penetrator mass (Fig. 23). This result is considered aconservatively high estimate since mass concentration calculated from high volume sampler massand sample volume exceeded by factors of 3 to 4 the mass concentration calculated similarly from
.
30

16:
.
ao1-aa1-Wzwn
16:
I I 1 I I
,.
—
h I/\/\
/
l\/\/i/
//I
f/ O AIR ONLY (2h)
/& ~% AIR60%C02
/
(4h,2h@ 500 ANDma “c)
–~)
NOMINAL TEMPERATURE (“C)
Fig. 22.Aerosol mass as a function of temperature.
o
, I I 1’A -!
MOMINAL TEMPERTURATURE(°C)
Fig. 23.Respirable mass as a function of temperature.
impactor data. The probable cause of this discrepancy was placement of the impactor probe atthe centerline of the exit tube. Sedimentation of larger particles could be expected to cause higherconcentration of larger particles below the centerline of the tube, which the high volume samplerwould collect but the impactor would not. The impactor, therefore, provided mass concentrationof particles more likely to remain airborne a longer length of time. These estimates in Fig. 23 showa ,general increase in total mass associated with particles smaller than 10 ym as temperature in-creases. Again several discrepancies appeared in the data for the reasons described earlier. Thevery high value for the 700”C air-COz run may be real, in that no experimental problem was iden-tified nor was the mass analysis dubious because of insufficient sample size.
4. Effects of Temperature Change During the Run. Runs at 500 and 700”C in air and 800”Cin air-COz were omitted from earlier discussions because each had a temperature irregularity dur-
ing the run, which prompted repeating the run. Each run showed higher oxidation and aerosolmass than the repeated run at the same nominal temperature. Rapid cooling at some point in the
O AIR ONLY (211)A 50% AIR-SO% CO*
(4h;2h0500AN0600 “C)
A
500 cm 700 800 900 I 000

run apparently caused oxide coating to span off, exposing new surface to oxidation and aerosoliz-ing more material. The 800”C run showed remarkably high aerosol mass for its short duration (55min at 800”C plus 18 min cooling to 625”C).
5. Aerosol Production as a Function of Time. Aerosol production as a function of time wasfirst observed on a qualitative basis using the GCA respirable mass monitor. Positive detection ofan aerosol occurred within the first 6 min on all runs with nominal temperature of 700° C or above.At lower temperatures, mass concentration was apparently lower than the minimum detectionlimit of the instrument. The high temperature runs, notably 900 and 1000”C, exhibited positivereadings over the first 1 to 2 min after gas flow was initiated, then diminished after 10-15 min. .
This early production of aerosol prompted another oxidation run at 800”C for 4 h in which highvolume samples and aerosol weight percent <10 pm were determined over eight 30-min intervals.
Effects on the penetrator during this run were quite similar to the earlier 800”C run with netmetal oxidation of 1011.7 g and 1003.1 g, respectively. Both penetrators were distinctively pittedwith large pits. A complete log of data from this run (M-774-8) is included in Table IV.
Aerosol masses collected in the impactor and in the high volume sampler in each of the 30-minintervals are displayed in Fig. 24. The impactor data show a major increase in aerosol mass in thesecond interval and another increase in the fourth interval. The high volume sampler indicatedconsistent aerosol mass through the first three intervals followed by a major increase in the fourthinterval. The increased amount in the fourth interval coincided with the only COZ bottle changeand may have been caused by this perturbation. Both samplers indicated a gradual reduction inaerosol production after 2-1/2 h, but did not compare well in the earlier part of the run. Since avertical mass concentration gradient in the exit tube is probable (as described earlier), the sharprise in mass collected by the impactor in the second interval may indicate a temporarily higherrelease of smaller particles. Smaller particles, probably in the range of 10- to 20-~m D,., couldhave been collected in higher numbers at the impactor probe inlet without causing a similar largeeffect in the high volume sampler mass.
The primary results of this experiment are the initiation of aerosol production very early in theexposure period; and the gradual decrease of aerosol production with time after 2-1/2 h.
6. Particle Size Analysis by Sieving. The coarse oxide particles left in the furnace tube orremoved from the penetrator by light mechanical work were sieved by standardized methodsdown to 400 mesh (38 pm). Particle size analysis of sieve weight data was performed as shown inTyler Screen Scale diagrams attached as Addendum B. Cumulative percent of weight retainedwas plotted in these diagrams against mesh opening. Midpoint (50~0) values from these plots arepresented in Fig. 25 to indicate the variation in central tendency of sieve particle size as a func-tion of exposure temperature. Particle size of the sieved oxide from the air-only runs decreasedwith increasing temperature from 570 pm at 500”C to 180 ~m at 700°C. The midpoint size in-creased at 800 and 900” C. The drop in sieve particle size between the 500 to 600”C runs was morepronounced in the air-CO, runs. Results of the no-flow run at 700”C and the air-only run at 700”Cwere in close agreement, indicating a negligible effect of flow on particle size as defined by sieveanalysis.
Mega# observed only an increase in particle size at 600”C and above. Coleman’ performedsimilar measurements at 400, 500, and 600”C but did not observe a particle size decrease. The50% retained sieve size for 600”C in air was compared among these experiments: approximately130 ~m by Coleman, 10-40pm by Megaw, and 420 ~m in this experiment. At 800”C, agreement
was no better: 500 ~m by Coleman, 80 ym by Megaw, and 240 ym in this experiment. This varia-tion may be caused by differences in sieving practice, that is, percent values in this experimentwere based on mass passing a No. 12 screen. The other experimenters may have chosen other
methods.
32

.
k“~-=;:;i—G
-& m
>,000 ~ — 102In z(n - HIGHVOLUME MASSaz=
— IMPACTORMASS Y
2
(PRECUTM?,STbGE- 13LO,ANOBXKU
FILTERr. $‘-- PRECUTTERMASS
CJ zoo 6~3
8-1
---1- 4~ ‘$2
~xg
z x200 ---
-— 2---
------- ---
00 l/2111/22 Zln 3 3V2 4
0
HOURS AT 800 % IN FLOWING AIR - C02
Fig. 24.Aerosol mass as a function of time.
600 I II [ I
OAIR ONLY (2h)
V
C.C02 ‘AIR (2h)
❑ C02 -AIR (4h)500 ● NO FLOW (2h)
%~~ 400N
G
w
g 300
nwga!j 200
sg
I 00
t 1~J
700 8C0 900 ICOONOMINAL TEMPERATURE (“C )
Fig. 25.Sieve particle size as a function of temperature.
‘7. Particle Size Analysis by Sedimentation. The average Stokes and aerodynamicequivalent diameters of the oxide <38pm (passing the No. 400 sieve) are displayed as a functionof nominal furnace temperature in Fig. 26. Sedimentation analysis permitted assigning anequivalent diameter to each oxide batch in the absence of a detailed particle shape determina-ticln.
The D.. increased with increasing temperature from approximately 35 urn at 500”C to 60-65 ~mat 800”C. The particle size distribution of the oxide was bimodal. The major and minor modediameters and the average diameter are included in Fig. 26. The effect of temperature on D..determined by sedimentation analysis of the mass fraction of oxide <38 Wmindicated a differenttrend than was observed earlier with air samples. The Andersen impactor samples indicated thatthe mean particle size decreased with increasing temperature while the sedimentation analysisindicates that particle size increased with increasing temperature. However, the sedimentationanalysis includes particles that are much larger than the maximum size collected by the impac-tor, therefore representing a different set of particles. Sedimentation analysis includes particleshaving Da. over 100 ym while the impactor analysis includes particles having diameters up to 10~m. The impactor data is more closely related to the minor mode data in which the particle sizeshows a slight decrease with increasing temperature.
,41though there were only two 2-h air-CO, runs, the 500”C and 600”C data differed only 10 to20% from the air-only runs, as shown in Fig. 26. The 4-h air-COz run at 800”C and the no-flow runat 700° C were in close agreement with the air-only runs, showing negligible effect of atmosphereor time-at-temperature in the <400-mesh size range.
l?igure 27 shows weight percent for material with < 10-~m aerodynamic equivalent diameter es-timated from the sedimentation results. This information is of interest as an estimate of the frac-tion (by weight) of the <38-~m oxide which is in the respirable (<10 ~m) range. Also included forcomparison is weight fraction of the total oxide which was small enough to pass the 400-meshsieve. For the air-only runs, the weight percent of the <400-mesh oxide which is in the < 10-~mD,,, range was 8% at 500”C (0.04% of the total penetrator) and 14% at 900°C (0.07% of the total
33

penetrator). Comparison of these values to aerosol mass as a percent of penetrator mass in Fig. 23shows at 900” C only 0.0004’%0was aerosolized vs 0.07~0 retained in the oxide; at 500°C, O.00001~0vs 0.0470. Thus, only a small fraction of those DU oxide particles of apparently entrainable sizeactually became airborne. Other results shown in Fig. 27 were unremarkable except for the largeincrease of oxide particles <400-mesh produced in the 6000C air-COz (2 h) run. A difference intemperature history during the run is a possible cause; chart records show acceptable control dur-ing both runs, except for one extra COZ bottle change occurring in the 600”C run. .
8. X-Ray Diffraction Analysis of DU Oxide. DU oxide powder samples from the 2-h runswere examined by x-ray diffraction methods principally for phase identification and to ascertainany variations in crystallinity, which might be attributed to temperature history. The principalphase present was U,OO (orthorhombic); however, UO* was present in all samples in amountsranging from a trace to several percent.
All results are summarized in Table V. The effective crystallite size of the U,O, increases withtemperature; there appears to be little dependence on the atmosphere or time-at-temperature.The crystallite exhibit much greater perfection in the pole (reference) direction than in anydirection perpendicular to this pole, an indication of a columnar, layered configuration. The UO,phase increases in relative amount with temperature. The anomalously high relative amount ofUO, in the 700°C-no airflow sample has no readily apparent cause, but could be due to lessavailable oxygen in the no airflow experiment.
9. Scanning Electron Microscopy (SEM) of DU Oxide. SEM examination of <400-meshsamples was performed for morphological observation only; particle size characterization was notan objective. Oxide particles were manually dispersed from the bulk powder onto an adhesive-coated aluminum specimen stub. While the adhesive was still wet, a mild airstream was blownacross the sample by syringe to remove loose material.
O AIR ONLY (2h)A C02- AIR (2h)D C02 - AIR (4h)
● NO FLOW (2h)
e/4------a.. s>MINORMOOE
“-W.“’ ‘\
“b
o~40J 500 700 800 900 1000
NOMINAL TEMPERATURE(”C)
Fig. 26.Stokes diameter of particles <38pm as a func-tion of temperature.
iL
1 1 I I I ! I400 500 600 7C0 8ca 900 Icm
NOMINAL TEMPERATURE (“C )
Fig. 27.Mass distribution in sub-400 mesh sieve frac-tion.
.
.
34

TABLE V,.
RESULTS OF X-RAY DIFFRACTIONoF cIu OXIDE POWOERS
SampleTest Conditions
No.—;.
A-774-7-
A-774-2
A-774-4
A-774-6
A-774-5
M-774-I
/4-774-2
M-774-5
N-774-I
Temp (°C)
500
600
700
800
900
500
600
800
700
Time
2h
2h
2h
2h
2h
2h
2h
4h
2h
Atmosphere
Air
Air
Air
Air
Air
50~Air + SO%COZ
50ZAir + 50ZC0Z
50%Air + S()%COZ
Air - No Flow
EffectiveCrystallite
Size (A)
730
1100
1700
2300
3800
770
1350
1900
1650
Relative
UoiAmou t
0.35
0.73
0.82
0.99
4.24
0.30
0.22
2.54
2.19
One photomicrograph from each run has been deliveredto ARRADCOM. Particle shape wasfound to be highly irregular in all runs. Figure28shows particlesfromthe penetratorexposure at500°C in air; Fig. 29, at 700”C in air. The particles formed at 500”C appear smaller, as was expec-ted from the results previously described in Figs. 23 and 26. Particles in the 1- to 10-~m rangewere usually found, but most particles were in the 10- to 30-~m range. A few needle-like particlesas large as 1000 urn in length were present. Submicron particles were rare and usually found onthe surface of larger particles. The 500”C specimens appeared to contain higher populations ofsmall particles than the higher temperature runs. Lamellar structure was found in many parti-cles, particularly in the 700, 800, and 900”C photos. Often the lamellae were parallel to the shortaxis of the particle., A variety of particle shapes appeared to be present (leaf-like, needle, andequiaxial); these co@d not be characterized in detail by this SEM examination.
These forced-draft oxidation experiments indicated DU aerosols were dispersed at all tem-peratures in the range 500 to 1000”C. An outdoor burning experiment (Burn 4) with peak tem-peratures near 1100”C and broad temperature cycles oxidized 42-47% of original penetratorweight in 3 h, compared to a maximum of 3070 in 4 h in the 800°C laboratory experiment where auniform temperature was controlled. Burn 4 also produced more aerosol mass in the respirablesize range (up to 62°10of the total aerosol mass was associated with particles under 10-ym D~~,compared to a maximum of 14~0 in the laboratory experiments).
Gravimetric analysis of DU metal removed as oxide in the 2-h air-only experiments showed ox-idation increased by a factor of approximately three between 600 and 700”C to a maximum of
22% at 7000C. The 4-h air-CO, experiments showed a similar increase started between 600 and700”C and reached a maximum of 30% at 800”C. Decreasing oxidation at higher temperaturesprobably indicated a change in the oxide layer, which tended to protect the penetrator. Thisgeneral trend of maximum oxidation at 700 or 800”C agreed with Megaw results? although theseresults did not have sufficient detail to show that the maximum occurred at the beta-gammatransition temperature of 771”C, as Megaw suggested.
35

.
.
Fig. 28.Particles from 500”C exposure in air.
.
.
36
Fig. 29.Particles from 700”C exposure in air,

.
I ..
Mass median aerodynamic diameter of the DU aerosol passing the 10-pm precutter of the im-pe.ctor decreased with increasing temperature from 10 ym to 4 pm. Geometric standard deviationof these aerosols ranged from 1.7 to 3.6. Mass of aerosol particles < 10-~m Da. as percent ofpe netrator mass ranged from approximately 10-’% at 500”C to 10-S% at 1000”C. The effect onaerosol size characteristics of COZ in the atmosphere was difficult to determine because of the runtime change from 2 to 4 h after the air-only runs were completed.
Nonairborne oxide particles exhibited a decrease in median size (50% retained sieve size) be-tween 500 and 600”C followed by an increase in size at higher temperatures. This median particle
size range was approximately 100-600 pm. The referenced studiesz’g both found that particle sizeincreased with increasing temperature.
The particle fraction passing the finest sieve ( <38-~m linear dimension) was subjected to sizeanalysis by sedimentation techniques. This analysis indicated that D,, increased from approx-imately 35 pm at 500” C to 60-65 ~m at 800” C. The particle size distribution was bimodal in this
sixe range with the minor mode generally 10- to 20-pm Da,. The presence of major amounts of par-
ticles <10-pm Da, in this fraction indicates only a small fraction of oxide particles of apparentlyentrainable size actually became airborne.
General conclusions to be drawn from these experiments with bare penetrators are as follows:
(1) DU aerosols with particles in the respirable size range are produced when penetrators areexposed to temperatures above 500° C for times on the order of one-half hour or more.
(2) Production of the oxide and of aerosol was enhanced by forced-draft and temperature cycl-ing during exposure of penetrators under fire conditions.
(3) Penetrators did not exhibit any tendency toward self-sustained burning, although completeoxidation could no doubt be achieved if adequate fuel and time (longer than 4 h) were provided.
ACKNOWLEDGMENTS
our sincere thanks go ~ the following people who contributed significantly to this project: Er-
nest Bloore and Ed Wilsey, ARRADCOM; Joe Greene, M-2; Dick Heaton, Hal Ide, Jean Lindsey,H-5; John Magnuson, CMB-6; Leonard Levinson and John O’Rourke, CMB-8.
REFERENCES
1. J. Katz and E. Rabinowitz, The Chemistry of Uranium, p. 165, McGraw-Hill, New York,19!;1.
2. L. F. Coleman and L. C. Schwendiman, “Particles Generated During the Air Oxidation ofUranium, ” Hanford Laboratories report HW-SA-2641, August 1962.
3. W. J. Megaw, R. C. Chadwick, A. C. Wells, and J. E. Bridges, “The Oxidation and Release ofIodine-131 From Uranium Slugs Oxidizing in Air and Carbon Dioxide, ” Reactor Science andTechnology (Journal of Nuclear Energy Parts A/B) 15, 176-184 (1961).
4. H. M. Ide, W. D. Moss, M. M. Minor, and E. E. Campbell, “Analysis of Uranium in Urine byDelayed Neutrons, ” Health Phys. 37, 405-408 (1979).
5. ASTM Specification E-11-70, “USA Sieve Series. ”
6. Commercial Bulletin, “Sedimentation Balance for Automatic Determination of Particle SizeDistribution, ” Sartorius-Werke AG, Gottingen, West Germany.
37
.
ADDENDUM A
Temperature Chart Records
Burn 4
.
38

‘.
~.
.
..!
.
. .
.-!
‘.
.!
.!
0.
TEHPERATIJRE HISTORY OF
NIDDLE PENETRATOR PENETRATOR
I
I1
1E. ~
54-0,+
.. .!*....!- !!- ,.
!.0s ,,,
!,”, W___
\ --------
2......!. .
s
--,f~, ,+7{ /.5
.-., . . . . . . . . .“”
.-
. . ., -..
.,
.,
“
!,
.
!,
.,
.s
!,
.>
!,
.,
!.
. .
!.
.
. .
.
. .
.
,,
..
..
..
.
,.
,.
>
.0
!...$ . . .
<,
: ,. .4 ,.: .x !-. .00 a!”
. .,,. -. ‘f
-2===’-..>,
3“w- ‘,
.-.. . .....,,.---,, . . . . . ..
,2
+7— .,.4 .
,C: .,
,U# .
,,.0
,.
,=
-k:---“. . . .!..
. !“ .x 4- >- a ,-
-=.-
.’. ”. A...,:,“ ::. ,,, ,,,
‘T:-’4 —,.--!:.. ... .. .
,2 ..., .
>
..
3-—--...........,,.s., .,,. ,!
- .-l-
C:. =.l
—. “ A ,----,, .,., . .
%f> ,
,,
2-4
“
.>
.>
..-.
P ● .-.-.-......“, .
,, .,..---.’=<O ..
.’ ‘-- + z “ =:”’”=’->
... ,. ,.4
—.. - ..-.. ,----
. . ..O ,,,,e
a 2-”/%1“
T]. ==% ‘[’u’w~*-—“....-.., ,. .-, .
. ...!.. ,,”
.
39

ADDENDUM B
Sieving Diagrams for Air-Only, CO,-Air at 800”C, and No Flow Runs
40

I
.
The Tyler Standard Screen Scale ?omNo. 1.4Plyhme:ty;bo”.
Cumulative Logarithmic Diagram of Screen Analysis on Sample of_~S&~&Q% L-OName 1P - Date ~/lJ77
.
,
uIIIn
—. 20.67
— $11.6s
1:).33
1).423
O.esso
‘— 4.6ee
‘— :1.327
.= :;
/# f. fee
H .e33
f) .oee
.417
-J’ .2e6
+. .zoe
.14T
.~ .104
## .074a
,●
“a
Pas< I
Igs
Inchas
1.060.742
.eae
.371
.263
.teo
.131
.oe3
.066
.04e
.03!4s
.0232
.0104
,Olle
.ooez
.0068
.0041
.oo2e
Fr ,73
jzzz3468
10
14
20
2e
36
4e
ae
100
160
200
Ji?a
u. s. SamrdeP9r Cent Sanlpl, Pw Cant
%molo
I
P*r Cant
No. WeightsPer C*II1 Cumulative
Wol,htsPer C8nt Cumulathfn
W,lghhPar Cant Cumulatlv*
Wdghls Walghts Wolshh
I r- +4 I
ri~i==i-==—,
e — .— ~—’—
‘zEl%&”’4K’-LA
41

The Tyler Standard Screen Scale ?.mNo. 1.-4Pleu8 mantl.. stave
who. Ordarllu
Cumulative Logarithmic Dia- ~a~;f Screen Analysis on Sample of DeD Iew q 3og ~.6
Name SO% d~~ - .50, / 9 Date. s/1/79 ‘
—.,—
:7i?-,,,~
,,,—.
OoeMllll-
metem
26.67
18.8613.33
0.423
6.680
4.690
3.327
2.302
1 .s51
1.16s
.833
.680
.417
.206
.20s
.147
.104
.074
Zs!ili
_&s
+
IRSTyler
I
u. s.
I
Samplo
I
Per CmSampln
Par Con: ~~~}o ~j$~f,Pw tint
Inches Mesh No. WeightsPer Cent Cumulative Welshts
Par Cant CumulathmWeluhta Walahts
.742
.626
.371
.263
.186
.131
I.093
.006
.046
.0320
.0232
.0164
.0116
.0082
.0068
.0041
3
4
6
a
I 10
14 I20
26
36
48
06
100
160
4
s.
8
12
16
20
30
40
60
70
100
140
200 I 200
*
.
●
42

.
..
.
w
80
70
m
50
40
30
10
0
,
The Tyler Standard Screen Scale FmNo. L-4P~h.:~:tOva
.—
.— .
.————.———
A
.*———.It——.—
.—..* —_ m....._!L—
.“— — “--- .,.. — —
SCREEN SCALE RATIO 1.414 [A-774-G (8-Y A- 77+6 (9mx4 N-77+-I ‘J?)+ I-—opt
MIlll-mctem.—
z!e. e7
18.86
13.33
0.423
e.eao
4.89e
3.327
2.382
1 .6s1
1.1ss
.s33
.6s9
.417
,206
.20s
.147
.104
.074
-A@
.&
,038
--l18s
Tylar
Inches Mesh
1.060
.742
.s2s
.371
.263
.1s6
.131
.093
.0s6
.046
.0320
.0232
.01s4
.011s
.00s2
.00ss
.0041
.0020
’52?0+4 I
3
4
6
a
!0
14
20
2s
35
48
0s
100
160
200
_Z!!Z
AQQ
J&XL
u. s. Ssmol* IPer Cant
San’@ePer Cent
SWIW19P*I Cmnt
No. Weiahts Per Cent Cumulative Weights Per Cent CumulativeWelahts Per Cant Cumulative
Weights Weights Welgtlu
U.d 5 q -2Zz. =ia %.3.‘z,
=i”k’, bjx(”de —— -—~=’s; / ==&&%
1s.20
30
40
60
70
100
140
200
*
A@
*Q
@
“.- “.”
7iz-+.’1
,3
?&f%
z
n .
43
U.S. ARMY DISTRIBUTION LIST
Office of Secretary of Defense(Health Affairs)
ATTN : LTC B. ChasePentagon, Room E171Washington, DC 20301
Office of Secretary of DefenseOffice of Director of Defense
Research and EngineeringATTN : Mr. J. PershEngineeringWashington, DC 20301
Office of Assistant Secretaryof Defense for Atomic Energy
ATTN : Cmdr. G. CliffPentagon, Room 3E1069Washington, DC 20301
Honorable Percy A. PierreAssistant Secretary of the Army
for Research, Developmentand Acquisition
Department of the ArmyWashington, DC 20301
Office of the Undersecretaryof the Army
Deputy Undersecretary (Operations)Research
ATTN : Mr. D. HardisonDepartment of the ArmyWashington, DC 20310
Undersecretary of Defense forResearch and Engineering
Deputy Undersecretary(Tactical Warfare Programs)
Department of DefenseWashington, DC 20310
DirectorDefense Advanced Research Projects
AgencyATTN : Tech Info1400 Wilson Blvd.Arlington, VA 22209
Undersecretary of Defense forResearch and Engineering
Deputy Undersecretaryand Advanced Techno’
ATTN : Dr. A. BementDepartment of DefenseWashington, DC 20301
Office of the Deputy I
(Research 3Ogy)
.
ndersecretaryof Defense, Research and
ATTN : Mr. R. ThorkildsenPentagontiashington, DC 20301
HeadquartersDepartment of the ArmyATTN : DASG-TSP-E, COL WangemanWashington, DC 20310
HeadquartersDepartment of the ArmyATTN : DACS-DMTtiashington, DC 20310
HeadquartersDepartment of the ArmyATTN : DAMA-ARX-A, Dr. M. LasserWashington, DC 20310
HeadquartersDepartment of the ArmyATTN : DAMA-CSS, Dr. J. BryantWashington, DC 20310
HeadquartersDepartment of the ArmyATTN : DAMA-CSM, LTC GermanWashington, DC 20310
HeadquartersDepartment of the ArmyATTN : DAMA-CSM-CA, Mr. LippiWashington, DC 20310
.
44

HeadquartersDepartment of the ArmyATTN : DAMA-W4, LTC HinsonWashington, DC 20310
.Headquarters
. Department of the ArmyATTN: DAMA-tiSZ-AWashington, DC 20310.
HeadquartersDepartment of the ArmyATTN : DAMO-RQD9 LTC IveyWashington, DC 20310
HeadquartersDepartment of the ArmyATTN : DAMO-TRS, LTC LyonWashingtcm, DC 20310
HeadquartersDepartment of the ArmyATTN : DAMO-DR1, MAJ SpeedyWashington, DC 20310
HeadquartersDepartment of the ArmyATTN : DALO-TSP, LTC EakeryWashington, DC 20310
HeadquartersDepartment of the ArmyATTN : D/lLO-SMS, Ms. Ueckerttiashington, DC 20310
HeadquartersDepartment of the ArmyATTN : DACS-DPA, LTC RogersWashington, DC 20310
HeadquartersDepartment of the ArmyATTN : DAEN-ZE, COL HerndonWashington, DC 20310
●
HeadquartersDepartment of the Army.
s ATTN : W7DA, COL D. BrudvigWashington, DC 20310
Project ManagerXM1 Tank Armament SystemATTN : DRCPM-GCMWArren, MI 48092
Project ManagerXM1 Tank SystemATTN : DRCPM-GCM-SI
Mr. D. BartleWarren, MI 48090
Project ManagerTank Main Armament SystemATTN : DRCPM-TMA, COL D. ApplingDover, NJ 07801
Project ManagerTank Main Armament SystemATTN : DRCPM-TMA 105mm
LTC M. MichlikDover, NJ 07801
Project ManagerDivision Air Defense GunATTN : DRCPM-ADGDover, NJ 07801
Project ManagerProduction Base Modernization and ExpATTN : SARPM-PBM, Mr. C. KolisDover, NJ 07801
Project ManagerM60 TankMichigan Army Missile PlantATTN : DRCPM-M60Warren, MI 48090
CormnanderUS Army Materiel Development and
Readiness CommandATTN : DRCDR-DW, COL Collins5001 Eisenhower AvenueAlexandria, VA 22333
CommanderUS Army Materiel Development and
Readiness CommandATTN : DRCQA, Mr. R. Fahy5001 Eisenhower AvenueAlexandria, VA 22333
45
ConunanderUS Army Materiel Development and
Readiness CommandATTN : DRCDMD5001 Eisenhower AvenueAlexandria, VA 22333
ComnanderUS Army Materiel Development and
Readiness CommandATTN : DRCBSI5001 Eisenhower AvenueAlexandria, VA 22333
CommanderUS Army Materiel Development and
Readiness CommandATTN : DRCDMA-ST5001 Eisenhower AvenueAlexandria, VA 22333
CommanderUS Army Materiel Development and
Readiness CommandATTN : DRCSMA-ST, COL Vincent5001 Eisenhower AvenueAlexandria, VA 22333
CommanderUS Army Materiel Development and
Readiness CommandATTN : DRCSG, COL R. Cutting5001 Eisenhower AvenueAlexandria, VA 22333
CommanderUS Army Materiel Development and
Readiness CommandATTN : DRCPA-E, Mr. Pace5001 Eisenhower AvenueAlexandria, VA 22333
CommanderUS Army Materiel Development and
Readiness CommandATTN : DRCSG-R, LTC BellWashington, DC 20310
CommanderUS Army Materiel Development and
Readiness ConwnandATTN : DRCSF-P, Mr. Taras5001 Eisenhower AvenueAlexandria, VA 22333
DirectorDARCOM Field Safety ActivityATTN : DRXOS-ES, Mr. E. OlsenCharlestown, IN 47111
DirectorUS Army Materiels and Mechanics
Research CenterATTN : DRXMR-X, Dr. E. Wrightdatertown, MA 02172
OirectorUS Army Materiels and Mechanics
Research CenterATTN : DRXMR-AR, Mr. S. LevinWatertown, MA 02172
DirectorUS Army Materiels Systems
Analysis AgencyATTN : DRXSYAberdeen Proving Ground, MD 21005
DirectorUS Army Materiels Systems Analysis
AgencyATTN : DRXSY-GS, Mr. W. BrooksAberdeen Proving Ground, MD 21005
DirectorUS Army Materiels Systems Analysis
AgencyATTN : DRXSY-GA, Mr. J. McCarthyAberdeen Proving Ground, MD 21005
DirectorUS Army Materiels Systems Analysis
AgencyATTN : DRXSY-GA, Mr. R. SmithAberdeen Proving Ground, MD 21005
.
.
46

ConwnanderUS Army Armament Materiel Readiness CmdATTN: DRSAR-MAD-C, Mr. P. ShawDover, NJ 07801
M CommanderUS Army Armament Materiel Readiness Cmd
.* ATTN : DRSAR-ASR, LTC Counihan
Rock Island, IL 61201.
CommanderUS Army Armamnt Materiel Readiness CmdATTN : DR!iAR-SF, Mr. B. MorrisRock Island, IL- 61201
CommanderUS Army Armament MaterATTN : DRSAR-CGRock Island, IL 61201
CommanderUS Army Armament Mater
el Readiness Cmd
el Readiness CmdATTN : ‘DRSAR-LEA, Mr. E. BeckmanRock Island, IL 61201
CommanderUS Army Armament Research and
Development CommandATTN : DRDAR-CG, MG A. LightDover, NJ 07801
CommanderUS Army Armament Research and
Development CommandATTN : DRDAR-TD, Dr. R. tieigleDover, NJ 07801
CommanderUS Army Arlnanx?ntResearch and
Development CommandATTN : DRDAR-BL, Dr. EichelbergerDover, NJ 07801
CommanderUS Army Armament Research and
> Development CommandATTN : DRDAR-SC, Dr. D.Dover, NJ 07801
*
Gyorog
CommanderUS Army Armament Research and
Development CommandATTN : DRDAR-SCM, Mr. J. CorrieDover, NJ 07801
CormnanderUS Army Armament Research and
Development CommandATTN : DRDAR-SCM, Dr. E. Bloore (10 cys)Dover, NJ 07801
CommanderUS Army Armament Research and
Development CommandATTN : DRDAR-LCU-D-T, Mr. DavittDover, NJ 07801
CorrunanderUS Army Armament Research and
Development CommandATTN : DRDAR-SF, Mr. ElliottDover, NJ 07801
ComnanderUS Army Armament Research and
Development CommandATTN : DRDAR-BLT, Mr. R. VitaliAberdeen Proving Ground, MD 21005
CommanderUS Army Armament Research and
Development CommandATTN : DRDAR-BLT, Dr. W. GillichAberdeen Proving Ground, MD 21005
ComnanderUS Army Armament Research and
Development CommandATTN : DRDAR-BLV, Mr. E. WilseyAberdeen Proving Ground, MD 21005
CommanderUS Army Armament Research and
Development CommandATTN : DRDAR-BLP, Mr. R. ComerAberdeen Proving Ground, MD 21005
47

CommanderUS Army Armament Research and
Development CommandATTN : DRDAR-AD-SA, Mr. MarklandAberdeen Proving Ground, MD 21005
CommanderUS Army Armament Research and
Development CommandATTN : DRDAR-LCB, Mr. P. RumnelNatervliet, NY 12189
CommanderUS Army Mobility Equipment
and Development CommandATTN : DRDME-RZT, Tech DocFort Belvoir, VA 22060
Research
Ctr B/315
Command
CommanderUS Army Mobility Equipment
Research and DevelopmentATTN : DRDME-VR, Mr. McMillanFort Belvoir, VA 22060
CommanderUS Army Combined Arms Combat
Development ActivityATTN : APCA-BCFort Leavenworth, KA 66027
CommanderUS Army Environment Hygience AgencyATTN : HSE-OAberdeen Proving Ground, MD 21005
DirectorUS Army Human Engineering LaboratoryATTN : DRXHE-HE, Mr. EricksonAberdeen Proving Ground, MD 23801
CommanderUS Army Logistics CenterATTN : ATCL-M, Mr. ThompsonFort Lee, VA 23801
CommanderUS Army Missile MunitionsATTN : ATSK-CDRedstone Arsenal, Alabama 35809
CommanderUS Army Logistics Evaluation AgencyATTN : DALO-LEI, Mr. FryeNew Cumberland Army DepotNew Cumberland, PA 17070
DirectorUS Army Ammunition CenterATTN : SARAC-D, Mr. K. CroscostSavanna, IL 61074
CommanderUS Army Missile CommandATTN : DRCPM-LCE, Mr. CrosswhiteRedstone Arsenal, AL 35809
CommanderUS Army Research OfficeATTN : Dr. G. MayerPO Box 12211Research Triangle Park, NC 27709
CommanderUS Army Research OfficeATTN : Dr. E. SaibelPO Box 12211Research Triangle Park, NC 27709
CommanderUS Army Tank Automotive Research
and Development CommandATTN : DRDTA-RtiLdarren, MI 48090
CommanderUS Army Tank Automotive Research
and Development CommandATTN : DRDTA-RKA, Mr. V. PaganoWarren, MI 48090
CommanderUS Army Test and Evaluation CommandATTN: DRSTEAberdeen Proving Ground, MD 21005
CommanderUS Army Test and Evaluation CommandATTN : DRSTE-AR, Mr. BrownAberdeen Proving Ground, MD 21005
48

Commander’-US Army Test and Evaluation CommandATTN: DRSTE-AR, Mr. BrownAberdeen Proving Ground, MD 21005
P CommanderUS Army Test and Evaluation Command
.* ATTN : DRSTE-CE
Aberdeen Proving Ground, MD 21005
CommanderUS Army Test and Evaluation CommandATTN : DR!3TE-PP-EAberdeen lProvingGround, MD 21005
CommanderUS Army Test and Evaluation CommandATTN: DRSTE-ST, Mr. J. StarkeyAberdeen Proving Ground, MD 21005
CommanderUS Army Training and Doctrine CmdFort MonroeHampton, 11A 23651
DirectorUS Army TF!ADOC Systems Analysis ActATTN : ATAA-SAWhite Sands Missile Range, NM 88002
CommanderUS Army Fcreign Science and Tech CtrATTN : DRXST-CB, J. Bollendorf7th Street., NE-Building 220Charlottesville, VA 22901
CommanderNaval Facilities Engineering CmdCode 04N2, Mr. G. Hendrix200 Stovall StreetAlexandria, VA 22333 (2 cys)
CommanderUS Naval Clrdnance Systems CommandATTN : ORO-9132
b Washington, DC 20360
. Superintendent* US Naval Post Graduate School
ATTN : Director of LibraryMonterey, CA 09340
CommanderNaval Sea Systems CommandATTN : PMS-404-31, Mr. E. GerlachWashington, DC 20362
CommanderUS Naval Surface Weapons CenterATTN : Code dR-32, Dr. S. FishmantihiteOak, MD 20910
CommanderUS Naval Surface Weapons CenterATTN : Code DG-52, A. Wishard‘dhiteOak, MD 20910
CommanderUS Marine Corps Liaison OfficerAberdeen Proving Ground, MD 21005
CommanderUS Air Force HeadquartersATTN : SG-PA, LTC J. BayerWashington, DC 20314
HQ AC)TC/SCVATTN : MAJ R. ConradEglin AFB, FL 32542
HQ ADTC/DLVATTN : Dr. J. CornetteEglin AFB, FL 32542
CommanderUS Air Force Tactical Air CommandATTN : SG-PA, LTC J. CoughlinLangley AFB, VA 23665
National Lead Company of OhioATTN : Mr. L. LevyBOX 39158Cincinnati, OH 45239
Rockwell InternationalRocky Flats PlantATTN : Mr. T. CritesBldg. 123, PO BOX 464Golden, CO 80401
The Analytic Sciences CorporationATTN : Dr. S. BucciSix Jacob NayReading, MA 01867
49
Union Carbide CorporationNuclear DivisionATTN: Mr. M. SandersPO Box YOak Ridge, TN 37830
Nuclear Regulatory CommissionDivision of Fuel Cycle and Material SafetyATTN : Mr. E. drightWashington, DC 21055
4
.*
,
University of CaliforniaLos Alamos Scientific LaboratoryATTN : Dr. D. Sandstrom, CMB-6Los Alamos, NM 87545
Air Force Materiel LaboratoryATTN : LTM. S. InouyeWright-Patterson AFB, OH 45433
Air Force Materiel LaboratoryATTN : XYD, CPT D. Schuurdright-Patterson AFB, OH 45433
HQ, ADTCATTN : CEEDO/CC Detachment 1Tyndall AFB, FL 32403
USA Ordnance Center and SchoolAberdeen Proving Ground, MD 21005
Battelle Northwest LaboratoriesATTN : Mr. R. GilchristBattelle Blvd.Richland, WA 99352
DirectorDARCOM Field Safety ActivityATTN : DRXOS-ES, Mr. L. FoleyCharlestown, IN 47111
*U.S. GOVERNMENT PRIMING OFFICE! 1980-777-022/21 S
50

.
.
.Domestic NTIS
Pase Rang, Price Price Code
001-025 s 5.00 A02
026J350 6.00 A03
0s1475 7.00 A04
076-100 8.00 A05
101-12s 9.00 A06
126-150 10.03 A07
printed in the United States of AmericaAvailable from
National Technical [nfc.rmatk.n ScJvicc
US Department of Commerce
5285 Port Royal Road
Springfkld, VA 22161
Microfiche S3.S0 (AOI)
Dc.mestic IVTIS Dc.meslic NTISPage Range Rice Price Cnde Page Range IMce Price Code
151-17s $11.00 A08 301-325 $17.00 A14
176-200 12.00 A09 326-350 18.00 A15
201-225 13.00 A1O 351-375 19.@2 A16
226-250 14.00 All 376400 20.00 A17
251-275 1s .00 A12 401425 21.00 A18
276.300 16.00 A13 426450 22.00 A19
Domestic NTlsPage Range Rice Rice Code
4s1475 S23.00 A20476-500 24.00 A21501-525 2s.00 A22
526-550 26.oo A23
551-s75 27.00 A24576-600 28.00 A25
601-uP t A99
tAdd S1.0) for each additional 25-page increment or @rtion thermf from601 pagesup.

mI
-——.
“
.
.