for th of an gy only ele rket in ercot
TRANSCRIPT

PrioEnerERCO
William
Susan L
May 9,
rities rgy‐OnOT
W. Hogan
. Pope, FTI
2017
for thnly Ele
n, Harvard
I Consultin
he Evoectrici
University
g
lutionity Ma
y
n of anarket
n Design in
MAAY 2017

FTI Consulting, Inc. PRIORITIES FOR THE EVOLUTION OF AN ENERGY‐ONLY ELECTRICITY MARKET DESIGN IN ERCOT
Copyright © FTI Consulting, Inc., 2017 EXECUTIVE SUMMARY i
Executive Summary
Electricity markets employ open access and non‐discrimination to foster competition, market
entry, and innovation. The physical characteristics of the electricity system require explicit
consideration of key elements in electricity market design. Pricing and settlement rules for the
real‐time market must provide efficient incentives, both for short‐term operations and long‐run
investment. The ERCOT energy‐only market design emphasizes the need to get the real‐time
prices right. The recent innovation of the ERCOT Operating Reserve Demand Curve (ORDC)
addressed the fundamental problem of inadequate region‐wide scarcity pricing that has
plagued other organized markets, which have exhibited inadequate incentives both for reliable
operations and efficient investment.
ERCOT employs an open wholesale electricity market as the basis for short‐term reliable
electricity supply as well as for long‐term investments to maintain reliability in the future. A
review of energy price formation in ERCOT leads to two important conclusions: (i) while the
ORDC is performing consistently within its design, scarcity price formation is being adversely
influenced by factors not contemplated by the ORDC; (ii) other aspects of the ERCOT market
design must be improved to better maintain private market response to energy prices as the
driver of resource investment, maintenance expenditure and retirement decisions.
The paper identifies three general issues that have affected ERCOT energy prices in recent
years, and recommends policy and price formation improvements consistent with efficient
market design. These recommendations cannot reverse the impact of broader economic
trends, such as low natural gas prices, or national policies, such as subsidies for investments in
renewable resources. However, the stress of these forces has exposed areas where there is a
need for adjustments to pricing rules and policies within ERCOT.
System‐wide Price Formation
• Marginal Losses: The efficiency of region‐wide prices in ERCOT is distorted by the omission of
the marginal cost of transmission losses from ERCOT’s energy market dispatch and pricing.
• ORDC Enhancements: The system‐wide ORDC calculation should be enhanced to address the
reliability impacts of changes in the generation supply mix and the price impacts of reliability
deployments.

FTI Consulting, Inc. PRIORITIES FOR THE EVOLUTION OF AN ENERGY‐ONLY ELECTRICITY MARKET DESIGN IN ERCOT
Copyright © FTI Consulting, Inc., 2017 EXECUTIVE SUMMARY ii
Locational Scarcity Pricing
• Out‐of‐Market Actions to Manage Transmission Constraints: Local scarcity pricing and
mitigation rules require changes to properly set prices when there are reliability unit
commitments or other ERCOT reliability actions to manage transmission constraints; these
changes should not disable rules for local market power mitigation.
• Dispatch and Pricing for Local Reserve Scarcity: Introduction of local reserve requirements,
implemented through co‐optimization of the energy dispatch and reserve schedules, would
provide a market solution to properly set prices when there are constraints on reserve
availability in a sub‐region.
Transmission Planning and Cost Recovery
• Transmission Planning: Market‐reflective policies for transmission investment should be
considered as a replacement for Texas’ socialized transmission planning, which, by building
new transmission in advance of scarcity developing, fails to provide the opportunity for
markets to respond.
• Transmission Cost Recovery: Alternatives for transmission cost recovery to replace or
reduce dependence on the summer peak demand‐based mechanism for the allocation of
sunk transmission costs would reduce distortion of energy market pricing.
An Appendix provides further details on a formulation and computational approach for calculation of co‐optimized prices for energy and operating reserves with local reserve requirements.
FTI Consulting, Inc. PRIORITIES FOR THE EVOLUTION OF AN ENERGY‐ONLY ELECTRICITY MARKET DESIGN IN ERCOT
Copyright © FTI Consulting, Inc., 2017 TABLE OF CONTENTS iii
Table of Contents
Executive Summary .................................................................................................................. i
Table of Contents ................................................................................................................... iii
Introduction ............................................................................................................................ 1
Foundations ............................................................................................................................ 5
Real‐Time Wholesale Markets .................................................................................................. 6
Day‐Ahead Wholesale Markets ................................................................................................. 7
Ancillary Services ....................................................................................................................... 9
Market Power Mitigation .......................................................................................................... 9
Infrastructure Investment ....................................................................................................... 11
Getting the Prices Right ........................................................................................................... 12
ERCOT Energy‐only Market .................................................................................................... 13
Persistence of Missing Money ................................................................................................ 13
Operating Reserve Demand Curve .......................................................................................... 14
Implementation Choices: No Co‐optimization or Local ORDC ............................................... 16
Challenges to Energy Price Formation.................................................................................... 18
System‐wide Price Formation Issues ...................................................................................... 21
Renewable Resources Receive Out‐of‐Market Compensation ............................................... 21
Production Tax Credit and Investment Tax Credit Incentives ................................................ 21
Efficiency Impact of PTC on ERCOT Dispatch and Prices ....................................................... 24
Impact of Increasing Intermittent Generation on Ancillary Service Needs ........................... 32
Utility Energy Efficiency and Demand Response Programs Reduce Peak Load ...................... 34
Improvements to System‐Wide Price Formation ................................................................... 35
ORDC Reforms ........................................................................................................................ 35
Reserve Estimates and Out‐of‐Market Commitments ........................................................... 40
Add Marginal Cost of Losses to Dispatch and Pricing ............................................................ 41
Local Price Formation Issues .................................................................................................. 48
Lack of Scarcity Pricing with Reliability Unit Commitment ..................................................... 49
Local Market Power Mitigation of RUC Units Ignores Local Scarcity Value .......................... 52

FTI Consulting, Inc. PRIORITIES FOR THE EVOLUTION OF AN ENERGY‐ONLY ELECTRICITY MARKET DESIGN IN ERCOT
Copyright © FTI Consulting, Inc., 2017 TABLE OF CONTENTS iv
Reliability Deployment Price Adder (NPRR 626) Does Not Price Local Scarcity Value .......... 54
ORDC Does Not Price the Scarcity Value of RUC Units .......................................................... 55
Other LOCAL Reliability Actions Have Price Impacts .............................................................. 56
Activation of Reliability Must‐Run Units ................................................................................ 56
Curtailment of Exports on DC Lines Based on E‐Tags ............................................................ 59
Actions Prior to or During Energy Emergency Alert ............................................................... 60
Improvements to Price Formation for Local Scarcity .............................................................. 60
Scarcity Pricing for Out‐of‐Market Commitments for Transmission Constraints .................. 61
Locational Scarcity Prices through Local Operating Reserve Demand Curves ...................... 63
Locational Scarcity Pricing with Transmission Constraint Penalty Functions ........................ 67
Socialized Transmission Planning and Cost Recovery Issues .................................................. 69
Transmission Planning Process Inconsistent with Energy Market Objectives ........................ 69
Four Coincident Peak (4CP) Cost Allocation Distorts Peak Period Load ................................. 75
Improvements to Transmission Planning and Cost Recovery to Support Energy‐only Market
......................................................................................................................................... 78
Conclusion ............................................................................................................................. 80
Appendix: Formulation and Computation of Local Reserve Scarcity Prices through Operating
Reserve Demand Curves ................................................................................................... 82
Economic Dispatch and Operating Reserves .......................................................................... 83
Modeling Economic Dispatch and Operating Reserves in a Co‐optimized System ................ 84
An Approximate Operating Reserve Demand Curve in a Co‐optimized System .................... 87
Multiple Emergency Actions ................................................................................................... 90
Multiple Reserve Types ........................................................................................................... 93
Multiple Zones and Locational Operating Reserves ............................................................... 97
Separable Demand Curve Approximation ............................................................................ 105
Zonal Contingency Requirements ........................................................................................ 109
Co‐Optimization with the Locational Demand Curves Interface Constraint ....................... 110
References........................................................................................................................... 112

FTI Consulting, Inc. PRIORITIES FOR THE EVOLUTION OF AN ENERGY‐ONLY ELECTRICITY MARKET DESIGN IN ERCOT
Copyright © FTI Consulting, Inc., 2017 INTRODUCTION 1
Priorities for the Evolution of an
Energy‐Only Electricity Market Design in ERCOT
William W. Hogan and Susan L. Popei
May 9, 2017
Introduction
The Electric Reliability Council of Texas (ERCOT) employs an open wholesale electricity market
as the basis for short‐term reliable electricity supply as well as for long‐term investments to
maintain reliability in the future. Texas introduced wholesale market competition in 1995, and
retail competition was subsequently implemented in 2002 under the requirements of Senate
Bill 7 of 1999. This was followed by the Texas Nodal reforms of 2008, which instituted the
existing market structure in 2010. These initiatives were intended to open the market to
competition, allow voluntary decisions about purchases and sales of electricity, and avoid
imposing excessive risk of resource expansion on consumers. The success of the Texas effort
has been widely recognized. The Public Utility Commission of Texas (PUCT) has been charged
to continue the improvement and efficiency of this enterprise to support markets and
competition. As reported by the Commission, “the competitive market has produced average
retail rates that consistently trend lower than those seen in other parts of the country in all
sectors” (PUCT, 2015).
The ERCOT market is an advanced example of an unbundled and restructured electricity market
run by an Independent System Operator (ISO), with competition at both the wholesale and
retail levels. A major innovation in ERCOT was the adoption of an Operating Reserve Demand
Curve (ORDC), in June 2014, as part of a continuing effort to improve the relationship between
electricity market prices and the underlying cost of reliable electricity supply. Electricity
suppliers in ERCOT receive direct compensation only from short‐term energy markets, without
additional revenue from a separate organized forward capacity market. Market participants
can arrange voluntary longer‐term bilateral contracts to support investments and hedging, but
the incentives for these transactions depend critically on getting the prices right in the short‐
term energy markets. Hence, payment for the provision of operating reserves and energy
during short‐term periods of scarcity through the ORDC is a critical element of the ERCOT
market design to support reliability.
FTI Consulting, Inc. PRIORITIES FOR THE EVOLUTION OF AN ENERGY‐ONLY ELECTRICITY MARKET DESIGN IN ERCOT
Copyright © FTI Consulting, Inc., 2017 INTRODUCTION 2
In October 2015, the PUCT launched a review of the performance of the ORDC to date and of
possible design changes to this innovation in electricity pricing.1 Modifications to the ORDC
would be important in their own right, and would also be a gateway to improvements in other
related features of the broader wholesale market design.2 As a contribution to the review
process, the present paper addresses possible changes in the ORDC, as well as other
opportunities to improve price formation in ERCOT’s wholesale market design as a signal of the
underlying cost of maintaining reliability. Among the challenges facing the market are those
arising from increasing energy supply from subsidized renewables, as well as continuing
challenges, such as transmission investment and cost recovery, and the persistent lower cost of
the wholesale market’s marginal fuel (i.e. natural gas), which results in lower energy and
ancillary service revenues.
Lower natural gas prices and the proliferation of renewables in ERCOT have changed market
fundamentals and transformed the balance sheets of electricity generation owners in the
region. These changes in fundamentals cannot be reversed, nor is it the purpose of good
market design to attempt to reverse the fundamentals or unwind what is already done. But,
just as one would be concerned about high prices, persistent pressure on pricing outcomes
motivates an examination of whether the market design and price formation rules in ERCOT
could be improved in support of greater efficiency and sustainable electricity markets.
A primary motivation for this review was an assessment of the operation of the ORDC. A broad
conclusion is that over the more than two years since implementation, operation of the ORDC
has been consistent within the context of its basic design. However, it is also evident that there
are factors external to the ORDC that are influencing scarcity prices and price formation in a
meaningful way. In regards to specific ORDC performance, there have been periods of
operating scarcity and corresponding higher energy prices, but the average effect of ORDC on
prices has been small. This result is consistent with the high operating reserves used as inputs
to the ORDC. A closer examination reveals impacts on supply and demand which often inflate
reserves and suppress ORDC price adders. In short, the ORDC is working within the context of
its design, but it is influenced by numerous external factors and it has not been severely tested.
Figure 1 summarizes our recommendations for price formation reforms in ERCOT. The current
design of the ORDC incorporates simplifications and assumptions that could be revisited. The
present paper considers possible modifications to the minimum reserve level “X”, the value of
lost load, the loss of load probability, and the calculation of available reserves. With regard to
1 PUCT Project 45572, “Review of the Parameters of the Operating Reserve Demand Curve,” launched at the Open
Meeting of October 8, 2015.
2 Bryant, Mark, Julia Harvey and Jason Hass, PUCT Memorandum, “PUCT Project 45572‐‐Review of the Parameters of the Operating Reserve Demand Curve,” April 1, 2016.

FTI Consulting, Inc. PRIORITIES FOR THE EVOLUTION OF AN ENERGY‐ONLY ELECTRICITY MARKET DESIGN IN ERCOT
Copyright © FTI Consulting, Inc., 2017 INTRODUCTION 3
the current ORDC implementation, improvements to price formation appear possible through
the modification of the loss of load probability to take account of the uncertainty accompanying
high levels of intermittent resource output, and logical modifications to exclude the capacity of
out‐of‐market deployments from the estimate of reserves.
Figure 1 Price Formation Reforms
In reviewing the performance and extensions of the ORDC, other critical elements of the ERCOT
market design arise as issues on their own merit. The lack of marginal‐loss pricing creates a
persistent distortion in locational prices and in the real cost of serving load. A marginal‐loss
price component could accumulate to have an effect on locational prices of the same order of
magnitude as the effect of marginal congestion, which is included in both dispatch and pricing.
Reliability constraints can create perverse conditions when they induce out‐of‐market actions,
such as reliability unit commitment, that, in combination with market power mitigation, result
in lower, not higher, market prices.3 Finally, out‐of‐market transmission planning and
3 The Appendix presents a formulation for the co‐optimization of energy and reserves that includes the computation of
local scarcity prices to complement the region‐wide ORDC in order to begin to correct the lack of market‐based alternatives for responding to local reserve scarcity conditions
Adjustments to ORDC
Marginal Losses
Local Scarcity Pricing
Transmission Planning and Cost Recovery
EASIER MORE DIFFICULT
Subtract out‐of‐market commitments from Real‐time On‐line Capacity Consider impact of changing supply mix on LOLP
Modify dispatch and pricing to be consistent with the proved standard in all other U.S. ISOs
Software is available
Reduces inefficiency and improves pricing in every hour
Consider beneficiaries pay planning model for consistency with objective of market‐driven investment
Modify 4CP to avoid impact on spot market efficiency and prices through recovery rules for sunk costs
Changes to mitigated offer prices and pricing of transmission constraints for out‐of‐market actions to relieve transmission constraints (e.g., RUC or RMR)
Include both region‐wide and local ORDCs in co‐optimized energy and reserves dispatch

FTI Consulting, Inc. PRIORITIES FOR THE EVOLUTION OF AN ENERGY‐ONLY ELECTRICITY MARKET DESIGN IN ERCOT
Copyright © FTI Consulting, Inc., 2017 INTRODUCTION 4
expansion occurs ahead of the development of scarcity and diminishes the scarcity price signals
that would lead, in the alternative, to market‐based investment. Furthermore, the allocation of
sunk transmission costs based on peak period usage leads to price suppression as well as
welfare loss as market loads make expensive decisions to avoid allocations of sunk transmission
costs that cannot be avoided in the aggregate.
Addressing these market design issues should be part of the continuing PUCT and ERCOT
agenda for getting the prices right. The discussion below addresses these related issues under
the general grouping of system‐wide pricing matters, local requirements and scarcity pricing,
and transmission planning and cost allocation.
The background for all this discussion begins with the basic electricity market design
framework. Before addressing the possible reforms, the next section summarizes the
foundations that drive the ERCOT energy‐only market design for reliable and efficient
operations supported by a compatible system of efficient prices.

FTI Consulting, Inc. PRIORITIES FOR THE EVOLUTION OF AN ENERGY‐ONLY ELECTRICITY MARKET DESIGN IN ERCOT
Copyright © FTI Consulting, Inc., 2017 FOUNDATIONS 5
Foundations
The design of the Texas electricity market embraces the principles of open access and non‐
discrimination. The underlying premise of this approach is that if all market participants have
comparable access to the inherently monopoly elements of the electricity system, namely the
transmission and distribution systems, then they can compete on a level playing field to buy,
sell, and trade energy and thereby achieve economically efficient market outcomes. Because of
the complexity of the electricity system, with the underlying engineering reliability
requirements interacting with the physics of how power flows from supply sources to load
sinks, the electricity sector is unique in comparison to seemingly similar markets, such as for gas
supply, in the requirement for some significant degree of central coordination in support of this
open access (Hogan, 1992).
After much debate and several false starts, a model has emerged for how a centrally‐organized
electricity market can be designed to provide open access and non‐discrimination in pursuit of
economically efficient operation and investment. A key requirement is for an efficient real‐
time market design, which is important in its own right, and also because the expected prices in
the real‐time market provide the basis for investment and contractual decisions in forward time
periods. Market participants will anticipate real‐time conditions and make forward decisions,
such as investing in new plants or signing contracts for future delivery, which recognize the
market determinants of real‐time prices and associated settlement payments. A well‐
functioning real‐time market will encourage efficiency in investments and other business
arrangements in forward markets. Conversely, if real‐time prices are not consistent with the
basic practices of operators to maintain efficient and reliable electricity system operation,
market participants will identify profitable opportunities to exploit the predictable
inconsistencies and the actions that system operators will need to take to maintain reliable
operation. The resulting inefficiency and threats to reliability can in turn lead to pressures to
restrict access or discriminate among market participants in order to prevent unintended
outcomes or an unravelling of the intended market (Hogan, 2002). A good real‐time market
design with efficient prices should be the first focus of an organized wholesale electricity
market.
The following sections describe the foundational elements of efficient electricity market design,
to serve as a touchstone for assessing the impact of factors that could undermine price
formation and also of possible improvements. The core features of the ERCOT market design
reflect these elements, but the presence of factors that frustrate price formation is apparent.
The opportunities for improvement of this design are important, but should build on, rather
than replace, what Texas has already accomplished.

FTI Consulting, Inc. PRIORITIES FOR THE EVOLUTION OF AN ENERGY‐ONLY ELECTRICITY MARKET DESIGN IN ERCOT
Copyright © FTI Consulting, Inc., 2017 FOUNDATIONS 6
REAL‐TIME WHOLESALE MARKETS
The overarching market design framework for real‐time markets follows the structure of a bid‐
based, security‐constrained economic dispatch. Market participants provide the system
operator with schedules for energy transactions from generation and load, including bids and
offers to change load and generation from any announced schedules. This can include bids and
offers made independently of any formal schedule. The system operator treats these bids and
offers as representing the best estimate of variable costs, and chooses the dispatch (i.e., the
schedules for load and generation in an interval) that reflects the physical operating and
security constraints in the system, as well as any announced schedules, and maximizes the sum
of the net benefits defined as the value of the scheduled load as expressed by the bids and the
cost of the scheduled generation as expressed by the offers. In the absence of price‐responsive
demand, the dispatch simplifies to minimization of the generator offer cost of meeting a fixed
level of forecast load.
The term‐of‐art for this structure is “economic dispatch” and the industry has been using this
principle for efficient electricity system operations since long before the creation of open‐
access electricity markets. The innovation for markets was to price the real‐time schedules
determined in the economic dispatch according to the conditions of the economic dispatch,
including the impact of transmission congestion and marginal losses. Security constraints and
transmission power flows can sometimes create significant congestion in this system. Marginal
line losses also determine the cost of moving power from one location to another. The result is
a system‐wide set of prices that differ by location in the system, often known as locational
marginal prices (LMP). An LMP is the marginal cost of serving an increment of load at a location
on the system from available supply, including the marginal cost due to transmission
congestion and line losses. These LMPs are the only prices that are consistent with the
economic dispatch. The meaning of this consistency is important: in the idealized case, if
generation at the location is paid according to these prices, then there is no economic incentive
for the generation to produce a level of output in an interval differing from its economic
dispatch schedule. Similarly, if load is charged these prices, there is no economic incentive for
the load to consume a different quantity in an interval than the efficient economic dispatch
outcome. In this sense, the LMP prices are the only prices that can lead market participants to
voluntarily transact in alignment with the efficient market dispatch outcome; the payment of
the price is sufficient, without the need for side payments, penalties, or other rules. This “is the
electricity spot pricing model that serves as the benchmark for market design – the textbook
ideal that should be the target for policy makers. A trading arrangement based on LMP takes all
relevant generation and transmission costs appropriately into account and hence supports
optimal investments” (International Energy Agency, 2007).

FTI Consulting, Inc. PRIORITIES FOR THE EVOLUTION OF AN ENERGY‐ONLY ELECTRICITY MARKET DESIGN IN ERCOT
Copyright © FTI Consulting, Inc., 2017 FOUNDATIONS 7
The real‐time market with LMP pricing creates the opportunity to solve the difficult problem of
defining and implementing transmission rights in the electricity system. Although it is not
possible to define or use transmission rights to control the actual flow of power because of the
complex interactions in the power flows, it is possible to define a financial contract that
provides the needed complement to contracts for energy defined at a location and priced
based on LMPs. The financial transmission right, known as a Congestion Revenue Right (CRR) in
ERCOT, entitles the holder to collect the congestion price difference between two locations
(Hogan, 1992). Like a physical transmission right, market participants can buy CRRs between
two locations to effectuate a contract to buy power at one location for delivery or consumption
at a second location without net payment of a real‐time transmission charge.
The basic design of bid‐based, security‐constrained, economic‐dispatch with locational prices
and financial transmission rights has been adopted by all the organized markets in the United
States, including ERCOT. The lessons of the failures along the way were expensive (Hogan,
2002), but the failures reinforced the basic message about the importance of the fundamental
elements of the design.
Although there would be efficiency gains from operating an electricity system with only a real‐
time LMP market, a common feature of electricity markets is to extend the design to include
one or more forward markets, such as the day‐ahead organized market, as well as markets for
ancillary services. These arise because electricity market operating decisions include choices
which are necessarily discrete, such as forward unit commitment decisions. Extensions of the
market design also arise because electricity market outcomes are affected by and invoke trade‐
offs in consideration of long‐term investments, such as major transmission line expansions, that
must invoke additional pricing and cost‐recovery decisions. The details of the design extensions
described in the following sections depend on the particular region, but the essential principle
is for the design to result in outcomes as consistent as possible with the choices that would
result from the operation of an efficient market.
DAY‐AHEAD WHOLESALE MARKETS
The design of day‐ahead wholesale electricity markets reflects the need for compatibility with
the real‐time market. The day‐ahead market includes the same basic framework of bids and
offers for energy. The resulting economic dispatch produces day‐ahead locational prices and
the associated day‐ahead load and supply dispatch schedules. The day‐ahead market is settled
at the day‐ahead locational prices and creates a set of short‐term forward contracts, i.e.,
contracts to inject or withdraw the day‐ahead scheduled quantities in real‐time, or pay real‐
time prices for deviations.
The day‐ahead market provides increased flexibility for scheduling load and generation. Given
an efficient real‐time market, day‐ahead market designs can accommodate both physical and

FTI Consulting, Inc. PRIORITIES FOR THE EVOLUTION OF AN ENERGY‐ONLY ELECTRICITY MARKET DESIGN IN ERCOT
Copyright © FTI Consulting, Inc., 2017 FOUNDATIONS 8
financial decisions and evaluate them in respect to transmission constraints on power flows and
other constraints to insure reliability. Unit commitment and related physical decisions are made
day ahead in the context of efficient forward trading of energy, resulting in day‐ahead
settlements providing price certainty for entities making discrete operating decisions in the
day‐ahead time frame. Unlike unit commitment, before real‐time, energy trading is essentially a
financial transaction. Forward agreements to buy or sell energy in real‐time will be settled with
real‐time deviations between the real‐time dispatch and day‐ahead schedules priced at the
efficient real‐time prices. This allows day‐ahead and other forward markets to include so‐called
“virtual” bidders that work through financial contracts, driving equilibrium in prices between
forward markets and the expected prices for the real‐time physical dispatch. Because forward
markets for energy do not involve physical delivery, they can include a wide array of virtual
participants, improving market liquidity for physical loads and generation and reducing the
potential for any exercise of market power by increasing the number of market buyers and
sellers (Hogan, 2016).
With the introduction of a day‐ahead market in addition to a real‐time market, the day‐ahead
prices are used to settle the CRRs in the day‐ahead market; the CRRs are not settled in the real‐
time market. In effect, the CRRs are reconfigured in the day‐ahead market as transmission
schedules for the real‐time market. This precludes settling the CRRs at real‐time prices, which
would amount to selling the transmission capacity twice. However, any market participant that
wishes to settle its CRRs at real‐time prices can do so by submitting Point‐to‐Point (PTP)
Obligation bids into the day‐ahead market. Awarded PTP bids are day‐ahead schedules, for
which the market participant will be charged the day‐ahead prices, with the congestion
component covered by the day‐ahead settlement of its corresponding CRR. The CRR is thus
reconfigured into a day‐ahead transmission schedule conveying the real‐time obligation to buy
power at one location for delivery or consumption at a second location without payment of a
real‐time transmission charge.
This basic structure adapts to account for any sequence of forward markets. For example, with
day‐ahead and then hour‐ahead markets, at each stage the forward dispatch with associated
locational prices creates a set of contracts that could be settled at the prices in the subsequent
stage.
Again, in the idealized case, all that would be required to ensure efficient operations and
investment is the day‐ahead market functioning based only on competition through bid‐based,
security‐contained, economic‐dispatch with locational prices and financial transmission rights.
But complications arise because of deviations from the assumptions of the idealized case. In
particular, unit commitment decisions can be large enough to have a non‐marginal effect on
prices and require some intervention to deal with the differences from the pure marginal cost
pricing case (Gribik, Hogan, & Pope, 2007). Similarly, the system operator may need to commit

FTI Consulting, Inc. PRIORITIES FOR THE EVOLUTION OF AN ENERGY‐ONLY ELECTRICITY MARKET DESIGN IN ERCOT
Copyright © FTI Consulting, Inc., 2017 FOUNDATIONS 9
some units to meet reliability constraints (i.e. Reliability Unit Commitment) that may not be
represented in the dispatch model.
These types of decisions can create a deficiency in the LMP revenues paid to suppliers
compared to the full offer‐based costs they would incur to produce their least cost dispatch
schedules. For pricing, this deviation creates an essential requirement to combine reasonable
approximations of prices based on pure marginal costs and marginal benefits with related
additional payments needed to maintain the incentives of load and generation to follow their
dispatch schedules. For example, generators committed in the day‐ahead dispatch may not
recover their full start‐up costs through only the LMPs paid for their energy injections. The
revenue deficit would provide an incentive to not participate in the dispatch. But additional
payment of the deficit in addition to the marginal energy price can restore consistency between
the total revenue the generator receives and the cost it incurs when it follows its dispatch
schedule. These are known as “make‐whole” payments because they must be recovered
through an additional charge on top of the price for energy to ensure a generator’s revenue is
at least equal to its offer costs.
ANCILLARY SERVICES
The idealized energy market design often abstracts from elements of operations that are
necessary for secure operation of the transmission grid and the rest of the electricity system.
These added services deal with a variety of requirements that are relatively small scale,
compared to the total energy flow, but are essential for maintaining reliability, efficiency, and
compliance with mandatory national standards.
For example, fast standby reserves must be available for quickly responding to unanticipated
forecast deviations or contingency events. Sudden loss of a generator must be addressed
quickly by increasing output from other generators or decreasing load. The standby resources
provide operating reserves necessary to meet the fast response reliability requirements of the
system.
Operating reserves and other services go under the general heading of ancillary services. The
fundamental market design principle is to dispatch and price these services in a manner that is
consistent with the basic market design and avoids significantly changing other efficient
incentives for energy load and generation.
Application of these principles to the case of operating reserves illustrates the point through
the development of the ERCOT ORDC, as discussed below.
MARKET POWER MITIGATION
With competitive price‐taking market participants, individual operating decisions can be left to
respond to the incentives of the efficient real‐time and day‐ahead prices. When there are

FTI Consulting, Inc. PRIORITIES FOR THE EVOLUTION OF AN ENERGY‐ONLY ELECTRICITY MARKET DESIGN IN ERCOT
Copyright © FTI Consulting, Inc., 2017 FOUNDATIONS 10
market conditions during which some market participants can manipulate prices, interventions
may be required to prevent such strategic behavior and ensure efficient outcomes. The
objective is to design market power mitigation mechanisms to make them compatible with the
basic efficient real‐time and day‐ahead wholesale markets.
Market participants may exercise market power in their bids and offers for a subset of
transactions to manipulate prices and profit from related transactions. The canonical example is
the case of a large generator that can withhold some of its production, increase the market‐
clearing price, and enjoy higher prices on the portion of its generation that is not withheld. If
prices can be increased enough, then the increased profits on the actual production could be
sufficient to outweigh the loss on the withheld supply. The result would include higher prices
for load and higher total real costs for the dispatch.
As a condition for participating in the organized electricity markets, regulations typically
provide mechanisms for mitigating or preventing the exercise of market power. The example of
the large generator provides a convenient illustration of the principle of designing the market
intervention to be as consistent as possible with the overall efficient market design.
An initial response to mitigate market power is often to place a cap on the market price
outcome, thereby preventing the increase in market prices that would be sought by a supplier
seeking to profit from exercising market power. However, this price cap could create
unintended consequences if not set at the right level to reflect actual operating conditions and
system‐wide or local scarcity in the real‐time market.
An alternative approach developed early in electricity markets is to impose an offer cap for
capacity with the potential for exercising market power, in place of a price cap for everyone.
The offer cap is combined with a must‐offer requirement to avoid physical withholding of
supply. The purpose of an offer cap is to insure the capacity offered is made available for
dispatch at a reasonable estimate of the variable cost of the generator plus a reasonable risk
factor considering current operating conditions. In the actual dispatch, the market‐clearing
price may be much higher than the offer, and may well be higher than would be
accommodated by a price cap. But even if the price rises above the offer cap, as long as the
offer cap is in place, the generator is not exercising market power, and the generator would be
paid according to the market‐clearing price, not the offer cap. The offer cap only determines if
the generator is dispatched, but not what it is paid as the market‐clearing price. If there is an
effective mechanism for determining the market‐clearing price, then the result is the same as
the competitive outcome without the exercise of market power. This offer‐cap approach to
market power mitigation sounds similar to a price cap, but it is fundamentally different. The
offer‐cap approach arises from close consideration of how to design a regulatory intervention
that incorporates and better reflects efficient market design. The existing ERCOT market power
mitigation approach uses offer caps as a primary tool, and even exempts small generators

FTI Consulting, Inc. PRIORITIES FOR THE EVOLUTION OF AN ENERGY‐ONLY ELECTRICITY MARKET DESIGN IN ERCOT
Copyright © FTI Consulting, Inc., 2017 FOUNDATIONS 11
(“small fish swim free”) who presumably cannot affect the system‐wide market price and would
not physically withhold their generation due to the risk of having a portion of their portfolio not
committed.
INFRASTRUCTURE INVESTMENT
Under the basic competitive electricity market design, investment decisions for generation and
load are left to the decisions of market participants based on their own evaluation of future
market prices and opportunities. This is a critical component of the energy‐only market
approach in ERCOT.
Investments in other types of infrastructure present complications for efficient market
operations, as they may affect the efficient energy market price signals that are the linchpin of
the basic market design. For example, transmission investments can preempt more economic
market solutions for reliably serving load and have a material effect on market prices. This
complicated problem is created by a regulatory structure where transmission investments are
generally made mandatory, often planned through processes that are not well integrated with
those focused on the sustainability of efficient electricity markets, and receive a guaranteed
rate of return. Market investments by suppliers or loads are expected to compete with
transmission investments receiving rate‐base returns. The design of investment policy for
transmission that supports efficient markets is a challenge in all existing energy markets.
An important characteristic of open markets and competition is the role of voluntary choices in
the purchase and sale of power. Market participants are responsible for and bear the costs of
their decisions; conversely, they should not be subject to cost responsibility for resource
investments where they have little or no control over the decisions. This market discipline is
relatively easy to maintain for load and generation, where the costs and the benefits flow to
those who make the consumption and investment decisions.
Transmission investment is perhaps the most difficult element to cover under the principle of
structuring the rules to result in choices that are as close as possible to the efficient outcomes
that would result from competition within the underlying market design, and then handling the
rest of the market intervention in ways that have the least impact on efficient market choices.
However, the logic still applies in the transmission case. This is best illustrated by the approach
in the New York tariff (NYISO, 2007);(Hogan, 2011), which follows this principle.
The essence of the New York approach is to balance market incentives and the need for
regulation to deal with large scale transmission projects that can give rise to free‐rider
concerns. Market participants can make transmission investments as merchant investments
that depend on future market revenues to finance the project. The revenues could come in the
form of voluntary ex‐ante contracts between transmission developers and generators that
benefit from higher prices and loads that benefit from lower prices; an additional revenue

FTI Consulting, Inc. PRIORITIES FOR THE EVOLUTION OF AN ENERGY‐ONLY ELECTRICITY MARKET DESIGN IN ERCOT
Copyright © FTI Consulting, Inc., 2017 FOUNDATIONS 12
source for transmission development could be future CRR revenues. This works well for small
projects where enough of the beneficiaries can collaborate and the beneficiaries voluntarily pay
for the project, so long as the contractual payments are not a loss‐taking attempt to exercise
market power. For large projects that affect many beneficiaries, this merchant approach may
not work because there are too many “free riders,” which is a situation in which parties do not
voluntarily offer to pay a share of the project costs commensurate with their individual benefits
with the hope that others will pay and they will be able to reap the benefits without paying any
costs. Here the regulator must intervene to evaluate costs and benefits. When the benefits are
greater than the costs, the project should be able to command enough support to sustain a
supermajority vote of beneficiaries who favor the project. The votes are weighted in proportion
to the estimated benefits and if a supermajority is obtained, the transmission project goes
forward and all the beneficiaries pay for the costs of the project in proportion to their deemed
benefits. The payment is not voluntary for any in the minority that opposed the project. In the
event that a supermajority of the beneficiaries cannot be obtained, the project fails the market
support test and does not go forward. In all cases, those who do not benefit do not pay, and do
not vote. Involuntary payments for transmission investment are required in the limited case
only to deal with free‐rider concerns for a small minority of the beneficiaries.
The issue of the appropriate approach for infrastructure investment will be important on the
national agenda where major transmission expansions are a subject of continuing discussion
(Department of Energy, 2017). The major recent investments for transmission expansion in
ERCOT are sunk, but the manner of the cost recovery may impact current decisions, and future
developments may raise the profile of transmission investment decisions and the interaction
with efficient market design. Costs socialized across all market participants undermine efficient
incentives and should be avoided whenever possible.
GETTING THE PRICES RIGHT
Subject to this fundamental framework, the challenge is to design the necessary additional
market features to be as consistent as possible with the efficient market design and to minimize
any distorting effect on future efficient decisions (Hogan, 2014). This in itself can go a long way
to support the energy‐only approach as found in ERCOT including the factors currently
impacting price formation. The discussion of the design of the ORDC illustrates a practical
application of this principle.

FTI Consulting, Inc. PRIORITIES FOR THE EVOLUTION OF AN ENERGY‐ONLY ELECTRICITY MARKET DESIGN IN ERCOT
Copyright © FTI Consulting, Inc., 2017 ERCOT ENERGY‐ONLY MARKET 13
ERCOT Energy‐only Market
In the early phase of unbundling and creation of an organized electricity market, ERCOT
deployed a zonal model based on the assumption that locational differences in marginal costs
of incremental electricity supply or demand within a zone would be unimportant and could be
ignored. During periods when this assumption proved to be materially incorrect in ERCOT, as
elsewhere, the market pricing design created perverse incentives inconsistent with the
management of system reliability and soon became unsustainable. The response was to
implement a fully nodal model in ERCOT using the essential elements of bid‐based, security‐
constrained, economic dispatch (Potomac Economics, 2011).
Although this major reform implementing nodal pricing addressed the most serious of the
perverse incentives of the earlier zonal market design, the ERCOT market eventually developed
evidence of an implementation problem in pricing during scarcity situations; similar issues were
observed in other ISOs. Although the basic design worked well when the system was not
stressed, in most markets a wide variety of implementation details combined to suppress prices
when systems encountered a scarcity of supply to meet either regional or local demand
(Joskow, 2008). Examples of these details include price caps, uneconomic out‐of‐market
reliability actions, uneconomic reserve requirements, the treatment of block‐loaded quick start
units in price formation, and the absence of demand participation. The result was the “missing
money” problem wherein electricity prices did not rise high enough and often enough to
support economic investment in generating capacity and required maintenance of existing
supply.
PERSISTENCE OF MISSING MONEY
The underlying theory of the original market design included demand participation through
bidding by load of its willingness‐to‐pay. During periods of supply scarcity, when capacity was
fully utilized, prices would rise and demand would voluntarily reduce to clear the market. In
these capacity constrained periods, demand would set price and the price could be materially
higher than the variable cost of the most expensive plant running. Within this framework, the
price effect would be adequate to support economic investment and there would be no missing
money.
For a variety of reasons, including interventions to mitigate price increases, this demand
participation did not appear, and is still developing slowly. The biases summarized by Joskow
continued to hold sway to keep market prices low. The resulting missing money problem affects
the incentives for new generation investment, retirement and maintenance and was identified
as a threat to resource adequacy. A policy response in many other markets was to develop

FTI Consulting, Inc. PRIORITIES FOR THE EVOLUTION OF AN ENERGY‐ONLY ELECTRICITY MARKET DESIGN IN ERCOT
Copyright © FTI Consulting, Inc., 2017 ERCOT ENERGY‐ONLY MARKET 14
various forward capacity market options to provide a mechanism for making additional
payments for capacity to support adequate investment.
The turn to capacity markets would have been a major change in the ERCOT policy to maintain
an “energy‐only” market design. When the missing money issue became salient in ERCOT, the
response was to review the experience with capacity markets elsewhere and to look for options
that could preserve the energy‐only market design (Newell et al., 2012). The ERCOT approach
would address the pricing problems directly by making important changes in the nodal market
design to produce pricing incentives sufficient to maintain reliability. The most significant
innovation was the treatment of scarcity pricing through the introduction of an ORDC that
would help mitigate the effect of the missing demand participation.
OPERATING RESERVE DEMAND CURVE
The ERCOT implementation of an ORDC illustrates the importance of carefully considering the
interactions among the basic components of the successful market design in order to respect
the fundamental principle of getting the prices right.
The theory of efficient electricity market design, which is the starting point for the ORDC,
focuses on the dispatch and pricing of energy supply and demand. Other ancillary services could
be included in the basic design, but were usually addressed in a simple way. Operating reserves
were a case in point prior to the ORDC. The basic model assumed a fixed requirement for
operating reserves. Optimization of schedules for suppliers (and possibly dispatchable load) in
the security‐constrained economic dispatch produced a related scarcity price if this fixed
requirement for operating reserves was an active constraint on the dispatch. The scarcity price
rose as more expensive supply or demand resources had to be dispatched in order to maintain
the required levels of operating reserve. For instance, if price‐responsive demand was deployed
in the dispatch because the price rose above its bid (i.e., its willingness‐to‐pay), these demand‐
side bids would set both a high energy price and a high implied scarcity price for operating
reserves when the system was stressed.
Absent material demand‐side participation, ERCOT reconsidered the treatment of operating
reserves, rather than creation of a capacity market, to address the missing money arising from
energy‐only pricing. Rather than treating operating reserves as a fixed requirement, where
reserves above the minimum amount would have zero value, it recognized that in electricity
system operation there is an underlying scarcity value to reserves at levels above this minimum
amount. The scarcity value of operating reserves of differing levels could be calculated and
included along with electricity supply and demand in the economic dispatch. The relationship
between scarcity value and reserve levels, i.e., the ORDC, incorporates a more granular
estimate of the willingness‐to‐pay to meet operating reserve reliability requirements and

FTI Consulting, Inc. PRIORITIES FOR THE EVOLUTION OF AN ENERGY‐ONLY ELECTRICITY MARKET DESIGN IN ERCOT
Copyright © FTI Consulting, Inc., 2017 ERCOT ENERGY‐ONLY MARKET 15
produces a market‐clearing scarcity price that reflects the value of remaining operating
reserves.
Figure 2
The ERCOT ORDC shown in Figure 2 combines two types of operating reserve requirements.
The minimum quantity of reserves required for system security, represented by “X”, is a limit
that is the minimum allowable MW to meet the standards defined to avoid cascading system
failures. In principle, if the level of operating reserves starts to fall close to this limit, the system
operator should curtail load in order to preserve the necessary reserves. Hence, at this
minimum reserve level, the marginal value of operating reserves would be the same as the
value of lost load (VOLL), since a 1 MW increment in reserves would prevent the shedding of 1
MW of load.
Above this minimum level of reserves, X, which is 2,000 MW Figure 2, the economic value of
incremental operating reserves falls. Above X, the system operator will not be actively shedding
load, so the value of operating reserves depends on the probability that this might happen, i.e.,
the probability that the system will move into the condition where reserves would be less than
the minimum required. For the range above X, the value of incremental reserves is equal to the
loss of load probability (LOLP) multiplied by the value of lost load. This basic LOLP relationship is
0
1,000
2,000
3,000
4,000
5,000
6,000
7,000
8,000
9,000
10,000
0 1,000 2,000 3,000 4,000 5,000 6,000 7,000 8,000
Marginal Value ($/M
Wh)
Quantity (MW)
Operating Reserve Demand
X
P = VOLL * LOLP

FTI Consulting, Inc. PRIORITIES FOR THE EVOLUTION OF AN ENERGY‐ONLY ELECTRICITY MARKET DESIGN IN ERCOT
Copyright © FTI Consulting, Inc., 2017 ERCOT ENERGY‐ONLY MARKET 16
familiar from traditional industry planning models, with the added modification of the need to
respect the minimum contingency limit (X).
In a full implementation, the ORDC would be included in the normal real‐time energy dispatch
and co‐optimization of energy and reserves and would create a scarcity price, i.e., the marginal
price of operating reserves. When the marginal cost of dispatching additional reserves was less
than the marginal value in avoiding a loss of load, where the latter is as expressed by the ORDC,
additional reserves would be dispatched. When the cost of incremental reserves rose above the
incremental value, less would be dispatched. Because a MW of most capacity can supply either
energy or reserves but not both, the clearing price for operating reserves is naturally mirrored
in and consistent with, the energy settlement price; as the marginal value of reserves increase,
so must the marginal value of energy. Through this relationship between reserve and energy
pricing, the marginal value of incremental reserves is paid to all capacity dispatched to supply
energy in an interval, not just the capacity designated as operating reserve (ERCOT, 2014).
IMPLEMENTATION CHOICES: NO CO‐OPTIMIZATION OR LOCAL ORDC
In ERCOT, a decision was made, for simplicity, to implement the ORDC and reserve scarcity
pricing without full co‐optimization in the dispatch of energy and operating reserves. Instead,
the marginal value of reserves is calculated for each dispatch interval, based on the value of the
ORDC for the quantity of physically responsive reserve capacity for the interval, and the
resulting price is added to each MW of reserves or energy scheduled in a dispatch interval.
An important assumption in the ERCOT ORDC implementation is that all reserves in ERCOT are
equally valuable in maintaining reliability. The ORDC price is, by definition, the price of scarcity
resulting from the probability of failure to balance load and generation system‐wide. The LOLP
underlying the ORDC is estimated for the ISO as a whole, as the probability of ERCOT needing to
shed load in the real‐time dispatch given varying levels of region‐wide on‐line and off‐line
reserves. The possibility of operating reserve demand varying locally within ERCOT was
discussed at the time ORDC was implemented, but was not pursued.
The ERCOT ORDC produces a number of benefits and represents a leap forward in the design of
the scarcity pricing mechanism in ERCOT. Through the economic dispatch, the ORDC
determines the scarcity price of reserves and the consistent energy price for all energy. It is
consistent with dispatchable demand, and would provide efficient incentives for demand to bid
into the dispatch. Furthermore, the ORDC is compatible with offer curve mitigation to deal with
any system‐wide market power concerns, and clearly distinguishes between cases of high
ERCOT‐wide prices because of underlying capacity scarcity versus high prices because of an
exercise of market power. In principle, the ORDC addresses ERCOT‐wide scarcity pricing and the
resulting missing money needed to support at least all economic investment in capacity (Hogan,
2013). The ORDC is not designed to support investment that is not economic given the

FTI Consulting, Inc. PRIORITIES FOR THE EVOLUTION OF AN ENERGY‐ONLY ELECTRICITY MARKET DESIGN IN ERCOT
Copyright © FTI Consulting, Inc., 2017 ERCOT ENERGY‐ONLY MARKET 17
reliability levels implied by the estimated LOLP. However, as discussed at length below,
numerous factors external to the ORDC influence its performance as a scarcity pricing
mechanism.

FTI Consulting, Inc. PRIORITIES FOR THE EVOLUTION OF AN ENERGY‐ONLY ELECTRICITY MARKET DESIGN IN ERCOT
Copyright © FTI Consulting, Inc., 2017 CHALLENGES TO ENERGY PRICE FORMATION 18
Challenges to Energy Price Formation
In ERCOT’s energy‐only market, suppliers are paid for sales of energy and ancillary services,
with additional adder values for scarcity as reserves diminish (ORDC) or reliability actions affect
prices (Reliability Deployment Price Adder).4 Under the energy‐only market design these
payments are intended to provide compensation for supply to be available – of the right type
and in the right location – for reliable system operation.
In the ERCOT market, distortions to the energy price are evident and must be addressed by
identifying and correcting their origin in energy market operations or price formation.
Sustaining the energy‐only market design requires that pricing reflect and be consistent with
the value of energy and the cost of actions occurring, or that need to occur, to maintain
reliability.
The data in Figure 3 show the recent trend in locational prices at the Houston Hub, inclusive of
the ORDC adder and the Reliability Deployment Price Adder. There has been a noticeable
decline in energy prices since 2014. The downward shift in prices over time is the result of many
factors, some of which are structural and are unrelated to the energy‐only market design,
although they interact with it. Subsidized wind had a meaningful impact for the first time in
2016. In addition, the decline in natural gas prices accounts for a substantial amount of the
reduction in energy prices and financial pressure on inframarginal rents for non‐renewable,
dispatchable producers in Texas. Potomac Economics reported that 2016 natural gas prices in
ERCOT were at their lowest level for 15 years, and that the average real‐time price in 2016 of
$24.65 per MWh was the lowest on record for ERCOT, going back to the start of the zonal
market in 2002.5 These important market conditions have a material impact, but they do not in
themselves indicate a problem with the market design assuming pricing outcomes are the
direct result of the market conditions. Low prices due to market fundamentals are a sign of
effective market operation.
4 ERCOT NPRR 568, “Real‐Time Reserve Price Adder Based on Operating Reserve Demand Curve,” approved November 19,
2013, and ERCOT NPRR 626, “Reliability Deployment Price Adder,” approved August 12, 2014.
5 Megawatt Daily, “ERCOT sets price, wind records in 2016: IMM,” February 15, 2017, p. 4.

FTI Consulti
Copyright ©
Below we
result of
highlight
are the r
tax credi
impact th
of this is
of issues,
center on
the need
operating
and the
origin of
how it m
right.
ng, Inc.
© FTI Consulting,
e examine o
broader eco
remaining
esult of fede
ts for wind a
he energy‐o
the process
, lying clearl
n the relatio
d for impro
g reserve re
cost to deli
the issues, t
must be addr
PRIORITIE
, Inc., 2017
other factors
onomic chan
market desi
eral or state
and solar pro
nly market,
s for transm
ly within the
onship betwe
oved local
quirements
ver electrici
the purpose
ressed as a m
ES FOR THE EVOL
s suppressing
nges. These
gn challeng
e‐level statut
oducers. Oth
but are not
ission plann
e domain o
een prices a
scarcity pric
. A further f
ity is the om
e here is to d
market desi
LUTION OF AN E
Figure 3
g or altering
effects are s
es. Some iss
tes or regula
her issues lie
part of the
ing and cost
f the energy
and ERCOT a
cing, includ
feature disto
mission of m
describe the
gn problem
ENERGY‐ONLY EL
CHALLENG
g energy pric
separate fro
sues impact
ations, such
e within the
energy‐only
t allocation.
y‐only mark
actions to m
ding the po
orting the cr
marginal loss
e price forma
with the ob
LECTRICITY MAR
GES TO ENERGY P
ces in ERCOT
om market fu
ting the ene
as productio
jurisdiction
y market des
Finally, the
ket design.
aintain relia
ssible intro
ritical linkage
ses. Witho
ation impact
bjective of g
RKET DESIGN IN
PRICE FORMATIO
T that are no
undamental
rgy‐only ma
on or invest
of the PUCT
sign. An exa
re is a third
Several of t
ability, sugge
duction of
e between p
out regard to
t and to con
getting the p
ERCOT
ON 19
ot the
s and
arkets
ment
T and
ample
class
these
esting
local
prices
o the
nsider
prices

FTI Consulting, Inc. PRIORITIES FOR THE EVOLUTION OF AN ENERGY‐ONLY ELECTRICITY MARKET DESIGN IN ERCOT
Copyright © FTI Consulting, Inc., 2017 CHALLENGES TO ENERGY PRICE FORMATION 20
The discussion below of challenges to price formation is organized around three topics:
• System‐wide Price Formation: The impact of subsidies for renewable resources and other
out‐of‐market influences on ERCOT’s region‐wide dispatch and prices. This section presents
important improvements to address region‐wide price formation issues, including
adjustments to the system‐wide ORDC consistent with the reliability impacts of changes in
the generation supply mix and out‐of‐market commitments, and the addition of the cost of
marginal losses to ERCOT’s energy market dispatch and pricing consistent with the best
practice in all other U.S. ISOs.
• Local Scarcity Pricing: The lack of pricing mechanisms to value ERCOT actions to maintain
local (as opposed to regional) reliability. A review of local price formation in the event of a
reliability unit commitment, particularly in combination with the mitigation of local market
power, shows the clear need for market rule changes to ensure that energy prices rise, rather
than fall, in regions experiencing local scarcity. This section proposes important changes to
ERCOT price formation to value scarcity when out‐of‐market actions occur to maintain local
reliability during conditions of transmission scarcity or when locational operating reserves
diminish.
• Transmission Planning and Cost Recovery: The effect of ERCOT’s policies for transmission
investment and cost recovery on price formation. This section motivates an urgent need to
consider alternatives to socialized transmission planning and cost recovery to avoid
unintended subversion of ERCOT’s market‐driven model for generation investment and the
distortion of energy‐only prices through the cost recovery rules for sunk transmission costs.
A technical Appendix provides details on a formulation and computational approach for the
calculation of co‐optimized prices for energy and operating reserves with local reserve
requirements.

FTI Consulting, Inc. PRIORITIES FOR THE EVOLUTION OF AN ENERGY‐ONLY ELECTRICITY MARKET DESIGN IN ERCOT
Copyright © FTI Consulting, Inc., 2017 SYSTEM‐WIDE PRICE FORMATION ISSUES 21
System‐wide Price Formation Issues
Policies outside the scope of the basic electricity market design have a significant impact on the
results of efficient markets operating under these policy umbrellas. A first grouping of policies
includes those that subsidize renewable resources, energy efficiency and demand response
with funding from sources outside of the energy‐only market. As a result, the size and extent of
the investments in the targeted assets or programs is not consistent with what a risk‐taking
investor would willingly invest if the only return were energy market revenues. This has had a
major effect on the prices in the ERCOT, increasing the need for reforms to sustain a market
design in which energy prices and risk taking by private investors drive investment in electricity
assets.
This section discusses the impact of these subsidies on the energy‐only market and describes
the following changes to better align energy‐only prices with the least cost dispatch in support
of reliability.
• Marginal Losses Pricing: Add the marginal cost of losses to ERCOT’s energy market dispatch
and pricing.
• Enhancements to ORDC: Improve the ORDC calculation to address the reliability impacts of
changes in the generation supply mix and the price impacts of reliability deployments.
RENEWABLE RESOURCES RECEIVE OUT‐OF‐MARKET COMPENSATION
The ITC and PTC have spurred a large increase in renewable investments in ERCOT and have
been a major factor in changes to the balance sheets of dispatchable electricity generation
owners in the region. These changes cannot be reversed. But an examination of the impact of
these policies external to the market reveals areas for improvement to region‐wide price
formation in ERCOT to support greater efficiency and sustainable electricity markets.
Production Tax Credit and Investment Tax Credit Incentives
Renewable resources receive payments from a variety of state and federal level programs that
are in addition to their earnings from market‐based sales of power.6 The most important of
these out‐of‐market payments is the Federal Renewable Electricity Production Tax Credit (PTC),
which in December 2015 was extended through December 31, 2019.7 The PTC is $0.015 per‐
kWh in 1993 dollars, adjusted for inflation, resulting in a 2016 tax rebate of $0.023/kWh for
wind, geothermal, and closed‐loop biomass generation. The tax credit applies to a facility’s first
6 Many federal policies and subsidies affect energy market and supply and demand, in addition to those discussed herein.
7 Energy.gov. “Renewable Electricity Production Tax Credit (PTC),” available at: https://energy.gov/savings/renewable‐electricity‐production‐tax‐credit‐ptc.

FTI Consulting, Inc. PRIORITIES FOR THE EVOLUTION OF AN ENERGY‐ONLY ELECTRICITY MARKET DESIGN IN ERCOT
Copyright © FTI Consulting, Inc., 2017 SYSTEM‐WIDE PRICE FORMATION ISSUES 22
ten years of operation, and more recent facilities are subject to a reduction in the PTC
depending on the year of construction. Some facilities have the option to make an irrevocable
election to claim the Business Energy Investment Tax Credit (ITC) instead of claiming the PTC,
allowing a deduction of up to 30% of the cost of renewable energy technology on federal
income taxes, although the percentage varies by technology and year.8
Texas also has several state‐level programs to encourage the development of renewable
generation, but their impact is dwarfed by the incentives of the Federal PTC and ITC. Texas
programs include a renewable generation requirement (renewable portfolio standard)9,10 and a
renewable energy credit (REC) program administered by ERCOT11 to support renewable
portfolio standards applied to retail energy providers.12 The REC prices in ERCOT have been the
lowest in the country since the beginning of 2013 due to the substantial build out of wind
resources, at less than $1 per MWh.13 Additionally, there is a Solar Energy Business Franchise
Tax Exemption, which is either .375% or .75% of the taxable entity’s margin,14 and is available
to businesses selling and installing wind and a variety of solar technologies, and also to the
businesses buying the equipment.15
Figure 4 below shows the capacity of wind additions in ERCOT by year, in response in part to
the strong financial incentives of the PTC and ITC.
8 Database of State Incentives for Renewables and Efficiency. “Business Investment Tax Credit,” available at:
http://programs.dsireusa.org/system/program/detail/658.
9 National Conference of State Legislatures. “State Renewable Portfolio Standards and Goals” http://www.ncsl.org/research/energy/renewable‐portfolio‐standards.aspx
10 Intermediate goals, according to PUCT Substantive Rule §25.173 were: 2,280 MW by January 1, 2007, 3,272 MW by 2009, 4,264 MW by 2011, and 5,256 MW by 2013.
11 ERCOT “Renewable Energy Credit,” available at: http://www.ercot.com/services/programs/rec
12 PUCT Substantive Rule §25.173, available at: https://www.puc.texas.gov/agency/rulesnlaws/subrules/electric/25.173/25.173.pdf.
13 US Department of Energy: Energy Efficiency and Renewable Energy. “Renewable Energy Certificates,” available at:
http://apps3.eere.energy.gov/greenpower/markets/certificates.shtml?page=5. 14 Texas Comptroller, “Franchise Tax,” available at: https://www.comptroller.texas.gov/taxes/franchise/.
15 Texas Tax Code Chapter 11.27.

FTI Consulti
Copyright ©
Actual w
factor as
in compa
ng, Inc.
© FTI Consulting,
ind output h
new develo
arison with a
PRIORITIE
, Inc., 2017
has similarly
opments hav
an output of
ES FOR THE EVOL
y increased o
ve come on l
f 53,116 GW
LUTION OF AN E
Figure 4
over time, w
ine. Total w
h in 2016, as
ENERGY‐ONLY EL
SYSTEM
without a sign
wind product
s seen in Fig
LECTRICITY MAR
M‐WIDE PRICE FO
nificant redu
tion in 2011
gure 5:
RKET DESIGN IN
ORMATION ISSU
uction in cap
was 27,894
ERCOT
UES 23
pacity
GWh

FTI Consulti
Copyright ©
Efficiency
When a
marginal
renewab
as much
MWh, be
would be
has been
of wind c
the Ame
MW of w
16 Ene
ng, Inc.
© FTI Consulting,
y Impact of
PTC is paid
cost intend
ble systems i
as possible
ecause at a
e positive.16
n reduced fro
capacity in T
rican Recov
wind operat
ergy.gov. “Renewelectricity‐produ
PRIORITIE
, Inc., 2017
PTC on ERCO
d, the paym
ded to incent
s $23 per M
e whenever
ny price jus
In effect, fro
om approxim
Texas in 201
very and Rei
ing in ERCO
wable Electricity uction‐tax‐credit
ES FOR THE EVOL
OT Dispatch
ment is trigg
t suppliers t
MWh, meanin
the location
st above ‐$2
om the pers
mately zero t
16, approxim
nvestment A
OT with a pr
Production Tax t‐ptc.
LUTION OF AN E
Figure 5
h and Prices
gered by act
o produce e
ng that a qu
nal price at
23 per MWh
pective of th
to ‐$23 per
mately 2,704
Act of 2009
oduction ta
Credit (PTC),” a
ENERGY‐ONLY EL
SYSTEM
tual produc
electricity. Th
ualifying sup
its location
h, its total p
he generato
MWh. Of th
4 MW electe
, leading to
x credit. Ap
vailable at: http
LECTRICITY MAR
M‐WIDE PRICE FO
tion, in effe
he current P
plier would
n was greate
payment, in
or, the margi
he approxima
ed a cash gr
an estimat
pproximatel
ps://energy.gov/
RKET DESIGN IN
ORMATION ISSU
ect changing
PTC for qual
want to pro
er than ‐$23
ncluding the
inal cost for
ately 18,923
rant or ITC u
e of over 16
ly 16,000 M
/savings/renewa
ERCOT
UES 24
g the
ifying
oduce
3 per
PTC,
wind
3 MW
under
6,000
W of
able‐

FTI Consulting, Inc. PRIORITIES FOR THE EVOLUTION OF AN ENERGY‐ONLY ELECTRICITY MARKET DESIGN IN ERCOT
Copyright © FTI Consulting, Inc., 2017 SYSTEM‐WIDE PRICE FORMATION ISSUES 25
wind capacity in Texas thus has an incentive to operate as much as possible, even at locational
prices less than zero.17
The PTC modifies the actual marginal cost, which affects the wind generator’s offer, which then
alters the locational price signal and may lead to a higher‐cost dispatch than would have
occurred without the tax credit. For example, this would be evident when the renewable
supplier is injecting power into the system that has a negative locational price. A locational
price of ‐$2 per MWh, for example, means that in order to accommodate the injections of
power from the renewable supplier without compromising reliability, the dispatch of other
suppliers and loads on the system had to be adjusted and the net cost (not savings) of these
other adjustments on the margin was $2 per MWh, equivalent to subsidizing incremental
load.18
Along with the economic dispatch, locational prices are altered by the PTC. Figure 6 shows the
number of intervals of the year, from 2013‐2016, in which there were negative prices at four
ERCOT trading hubs. Prior to the increase in wind and other intermittent capacity in the ISOs,
negative prices sometimes occurred in the middle of the night, as load dropped and generators
needed for operation the following day were pinned at their minimum loads. In contrast, the
increasing incidence of negative prices in ERCOT is caused by the incentive of the owners of
wind generation capacity receiving the PTC to continue to produce even when the locational
price is negative.
The relatively high frequency of negative prices observed in the western part of ERCOT
occurred because the large number of wind farms in the rural western and northern areas of
the state overwhelmed export capacity of the local transmission system and created
transmission constraints that can limit the export of this power to other regions of ERCOT.19 As
the Competitive Renewable Energy Zones (CREZ) transmission project reached completion and
installed capacity of wind generation continued to grow, system dispatch at negative prices
increasingly impacted prices at the Houston, Southern, and Northern Hubs, as power from wind
is setting the prices more frequently outside the West zone, as seen in Figures 6 and 7.
17 “1603 Program: Payments for Specified Energy Property in Lieu of Tax Credits,” available at
https://www.treasury.gov/initiatives/recovery/Pages/1603.aspx
18 Viewing the PTC as an imperfect estimate of the social cost of carbon emissions (and other emissions) avoided by the use of renewable energy rather than fossil‐fuel fired energy is a relevant element to evaluation of the effect of the production tax credit on social welfare. This paper does not attempt to unwind the diverse and complicated efficiency impacts of state and federal government programs to increase electricity production from renewable sources. Programs to encourage electricity production from renewable sources may move in the direction of efficiency, but a policy that does not apply consistent subsidies or charges to all carbon‐emitting sources within a broad region could have complex second‐order welfare effects.
19 EIA, “Today in Energy,” June 24, 2014, available at: http://www.eia.gov/todayinenergy/detail.php?id=16831.

FTI Consulti
Copyright ©
ng, Inc.
© FTI Consulting,
PRIORITIE
, Inc., 2017
ES FOR THE EVOL
LUTION OF AN E
Figure 6
ENERGY‐ONLY EL
SYSTEM
LECTRICITY MAR
M‐WIDE PRICE FO
RKET DESIGN IN
ORMATION ISSU
ERCOT
UES 26

FTI Consulti
Copyright ©
Subsidize
decreasin
subsidize
amount o
curve du
supply cu
variation
impact o
more sha
in wind d
result fro
and the a
ng, Inc.
© FTI Consulting,
ed wind ene
ng prices in
ed wind pro
of wind and
ring each in
urve could b
ns in the qua
n price. Wit
arply, as unit
during a high
om the inter
actual wind
PRIORITIE
, Inc., 2017
ERCOT Win
ergy is not o
every hour
oduction on
the unit com
nterval. If th
be relatively
antity of win
th higher lev
ts with high
h load interv
rplay betwee
conditions d
ES FOR THE EVOL
nd Turbines
only increasi
r that the w
n locational
mmitment, w
ere were a
y flat over a
d might shif
vels of load,
er heat rate
val would lik
en forecasts
during a 5‐ m
LUTION OF AN E
Figure 7 and 345 kV
ing the freq
wind farms a
prices depe
which deter
number of u
range of o
ft the supply
the supply c
s would be
kely lead to
of the level
minute interv
ENERGY‐ONLY EL
SYSTEM
Transmissio
uency of ne
are generat
ends on th
mines the sh
units operat
utput near
y curve but w
curve would
needed to m
a larger dro
of wind out
val.
LECTRICITY MAR
M‐WIDE PRICE FO
on Lines
egative price
ing. The deg
e relationsh
hape of the
ting near mi
the market
would have
likely start t
meet deman
op in price.
tput, comm
RKET DESIGN IN
ORMATION ISSU
es in ERCOT
gree of effe
hip between
electricity su
inimum load
clearing, so
a relatively
to slope upw
nd, so an incr
Locational p
itment decis
ERCOT
UES 27
T, it is
ect of
n the
upply
d, the
o that
small
wards
rease
prices
sions,

FTI Consulting, Inc. PRIORITIES FOR THE EVOLUTION OF AN ENERGY‐ONLY ELECTRICITY MARKET DESIGN IN ERCOT
Copyright © FTI Consulting, Inc., 2017 SYSTEM‐WIDE PRICE FORMATION ISSUES 28
Figures 8 and 9 on the following two pages are based on actual ERCOT data for 1 AM on August
1, 2016 and April 4, 2016.20 These show the impact of varying levels of wind production on
prices in ERCOT in an unconstrained dispatch to serve 45,000 MW of load on August 1, and
25,000 MW of load on April 4.21
As the quantity of wind supply changes from 0 MWh, to 5,000 MWh, to 10,000 MWh, to 15,000
MWh, it shifts the supply curve to the right in successive panels of the figures, reducing the
clearing price for any level of electricity demand. In the August 1st illustration, with a load of
45,000 MW, the clearing price starts at $30.02 per MWh with no wind, falling to $26.25 per
MWh with 5,000 MWh of wind and then to $22.82 per MWh with 15,000 MWh of wind.
The example for April 1st illustrates how the impact of the wind power on prices depends on the
capacity online in an interval. In the April 4th illustration, the clearing price falls $2.67 per MWh
when the first 5,000 MW of wind power enters the grid but then falls less, by $1.42, when wind
increases another 5,000 MWh to 10,000 MWh.
It is possible that price increases may not be as large as shown in the figures if wind were to
drop because, for instance, ERCOT might be able to quickly arrange for increased imports or
bring additional capacity on line. Similarly, there could be much larger price changes than
shown here in some intervals from a drop in wind if there were insufficient capacity available to
ramp. But the illustrations clearly suggest how over many hours the accumulation of the price
impact on dispatchable generation not receiving the PTC sums to a very substantial reduction in
its net margin.
20 The impact of subsidized wind production on prices has been estimated with the simplifying assumption of no active
transmission constraints.
21 The bid of $0 per MWh for wind supply is used for purposes of illustration.

FTI Consulting, Inc. PRIORITIES FOR THE EVOLUTION OF AN ENERGY‐ONLY ELECTRICITY MARKET DESIGN IN ERCOT
Copyright © FTI Consulting, Inc., 2017 SYSTEM‐WIDE PRICE FORMATION ISSUES 29
Figure 8 Illustrative Off‐Peak ERCOT Supply Curve 1 AM August 1, 2016 (45,000 MW Load)
0
5
10
15
20
25
30
35
40
45
50
0 20,000 40,000 60,000
$/M
Wh
Cumulative Capacity MW
No Wind
Clearing Price = $30.02
0
5
10
15
20
25
30
35
40
45
50
0 20,000 40,000 60,000
$/M
Wh
Cumulative Capacity MW
5,000 MW Wind
Clearing Price = $26.25
0
5
10
15
20
25
30
35
40
45
50
0 20,000 40,000 60,000
$/M
Wh
Cumulative Capacity MW
10,000 MW Wind
Clearing Price = $24.18
0
5
10
15
20
25
30
35
40
45
50
0 20,000 40,000 60,000
$/M
Wh
Cumulative Capacity MW
15,000 MW Wind
Clearing Price = $22.82
Cost and capacity data from Ventyx Supply Curve Analyst for August 4, 2016. Removed units not in operation. Using
Ventyx data set for plant level generation on August 1 2016 at 1 AM, additional units removed if they had no net
generation and were larger than 50 MW.

FTI Consulting, Inc. PRIORITIES FOR THE EVOLUTION OF AN ENERGY‐ONLY ELECTRICITY MARKET DESIGN IN ERCOT
Copyright © FTI Consulting, Inc., 2017 SYSTEM‐WIDE PRICE FORMATION ISSUES 30
Figure 9 Illustrative Off‐Peak ERCOT Supply Curve
1 AM April 4, 2016 (25,000 MW Load)
0
5
10
15
20
25
30
35
40
45
50
0 20,000 40,000
$/M
Wh
Cumulative Capacity MW
No Wind
Clearing Price = 26.30
0
5
10
15
20
25
30
35
40
45
50
0 20,000 40,000
$/M
Wh
Cumulative Capacity MW
5,000 MW Wind
Clearing Price = $23.63
0
5
10
15
20
25
30
35
40
45
50
0 20,000 40,000
$/M
Wh
Cumulative Capacity MW
10,000 MW Wind
Clearing Price = $22.21
0
5
10
15
20
25
30
35
40
45
50
0 20,000 40,000
$/M
Wh
Cumulative Capacity MW
15,000 MW Wind
Clearing Price = $20.74
Cost and capacity data from Ventyx Supply Curve Analyst for April 1, 2016. Using Ventyx data set for plant level
generation on April 4, 2016 at 1 AM, additional units removed if they had no net generation and were larger than 50
MW.

FTI Consulti
Copyright ©
The incre
peak hou
from tho
example,
peak day
Although
adder du
The PTC
hours in
may now
energy m
supplier f
It is impo
locationa
increases
ng, Inc.
© FTI Consulting,
ease in the q
urs, as the d
ose of earlie
, shows that
ys of the yea
h wind is int
uring peak ho
affects the l
which a no
w not be ru
margin, whic
fixed costs.
ortant to no
al prices as
s the quanti
PRIORITIE
, Inc., 2017
quantity of w
iurnal chara
r wind deve
t the quantit
ar rose from
termittent, i
ours.
level of disp
n‐wind supp
unning, or m
ch in an ene
ote that the
the PTC. Th
ty of interm
ES FOR THE EVOL
wind product
cteristics of
elopments in
ty of wind o
m less than 1
t is clearly d
F
patch of non
plier would
may be runn
ergy‐only m
ITC does no
he ITC affec
mittent capac
LUTION OF AN E
tion in ERCO
new wind d
n the weste
output in ERC
1,000 MW in
decreasing t
Figure 10
‐wind suppl
have been
ning at a low
market is the
ot have the s
cts incentive
city bidding
ENERGY‐ONLY EL
SYSTEM
OT has occur
development
rn area of E
COT in the m
n 2012, to w
the probabi
iers as well
infra‐margin
wer dispatc
e primary so
same impact
es to build n
at low price
LECTRICITY MAR
M‐WIDE PRICE FO
rred in both
ts along the
ERCOT. Figu
middle of th
well over 5,0
lity of scarc
as their loca
nal in the ab
ch point. T
ource of rev
t on margin
new renewa
es into the E
RKET DESIGN IN
ORMATION ISSU
on‐peak and
Gulf Coast d
ure 10 below
e day in the
000 MW in 2
ity and an O
ational price
bsence of PT
his decrease
venue to pa
al incentives
able capacity
ERCOT elect
ERCOT
UES 31
d off‐
differ
w, for
e four
2016.
ORDC
es. In
TC, it
es its
ay for
s and
y and
tricity

FTI Consulting, Inc. PRIORITIES FOR THE EVOLUTION OF AN ENERGY‐ONLY ELECTRICITY MARKET DESIGN IN ERCOT
Copyright © FTI Consulting, Inc., 2017 SYSTEM‐WIDE PRICE FORMATION ISSUES 32
market, but once the capacity is built, suppliers receiving the ITC will respond efficiently to
locational prices and, in particular, will not have an incentive to supply at negative prices.
Impact of Increasing Intermittent Generation on Ancillary Service Needs
Secondary to the impact on energy prices, the increasing reliance on intermittent resources,
such as wind, also potentially affects ERCOT’s requirements for ancillary services. In ISO
capacity markets outside ERCOT, non‐intermittent suppliers are compensated more highly for
nameplate capacity than intermittent suppliers because of the dependability of their supply. A
capacity market payment, in principle, is the market‐clearing payment required by the marginal
capacity supplier, in addition to its energy and ancillary services market revenue, in order to
impel it to be available. The capacity market payment compensates for the missing money in
expected energy and ancillary service market payments in order to ensure that sufficient
capacity is in operation to meet reliability standards. In ERCOT’s energy‐only market, though,
the price signal that rewards the short‐ or long‐run value of non‐intermittent, dispatchable
supply is a combination of the energy price, the ORDC adder paid during ERCOT‐wide scarcity,
and the Reliability Deployment Price Adder.
For several years, ISOs experiencing increases in intermittent generation have been studying
the possible need for new requirements for regulation, inertial response and operating
reserves. The same questions about ancillary services are arising in ERCOT, and the possibility of
increased system efficiency led to an investigation of the benefits of alternative ancillary service
product definitions and requirements, such as synchronous inertia service.22 During 2016 in
ERCOT, the largest 1 hour upward ramp was 3,624 MW, and there were 49 hours over the year
with hourly upward ramps of over 2,000 MW. The largest downward ramp was 3,080 MW, and
there were 38 hours with downward ramping of over 2,000 MW.23 Despite this variability in
supply, ERCOT’s ability to manage system frequency has improved, which eliminated the need
to modify ancillary services at this time.24 The question remains whether changes in the size of
hourly ramps, and other changes related to the increase in intermittent generation, necessitate,
or would lead to benefits from, new or revised reliability constraints and requirements within
ERCOT’s energy‐only market design.
22 ERCOT. “NPRR 667 Ancillary Service redesign 111814,” November 8, 2014, available at:
http://www.ercot.com/content/mktrules/issues/nprr/651‐675/667/keydocs/667NPRR‐ 01_Ancillary_Service_Redesign_111814.doc.
23 ERCOT 2016 Hourly Aggregated Wind Output, available at: http://mis.ercot.com/misapp/GetReports.do?reportTypeId=13424&reportTitle=Hourly%20Aggregated%20Wind%20Output&showHTMLView=&mimicKey.
24 ERCOT “Monthly Operational Overview,” March 15, 2017, p. 6, available at: http://www.ercot.com/content/wcm/key_documents_lists/27311/ERCOT_Monthly_Operational_Overview_201702.pdf

FTI Consulting, Inc. PRIORITIES FOR THE EVOLUTION OF AN ENERGY‐ONLY ELECTRICITY MARKET DESIGN IN ERCOT
Copyright © FTI Consulting, Inc., 2017 SYSTEM‐WIDE PRICE FORMATION ISSUES 33
The California Independent System Operator (CAISO) and the Midcontinent Independent
System Operator (MISO) worked for several years to develop ramping products to compensate
flexible dispatchable generators for the ability to increase or decrease their output quickly.
These efforts illustrate the connection between evolving capabilities for how and when
ancillary services are scheduled in an ISO’s real‐time unit commitment and dispatch software,
the determination of whether or not a ramping product or other change to ancillary service
requirements is needed, and the effectiveness of any proposed implementation approach. The
CAISO implemented a flexible ramping constraint in its short‐term unit commitment process
(real time pre‐dispatch, RTPD) in December 2011 and the MISO has been committing capacity
to provide “headroom” even longer. These early processes, however, did not insure that the
desired ramping capacity was maintained in the dispatch. In particular, the CAISO process
tended to create phantom ramp, because of the assumption that capacity available to ramp
hour ahead would actually be available to ramp in real time. Their implementation of the hour‐
ahead ramping constraint did not entail paying units the opportunity cost of capacity reserved
to ramp rather than being dispatched for energy in real‐time.
In May 2016 the MISO implemented a ramp capability dispatch and in December 2016 the
CAISO implemented a similar dispatch design referred to as the flexible ramping product.25
Because the CAISO clears both a 15‐minute and a 5‐minute real‐time market, the CAISO ramp
pricing design provides compensation both to resources dispatchable in a 5‐minute time frame
and a 15‐minute time frame; the market‐clearing price is calculated based on both opportunity
costs and penalty factors.26 The MISO product is implemented within a single‐interval real‐time
dispatch for energy and reserves. The CAISO does not co‐optimize energy with other ancillary
services in its 5‐minute multi‐interval dispatch, although this is under consideration. Ramping is
considered in the look‐ahead commitment in both ISOs.
A key consideration in the implementation of a dynamic product, such as ramping, is the
connection between the scheduling and pricing of the product and any inter‐temporal
optimization of the dispatch. For example, under the idealized conditions of an energy‐only
market, co‐optimization in a dynamic framework will produce LMPs that reflect ramping
constraints and compensate the provision of the corresponding ramp without requiring the
definition of new products. Although ERCOT and its stakeholders have been examining the
25 MISO Market Subcommittee. “Ramp Capability Product Performance Update,” November 29, 2016, p. 2, available at:
https://www.misoenergy.org/Library/Repository/Meeting%20Material/Stakeholder/MSC/2016/20161129/20161129%20MSC%20Item%2005f%20Ramp%20Capability%20Post%20Implementation%20Analysis.pdf; FERC. “Order on Tariff Revisions,” September 26 2016. Docket No. ER16‐2023‐000.
26 Bushnell, Harvey and Hobbs, “Opinion on Flexible Ramping Product,” CAISO Market Surveillance Committee, DRAFT, January 20, 2016, available at: https://www.caiso.com/Documents/Draft_MSC_Opinion_FlexibleRampingProduct‐Jan2016.pdf.

FTI Consulting, Inc. PRIORITIES FOR THE EVOLUTION OF AN ENERGY‐ONLY ELECTRICITY MARKET DESIGN IN ERCOT
Copyright © FTI Consulting, Inc., 2017 SYSTEM‐WIDE PRICE FORMATION ISSUES 34
need for a “Multi‐Interval Real Time Market,” this possible innovation is not a current priority.
A discussion of the need to develop new dynamic products or services would be most
productive as a component of a broader discussion of the costs and benefits of explicit real‐
time inter‐temporal co‐optimization of energy and ancillary services as a refinement in getting
the prices right when changes in net load could occur that have not been forecasted.
UTILITY ENERGY EFFICIENCY AND DEMAND RESPONSE PROGRAMS REDUCE PEAK LOAD
Energy Efficiency (EE) and Demand Response (DR) programs in Texas continue to grow and
reduce projected ERCOT peak electricity demand. Beginning January 1, 2013, the Texas PUCT
implemented a Texas 2011 legislative directive requiring utility EE/DR program goals to be
measured as a percentage of peak demand, as opposed to prior measurement as a percentage
of projected peak demand growth, increasing the expected impact of these utility programs.27
Under subsequently adopted PUCT procedures in response to the 2011 legislation, Texas
utilities are responsible for administering incentive programs necessary to meet the EE/DR
reduction goals.28 The utility programs are implemented mainly through energy efficiency
service providers in order to reduce peak electricity demands and energy consumption.29 The
costs of the EE/DR programs are recovered from utility ratepayers through specific EE/DR cost‐
recovery charges.30
EE/DR programs have progressively reduced peak demand in ERCOT.31 ERCOT now reports an
expected peak demand reduction associated with utility EE/DR programs of 407 MW in 2017,
with the reduction expected to grow to 677 MW in 2019.32
EE/DR peak demand reductions put additional downward pressure on ERCOT peak period
electricity prices. While the change in the supply and demand balance in ERCOT from the EE/DR
27 Texas Senate Bill 1125, 2011.
28 See, generally, PUCT Substantive Rule 25.181, “Substantive Rules Applicable to Electric Service Providers, Subchapter H., Electrical Planning, Division 2, Energy Efficiency and Customer‐Owned Resources,” Energy Efficiency Goal, available at: http://www.puc.texas.gov/agency/rulesnlaws/subrules/electric/25.181/25.181.pdf.
29 See, generally, Texas Energy Efficiency, available at: http://www.texasefficiency.com/index.php/about/energy‐efficiency‐rule.
30 PUCT Chapter 25, §25.181, at C (13).
31 Frontier Associates LLC, “Energy Efficiency Accomplishments of Texas Investor‐Owned Utilities, Calendar Year 2015,”, available at: http://www.texasefficiency.com/images/documents/Publications/Reports/EnergyEfficiencyAccomplishments/EEPR2015.pdf.
32 ERCOT, “Report on the Capacity, Demand and Reserves (CDR) in the ERCOT Region, 2017‐2026,” December 15, 2016, p. 99, available at: http://www.ercot.com/content/wcm/lists/96607/CapacityDemandandReserveReport‐Dec2016.pdf, reporting estimated reductions based on 2011 legislation (see page 6). ERCOT’s reported demand reductions are based on newly estimated EE/DR peak demand reductions (thus do not include previously achieved reduction) and do not include impacts that may occur after 2019.

FTI Consulting, Inc. PRIORITIES FOR THE EVOLUTION OF AN ENERGY‐ONLY ELECTRICITY MARKET DESIGN IN ERCOT
Copyright © FTI Consulting, Inc., 2017 SYSTEM‐WIDE PRICE FORMATION ISSUES 35
programs is not as dramatic as that occurring due to subsidized wind production or the 4CP
transmission cost allocation discussed below, the EE/DR programs are a further instance in
which out‐of‐market payments are reducing energy‐only prices. EE and DR reductions in peak
demand are funded by programs recovered through utility rates, rather than by customer
savings achieved from efficient market behavior to reduce consumption that would otherwise
be charged the energy‐only price plus, possibly, a scarcity adder. These programs reflect state‐
level policy goals and choices. But there is no avoiding that the existence of these programs has
an impact on energy‐only market prices in ERCOT, and on the ability of the energy‐only market
design to operate as intended to incentivize efficient supply and demand reduction.33
IMPROVEMENTS TO SYSTEM‐WIDE PRICE FORMATION
Retirement of existing facilities, even early retirement, could be consistent with efficient
market operations. In ERCOT, the pressure is on dispatchable generation capacity due to falling
natural gas prices, increasing wind production spurred by out‐of‐market payments, and other
factors external to the energy market under the direct control of the PUCT. The low level of
region‐wide energy prices and ORDC adders are sending a message for dispatchable resources
to exit the market, and there is a need to evaluate the consequences of increasing reliance on
intermittent sources of energy. In particular, these external factors and shifting market
conditions highlight the importance of improving price formation to ensure that it is
fundamentals, and not avoidable market influences or defects that drive decisions about
retirement, entry or plant maintenance. The PUCT and ERCOT have started this process
through the review of whether reforms are needed in system‐wide pricing, specifically the
ORDC.
ORDC Reforms
There is a broad range of proposals for changes in the design of the system‐wide ORDC (Bryant,
Harvey, & Haas, 2016). The discussion has covered many different issues, ranging from a view
that implementation of the ORDC has worked largely as expected and there is no need for
immediate reforms, to specific suggestions for changing the parameters or utilization of the
ORDC.
A focus on evaluation and possible reforms is appropriate, but it is also important to recognize
how far ERCOT has come in supporting the use of the ORDC. Although the basic principle of
having a demand curve for operating reserves is widely accepted across other organized
markets in the United States, it is only in ERCOT that the approach has been explicitly
connected to underlying principles of reliability and efficient market design. For example,
33 The Reliability Deployment Price Adder addresses the price impact of load resource deployment by the IESO, but not
load reductions due to distribution level funding of EE/DR.

FTI Consulti
Copyright ©
Figure 11
system t
but on an
The ERCO
ORDC do
ORDC pl
forward c
34 “[T]
35 “Th
ng, Inc.
© FTI Consulting,
1 compares
han ERCOT.
n estimate o
OT ORDC ref
oes not app
ays a smal
capacity ma
he $300/MWh panalysis of offer“Proposed Tarif
e ORDCs PJM cuemergency opePJM Interconne24‐000, Novemb
PRIORITIE
, Inc., 2017
the ORDC im
In essence,
of the supply
flects the va
ly in all hou
ler role in
rket.
price is approprir data for resourff Revisions of PJ
urrently utilizes wrating conditionction, L.L.C And ber 30, 2015.).
ES FOR THE EVOL
mplemented
, the PJM OR
y costs of like
F
lue of the re
urs, but only
the system
iate for reservesrces that are likeM Interconnect
were designed us and therefore Southwest Pow
LUTION OF AN E
d in ERCOT w
RDC is based
ely providers
Figure 11
eserves, not
y during de
and PJM h
s on the second ely to be called oion, L.L.C.”, FERC
under the assumthe curves are a
wer Pool, Inc. Add
ENERGY‐ONLY EL
SYSTEM
with that in
d not on the
s.34
the cost of
eclared eme
has implem
step of the propon to provide resC Docket No. ER
mption that shorta step function” dressing Shortag
LECTRICITY MAR
M‐WIDE PRICE FO
PJM, which
e value of op
supply. In a
rgencies.35
ented a ce
posed ORDC basserves in the OpR15‐643‐000, De
tage pricing wou (PJM and SPP, “ge Pricing,” FERC
RKET DESIGN IN
ORMATION ISSU
is a much l
perating res
addition, the
Hence, the
ntrally‐orga
ed on an internaperating Day” (PJecember 17, 201
uld only occur du“Joint CommentC Docket No. RM
ERCOT
UES 36
arger
erves
e PJM
e PJM
nized
al JM, 14).
uring ts Of M15‐

FTI Consulti
Copyright ©
Opportun
three pa
the level
factor is
available
Reliabilit
X Factor
The man
operator
the Energ
requirem
the price
scarcity p
It would
operator
ng, Inc.
© FTI Consulting,
nities for fu
rameters th
when the p
the specific
e that defin
y Unit Comm
y proposed
r can or shou
gy Emergenc
ments for ro
e of energy
price less tha
be possible,
r‐initiated re
PRIORITIE
, Inc., 2017
urther refine
hat define th
price matche
c protocols f
e the scarc
mitment (RU
changes in
uld take und
cy Alert prot
lling blackou
should be s
an the VOLL
, and was co
eliability step
ES FOR THE EVOL
ement of the
he shape an
es the VOLL;
for determin
city price di
UC) decisions
the “X” fact
der stressed
tocols range
uts. The rol
set at the V
.
F
onsidered in
ps ERCOT co
LUTION OF AN E
e ORDC fall
d magnitud
; the VOLL;
ning the rea
ictated by t
s (Supply An
tor focus on
conditions.
e from calls f
lling blackou
VOLL, but th
Figure 12
the initial d
ould take un
ENERGY‐ONLY EL
SYSTEM
into four b
e of the OR
and the est
al‐time amo
the ORDC,
nalysis Work
the connec
For exampl
for voluntary
ut condition
he other cas
design, to mo
nder emerge
LECTRICITY MAR
M‐WIDE PRICE FO
broad catego
RDC: the “X”
imate of the
unts of the
such as the
king Group, 2
tion with ac
e, the differ
y conservati
n is the idea
ses would im
odel each of
ency conditi
RKET DESIGN IN
ORMATION ISSU
ories. Ther
” factor that
e LOLP. A fo
various res
e accountin
2016).
ctions the sy
rent stages u
on to mand
lized case w
mply some o
f the increm
ions. This w
ERCOT
UES 37
e are
t sets
ourth
erves
g for
ystem
under
atory
where
other
mental
would

FTI Consulting, Inc. PRIORITIES FOR THE EVOLUTION OF AN ENERGY‐ONLY ELECTRICITY MARKET DESIGN IN ERCOT
Copyright © FTI Consulting, Inc., 2017 SYSTEM‐WIDE PRICE FORMATION ISSUES 38
produce an ORDC with multiple steps, some probably below and some possibly above the
current “X” value of 2,000 MW. This might be appropriate to provide better signals during
conditions when actual reserves fall at or below 2,000 MW. However, it is not clear that these
proposals would have much impact on the level of the implied scarcity price when operating
reserves are well above 2,000 MW. Most of the operating hours, as shown in Figure 12, and
most of the experience with scarcity pricing, have been in this higher range of reserves.36
Hence, the main impact on average revenues may not be much affected by refinements to the
“X” value, as the scarcity prices at these higher levels of reserves are driven in large part by the
LOLP which would not change much with modest changes in the “X” value.
The proposals for changes in the “X” factor emphasize that there is a more complex picture for
the underlying actions under stressed conditions than a one‐step transition to load shedding.
But a further issue with suggestions to increase the X threshold is that the justification to refine
the ORDC to include steps to better match actual operator actions would also lead to an
implied scarcity price of less than the VOLL for actions at a lower level of stress than actual load
shedding.
The design of the ORDC did recognize this interaction effect and, in part, the choice by the
Commission to use a single “X” factor at the VOLL was a compromise in the name of simplicity.
A comparison of the compromise with the details of actual operations could be revisited, but
the logic of an argument to introduce steps to ORDC representing X factors of increasing
severity would likely dictate use of values lower than VOLL for emergency actions of less
severity than the case of actual rolling blackouts. The details of an illustrative version of a
“multiple emergency actions” ORDC curve appear in the Appendix. On the whole, it is possible
that refinement of the X value or the approximation of multiple X steps consistent with
emergency actions reflecting differing levels of estimated loss of load probability would not
result in a material change to the ORDC scarcity price signal in most hours and would therefore
introduce unnecessary complexity.
VOLL
Similarly, the choice of the VOLL of $9,000/MWh was made by the Commission as a reasonable
approximation of a more complicated underlying reality. There are many different estimates of
the VOLL, under different conditions. The decision was to approximate the average value of
lost load of those customers who would be included as a group in an involuntary load
curtailment by ERCOT. The group would be heterogeneous, and some would have a higher and
some a lower VOLL. But the average is the appropriate measure given the current technology
for curtailment. By contrast, voluntary reductions can be accommodated through load bidding
36 Surendran, Resmi, “ERCOT: Role and Value of Scarcity Pricing,” 2017, EUCI Presentation, April 10, 2017.

FTI Consulting, Inc. PRIORITIES FOR THE EVOLUTION OF AN ENERGY‐ONLY ELECTRICITY MARKET DESIGN IN ERCOT
Copyright © FTI Consulting, Inc., 2017 SYSTEM‐WIDE PRICE FORMATION ISSUES 39
or self‐initiated demand reductions and do not need to be part of the definition of the ORDC.
Hence, the concept of the VOLL is to estimate the best proxy of the cost to load of emergency
actions implemented through actual involuntary curtailment protocols.
LOLP
The loss of load probability (LOLP) is the component most straightforward to estimate. Because
of its detailed records, ERCOT can use the available data to estimate the standard deviation and
mean for “…historic events defined as the difference between the hour‐ahead forecasted
reserves with the reserves that were available in Real‐Time during the Operating Hour” (Supply
Analysis Working Group, 2016, p. 8). This is the definition of the LOLP for the ORDC, which can
vary across time to reflect different operating conditions such as changing availability of
intermittent renewable sources. This estimate can capture the LOLP and the expected value of
operating reserves.
An argument for changing the LOLP arises from a perspective to be conservative in the
reliability estimates or due to the increased risk of renewable volatility on reserves. The
current LOLP is taken from data and is the correct theoretical framework. However, the
analysis assumes that the system operator has an accurate forward‐looking model of the
system and that there will be no operational surprises outside of the range of history. A natural
response to adopting a conservative bias, given the relative lack of foresight or experience in
operating a system heavily dependent on intermittent resources would be to make a
judgmental adjustment in the margin of safety by shifting the LOLP. This would leave
untouched the “X” and VOLL levels, but provide a higher estimated scarcity price during the
bulk of the hours at levels where the system normally operates. And the conscious shift of the
LOLP would provide a good measure of the degree of the conservative assumption. A shift of a
small fraction of a standard deviation would seem not very conservative. A shift of the LOLP by
a full standard deviation would seem like a large margin of safety.
Stated in terms of the analytical description of the ORDC, a conservative shift of the LOLP would
be a fraction of the standard deviation of the cumulative density function (CDF) estimated for
system reliability given a level of hour‐ahead reserves (R).
, , , 1 , ,LOLP s R CDF s R
ERCOT calculates the mean (µ) and standard deviation (ơ) of the historical CDF, which follows a
normal distribution.37 The conservative measure would be to shift the mean of the CDF
37 ERCOT. “Methodology for Implementing Operating Reserve Demand Curve (ORDC) to Calculate Real‐Time Reserve
Price Adder”, January 1, 2017, available at: http://www.ercot.com/content/wcm/key_documents_lists/89286/Methodology_for_Implementing_ORDC_to_Calculate_Real‐Time_Reserve_Price_Adder.zip

FTI Consulting, Inc. PRIORITIES FOR THE EVOLUTION OF AN ENERGY‐ONLY ELECTRICITY MARKET DESIGN IN ERCOT
Copyright © FTI Consulting, Inc., 2017 SYSTEM‐WIDE PRICE FORMATION ISSUES 40
function by up to one standard deviation using a scaling value between 0 and 1 (0<s<1). This
shift would flow directly into the estimated LOLP, as the LOLP is equal to 1‐CDF.
The arguments for changing any of these three components of the ORDC, drawn within the
framework of the basic design, leave room for judgment about the best approximation of the
number of steps in the ORDC, or in the VOLL, used to describe the costs of emergency actions
at each step, or a proper adjustment of the LOLP. However, there does not appear to be
evidence of a fundamental flaw in the choices made in the original design of the ORDC, and the
small average ORDC contribution partly reflects the forces influencing electricity supply and
demand described throughout this paper.
An underlying issue remains that the recent availability of capacity has been such that the total
scarcity revenues have been low. In short, ample capacity exists in ERCOT partly as a result of
renewable subsidies and the underlying economics have produced low average scarcity prices
including ORDC price adders. The Commission should recognize that this does not arise from a
fundamental flaw in the original design of the ORDC. The ORDC is given certain inputs and it
should be expected to produce a consistent set of outputs. An issue suppressing scarcity
pricing in ERCOT is that some inputs to the ORDC are distorted by external factors. If the
Commission chooses to configure the ORDC to consider the effects of these other factors
described in this report, then it would seem natural and consistent with the rest of the design
to focus on possible shifts of the LOLP to reflect the increased risk of reserve scarcity.
Reserve Estimates and Out‐of‐Market Commitments
Application of the ORDC depends on decisions about the measurement methodology for
available operating reserves and their translation into an appropriate scarcity price. For
example, consider the treatment of Reliability Must Run (RMR) and RUC capacity. The stated
motivation for employing such units arises from concerns about reliability. The conditions
leading to the activation of RMR or RUC units ‐‐ generally transmission congestion ‐‐ may differ
from the conditions giving rise to a general shortage of operating reserves, but all available
capacity nevertheless affects the calculation of the price adder under the ORDC methodology.
If an out‐of‐market unit is committed by ERCOT, it is by construction selected because the
natural market choice, as operationalized in ERCOT’s commitment and dispatch models, would
not have the unit available or online. However, the ORDC was designed based on economic
principles to support market decisions and valuations. Including this non‐market capacity in the
ORDC determination of a market price distorts the underlying logic of scarcity pricing. There
are at least two dimensions to the resulting price distortion in the ERCOT market. First, the
scarcity price will be underestimated through the ORDC. Second, the incremental costs of the
out‐of‐market capacity employed but seldom dispatched might be greater, even much greater,
than the avoided costs of a reliability event, as estimated by ERCOT’s VOLL. The second

FTI Consulting, Inc. PRIORITIES FOR THE EVOLUTION OF AN ENERGY‐ONLY ELECTRICITY MARKET DESIGN IN ERCOT
Copyright © FTI Consulting, Inc., 2017 SYSTEM‐WIDE PRICE FORMATION ISSUES 41
problem reiterates questions that have been voiced in ERCOT about the cost‐benefit
justification for committing out‐of‐market capacity. This is a question going beyond the present
focus on the issue of the interaction between the commitment of the out‐of‐market capacity
and scarcity price formation under the ORDC. It entails improvement of the unit commitment
and dispatch models themselves, rather than just an improvement to pricing, but it should be
duly noted.38
With regard to the problem of the underestimation of the scarcity price, a natural approach to
addressing the reliability capacity that the system operator commits or pays for outside the
normal energy‐only locational energy prices would be to decrease the operating reserves by the
amount of the out‐of‐market commitments. This would be equivalent to decreasing the Real‐
Time Online Reserves by the amount of the capacity made available by the out‐of‐market
action including capacity above the low sustainable limit.39 For purposes of calculating the
ORDC scarcity price, this rule change would restore the integrity of the calculation of Real‐Time
Online Capacity when there is an out‐of‐market commitment. A similar argument might apply
to formal demand response programs where the system operator pays separately for the
demand response commitment, or other capacity deployments currently included in the
methodology for the Reliability Deployment Price Adder. For all of these out‐of‐market actions,
the same logic used for estimation of the Reliability Deployment Price Adder would suggest
decreasing the calculation of Real‐Time On‐Line Reserve Capacity by the quantity of capacity
committed and available to be deployed.
Add Marginal Cost of Losses to Dispatch and Pricing
When power is injected into the grid by suppliers, whether fossil fuel, renewable, or an
alternative power source, not all of the power reaches consumers. Some of the power is lost
during transmission because the movement of electrons produces heat in the transmission
lines. To complicate matters, the amount of power lost in moving energy over a transmission
line depends on physical properties of the line such as resistance, reactance, voltage levels,
loading of the line, and ambient temperature. The losses incurred in transmitting power from a
specific supply location to serve a specific customer depends on the many ways the power
moves over different transmission lines from supply source to load sink.40 Supply sources that
are located at different points on the grid will incur different levels of losses in serving an
38 A later section contains a brief discussion of the need to examine the level of transmission constraint penalty factors
(shadow prices) as a step in lessening the gap between the cost of out‐of‐market actions and the avoided cost of loss of load events.
39 An equivalent approach would be to increase the “X” factor by the amount of the out‐of‐market capacity. 40 Hogan, William, “Networks for Electric Power Transmission: Technical Reference,” February 1992; available at:
https://www.hks.harvard.edu/fs/whogan/acnetref.pdf.

FTI Consulting, Inc. PRIORITIES FOR THE EVOLUTION OF AN ENERGY‐ONLY ELECTRICITY MARKET DESIGN IN ERCOT
Copyright © FTI Consulting, Inc., 2017 SYSTEM‐WIDE PRICE FORMATION ISSUES 42
increment of load at a specified location. In order to compare the incremental and total losses
of different supply and load configurations, a standard measure called a “penalty factor,” or its
mathematical equivalent, a “marginal‐loss factor”,41 quantifies the marginal losses incurred in
serving an increment of load at a reference bus from different locations. The marginal‐loss
factor is not a constant for the system as a whole or for any location. In particular, it increases
with increasing transmission system flows, so that the marginal losses incurred in serving an
increment of system load are always larger than the average losses. To a first approximation,
losses increase in proportion to the square of power flows. It is standard practice in all of the
ISOs regulated by the Federal Energy Regulatory Commission to take marginal losses into
account in both the least cost economic dispatch and locational pricing.42
By dispatching generation to meet load at least cost, including the cost of losses, system
operators eliminate a material source of inefficiency and have achieved substantial cost
savings. In a 2007 report, PJM estimated savings of $100 million per year through energy and
congestion costs, and of over 3,600 MW during peak hours as a result of including marginal
losses in dispatch and pricing.43 The Federal Energy Regulatory Commission (FERC) explained
the savings clearly in an Order supporting the implementation of marginal‐loss pricing in the
CAISO:
For example, if the marginal losses to deliver energy from a remote generator to a customer at another location are 10 percent, then in order to deliver 1 MWh to the customer, the remote generator must produce 10 percent more, or 1.1 MWh of energy. If the remote generator’s marginal cost to produce 1 MWh is $50, then the marginal cost of delivering 1 MWh of energy to the customer is $55 (i.e., the marginal cost of producing 1.1 MWh). Suppose that the customer could be served with energy either from the remote generator or from a local generator whose losses would be de minimus and whose marginal production cost is $53/MWh. If the buyer fails to consider, and is not required to pay for, losses, the remote generator would appear to be cheaper, since its marginal production cost (of $50/MWh) would be lower than the $53/MWh marginal production cost of the nearby generator. However, when marginal losses are
41 The incremental or marginal‐loss factor for a bus is the change in system losses due to a change in generation at the
bus. A loss penalty factor is used to modify the incremental cost of each supplier so as to include the effects of losses. The penalty factor is the inverse of 1 minus the marginal‐loss factor.
42 “The locational marginal‐loss provision is consistent with similar tariff provisions in other RTO tariffs and with the efficiency goals that underpinned the Commission’s approval of those provisions, including the Midwest ISO, the NYISO, and ISO‐NE.” FERC, “Order on Complaint Requiring Compliance with Existing Tariff Provisions and Related Filings,” May 1, 2006, paragraph 22, available at: https://www.ferc.gov/CalendarFiles/20060501180437‐EL06‐55‐000.pdf. For a recent review of marginal‐loss pricing in the FERC jurisdictional ISOs, see Eldridge, O’Neill and Castillo, “Marginal Loss Calculations for the DCOPF,” January 24, 2017, available at: https://www.ferc.gov/legal/staff‐reports/2017/marginallosscalculations.pdf.
43 PJM, “Marginal Losses Implementation Training,” Winter and Spring 2007, Version 1, p. 10.

FTI Consulting, Inc. PRIORITIES FOR THE EVOLUTION OF AN ENERGY‐ONLY ELECTRICITY MARKET DESIGN IN ERCOT
Copyright © FTI Consulting, Inc., 2017 SYSTEM‐WIDE PRICE FORMATION ISSUES 43
considered, the nearby generator would be the more efficient source. That is because the marginal cost of delivering energy to the customer from the nearby generator would be about the same as the marginal production cost of $53/MWh (since losses would be de minimus), while the full marginal cost to deliver energy from the remote generator would be higher, i.e., $55/MWh. Thus, in determining what supply sources can most efficiently serve customers, the cost of marginal losses should be considered. Failure to consider marginal losses – or to understate marginal loss costs – can inefficiently inflate the total cost of serving load.44
Dispatching in order to minimize the cost of meeting load, including transmission system losses,
is accompanied by locational pricing that reflects the differences in marginal losses for different
supply sources. When incremental supply from a generator decreases losses in serving load, the
generation is more valuable, and its locational price will increase in proportion to the loss
penalty factor (which will be greater than one). Conversely, supply that results in an increase in
system losses will look relatively less attractive in the dispatch; the generation will have a lower
locational price and will be dispatched to a lesser extent than if marginal losses were not taken
into account. With marginal‐loss pricing, the locational price at each location reflects not only
the marginal impact on congestion from an increment of load at the bus, but also the marginal
impact on system‐wide losses.
Billing on the basis of marginal costs ensures that each customer pays the proper marginal cost price for the power it is purchasing. It therefore complements and reinforces PJM’s use of LMP to price electricity.45
The PJM experience illustrates the relative importance of marginal losses. As shown in Figure
13, marginal losses in total are comparable in importance to congestion costs.
44 FERC, “Order On Further Development of The California ISO’s Market Redesign and Establishing Hearing Procedures,” June 17, 2004, paragraphs 142 and 143, available at: https://www.ferc.gov/whats‐new/comm‐meet/061704/E‐2.pdf. 45May 1, 2006 Order, paragraph 4, available at: https://elibrary.ferc.gov/idmws/common/opennat.asp?fileID=11016260.

FTI Consulti
Copyright ©
ERCOT c
sources i
each loc
constrain
model.46
will be in
Instead o
socialized
uses to
Qualified
46 ERC
ng, Inc.
© FTI Consulting,
currently do
n operating
cation on th
ned dispatch
The dispatc
ncurred in se
of charging p
d to all load
allocate bo
d Scheduling
COT Nodal Proto
PRIORITIE
, Inc., 2017
oes not take
its security
he grid incl
h of genera
ch does not
erving load fr
prices that r
. Section 13
oth transmis
g Entities (Q
ocols, Section 13
ES FOR THE EVOL
F
e into acco
constrained
udes an es
ation to ser
account for
rom one sup
reflect margi
3 of the ERC
ssion and d
QSEs), who a
3.1.1, Septembe
LUTION OF AN E
Figure 13
unt the ma
d economic d
stimate of l
rve load plu
r differences
pply source v
inal losses, t
OT Nodal Pr
distribution
are respons
r 1, 2016.
ENERGY‐ONLY EL
SYSTEM
arginal‐loss
dispatch. In
osses and
us losses us
s in the cost
versus anoth
the actual co
rotocols exp
level losses
ible for pro
LECTRICITY MAR
M‐WIDE PRICE FO
factors for
ERCOT, the
ERCOT perf
sing a lossl
t of the mar
her.
ost of losses
plains the pr
s to the lo
ocuring addi
RKET DESIGN IN
ORMATION ISSU
different su
load foreca
forms a sec
ess transmi
rginal losses
s is averaged
rocedures E
ad obligatio
tional suppl
ERCOT
UES 44
upply
st for
curity
ission
s that
d and
RCOT
on of
ly for

FTI Consulting, Inc. PRIORITIES FOR THE EVOLUTION OF AN ENERGY‐ONLY ELECTRICITY MARKET DESIGN IN ERCOT
Copyright © FTI Consulting, Inc., 2017 SYSTEM‐WIDE PRICE FORMATION ISSUES 45
their loads to cover the allocation of losses.47 The QSE obligation to self‐supply losses or
purchase energy to cover them is included in the ERCOT settlements for loads.
The lack of marginal‐loss pricing is a significant matter in ERCOT, where setting prices to
accurately reflect locational differences is central to the energy‐only market design. Marginal‐
loss pricing reform will have a beneficial impact and ensure that the cost‐causation principle is
better expressed to resources to provide more efficient retirement decisions and more efficient
siting of future generation.
Using another way to illustrate the significance of this missing market design element, Figure 14
summarizes the marginal‐loss component of prices for each of the New York Independent
System Operator (NYISO) zones in a high load interval and a low load interval. In both periods,
the marginal‐loss component results in a significant difference in the locational price for
suppliers that are located remotely from load versus those located closer to load. In the high
load interval, for example, the loss component leads to a difference of $4.63 per MWh ($3.3 +
$1.33) in the locational price paid to a supplier in Zone J (New York City), versus Zone D
(North).48 In the low load interval, this price difference falls, to $2.48 per MWh, but is a
substantial 15.2% of the reference bus price. Figure 15 shows the location of these load zones
in New York State.
The implications of marginal‐loss pricing for Texas should be clear where CREZ enables
renewable power from the northwest to serve load in other regions of the state. If the
marginal‐loss components of prices were of the same order of magnitude as those observed in
the NYISO, the locational prices in Houston could and should exceed those in the west by $2 to
$4 in every hour, even when transmission constraints are not active.
47 Id. 48 The impact of marginal losses is stated as a difference in the loss component of the price difference between two
locations, as this is invariant (although there is a second‐order effect) to the choice of the reference bus. The absolute value of the marginal‐loss component (and congestion component) at a bus will change with a change in the reference bus, because the reference bus price, penalty factors and shift factors all change.

FTI Consulti
Copyright ©
ng, Inc.
© FTI Consulting,
PRIORITIE
, Inc., 2017
ES FOR THE EVOL
F
LUTION OF AN E
Figure 14
ENERGY‐ONLY EL
SYSTEM
LECTRICITY MAR
M‐WIDE PRICE FO
RKET DESIGN IN
ORMATION ISSU
ERCOT
UES 46

FTI Consulti
Copyright ©
Transmis
a fraction
from the
importan
importan
generatio
pricing is
in the ex
ng, Inc.
© FTI Consulting,
ssion conges
n of the tota
e simple fac
nt for improv
nt as transm
on in specif
s straightforw
perience of
PRIORITIE
, Inc., 2017
stion costs c
al hours of t
ct that they
ving the disp
mission cong
ic locations.
ward, and th
other region
ES FOR THE EVOL
F
an be quite
the year. By
are relevan
patch, but th
gestion in pr
. The logic
he evidence
ns.
LUTION OF AN E
Figure 15
volatile, bu
y contrast, t
nt in every
he marginal‐
roviding effi
for includin
of its critica
ENERGY‐ONLY EL
SYSTEM
t the large p
the importan
hour of the
‐loss incenti
cient incent
ng marginal‐
al importanc
LECTRICITY MAR
M‐WIDE PRICE FO
price impact
nce of marg
e dispatch.
ives add up
tives for ret
‐loss effects
e to price fo
RKET DESIGN IN
ORMATION ISSU
ts happen in
ginal losses a
This is not
to make the
taining and
s in dispatch
ormation is f
ERCOT
UES 47
n only
arises
only
em as
siting
h and
found
FTI Consulting, Inc. PRIORITIES FOR THE EVOLUTION OF AN ENERGY‐ONLY ELECTRICITY MARKET DESIGN IN ERCOT
Copyright © FTI Consulting, Inc., 2017 LOCAL PRICE FORMATION ISSUES 48
Local Price Formation Issues
In addition to the policy impacts discussed in other sections – the renewable energy PTC and
ITC, lack of marginal losses, and state‐mandated demand response and energy efficiency
programs ‐‐ price formation in ERCOT also is affected by interactions between the energy
market and actions taken by the system operator to maintain local reliability. The focus in this
section will be on the locational price formation impacts of RUCs, although recent ERCOT
initiatives regarding RMR units, and the ex‐ante curtailment of exports on DC lines illustrate the
potential for RUC‐type pricing issues to arise in other instances in which ERCOT takes out‐of‐
market actions related to local reliability.
The interaction between ERCOT’s out‐of‐market actions and local market power mitigation
rules has become visible in the search for answers to the question of why some generation
units are experiencing low energy‐only returns, and why the ORDC has remained consistently
low over the last year, despite the need for the same units to provide for system reliability, as
evidenced by ERCOT starting them through the RUC process. The answer appears to lie in a gap
in the market rules: the current ORDC mechanism compensates suppliers when there is only an
RTO‐wide scarcity of operating reserves, and the mechanisms in ERCOT for pricing and
compensating suppliers for local scarcity are limited, which is generally the trigger for a RUC. In
fact, under the current market rules, the opposite occurs, as the combination of RUC and local
market power mitigation rules reduce prices, in contravention of the outcome logically
expected in an energy‐only market with scarcity pricing, when ERCOT brings units on‐line to
manage constraints. There is clear inconsistency between the objectives of the energy‐only
market, to employ prices to maintain reliability, and the use of out‐of‐merit actions rather than
prices to resolve local reliability problems. The increasing frequency of RUCs, like the recent
discussion of the possible need for RMR units, is a signal of reliability issues that are not being
adequately reflected in real‐time prices.
Following a review of the issues leading to a lack of local scarcity pricing in ERCOT, this section
describes the following priorities for improvement:
• Out‐of‐Market Actions to Manage Transmission Constraints: Local scarcity pricing and
mitigation rules require changes to properly set prices when there are reliability unit
commitments or other ERCOT reliability actions to manage transmission constraints; these
changes should not disable rules for local market power mitigation.
• Dispatch and Pricing for Local Reserve Scarcity: The introduction of local reserve requirements, implemented through co‐optimization, would provide a market solution to
properly set prices when there are constraints on reserve availability in a sub‐region.

FTI Consulting, Inc. PRIORITIES FOR THE EVOLUTION OF AN ENERGY‐ONLY ELECTRICITY MARKET DESIGN IN ERCOT
Copyright © FTI Consulting, Inc., 2017 LOCAL PRICE FORMATION ISSUES 49
LACK OF SCARCITY PRICING WITH RELIABILITY UNIT COMMITMENT
A RUC is an out‐of‐market action taken by ERCOT when it determines that the set of units that
are on‐line and operating in the market, or that can be brought on‐line, are not sufficient to
meet its operational reliability criteria. ERCOT assesses the reliability of its unit commitment
following the completion of the day‐ahead market, and thereafter hourly up to the time of the
real‐time dispatch; it is of no significance to this evaluation whether units are self‐committed or
committed in the day‐ahead market, because the need for a RUC is based only on the forecast
of the physical operating status of the system, load, and other variables at the time of real‐time
dispatch. If ERCOT’s software determines that the power flow will not otherwise meet its
reliability criteria, it produces a set of recommended resource commitments. ERCOT operators
review these recommendations and decide whether or not to execute them, and may also
manually select resources to commit through a RUC, introducing transparency concerns.49
The number of days on which RUC commitments occurred increased from 70 in 2015 to 269 in
2016, while the number of hours in which resources responded to RUC instructions from ERCOT
increased from 411 in 2015 to 1,514 in 2016.50 This recent increase in out‐of‐market RUC
commitments is a cause for concern, as it indicates that energy‐only market mechanisms are
increasingly insufficient, on their own, to maintain system reliability. Over the last year, most
RUCs occurred to address shortages of generating capacity in a specific location in the event of
an n‐1 contingency. They occurred with regularity when there were scheduled transmission
outages north of Houston or scheduled or unplanned equipment outages potentially causing
overloads in the area of the Rio Grande Valley. Approximately 98% of the RUC‐hours addressed
transmission congestion, primarily in the North and Houston zones, while only 33 hours arose
to address capacity shortages. No RUC commitments occurred because of ancillary service
shortage, voltage or reactive support, system inertia, anticipation of extreme cold weather or
startup failures, according to ERCOT.51 Although ERCOT reports the reliability condition giving
rise to a RUC,52 there can be a lack of clear association between the reported cause and the
49 ERCOT, “Overview of the Reliability Unit Commitment Process,” October 14, 2016, available at:
http://www.ercot.com/content/wcm/key_documents_lists/87633/5_‐_Overview_of_the_RUC_Process_for_QMWG_‐_Final.pptx
50 ERCOT, “Annual TAC Review of the Market Impacts of Reliability Unit Commitments,” January 26, 2017, p. 11, available at: http://www.ercot.com/content/wcm/key_documents_lists/107846/14._2017_Annual_TAC_Review_of_the_Market_Impacts_of_RUCs_‐_Final.pptx
51 Id. 52 ERCOT, “Annual TAC Review of the Market Impacts of Reliability Unit Commitments,” January 26, 2017, available at:
http://www.ercot.com/content/wcm/key_documents_lists/107846/14._2017_Annual_TAC_Review_of_the_Market_Impacts_of_RUCs_‐_Final.pptx

FTI Consulting, Inc. PRIORITIES FOR THE EVOLUTION OF AN ENERGY‐ONLY ELECTRICITY MARKET DESIGN IN ERCOT
Copyright © FTI Consulting, Inc., 2017 LOCAL PRICE FORMATION ISSUES 50
RUC action, giving rise to questions about whether RUC actions occur for additional reasons,
such as to protect against an n‐1 or n‐2 event.53
Following the logic that a RUC‐committed unit is not running voluntarily, but is rather running
because it is required for reliability, its energy market offer is set to the greater of the ERCOT
RUC offer floor of $1,500 per MWh or its submitted energy offer curve (if any).54 However,
during instances when a RUC alleviates local congestion, the $1,500 offer is often mitigated to a
lower price because the RUC unit fails ERCOT’s test of local market power. When this occurs,
the $1,500 per MWh default RUC offer is mitigated using an offer cap typically based on the
verifiable cost of the RUC‐committed resource plus a modest adder.55 As discussed below, while
this mitigation follows ERCOT protocols for managing the potential for the exercise of local
market power, it has the potential to extinguish the ability of the unit to earn a return for
scarcity.56
The introduction of a RUC‐committed unit’s minimum generation block into the generation
dispatch stack decreases locational prices through its impact on the congestion component of
prices. A RUC‐committed unit immediately comes on‐line and ramps to its lower sustainable
limit. If the RUC unit’s energy offers are not mitigated for local market power, they will remain
at $1,500 and the RUC‐committed unit will rarely be dispatched above its low sustainable limit
and its offer price of $1,500 will not set the locational price. The RUC‐committed unit is said to
be “pinned” at its low sustainable limit. It will rarely be dispatched to meet an increment of
load because of its $1,500 offer price, so its offer does not enter into locational price formation.
Instead, in the absence of local market power mitigation, the locational prices generally will be
based on the offer prices of one or more lesser priced supply (or dispatchable demand)
alternatives. These price‐setting units are often those that have been dispatched down to
accommodate the minimum load block of the RUC‐committed unit: their offer price for being
dispatched up (again) is marginal for price formation.
53 Nodal Protocols, 5.5.1 (5). “ERCOT shall analyze base configuration, select n‐1 contingencies and select n‐2
contingencies under the Operating Guides. The Operating Guides must also specify the criteria by which ERCOT may remove contingencies from the list. ERCOT shall post to the Market Information System (MIS) Secure Area the standard contingency list, including identification of changes from previous versions before being used in the Security Sequence. ERCOT shall evaluate the need for Resource‐specific deployments during Real‐Time operations for management of congestion consistent with the Operating Guides.”
54 Nodal Protocols, 6.5.7.3 (c).
55 ERCOT, “Nodal Protocols Section 4: Day‐Ahead Operations,” April 5, 2017, Section 4.4.9.4.1 (c); the mitigated offer is the greater of 10.5 MMbtu/MWH times the gas reference price, or the resource’s verifiable offer cost plus the verifiable variable O&M cost times a multiplier.
56 In situations of extreme scarcity, the price might rise to more than $1,500 per MWh, despite the mitigation of the offer price of a RUC‐committed unit.

FTI Consulting, Inc. PRIORITIES FOR THE EVOLUTION OF AN ENERGY‐ONLY ELECTRICITY MARKET DESIGN IN ERCOT
Copyright © FTI Consulting, Inc., 2017 LOCAL PRICE FORMATION ISSUES 51
A specific concern arises when a RUC commitment occurs to resolve a modest or relatively
short‐term transmission element overload. When this occurs, the dispatch of the RUC‐
committed unit will likely remain pinned to its low sustainable limit, because not all of its
minimum load block capacity is needed to resolve the constraint, and its incremental offer price
is set at the cap of $1,500. Pinning will occur throughout the minimum run time of the RUC‐
committed unit, even if the unit is needed to resolve a constraint for only a portion of this time.
RUC commitments can primarily to resolve modest transmission constraint violations because
ERCOT’s software assigns a very high penalty factor to the violation57 and the software will
search for any solution to relieve the constraint, even a generation unit with only a small shift
factor with respect to the constraint violation. Thus, the ERCOT market bears the cost of
committing a unit to provide a modest counterflow to resolve a situation with a low value of
lost load, and the price formation treatment of the RUC‐committed unit suppresses locational
prices through the addition of the minimum load capacity to the dispatch stack, combined in
many cases with mitigation of the offer prices of the RUC‐committed unit.58 ERCOT recently
lowered the RUC penalty factors following discussion with stakeholders but it remains to be
seen if the lower values will remedy the situation.59 The price adjustment to the ERCOT system
lambda for RUC minimum capacity through the Reliability Deployment Price Adder will not
compensate for the suppression of the congestion component of the local price.
If the RUC‐committed unit is dispatched above its low sustainable limit, in principle it could set
a locational price of $1,500 until it reaches its upper operating limit, but this will only happen in
the circumstance in which the energy offer costs of the unit are not mitigated for local market
power and the unit is dispatched above its low sustainable limit. In other words, the $1,500
price will be reached only when a RUC unit is so effective in resolving a constraint or when
region‐wide capacity is so scarce that it is dispatched above its low sustainable limit despite an
offer cost of $1,500, yet it passes ERCOT’s local market power test.
Thus, out‐of‐market RUC commitments, which may increasingly be occurring as a symptom of
low energy‐only prices, are unlikely to result in prices that signal the local scarcity issue
triggering the RUC. Rather, the RUCs, often in combination with market power mitigation,
suppress prices and perpetuate a cycle of reliance on out‐of‐market actions, rather than market
responses, to maintain local reliability.
57 ERCOT “ Maximum Shadow Prices in RUC: Initial Results,” January 30, 2017, available at:
http://www.ercot.com/content/wcm/key_documents_lists/113924/Analysis_of_RUC_max_shadow_prices_initial_results.pptx
58 See NPRR626 “Reliability Deployment Price Adder (formerly "ORDC Price Reversal Mitigation Enhancements")”.
59 ERCOT, “W‐A040617‐01 Changes to transmission constraint Shadow Price caps,” Operations Notice to ERCOT Market Participants, April 6, 2017.

FTI Consulting, Inc. PRIORITIES FOR THE EVOLUTION OF AN ENERGY‐ONLY ELECTRICITY MARKET DESIGN IN ERCOT
Copyright © FTI Consulting, Inc., 2017 LOCAL PRICE FORMATION ISSUES 52
Local Market Power Mitigation of RUC Units Ignores Local Scarcity Value
ERCOT conducts local market power mitigation through a process called the “Texas Two Step”
because it is based on two Security Constrained Economic Dispatch (SCED) runs. Prior to the
first run, ERCOT identifies competitive and non‐competitive constraints using its constraint
competitiveness test, which evaluates a market participant’s ability to exercise local market
power through economic or physical withholding. In the first step, SCED observes only the
limits of competitive constraints to calculate initial reference prices. In the second step, the
SCED process observes the limits of both competitive and non‐competitive constraints, and
mitigates offers to the greater of the reference prices produced in step one (adjusted by a
variable not to exceed 0.01 multiplied by the resource’s mitigated offer cap) or a resource’s
mitigated offer cap.60
Imposition of offer caps based on verifiable costs (plus a modest adder) for local market power
mitigation is inconsistent with compensating suppliers for the scarcity value of their output
during times when generation units are committed through the RUC process. RUC units have
been committed by ERCOT because they are needed, in the absence of alternative economic
offers, to prevent the power flow from violating a reliability constraint. From this perspective,
it is apparent that the RUC‐committed unit is providing a scarce resource and, in the absence of
a determination of local market power, the RUC energy offer is set to $1,500 as a
consequence.61 But, if the same unit is determined to have local market power, its offer is
reduced, as described above, to a price near its costs and it will set price whenever it is
dispatched up for incremental energy at this relatively low offer price.
The graphic in Figure 16 illustrates the impact of market power mitigation on the price and
dispatch of a Calpine generation unit for 17 hours during a time when it receives a RUC
instruction from ERCOT in order to relieve a transmission constraint into the Rio Grande Valley
area. The blue line on the figure is the real‐time settlement point price for the unit during each
interval, including the ORDC and Reliability Deployment Price Adder. The orange line is the
dispatch level of the unit and reflects high and low scheduling limits that vary depending on its
operating configuration (either 1x1 or 2x1).
The figure shows, first, that the settlement price for the unit during the period of its RUC is far
below the $1,500 per MWh offer price floor for a RUC unit. In about half of the intervals, the
60 ERCOT, “Nodal Protocols Section 6: Adjustment Period and Real‐Time Operations,” January 1, 2017, p. 58. The offer
caps of units subject to local market power mitigation are the lower of their verifiable costs or the product of a gas price index multiplied by a predetermined heat rate (10.5). ERCOT, “Nodal Protocols Section 4: Day‐Ahead Operations”, April 5, 2017, Section 4.4.9.4.1 (c).
61ERCOT, “Module 5: Reliability Unit Commitment,” p. 31, available at: http://www.ercot.com/content/wcm/training_courses/44/M5___Set301___RUC___Dec2014.pdf.

FTI Consulti
Copyright ©
settleme
until just
offer pric
limit; this
time as t
following
power a
intervals
offer pri
displacin
The situa
hours in
minimum
However
power m
ng, Inc.
© FTI Consulting,
ent price hov
t after 8:00
ce of the un
s can be see
the dispatch
g the first R
nd dispatch
when the u
ce, the incr
g other supp
ation shown
n 2016, ERC
m load level
r, in 127 of
mitigation an
PRIORITIE
, Inc., 2017
vers around
am on 2/28
it during the
en, for exam
h of the unit
RUC instruct
hed up in m
unit is dispa
remental en
pliers at an o
n in Figure 1
COT reporte
and, in princ
these hour
nd, as a resu
ES FOR THE EVOL
$27/MWh (
8). When th
e RUC perio
mple, in the f
t increases s
ion at 18:00
many interva
atched abov
nergy availa
offer price th
F
6 was repea
ed that the
ciple, could h
s, the offer
ult, the loca
LUTION OF AN E
starting just
he settlemen
d, the unit i
figure where
starting at 9
0 on 2/27, t
als at marke
ve its lower
able on the
hat is below
Figure 16
ated during
e committe
have been m
price of th
tional price
ENERGY‐ONLY EL
t before mid
nt point pric
is dispatched
e the settlem
9:15 on 2/28
the unit wa
et prices fa
scheduling
unit is ma
the $1,500
many hours
d resource
marginal for
he RUC reso
for the res
LECTRICITY MAR
LOCAL PRICE FO
dnight on 2/2
ce rises abo
d above its
ment price r
8. In the per
as also mitig
r below $1,
limit based
ade availabl
default offe
s in 2016. In
was dispa
purposes of
ource was su
ource was l
RKET DESIGN IN
ORMATION ISSU
27 and exten
ove the mitig
lower sched
rises at the
riod immedi
gated for m
,500. During
on its mitig
e to meet
er price.
n 170 of the
tched abov
f price forma
ubject to m
ess than its
ERCOT
UES 53
nding
gated
duling
same
iately
arket
g the
gated
load,
e RUC
ve its
ation.
arket
s RUC

FTI Consulting, Inc. PRIORITIES FOR THE EVOLUTION OF AN ENERGY‐ONLY ELECTRICITY MARKET DESIGN IN ERCOT
Copyright © FTI Consulting, Inc., 2017 LOCAL PRICE FORMATION ISSUES 54
offer floor although the unit was needed for reliability. In another 39 of these hours, the LMP
was less than the RUC offer floor even though the RUC resource was not mitigated for market
power.62
RUC‐committed capacity appears to be, in almost all instances, a substitute for transmission, as
it provides counterflow on a constraint to increase transmission capacity in the opposite
direction. However, when pinned at its low sustainable limit and/or with its offer costs reduced
because of market power mitigation rules, the RUC‐committed capacity is not paid a price
reflecting transmission scarcity or, stated a different way, the avoided cost of alternative
solutions to resolving the constraint. The scarcity value of the unit's output can be related to
the value of the counterflow provided on the constraint and it is doubtful that this counterflow
is worth no more than the mitigated offer cost of the unit. Thus, the requirement is for a
methodology to place a value on this counterflow, i.e., place a value on the relief of local
scarcity, despite the imposition of local market power mitigation.
For the RUC process, price formation in ERCOT fails to simultaneously address the objectives of
mitigating market power, which is necessary in an electricity market, and compensation of
suppliers for the scarcity value of their capacity and energy. The impact in an energy‐only
market is particularly compelling because recovery of fixed costs comes entirely from the
margin a supplier earns above its costs in the energy and reserve markets. Mitigation of a unit's
offer at exactly the time when it is addressing a situation of scarcity eliminates the price signal
required in the energy‐only market to sustain this and other units in operation so that they can
continue to address the same scarcity situation in the future.
Without examining the underlying efficiency of the procedures and software used for RUC,
changes to price formation must be considered to ameliorate the impact of RUC commitments
and local market power mitigation on pricing. The ERCOT market rules implemented by Nodal
Protocol Revision Request (NPRR) 626 intended to address the impact of the extra capacity of
RUC‐committed units on system energy prices, and the ORDC was implemented for scarcity
pricing, but neither of these tools assigns a value to the relief of local scarcity.
Reliability Deployment Price Adder (NPRR 626) Does Not Price Local Scarcity Value
The Reliability Deployment Price Adder implemented in August 2014 does not attribute local
scarcity value to capacity deployments occurring to relieve local reliability problems. The
Reliability Price Adder is intended to relieve the energy price suppression arising from out‐of‐
market actions the system operator may take to maintain reliability, including the deployment
62 ERCOT, “Annual TAC Review of the Market Impacts of Reliability Unit Commitments,” January 26, 2017, p. 7, available
at:
http://www.ercot.com/content/wcm/key_documents_lists/107846/14._2017_Annual_TAC_Review_of_the_Market
Impacts_of_RUCs_‐_Final.pptx

FTI Consulting, Inc. PRIORITIES FOR THE EVOLUTION OF AN ENERGY‐ONLY ELECTRICITY MARKET DESIGN IN ERCOT
Copyright © FTI Consulting, Inc., 2017 LOCAL PRICE FORMATION ISSUES 55
of Emergency Response Service, RMR committed units, RUC‐committed units, and load
resources other than controllable loads.63 The implementation of this adder, however,
estimates only the impact of these reliability deployments on the level of the ERCOT system‐
wide price (i.e., system lambda), as measured by the change in the reference price component
of the LMP.64 It does not confer value to reliability actions causing changes in relative locational
prices within ERCOT, as measured by changes in the congestion components of LMPs in
different locations.65 A RUC commitment and other reliability deployments may decrease
prices in a local area, due to relieving a transmission constraint, for example, yet have little or
no effect on prices outside of this local area, so that the estimated change in the system
reference price will often be close to zero.
There are problems with the Reliability Deployment Price Adder even for the limited purpose of
estimating the region‐wide price effect, when the resource deployed for reliability is dispatched
based on its offer. When its offers are mitigated, a RUC‐committed unit may be dispatched
above its lower operating limit, because its mitigated offer leads it to displace the dispatch of
other higher‐price resources. However, the methodology for estimating the Reliability
Deployment Price Adder excludes only the capacity of the unit’s low sustainable limit, so that
the re‐estimation of prices and calculation of the adder does not take into account the full
quantity of energy dispatched from the RUC‐committed unit.66
ORDC Does Not Price the Scarcity Value of RUC Units
The current ORDC does not correctly price regional scarcity when there is a RUC and, by design,
it does not produce a price signal for local scarcity. The ORDC provides a principled basis for
pricing region‐wide scarcity, but when a RUC occurs (or an RMR), the measurement of the Real‐
Time On‐Line Reserve Capacity used to calculate the ORDC scarcity price is distorted by the
inclusion of the RUC capacity.67 The ORDC price adder should rise when there is increased
scarcity, but if a RUC reduces this scarcity by increasing the quantity of available reserves as
63 NPRR 626, “Reliability Deployment Price Adder,” August 12, 2014.
64 Nodal Protocols, April 1, 2017, Section 6.5.7.3.1 (2) (j). 65 Note that the methodology for calculating the Reliability Deployment Price Adder appears to depend on the definition
of the system reference bus. Depending on the location of the reference bus, the change in prices from a change in unit commitment could appear as a change in the reference bus price or a change in the congestion component at a bus. For example, if the reference bus were at the location of a deployed RUC unit, the reference price would change, not the congestion component, where as if the reference bus were in a different place, the change would likely be to the congestion component. This does not appear to be an issue in ERCOT because of the use of a distributed reference bus.
66 Nodal Protocols, April 1, 2017, Section 6.5.7.3.1 (2) (a).
67 The calculations of Real‐Time On‐Line Reserve Capacity and Real‐time Off‐Line Reserve Capacity are not reduced as a result of a RUC or RMR activation. ERCOT, “Methodology for Implementing Operating Reserve Demand Curve (ORDC) to Calculate Real‐Time Reserve Price Adder,” Version 1.3 accessed on April 6, 2017.

FTI Consulting, Inc. PRIORITIES FOR THE EVOLUTION OF AN ENERGY‐ONLY ELECTRICITY MARKET DESIGN IN ERCOT
Copyright © FTI Consulting, Inc., 2017 LOCAL PRICE FORMATION ISSUES 56
measured by Real‐Time On‐Line Reserve Capacity, the ORDC price adder will fall (or stay the
same), rather than rise. ERCOT supply will increase by the amount of the minimum load of the
RUC or RMR committed unit. Additionally, if the offer of the out‐of‐market committed unit is
mitigated because of the potential for local market power, the unit may be dispatched above its
minimum load level, further adding to supply and depressing prices. When ERCOT initiates a
RUC prior to the development of scarcity, it thus may forestall the development of a price signal
to induce market‐based solutions to such scarcity.
The current ORDC also does not price local scarcity in general. Therefore, if there is an
adequate supply of reserves region‐wide, but a shortage in a particular region, the ORDC will
remain low. When a RUC is triggered by a local transmission constraint and there are
concurrently sufficient reserves region‐wide, the ORDC by design will not produce a scarcity
price signal. This is almost always the case. In January 2017, ERCOT reported that 97.8% of the
RUCs in 2016 occurred to address transmission congestion, and only 2.2% for capacity
insufficiency.68 In these cases when the RUC occurred, the overall system was not short of
reserves, so the ORDC adder did not apply and there was no mechanism to ensure appropriate
pricing of local scarcity.
OTHER LOCAL RELIABILITY ACTIONS HAVE PRICE IMPACTS
Activation of Reliability Must‐Run Units
ERCOT activation of a generation unit contracted under an RMR agreement has the same
potential impact on price formation as a RUC, due in large part to the confounding effect of
local market power mitigation. When an RMR unit is activated to serve a reliability need, it
indicates the need for local scarcity pricing since the presence of an RMR unit signals a shortage
of supply in a particular region. Prices in the local area of an activated RMR unit should rise, not
fall. However, since RMR units address local problems, the units will often fail market power
screens. Given the local market power, ERCOT mitigates the offer price. The result is that the
increased out‐of‐market capacity produces lower, not higher, prices. This distortion to price
formation affects the dispatch and prices for all other units in the local area, not just the RMR
unit. If mitigated, offers for RMR units should reflect the penalty value of resolving the
constraint so as to not disturb the price signal.
RMR agreements occur when a generation unit announces its intention to exit the ERCOT
market, but ERCOT determines it must remain in service for a period of time because there is a
68 ERCOT, “Annual TAC Review of the Market Impacts of Reliability Unit Commitments,” January 26, 2017, available at:
http://www.ercot.com/content/wcm/key_documents_lists/107846/14._2017_Annual_TAC_Review_of_the_Market_Impacts_of_RUCs_‐_Final.pptx.

FTI Consulting, Inc. PRIORITIES FOR THE EVOLUTION OF AN ENERGY‐ONLY ELECTRICITY MARKET DESIGN IN ERCOT
Copyright © FTI Consulting, Inc., 2017 LOCAL PRICE FORMATION ISSUES 57
shortage of supply in the location of the unit to provide voltage support, stability, or
management of transmission constraints.69 The energy offers of RMR units are set at the
ERCOT system‐wide offer cap ($9,000/ MWh) because the units are activated when the system
operator has no other available market alternative to maintain reliability.70 Setting the RMR
offer price at the cap is also intended to insure that incremental dispatch of the RMR unit above
its lower scheduling limit does not displace the dispatch of other resources. As long as the RMR
unit remains at its low sustainable limit, other resources will determine the energy price
outcome, and ERCOT also estimates the Reliability Deployment Price Adder with the intention
of augmenting prices to offset the impact of the RMR unit’s minimum generation.71
However, mitigation of the offers of activated RMR units not only eliminates the scarcity pricing
intended by the default offer of $9,000/MWh, but it will also result in the RMR unit being
incrementally dispatched, displacing other suppliers, and setting a price equal to its mitigated
offer cost. The way that this price distortion occurs is identical to what has been described for
RUC‐committed units. When an RMR unit is activated it is deemed to be the only resource
available to solve a reliability constraint, so the expectation is that the offers of RMR units will
be mitigated for local market power.
Debate over the offer price for the recently terminated RMR agreement with NRG’s 371 MW
Greens Bayou Unit 5 exposed the potential impact of RMR agreements on ERCOT prices.
ERCOT determined that the Greens Bayou Unit 5 would be needed for the peak months of 2016
and 2017 to alleviate overloads on the Singleton to Zenith lines north of Houston until the
completion of the Houston Import Project in 2018.72 However, under the ERCOT market rules,
the ERCOT Independent Market Monitor estimated that the mitigated offer price of the unit at
69 Nodal Protocols, Section 3.14.1, April 5, 2017.
70 PUCT Substantive Rule §25.505. 71 The Reliability Deployment Price Adder does not include a locational component, so does not value the suppressing
effect of the minimum load block on LMPs in the area local to the RMR unit.
72 ERCOT Nodal Protocols, Section 22, Attachment B: Standard Form Reliability Must‐Run Agreement, April 1, 2015, available at: http://www.ercot.com/content/wcm/lists/89476/Reliability_Must_Run_Agreement___NRG_Texas_Power_LLC_and_ERCOT___Effective_Date_06_01_2016__Fully_Executed___003_.pdf”) and http://www.ercot.com/content/wcm/lists/89476/2016_Constraints_and_Needs_Report.pdf. The ERCOT Board had the option to extend the program through June 2018, which it did on June 14, 2016, before subsequently terminating the agreement effective May 29, 2017. See http://www.ercot.com/services/comm/mkt_notices/archives/1219. Under the agreement, ERCOT paid NRG a standby payment of $3,185 per hour to be available. See http://lists.ercot.com/scripts/wa‐ercot.exe?A3=ind1606&L=NOTICE_CONTRACTS&E=quoted‐printable&P=7446. ERCOTT completed RMR studies in the fall of 2016 and determined that Greens Bayou Unit 5 would be needed to support transmission system reliability until the Colorado Bend II Generating Station begins operation. With a change in the expected operational date for the Colorado Bend II Station to June 2017 from July 2017, the RMR agreement with Greens Bayou Unit 5 is no longer needed for the peak months of 2017. See http://www.ercot.com/news/releases/show/120278.
FTI Consulting, Inc. PRIORITIES FOR THE EVOLUTION OF AN ENERGY‐ONLY ELECTRICITY MARKET DESIGN IN ERCOT
Copyright © FTI Consulting, Inc., 2017 LOCAL PRICE FORMATION ISSUES 58
the time was “likely to be roughly $50 per MWh.”73 The Independent Market Monitor
supported the concern that, at this price, the RMR unit could be incrementally dispatched and
set price in advance of other sources of supply.74
RMR contracts signal a problem with energy‐only pricing. By suppressing prices and shifting
costs out of the market (through the per hour availability payment), they perpetuate a cycle in
which reliability problems are addressed by transmission solutions or more RMR contracts or
RUCs because there is inadequate price incentive for solutions proffered by private market
investors.
In addition to providing a local scarcity price signal that is not extinguished by market power
mitigation, there is a need to ensure RMR contracts are not invoked unnecessarily because of
the assumptions used to evaluate the necessity for the contracts. For example, prior to the
passage of NPRR 788 in October 2016, the market rules directed ERCOT to use “the regional
Load value provided by the appropriate Transmission Service Provider (TSP) as part of the
annual Steady State Working Group (SSWG) study case development process” as the
assumption for load in the local RMR area.75 The SSWG load forecasts are for six years in the
future,76 which is well beyond the maximum two‐year time horizon for consideration of an RMR
solution to a reliability issue. NPRR 788 addressed this bias toward RMR solutions by applying
more appropriate operational reliability criteria to the RMR evaluation and requiring the use of
load forecasts from the current regional transmission plan.77
When prices are suppressed, as a result of mitigation of the offer price of an activated RMR
unit, they do not reflect the scarcity value of capacity in the locality of the unit. The prices are
inconsistent with the foundational objective of the ERCOT market to formulate energy prices to
support necessary investments in existing and new resources. Moreover, the presence of an
RMR unit, even when not activated, will tend to suppress prices, as day‐ahead prices and
forward contracts will be discounted based on assessments of and uncertainty about the
73 Garza, Beth, “NPRR Comments,” NPRR 784, Mitigated Offer Caps for RMR Units, June 15, 2016, available at:
http://www.ercot.com/content/wcm/key_documents_lists/98406/784NPRR_03_IMM_Comments_061516.doc
74 Both the IMM and NRG support NPRR 784, which would have required ERCOT to “set the Mitigated Offer Cap curve
equal to the highest value (in $/MWh, not exceeding SWCAP) that is expected to allow SCED to Dispatch the RMR Unit.” (see NPRR 784, June 1 2016). For Greens Bayou, these estimates were as high as $700/MWh. Beth Garza, “NPRR Comments,” NPRR 784, July 26, 2016.
75 Nodal Protocols, Section 3.14.1.
76 ERCOT, “Steady State Working Group Procedure Manual,” February 3, 2016, available at: http://www.ercot.com/content/wcm/key_documents_lists/27292/SSWG_Procedure_Manual.Approved_by_ROS_20160203.docx.
77 “Board Report,” NPRR 788, RMR Study Modifications, October 11, 2016. NPRR 788 also sets requirements for the minimal required shift factor of an RMR unit on a violated constraint, the minimal constraint violation required for an RMR agreement, and assumptions on generation in‐service in the power flow analysis.

FTI Consulting, Inc. PRIORITIES FOR THE EVOLUTION OF AN ENERGY‐ONLY ELECTRICITY MARKET DESIGN IN ERCOT
Copyright © FTI Consulting, Inc., 2017 LOCAL PRICE FORMATION ISSUES 59
probability of activation and the corresponding impact of RMR offer mitigation and minimum
generation output on local scarcity price formation.
Curtailment of Exports on DC Lines Based on E‐Tags
ERCOT’s recent, but temporary, change to its operating rule for curtailing export schedules to
Mexico is a specific example of the continuing need to assess the potential for reliability rules to
subvert the energy‐only price signals required to encourage market‐based investment, as
opposed to reliance on non‐market interventions like RMR and RUCs occurring in part because
of the insufficiency of energy‐only prices.78
On September 28, 2016, ERCOT changed its operating procedures regarding requests to
schedule exports at its DC ties with CFE in Mexico.79 Prior to this procedure change, ERCOT
accepted e‐tag schedules for the DC ties up to the physical limit of the relevant tie, even if the
total schedule on the tie exceeded ERCOT’s posted limit. Schedules on the tie were treated on
par with ERCOT load in the dispatch, and only curtailed prior to ERCOT load in the event of
system emergencies.80
After the procedure change, new e‐tag requests were denied as soon as the sum of previously
accepted e‐tags reached the posted export limit, which does not necessarily bear any
relationship to actual physical capability for power transfers in real‐time. By prospectively
denying export e‐tags, and forestalling exports that would have been efficient at market prices,
ERCOT avoided the possible need to declare an emergency and report the event to the North
American Electric Reliability Corporation (NERC).
ERCOT’s operating rule change was inconsistent with price formation in an energy‐only market
because it prescribed prospective actions undercutting the very price formation that would
solve the reliability issues that might occur as export load rises. ERCOT would not necessarily
have been approaching a situation of scarcity when it invoked the procedure change, as the
rule was based on contract path scheduling limits, rather than based on an estimate of the real‐
time power flow. Such a reliability action preempts a market response by lowering price in
advance of a potential scarcity event, rather than allowing the price to rise, reducing the
incentive for supply and demand to respond. As the price rises, imports could increase, for
example, to offset the scheduled exports.
78 “Nodal Protocol Revision Request,” NPRR 818, Allow Curtailment of DC Tie Load Prior to Declaring Emergency
Conditions, February 2, 2017. Approved April 4, 2016, See http://www.ercot.com/mktrules/issues/NPRR818.
79 Power Operations Bulletin #755.
80 See Nodal Protocol 4.4.4: “DC Tie Load is considered as Load for daily and hourly reliability studies, and settled as Adjusted metered Load (AML)”. Nodal Protocol 6.5.9.3.4 addresses Energy Emergency Alerts.

FTI Consulting, Inc. PRIORITIES FOR THE EVOLUTION OF AN ENERGY‐ONLY ELECTRICITY MARKET DESIGN IN ERCOT
Copyright © FTI Consulting, Inc., 2017 LOCAL PRICE FORMATION ISSUES 60
Actions Prior to or During Energy Emergency Alert
According to Nodal Protocols 6.5.9.3.1 and 6.5.9.4.1, ERCOT may take a number of actions, such
as starting RMR units, committing additional units, or directing resources to operate at their
emergency base points, to maintain reliability when it identifies levels of Physical Responsive
Capacity falling below Advisory, Watch and Energy Emergency Alert levels. These actions shift
the supply and demand balance and can result in reduced energy prices as well as the reduction
of the ORDC scarcity price adder.
In the current ORDC design, Real‐Time Online Capacity of 2,000 MW defines the level at which
the value of reserves rises to the value of lost load. However, ERCOT may take out‐of‐market
actions when it reaches a Physical Responsive Capacity of 2,300 MW (at which point it is in
Energy Emergency Alert Step #1) and, because the elements of the Physical Responsive
Capacity calculation do not align with the calculation of Real‐Time Online Capacity, this will
likely occur well before the Real‐Time Online Capacity falls to 2,000 MW.81 Because of the
inconsistency between the ORDC parameters and ERCOT operating procedures based on
Physical Responsive Capacity, ERCOT can use out‐of‐market actions to resolve reliability issues
prior to the energy‐only price rising substantially through the ORDC adder in order to incent
market responses.
ERCOT’s operating procedures appear to be inconsistent with the ORDC market design because
they can diminish the price‐based incentive for suppliers to respond to tight system conditions.
As the ERCOT market fails to provide a scarcity price signal, suppliers will find that it is not
profitable to remain in operation or to be available when needed for reliability, and when this
supply is not available, ERCOT will find it increasingly necessary to take out‐of‐market actions,
which will further reduce prices, leading to further exit of the resources required for reliability,
and yet further out‐of‐market intervention.
If the simple structure of the ORDC continues, with the single value for “X”, then out‐of‐market
actions should accompany adjustments in the reserve values in the same way as recommended
for the treatment of RUC commitments.
IMPROVEMENTS TO PRICE FORMATION FOR LOCAL SCARCITY
From the perspective of market design, there are three approaches to addressing price
distortion occurring when RUCs or other out‐of‐market actions occur to maintain local
reliability:
81 When an Advisory is issued for PRC below 3,000 MW and ERCOT expects system conditions to deteriorate to the extent
that an EEA Level 2 or 3 results, ERCOT can instruct the TSPs to reconfigure the transmission system to increase the allowed output of generation units; these actions can have a substantial impact on price formation/signals.

FTI Consulting, Inc. PRIORITIES FOR THE EVOLUTION OF AN ENERGY‐ONLY ELECTRICITY MARKET DESIGN IN ERCOT
Copyright © FTI Consulting, Inc., 2017 LOCAL PRICE FORMATION ISSUES 61
• Enhance price formation rules to price local scarcity occurring when RUCs and other out‐of‐
market actions are used to manage transmission constraints;
• Enhance price formation rules to price local scarcity occurring when RUCs and other out‐of‐
market actions (i.e. RMR) are taken to manage the impact of transmission constraints on the
local deliverability of reserves during contingencies;
• Change market and operational rules to limit conditions for the system operator employing
out‐of‐market mechanisms to address reliability constraints.
Market rule changes to enhance local scarcity price formation are preferred because they will
encourage market responses to maintain reliability as an alternative to RUCs and other out‐of‐
market actions. Market rules limiting RUCs are unlikely to be effective unless market pricing
aligns with and compensates these alternative market responses to maintain reliability.
Additionally, changes to system operator reporting, requiring improved documentation of the
reliability constraint triggering the out‐of‐market action, and how the action (such as a RUC)
relieves the constraint (and possibly, reporting the cost of the constraint relief) would be
helpful in tempering overly‐conservative out‐of‐market operator actions and in identifying
opportunities for changes to market rules to maintain reliability while avoiding out‐of‐market
actions, like RUCs.
Scarcity Pricing for Out‐of‐Market Commitments for Transmission Constraints
The normal transmission constraints used in evaluating the security of an economic dispatch
solution apply, by construct, to steady‐state power flows that in principle could continue
indefinitely. When the normal flows are not known with certainty ex‐ante, as must occur in
forward planning and commitment, contingency analysis may identify conditions where RUC or
even RMR commitments are necessary to maintain reliability in contingencies. When such a
RUC or RMR commitment is made, suppression of local prices can occur, as discussed above,
because the minimum load dispatch from these units depresses the locational energy prices
and ORDC price adders, and local market power mitigation can additionally depress prices
when the units are dispatched above minimum levels and their mitigated offer enters into price
formation.
Several enhancements to ERCOT price formation should be promptly considered and could be
implemented relatively quickly to reduce the effects on both local and system‐wide scarcity
prices when out‐of‐market actions occur to relieve transmission constraints. The
recommendations here apply to situations when out‐of‐market operator actions are taken
because there is uneconomic scarcity of transmission, not scarcity of region‐wide or local
reserves. The recommendations will be explained here for the case of a RUC, for simplicity,
with acknowledgment that the details of the market rule changes might differ depending on
the particular out‐of‐market action case.

FTI Consulting, Inc. PRIORITIES FOR THE EVOLUTION OF AN ENERGY‐ONLY ELECTRICITY MARKET DESIGN IN ERCOT
Copyright © FTI Consulting, Inc., 2017 LOCAL PRICE FORMATION ISSUES 62
First, the full capacity of the RUC‐committed unit should be removed from the Real‐Time Online
Capacity used in the calculation of the ORDC adder. The full capacity of the unit is available to
provide energy or reserves but was not the result of market commitment; hence, the full
capacity should be removed from the Real‐Time Online Capacity to leave the system‐wide
market‐clearing price of scarcity unchanged following the RUC, as calculated by the ORDC.
Second, under the typical situation in which a RUC unit is committed to deal with normal
transmission constraints active in the base case power flow or monitored contingencies (i.e. n‐
1), price formation needs to assign a scarcity value for the relief of the constraint(s) triggering
the RUC. This requires reducing the transmission capacity of the constraints relieved by the
RUC by the amount of the “but‐for” counterflow created by the minimum operating level of the
RUC unit. It is this counterflow that the system operator has chosen to purchase as a substitute
for being able to otherwise increase the capacity of the active transmission constraint(s). In
principle, the subtraction of the counterflow would occur for every possible affected
transmission constraint, since the system operator, in principle, evaluates the full impact of all
of the RUC unit counterflow on system reliability and cost in the decision to commit the RUC
unit. In practice, it might be sufficient to decrease the limit on only the constraint driving the
needed RUC commitment; this decrease would be made in only the base case power flow or
the contingency in which the constraint would potentially be violated.
Third, the mitigated offer cap of the RUC‐committed unit should reflect that it has been
committed out‐of‐market in a scarcity situation. The usual logic for mitigation for local
constraints is turned on its head when a unit being mitigated has been committed out‐of‐
market for reliability and not as part of normal market operation based on bids and offers.
A simple way to address the mitigation of RUC offers in ERCOT would be to assign a value for
the RUC unit’s mitigated offer cap higher than its verifiable cost‐based approach. The mitigated
offer cap for a RUC unit should be increased to reflect the unit’s value in relieving the reliability
constraint but not be set so high as to reflect the exercise of local market power. An alternative
approach for market power mitigation for a RUC‐committed unit that may be considered in
ERCOT would be a must‐offer requirement with an offer cap for its minimum load level in the
day‐ahead market. Then, if the unit is not committed day ahead, it would establish that there
has been no day‐ahead physical or economic withholding, because the day‐ahead model
identified a cheaper commitment to serve load excluding the capped offer of the possible RUC
unit. Once this is done, and a unit is not committed in the normal day‐ahead market process, a
subsequent RUC decision changes the fundamental condition for determining appropriate
mitigated offers; mitigated offers for RUCs logically should be different than those applied to
units that have not been RUC‐committed because the unit is required to run for reliability. For
dispatch above the minimum level, the unmitigated offer curve would provide a proxy for
measuring the scarcity value that would be reflected in locational prices, since dispatch above
the minimum load level is presumably not required for reliability and any incremental dispatch

FTI Consulting, Inc. PRIORITIES FOR THE EVOLUTION OF AN ENERGY‐ONLY ELECTRICITY MARKET DESIGN IN ERCOT
Copyright © FTI Consulting, Inc., 2017 LOCAL PRICE FORMATION ISSUES 63
would be evaluated in comparison with competing offers, but this would depend on the
circumstances of the case.
Mitigated offers for reliability commitments should have some workable proxy for scarcity, and
the usual local market power mitigation is inappropriate. A middle ground methodology must
be determined for calculating the mitigated offer cap for a RUC unit committed for local
reliability, so that market prices reflect the value of the unit’s output in managing transmission
scarcity, but also do not allow the exercise of market power.
The scarcity pricing recommendations here apply to out‐of‐market commitments arising in the
management of “normal” transmission constraints, where the distinguishing characteristic is
that these constraints should be enforced in the normal dispatch but can be violated for short
periods of time to use reserve generation outside of the constrained area to meet short‐term
deviations in the net‐load forecast.
By contrast, any transmission constraints that must be managed both for normal power flows
and utilization of reserves give rise to locational requirements for reserves and the
corresponding locational operating reserve demand curves. Recommendations for this second
type of local scarcity pricing follow.
Locational Scarcity Prices through Local Operating Reserve Demand Curves
Local reserve requirements, implemented day ahead and in real‐time through co‐optimization,
would enable ERCOT to be better positioned to avoid committing additional units for reliability
within the day. Implementation of real‐time co‐optimization of energy and reserves using the
current ORDC, on its own, could enable ERCOT to better insure that a sufficient level of system‐
wide reserves is available in real‐time.82 However, pricing of local scarcity will require the
introduction of local reserve requirements for defined zones, as well as a corresponding
definition of constraints on the import and export of energy and reserves between load zones.
82 Potomac Economics, Ltd., “2015 State of the Market Report for the ERCOT Wholesale Electricity Markets,” June 2016,
p. 47, available at: https://www.potomaceconomics.com/wp‐content/uploads/2017/01/2015‐ERCOT‐State‐of‐the‐Market‐Report.pdf. “The primary reason that SASMs were infrequent was the dearth of ancillary service offers typically available throughout the operating day, limiting the opportunity to replace ancillary service deficiencies via a market mechanism. Without sufficient ancillary service offers available, ERCOT must resort to using reliability unit commitment (RUC) procedures to bring additional capacity online.” “Real‐time co‐optimization of energy and ancillary services does not require resources to estimate opportunity costs, would eliminate the need for the SASM mechanism, and allow ancillary services to be continually shifted to the most efficient provider. Because co‐optimization allows the real‐time market far more flexibility to procure energy and ancillary services from online resources, it would also reduce ERCOT’s need to use RUC procedures to acquire ancillary services. Its biggest benefit would be to effectively handle situations where entities that had day‐ahead ancillary service awards were unable to fulfill that commitment, e.g. due to a generator forced outage. Thus, implementation of real‐time co‐optimization would provide benefits across the market.”

FTI Consulting, Inc. PRIORITIES FOR THE EVOLUTION OF AN ENERGY‐ONLY ELECTRICITY MARKET DESIGN IN ERCOT
Copyright © FTI Consulting, Inc., 2017 LOCAL PRICE FORMATION ISSUES 64
Implementation of the ORDC applied a system‐wide perspective on the need for operating
capacity (ERCOT Staff & Hogan, 2013). The value of operating reserves arises from the ability to
respond quickly to make up for unexpected changes in demand or the availability of capacity.
The reserves provide reliable support to balance load over a relatively short period, which could
be longer than a single dispatch interval, but would not need to be sustained over a time frame
longer than needed to rearrange the normal economic dispatch.
This timing is important in the market design. The standard formulation of the economic
dispatch problem assumes an equilibrium condition with system‐wide balance and meshed
system power flows that are subject to transmission constraints over longer durations,
including steady‐state conditions. These transmission constraints give rise to power congestion
problems and the associated congestion costs that create locational differences in efficient
energy prices. The transmission constraints can have different limits for different durations,
but the essence is that the transmission constraints interact with the flows in the
interconnected grid and give rise to the locational congestion costs.
For a system‐wide ORDC, as in ERCOT, an assumption is that any actual dispatch from the
reserves would be over such a short interval that the longer duration dispatch transmission
constraints would not apply. In other words, the possible use of the generation reserves would
not be limited by the normal transmission constraints. Therefore, generation at any location
could provide operating reserves on the same basis as any other location. Hence, there would
be no congestion costs for reserves and no locational price for operating reserve capacity
scarcity.
The simplifying assumption of no local reserve constraints for the ORDC in the original design
could be revisited. Electricity systems can give rise to locational reliability concerns where
generation and operating reserves have different locational effects over the interval covered in
response to unexpected changes in load or generation. Under these circumstances the local
reliability requirements would translate into different reserve requirements and different
locational prices. Hence, in other systems such as MISO, NYISO, PJM, and ISO‐NE, there are
locational operating reserve requirements, in addition to the aggregate requirements for the
system as a whole.83
The locational reserve constraints are not as complex as the full equilibrium power flow limits in
meshed systems. But locational constraints can create differences in locational power prices. A
common model of the underlying power flows governing the operating reserve requirement is
to assume that there is a local region (“operating reserve zone”), as conceptually illustrated in
Figure 17. Within the zone there are now two sources of operating reserves. Some of the
83 For example, see NYISO Ancillary Service Manual, Version 4.8 December 13, 2016, pp. 6‐22‐6‐24.

FTI Consulti
Copyright ©
reserves
from out
local zon
zone.
The clos
between
with the
regular d
reserves.
price diff
power.
This loca
constrain
balance
interactin
single re
(Hogan,
ng, Inc.
© FTI Consulting,
can be prov
tside is limit
ne. The bal
ed interface
the steady
dispatch o
dispatch, the
. This inter
ferential, tha
ational mod
ned zone, a
of the syst
ng compone
egional ORD
2010). Furt
PRIORITIE
, Inc., 2017
vided from lo
ed by a clos
ance of the
e between
‐state dispa
f the opera
e less capab
raction crea
at would app
el for opera
closed inter
tem. With
ents, each w
DC, but the
thermore, th
ES FOR THE EVOL
ocations out
sed interface
e operating
F
the zone a
tch of powe
ting reserve
bility there
tes a locati
pear both in
ating reserv
rface limit fo
one such
ith its own s
details allo
he same pri
LUTION OF AN E
tside the zon
e that define
reserves wo
Figure 17
nd the rest
er and the p
es. The mo
is to rely o
onal scarcit
the price fo
ves then ha
or power flo
local operat
scarcity price
w for a mo
inciples app
ENERGY‐ONLY EL
ne, but the a
es the maxim
ould be prov
t of the sys
possible em
ore power f
n the rest o
y condition,
or reserves a
s three com
ows into the
ting zone, t
e. The princ
odel of the
ply to having
LECTRICITY MAR
LOCAL PRICE FO
amount that
mum flow o
vided by so
stem create
mergency pow
lowing into
of the syste
, and theref
and in the lo
mponents: a
e zone, and
there would
ciples are the
interaction
g multiple o
RKET DESIGN IN
ORMATION ISSU
t can be prov
of power int
ources within
es an intera
wer flow de
the zone in
em for oper
fore a locat
cational pric
an ORDC fo
an ORDC fo
d now be t
e same as fo
of these p
operating res
ERCOT
UES 65
vided
o the
n the
action
ealing
n the
rating
tional
ce for
r the
or the
three
or the
prices
serve

FTI Consulting, Inc. PRIORITIES FOR THE EVOLUTION OF AN ENERGY‐ONLY ELECTRICITY MARKET DESIGN IN ERCOT
Copyright © FTI Consulting, Inc., 2017 LOCAL PRICE FORMATION ISSUES 66
zones, each with its own reserve demand and interface constraint. The key incremental
requirement beyond system‐wide ORDC would be to identify the locations comprising each
constrained zone and to perform calculations to estimate the size of the zonal interface
constraint.84 The Appendix includes a further discussion of the modeling approach, including an
example of how to construct the interacting ORDC components and include them in the co‐
optimization with the energy dispatch.
Figure 18
Figure 18 provides an example of the scarcity calculations for a locational ORDC. In the
example, there are separate reserve demand curves for Zone 1 and for the Rest of the System
because because a closed interface limit constrains the import of reserves to Zone 1 from the
Rest of the System. For simplicity, we set the “X” values at zero. The available interface
capacity is 45.9 MW, meaning that at most 45.9 MW of reserves scheduled in the Rest of the
System are available for use in Zone 1. Inside Zone 1, the ORDC incorporates a probability
distribution for the change in net load, which in the illustration has a mean of 45.9 and a
84 See the Capacity Emergency Transfer Limit (CETL) in PJM Manual 14B, Revision 36, November 17, 2016, pp. 63‐68.
Locational ORDC
Rest of System
Rest of System Reserve Demand Curve
$0
$500
$1,000
$1,500
$2,000
$2,500
$3,000
$3,500
$4,000
0 200 400 600 800 1000 1200
Capacity (MW)
Pri
ce (
$/M
Wh
)
160
$2892
Zone 1Constrained Zonal Reserve Demand Curve
$0
$1,000
$2,000
$3,000
$4,000
$5,000
$6,000
$7,000
0 100 200 300 400 500 600 700 800 900
Reserves (MW)
Pri
ce (
$/M
Wh
)
68
$5,323
Closed Interface LimitInterface Capacity Demand Curve
$0
$500
$1,000
$1,500
$2,000
$2,500
$3,000
$3,500
0 100 200 300 400 500 600
Capacity (MW)
Pri
ce (
$/M
Wh
)
45.9
$2,500
$2,432
ROS Zone 1Expected Total (MW) 107.10 45.90Std Dev (MW) 488.99 209.57VOLL ($/MWh) 7000 10000
ROS Zone 1 InterfaceBenchmark (MW) 160.65 68.85 45.90Price ($/MWh) $2,892 $5,323 $2,431

FTI Consulting, Inc. PRIORITIES FOR THE EVOLUTION OF AN ENERGY‐ONLY ELECTRICITY MARKET DESIGN IN ERCOT
Copyright © FTI Consulting, Inc., 2017 LOCAL PRICE FORMATION ISSUES 67
standard deviation of 209 MW, and the VOLL for Zone 1, which is assumed to be
$10,000/MWh. Outside the constrained zone, for the Rest of the System, the mean and
standard deviation of net‐load change are 107 and 489 MW, respectively, and the assumed
VOLL is $7,000/MWh. In the co‐optimized security constrained dispatch given the bids and
offers for energy and reserves inside and outside of Zone 1, there are 161 MW of reserves
scheduled outside of the constrained zone, and 68 MW of reserves scheduled inside of the
constrained zone, and the import of reserves into Zone 1 is at the interface capacity limit of
45.9 MW. The co‐optimized dispatch including both regional and local ORDC curves and the
associated definitions of closed interface limits defining local reserve zones, as described in the
Appendix, produces scarcity prices of $2,892/MWh outside the constrained zone, $5,323/MWh
inside the constrained zone, and $2,432/MWh for the incremental transfer capacity. These
prices correspond to schedules of 160.65 MW of reserves in the Rest of the System, and 68.85
in Zone 1.
Application of a locational operating reserve requirement in ERCOT arises as an important
market feature whenever there is a material locational reliability requirement. For example,
existence of an RMR unit at a particular location must arise because of a locational reliability
requirement. Similarly, local market power mitigation through offer caps suggests a locational
reliability requirement that could accompany such mitigation and provide the necessary
locational scarcity pricing through the local ORDC.
By improving price formation during periods of local scarcity, locational scarcity pricing would
help to reduce the frequency of out‐of‐market interventions to maintain reliability, such as RUC
commitments. Increased locational prices provide a market incentive for units to be available,
where and when needed, to respond based on their offers to ERCOT dispatch instructions.
Additionally, improved real‐time scarcity pricing will likely increase the incentive for resources
to participate in the day‐ahead market, relative to the situation today where units committed in
the day‐ahead market consistently face the possibility of receiving a make‐whole payment and
earning no margin above their costs. The alternative of self‐commitment is even worse, as a
self‐committed unit does not receive the guarantee of a make‐whole payment in the event that
energy prices are lower than expected or turn negative. Because of the low prices today, there
is an incentive for the owners of some units to elect not to offer into the day‐ahead market
and, instead, decide whether or not to self‐commit subsequent to receiving a RUC instruction.
This optionality, which is allowed by the market rules, is a rational response to low prices and
could be a reason for the increased frequency of RUCs during the current period of low energy
prices.
Locational Scarcity Pricing with Transmission Constraint Penalty Functions
In addition to improvements to price formation, ERCOT should consider changes to its rules and
software for commitment and dispatch to reduce the commitment of RUC units and other out‐

FTI Consulting, Inc. PRIORITIES FOR THE EVOLUTION OF AN ENERGY‐ONLY ELECTRICITY MARKET DESIGN IN ERCOT
Copyright © FTI Consulting, Inc., 2017 LOCAL PRICE FORMATION ISSUES 68
of‐market reliability actions, and thereby avoid inefficient price suppression and the dampening
of market incentives. As mentioned above, ERCOT recently decreased the penalty factors (i.e.
shadow price caps) modeled in the RUC engine, but they are still static and relatively high.85
An additional change to be considered in the near term would be to modify SCED transmission
constraint penalty values to enable brief excursions of transmission flows into emergency levels
during normal operation in order to avoid the higher cost of an additional unit commitment.
This type of software change should be relatively straightforward. These default penalty factors
could be modified to levels more reflective of the estimated cost of the probability of lost load
if the constraint is violated. Going further, the transmission constraint could be represented as
a penalty curve function, where the cost of the violation is an increasing function of the
magnitude or duration of the excursion.86
85 ERCOT, “W‐A040617‐01 Changes to transmission constraint Shadow Price caps,” Operations Notice to ERCOT Market
Participants, April 6, 2017. See MISO transmission demand curve values at https://www.misoenergy.org/_layouts/MISO/ECM/Download.aspx?ID=168921
86 MISO transmission demand curves (i.e., penalty functions) depend on the voltage level of the transmission element and the percentage violation. Ibid.

FTI Consulting, Inc. PRIORITIES FOR THE EVOLUTION OF AN ENERGY‐ONLY ELECTRICITY MARKET DESIGN IN ERCOT
Copyright © FTI Consulting, Inc., 2017 SOCIALIZED TRANSMISSION PLANNING AND COST RECOVERY DISTORT PRICES 69
Socialized Transmission Planning and Cost Recovery Issues
Like the renewable energy policies discussed in a prior section, transmission planning and cost‐
recovery policies affect the ERCOT energy‐only market, but are implemented through
regulatory and legislative processes external to the energy market design. Importantly, this
second set of policies is internal to Texas, so potentially more amenable to modification to
improve consistency with the market‐driven philosophy of ERCOT’s electricity spot market
design. Like renewable energy policies, ERCOT’s policies for transmission planning and cost
recovery entail subsidization of investments or allocations of fixed costs that directly affect the
balance of supply and demand in the energy‐only market. In essence, the supply functions and
demand functions determining energy‐only prices are shifting because of these out‐of‐market
decisions and cost allocations, rather than because of the decisions of energy market
participants acting in response to the energy‐only market prices.
Following a review of transmission planning and transmission cost recovery in ERCOT, this
section describes the following priorities for improvement:
• Transmission Planning: Market‐reflective policies for transmission investment should be
considered as a replacement for Texas’ socialized transmission planning, which, by building
new transmission in advance of scarcity developing, fails to provide the opportunity for
markets to respond.
• Transmission Cost Recovery: Alternatives for transmission cost recovery to replace or
reduce dependence on the summer peak demand‐based mechanism for the allocation of
sunk transmission costs would reduce distortion of energy market pricing.
TRANSMISSION PLANNING PROCESS INCONSISTENT WITH ENERGY MARKET OBJECTIVES
Assessment of transmission planning protocols in the U.S. reveals a heavy emphasis on setting
transmission system investment to ensure systems meet reliability requirements. These
analyses typically look forward five to ten years and analyze the high voltage transmission
system that will be needed in the future to meet reliability standards. Because transmission
infrastructure additions commonly require lengthy development timelines that often can reach
ten years or more, the result of these assessments has been significant investment in
transmission infrastructure in some parts of the U.S. to accommodate demand growth and new
generation additions. At the same time, there is consideration of transmission system
investment that can reduce congestion and/or facilitate the accommodation of policy driven
resource additions like renewables. Because the majority of the transmission system
investments identified through these planning processes are funded through non‐bypassable

FTI Consulting, Inc. PRIORITIES FOR THE EVOLUTION OF AN ENERGY‐ONLY ELECTRICITY MARKET DESIGN IN ERCOT
Copyright © FTI Consulting, Inc., 2017 SOCIALIZED TRANSMISSION PLANNING AND COST RECOVERY DISTORT PRICES 70
tariffs, there is little opportunity for competitive generation additions that may directly
compete with transmission system infrastructure additions.87
The implementation of ERCOT’s transmission planning process institutionalizes a preference for
identifying transmission system solutions to expected reliability problems and accommodating
Texas public policy objectives (such as the CREZ transmission system additions). ERCOT’s
annual regional transmission planning process results in the regular addition of high voltage
(“bulk”) transmission system infrastructure to address potential electric system reliability
violations and system congestion. The ERCOT Planning Guide outlines the regional planning
process undertaken by ERCOT each year to develop a Regional Transmission Plan (RTP)88 in
association with the Regional Planning Group and Transmission Service Providers.89 The RTP
“addresses regional and ERCOT‐wide reliability and economic transmission needs and the
planned improvements to meet those needs for the upcoming six years starting with the
[Steady State Working Group] SSWG base cases.”90
Under PUCT rules, ERCOT’s role is to conduct transmission planning assessments focused on
ensuring reliability and minimizing congestion.91 The RTP process does not explicitly investigate
the trade‐off between resolving future problems using generation resources as opposed to
transmission resources. In particular, when specifying the modeling inputs to the RTP, ERCOT
limits the addition of proposed generation in its planning models to those generation resources
that have practically already committed to construction.92 Because generation resources that
are permitted and have made financial commitments are usually within a couple years of
commencing actual operations, the RTP analysis forward‐looking time horizon of six years
87 As transmission planning has evolved in the U.S. in response to FERC requirements to plan regionally and accommodate
transmission proposals driven by public policy requirements there are often opportunities for merchant transmission developers to pursue projects that will qualify for cost‐of‐service ratemaking. However, there are few examples of merchant transmission development beyond multi‐purpose DC lines that interconnect different electric systems providing the opportunity to arbitrage energy and capacity price differences between regions.
88 ERCOT Planning Guide, Section 3: Regional Planning, January 1, 2017, available at: http://www.ercot.com/mktrules/guides/planning/current. ERCOT bulk transmission system planning is conducted in compliance with the Public Utility Commission of Texas, Chapter 25, Substantive Rules Applicable to Electric Service Providers, §25.361(d), Electric Reliability Council of Texas (ERCOT), http://www.puc.texas.gov/agency/rulesnlaws/subrules/electric/25.361/25.361.pdf.
89 ERCOT also develops biannually a Long‐Term System Assessment which seeks to determine if there may be a more cost‐effective system upgrade than may be identified when only examining 6 years forward under the RTP.
90 ERCOT Planning Guide, Section 3.
91 See, for example, ERCOT Transmission Planning Assessments, Assessing near‐term transmission system needs, December 2016, available at: http://www.ercot.com/content/wcm/lists/114740/CNRTP‐Dec2016‐FINAL.pdf
92 ERCOT Planning Guide, Section 6: Data/Modeling, January 1, 2017, at 6.9, available at: http://www.ercot.com/mktrules/guides/planning/current. ERCOT requires that a proposed generation resource have in hand key environmental permits as appropriate and demonstrate a commitment to finance and commence construction of electric interconnection facilities.
FTI Consulting, Inc. PRIORITIES FOR THE EVOLUTION OF AN ENERGY‐ONLY ELECTRICITY MARKET DESIGN IN ERCOT
Copyright © FTI Consulting, Inc., 2017 SOCIALIZED TRANSMISSION PLANNING AND COST RECOVERY DISTORT PRICES 71
ignores generation resources that could be available in years three to six of the forward‐looking
RTP analysis. Absent explicit consideration of generation and market‐based resources as an
alternative to transmission resources, the RTP process will virtually guarantee that transmission
system investments will preempt and prevent market solutions from resolving expected future
problems.
Ironically, ERCOT recently used an RMR agreement to maintain system reliability in a region
that would otherwise be supply constrained in the absence of the RMR agreement. The
imposition of an RMR agreement allowed time to develop a transmission system upgrade that
could be readily implemented, as opposed to accommodating an evaluation of the economic
trade‐off between generation and transmission solutions that might eliminate the need for the
RMR agreement.93 At the 2016 ERCOT Board of Directors Meeting, Independent Market
Monitor David Patton described the damage Texas’s transmission planning process, as
implemented by ERCOT, inflicts on the energy‐only market: “So you're going to be talking in a
minute about an RMR contract in Houston, and that should concern you…You can either just
keep building transmission and building transmission to make sure you never have areas like
that, but in the case of Houston now you have an RMR contract with a generator that's
premised I think largely on this sort of need, and the reality is that transmission is not always
the cheapest answer. In fact, it's often not the cheapest answer.”94 In contrast, in some regions
of the U.S. generation resources are evaluated as potential solutions to system reliability
problems in explicit recognition of the impact of new transmission on investment and returns in
electricity markets. As discussed previously, the NYISO’s reliability planning process provides
for consideration of different proposals to resolve a projected reliability issue.95
The implication is that the ERCOT transmission planning process preempts generation
investment in response to the energy‐only market price signal, undermining a key feature of
the energy‐only market design. Planning and building new transmission based on a six year
look‐ahead effectively excludes non‐transmission solutions (generation and other possible
actions that may resolve a reliability problem) that might be implemented more quickly, and at
lower cost to consumers, to address reliability issues in the future. By identifying and
implementing transmission solutions over a six year period, ERCOT’s planning process
93 See, for example, Public Utility Commission of Texas, Project No. 46369, Rulemaking Related to Reliability Must‐Run
Service, “Texas Industrial Energy Consumers’ Reply Comments on Commission Staff’s Strawman”,” pp. 8‐10 arguing transmission additions are the only possible response that ERCOT can facilitate to alleviate a localized reliability issue.
94 Patton, David, Potomac Economics, June 14
,
2016 ERCOT Board of Directors Meeting.
95 NYISO, “Reliability Planning Process Manual,” April 2016, Version 2.3 at Section 5. Available at: http://www.nyiso.com/public/webdocs/markets_operations/documents/Manuals_and_Guides/Manuals/Planning/rpp_mnl.pdf.

FTI Consulting, Inc. PRIORITIES FOR THE EVOLUTION OF AN ENERGY‐ONLY ELECTRICITY MARKET DESIGN IN ERCOT
Copyright © FTI Consulting, Inc., 2017 SOCIALIZED TRANSMISSION PLANNING AND COST RECOVERY DISTORT PRICES 72
suppresses locational price signals before they occur, preventing more efficient non‐
transmission solutions to system congestion or reliability issues. Unlike the original intent of
electricity market reform in ERCOT, which was to move some or all of the cost risk for system
reliability away from load, the effect of transmission planning under the current rules is to
substitute regulated infrastructure payments by load for market‐based investments in
transmission alternatives. Recalling the process of deregulation in Texas through SB‐7, the
incongruity of this outcome appears in statements at the time: “[T]he law also has shifted the
burden of risk for building new power plants to investors from consumers.”96
ERCOT’s transmission planning process is inconsistent with the energy‐only pricing paradigm.
The challenges faced by privately‐funded generation investors when confronting centrally
planned transmission, for which the costs are socialized through non‐bypassable charges rather
than borne by the beneficiaries, has been well recognized. Notably, this discourse has occurred
in regions that include a capacity market to support, annually, the continued operation of
generation required for reliability. In ERCOT, operating without a capacity market, there is no
back‐up mechanism to supplement the impact of new transmission on the energy‐only revenue
of existing generation that may be required for reliability. The transmission planning process
suppresses the market price signal that is supposed to be the incentive for generators to
respond and build when and where needed in ERCOT.
96 Houston Chronicle, “Many call energy deregulation in Texas a failure,” quoting Senator Sibley, October 6, 2007, available at:
http://www.chron.com/business/article/Many‐call‐energy‐deregulation‐in‐Texas‐a‐failure‐1824046.php.

FTI Consulti
Copyright ©
As a case
the mult
western
observat
resource
Houston
The effec
and a de
outstand
an even
the locat
97 ERC
ng, Inc.
© FTI Consulting,
e in point, t
ti‐billion dol
Texas to t
ions of neg
s have loca
area of ERC
ct, therefore
crease in the
ding question
larger quest
tions where
COT, “2016 ERCO
PRIORITIE
, Inc., 2017
he transmis
lar CREZ pr
the eastern
gative price
ated. At th
OT, as show
e, was to sign
e value of ad
n of whethe
tion of whet
future gene
OT Report on Exi
ES FOR THE EVOL
SOCIALIZED T
Fi
sion plannin
rojects (see
load cente
es in ERCOT
e same tim
wn in Figure 6
nal an increa
dditional gen
er the benef
ther the con
ration invest
sting and Poten
LUTION OF AN E
TRANSMISSION
igure 1997
ng process i
Figure 19)
ers (see Fig
T’s western
me, it increa
6.
ase in the va
neration loc
fits from thi
nsequent ch
tment is nee
tial Electric Con
ENERGY‐ONLY EL
PLANNING AND
n ERCOT res
to increase
gure 20). Th
n region, w
sed the inc
alue of addit
ated in and
is large inve
hanges in en
eded for reli
straints and Nee
LECTRICITY MAR
D COST RECOVER
sulted in the
transmissio
he project
here the m
cidence of lo
tional genera
around Hou
estment exce
nergy price s
ability.
eds”,” Decembe
RKET DESIGN IN
RY DISTORT PRIC
e energizatio
on capacity
notably red
majority of
ow prices in
ation in the w
uston. There
eeds its cost
signals align
er 30, 2016, p. 4.
ERCOT
CES 73
on of
from
duced
wind
n the
west,
e is an
t and
with

FTI Consulti
Copyright ©
ng, Inc.
© FTI Consulting,
PRIORITIE
, Inc., 2017
ES FOR THE EVOL
SOCIALIZED T
F
LUTION OF AN E
TRANSMISSION
Figure 20
ENERGY‐ONLY EL
PLANNING AND
LECTRICITY MAR
D COST RECOVER
RKET DESIGN IN
RY DISTORT PRIC
ERCOT
CES 74

FTI Consulti
Copyright ©
FOUR CO
Transmis
with Texa
of CREZ
increase
These su
consume
98 ERC
99 In E
ng, Inc.
© FTI Consulting,
OINCIDENT P
ssion system
as’ CREZ tra
and non‐C
in ERCOT’s a
bstantial inc
ers. For exam
COT, “2016 ERCO
ERCOT Transmissbased on each Dand cooperativecompetitive servwho may bill ret
PRIORITIE
, Inc., 2017
PEAK (4CP) C
m investmen
nsmission sy
CREZ transm
annual trans
creases in th
mple, increa
OT Report on Exi
sion Service ProvDSP’s percentagee utilities. DSPs vice areas the trtail customers.
ES FOR THE EVOL
SOCIALIZED T
COST ALLOC
t in Texas e
ystem invest
mission infra
smission cos
F
he transmiss
ases to the t
sting and Poten
viders (TSPs) chae of 4CP for the pass through traransmission and
LUTION OF AN E
TRANSMISSION
CATION DIST
exceeded ten
tment alone
astructure d
st‐of‐service,
Figure 21
ion cost‐of‐s
transmission
tial Electric Con
arge Distributionprior year. DSPansmission syste distribution sys
ENERGY‐ONLY EL
PLANNING AND
TORTS PEAK
n billion dol
e exceeding $
developmen
, as shown in
service are u
n componen
straints and Nee
n Service ProvidePs include investem costs pursuastem costs are ch
LECTRICITY MAR
D COST RECOVER
PERIOD LOA
lars over th
$7 billion.98
nt is driving
n Figure 21.9
ultimately p
nts of Oncor
eds” December
ers (DSPs) for tror owned utilitieant to their retaiharged to Retail
RKET DESIGN IN
RY DISTORT PRIC
AD
he past five
The combin
g a pronou99
assed throu
r’s retail de
30, 2016, p. 4.
ansmission serves, municipal util tariff. In Electric Provide
ERCOT
CES 75
years
ation
unced
gh to
livery
vice ilities
ers

FTI Consulting, Inc. PRIORITIES FOR THE EVOLUTION OF AN ENERGY‐ONLY ELECTRICITY MARKET DESIGN IN ERCOT
Copyright © FTI Consulting, Inc., 2017 SOCIALIZED TRANSMISSION PLANNING AND COST RECOVERY DISTORT PRICES 76
tariff for distribution system customers have ranged from 72% to 147%, depending on
customer class, for the period March 2012 to March 2017.100
Transmission costs are sunk because, unlike variable costs, they do not change depending on
energy demand in an interval. A general principle of market design is to allocate sunk costs to
minimize impacts on real‐time markets, since allocating sunk costs based on real‐time supply or
demand can impact the efficiency of the real‐time market. ERCOT does not conform to this
principle; rather, the transmission costs charged to the largest customers are determined based
on their demand in four peak summer intervals using the Four Coincident Peak (4CP)
transmission cost allocation methodology.101 At the end of each year, the PUCT determines the
proportion of ERCOT system‐wide 4CP load attributable to each distribution service provider.102
A distribution service provider’s load during the interval in which the system‐wide peak occurs
for each of the months from June to September defines its share of the 4CP and its
corresponding allocation of the yearly ERCOT transmission cost‐of‐service. Distribution service
providers recover their annual allocation of transmission service costs through the delivery
service tariffs charged to their different classes of customers. Typically, residential and small
commercial customers’ delivery service tariffs have an energy based (per‐kWh) charge, while
large commercial and industrial customer delivery service tariffs have a demand‐based (per‐
kW) charge. The demand charge to large commercial and industrial customers with interval
meters is applied to the customer’s kW load during the identified 4CP intervals.103 ERCOT
reports that the customers who are billed based on their demand during the 4CP intervals
represent 44% of the electric load served by ERCOT.104
Inevitably, the 4CP transmission cost allocation rule operates as an outside‐the‐market effect
that suppresses peak and near‐peak energy scarcity prices. The pronounced increase in the
transmission cost‐of‐service shown in Figure 21, combined with the structure of the 4CP charge,
creates a powerful incentive for customers to take actions to reduce their portion of the
100 Oncor Electric Delivery Company LLC, “Tariff for Retail Delivery Service,” 6.1.1 Delivery System Charges, Applicable:
Entire Certified Service Area, Effective Date: March 1, 2017, Sheet 6.1, Page 3 of 4, Revision: Thirty‐Two. Note that for transmission system customers (not taking service at distribution voltage levels) the rate has increased 58% over the same time period.
101 There is an inconsistency between determining planning for new transmission needs based on non‐coincident peak loads (Steady State Working Group base case) and allocating the costs of these upgrades based on coincident peak load.
102 See, for example, Texas Public Utility Commission of Texas, Docket No. 45382, Commission Staff’s Application to Set 2016 Wholesale Transmission Service Charges for the Electric Reliability Council of Texas, Electric Reliability Council of Texas, Inc.'s Report on the 2015 "4CP" Coincident Peak Load in the ERCOT Region, December 1, 2015.
103 For example Oncor customer’s greater than 10kW are charged the 4CP rate provided that they have an Interval Demand Recorder (IDR) which records customer demand every fifteen minutes. http://www.ercot.com/content/wcm/key_documents_lists/41536/Joint_TDSP_s_4CP_Tariff_Language.docx.
104 ERCOT, “4CP Overview”, February 16, 2017, p. 1; percentage is based on ERCOT load on August. 3, 2011.

FTI Consulting, Inc. PRIORITIES FOR THE EVOLUTION OF AN ENERGY‐ONLY ELECTRICITY MARKET DESIGN IN ERCOT
Copyright © FTI Consulting, Inc., 2017 SOCIALIZED TRANSMISSION PLANNING AND COST RECOVERY DISTORT PRICES 77
transmission cost‐of‐service. Customers on a 4CP tariff have their monthly transmission charge
for the current year calculated based on their prior year’s observed 4CP demand. Thus, a
customer served under a 4CP tariff that can reduce its load during the actual ERCOT summer
monthly system peaks will realize substantial savings on its transmission charges in the
following year.
For example, assume an industrial customer has a peak demand of 10 MW and is capable of
interrupting its entire demand during each ERCOT peak demand interval during the months of
June, July, August, and September.105 Next, assume that this customer is in the Oncor service
territory and served with primary transmission service such that it faces a transmission charge
of $4.13 per 4CP kW‐month. If the customer were to reduce its 4CP demand to zero, the
customer would pay no transmission charge the following year. However, if the customer did
not reduce its demand it would be charged 10,000 kW (10 MW) * $4.13/4CP kW, or
$41,300/month, which totals $495,600 for the year.
It makes sense for large customers and municipal and cooperative utilities subject to 4CP
transmission charges to acquire analytical tools to forecast peak demand periods. Recent
ERCOT analyses confirm that as the transmission cost‐of‐service has increased, customers have
been demonstrating increased peak demand reduction coincident with ERCOT’s peak periods.
For example, ERCOT has recently estimated a pronounced increase in the magnitude of
municipal and cooperative utilities’ peak demand reduction over the past several years during
which transmission costs have increased.106 Increased transmission costs, combined with the
design of the 4CP charge, are reducing peak demand and putting downward pressure on ERCOT
energy market prices during peak demand periods.
The 4CP transmission charge raises an issue for energy‐only markets because the reduction in
demand during peak periods is not occurring in response to energy prices, but instead is in
response to avoiding an allocation of sunk transmission costs. The incremental cost faced by
4CP customers for additional power consumption during potential peak intervals is not equal to
the energy price paid to energy suppliers at the same location at the same time. During a
potential 4CP interval, a 4CP customer faces an incremental cost for an additional MW of
consumption equal to (approximately) ¼ of the 4CP transmission charge (since the customer’s
peak demand is averaged over four intervals), plus the locational price of energy.107 This price
for incremental consumption for 4CP customers during potential peak demand intervals is
105 This example is based on the now out‐of‐date example provided by ERCOT in its 4CP Overview, February 16, 2017, p. 4.
106 Raish, Carl L, Principal Load Profiling and Modeling, ERCOT Demand Side Working Group, “Analysis of NOIE Load Reductions Associated with 4‐CP Transmission Charges/Price Response in ERCOT,” June 17, 2016, at 12. http://www.ercot.com/content/wcm/key_documents_lists/27290/Demand_Response_Presentations.zip
107 There also is a feedback effect whereby a reduction in the 4CP load of all customers will increase the 4CP rate.

FTI Consulting, Inc. PRIORITIES FOR THE EVOLUTION OF AN ENERGY‐ONLY ELECTRICITY MARKET DESIGN IN ERCOT
Copyright © FTI Consulting, Inc., 2017 SOCIALIZED TRANSMISSION PLANNING AND COST RECOVERY DISTORT PRICES 78
orders of magnitude higher than the energy price paid to suppliers, creating an inconsistency
from the perspective of efficient energy‐only market design. The 4CP mechanism leads to
inefficient load reductions because the marginal cost of electricity supply will be lower than the
opportunity cost of load reductions.
With the 4CP transmission cost allocation, 44% of ERCOT load has an enormous out‐of‐market
incentive to reduce demand during exactly the peak intervals when prices would otherwise be
high or rising in an energy‐only market. In effect, there is a payment, in terms of avoided
transmission and distribution charge allocations in the following year, leading to a reduction in
peak demand and in energy prices. Importantly, there is no real reduction in transmission or
distribution costs. This is clearly demonstrated in Figure 21. The charges are just allocations of
sunk costs. Hence, real costs are incurred to reallocate sunk costs among market participants.
ERCOT has recently estimated the 4CP response during peak load hours of as high as 1,408
MW.108 Assuming this reduction were to occur at a time when the ORDC would otherwise be
included in the locational price; prices throughout ERCOT could be reduced by hundreds of
dollars per MWh.
Demand reductions resulting from the 4CP transmission cost‐recovery mechanism are not in
response to high system marginal costs, but instead are in response to the allocation of sunk
costs. On a net basis, there are no cost savings, only a reallocation of the costs to other
customers. In principle, the most perverse outcome would be to have everyone shifting costs
onto everyone else, so that on balance no customer avoids the transmission payment but every
customer incurs real expenses in the attempt.
IMPROVEMENTS TO TRANSMISSION PLANNING AND COST RECOVERY TO SUPPORT ENERGY‐
ONLY MARKET
An alternative approach to the PUCT and ERCOT’s current transmission planning and cost
allocation rules would be to modify the transmission planning, expansion and cost allocation
protocols to focus on a beneficiaries‐pay system. Such a system would enable and encourage
explicit consideration of all competing investments, including generation and storage, that are
substitutes for transmission in meeting system‐wide or local reliability objectives during future
time periods. As mentioned, the NYISO pro forma process could serve as a model for ERCOT.
The PUCT should be wary of the impact 4CP has on energy price formation. The Commission
could evaluate and ultimately adopt an alternate transmission cost allocation methodology that
is congruent with the energy‐only market. For example, efficient pricing for transmission cost
108 Raish Analysis at 10.
http://www.ercot.com/content/wcm/key_documents_lists/27290/Demand_Response_Presentations.zip

FTI Consulting, Inc. PRIORITIES FOR THE EVOLUTION OF AN ENERGY‐ONLY ELECTRICITY MARKET DESIGN IN ERCOT
Copyright © FTI Consulting, Inc., 2017 SOCIALIZED TRANSMISSION PLANNING AND COST RECOVERY DISTORT PRICES 79
recovery would follow the general outline of a two‐part tariff, with fixed and variable
components.
Typically for transmission infrastructure, the variable component ($/kWh) would be insufficient
to recover the full cost of the transmission investment. The fixed component would be used to
collect the balance of the requirement in a manner that provided the least distortion to peak
demand decisions. Although a perfect fixed and variable charge may not be achieved, it should
be possible to provide workable access charges that do not distort energy pricing because they
depend so directly on individual peak demand decisions.
This situation may not be amenable to full correction in the short term through modification to
allocation rules for transmission cost recovery; however, the PUCT should closely examine this
issue as the current 4CP transmission cost allocation mechanism is fundamentally in conflict
with the energy‐only market.

FTI Consulting, Inc. PRIORITIES FOR THE EVOLUTION OF AN ENERGY‐ONLY ELECTRICITY MARKET DESIGN IN ERCOT
Copyright © FTI Consulting, Inc., 2017 CONCLUSION 80
Conclusion
ERCOT employs an open wholesale electricity market as the basis for short‐term reliable
electricity supply as well as for long‐term investments to maintain reliability in the future.
Pricing and settlement rules for the real‐time energy‐only market must provide efficient
incentives for market participants to respond to scarcity conditions so as to avoid a situation in
which reliability is provided, instead, by expensive non‐market interventions, such as RUCs and
RMR contracts. The introduction of the system‐wide ORDC to provide for region‐wide scarcity
pricing was a major step in the evolution of the market.
Lower natural gas prices and the proliferation of renewables in ERCOT have changed market
fundamentals and transformed the balance sheets of electricity generation owners in the
region. These changes in broader economic trends and national policies cannot be reversed,
nor is it the purpose of good market design to attempt to reverse or unwind what is already
done. But the low level of region‐wide energy prices and ORDC adders are sending a message
for dispatchable resources to exit the market or delay maintenance expenditures, and elevate
the importance of improving price formation to ensure that it is fundamentals, and not
avoidable market influences or defects that drive the process of decisions about retirement,
entry or plant maintenance.
A review of energy price formation in ERCOT leads to two important conclusions: (i) while the
ORDC is performing consistently within its design, scarcity price formation is being adversely
influenced by factors not contemplated by the ORDC; (ii) other aspects of the ERCOT market
design must be improved to better maintain private market response to energy prices as the
driver of resource investment, maintenance expenditure and retirement decisions.
The following policy and price formation improvements are recommended to ensure a
sustainable structure consistent with tenets of energy‐only market design.
System‐wide Price Formation
• Marginal Losses: ERCOT should include the marginal cost of losses in its energy market
dispatch and pricing. The current omission of marginal losses creates a persistent inefficiency
in locational prices and an elevation of the real cost of serving load that can accumulate to
have an effect of the same order of magnitude as the effect of marginal congestion.
• ORDC Enhancements: ERCOT’s system‐wide ORDC calculation should be enhanced to
address the reliability impacts of changes in the generation supply mix, through a
conservative shift in the LOLP, and the price impacts of reliability deployments, by
subtracting such capacity from the measure of available reserves.

FTI Consulting, Inc. PRIORITIES FOR THE EVOLUTION OF AN ENERGY‐ONLY ELECTRICITY MARKET DESIGN IN ERCOT
Copyright © FTI Consulting, Inc., 2017 CONCLUSION 81
Locational Scarcity Pricing
• Out‐of‐Market Actions to Manage Transmission Constraints: Reliability constraints can
create perverse conditions when they induce out‐of‐market actions that, in combination with
market power mitigation, result in lower, not higher, market prices. Local scarcity pricing and
mitigation rules require changes to properly set prices when there are reliability unit
commitments or other ERCOT reliability actions to manage transmission constraints; these
changes should not disable rules for local market power mitigation.
• Dispatch and Pricing for Local Reserve Scarcity: A second step to price local scarcity and avoid out‐of‐market actions would be the introduction of local reserve requirements,
implemented through co‐optimization of the energy dispatch and reserve schedules, to
properly set prices when there are constraints on reserve availability in a sub‐region.
Transmission Planning and Cost Recovery
• Transmission Planning: Currently, out‐of‐market transmission planning occurs ahead of the
development of scarcity and diminishes the scarcity price signals that would lead, in the
alternative, to market‐based investment. Market‐reflective policies for transmission
investment should be considered as a replacement for Texas’ socialized transmission
planning, which fails to provide the opportunity for markets to respond.
• Transmission Cost Recovery: The allocation of transmission charges based on peak period
usage (4CP) leads to price suppression as well as welfare loss as market loads make expensive
decisions to avoid allocations of sunk costs that cannot be avoided in the aggregate.
Alternatives for transmission cost recovery to replace or reduce dependence on the summer
peak demand‐based mechanism for the allocation of sunk transmission costs would reduce
distortion of energy market pricing.

FTI Consulting, Inc. PRIORITIES FOR THE EVOLUTION OF AN ENERGY‐ONLY ELECTRICITY MARKET DESIGN IN ERCOT
Copyright © FTI Consulting, Inc., 2017 APPENDIX 82
Appendix: Formulation and Computation of Local Reserve Scarcity Prices through Operating Reserve Demand Curves
A representation of the value of operating reserves is essential for establishing prices for energy
and reserves. This Appendix provides further detail on the structure of the operating reserve
demand curve as now applied in ERCOT and discusses possible extensions. The ORDC provides
an approximation of the value of operating reserves appropriate for inclusion in a single period
representation of a dispatch model. The current ERCOT application treats pricing as arising
essentially as if it were within a co‐optimization framework, although full dispatch co‐
optimization of reserves and energy is not yet in place.
The full co‐optimization framework, simultaneously considering both the dispatch of energy
and reserves to meet forecast load conditions, could be important for some extensions of the
ORDC. In this framework, the offer costs and value of reserves (where the latter is measured by
the ORDC) trade off against the offer costs and locational demands for energy in the
simultaneous dispatch. The co‐optimization model extends the use of the current ORDC.
The existing ERCOT ORDC has one assumed emergency response, which requires involuntary
curtailment of load priced at the Value of Lost Load (VOLL). This action is triggered at the
associated minimum contingency level of reserve requirement. Furthermore, the existing ORDC
is for a system‐wide requirement under the assumption that using the reserves over a short
interval would not confront any transmission constraints.
The first extension discussed below would be to unpack the emergency response to better track
the actual practice during emergency conditions. In particular, ERCOT has a number of Energy
Emergency Alert stages that precipitate emergency actions of increasing severity. These
different actions would have costs lower than VOLL, but the reserve levels where they would be
applied would be higher than the contingency minimum. For simplicity, the existing ERCOT
design makes the compromise of having a trigger level (the “X” factor) that is higher than the
true minimum contingency reserve level but lower than the initiation of the Energy Emergency
Alerts. Extending the ORDC to better approximate the various Energy Emergency Alerts would
be possible. This would require estimating the trigger levels, which is complicated by the
variance between Physical Responsive Capability, which triggers Energy Emergency Alerts) and
ORDC reserves (which triggers ORDC price adders), and estimating the avoided cost values of
the emergency actions, which could also prove difficult. An example of a model for a multi‐step
ORDC representation in the dispatch model is described and illustrated below.

FTI Consulting, Inc. PRIORITIES FOR THE EVOLUTION OF AN ENERGY‐ONLY ELECTRICITY MARKET DESIGN IN ERCOT
Copyright © FTI Consulting, Inc., 2017 APPENDIX 83
A second extension would be to address the situations in which transmission constraints would
be relevant in the event of deployment of operating reserves. This condition would create a
locational requirement for operating reserves. Moreover, because the requirements would
lead to separation in the prices and value for reserves in different locations, the transmission
limits would imply locationally differentiated operating reserve products. A locational
requirement would be paired with the identification of the locations of each constrained zone.
Associated with each zone, the approach would require estimates of the probability of net load
changes for a given time step (hourly), analogously to the estimation of the probabilities for the
current ERCOT‐wide ORDC. In addition, the analysis would require an estimate of the capacity
of a closed interface constraint that would restrict the flow of energy and dispatch of reserves
into the constrained region. These would be used to construct locational operating reserve
demand curve values. The locational supply and demand for reserves and interface capacity
would interact with the system wide supply and demand for reserves and this would produce
an ORDC function that determines the price for each as a function of the availability of total
reserves, local reserves and the interface constraint. The sections below provide a derivation of
such a model of a locational ORDC and the necessary changes to incorporate this
representation of operating reserves in the dispatch objective function.
The outline of the formulation of system‐wide and local ORDCs provides guidance for applying
the basic principles in practice. By its nature, an ORDC is an approximation of a complex reality.
Some approximation is necessary to make the power dispatch problem tractable. Furthermore,
the details will depend on the actual system constraints and operating practices. The following
summarizes the major elements of a model that incorporates an explicit treatment of an ORDC
and provides a guide for implementation. This Appendix derives from and extends the earlier
discussion in prior work (Hogan, 2013).
ECONOMIC DISPATCH AND OPERATING RESERVES
The assumption of the existence of an operating reserve demand curve simplifies the analysis.
The demand curve gives rise to a reserve benefit function that can be included in the objective
function for economic dispatch. The basic framework approximates the complex problem with
a wide range of uncertainties and applies a pricing logic to match the actions of system
operators. The main features include:
• Single Period Model. There is a static representation of the underlying dynamic problem.
This static formulation is a conventional building block for a multi‐period framework.
• Deterministic Representation. The single period dispatch formulation is based on bids,
offers, and expected network conditions as in standard economic dispatch models. The
operating reserve demand curve represents the value of uncertain uses of reserves without
explicitly representing the uncertainty in the optimization model.

FTI Consulting, Inc. PRIORITIES FOR THE EVOLUTION OF AN ENERGY‐ONLY ELECTRICITY MARKET DESIGN IN ERCOT
Copyright © FTI Consulting, Inc., 2017 APPENDIX 84
• Security Constrained. The economic dispatch model includes the usual formulation of N‐1
contingency constraints to preclude cascading failures.
• Ex‐Ante Dispatch. The dispatch is determined before uncertainty about net load relative to
forecast is revealed.
• Expected Value for Reserves. The reserve benefit function represents the expected value of avoiding involuntary load curtailments and similar emergency actions.
• Multiple Reserve Types. The model of the operating reserve demand allows for a typical
cascade model of different reserve types. Online spinning reserves and fast start standby
reserves interact to provide complementary reserve prices.
• Administrative Balancing. Subsequent uncertain events are treated according to
administrative rules to utilize operating reserves to maintain system balance and minimize
load curtailments.
• Consistent Prices. The model co‐optimizes the dispatch of energy and reserves and produces
a consistent set of prices for the period.
The framework allows for a variety of implementations with multiple zones, forward markets
and other common aspects of electricity markets.
MODELING ECONOMIC DISPATCH AND OPERATING RESERVES IN A CO‐OPTIMIZED SYSTEM
The model presented below is a one‐period DC‐load model with co‐optimization of reserves
and energy. The notion is that the dispatch set at the beginning of the period must include
some operating reserves that could deal with subsequent uncertain events. The emphasis is on
the co‐optimization of energy and reserves to illustrate the major interactions with energy
prices. The initial approach assumes no locational constraints on reserves. The canonical
example assumes the existence of a separable non‐locational benefit function for reserves.

FTI Consulting, Inc. PRIORITIES FOR THE EVOLUTION OF AN ENERGY‐ONLY ELECTRICITY MARKET DESIGN IN ERCOT
Copyright © FTI Consulting, Inc., 2017 APPENDIX 85
Here the various variables and functions include:
0
0
: Vector of locational demands
: Vector of locational responsive generation
: Vector of locational responsive reserves
: Vector of locational non-spin reserves
: Aggregate responsive reserves
:
R
R
NS
R
NS
d
g
r
r
r
r
Aggregate non-spin reserves
: Vector of locational generation not providing reserves
: Benefit function for demand
: Cost function for generation offers
: Generation Capacity
: Reserve value fun
NR
k k
k
k k
g
B d
C g
K
R rmax
ction integrating demand curves
: Maximum Ramp Rate
, : Transmission Constraint Parameters
: Vector of ones.
kr
H b
i
Assuming that unit commitment is determined, the stylized economic dispatch model is:
(1)
0 0
0 0
, , , , , , 0;
Net Loads
0 Load Balance
Transmission Limits
Responsive Capacity
Generation Only Capacity
Non-Spin
R NR R R NS NS
R R NR NR I R II NSd g g r r r r y
R NRt
R R R R
NR NR NR
NS NS
Max B d C g C g R r R r
d g g y
i y
Hy b
g r K
g K
r K
0
0
max
max
Capacity
Responsive Reserves
Non-Spin Reserves
Responsive Ramp Limit
Non-Spin Ramp Limit .
NSt
R R Rt t
R NS NS NS
R R R
NS NS NS
i r r
i r i r r
r r
r r
This formulation assumes that the non‐spinning reserve generators are not spinning and,
therefore, cannot provide energy for the dispatch. The Non‐Spinning Reserve equation
implements a cascade model for reserves, where both responsive and non‐spinning reserves
contribute to the aggregate non‐spinning supply.

FTI Consulting, Inc. PRIORITIES FOR THE EVOLUTION OF AN ENERGY‐ONLY ELECTRICITY MARKET DESIGN IN ERCOT
Copyright © FTI Consulting, Inc., 2017 APPENDIX 86
For the present discussion, the pricing relationships follow from the usual interpretation of a
convex economic dispatch model. This could be expanded to include unit commitment and
extended LMP formulations (ELMP), but the basic insights would be similar (Gribik et al., 2007).
An interpretation of the prices follows from analysis of the dual variables and the
complementarity conditions. For an interior solution, the locational prices ( ) are equal to the
demand prices for load.
(2) .B d
The same locational prices connect to the system lambda and the cost of congestion for the
binding transmission constraints in the usual way.
(3) .ti H
In addition, the locational prices equate with the marginal cost of generation plus the cost of
scarcity.
(4) .R R RC g
A similar relation applies for the value of non‐reserve related generation.
(5) .NR NR NRC g
The marginal value of responsive reserves connects to the scarcity costs of capacity and
ramping limits.
(6) 0 0
.I R II NS
R R R NS
dR r dR ri i i i
dr dr
The corresponding marginal value of non‐spinning reserves reflects the scarcity value for
capacity and ramping limits.
(7) 0
.II NS
NS NS NS
dR ri i
dr
If there are no binding ramp limits for responsive reserves, then 0R and from (6) we have
R as a vector where every element is the price of responsive reserves. Similarly, for the
ramping limits on non‐spinning reserves, if these are not binding, then 0NS and from (7) we
have NS as a vector where every element is the price of non‐spinning reserves.
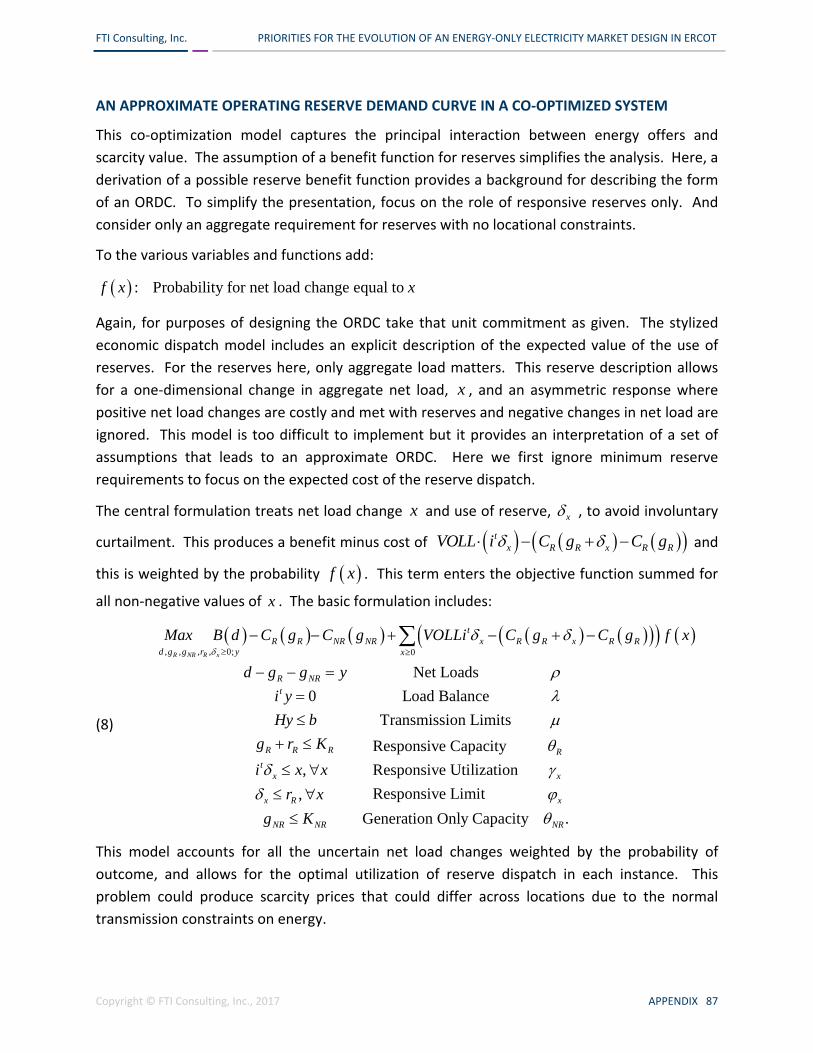
FTI Consulting, Inc. PRIORITIES FOR THE EVOLUTION OF AN ENERGY‐ONLY ELECTRICITY MARKET DESIGN IN ERCOT
Copyright © FTI Consulting, Inc., 2017 APPENDIX 87
AN APPROXIMATE OPERATING RESERVE DEMAND CURVE IN A CO‐OPTIMIZED SYSTEM
This co‐optimization model captures the principal interaction between energy offers and
scarcity value. The assumption of a benefit function for reserves simplifies the analysis. Here, a
derivation of a possible reserve benefit function provides a background for describing the form
of an ORDC. To simplify the presentation, focus on the role of responsive reserves only. And
consider only an aggregate requirement for reserves with no locational constraints.
To the various variables and functions add:
: Probability for net load change equal to f x x
Again, for purposes of designing the ORDC take that unit commitment as given. The stylized
economic dispatch model includes an explicit description of the expected value of the use of
reserves. For the reserves here, only aggregate load matters. This reserve description allows
for a one‐dimensional change in aggregate net load, x , and an asymmetric response where
positive net load changes are costly and met with reserves and negative changes in net load are
ignored. This model is too difficult to implement but it provides an interpretation of a set of
assumptions that leads to an approximate ORDC. Here we first ignore minimum reserve
requirements to focus on the expected cost of the reserve dispatch.
The central formulation treats net load change x and use of reserve, x , to avoid involuntary
curtailment. This produces a benefit minus cost of tx R R x R RVOLL i C g C g and
this is weighted by the probability f x . This term enters the objective function summed for
all non‐negative values of x . The basic formulation includes:
(8)
, , , , 0; 0
Net Loads
0 Load Balance
Transmission Limits
Responsive Capacity
, Responsive Utilization
Responsiv,
R NR R x
tR R NR NR x R R x R R
d g g r y x
R NRt
R R R
tx
x R
Max B d C g C g VOLLi C g C g f x
d g g y
i y
Hy b
g r K
i x x
r x
e Limit
Generation Only Capacity .
R
x
x
NR NR NRg K
This model accounts for all the uncertain net load changes weighted by the probability of
outcome, and allows for the optimal utilization of reserve dispatch in each instance. This
problem could produce scarcity prices that could differ across locations due to the normal
transmission constraints on energy.

FTI Consulting, Inc. PRIORITIES FOR THE EVOLUTION OF AN ENERGY‐ONLY ELECTRICITY MARKET DESIGN IN ERCOT
Copyright © FTI Consulting, Inc., 2017 APPENDIX 88
To approach the assessment of how to approximate reserves with a common scarcity price
across the system, further simplify this basic problem.
1. Treat the utilization of reserves as a one‐dimensional aggregate variable. 2. Replace the responsive reserve limit vector with a corresponding aggregate constraint
on total reserves.
3. Utilize an approximation of the cost function, C , for the aggregate utilization of reserves, and further approximate the change in costs with the derivative of cost times the utilization of reserves.
This set of assumptions produces a representation for the use of a single aggregate level of
reserves for the system:
(9)
, , , , 0; 0
ˆ
Net Loads
0 Load Balance
Transmission Limits
Responsive Capacity
, Responsive Utilization
Responsi,
0 ,
R NR R x
tR R NR NR x R R x
d g g r y x
R NRt
R R R
x
tx R
R
Max B d C g C g VOLL C i g f x
d g g y
i y
Hy b
g r K
x x
i r x
r
ve Limit
Explicit Sign Constraint
Generation Only Capacity .
R
x
x
R
NR NR NRg K
This formulation provides a reasonably transparent interpretation of the implied prices.
Focusing on an interior solution for all the variables except Rr , we would have locational prices
related to the marginal benefits of load:
(10) .B d
The same locational prices connect to the system lambda and the cost of congestion for the
binding transmission constraints.
(11) .ti H
The locational prices equate with the marginal cost of generation‐only plus the cost of scarcity
when this generation is at capacity, which appears in the usual form.
(12) .NR NR NRC g

FTI Consulting, Inc. PRIORITIES FOR THE EVOLUTION OF AN ENERGY‐ONLY ELECTRICITY MARKET DESIGN IN ERCOT
Copyright © FTI Consulting, Inc., 2017 APPENDIX 89
The locational prices equate with the marginal cost of responsive generation and display the
impact of reserve scarcity. First, the impact of changing the base dispatch of responsive
generation implies:
2
0
ˆ .tR R R R x R
x
C g C i g i f x
The second‐order term captures the effect of the base dispatch of responsive dispatch on the
expected cost of meeting the reserve utilization. This term is likely to be small. For example, if
we assume that the derivative ˆRC is constant, then the second order term is zero.
When we account for the base dispatch of reserves, we have:
0R x R
x
i
.
When accounting for utilization of the reserves, we have:
ˆ tx x R RVOLL C i g f x .
Let tRr i r . Then for , 0; , 0x xx r x r . Hence,
ˆ 1tR x R R R R
x r
i VOLL C i g F r i
.
Combining these, we can rewrite the locational price as:
(13) 2
0
ˆ ˆ 1 .t tR R R R x R R R
x
C g C i g i f x VOLL C i g F r i
Equations (2) thru (13) capture our approximating model for aggregate responsive reserves.
Here 1 F r Lolp r . The term ˆ 1tR RVOLL C i g F r in (13) is the scarcity price
of the ORDC. If the second order terms in (13) are dropped, then the scarcity price is the only
change from the conventional generation only model. In practice, we would have to update
this model to account for minimum reserve levels, non‐spin, and so on, to include an estimate
of ˆRc C in defining the net value of operating reserves v VOLL c .
Note that under these assumptions the scarcity price is set according to the opportunity cost
using C for the marginal responsive generator in the base dispatch. Depending on the
accuracy of the estimate in C , this seeks to maintain that the energy price plus scarcity price
never exceeds the value of lost load.
Providing a reasonable estimate for C could be done either as an (i) exogenous constant, (ii)
through a two‐pass procedure, or (iii) approximately in the dispatch. For example, a possible
procedure would define the approximating cost function as the least unconstrained cost,

FTI Consulting, Inc. PRIORITIES FOR THE EVOLUTION OF AN ENERGY‐ONLY ELECTRICITY MARKET DESIGN IN ERCOT
Copyright © FTI Consulting, Inc., 2017 APPENDIX 90
ˆ ˆ ˆ tR R R RC g Min C g g i g .
This information would be easy to evaluate before the dispatch.
Construct the ORDC for responsive reserves that modifies (13) to incorporate the minimum or
last resort reserves X priced at v . Here Probability Net Load ChangeLolp r r . For a
candidate value of the aggregate responsive reserves define the corresponding value on the
operating reserve demand curve:
(14)
, 0
1, 0
.
t tR R
R R tR
R R R R
Lolp i r X i r Xr
i r X
P r v r
This defines the ORDC for responsive reserves. With this definition, the price of energy is the
marginal cost of energy plus the scarcity value, and is bounded byVOLL .
MULTIPLE EMERGENCY ACTIONS
The basic logic extends to the case where there are multiple stages of emergency actions
triggered by a low level of responsive reserves. The price of reserves is defined by the
willingness to pay at the margin to obtain an additional unit of reserves. If emergency actions
have been taken ex‐ante, then the willingness to pay will be at least the cost of the emergency
action. In addition, the value of reserves would be at least the ex‐post value of an increment of
reserves given the probability distribution of the change relative to the anticipated dispatch of
the net load.
For example, suppose that we have three emergency actions, with limited capacity, where only
the last requires involuntary curtailment of load at the full VOLL. Let the first two actions have
values of emergency action 1 2VEA VEA VOLL , and available capacities 1 2,KEA KEA . Define
the contingency minimum for reserves at 3X where the VOLL applies. Let the other
breakpoints be:
2 3 2
1 2 1
X X KEA
X X KEA
.
Then define s , including the minimum contingency levels and emergency actions, as the
greater of the ex‐ante cost and the expected cost of using the emergency action given the level
of reserves in the event that there is a deviation for the forecast net load.

FTI Consulting, Inc. PRIORITIES FOR THE EVOLUTION OF AN ENERGY‐ONLY ELECTRICITY MARKET DESIGN IN ERCOT
Copyright © FTI Consulting, Inc., 2017 APPENDIX 91
(15)
3
3 2 3 2
3
2 1
2 2 3 1
3 2 2 3
1
1 1 2
,
* , ,
*,
* ,
* *
* ,
VOLL s X
Max VOLL Lolp s X VEA X s X
VOLL Lolp s XMax X s Xs
VEA Lolp s X Lolp s X VEA
VOLL Lolp s X VEA Lolp s X Lolp s XX s
VEA Lolp s X Lolp s X
.
Hence, the ex‐ante scarcity value for reserves is R R RP r r c .
If the two emergency values are high enough, then given an operating reserve level r above the
total 1 2X KEA KEA , the marginal value of an increment of responsive operating reserves
would be:
1 1 2 1 1 2
1 2 .
RP r VEA Lolp r Lolp r KEA VEA Lolp r KEA Lolp r KEA KEA
VOLL Lolp r KEA KEA c
This is the expected value component of the ORDC. The full ORDC in the dispatch would
include the steps in the emergency response, and the probabilistic value of additional reserves,
as in (15).

FTI Consulti
Copyright ©
Figure 22
the seco
1300MW
2300MW
and VOLL
109
ng, Inc.
© FTI Consulting,
2 shows an i
nd at $6000
W with a VOL
W. The com
L=$9000.109
The basic assum
PRIORITIE
, Inc., 2017
illustrative c
0 for 500MW
LL=$9000/M
parison is w
mptions for the il
ES FOR THE EVOL
F
case with the
W, and the
MW. The co
with the init
llustrative norm
Expected Total
Std Dev (MW)
VOLL ($/MWh)
Marginal Dispat
LUTION OF AN E
Figure 22
e first emerg
final X valu
rresponding
tial ERCOT O
al distribution o
(MW)
tch ($/MWh)
ENERGY‐ONLY EL
gency action
ue of minim
g emergency
ORDC as imp
of changes in net
LECTRICITY MAR
n at $4000/M
mum conting
y action “X1”
plemented w
t load are
16
1357.00
9000
100
RKET DESIGN IN
APPEND
MW for 500
gency reserv
” value is th
with X=2000
ERCOT
DIX 92
0MW,
ves at
en at
0MW

FTI Consulting, Inc. PRIORITIES FOR THE EVOLUTION OF AN ENERGY‐ONLY ELECTRICITY MARKET DESIGN IN ERCOT
Copyright © FTI Consulting, Inc., 2017 APPENDIX 93
MULTIPLE RESERVE TYPES
The organized market practice distinguishes several types of reserves. Setting aside regulation,
the principal distinction is between “responsive” reserves (R) and “non‐spin” reserves (NS). The
ORDC framework can be adapted to include multiple reserves. This section summarizes one
such modeling approach and relates it to the co‐optimization examples above. The main
distinction is that “responsive” reserves are spinning and have a quick reaction time. These
reserves would be available almost immediately and could provide energy to meet increases in
net load over the whole of the operating reserve period. By comparison, non‐spinning reserves
are slower to respond and would not be available for the entire period.
The proposed model of operating reserves approximates the complex dynamics by assuming
that the uncertainty about the unpredicted change in net load is revealed after the basic
dispatch is determined. The probability distribution of change in net load is interpreted as
applying the change over the uncertain reserve period, say the next hour, divided into two
intervals. Over the first interval, of duration ( ), only the responsive reserves can avoid
curtailments. Over the second interval of duration (1‐ ), both the responsive and non‐spin
reserves can avoid involuntary load shedding.
This formulation produces different values for the responsive and non‐spin reserves. Let v be
the net value of load curtailment, defined as the value of lost load less the avoided cost of
energy dispatch offer for the marginal reserve. The interpretation of the prices of reserves,
andR NSP P , is the marginal impact on the load curtailment times Lolp , the probability of the
net change in load being greater that the level of reserves, andR NSr r . This marginal value
differs for the two intervals, as shown in the following table:
Marginal Reserve Values
Interval I Interval II
Duration 1‐
RP I RvLolp r I II R NSvLolp r r
NSP 0 I II R NSvLolp r r
This formulation lends itself to the interpretation of Figure 22 where there are two periods with
different demand curves and the models are nested. In other words, responsive reserves Rr
can meet the needs in both intervals and the non‐spinning reserves NSr can only meet the needs
for the second interval.

FTI Consulti
Copyright ©
In order
advantag
marginal
varying n
The stan
is spread
Figure 24
first inte
change, a
ng, Inc.
© FTI Consulting,
to keep th
ge of utilizin
value in an
net load chan
dard deviati
d out over th
4. An altern
erval, when
and the seco
PRIORITIE
, Inc., 2017
e analysis o
ng a step fun
n interval co
nge. We on
ion of the ch
he period, th
native two‐st
only respon
ond step cap
ES FOR THE EVOL
F
of the marg
nction appro
onstant, and
ly need the t
hange in net
hen on aver
tep approxim
nsive reserv
ptures the to
LUTION OF AN E
Figure 23
inal benefit
oximation fo
d we don’t h
total LOLP o
t load is for
rage it would
mation in Fi
ves can resp
otal change a
ENERGY‐ONLY EL
ts of more r
or the net lo
have to com
over that inte
the total ov
d be more l
igure 24 tha
pond, is pro
at the begin
LECTRICITY MAR
reserves sim
oad change.
mpute expec
erval.)
ver the perio
ike the diag
at the net lo
oportional t
ning of the s
RKET DESIGN IN
APPEND
mple, there
(This keep
ctations ove
od. If the ch
gonal dashed
ad change i
to the total
second inter
ERCOT
DIX 94
is an
ps the
er the
hange
d line
n the
load
rval.
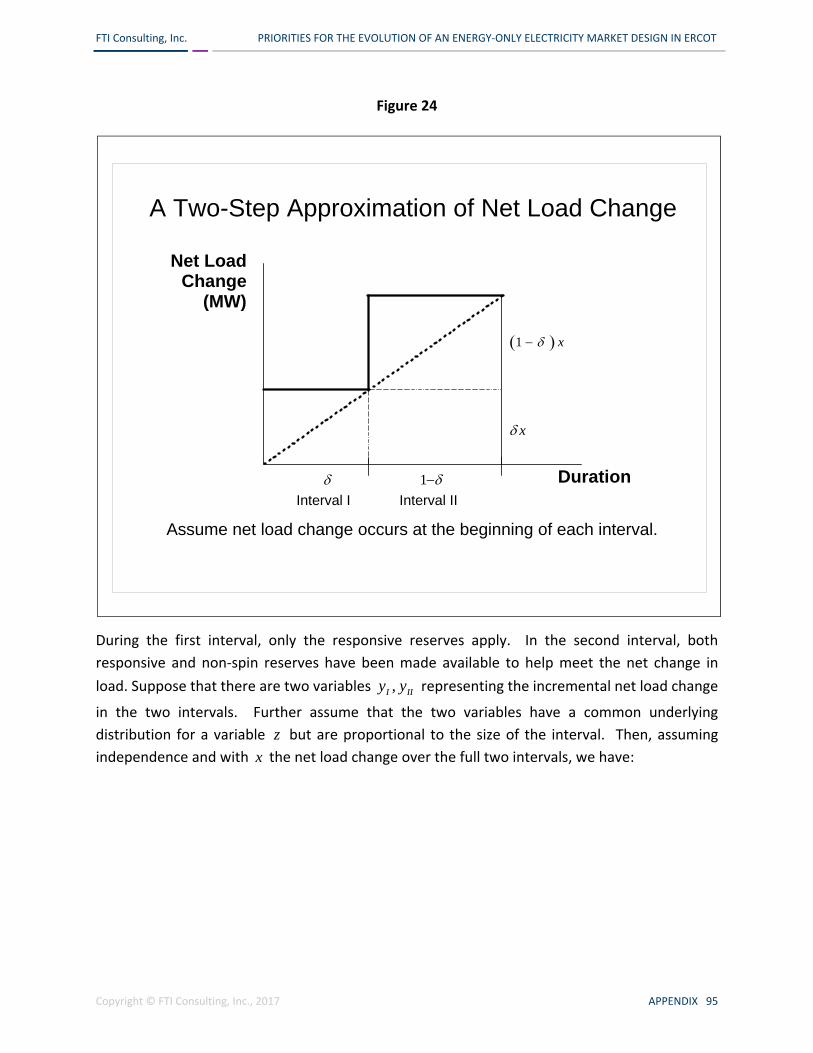
FTI Consulting, Inc. PRIORITIES FOR THE EVOLUTION OF AN ENERGY‐ONLY ELECTRICITY MARKET DESIGN IN ERCOT
Copyright © FTI Consulting, Inc., 2017 APPENDIX 95
Figure 24
During the first interval, only the responsive reserves apply. In the second interval, both
responsive and non‐spin reserves have been made available to help meet the net change in
load. Suppose that there are two variables ,I IIy y representing the incremental net load change
in the two intervals. Further assume that the two variables have a common underlying
distribution for a variable z but are proportional to the size of the interval. Then, assuming
independence and with x the net load change over the full two intervals, we have:
A Two-Step Approximation of Net Load Change
Duration
Net Load Change
(MW)
Assume net load change occurs at the beginning of each interval.
1
1 x
x
Interval I Interval II

FTI Consulting, Inc. PRIORITIES FOR THE EVOLUTION OF AN ENERGY‐ONLY ELECTRICITY MARKET DESIGN IN ERCOT
Copyright © FTI Consulting, Inc., 2017 APPENDIX 96
2
2
22
2
2 22 2
,
1 1 .
,
1 1 .
.
1 .
.1 1
I
II
I
II
I II
I II I II
E y E z E z
E y E z E z
Var y Var z Var z
Var y Var z Var z
E z E y y E x
Var x Var y y Var y Var y Var z
Var xVar z
The distinction here is that the implied variance of the individual intervals is greater compared
to the one‐draw assumption, even though the total variance of the sum over the two intervals
is the same. This is simply an impact square root law for the standard deviation of the sums of
independent random variables.
Hence, for the first interval, the standard deviation is 22 1
, where is the standard
deviation of the net change in load over both intervals.
Here the different distributions refer to the net change in load over the first interval, and over
the sum of the two intervals. The distribution over the sum is just the same distribution for the
whole period that was used above. Then ~ , ~I I I II I IIy Lolp y y Lolp . A workable
approximation would be to utilize the normal distribution for the net load change.
As before, there would be an adjustment to deal with the minimum reserve to meet the max
contingency. The revised formulation would include:
, 0
1, 0
, 0,
1, 0
, 1 , ,
, 1 , .
t tI R R
R R tR
t t t tI II R NS R NS
NS R NS t tR NS
R R NS R R NS R NS
NS R NS NS R NS
Lolp i r X i r Xr
i r X
Lolp i r i r X i r i r Xr r
i r i r X
P r r v r r r
P r r v r r
This formulation lends itself to implementation in the co‐optimization model. For example,
given benchmark estimates for each type of reserves, ˆ ˆ,R NSr r , the problem becomes separable
in responsive and non‐spin reserves. A numerical integration of ˆ,R R NSP r r and ˆ ,NS R NSP r r

FTI Consulting, Inc. PRIORITIES FOR THE EVOLUTION OF AN ENERGY‐ONLY ELECTRICITY MARKET DESIGN IN ERCOT
Copyright © FTI Consulting, Inc., 2017 APPENDIX 97
would produce the counterpart benefit functions, 0 0,I R II NSR r R r . With weak interactions
between the types of reserves, the experience with this type of decomposition method suggest
that updating the benchmark estimates in an iterative model could produce rapid convergence
to the simultaneous solution (Ahn & Hogan, 1982).
MULTIPLE ZONES AND LOCATIONAL OPERATING RESERVES
The assumption that there is a single system‐wide operating reserve benefit may need to be
modified. The steady‐state constraints of transmission limits and loop flows apply to the base
dispatch. These constraints need not apply necessarily to the short‐term use of operating
reserves in stressed situation. However, it is possible a set of transmission limits includes
locational constraints on operating reserves. An approach for modeling locational operating
reserves is to define a zone and the associated interface constraint that limits the emergency
movement of power. This constraint then separates the reserves inside and outside the region
and defines their interaction.
The task is to define a locational operating reserve model that approximates and prices the
dispatch decisions made by operators. To illustrate, consider the simplest case with one
constrained zone and the rest of the system. The reserves are defined separately and there is a
known transfer limit for the closed interface between the constrained zone and the rest of the
system. This zonal interface constraint would be analogous to the Capacity Emergency Transfer
Limit in PJM planning models (PJM, 2016). The probability distribution for net load changes
would be estimated separately for locations inside and outside the zone. The zonal
requirements for operating reserves that interact with energy and economic dispatch,
incorporate local interface constraints, and provide compatible short‐term prices for operating
reserves and interface capacity. This basic argument leads to a simple numerical model that
can incorporate multiple embedded zones and interface constraints and be implemented with
the co‐optimization framework for energy and reserves.
An outline of the basic framework illustrates the representation of locational operating reserve
demand curves. Adaptation of a single system ORDC to address locational reserve
requirements raises additional issues.
To illustrate, consider the simplest case with one constrained zone and the rest of the system,
as Figure 25. The regions are nested, meaning that the locational requirement is a subset of the
system requirement. The reserves are defined separately for the system and within the local
region, but they interact and there is a known transfer limit for the closed interface between
the constrained zone and the rest of the system.

FTI Consulting, Inc. PRIORITIES FOR THE EVOLUTION OF AN ENERGY‐ONLY ELECTRICITY MARKET DESIGN IN ERCOT
Copyright © FTI Consulting, Inc., 2017 APPENDIX 98
Figure 25
The interior Zone 1 has a known level of reserves 1r . The distribution of net load changes
within the zone is 1 1~y f . The closed interface defines the interior zone by a limit 1r on the
aggregate power flow from the rest of the system into the local zone. This limit will interact
with the dispatch power flow. The rest of system has a known level of reserves 0r and a
distribution of net load changes outside of the interior zone, 0 0~y f . These are treated as
independent distributions. Independence is not a strong assumption. The dispatch load
forecast might be strongly interacting across the zones, but the unanticipated deviations from
the forecast can be viewed as approximately independent across the zones.
The distributions for each net load change have corresponding cumulative distributions.
.
The zonal value of expected unserved energy (ZVEUE) would be an added component of the
objective function in economic dispatch. Here, assume that the 1 1v VOLL is at least as great
Zonal Interface Limit on Emergency Transfers
Zone 1Rest of System
Reserves 0r1r
Closed Interface Limit 1r
Reserves
0yNet Load Change 1yNet Load Change
0 1
0 0 1 1 0 0 0 0 1 1 1 1 1~ , ~ , ,y y
oy f y f F y f x dx F y f x dx

FTI Consulting, Inc. PRIORITIES FOR THE EVOLUTION OF AN ENERGY‐ONLY ELECTRICITY MARKET DESIGN IN ERCOT
Copyright © FTI Consulting, Inc., 2017 APPENDIX 99
as the corresponding value in the rest of the system, 0 0v VOLL . With this assumption, we
assume the protocol that gives priority to meeting load deviations inside zone relative to the
rest of the system, and the ex‐post dispatch will have a simple structure. In Figure 26, the first
priority is to meet the net change of load within the interior zone. The unserved load il will be
penalized at the respective value of loss load.
Figure 26
The basic problem determines the configuration of lost load and the ZVEUE.
0 1 1 0 0 1 1 0 1 0 1 0 1 1 1 1 10
, , ,i
yl
ZVEUE r r r E Min v l v l y y l l r r y l r r
.
The derivatives of ZVEUE define the demand curves for operating reserves. The tree structure
in Figure 27 illustrates the steps to construct these prices for reserves and the interface
constraint. At the top of the branching is the amount of lost load in region 1. This is either zero
or positive, and the probabilities on the branches apply for these conditions. The key is the
limit on internal reserves and the interface limit. If the net change in load inside the zone is
Loss of Load Probability Structure
Rest of System
0r
1 1 1, ,r r y
0y
0l
1l+
+
0
0
1 1 1F r r 1 1 1F r r
Path Dependent
,iy
i i i i i i iy f F y f x dx
0 1 1 0 0 1 1 0 1 0 1 0 1 1 1 1 10
, , ,i
yl
ZVEUE r r r E Min v l v l y y l l r r y l r r
0 0 1 1.VOLL v VOLL v

FTI Consulting, Inc. PRIORITIES FOR THE EVOLUTION OF AN ENERGY‐ONLY ELECTRICITY MARKET DESIGN IN ERCOT
Copyright © FTI Consulting, Inc., 2017 APPENDIX 100
greater than 1 1r r then all the reserves inside the region and all that could move from outside
the region would be utilized, and there would be loss of load inside the region. This occurs with
probability 1 1 1 1 1 11F r r F r r . Likewise, the left branch with 1 0l has probability
.
The probabilities for the next level down are path dependent, but the calculation is
conceptually straightforward.
Figure 27
For example, in Figure 27, given that we are on the path with 1 0l , the reserves available for
the rest of the region must be the total rest‐of‐system reserves minus the interface capacity,
because the interface capacity is being used to meet requirements in the constrained zone.
The conditional probability of this case is 0 0 1F r r . Hence, the probability for the full path is
1 1 1 0 0 1F r r F r r , as shown in Figure 27. A similar argument applies to the other paths.
1 1 1F r r
Rest of System
0r
1 1 1, ,r r y
0y
Demand Curve Elements
1 1
0 1 1
1 1
1
0
0 0 1 1 1 1 1
r r
i i iir r x
r r
f x dx
F r r x f x dx
1 1 0 1
1
0
1 1 1 0 0 1
i i iir r r r
f x dx
F r r F r r
+
++
0
00
1 1 1F r r 1 1 1F r r
0l
1l
Path Probabilty

FTI Consulting, Inc. PRIORITIES FOR THE EVOLUTION OF AN ENERGY‐ONLY ELECTRICITY MARKET DESIGN IN ERCOT
Copyright © FTI Consulting, Inc., 2017 APPENDIX 101
The full ZVEUE is difficult to characterize and calculate. However, inspection of the possible
configurations of outages reveals the marginal zonal values of unserved energy, which define
the locational demand curves for operating reserves.
Figure 28
The table in Figure 28 illustrates the reserve incremental values on each of the paths. For
example, on the right‐most path, the marginal value of reserves inside the region is 1v and the
marginal value in the rest of the region is 0v , because there are load losses in both regions. On
this same path, the marginal value of incremental interface capacity is the increased flow from
outside to inside, which would produce net benefit 1 0v v . Similar arguments apply to the
other elements of the table. And with this table we see the paths where values are non‐zero
and we need the associated path probabilities.
Combining the marginal values and probabilities for each path in the tree yields the
corresponding value which defines the expected marginal value of the increment of reserves or
interface capacity.
Loss of Load Values
0 1 1 0 0 1 1 0 1 0 1 0 1 1 1 1 10
, , ,i
yl
ZVEUE r r r E Min v l v l y y l l r r y l r r
Rest of System
0r
1 1 1, ,r r y
0y+
++
0
00
1 1 1F r r 1 1 1F r r
0l
1l
0r1r1r 0v 1v
1v1v
1 0v v
0v0v
000
00
Reserve Incremental Values

FTI Consulting, Inc. PRIORITIES FOR THE EVOLUTION OF AN ENERGY‐ONLY ELECTRICITY MARKET DESIGN IN ERCOT
Copyright © FTI Consulting, Inc., 2017 APPENDIX 102
For example, Figure 29 shows the demand curve for the price of reserves in the rest of the
system, with the check marks showing the relevant paths.
Figure 29
The demand is a function of all three elements and the associated probability distributions.
1 1
0 0 0 1 1 1 1 1 1 1 1 0 0 1
r r
r op v F r r x f x dx F r r F r r
.
Since all these elements are known, it is a simple calculation to trace out the elements of the
demand curve to include in the dispatch objective function and solve for energy and reserves.
Rest of System
0r
1 1 1, ,r r y
0y
1 1
0 1 1
1 1
1
0
0 0 1 1 1 1 1
r r
i i iir r x
r r
f x dx
F r r x f x dx
1 1 0 1
1
0
1 1 1 0 0 1
i i iir r r r
f x dx
F r r F r r
Demand Curve Elements: Rest of System
1 1
0 0 0 1 1 1 1 1 1 1 1 0 0 1
r r
r op v F r r x f x dx F r r F r r
+
++
0
00
1 1 1F r r 1 1 1F r r
0l
1l

FTI Consulting, Inc. PRIORITIES FOR THE EVOLUTION OF AN ENERGY‐ONLY ELECTRICITY MARKET DESIGN IN ERCOT
Copyright © FTI Consulting, Inc., 2017 APPENDIX 103
There is a similar story for the price of reserves inside the local zone in Figure 30.
1 1
1 1 1 1 1 0 0 1 1 1 1 1
r r
r op v F r r v F r r x f x dx
Figure 30
Finally, the analysis extends to the demand curve for interface capacity in Figure 31 .
1 1 1 1 1 0 1 1 1 0 0 1rp v F r r v F r r F r r
Rest of System
0r
1 1 1, ,r r y
0y
1 1
0 1 1
1 1
1
0
0 0 1 1 1 1 1
r r
i i iir r x
r r
f x dx
F r r x f x dx
1 1 0 1
1
0
1 1 1 0 0 1
i i iir r r r
f x dx
F r r F r r
Demand Curve Elements: Zone 1
1 1
1 1 1 1 1 0 0 1 1 1 1 1
r r
r op v F r r v F r r x f x dx
+
++
0
00
1 1 1F r r 1 1 1F r r
0l
1l

FTI Consulting, Inc. PRIORITIES FOR THE EVOLUTION OF AN ENERGY‐ONLY ELECTRICITY MARKET DESIGN IN ERCOT
Copyright © FTI Consulting, Inc., 2017 APPENDIX 104
Figure 31
Although the values for each reserve differ in each case on the tree, the expected values
defining the reserve prices satisfy 0 1ir r rp p p .
The extensions to include multiple zones or further nested zones would follow a similar logic.
At some stage the “curse of dimensionality” would make the size of the probability tree too
large to maintain computational tractability. However, the simple structure could well
accommodate a few zones.
The illustration in Figure 32 suggests the basic structure with parallel and nested zones. On
each path there would be an algorithm for numerically integrating the probabilities to obtain
the path weights. And there would be a corresponding table of marginal values of each zonal
reserve and interface constraint (Hogan, 2010). The resulting demand curves could be included
in the dispatch logic.
Rest of System
0r
1 1 1, ,r r y
0y
1 1
0 1 1
1 1
1
0
0 0 1 1 1 1 1
r r
i i iir r x
r r
f x dx
F r r x f x dx
1 1 0 1
1
0
1 1 1 0 0 1
i i iir r r r
f x dx
F r r F r r
Demand Curve Elements: Interface
1 1 1 1 1 0 1 1 1 0 0 1rp v F r r v F r r F r r
+
++
0
00
1 1 1F r r 1 1 1F r r
0l
1l

FTI Consulting, Inc. PRIORITIES FOR THE EVOLUTION OF AN ENERGY‐ONLY ELECTRICITY MARKET DESIGN IN ERCOT
Copyright © FTI Consulting, Inc., 2017 APPENDIX 105
Figure 32
Separable Demand Curve Approximation
In all cases, the price for reserves and the interface constraint are functions of all the reserve
components. Furthermore, the relationships are not separable. One implication is that the
scarcity prices are not simply additive, and the highest price in a region can never be higher
than the value of lost load for that region. However, unlike the case of a single regional ORDC,
the construction of the counterpart of k kR r requires more than simply integrating under the
prices along a single dimension.
A requirement to construct a counterpart of (1) is to have integrated functions 1 1ˆ , ,k oR r r r
such that at the optimal solution * * *0 1 1, ,r r r the derivatives equal the respective prices. For the
Mixed Demand Curve Elements
Path Dependent
Rest of System
0r 0y1 1 1, ,r r y
2 2 2, ,r r y
3 3 3, ,r r y4 4 4, ,r r y
0l
2l
1l
1 1 1 2F r r r
+
+
+
+
+++
0
0 0
0000
2 2 2F r r
2 2
1 1 2 2
2
2 2 21
r r
i i iir r r x
f x dx F r r
+
+
+
+
+++
0
0 0
0000
+
+
+
+
+++
0
0 0
0000
+
+
+
+
+++
0
0 0
0000
4l
3l
0
0 0
+
+ +
4 4 4F r r 4 4 4F r r
3 3 3 4F r r r 3 3 3 4F r r r
4 4
3 3 4 4
4
4 4 43
r r
i i iir r r x
f x dx F r r

FTI Consulting, Inc. PRIORITIES FOR THE EVOLUTION OF AN ENERGY‐ONLY ELECTRICITY MARKET DESIGN IN ERCOT
Copyright © FTI Consulting, Inc., 2017 APPENDIX 106
Zonal Interface Limit on Emergency Transfers
Zone 1Rest of System
Reserves 0r1r
Closed Interface Limit 1r
Reserves
0yNet Load Change 1yNet Load Change
single constrained zone and rest of the system, an example of a separable version of such a
function would be:
(16)
0
0
1
1
1
1
* *0 0 1 10
* *1 0 1 10
* *1 0 1 10
ˆ , ,
ˆ , ,
ˆ , ,
r
r
r
r
r
r
R r p r r r
R r p r r r
R r p r r r
.
Implementation of these approximations utilizes an estimate of a reasonable version of the
dispatch solution. The better the estimate, the better the approximation. Iteration on the
estimate could be combined with the dispatch search algorithm in a manner that would
implement the path model numerically without significant computation difficult. This iteration
with (16) would be a variant of the PIES method for non‐separable demand model and
computing equilibria (Ahn & Hogan, 1982).
An example illustrates the separable implementation of three locational reserve‐related
demand curves. The parameter assumptions and an assumed benchmark provide the
components for the approximation.
ROS Zone 1 Interface Benchmark (MW) 160.65 68.85 45.90
With these assumptions, we can use the normal approximation of the net load changes to
calculate the corresponding probabilities on each path and the resulting estimates of the
reserve‐related prices.
ROS Zone 1Expected Total (MW) 107.10 45.90Std Dev (MW) 488.99 209.57VOLL ($/MWh) 7000 10000

FTI Consulti
Copyright ©
For the p
The max
lost load
For the p
ng, Inc.
© FTI Consulting,
price in the c
rp
imal zonal p
and the loss
price of reser
PRIORITIE
, Inc., 2017
constrained z
1 1 11r v F
price in Figu
s of load pro
rves on the r
0rp
ES FOR THE EVOL
zone we hav
1 1 0r r v
F
re 33 is slig
obability.
rest of the sy
0 10 1
r rv F
LUTION OF AN E
ve:
1 1
01r r
F
Figure 33
ghtly over $6
ystem we ha
1 0 1 0F r r x
ENERGY‐ONLY EL
0 1 1r r x
6000/MWh,
ave:
0 0 0f x dx
LECTRICITY MAR
1 1 1f x dx
determined
0x
RKET DESIGN IN
APPENDI
d by the val
ERCOT
IX 107
ue of

FTI Consulti
Copyright ©
The max
the lowe
For the in
ng, Inc.
© FTI Consulting,
imal rest of
r value of lo
nterface con
PRIORITIE
, Inc., 2017
the system
ost load and t
nstraint, the
1 1 1rp v F
ES FOR THE EVOL
F
price in Fig
the loss of lo
price is:
1 1 1F r r
LUTION OF AN E
Figure 34
gure 34 is sli
oad probabi
0 0 01v F r
ENERGY‐ONLY EL
ightly over $
lity.
1 11r F
LECTRICITY MAR
$3500/MWh
1 1r r
RKET DESIGN IN
APPENDI
h, determine
ERCOT
IX 108
ed by

FTI Consulti
Copyright ©
The max
determin
Zonal Co
The zona
emergen
to chang
level.
For exam
as in Figu
ng, Inc.
© FTI Consulting,
ximal interf
ned by the d
ontingency R
al demand cu
ncy action su
ge the path
mple, the rev
ure 36.
PRIORITIE
, Inc., 2017
face capacit
ifferences in
Requirement
urves would
uch as a curt
probability
vised version
ES FOR THE EVOL
F
ty scarcity
n the values
ts
be modified
tailment of
calculation
n of the two
LUTION OF AN E
Figure 35
price in Fig
of lost load
d to include
load at the
to reflect t
critical path
ENERGY‐ONLY EL
gure 35 is
and the loss
minimum c
respective V
the effect o
h probabilitie
LECTRICITY MAR
slightly ov
s of load pro
ontingency
VOLL . The
f the minim
es in Figure
RKET DESIGN IN
APPENDI
ver $3000/M
obability.
requiremen
impact wou
mum conting
27 would ap
ERCOT
IX 109
MWh,
ts for
uld be
gency
ppear

FTI Consulti
Copyright ©
An exten
particula
loss of lo
there ar
protocol.
simple tr
Co‐Optim
The desi
version o
the objec
locationa
ng, Inc.
© FTI Consulting,
nsion to inclu
r, the simpl
oad inside t
e many em
. However,
ree structure
mization wit
ign of the O
of the dispat
ctive and ad
al transfer lim
PRIORITIE
, Inc., 2017
ude multiple
e paths in t
he constrain
mergency ste
if the admi
e and locatio
th the Locati
ORDC allow
tch co‐optim
dd a constra
mit. Hence,
ES FOR THE EVOL
F
e types of em
the various p
ned region
eps modele
nistrative re
onal operatin
ional Deman
ws for co‐op
mization prob
aint that cap
represent a
y
LUTION OF AN E
Figure 36
mergency ac
probability t
takes prece
ed, the opti
esponse dec
ng reserve d
nd Curves In
ptimization w
blem in (1) w
ptures the in
ggregate loa
0
1
yy
y
.
ENERGY‐ONLY EL
ctions would
trees arise b
edence over
imization as
cisions adhe
demand curv
nterface Con
with the en
would includ
nteraction of
ads as:
LECTRICITY MAR
d require fur
because of t
that outsid
ssumption m
re to this pr
ves should re
nstraint
nergy dispat
de these res
f energy and
RKET DESIGN IN
APPENDI
rther analys
the protocol
de the regio
might upset
rotocol, the
emain as we
tch. A mod
serve functio
d reserves i
ERCOT
IX 110
is. In
l that
on. If
t this
n the
ell.
dified
ons in
n the

FTI Consulting, Inc. PRIORITIES FOR THE EVOLUTION OF AN ENERGY‐ONLY ELECTRICITY MARKET DESIGN IN ERCOT
Copyright © FTI Consulting, Inc., 2017 APPENDIX 111
Let 1IntK be the total interface constraint. The net load demand inside the local constraint is
1ti y , and this must be met by ex‐ante dispatch of generation in the rest of the system. This
dispatch of energy utilizes part of the ex‐ante estimate of the interface capacity. That residual
1r is available for the transfer of reserves. Hence, the added constraint in the combined energy
and reserve dispatch would be:
1 1 1t
Inti y r K .
The result of co‐optimization of reserves and energy would induce scarcity prices for reserves
and the interface constraint that affect the locational price of energy.

FTI Consulting, Inc. PRIORITIES FOR THE EVOLUTION OF AN ENERGY‐ONLY ELECTRICITY MARKET DESIGN IN ERCOT
Copyright © FTI Consulting, Inc., 2017 REFERENCES 112
References
Ahn, B., & Hogan, W. W. (1982). On convergence of the PIES algorithm for computing equilibria. Operations Research, 30(2), 281–300. Retrieved from http://or.journal.informs.org/content/30/2/281.short
Bryant, M., Harvey, J., & Haas, J. (2016). Review of the Parameters of the Operating Reserve Demand Curve (April 7, 2016). Retrieved from http://interchange.puc.state.tx.us/WebApp/Interchange/Documents/45572_24_888862.PDF
Department of Energy. (2017). Transforming the Nation’S Electricity System: The Second Installment of the Quadrennial Energy Review. Retrieved from https://energy.gov/sites/prod/files/2017/01/f34/Transforming the Nation%27s Electricity System‐The Second Installment of the Quadrennial Energy Review‐‐ Full Report.pdf
ERCOT. (2014). About the Operating Reserve Demand Curve and Wholesale Electric Prices. ERCOT. Retrieved from http://www.ercot.com/content/news/presentations/2014/ORDCUpdate‐FINAL.pdf
ERCOT Staff, & Hogan, W. W. (2013). Back Cast of Interim Solution B + to Improve Real‐Time Scarcity Pricing White Paper. Retrieved from http://www.ercot.com/content/news/presentations/2013/White Paper ‐ Back Cast of Interim Solution B+ to Improve Re.pdf
Gribik, P. R., Hogan, W. W., & Pope, S. L. (2007). Market‐Clearing Electricity Prices and Energy Uplift. Retrieved from http://www.hks.harvard.edu/fs/whogan/Gribik_Hogan_Pope_Price_Uplift_123107.pdf
Hogan, W. W. (1992). Contract networks for electric power transmission. Journal of Regulatory Economics, 4(3), 211–242. Retrieved from http://ezp‐prod1.hul.harvard.edu/login?url=http://search.ebscohost.com/login.aspx?direct=true&db=bth&AN=16580807&site=ehost‐live&scope=site
Hogan, W. W. (2002). Electricity market restructuring: reforms of reforms. Journal of Regulatory Economics, 21(1), 103–132. Retrieved from http://ezp‐prod1.hul.harvard.edu/login?url=http://search.ebscohost.com/login.aspx?direct=true&db=bth&AN=17768581&site=ehost‐live&scope=site
Hogan, W. W. (2010). Scarcity Pricing and Locational Operating Reserve Demand Curves. Retrieved from http://www.hks.harvard.edu/fs/whogan/Hogan_FERC_060210.pdf
Hogan, W. W. (2011). Transmission benefits and cost allocation. Retrieved from http://www.hks.harvard.edu/hepg/Papers/2011/Hogan_Trans_Cost_053111.pdf
Hogan, W. W. (2013). Electricity Scarcity Pricing Through Operating Reserves. Economics of Energy & Environmental Policy, 2(2), 65–86. Retrieved from http://www.pserc.cornell.edu/empire/2_2_a04.pdf

FTI Consulting, Inc. PRIORITIES FOR THE EVOLUTION OF AN ENERGY‐ONLY ELECTRICITY MARKET DESIGN IN ERCOT
Copyright © FTI Consulting, Inc., 2017 REFERENCES 113
Hogan, W. W. (2014). Electricity Market Design and Efficient Pricing: Applications for New England and Beyond. The Electricity Journal, 27(7), 23–49. http://doi.org/10.1016/j.tej.2014.07.009
Hogan, W. W. (2016). Virtual bidding and electricity market design. The Electricity Journal, 29(5), 33–47. http://doi.org/10.1016/j.tej.2016.05.009
International Energy Agency. (2007). Tackling Investment Challenges in Power Generation in IEA Countries: Energy Market Experience. Paris. Retrieved from http://www.iea.org/publications/freepublications/publication/tackling_investment.pdf
Joskow, P. L. (2008). Capacity payments in imperfect electricity markets: Need and design. Utilities Policy, 16(3), 159–170. Retrieved from http://www.sciencedirect.com.ezp‐prod1.hul.harvard.edu/science/article/pii/S0957178707000926/pdf?md5=141854e71a805b11bea5d3510c9fbc6f&pid=1‐s2.0‐S0957178707000926‐main.pdf
Newell, S., Spees, K., Pfeifenberger, J. P., Mudge, R., DeLucia, M., & Carlton, R. (2012). ERCOT Investment Incentives and Resource Adequacy. Retrieved from http://www.ercot.com/content/news/presentations/2012/Brattle ERCOT Resource Adequacy Review ‐ 2012‐06‐01.pdf
NYISO. (2007). Order No. 890 Transmission Planning Compliance Filing. Retrieved from http://www.nyiso.com/public/webdocs/documents/regulatory/filings/2007/12/cover_ltr_order_890_transmission_planning_compliance_filing_.pdf
PJM. (2016). PJM Region Transmission Planning Process: Manual 14b (No. Revision 36). Retrieved from http://www.pjm.com/~/media/documents/manuals/m14b.ashx
Potomac Economics. (2011). 2010 State of the Market Report for the ERCOT Wholesale Electricity Markets. Retrieved from https://www.puc.texas.gov/industry/electric/reports/ERCOT_annual_reports/2010annualreport.pdf
PUCT. (2015). Scope of Competition in Electricity Markets in Texas. Retrieved from http://www.puc.texas.gov/industry/electric/reports/scope/2015/2015scope_elec.pdf
Supply Analysis Working Group. (2016). Discussion on ORDC Parameters. Retrieved from http://www.google.com/url?sa=t&rct=j&q=&esrc=s&source=web&cd=3&cad=rja&uact=8&ved=0ahUKEwjAwdjR6qHSAhWEaxQKHZYRDq4QFgghMAI&url=http%3A%2F%2Fwww.ercot.com%2Fcontent%2Fwcm%2Fkey_documents_lists%2F77646%2F07._SAWG_ORDC_Discussion__Analysis__and_Positions_1_6
i William W. Hogan is the Raymond Plank Professor of Global Energy Policy, John F. Kennedy School of Government, Harvard University. Susan Pope is Managing Director of FTI Consulting. This paper was supported by Calpine Corporation and NRG. Energy, Inc. This paper draws on research for the Harvard Electricity Policy Group and for the Harvard‐Japan Project on Energy

FTI Consulting, Inc. PRIORITIES FOR THE EVOLUTION OF AN ENERGY‐ONLY ELECTRICITY MARKET DESIGN IN ERCOT
Copyright © FTI Consulting, Inc., 2017 REFERENCES 114
and the Environment. The authors are or have been consultants on electric market reform and transmission issues for Allegheny Electric Global Market, American Electric Power, American National Power, Aquila, Atlantic Wind Connection, Australian Gas Light Company, Avista Corporation, Avista Utilities, Avista Energy, Barclays Bank PLC, Brazil Power Exchange Administrator (ASMAE), British National Grid Company, California Independent Energy Producers Association, California Independent System Operator, California Suppliers Group, Calpine Corporation, CAM Energy, Canadian Imperial Bank of Commerce, Centerpoint Energy, Central Maine Power Company, Chubu Electric Power Company, Citigroup, City Power Marketing LLC, Cobalt Capital Management LLC, Comision Reguladora De Energia (CRE, Mexico), Commonwealth Edison Company, COMPETE Coalition, Conectiv, Constellation Energy, Constellation Energy Commodities Group, Constellation Power Source, Coral Power, Credit First Suisse Boston, DC Energy, Detroit Edison Company, Deutsche Bank, Deutsche Bank Energy Trading LLC, Duquesne Light Company, Dyon LLC, Dynegy, Edison Electric Institute, Edison Mission Energy, Electricity Corporation of New Zealand, Electric Power Supply Association, El Paso Electric, Energy Endeavors LP, Exelon, Financial Marketers Coalition, FirstEnergy Corporation, FTI Consulting, GenOn Energy, GPU Inc. (and the Supporting Companies of PJM), GPU PowerNet Pty Ltd., GDF SUEZ Energy Resources NA, Great Bay Energy LLC, GWF Energy, Independent Energy Producers Assn, ISO New England, Koch Energy Trading, Inc., JP Morgan, LECG LLC, Luz del Sur, Maine Public Advocate, Maine Public Utilities Commission, Merrill Lynch, Midwest ISO, Mirant Corporation, MIT Grid Study, Monterey Enterprises LLC, MPS Merchant Services, Inc. (f/k/a Aquila Power Corporation), JP Morgan Ventures Energy Corp., Morgan Stanley Capital Group, Morrison & Foerster LLP, National Independent Energy Producers, New England Power Company, New York Independent System Operator, New York Power Pool, New York Utilities Collaborative, Niagara Mohawk Corporation, NRG Energy, Inc., Ontario Attorney General, Ontario IMO, Ontario Ministries of Energy and Infrastructure, Pepco, Pinpoint Power, PJM Office of Interconnection, PJM Power Provider (P3) Group, Powerex Corp., Powhatan Energy Fund LLC, PPL Corporation, PPL Montana LLC, PPL EnergyPlus LLC, Public Service Company of Colorado, Public Service Electric & Gas Company, Public Service New Mexico, PSEG Companies, Red Wolf Energy Trading, Reliant Energy, Rhode Island Public Utilities Commission, Round Rock Energy LP, San Diego Gas & Electric Company, Secretaría de Energía (SENER, Mexico), Sempra Energy, SESCO LLC, Shell Energy North America (U.S.) L.P., SPP, Texas Genco, Texas Utilities Co, Tokyo Electric Power Company, Toronto Dominion Bank, Transalta, TransAlta Energy Marketing (California), TransAlta Energy Marketing (U.S.) Inc., Transcanada, TransCanada Energy LTD., TransÉnergie, Transpower of New Zealand, Tucson Electric Power, Twin Cities Power LLC, Vitol Inc., Westbrook Power, Western Power Trading Forum, Williams Energy Group, Wisconsin Electric Power Company, and XO Energy. The views presented here are not necessarily attributable to any of those mentioned, and any remaining errors are solely the responsibility of the authors. (Related papers can be found on the web at www.whogan.com ). Thanks to Zachary Campbell and Jordan Girasole for their research support for this paper.