for the interim period ended june 30, 2011 management’s discussion and analysis · the following...
TRANSCRIPT

FOR THE INTERIM PERIOD ENDED JUNE 30, 2011 MANAGEMENT’S DISCUSSION AND ANALYSIS The following Management’s Discussion and Analysis (“MD&A”) of Parex Resources Inc. (“Parex” or the “Company”) is dated August 11, 2011 and should
be read in conjunction with the unaudited interim consolidated financial statements for the period ended June 30, 2011 and the MD&A and audited
consolidated financial statements for the year ended December 31, 2010. The unaudited interim consolidated financial statements have been prepared in
accordance with International Financial Reporting Standards (“IFRS”).
Additional information related to Parex is available in the Annual Information Form dated March 9, 2011 on the Canadian Securities Administrators’ website
at www.sedar.com.
All financial amounts are in United States (US) dollars unless otherwise stated.
Company Profile
Parex is an oil and gas exploration and production company currently active in the Llanos Basin of Colombia and onshore Trinidad & Tobago.
Headquartered in Calgary, Canada, Parex through its foreign subsidiaries holds interests in eight onshore exploration blocks totaling 817,113 gross
acres. The common shares of the Company trade on the Toronto Stock Exchange Venture (“TSX.V”) under the symbol PXT. The Company’s 5.25
percent convertible unsecured subordinated debentures (the “Debentures”) trade on the TSX-V under the symbol PXT.DB.
Change in Accounting Policies On January 1, 2011, Parex adopted IFRS for financial reporting purposes, using a transition date of January 1, 2010. The unaudited consolidated financial
statements for the period ended June 30, 2011, including required comparative information, have been prepared in accordance with IFRS 1, First-time
Adoption of International Financial Reporting Standards, and with International Accounting Standard (“IAS”) 34, Interim Financial Reporting, as issued by
the International Accounting Standards Board (“IASB”). Previously, the Company prepared its Interim and Annual Consolidated Financial Statements in
accordance with Canadian generally accepted accounting principles (“previous GAAP”). Unless otherwise noted, 2010 comparative information has been
prepared in accordance with IFRS. The adoption of IFRS has not had an impact on the Company’s operations, strategic decisions or funds flow from
operations.
Advisory on Forward-Looking Statements Certain information regarding Parex set forth in this MD&A, including assessments by the Company’s management of the Company’s plans and future
operations, contains forward-looking statements that involve substantial known and unknown risks and uncertainties. The use of any of the words “plan”,
“expect”, “forecast”, “project”, “intend”, “believe”, “anticipate”, “estimate” or other similar words, or statements that certain events or conditions “may” or
“will” occur are intended to identify forward-looking statements. Such statements represent the Company’s internal projections, estimates or beliefs
concerning, among other things, future growth, results of operations, production, future capital and other expenditures (including the amount, nature and
sources of funding thereof), competitive advantages, plans for and results of drilling activity, environmental matters, business prospects and opportunities.
These statements are only predictions and actual events or results may differ materially. Although the Company’s management believes that the expectations
reflected in the forward-looking statements are reasonable, it cannot guarantee future results, levels of activity, performance or achievement since such
expectations are inherently subject to significant business, economic, competitive, political and social uncertainties and contingencies. Many factors could

Parex Resources Inc. June 30, 2011
cause the Company’s actual results to differ materially from those expressed or implied in any forward-looking statements made by, or on behalf of, Parex. In
particular, forward-looking statements contained in this MD&A include, but are not limited to, statements with respect to: the performance characteristics of
the Company’s oil properties; supply and demand for oil; treatment under governmental regulatory regimes and tax laws; financial and business prospects and
financial outlook; results of operations, production, future costs, reserves and production estimates; drilling plans; activities to be undertaken in various areas
including the fulfillment of exploration commitments; timing of drilling, completion and tie-in of wells; tax horizon; access to infrastructure; timing of
development of undeveloped reserves; planned capital expenditures, the timing thereof and the method of funding; financial condition and access to capital. In
addition, statements relating to “reserves” or “resources” are by their nature forward-looking statements, as they involve the implied assessment, based on
certain estimates and assumptions that the resources and reserves described can be profitably produced in the future. The recovery and reserve estimates of
Parex’ reserves provided herein are estimates only and there is no guarantee that the estimated reserves will be recovered. As a consequence, actual results
may differ materially from those anticipated in the forward-looking statements
These forward-looking statements are subject to numerous risks and uncertainties, including but not limited to: the impact of general economic conditions in
Canada, Colombia and Trinidad & Tobago; industry conditions including changes in laws and regulations including adoption of new environmental laws and
regulations, and changes in how they are interpreted and enforced, in Canada, Colombia and Trinidad & Tobago; competition; lack of availability of qualified
personnel; the results of exploration and development drilling and related activities; partner approval of capital work programs and other matters requiring
approval; imprecision in reserve and resource estimates; the production and growth potential of Parex’ assets; obtaining required approvals of regulatory
authorities in Canada, Colombia and Trinidad & Tobago; risks associated with negotiating with foreign governments as well as country risk associated with
conducting international activities; volatility in market prices for oil and natural gas; fluctuations in foreign exchange or interest rates; environmental risks;
changes in income tax laws or changes in tax laws and incentive programs relating to the oil and natural gas industry; ability to access sufficient capital from
internal and external sources; the risks discussed under “Risk Factors” in the Company’s Annual Information Form dated March 9, 2011 and other factors,
many of which are beyond the control of the Company. Readers are cautioned that the foregoing list of factors is not exhaustive. Additional information on
these and other factors that could affect the Company’s operations and financial results are included in reports on file with Canadian securities regulatory
authorities and may be accessed through the SEDAR website (www.sedar.com).
Although the forward-looking statements contained in this MD&A are based upon assumptions which management believes to be reasonable, the Company
cannot assure investors that actual results will be consistent with these forward-looking statements. With respect to forward-looking statements contained in
this MD&A, Parex has made assumptions regarding: current commodity prices and royalty regimes; availability of skilled labour; timing and amount of
capital expenditures; uninterrupted access to infrastructure; future exchange rates; the price of oil and natural gas; the impact of increasing competition;
conditions in general economic and financial markets; availability of drilling and related equipment; effects of regulation by governmental agencies;
recoverability of the reserves; royalty rates, future operating costs, and other matters. The ability of the Company to carry out its business plan is primarily
dependent upon the continued support of its shareholders, the discovery of economically recoverable reserves and the ability of the Company to obtain
financing to develop such reserves.
Forward-looking statements and other information contained in this MD&A concerning the oil and natural gas industry in the countries in which it operates
and the Company's general expectations concerning this industry are based on estimates prepared by Management using data from publicly available industry
sources as well as from resource reports, market research and industry analysis and on assumptions based on data and knowledge of this industry which the
Company believes to be reasonable. However, this data is inherently imprecise, although generally indicative of relative market positions, market shares and
performance characteristics. While the Company is not aware of any material misstatements regarding any industry data presented herein, the oil and natural
gas industry involves numerous risks and uncertainties and is subject to change based on various factors.

Parex Resources Inc. June 30, 2011
Management has included the above summary of assumptions and risks related to forward-looking information provided in this MD&A in order to provide
shareholders with a more complete perspective on the Company’s current and future operations and such information may not be appropriate for other
purposes. The Company’s actual results, performance or achievement could differ materially from those expressed in, or implied by, these forward-looking
statements and, accordingly, no assurance can be given that any of the events anticipated by the forward-looking statements will transpire or occur, or if any
of them do, what benefits Parex will derive therefrom. These forward-looking statements are made as of the date of this MD&A and Parex disclaims any
intent or obligation to update publicly any forward-looking statements, whether as a result of new information, future events or results or otherwise, other than
as required by applicable securities laws.
Non-GAAP Terms Funds flow used in, or from operations, working capital, operating netback per barrel and total net debt may from time to time be used by the Company, but
do not have any standardized meaning under IFRS and Canadian GAAP and may not be comparable to similar measures presented by other companies. Funds
flow used in, or from operations includes all cash generated from operating activities and is calculated before changes in non-cash working capital. Funds
flow used in, or from operations is reconciled with net income (loss) in the Consolidated Statements of Cash Flows. Funds flow per share is calculated by
dividing funds flow used in, or from operations by the weighted average number of shares outstanding. Working capital includes current assets less current
liabilities. Operating netback per barrel equals sales revenue, less royalties, production expense and transportation expense, divided by total equivalent sales
volume. Total net debt is a non-GAAP measure defined as the sum of working capital less the convertible debentures (excluding the derivative financial
liability associated with the convertible debentures). Management uses these non-GAAP measures for its own performance measurement and to provide
shareholders and investors with additional measurements of the Company’s efficiency and its ability to fund a portion of its future growth expenditures.
Highlights
On June 29, 2011, Parex successfully closed the acquisition of Remora Energy Colombia Ltd. (“Remora”) a Company that holds the 50 percent
working interest Parex did not previously own in four Llanos Basin blocks in Colombia, including Block LLA-16 and the Kona light oil field, for
approximately $252.9 million in cash, net of the adjustments, (the “Acquisition”). The Acquisition was fully funded through a bought-deal public
offering of Cdn$217.4 million of subscription receipts and Cdn$85.0 million of 5.25 percent convertible unsecured subordinated debentures for
total combined gross proceeds of Cdn$302.4 million. Upon closing of the Acquisition each subscription receipt was automatically exchanged for
one Parex common share. The net proceeds received from the equity and the convertible debenture offering in excess of the purchase price were
retained in working capital;
For the three and the six months ended June 30, 2011, Parex’ production volumes averaged approximately 1,619 bbls/d and 1,441 bbls/d,
respectively, based upon net Company working interest before royalties, with sales volumes averaging approximately 1,125 bbls/d and 1,136
bbls/d, respectively. In July, 2011 Parex sold approximately 90,000 bbls of oil that had been delivered and injected into the Ocensa and the ODC
pipelines prior to June 30, 2011. Current production is approximately 7,010 bbls/d;
Realized sales price in Colombia was $104.67 per barrel generating an operating netback of $70.97 per barrel. Throughout the Second Quarter the
Company increased oil delivery under contracts with reference pricing to Colombian Vasconia Blend (which is highly correlated with Brent
benchmark pricing);
On Block LLA-16 in Colombia, during the three months ended June 30, 2011, the Company drilled three appraisal oil wells, Kona-4, Kona-5 and
Kona-6 and one water disposal well, Kona Norte-1, and commenced drilling a sidetrack at Kona-3;
The Company completed the construction of the Kona oil treatment facility on the Kona lease with a capacity of 30,000 barrels of fluid per day;
Parex signed the Los Ocarros Block farm-in and began drilling a Mirador Formation test, the Las Maracas-2 sidetrack well;
In Trinidad & Tobago, lease construction for the first of two shallow exploration wells on the Central Range Block, was completed. This well spud
early in the third quarter; and
Parex maintained a strong balance sheet with cash and cash equivalents of $115.5 million and working capital of $101.4 million at June 30, 2011.

Parex Resources Inc. June 30, 2011
For the three months
ended June 30 For the six months
ended June 30 (Financial figures in 000s except per share amounts) 2011 2010(1) 2011 2010(1) Average daily sales
Oil (bbls/d) (2)(3) 1,125 - 1,136 - Natural gas (boe/d) - 11 - 12 Total (boe/d) 1,125 11 1,136 12
Realized sales price ($/boe) 104.67 29.00 100.09 30.00 Operating netback ($/boe) 70.97 8.02 67.02 11.00 Oil and natural gas sales $ 10,719 $ 32 $ 20,572 $ 68
Net loss (4,688) (4,451) (3,665) (8,022)Per share – basic (0.06) (0.07) (0.05) (0.13)Per share – diluted (0.06) (0.07) (0.05) (0.13)
Funds flow from (used in) operations 334 (2,617) 3,294 (5,942)Per share – basic 0.00 (0.04) 0.04 (0,09)
Per share – diluted 0.00 (0.04) 0.04 (0,09) Total assets (end of period) 593,699 127,789 593,699 127,789 Working capital surplus (end of period) 101,422 72,883 101,422 72,883 Convertible debenture (end of period) 61,200 - 61,200 - Bank debt (end of period) - - - - Total net debt (surplus) (end of period) $ (40,222) $ (72,883) $ (40,222) $ (72,883)
Weighted average shares outstanding (000s)
Basic 77,317 63,870 77,316 63,870 Diluted 78,918 63,870 78,884 63,870
Outstanding shares (end of period) (000s) Basic 108,215 63,870 108,215 63,870 Diluted 113,783 67,857 113,783 67,857
(1) Natural gas sales were attributed to minor Canadian non-operated oil and natural gas properties which were sold in October 2010. (2) Includes Remora’s oil sales only from the date of the Acquisition, June 29, 2011. (3) Does not include approximately 90,000 bbls of oil delivered in the second quarter of 2011 and sold in July, 2011, see “Colombian Crude Oil Inventory in
Transit” below.
Description of Business
Strategy
The Company’s strategy is to leverage Latin American and Caribbean onshore experience and capability to create shareholder value. Jurisdictions will be
targeted that have stable fiscal regimes coupled with oil-prone hydrocarbon-rich basins in under-explored areas. Parex will apply proven technology used in
the Western Canada Sedimentary Basin in basins with large oil-in-place potential. The Company will focus on short cycle time from discovery to bringing
new reserves on-stream and use a portfolio approach to manage subsurface and commercial risks.
Principal Properties
As at June 30, 2011, the Company’s principal land holdings and exploration blocks were as follows: Working Interest Gross Acres Net Acres Colombia
Llanos Basin Blocks LLA-16, 20, 29,30 & 57(1)(4) 100% 593,665 593,665 Trinidad & Tobago
Central Range Blocks(2) 50% 211,478 105,739 Moruga Block(3) 50% 11,970 5,985
Total 817,113 705,389 (1) The initial exploration phase under the Company’s exploration and production (“E&P”) contracts is 36 months. Subsequent to this period, the Company has the
option to enter into a second 36-month exploration phase. The effective date of the Colombian contracts is April 20, 2009 for Blocks LLA-16 and LLA-20, October 20, 2009 for Blocks LLA-29 and LLA-30 and February 17, 2011 for Block LLA-57. Exploration property deemed non-commercial will be released in due course.
(2) Working interests noted are for the exploration phase of the Production Sharing Contracts (“PSCs”). The Petroleum Company of Trinidad & Tobago (“Petrotrin”) has the right to participate at a 35 percent working interest in any development on the Central Range Shallow Block and at a 20 percent interest in any development on the Central Range Deep Block. The initial exploration phase under the Company’s PSCs was 48 months. However, on August 9, 2010, the Ministry of Energy and Energy Affairs (“MEEA”) approved an extension of the first exploration phase to 60 months. The effective date of both Trinidad & Tobago Central Range Block PSCs is September 18, 2008. Exploration property deemed non-commercial will be released in due course.
(3) The Moruga Block is an exploration block with the final earning confirmed on April 27, 2011. (4) Does not include Los Ocarros Block in which the working interest was not earned as at June 30, 2011.
Parex Resources Inc. June 30, 2011
All of the Company’s properties in Colombia and Trinidad & Tobago are subject to exploration commitments for seismic and drilling activities as described
below.
a) Llanos Basin (LLA) Blocks (Colombia)
On June 29, 2011, the Company acquired the other 50 percent working interest Parex did not previously own in Blocks LLA-16, 20, 29 and 30, through the
acquisition of Remora. After closing the Acquisition, Parex holds a 100 percent working interest in the following exploration blocks in the Llanos Basin of
Colombia: Block LLA-16, Block LLA-20, Block LLA-29, Block LLA-30 and Block LLA-57. The E&P contracts consist of an initial exploration phase of 36
months with the option for the parties to enter into a second 36-month exploration phase. The exploration work commitments for the initial exploration phase,
before reduction for the work incurred to date, total $102.2 million to the Company representing 21 wells and 1,003 square kilometres (“km2”) of three-
dimensional (“3D”) seismic of which seven wells and 900 km2 of 3D seismic have been completed as at June 30, 2011.
On June 22, 2011, Parex signed a farm-in agreement with Petroamerica Oil Corp (“Petroamerica”) for the Los Ocarros Block, which is located directly south-
west of Block LLA-16. Parex will fund 100 percent of the drilling costs associated with the Las Maracas-2 sidetrack well to a maximum of $7.0 million.
Thereafter, Parex will pay 50 percent of the Las Maracas-2 sidetrack well drilling costs and 50 percent of any cost of completion. The well is currently drilling
to evaluate the Mirador Formation.
b) Central Range Blocks (Trinidad & Tobago)
Parex holds working interests in the Central Range Shallow and Central Range Deep Blocks located onshore Trinidad & Tobago. The blocks are subject to
PSCs that were signed on September 18, 2008. The Company is party to a joint venture agreement with Niko Resources Ltd. (formerly Voyager Energy Ltd.)
(“Niko”), and is the operator of the blocks. During the exploration phase of the PSCs, Parex and Niko will each hold a 50 percent working interest. Petrotrin
has the right to participate at a 35 percent working interest in any development on the Central Range Shallow Block and at a 20 percent working interest in
any development on the Central Range Deep Block. The PSCs provide for an initial exploration phase of 48 months. On August 9, 2010, the MEEA approved
an extension of the first exploration phase to 60 months or September 18, 2013.
The PSCs have minimum work commitments during the initial 60-month exploration phase of the contracts. The work commitments include 100 kilometres
of two-dimensional (“2D”) seismic, 168 km2 of 3D seismic, one deep well to be drilled to a minimum depth of 12,000 feet and two shallow wells to be drilled
to a maximum depth of 4,500 feet. Under the terms of the joint venture agreement with Niko, Parex will pay 100 percent of the first $10.0 million of seismic
acquisition costs during the exploration phase, of which approximately $8.5 million was incurred as at June 30, 2011. Petrotrin is carried through the
minimum work commitments of the contracts. As at June 30, 2011 the 2D seismic work obligation has been satisfied and the Company expects to drill the
two shallow exploration wells in the third quarter of 2011.
The Company currently has no oil and natural gas production or published oil and natural gas reserves for the Central Range Blocks.
c) Moruga Block (Trinidad & Tobago)
On September 16, 2009, Parex entered into an agreement with Primera Oil and Gas Limited and Primera Energy Resources Ltd. (together, "Primera") to farm-
in (the "Primera Farm-In") to the interests of these companies in the Moruga Block Exploration and Production Licence located in South Central Trinidad &
Tobago (the "Moruga Block"). The terms of the Primera Farm-In require Parex to drill one exploratory well to a depth of 8,600 feet or the top of the
Cretaceous, whichever occurs first, and one exploratory well to 10,500 feet. In connection with the Primera Farm-In, an application has been made for Parex
to become the operator of the Moruga Block. Parex will earn a 50 percent working interest in the Moruga Block by paying 95 percent of all costs, to a
maximum of $13.3 million for drilling and evaluating these two exploration wells. The Moruga Block encompasses 11,970 gross acres and targets oil-prone
prospects. On April 27, 2011, the Company received confirmation that Parex had fulfilled the initial earning requirement for the Moruga Block. However, the
assignment of interest earned under the Primera Farm-In and the transfer of operatorship are subject to final approval by the MEEA.
The Company currently has no oil and natural gas production or published oil and natural gas reserves for the Moruga Block.

Parex Resources Inc. June 30, 2011
2011 Outlook
Parex expects to exit 2011 with oil production in excess of 14,000 bbls/d. Parex’ 2011 capital budget is now approximately $140-$160 million, excluding the
purchase price of the Acquisition and including approximately $10 million contingent on mobilizing a rig and drilling a Central Range Deep Block well. The
2011 capital budget has increased from that noted in the previous MD&A as a result of now funding: 100 percent of LLA-16, 20, 29 and 30 blocks capital
activity, the Los Ocarros Block farm-in and increasing the number of Kona wells to be drilled in 2011 from six to nine. Parex expects to fund the 2011 capital
program from the existing working capital and funds flow from operations. Excluding the Acquisition purchase price and adjustments, the forecast capital
expenditures and forecast exit rate production are:
2011 Forecast
Capital ($ millions) 2011 Forecast
Exit Rate (bbls/d) Parex Guidance Pre-Acquisition April 15, 2011 95 – 105 > 7,000 Updated Guidance 140 – 160(1) > 14,000
(1) Reflects 100 percent of LLA-16, 20, 29 and 30 capital budgets from June 29, 2011.
Financial and Operational Results
Consolidated Results of Operations
Parex’ operations are carried out in Colombia, Trinidad & Tobago and Canada which are the Company’s reportable segments. The Company’s consolidated
results of operations provided in this MD&A include Remora’s operational results only from the date of the Acquisition, June 29, 2011.
For the three months
ended June 30 For the six months
ended June 30 2011 2010 2011 2010 Average daily sales
Colombia – oil (bbls/d)(1)(2) 1,125 - 1,136 - Canada – natural gas (boe/d) - 11 - 12 Total (boe/d) 1,125 11 1,136 12
Operating netback ($000s)
Oil and natural gas sales $ 10,719 $ 32 $ 20,572 $ 68 Royalties (1,195) - (1,877) - Net revenue 9,524 32 18,695 68 Production expense (817) (21) (1,235) (39)Transportation expense (1,439) - (3,684) - Operating netback $ 7,268 $ 11 $ 13,776 $ 29
Operating netback (per boe) Oil and natural gas sales 104.67 29.00 100.09 29.00 Royalties (11.67) - (9.13) - Net revenue 93.00 29.00 90.96 29.00 Production expense (7.97) (20.98) (6.01) (18.00)Transportation expense (14.06) - (17.93) - Operating netback $ 70.97 $ 8.02 $ 67.02 $ 11.00
(1) Does not include approximately 90,000 bbls of oil delivered in the second quarter of 2011 and sold in July, 2011. (2) Includes Remora’s oil sales only from the date of the Acquisition, June 29, 2011.
The Company’s operating netback on a per boe basis increased in the second quarter along with the increase in world oil prices and reduced transportation
expenses. The Company’s operating netback on a per boe basis for the three months ended June 30, 2011 was $70.97 compared to $63.10 reported for the first
quarter of 2011. Realized sales price in Colombia was $100.09/boe for the period with royalty charges of $9.13/boe based on produced oil. Royalties are
calculated by applying the royalty percentage on produced oil and are valued at the reference price net of transportation costs. Production expense for the
Company was $7.97/boe during the second quarter of 2011 compared to $4.06/boe reported for the first quarter of 2011. Transportation expense per boe for
the three months ended June 30, 2011was $14.06 compared to $21.77 for the first quarter of the year. On a combined basis, production expense and
transportation expense decreased by $3.80/boe compared to the three months ended March 31, 2011. Transportation and marketing alternatives continue to be
examined by the Company in an effort to maximize the net proceeds from monetizing production in Colombia. Comparative figures provided for the period
ended June 30, 2010 relate to the minor non-operated Canadian properties which were not significant to the Company’s historical operations and were sold in
October, 2010.

Parex Resources Inc. June 30, 2011
Colombian Oil Sales
For the three months
ended June 30 For the six months
ended June 30 2011 2010 2011 2010 Oil sales ($000s) $ 10,719 $ - $ 20,572 $ - Realized sales price ($/bbl) 104.67 - 100.09 -
Oil revenue was recognized in the first half of 2011 in contrast to the same period in 2010, given the initiation of production and sales in Colombia in the
latter part of 2010. Oil revenue excluded approximately 90,000 bbls of crude oil produced in the second quarter of 2011 and sold in July, 2011, see
“Colombian Crude Oil Inventory in Transit” below.
(a) Colombian Volumes
For the three months
ended June 30 For the six months
ended June 30 2011 2010 2011 2010 Average daily oil sales (bbls/d) – Kona Field 1,125 - 1,136 - Average daily oil production (bbls/d) – Kona Field 1,619 - 1,441 -
Production volumes for the three months ended June 30, 2011 averaged approximately 3,205 bbls/d (1,619 bbls/d net) which represents an increase of
approximately 29 percent compared to the first quarter of 2011. Sales volumes, during the second quarter of the year, averaged approximately 2,213 bbls/d
(1,125 bbls/d net). During the three months ended June 30, 2011, an average of approximately 454 bbls/d net was injected through the pipeline system and
transported to the Colombian coast to be exported. After the Acquisition on June 29, 2011, Parex took ownership of the other 50 percent of the oil in transit in
the pipeline system and, as a result, approximately 90,000 bbls of crude oil inventory in transit was recorded at the end of the second quarter. This oil was
subsequently sold in July, 2011.
(bbls) For the three months ended June 30, 2011 2010 Total gross oil production – Kona Field 291,000 - Total gross oil sales – Kona Field 201,000 - Crude oil inventory in transit 90,000 -
The Company reported no Colombian oil sales in the comparative period as Parex commenced oil production and sales in Colombia in the fourth quarter of
2010.
(b) Colombian Commodity Prices
For the three months
ended June 30 For the six months
ended June 30 2011 2010 2011 2010 WTI ($/bbl) (1) 102.56 - 98.33 - Vasconia ($/bbl) (1) (2) 110.84 - 107.86 - Realized sales price ($/bbl) 104.67 - 100.09 -
(1) Average prices for the three and six months ended June 30, 2011. (2) A medium heavy crude derived from a combination of light grades originally from the Llanos Orientales and Upper Magdalena Region. It is produced by different
streams that are blended at the Colombian Vasconia Station wherefrom it takes its name. Vasconia Blend prices are more correlated to Brent than WTI.
The majority of the Company’s oil sales contracts during the first half of 2011 were referenced to WTI with a minor portion of the oil sales during the latter
part of the second quarter priced in relation to the Colombian Vasconia blend. The Company’s average realized oil sales price for the three and six months
ended June 30, 2011 has increased along with the increase in world oil prices during the second quarter.

Parex Resources Inc. June 30, 2011
(c) Colombian Crude Oil Inventory in Transit
($000s) For the three and the six months ended June 30, 2011 2010 Crude oil in transit $ 3,141 $ -
As at June 30, 2011, the Company had approximately 90,000 bbls of crude oil inventory in transit which was injected into the Colombian Ocensa and ODC
pipelines. The cost, at which the inventory was valued, includes direct and indirect expenditures (such as production costs, transportation costs, and depletion
expense) of approximately $34.90 per barrel incurred in bringing the crude oil to its existing condition and location.
The oil inventory was subsequently sold in July, 2011 for approximately $9.0 million (net of transportation costs). This sale will generate an estimated $5.9
million ($0.07 per share on a fully diluted basis) of funds flow from operations to be recorded in the third quarter of 2011.
Colombian Royalties
For the three months
ended June 30 For the six months
ended June 30 2011 2010 2011 2010 Royalties ($000s) $ 1,195 $ - $ 1,877 $ - Per unit ($/bbl) $ 11.67 $ - $ 9.13 $ - Percentage of sales(1) 11% - 9% -
(1) Net of transportation costs
The Company’s Colombian government royalties are comprised of a fixed rate of 8 percent, supplemented with a 1 percent x-factor based upon the E&P
contract terms. Royalties are paid in kind and valued at the realized sales price less transportation expenses incurred. Should monthly average daily production
rates exceed 5,000 bbls/d, the Company’s royalty rates will increase by 1 percent for each incremental 10,000 bbls/d of production per field. In addition, as
accumulated production of any production area, inclusive of royalty volumes, exceeds 5 million barrels, and in the event international reference prices are
exceeded by pricing determined in the contract, the Company’s royalty percentage will increase to approximately 37 percent given current WTI prices.
Royalties expense of approximately $300,000 associated with the production of the oil inventory in transit was recognized in the second quarter of 2011. The
royalties as a percentage of sales were 11 percent versus 9 percent that would have been expected without the impact of the oil in transit inventory.
Colombian Production Expense
For the three months
ended June 30 For the six months
ended June 30 2011 2010 2011 2010 Production expense ($000s) $ 817 $ - $ 1,235 $ - Per unit ($/bbl) $ 7.97 $ - $ 6.01 $ -
Production expense includes the cost of activities in the field to operate wells and facilities, lift to surface, gather, process, treat and store production. The
second quarter cost per barrel of $7.97/bbl reflects the operating cost associated with having an average of three to four wells on production in the Kona field
during the three months ended June 30, 2011 and is reflective of the Company’s expectations for the balance of 2011.
Colombian Transportation Expense
For the three months
ended June 30 For the six months
ended June 30 2011 2010 2011 2010 Transportation expense ($000s) $ 1,439 $ - $ 3,684 $ - Per unit ($/bbl) $ 14.06 $ - $ 17.93 $ -
Transportation expense includes the trucking costs incurred by the Company to transport production to several offloading stations for sale and an oil
transportation tariff from delivery point to the buyer’s facility included as a discount in the marketing contract. During the second quarter, Parex decreased the
cost of transportation per barrel by approximately 30 percent due to better contract conditions in comparison to the first quarter of 2011. Parex expects similar
transportation costs on a per barrel basis for the balance of 2011.

Parex Resources Inc. June 30, 2011
General and Administrative Expense (“G&A”)
For the three months
ended June 30 For the six months
ended June 30 ($000s) 2011 2010 2011 2010 Gross G&A $ 5,950 $ 4,591 $ 11,878 $ 8,726 G&A recoveries (1,958) (1,105) (3,836) (1,467) Capitalized G&A (382) (864) (971) (980) Net G&A expense $ 3,610 $ 2,622 $ 7,071 $ 6,279
Net G&A was $7.1 million compared to $6.3 million for the six months ended June 30, 2011 and 2010 respectively. These costs primarily consist of
management and administrative salaries, legal and professional fees, office rent, insurance, travel and other administrative expenses. For the six months ended
June 30, 2011, net G&A was mainly comprised of $4.7 million relating to staff, consultants and professional services, $1.1 million relating to office costs and
various other expenses totaling $1.3 million. Net G&A expense for the period ended June 30, 2010 included $1.1 million relating to legal matters of a non-
recurring nature, with the remaining G&A expenses amounting to $5.2 million. The increase in recurring net G&A compared to the six months ended June 30,
2010 is mainly attributable to salaries and benefits for additional staff hired to support the increased activity of the Company’s operations. The Company
engages local in-country staff at the earliest opportunity and engages local professional services to improve execution and manage costs. A total of 86 full-
time-equivalents in three locations were working for Parex as at June 30, 2011 compared to 52 for the same period in 2010. Due to the Acquisition, joint
venture recoveries are expected to significantly decrease. Joint venture recoveries in Colombia totaled $1.9 million for the first six months of 2011. As capital
and operating activities increase it is expected that G&A will also increase primarily in Colombia and Trinidad & Tobago.
Share Based Compensation Expense
For the three months
ended June 30 For the six months
ended June 30 ($000s) 2011 2010 2011 2010 Stock options $ 1,335 $ 836 $ 2,709 $ 1,548 Share appreciation rights 227 62 707 62 Share-based compensation expense $ 1,562 $ 898 $ 3,416 $ 1,610
The Company calculates stock option expense using graded vesting. The determination of fair value for recording stock option expense is based upon
assumptions including stock volatility, a risk-free interest rate, an expected dividend rate and expected life of the options. The Company uses Black-Scholes
valuation methodology to value the stock options at the date of award. Stock options expense was $2.7 million for the six months ended June 30, 2011
compared to $1.5 million for the same period in 2010. The primary reason for the increase relates to the graded vesting recognition of a higher number of
options outstanding due to subsequent grants. As at June 30, 2011, stock options outstanding were 5,567,256, equaling 5 percent of the number of common
shares outstanding at the end of the second quarter. A total of 197,083 options were exercised and 225,000 options were granted during the six months ended
June 30, 2011. The weighted average fair value at the grant date of the options outstanding was Cdn$2.99 per option as at June 30, 2011 (period ended June
30, 2010 – Cdn$2.13 per option).
Parex Trinidad and Parex Colombia have a share appreciation rights (“SARs”) plan that provides for the issuance of SARs to certain employees. The
Company calculates SARs expense using graded vesting. The determination of fair value for recording SARs expense is based upon assumptions including
stock volatility, a risk-free interest rate, an expected dividend rate and expected life of the SARs. The Company uses Black-Scholes valuation methodology to
value SARs at the fair value each reporting date. As at June 30, 2011, 970,833 SARs were outstanding all of which were granted to employees in Colombia
and Trinidad & Tobago. The weighted average exercise price at June 30, 2011 of the SARs outstanding was Cdn$6.84 per SAR (period ended June 30, 2010 –
Cdn$5.25). The increase in SARs expense, when comparing the six months ended June 30, 2011 with the six months ended June 30, 2010, was due to the
initiation of a SARs plan for the Company during the second quarter of 2010 and graded vesting recognition of a higher number of SARs outstanding due to
subsequent grants.

Parex Resources Inc. June 30, 2011
Depletion, Depreciation and Accretion Expense (“DD&A”)
For the three months
ended June 30 For the six months
ended June 30 2011 2010 2011 2010 DD&A expense ($000s) $ 1,751 $ 483 $ 2,642 $ 759 Per unit ($/bbl) $ 17.10 $ - $ 12.85 $ -
DD&A is primarily associated with production assets in Colombia and also includes the depreciation and amortization of corporate assets such as computer
equipment, office furniture and leasehold improvements. The net carrying value of production assets is depleted using the unit of production method by
reference to the ratio of production in the period over the related proven and probable reserves while also taking into account estimated future development
costs necessary to bring those reserves into production. Second quarter 2011 DD&A was $1.8 million compared to $483,000 for the same period in 2010. The
increase relates to the Company depleting the development and production assets associated with the Kona field given the initiation of production from the
field in the latter part of 2010. Year to date depletion expense of $2.2 million ($10.76/bbl) attributable to the Kona field was recognized as at June 30, 2011.
The remaining DD&A relates to seismic equipment and office equipment which are depreciated over the assets estimated useful lives.
DD&A expense on a per barrel basis is expected to increase as a result of the Acquisition in Colombia.
Foreign Exchange Gain
For the three months
ended June 30 For the six months
ended June 30 2011 2010 2011 2010 Foreign exchange loss (gain) ($000s) $ 975 $ 545 $ (413) $ (441)
The Company’s main exposure to foreign currency risk relates to the pricing of foreign currency denominated in Canadian dollars, Colombian pesos and
Trinidad & Tobago dollars as the Company’s functional currency is the US dollar. The Company also has exposure in Canada, Colombia and Trinidad &
Tobago on costs, such as capital expenditures, local wages, royalties and income taxes, all of which may be denominated in local currencies. The Company
holds Canadian dollars and Canadian dollar-denominated short-term deposits to meet head-office general and administrative expenditures. All cash balances
in Colombia must be held in Colombian pesos due to local currency exchange requirements. During the six months ended June 30, 2011, the total foreign
exchange gain was $413,000 due primarily to the appreciation of the Colombian peso and the Canadian dollar versus the US dollar. The Trinidad & Tobago
dollar was relatively stable against the US dollar during the first half of 2011. Unrealized foreign exchange gains and losses may be reversed in the future as a
result of fluctuations in exchange rates and are recorded in the Company’s consolidated statement of operations.
The Company does not hedge against any fluctuations in exchange rates, but reviews its exposure to foreign currency variations on an ongoing basis and
maintains Canadian, Colombian and US denominated deposits.
Net Finance Expense
For the three months ended June 30,
For the six months ended June 30,
2011 2010 2011 2010 Interest expense on convertible debenture $ (552) $ - $ (552) $ - Accretion on convertible debenture (8) - (8) - Accretion on decommissioning liability (11) (1) (19) (2) Loss on derivative liability (1,048) - (1,048) - Amortization of debt issue costs (1) - (1) - Finance income 452 87 659 159 Net finance expense $ (1,168) $ 86 $ (969) $ 157
Derivatives are carried at fair value on the balance sheet, with any changes in fair value being recorded to the statement of operations. Under IFRS, the
conversion feature of the Debenture issued on June 29, 2011 is classified as a derivative financial liability given that, if converted, the Company has the
option to deliver either common shares or cash equal to the market value. As the Company’s stock price increased since issuance, the derivative liability
increased by $1.0 million and an equivalent non cash derivative loss was recorded.

Parex Resources Inc. June 30, 2011
The liability portion of the Debentures is measured at amortized cost and will accrete up to the principal balance at maturity using the effective interest rate
method. The resulting accretion on convertible debenture is charged to finance expense in the consolidated statement of comprehensive loss.
Income Tax
For the six months
ended June 30 ($000s) 2011 2010 Colombia current tax expense $ 1,436 $ - Colombia equity tax 424 - Colombia deferred tax expense 50 - Trinidad & Tobago - - Canada and other foreign subsidiaries - - Income and equity tax expense $ 1,910 $ -
As at June 30, 2011, the Company recognized a current tax expense of $1.4 million which is based on the Company’s expectations of taxable income for
2011. Also, $50,000 of future tax expense was recognized for its Colombian temporary tax differences that were mostly associated with capital assets. The
Company does not recognize any benefit for its Canadian tax losses nor its Trinidad & Tobago net operating losses at this time.
Parex’ Colombian subsidiary was subject to a one-time tax which was calculated based on the subsidiary’s net taxable equity as at January 1, 2011 at a rate of
6 percent. The equity tax is payable over four years (1.5 percent per year) in eight equal installments every May and September starting in 2011. A total of
$328,000 was paid in May, 2011 for the first installment. An equity tax provision of $2.3 million, to be paid over the remaining seven installments, has been
accrued, of which $657,000 is due within one year. The equity tax accrual includes $424,000 of under accrued equity tax expense that was recognized in the
second quarter of 2011.
Capital Expenditures (Excluding Corporate Acquisition costs)
For the six months ended June 30 Colombia
Trinidad & Tobago
Canada Total ($000s) 2011 2010 2011 2010 2011 2010 2011 2010 Geological and geophysical $ 1,956 $ 4,058 $ 132 $ 570 $ - $ - $ 2,088 $ 4,628 Acquisition of unproved properties
1,204 4 260 409 - - 1,464 413
Drilling and completion 27,215 4,648 3,923 6869 - - 31,138 11,517 Well equipment and facilities 6,053 - 600 324 - - 6,653 324 Other 62 32 12 131 64 62 138 225 $ 36,490 $ 8,742 $ 4,927 $ 8,303 $ 64 $ 62 $ 41,481 $ 17,107
For the three months ended June 30 Colombia
Trinidad & Tobago
Canada Total ($000s) 2011 2010 2011 2010 2011 2010 2011 2010 Geological and geophysical $ 1,931 $ 2,005 $ 139 $ 87 $ - $ - $ 2,070 $ 2,092 Acquisition of unproved properties
1,018 1 131 330 - - 1,149 331
Drilling and completion 13,694 2,116 881 5,509 - - 14,575 7,625 Well equipment and facilities 5,084 - 376 324 - - 5,460 324 Other 37 12 12 44 26 44 75 100 $ 21,764 $ 4,134 $ 1,539 $ 6,294 $ 26 $ 44 $ 23,329 $ 10,472
During the six months ended June 30, 2011, the Company incurred $41.5 million of capital expenditures compared to $17.1 million in 2010. Increased capital
spending is integral to the Company’s growth strategy. The activity by country is described below:
Colombia Capital Expenditures Summary
During the second quarter of 2011, in Block LLA-16, the Company drilled 4 gross (4 net) wells (including a water disposal well) and spud 1 gross (1 net)
well, and commenced the lease construction of the next exploration prospects, Sulawesi, Merida and Java. The Company also completed the construction of
the Kona field oil treatment facility.

Parex Resources Inc. June 30, 2011
The following table summarizes the Company’s activities in Colombia from inception to June 30, 2011:
LLA-16 LLA-20 LLA-29 LLA-30 Total Km2 of 3D seismic acquired 319 254 195 180 948 Wells drilled 10 2 - - 12 Wells in progress at the end of the period 1 - - - 1
Capital expenditures for the three months ended June 30, 2010 primarily relate to 3D seismic acquisition and exploration drilling.
2011 Colombian Operations and Exploration Update
On April 17, 2011 the Kona-6 well on Block LLA-16 was spud and completed drilling in 19 days. Kona-6, located between Kona-1 and Kona-2, was drilled
to evaluate the C7 Formation. An excellent cement bond in the well allowed for testing multiple objectives in the C7 Formation. Oil was tested from the two
secondary objectives in the lower C7 at rates of 530 bbls/d and 190 bbls/d, respectively, without pumping prior to moving uphole to the primary objective. On
June 9, 2011, the primary objective in the Upper C7 was tested. Following the installation of an electric submersible pump (“ESP”), the well has produced,
since June 14, 2011, at an average rate of 2,810 bbls/d (30° API oil) at less than 3 percent water-cut from the Upper C7 Formation. The Kona-6 well was
drilled, cased and completed under a simpler well program that will be implemented going-forward for all development wells.
On April 19, 2011, the Kona-2 well began producing from the Gacheta Formation on natural flow at a rate of 2,634 bbls/d and experienced above average
production decline due to a poor completion. On June 15, 2011, the Kona-2 well was shut-in to commence a cement remediation operation to attempt to
properly isolate the oil pay section from the underlying wet reservoirs. The well was remediated and was brought on-stream in July, 2011 at an initial rate of
approximately 1,600 bbls/d.
The Kona-3 well was drilled in January 2011 and was designed to evaluate the northern extent of the Kona field. Both the C7 and Mirador formations tested
oil with high water production. During cementing operations, mechanical problems resulted in sub-optimal cement placement. As a result, Parex believes that
the prospective oil pay sections were not isolated from the underlying wet reservoirs. On June 18, 2011, a drilling rig re-entered the Kona-3 well to start side-
tracking operations to re-set and cement a new liner across the C7 and Mirador formations of the well. The side-track operation was successful in the target
formations, however, prior to setting a production liner, the whipstock tool failed and, as a result, the well could not be cased for production. A new side-track
operation has been commenced in the third quarter of 2011.
On May 24, 2011, the Kona-5 well was spud to evaluate the C7 and Mirador formations as a twin development well to Kona-4 well which showed formation
damage due to mechanical problems during cementing operations. Kona-5 was brought on stream in July, 2011 at a rate of 800 bbls/d in the Mirador
Formation.
The next three exploration prospects the Company plans to drill on Block LLA-16 are Sulawesi, Merida and Java. Drilling depths for these exploration wells
range from 11,000 feet to 13,000 feet. Subsequent to second quarter of 2011, the Sulawesi-1 was spud on July 16, 2011 and cased to a total depth of
approximately 12,000 feet. On Block LLA-20, the Company is working to spud its Cumbre exploration well in 2011. At the close of the Acquisition, Parex assumed operatorship on blocks LLA-29 and LLA-30. Parex has identified prospects and begun the regulatory process
to allow for civil work and drilling to commence during early 2012. Parex has initiated additional 3D seismic programs that will cover 75 km2 on Block LLA-
16, 135 km2 on Block LLA-20, and 165 km2 on Block LLA-57. These seismic programs are expected to be completed by year-end 2011.
On June 22, 2011, Parex signed a farm-in agreement with Petroamerica for the Los Ocarros Block, which is located directly south-west of Block LLA-16.
Parex will fund 100 percent of the drilling costs associated with the Las Maracas-2 sidetrack well to a maximum of $7.0 million. Thereafter, Parex will pay 50
percent of the Las Maracas-2 sidetrack well drilling costs and 50 percent of any cost of completion. The well is currently drilling to evaluate the Mirador
Formation.
Colombian Llanos Basin Acquisition
On June 29, 2011, Parex acquired Remora which held the 50 percent interest Parex did not previously own in four Llanos Basin blocks in Colombia, including
Block LLA-16 and the Kona discovery. The Acquisition was funded through a bought-deal public offering of Cdn$217.4 million of subscription receipts and
Cdn$85.0 million of convertible unsecured subordinated debentures. With the close of the Acquisition Parex has increased its working interest from 50 percent to
Parex Resources Inc. June 30, 2011
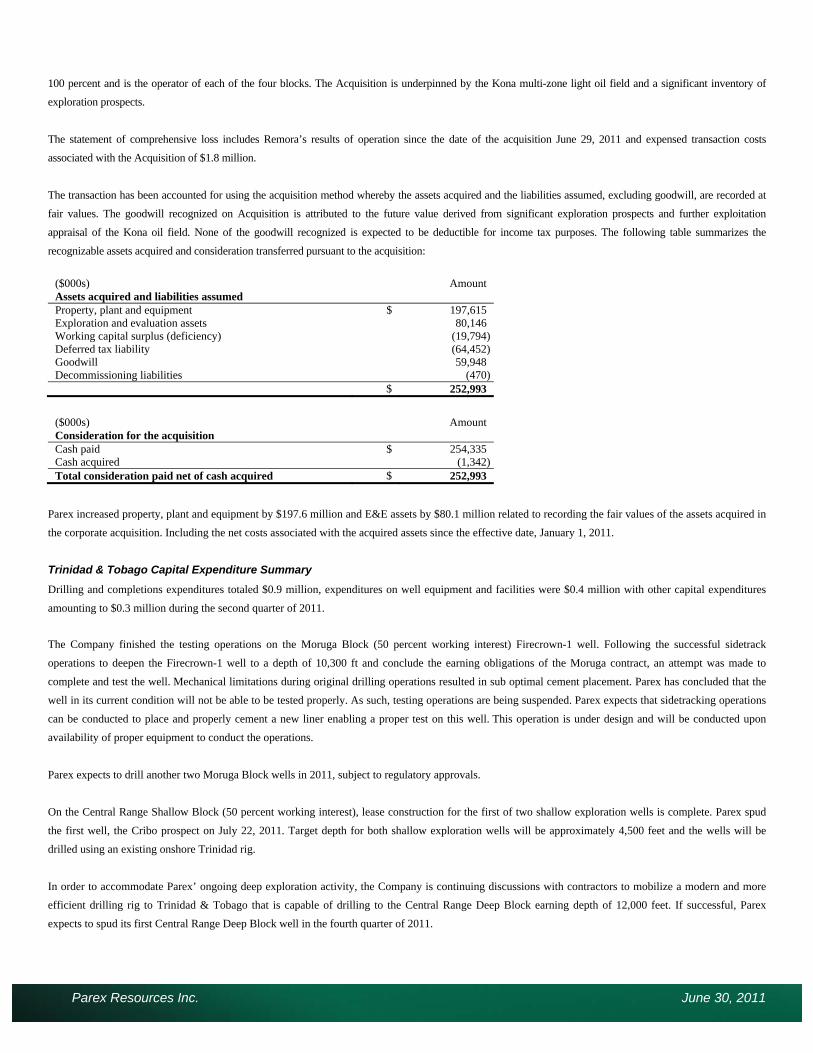
100 percent and is the operator of each of the four blocks. The Acquisition is underpinned by the Kona multi-zone light oil field and a significant inventory of
exploration prospects.
The statement of comprehensive loss includes Remora’s results of operation since the date of the acquisition June 29, 2011 and expensed transaction costs
associated with the Acquisition of $1.8 million.
The transaction has been accounted for using the acquisition method whereby the assets acquired and the liabilities assumed, excluding goodwill, are recorded at
fair values. The goodwill recognized on Acquisition is attributed to the future value derived from significant exploration prospects and further exploitation
appraisal of the Kona oil field. None of the goodwill recognized is expected to be deductible for income tax purposes. The following table summarizes the
recognizable assets acquired and consideration transferred pursuant to the acquisition:
($000s) Amount Assets acquired and liabilities assumed Property, plant and equipment $ 197,615 Exploration and evaluation assets 80,146 Working capital surplus (deficiency) (19,794)Deferred tax liability (64,452)Goodwill 59,948 Decommissioning liabilities (470) $ 252,993
($000s) Amount Consideration for the acquisition Cash paid $ 254,335 Cash acquired (1,342)Total consideration paid net of cash acquired $ 252,993
Parex increased property, plant and equipment by $197.6 million and E&E assets by $80.1 million related to recording the fair values of the assets acquired in
the corporate acquisition. Including the net costs associated with the acquired assets since the effective date, January 1, 2011.
Trinidad & Tobago Capital Expenditure Summary
Drilling and completions expenditures totaled $0.9 million, expenditures on well equipment and facilities were $0.4 million with other capital expenditures
amounting to $0.3 million during the second quarter of 2011.
The Company finished the testing operations on the Moruga Block (50 percent working interest) Firecrown-1 well. Following the successful sidetrack
operations to deepen the Firecrown-1 well to a depth of 10,300 ft and conclude the earning obligations of the Moruga contract, an attempt was made to
complete and test the well. Mechanical limitations during original drilling operations resulted in sub optimal cement placement. Parex has concluded that the
well in its current condition will not be able to be tested properly. As such, testing operations are being suspended. Parex expects that sidetracking operations
can be conducted to place and properly cement a new liner enabling a proper test on this well. This operation is under design and will be conducted upon
availability of proper equipment to conduct the operations.
Parex expects to drill another two Moruga Block wells in 2011, subject to regulatory approvals.
On the Central Range Shallow Block (50 percent working interest), lease construction for the first of two shallow exploration wells is complete. Parex spud
the first well, the Cribo prospect on July 22, 2011. Target depth for both shallow exploration wells will be approximately 4,500 feet and the wells will be
drilled using an existing onshore Trinidad rig.
In order to accommodate Parex’ ongoing deep exploration activity, the Company is continuing discussions with contractors to mobilize a modern and more
efficient drilling rig to Trinidad & Tobago that is capable of drilling to the Central Range Deep Block earning depth of 12,000 feet. If successful, Parex
expects to spud its first Central Range Deep Block well in the fourth quarter of 2011.

Parex Resources Inc. June 30, 2011
Capital expenditures for the period ended June 30, 2010 primarily relate to costs associated with the lease construction for the exploratory wells on the
Morgua Block.
Summary of Quarterly Results (Unaudited)
Three months ended
June 30,
2011
Mar.31,
2011
Dec. 31,
2010
Sep.30,
2010 Average daily sales (boe/d) 1,125 1,136 306 11 - Realized sales price ($/boe) 104.67 95.54 89.69 25.00 Financial ($000s except per share amounts)
Net income (loss) $ (4,688) $ 1,023 $ (1,298) $ (4,297)Per share – basic (0.06) 0.01 (0.02) (0.07)Per share – diluted (0.06) 0.01 (0.02) (0.07)
Funds flow from (used in) operations 334 2,960 360 (3,555)Per share – basic 0.00 0.04 0.01 (0.06)Per share – diluted 0.00 0.04 0.01 (0.06)
Total assets (end of period) 593,699 220,521 216,616 128,503 Working capital surplus (end of period) 101,422 101,672 115,136 57,188 Convertible debenture (end of period) 61,200 - - - Bank debt (end of period) - - - - Total net debt (surplus) (end of period) $ (40,222) $ (101,672) $ (115,136) $ (57,188)
Previous GAAP(1)
Three months ended
June 30,
2010
Mar. 31,
2010
Dec. 31,
2009(2)
Sep. 30,
2009(2)
Average daily sales (boe/d) (3) 11 14 6 -
Realized sales price ($/boe) (3) 29.00 29.72 25.93 -
Financial ($000s except per share amounts) Net loss $ (4,451) $ (3,571) $ (2,316) $ (1,445)
Per share – basic (0.07) (0.06) (0.04) (0.03)Per share – diluted (0.07) (0.06) (0.04) (0.03)
Funds flow used in operations (2,617) (3,325) (1,569) (1,393)Per share – basic (0.04) (0.05) (0.03) (0.03)Per share – diluted (0.04) (0.05) (0.03) (0.03)
Total assets (end of period) 127,789 128,164 133,485 46,147 Working capital surplus (end of period) 72,883 86,487 95,704 15,986 Convertible debenture (end of period) - - - - Bank debt (end of period) - - - - Total net debt (surplus) (end of period) $ (72,883) $ (86,487) $ (95,704) $ (15,986)(1) As Parex’ IFRS transition date was January 1, 2010, 2009 comparatives figures have not been restated. (2) Determined by using continuity-of-interests accounting (EIC-89) for the 2009 comparative periods. (3) Sales were generated by the minor non-operated Canadian properties that were transferred from Petro Andina to Parex through the Plan of Arrangement
on November 6, 2009 and were sold in October, 2010 (see AIF dated March 9, 2011).
Liquidity and Capital Resources
As at June 30, 2011 Parex held $115.5 million of cash, compared to $123.5 million at December 31, 2010. The Company’s cash balances reside in current
accounts and term deposits, the majority of which are held on account in Canada.
As at June 30, 2011, working capital was $101.4 million with no bank debt. Parex has signed a general security agreement with Export Development Canada
(“EDC”) to secure the guarantees provided by EDC to support the letters of credit issued to the ANH in connection with the initial exploration work
commitments associated with the Company’s Colombian properties.

Parex Resources Inc. June 30, 2011
Parex has estimated exploration and other commitments over the next two years of approximately $19.0 million in Trinidad & Tobago and approximately
$54.1 million in Colombia. Parex has sufficient financial resources to fund all of its work commitments and other discretionary future capital costs based upon
the Company’s current working capital position and estimated 2011 funds flow from operations.
Convertible Debenture On June 29, 2011, Parex issued Cdn$85.0 million of convertible unsecured subordinated debentures with an annual coupon of 5.25 percent maturing on June
30, 2016. The Debentures have a face value of $1,000 per Debenture, are convertible into Common Shares at the option of the holder at a conversion price of
Cdn$10.15 per Common Share, representing a conversion rate of approximately 98.52 Common Shares per Debenture. The Debentures pay interest semi-
annually in arrears on June 30 and December 31 of each year, commencing on December 31, 2011. In the event that a holder of Debentures exercises the
conversion feature, such holder shall be entitled to receive accrued and unpaid interest, in addition to the applicable number of Common Shares to be received
on conversion, for the period from the latest interest payment date to the date of conversion.
The Debentures were split between the liability and the equity conversion feature (which is classified as a derivative financial liability under IFRS). The
amount of the financial liability was determined by subtracting issuance costs and the fair value of the conversion feature from the principal amount of the
Debentures. As at June 29, 2011, the $87.5 million (Cdn$85.0 million) gross issuance proceeds resulted in $64.3 million (Cdn$62.4 million) being classified
as a liability and $23.3 million (Cdn$22.6 million) being classified as a derivative financial liability. The fair value of the conversion feature is estimated
every balance sheet date with changes in the fair value estimate between periods recognized in the statement of comprehensive income (loss) as finance
expense.
Outstanding Share Data
Parex is authorized to issue an unlimited number of voting common shares without nominal or par value. As at June 30, 2011 the Company had 108,215,368
common shares outstanding.
The Company has a stock option plan. The plan provides for the issuance of options to the Company’s directors, officers, employees and consultants to
acquire common shares. The maximum number of options reserved for issuance under the stock option plan may not exceed 10 percent of the number of
common shares issued and outstanding.
As at August 11, 2011 Parex has the following securities outstanding:
Number % Common shares 108,215,368 95 Stock options 5,504,756 5 Fully diluted 113,720,124 100
As of the date of this MD&A, total stock options outstanding represent approximately 5 percent of the total issued and outstanding common shares.
Contractual Obligations, Commitments and Guarantees
In the normal course of business, Parex has entered into arrangements and incurred obligations that will impact the Company’s future operations and liquidity.
These commitments primarily relate to exploration work commitments including seismic and drilling activities. The Company has discretion regarding the
timing of capital spending for exploration work commitments, provided that the work is completed by the end of the exploration periods specified in the
contracts. The Company’s exploration commitments are described under “Description of Business – Principal Properties”. These obligations and
commitments are considered in assessing cash requirements in the discussion of future liquidity.
In Colombia, the Company has provided guarantees to the ANH totaling approximately $50.0 million to support the initial exploration work commitments in
respect of the five blocks. The guarantees have been provided in the form of letters of credit for 24-month terms expiring in January, 2013 for Block LLA-16
and Block LLA-20, May 2013 for Block LLA-29 and Block LLA-30 and September, 2014 for Block LLA-57. EDC has provided the Company’s bank with

Parex Resources Inc. June 30, 2011
performance security guarantees to support 100 percent of the letters of credit issued on behalf of Parex. The letters of credit issued to the ANH have not been
reduced to reflect work performed to date.
In Trinidad & Tobago, the Company has purchased a performance bond and provided a guarantee to the underwriters of the bond in the amount of
approximately $33.0 million to cover its and Niko’s share of the financial guarantees required under the Central Range Block PSCs for the initial four-year
exploration phase. In the event of default by Niko, the joint venture agreement provides that Niko’s working interest shall vest in Parex. The obligations under
the PSCs are to perform the exploration work commitments, irrespective of actual cost. Parex has no obligation to spend the actual amount guaranteed. The
amount of the bond has not been reduced to reflect work performed to date.
The following table and footnotes summarize the Company’s estimated commitments as at June 30, 2011:
($000s) Total <1 year 1-3 years 3-4 years >5 years Exploration(1) $ 70,956 $ 48,752 $ 22,204 $ - $ - Office and accommodations(2) 2,633 1,048 1,155 430 - Other 2,173 1,150 1,023 - - Total $ 75,762 $ 50,950 $ 24,382 $ 430 $ -
(1) Exploration commitments do not include production bonuses and other payments that will vary depending on production levels due to the uncertainty of their amount and timing.
(2) Includes minimum lease payment obligations associated with leases for office space and accommodations.
The Company has entered into contracts for drilling rigs in Colombia and Trinidad & Tobago. Rig contracts in both countries include commitments to use the
rigs for a minimum period on terms consistent with normal industry practice. The Company anticipates that, given its planned level of drilling activity to meet
exploration commitments in both countries, the rigs will be fully utilized for the duration of their contracts and no material additional charges will be incurred.
Business Environment and Risks
Parex is exposed to a variety of risks including, but not limited to, operational, financial, competitive, political and environmental risks. As a participant in the
oil and natural gas industry, Parex is exposed to operational risks such as: unsuccessful exploration and exploitation activities, the inability to find new
reserves that are commercially and economically feasible, premature declines of reservoirs, blow-outs and other operating hazards, and lack of infrastructure
or transportation to access markets and monetize reserves. The Company works to mitigate these risks by employing highly skilled personnel and utilizing
available technology. The Company also maintains a corporate insurance program consistent with industry practices to protect against insurable losses.
The Company is exposed to normal financial risks inherent in the oil and natural gas industry including: commodity price risk, exchange rate risk, interest rate
risk and credit risk. From time to time, the Company may have to raise additional funds to finance business development activities. However, depending on
market conditions at the time, there can be no assurance that the Company will be able to arrange debt or equity financing on satisfactory terms. The
Company continuously monitors opportunities to use financial instruments to manage exposure to fluctuations in commodity prices, foreign currency rates
and interest rates. Parex operates the majority of its properties and, therefore, has significant control over the timing, direction and costs related to exploration
commitments and development opportunities.
The oil and natural gas industry is intensely competitive, with Parex competing against companies that may have greater technical and financial resources.
There is competition for new exploration and development properties, for drilling and other specialized technical equipment and for experienced key human
resources. To the extent possible, Parex seeks to enter into joint venture arrangements with large and/or experienced industry players in each country to
improve its access to resources.
Parex is focused on international oil and natural gas activities, currently with interests in Colombia and Trinidad & Tobago. As such, the Company is subject
to political risks such as: changes in policy environments related to changes in government, price controls, renegotiation of land tenure agreements,
nationalization, changes in tax regulations, amendments or changes to legal systems, complex regulatory regimes and foreign language risks. The Company
focuses its foreign operations in countries where management has prior experience and/or engages local in-country staff as soon as possible. The Company
engages local, Canadian and international legal, accounting and tax professionals. The Company may also, from time to time, arrange for insurance to
mitigate specific risks.

Parex Resources Inc. June 30, 2011
The oil and natural gas industry is subject to extensive and varying environmental regulations imposed by governments in all countries in which Parex
operates. The Company adopts prudent and industry-recommended field operating procedures in all of its operations, as well as maintaining a health, safety
and environment program.
The Company is exposed to a high level of exploration risk. The Company’s current and future (to the extent discovered or acquired) proved reserves will
decline as reserves are produced from its properties unless the Company is able to acquire or develop new reserves. The business of exploring for, developing
or acquiring reserves is capital-intensive and is subject to numerous estimates and interpretations of geological and geophysical data. There can be no
assurance the Company’s future exploration, development and acquisition activities will result in material additions of proved reserves. To manage this risk,
to the extent possible, Parex employs highly experienced geologists and geophysicists, uses technology such as 3D seismic as a primary exploration tool and
focuses exploration efforts in known hydrocarbon-producing basins. In addition, the Company takes a portfolio approach to exploration drilling by having
drilling locations spread out among different exploration blocks and geological basins and by targeting multiple play-types.
Off-Balance-Sheet Arrangements
The Company did not enter into any off-balance-sheet arrangements during the three months ended June 30, 2011.
Financial Instruments and Other Instruments
The Company’s non-derivative financial instruments recognized in the balance sheet include cash and cash equivalents, accounts receivable, accounts payable
and accrued liabilities and convertible debentures (excluding the derivative financial liability associated with the convertible debentures). Non-derivative
financial instruments are recognized initially at fair value. The fair values of the current financial instruments approximate their carrying value due to their
short-term maturity.
Accounting Policies and Estimates
Adoption of International Financial Reporting Standards
The Company has prepared its unaudited consolidated financial statements for the three months ended June 30, 2011, including required comparative
information, in accordance with IFRS 1, First-time Adoption of IFRS, and with IAS 34, Interim Financial Reporting, as issued by the IASB. Previously, the
Company prepared its Interim and Annual Consolidated Financial Statements in accordance with Canadian GAAP. The adoption of IFRS has not had an
impact on the Company’s operations, strategic decisions and funds flow from operations.
The Company’s IFRS accounting policies are provided in Note 3 to the Interim unaudited consolidated financial statements for the period ended June 30,
2011 and, in addition, Note 21 presents reconciliations between the Company’s 2010 previous GAAP results and the 2010 IFRS results.
The following provides summary reconciliations of Parex’ 2010 previous GAAP and IFRS results, along with a discussion of the significant IFRS accounting
policy changes.
Summary Net Losses Reconciliation
2010
($000s) Annual Q4 Q3 Q2 Q1 Net losses – previous GAAP $ (13,385) $ (1,285) $ (4,140) $ (4,389) $ (3,571) After tax (addition)/deduction:
Exploration and evaluation expense (37) (37) - - - Depletion, depreciation and amortization 135 135 - - - Share based compensation – SARs (244) (25) (157) (62) -
(146) 73 (157) (62) - Net losses – IFRS $ (13,531) $ (1,212) $ (4,297) $ (4,451) $ (3,571)

Parex Resources Inc. June 30, 2011
Accounting Policies Changes
The following discussion explains the significant differences between Parex’ previous Canadian GAAP accounting policies and those applied by the
Company under IFRS. IFRS policies have been retrospectively and consistently applied except where specific IFRS 1 optional and mandatory exemptions
permitted an alternative treatment upon transition to IFRS for first-time adopters.
The most significant changes to the Company's accounting policies relate to the accounting for upstream costs. Under previous GAAP, the Company followed
the Canadian Institute of Chartered Accountants (“CICA”) guideline on full cost accounting in which all costs directly associated with the acquisition of, the
exploration for, and the development of oil and natural gas reserves were capitalized on a country-by-country cost centre basis. Costs accumulated within each
country cost centre were depleted using the unit-of-production method based on proved reserves determined using estimated future prices and costs. Upon
transition to IFRS, the Company was required to adopt new accounting policies for oil and natural gas activities, including exploration and evaluation costs
and development costs.
Under IFRS, exploration and evaluation costs are those expenditures for an area where technical feasibility and commercial viability have not yet been
determined. Development costs include those expenditures for areas where technical feasibility and commercial viability have been determined. Parex
adopted the IFRS 1 exemption whereby the Company deemed its January 1, 2010 IFRS upstream asset costs to be equal to its previous GAAP historical
upstream property, plant and equipment net book value. Accordingly, exploration and evaluation costs were deemed equal to the unproved properties balance.
Under IFRS, exploration and evaluation costs are presented as exploration and evaluation assets and development costs are presented within property, plant
and equipment on the Consolidated Balance Sheet.
Exploration and evaluation
Exploration and evaluation assets at January 1, 2010 were deemed to be $25.9 million, representing the unproved properties balance under previous GAAP.
This determination resulted in a reclassification of $25.9 million from property, plant and equipment to exploration and evaluation assets on Parex’
Consolidated Balance Sheet as at January 1, 2010. As at December 31, 2010, the Company's exploration and evaluation assets were $55.9 million including
$25.8 million in Colombia and $30.1 million in Trinidad & Tobago.
Under previous GAAP, exploration and evaluation costs were capitalized as property, plant and equipment in accordance with the CICA’s full cost accounting
guidelines. Under IFRS, the Company capitalizes these costs initially as exploration and evaluation assets. Once technical feasibility and commercial viability
of the area have been determined, the capitalized costs are transferred from exploration and evaluation assets to property, plant and equipment. Under IFRS,
unrecoverable exploration and evaluation costs associated with an area and costs incurred prior to obtaining the legal rights to explore are expensed.
During the year ended December 31, 2010, Parex transferred $10.5 million of capitalized exploration and evaluation costs to property, plant and equipment.
The application of IFRS for exploration and evaluation costs resulted in a $37,000 increase, after tax, to Parex’ previous GAAP net losses for the year ended
December 31, 2010.
Depreciation, depletion and amortization
Consistent with previous GAAP, development costs are capitalized as property, plant and equipment under IFRS. Under previous GAAP, development costs
were depleted using the unit-of-production method based on proved reserves for each country cost centre. Under IFRS, development costs are depleted using
the unit-of-production method calculated based on proved and probable reserves at the established area level. This resulted in a $205,000 decrease to the
Company’s DD&A expense for the year ended December 31, 2010 and Parex’ net losses decreased $135,000, after tax, compared to previous GAAP for the
year ended December 31, 2010.
Impairments
Under previous GAAP, an upstream impairment was recognized if the carrying amount exceeded the undiscounted cash flows from proved reserves for a
country cost centre. An impairment was measured as the amount by which the carrying value exceeded the sum of the fair value of the proved and probable
reserves and the costs of unproved properties.

Parex Resources Inc. June 30, 2011
Under IFRS, an upstream impairment is recognized if the carrying value exceeds the recoverable amount for a cash-generating unit. Upstream areas are
aggregated into cash-generating units based on their ability to generate largely independent cash flows. If the carrying value of the cash-generating unit
exceeds the recoverable amount, the cash-generating unit is written down with an impairment recognized in net income (loss). Impairments recognized under
IFRS are reversed when there has been a subsequent increase in the recoverable amount. Impairment reversals are recognized in net income (loss) and the
carrying amount of the cash-generating unit is increased to its revised recoverable amount as if no impairment had been recognized for the prior periods.
There is no impairment impact to the Company’s opening balance sheet as at January 1, 2010 or for the year ended December 31, 2010.
Decommissioning liabilities
Under previous GAAP, decommissioning liabilities were discounted using a credit adjusted risk free rate. Under IFRS, the Company is discounting
decommissioning liabilities using a risk-free rate. As at December 31, 2010, the difference results in an increase to the decommissioning liability of $395,000
and a corresponding increase to property, plant and equipment.
Share appreciation rights
The Company’s SARs plan was accounted for using the intrinsic value method under previous GAAP. Under IFRS, the Company is using the Black-Scholes
fair value method to value the SARs liability. This IFRS difference has no effect on the Company’s opening balance sheet as the SARs plan was initiated in
the second quarter of 2010. For year ended December 31, 2010, an increase to share based compensation of $347,000 was recognized with a corresponding
increase to accounts payable of $190,000 and long term liability of $157,000. The application of IFRS for SARs valuation resulted in a $244,000 increase,
after tax, to Parex’ previous GAAP net losses for the year ended December 31, 2010.
Reduction of capital
Under previous GAAP, a deferred tax asset is recognized due to a Colombian government tax incentive that allowed an additional 30 percent deduction on
qualifying eligible capital expenditures. A taxable benefit of $3.2 million was recognized and recorded through a reduction of the carrying values of these
expenditures as at December 31, 2010. Under IFRS, the after-tax effect of the tax incentive reduces the carrying value of the eligible capital at inception and
the taxable benefit of the tax incentive is recognized to net income (loss) over the life of the asset. This resulted in a decrease to the deferred tax asset of $1.1
million and a corresponding increase to property, plant and equipment at December 31, 2010.
Income tax
Deferred taxes have been adjusted to reflect the tax effect arising from the differences between IFRS and previous GAAP. For the year ended December 31,
2010, the application of the IFRS adjustments as discussed above resulted in a $53,000 increase to the Company’s deferred tax recovery.
Recent Pronouncements Issued
The Company has reviewed new and revised accounting pronouncements that have been issued but are not yet effective and determined that the following
may have an impact on the Company:
As of January 1, 2013, Parex will be required to adopt IFRS 9, Financial Instruments, which is the result of the first phase of the IASB’s project to replace
IAS 39, Financial Instruments: Recognition and Measurement. The new standard replaces the current multiple classification and measurement models for
financial assets and liabilities with a single model that has only two classification categories: amortized cost and fair value. The adoption of this standard
should not have a material impact on the Company’s Consolidated Financial Statements.
In May 2011, the IASB issued the following standards which have not yet been adopted by Parex: IFRS 10, Consolidated Financial Statements, IFRS 11,
Joint Arrangements, IFRS 12, Disclosure of Interests in Other Entities, IAS 27, Separate Financial Statements, IFRS 13, Fair Value Measurement and
amended IAS 28, Investments in Associates and Joint Ventures. Each of the new standards is effective for annual periods beginning on or after January 1,
2013 with early adoption permitted. Parex has not yet begun the process of assessing the impact that these new and amended standards will have on the
Company’s Consolidated Financial Statements or whether to early adopt any of the new requirements.

Parex Resources Inc. June 30, 2011
Critical Accounting Estimates
The preparation of consolidated financial statements in accordance with IFRS requires management to make judgments, assumptions and estimates that affect
the financial results of the Company. The following discussion outlines the accounting policies and practices involving the use of estimates that the Company
believes are critical in determining Parex’ financial results.
Upstream reserves
The Company retains qualified independent reserves evaluators to evaluate the Company’s proved and probable oil and natural gas reserves. As at March 31,
2011, Parex’ reserves were evaluated by GLJ Petroleum Consultants Ltd., who are a firm of qualified independent reserves evaluators. The evaluation was
conducted in accordance with National Instrument 51-101 Standards of Disclosure for Oil and Gas Activities. The Operations and Reserves Committee of the
Company’s Board of Directors is comprised of independent directors whose mandate is to steward the reserves evaluation process.
The estimation of reserves involves the exercise of judgment. Forecasts are based on engineering data, expected rates of production and the timing of future
capital expenditures, all of which are subject to major uncertainties and interpretations. The Company expects that over time its reserve estimates will be
revised upward or downward based on updated information such as the results of future drilling, testing and production levels. Reserve estimates can have a
significant impact on net income (loss), as they are a key component in the calculation of DD&A and for determining potential asset impairment. A
downward revision in reserves estimates or an increase in estimated future development costs could result in the recognition of a higher DD&A charge to net
income (loss).
Upstream assets, including exploration and evaluation costs and development costs, are aggregated into cash-generating units based on their ability to
generate largely independent cash flows. If the carrying value of the cash-generating unit exceeds the recoverable amount, the cash-generating unit is written
down with an impairment recognized in net income (loss). The recoverable amount of an asset or cash-generating unit is the greater of its fair value less costs
to sell and its value in use. Fair value less costs to sell may be determined using discounted future net cash flows of proved and probable reserves using
forecast prices and costs. A downward revision in reserves estimates could result in the recognition of impairments charged to net income (loss).
Reversals of impairments are recognized when there has been a subsequent increase in the recoverable amount. In this event, the carrying amount of the asset
or cash-generating unit is increased to its revised recoverable amount with an impairment reversal recognized in net income (loss).
Decommissioning liabilities
The Company is required to recognize a liability for future dismantling, decommissioning, abandoning and site disturbance remediation costs associated with
the Company's oil and natural gas properties in accordance with existing laws, contracts or other policies. The fair value of the estimated decommissioning
liability is recorded as a long-term liability, with a corresponding increase in the carrying amount of the related long-lived asset, which is depleted on a unit-
of-production basis over the life of the reserves. The liability is adjusted each reporting period to reflect the passage of time, with the accretion charged to
income (loss), and for revisions to the estimated future cash flows. Actual costs incurred upon settlement of the obligations are charged against the liability.
Decommissioning liabilities are determined by using management’s best estimate of costs, taking into account the anticipated method and extent of restoration
consistent with legal requirements, technological advances, industry practices and the possible use of the site. Since these estimates are specific to the sites
involved, there are many individual assumptions underlying the Company’s total decommissioning liability. These individual assumptions can be subject to
change based on experience. Restoration technologies and costs are constantly changing, as are regulatory, political, environmental, safety and public
relations considerations. The Company estimates future decommissioning costs based on current estimates adjusted for inflation. This estimate for inflation is
also subject to management uncertainty.
Deferred tax
The Company follows the liability method of accounting for income taxes. Under this method, future tax assets and liabilities are determined based on
differences between the financial reporting and tax basis of assets and liabilities and are measured using substantially enacted tax rates and laws that will be in
effect when the differences are expected to reverse. The effect of a change in income tax rates on deferred tax liabilities and assets is recognized in income
(loss) in the period that the change occurs. Deferred tax assets are only recognized to the extent that it is more likely than not that sufficient future taxable
income will be available in the applicable jurisdiction to allow the deferred tax assets to be realized.

Parex Resources Inc. June 30, 2011
The determination of the Company’s income and other tax liabilities requires interpretation of complex laws and regulations from multiple jurisdictions. Rates
are also affected by legislative changes. All tax filings are subject to audit and potential reassessment after the lapse of considerable time. Accordingly, the
actual income tax liability may differ significantly from that estimated and recorded in the financial statements. Estimates of Colombian current income tax
for interim periods are also subject to additional uncertainty. A variety of factors cannot be known until year-end and, therefore, estimates are used for interim
period current tax provisions.
Share-based compensation
The Company records stock-based compensation expense using the fair value method. The fair value of an option is calculated at the grant date, and expensed
equally over the vesting term of the option. The Company records the cumulative stock-based compensation as contributed surplus. When options are
exercised, contributed surplus is reduced and share capital is increased by the amount of accumulated stock-based compensation for the exercised option. Any
consideration received on the exercise of stock options is credited to share capital.
The determination of stock-based compensation expense is based on assumptions regarding stock volatility, risk-free interest rates and the expected life of the
options. These assumptions, by their nature, are subject to measurement uncertainty.
Obligations for payments of cash under the subsidiaries’ SARs plan are accrued as compensation expense over the vesting period based on the fair value of
SARs, subject to appreciation limits specified in the plan. The fair value of SARs is measured using the Black-Scholes pricing model. In accordance with the
fair value method, increases or decreases in the fair value of the SARs result in a corresponding change in the recorded liability. The accrued compensation
for a right that is forfeited is adjusted by decreasing compensation cost in the period of forfeiture.
The determination of SARs expense is based on assumptions regarding stock volatility, risk-free interest rates and the expected life of the SAR. These
assumptions, by their nature, are subject to measurement uncertainty.
Goodwill
Goodwill represents the excess of purchase price over fair value of net assets acquired, and is assessed for impairment annually at December 31 of each year.
To test for impairment, goodwill is allocated to each of the Company’s cash generating units (“CGUs”), or groups of CGUs, that are expected to benefit from
the acquisition and is tested as described above in the Company’s Impairment policy. The recoverable amount of an asset or a CGU is the greater of its value
in use and its fair value less costs to sell (“FVLCTS”).
Value in use is determined by estimating the present value of the future net cash flows expected to be derived from the continued use of the asset or CGU.
FVLCTS is based on available market information, where applicable. In the absence of such information, FVLCTS is determined using discounted future net
cash flows of proved plus probable reserves using forecast prices and costs. A downward revision in reserves estimates could result in the recognition of a
goodwill impairment charge to net earnings.
Derivative liabilities
The Debentures, if converted by the holder are settled in common shares. The potential settlement results in a derivative financial liability. As a result of
measuring the liability for the potential settlement related to the conversion feature under the convertible debenture agreements at fair value under IFRS,
fluctuations in the estimated fair value will affect the derivative liability gains and losses that are recognized. The fair value of the liability fluctuates, as it is
based on assumptions for the risk-free interest rate, the period-end share price as well as the volatility of the share price.
Legal, environmental remediation and other contingent matters
In respect of these matters, the Company is required both to determine whether a loss is probable based on judgment and interpretation of laws and regulations
and if such a loss can reasonably be estimated. When any such loss is determined, it is charged to income (loss). Management continually monitors known
and potential contingent matters and makes appropriate provisions by charges to income (loss) when warranted by circumstances.

Interim Consolidated Balance Sheets (unaudited)
As at June 30, December 31, (thousands of United States dollars) NOTE 2011 2010 ASSETS Current assets
Cash and cash equivalents 5 $ 115,499 $ 123,539 Accounts receivable 6 24,091 14,877 Prepaids and other current assets 2,008 744 Oil inventory 3,141 -
144,739 139,160 Deferred tax asset 15 3,274 3,325 Goodwill 9 59,948 - Exploration and evaluation 7 147,830 55,852 Property, plant and equipment 8 237,908 12,365 $ 593,699 $ 210,702 LIABILITIES AND SHAREHOLDERS’ EQUITY Current liabilities
Accounts payable and accrued liabilities $ 41,224 $ 23,473 Current income and equity tax payable 15 2,093 551
43,317 24,024 Convertible debenture 14 61,200 - Derivative financial liability 14 24,472 - Other long-term liabilities 11 2,023 2,082 Decommissioning liabilities 12 2,524 651 Deferred tax liability 15 64,452 -
197,988 26,757 Shareholders’ equity
Share capital 13 411,848 198,857 Contributed surplus 6,440 4,000 Deficit (22,577) (18,912) 395,711 183,945
$ 593,699 $ 210,702
Commitments (note 20)
See accompanying Notes to the Interim Consolidated Financial Statements
Approved by the Board:
Paul Wright Ron Miller
Director Director
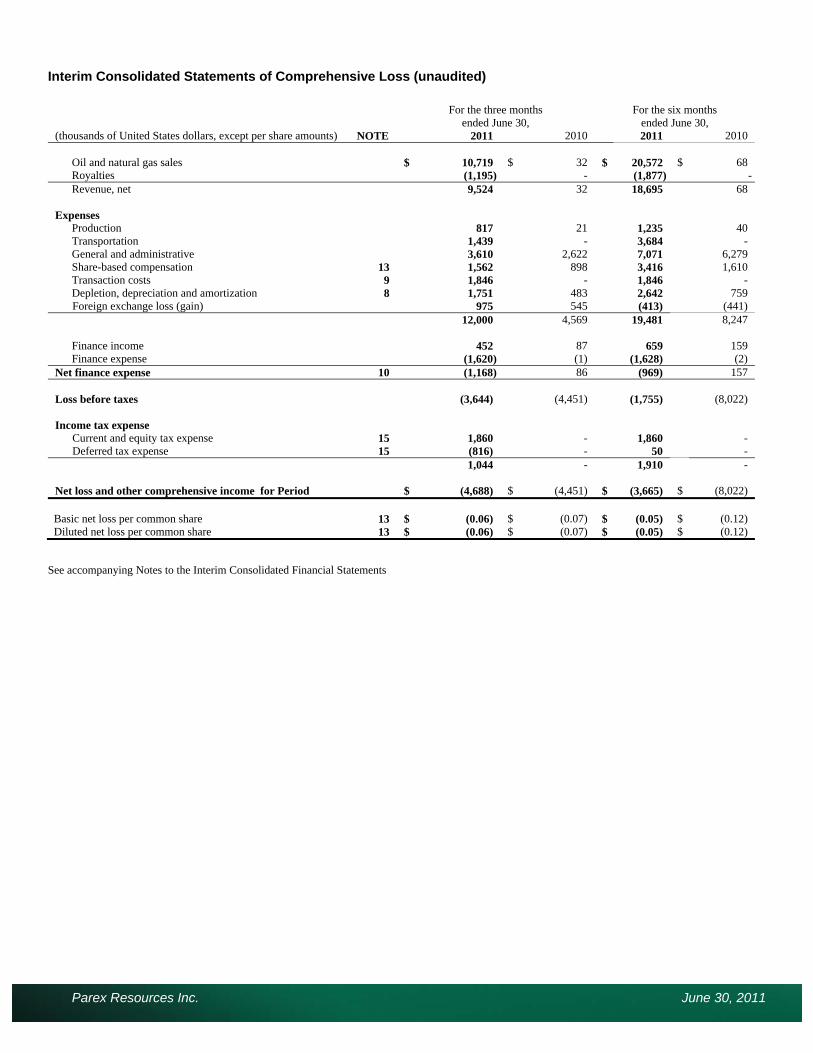
Parex Resources Inc. June 30, 2011
Interim Consolidated Statements of Comprehensive Loss (unaudited)
For the three months
ended June 30, For the six months
ended June 30, (thousands of United States dollars, except per share amounts) NOTE 2011 2010 2011 2010
Oil and natural gas sales $ 10,719 $ 32 $ 20,572 $ 68 Royalties (1,195) - (1,877) -Revenue, net 9,524 32 18,695 68
Expenses
Production 817 21 1,235 40 Transportation 1,439 - 3,684 - General and administrative 3,610 2,622 7,071 6,279 Share-based compensation 13 1,562 898 3,416 1,610 Transaction costs 9 1,846 - 1,846 - Depletion, depreciation and amortization 8 1,751 483 2,642 759 Foreign exchange loss (gain) 975 545 (413) (441)
12,000 4,569 19,481 8,247 Finance income 452 87 659 159 Finance expense (1,620) (1) (1,628) (2)
Net finance expense 10 (1,168) 86 (969) 157
Loss before taxes (3,644) (4,451) (1,755) (8,022) Income tax expense
Current and equity tax expense 15 1,860 - 1,860 - Deferred tax expense 15 (816) - 50 -
1,044 - 1,910 -
Net loss and other comprehensive income for Period $ (4,688) $ (4,451) $ (3,665) $ (8,022)
Basic net loss per common share 13 $ (0.06) $ (0.07) $ (0.05) $ (0.12) Diluted net loss per common share 13 $ (0.06) $ (0.07) $ (0.05) $ (0.12)
See accompanying Notes to the Interim Consolidated Financial Statements

Parex Resources Inc. June 30, 2011
Interim Consolidated Statements of Changes in Equity (unaudited)
For the six months ended June 30, (thousands of United States dollars ) 2011 2010 Share Capital
Balance, beginning of year $ 198,857 $ 128,726
Issuance of common shares under option plans 886 -
Issuance of common shares 212,105 -
Balance, end of period $ 411,848 $ 128,726
Contributed Surplus
Balance, beginning of year $ 4,000 $ 771
Share-based compensation 2,709 1,548
Options exercised (269) -
Balance, end of period $ 6,440 $ 2,319
Deficit
Balance, beginning of year $ (18,912) $ (5,381)
Net loss for the period (3,665) (8,022)
Balance, end of period $ (22,577) $ (13,403)
See accompanying Notes to the Interim Consolidated Interim Financial Statements

Parex Resources Inc. June 30, 2011
Interim Consolidated Statements of Cash Flows (unaudited)
For the six months ended June 30 (thousands of United States dollars) NOTE 2011 2010
Operating activities
Net loss $ (3,665) $ (8,022)Add (deduct) non-cash items
Depletion, depreciation and amortization 8 2,642 759 Non cash finance expense 10 1,076 2 Share-based compensation 13 3,416 1,610 Deferred tax expense 15 50 - Equity tax expense 15 95 - Unrealized foreign exchange gain (320) (291)
Funds flow from (used in) operations 3,294 (5,942) Net change in non-cash working capital 16 18,018 401 21,312 (5,541)
Investing activities
Capital expenditures (41,481) (17,107) Acquisition 9 (252,993) - Net change in non-cash working capital 16 (32,588) 4,236 (327,062) (12,871)
Financing activities
Issuance of common shares 13 224,575 - Share issuance costs 13 (11,853) - Convertible debenture 14 84,244 - Net change in non-cash working capital 16 (1,290) (2,498)
295,676 (2,498) Decrease in cash and cash equivalents for period (10,074) (20,910) Impact of foreign exchange on foreign currency-denominated cash balances 2,034 273 Cash and cash equivalents, beginning of period 123,539 101,280
Cash and cash equivalents, end of period $ 115,499 $ 80,643
Supplemental Disclosure of Cash Flow Information (note 16)
See accompanying Notes to the Interim Consolidated Financial Statements

Parex Resources Inc. June 30, 2011
Notes to the Interim Consolidated Financial Statements (unaudited)
For the six months ended June 30, 2011
(Tabular amounts in thousands of United States dollars, unless otherwise stated. Amounts in text are in United States dollars unless otherwise stated.)
1. Corporate Information
Parex Resources Inc. and its subsidiaries (“Parex” or “the Company”) are in the business of the exploration, development, production and marketing of oil and
natural gas.
Parex Resources Inc. is a publicly traded company, incorporated and domiciled in Canada. Its registered office is at 1400, 350-7th Avenue S.W., Calgary,
Alberta T2P 3N9. The Company was incorporated as 1485196 Alberta Ltd. on August 17, 2009, pursuant to the Business Corporations Act (Alberta). On
September 29, 2009 it filed Articles of Amendment to change its name to Parex Resources Inc.
The interim consolidated financial statements were approved and authorized for issuance by the Board of Directors ("the Board") on August 11, 2011.
2. Basis of Presentation and Adoption of International Financial Reporting Standards (“IFRS”)
a) Statement of compliance
The Company prepares its financial statements in accordance with Canadian generally accepted accounting principles as set out in the Handbook of the
Canadian Institute of Chartered Accountants (“CICA Handbook”). In 2010, the CICA Handbook was revised to incorporate IFRS, and require publicly
accountable enterprises to apply such standards effective for years beginning on or after January 1, 2011. Accordingly, the Company commenced reporting on
this basis in its 2011 interim consolidated financial statements. In these financial statements, the term “Canadian GAAP” refers to Canadian GAAP before the
adoption of IFRS.
These interim consolidated financial statements have been prepared in accordance with IFRS applicable to the preparation of interim financial statements,
including International Accounting Standard (“IAS”) IAS 34, Interim Financial Reporting, and IFRS 1, First-time Adoption of International Financial
Reporting Standards. The accounting policies followed in these interim financial statements are the same as those applied in the Company’s interim financial
statements for the period ended March 31, 2011. The Company has consistently applied the same accounting policies throughout all periods presented, as if
these policies had always been in effect. Note 21 discloses the impact of the transition to IFRS on the Company’s reported equity as at June 30, 2010 and
comprehensive income for the three and six months ended June 30, 2010, including the nature and effect of significant changes in accounting policies from
those used in the Company’s consolidated financial statements for the year ended December 31, 2010.
The policies applied in these interim consolidated financial statements are based on IFRS issued and outstanding as of August 11, 2011, the date the Board of
Directors approved the statements. Any subsequent changes to IFRS that are given effect in the Company’s annual consolidated financial statements for the
year ending December 31, 2011 could result in restatement of these interim consolidated financial statements, including the transition adjustments recognized
on change-over to IFRS.
The interim consolidated financial statements should be read in conjunction with the Company’s Canadian GAAP annual financial statements for the year
ended December 31, 2010, and the Company’s interim financial statements for the quarter ended March 31, 2011 prepared in accordance with IFRS
applicable to interim financial statements.
b) Basis of measurement
The interim consolidated financial statements have been prepared under the historical cost convention except for derivative financial instruments and share-
based payment transactions which are measured at fair value and. The methods used to measure fair values are discussed in note 4 - Determination of Fair
Values.

Parex Resources Inc. June 30, 2011
c) Use of management estimates, judgments and measurement uncertainty
The timely preparation of the interim consolidated financial statements requires that Management make estimates and use judgment regarding the reported
amounts of assets and liabilities and disclosures of contingent assets and liabilities as at the date of the interim consolidated financial statements and the
reported amounts of revenues and expenses during the period. Such estimates primarily relate to unsettled transactions and events as at the date of the interim
consolidated financial statements. Accordingly, actual results could differ from estimated amounts as future confirming events occur. Significant estimates
and judgments made by management in the preparation of these interim consolidated financial statements are outlined below:
(i) Reserves
Amounts recorded for depreciation, depletion and amortization (“DD&A”) and amounts used for impairment calculations are based on estimates of oil and
natural gas reserves. By their nature, the estimates of reserves, including the estimates of future prices, costs, discount rates and the related future cash flows,
are subject to measurement uncertainty. Accordingly, the impact in the consolidated financial statements of future periods could be material.
(ii) Determination of cash-generating units (“CGU”)
Property, plant and equipment are aggregated into CGUs based on their ability to generate largely independent cash flows and are used for impairment testing.
The determination of the Company's cash-generating units is subject to management's judgment.
(iii) Exploration and evaluation (“E&E”)
The decision to transfer assets from exploration and evaluation to property, plant and equipment is based on the estimated proved and probable reserves used
in the determination of an area’s technical feasibility and commercial viability.
(iv) Decommissioning liabilities
Amounts recorded in decommissioning liabilities and the related accretion expense require the use of estimates with respect to the amount and timing of asset
retirements, site remediation, discount rate, inflation rate and related cash flows. Other provisions are recognized in the period when it becomes probable that
there will be a future cash outflow.
(v) Share –based compensation
Compensation costs accrued for share-based compensation plans and the Company’s Share Appreciation Rights plan are subject to the estimation of what the
ultimate payout will be using the Black-Scholes pricing model which is based on significant assumptions such as the future volatility of the market price of
Parex shares and expected term of the issued stock option.
(vi) Income taxes
Tax interpretations, regulations and legislation in the various jurisdictions in which the Company and its subsidiaries operate are subject to change and
interpretation. As such, income taxes are subject to measurement uncertainty. Deferred tax assets are assessed by management at the end of the reporting
period to determine the likelihood that they will be realized from future taxable earnings.
(vii) Business Combinations
Business combinations are accounted for using the acquisition method of accounting. The determination of fair value often requires management to make
assumptions and estimates about future events. The assumptions and estimates with respect to determining the fair value of exploration and evaluation assets
and petroleum and natural gas assets acquired generally require the most judgment and include estimates of reserves acquired, forecast benchmark commodity
prices and discount rates. Changes in any of the assumptions or estimates used in determining the fair value of acquired assets and liabilities could impact the
amounts assigned to assets, liabilities and goodwill in the purchase price allocation. Future net earnings can be affected as a result of changes in future
depletion and depreciation, asset impairment or goodwill impairment.
3. Summary of Significant Accounting Policies
The accounting policies set out below have been applied consistently to all years presented in these interim consolidated financial statements, and have been
applied consistently by the Company and its subsidiaries.

Parex Resources Inc. June 30, 2011
a) Consolidation
The interim consolidated financial statements include the accounts of Parex and its subsidiaries. Intercompany balances and transactions are eliminated on
consolidation. Interests in jointly controlled assets are accounted for using the proportionate consolidation method, whereby Parex’ proportionate share of
revenues, expenses, assets and liabilities are included in the accounts.
b) Foreign currency translation
(i) Functional and presentation currency
Items included in the interim consolidated financial statements are measured using the currency of the primary economic environment in which the entity
operates (the “functional currency”). The interim consolidated financial statements are presented in United States dollars, which is Parex’ functional currency.
(ii) Transactions and balances
Foreign currency transactions are translated into the functional currency using the exchange rates prevailing at the dates of the transactions. Generally, foreign
exchange gains and losses resulting from the settlement of foreign currency transactions and from the translation at period-end exchange rates of monetary
assets and liabilities denominated in currencies other than an operation’s functional currency are recognized in the statement of comprehensive income (loss).
c) Financial instruments
(i) Non-derivative financial instruments
Non-derivative financial instruments comprise cash and cash equivalents, accounts receivable, accounts payable and accrued liabilities and the liability
portion of the convertible debenture. Non-derivative financial instruments are recognized initially at fair value.
(ii) Derivative financial instruments
The conversion feature associated with convertible debentures is a derivative liability. Derivative liabilities are recorded upon recognition and subsequently at
each balance sheet date at fair value, with changes in fair value being recognized in the statement of comprehensive income (loss).
d) Capital assets
(i) Exploration and evaluation
All costs directly associated with the exploration and evaluation of oil and natural gas reserves are initially capitalized. E&E costs are those expenditures for
an area where technical feasibility and commercial viability have not yet been determined. These costs include unproved property acquisition costs,
exploration costs, geological and geophysical costs, asset retirement costs, exploration and evaluation drilling, sampling and appraisals. Costs incurred prior
to acquiring the legal rights to explore an area are charged directly to net income as E&E expense.
When an area is determined to be technically feasible and commercially viable the accumulated costs are transferred to property, plant and equipment. When
an area is determined not to be technically feasible and commercially viable or the Company decides not to continue with its activity, the unrecoverable costs
are charged to comprehensive income (loss) as E&E expense.
(ii) Property, plant and equipment (“PP&E”)
All costs directly associated with the development of oil and natural gas reserves are capitalized on an area-by-area basis. Development costs include
expenditures for areas where technical feasibility and commercial viability has been determined. These costs include proved property acquisitions,
development drilling, completion of wells, gathering facilities and infrastructure, asset retirement costs and transfers of exploration and evaluation assets.
Costs accumulated within each CGU are depleted using the unit-of-production method based on proved plus probable reserves incorporating estimated future
prices and costs. Costs subject to depletion include estimated future costs to be incurred in developing proved plus probable reserves. Costs of major
development projects are excluded from the costs subject to depletion until they are available for use.
Costs associated with office furniture, fixtures and leasehold improvements are carried at cost and depreciated on a straight-line basis over the estimated
service lives of the assets, which range from one to five years.

Parex Resources Inc. June 30, 2011
e) Impairment of long-term assets
The carrying amounts of the Company’s long-term assets, other than E&E assets and deferred tax assets, are reviewed at each reporting date to determine
whether there is any indication of impairment. If so,, then the asset’s recoverable amount is estimated. E&E assets are assessed for impairment when they are
reclassified to PP&E, and also if facts and circumstances suggest that the carrying amount exceeds the recoverable amount.
For the purpose of impairment testing, assets are grouped together into the smallest group of assets that generates cash inflows from continuing use that are
largely independent of the cash inflows of other assets or groups of assets (the “cash-generating unit” or “CGU”). The recoverable amount of an asset or a
CGU is the greater of its value in use and its fair value less costs to sell (“FVLCTS”).
Value in use is determined by estimating the present value of the future net cash flows expected to be derived from the continued use of the asset or CGU.
FVLCTS is based on available market information, where applicable. In the absence of such information, FVLCTS is determined using discounted future net
cash flows of proved plus probable reserves using forecast prices and costs.
E&E assets are allocated to related CGUs where they are assessed for impairment upon their eventual reclassification to PP&E.
An impairment loss is recognized if the carrying amount of an asset or its CGU exceeds its estimated recoverable amount. Impairment losses are recognized in
net income. Impairment losses recognized in respect of CGUs are allocated first to reduce the carrying amount of any goodwill allocated to the units and then
to reduce the carrying amounts of the other assets in the unit (group of units) on a pro rata basis.
Impairment losses recognized in prior years are assessed at each reporting date for any indications that the loss has decreased or no longer exists. An
impairment loss is reversed if there has been a change in the estimates used to determine the recoverable amount. An impairment loss is reversed only to the
extent that the asset’s carrying amount does not exceed the carrying amount that would have been determined, net of depletion and depreciation or
amortization, if no impairment loss had been recognized.
f) Crude oil inventory
Crude oil inventory consists of crude oil in transit at the balance sheet date and is valued at the lower of cost, using the weighted average cost method and net
realizable value. Costs include direct and indirect expenditures incurred in bringing the crude oil to its existing condition and location.
g) Goodwill
Goodwill is recorded on a business acquisition when the purchase price is in excess of the fair values assigned to assets acquired and liabilities assumed.
Goodwill is not amortized and an impairment test is performed annually to evaluate the carrying value. To test for impairment, goodwill is allocated to each of
the Company’s CGUs, or groups of CGUs, that are expected to benefit from the acquisition and tested as described above in the Company’s Impairment
policy. Impairment losses are recognized, when identified, in the statement of comprehensive income (loss) and cannot be reversed.
h) Revenue recognition
Revenue from the sale of oil and natural gas is recorded when the significant risks and rewards of ownership of the product are transferred to the buyer which
is usually when legal title passes to the external party.
i) Share-based payments
The Company has an incentive stock option plan for employees, officers, directors and consultants as described in note 13. The Company records share-based
compensation expense using the fair value method. The fair value of an option is calculated at the grant date using the Black-Scholes pricing model, and
expensed over the vesting period of the option. The Company determines an appropriate forfeiture rate by examining the history of its forfeitures. The
Company records the cumulative share-based compensation as contributed surplus. When options are exercised, contributed surplus is reduced and share
capital is increased by the amount of accumulated share-based compensation for the exercised option. Any consideration received on the exercise of stock
options is credited to share capital.

Parex Resources Inc. June 30, 2011
Obligations for payments of cash under the subsidiaries’ SARs plan are accrued as compensation expense over the vesting period based on the fair value of
SARs, subject to appreciation limits specified in the plan. The fair value of share appreciation rights is measured using the Black-Scholes pricing model. In
accordance with the fair value method, increases or decreases in the fair value of the SARs result in a corresponding change in the recorded liability. The
accrued compensation for a right that is forfeited is adjusted by decreasing compensation cost in the period of forfeiture.
j) Provisions
A provision is recognized if, as a result of a past event, the Company has a present legal or constructive obligation that can be estimated reliably, and it is
probable that an outflow of economic benefits will be required to settle the obligation. Provisions are determined by discounting the expected future cash
flows at a pre-tax rate that reflects current market assessments of the time value of money and the risks specific to the liability. Provisions are not recognized
for future operating losses.
k) Decommissioning liabilities
The Company’s activities give rise to dismantling, decommissioning, abandonment g and site disturbance remediation activities. Provision is made for the
estimated cost of site restoration and capitalized in the relevant asset category.
Decommissioning liabilities are measured at the present value of management’s best estimate of the expenditure required to settle the present obligation at the
balance sheet date using a risk-free discount rate. Subsequent to the initial measurement, the obligation is adjusted at the end of each period to reflect the
passage of time and changes in the estimated future cash flows underlying the obligation. The increase in the provision due to the passage of time is
recognized as a finance expense whereas increases/decreases due to changes in the estimated future cash flows are capitalized. Actual costs incurred upon
settlement of the decommissioning liabilities are charged against the provision to the extent the provision was established.
l) Finance income and expense
Finance expense comprises interest expense on borrowings, accretion on decommissioning liabilities, revaluation of derivative financial liabilites and
impairment losses recognized on financial assets. Finance income comprises interest earned on cash and cash equivalents.
m) Cash and cash equivalents
Cash and cash equivalents comprise cash in the bank and term deposits held with banks with original maturities of 12 months or less.
n) Income taxes
Income tax expense comprises current and deferred tax. Income tax expense is recognized in comprehensive income (loss) except to the extent that it relates
to items recognized directly in equity, in which case it is recognized in equity.
Current tax is the expected tax payable on taxable income for the year, using tax rates enacted or substantively enacted at the reporting date, and any
adjustment to tax payable in respect of previous years. Tax on taxable income in interim periods is accrued using the tax rate that would be applicable to
expected annual taxable income for each subsidiary.
In general, deferred tax is recognized in respect of temporary differences arising between the tax basis of assets and liabilities and their carrying amounts in
the interim consolidated financial statements. Deferred tax is determined on a non-discounted basis using tax rates and laws that have been enacted or
substantively enacted at the balance sheet date and are expected to apply when the deferred tax asset or liability is settled. Deferred tax assets are recognized
to the extent that it is probable that the assets can be recovered. Deferred tax is provided on temporary differences arising on investments in subsidiaries
except, in the case of subsidiaries, where the timing of the reversal of the temporary difference is controlled by the Company and it is probable that the
temporary difference will not be reversed in the foreseeable future. Deferred tax assets and liabilities are presented as non-current.
o) Per share information
Basic net income (loss) per share is calculated by dividing the income or loss attributable to common shareholders of the Company by the weighted average
number of common shares outstanding during the period. Diluted net income (loss) per share is determined by adjusting the income or loss attributable to
common shareholders and the weighted average number of common shares outstanding for the effects of dilutive instruments such as options granted to
employees, except when the effect would be anti-dilutive.

Parex Resources Inc. June 30, 2011
p) New standards and interpretations not yet adopted
The Company has reviewed new and revised accounting pronouncements that have been issued but are not yet effective and determined that the following
may have an impact on the Company:
As of January 1, 2013, Parex will be required to adopt IFRS 9, Financial Instruments, which is the result of the first phase of the International Accounting
Standards Board’s (IASB) IASB’s project to replace IAS 39, “Financial Instruments: Recognition and Measurement”. The new standard replaces the current
multiple classification and measurement models for financial assets and liabilities with a single model that has only two categories: amortized cost and fair
value. The adoption of this standard should not have a material impact on Parex’ consolidated financial statements.
In May 2011, the IASB issued the following standards which have not yet been adopted by Parex: IFRS 10, Consolidated Financial Statements, IFRS 11,
Joint Arrangements, IFRS 12, Disclosure of Interests in Other Entities, IAS 27, Separate Financial Statements, IFRS 13, Fair Value Measurement and
amended IAS 28, Investments in Associates and Joint Ventures. Each of the new standards is effective for annual periods beginning on or after January 1,
2013 with early adoption permitted. Parex has not begun assessing the impact that these new and amended standards will have on the Company’s consolidated
financial statements or whether to early adopt any of the new requirements early.
4. Determination of Fair Values
A number of the Company’s accounting policies and disclosures require the determination of fair value, for both financial and non-financial assets and
liabilities. Fair values have been determined for measurement and/or disclosure purposes based on the methods below. When applicable, further information
about the assumptions made in determining fair values is disclosed in the notes specific to that asset or liability.
(i) PP&E and intangible exploration assets
The fair value of PP&E is the estimated amount for which PP&E could be exchanged on the acquisition date between a willing buyer and a willing seller in an
arm’s-length transaction after proper marketing wherein the parties had each acted knowledgeably, prudently and without compulsion. The fair value of oil
and natural gas assets (included in PP&E) and exploration and evaluation assets is estimated with reference to the discounted cash flows expected to be
derived from oil and natural gas production based on externally prepared reserve reports. The risk-adjusted discount rate is specific to the asset with reference
to general market conditions.
The fair value of other items of PP&E is based on the quoted market prices for similar items.
(ii) Cash and cash equivalents, accounts receivable, and accounts payable
The fair value of cash and cash equivalents, accounts receivable, and accounts payable is estimated as the present value of future cash flows, discounted at the
market rate of interest at the reporting date. At June 30, 2011 and December 31, 2010, the fair value of these balances approximated their carrying value due
to their short term to maturity.
(iii) Stock options
The fair value of stock options is measured using the Black-Scholes option pricing model. Measurement inputs include the share price on measurement date,
exercise price of the option, expected future share price volatility, weighted average expected life of the instruments (based on historical experience and
general option-holder behaviour), expected dividends, and the risk-free interest rate (based on Government of Canada Bonds) for the relevant expected life as
described in note 13.

Parex Resources Inc. June 30, 2011
5. Cash and Cash Equivalents
June 30, 2011 December 31, 2010 Bank balances $ 115,499 $ 93,540Term deposits(1) - 29,999Cash and cash equivalents $ 115,499 $ 123,539
(1) Term deposits are all less than 12 months duration.
6. Accounts Receivable
June 30, 2011 December 31, 2010 Trade receivables $ 11,477 $ 2,744Colombia and Trinidad value added taxes (VAT) 4,286 4,342Receivables from partners 8,328 7,791 $ 24,091 $ 14,877
Trade receivables consist primarily of Colombian receivables related to the Company’s oil sales for the three months ended June 30, 2011. VAT receivable in
Colombia totalled $3.7 million as at June 30, 2011 and is recoverable in the remainder of 2011 as the Company’s taxable oil sales are expected to exceed its
taxable purchases. Accordingly, the balance is classified as a current asset. In Trinidad & Tobago, the VAT receivable as at June 30, 2011 totalled $0.6
million. Receivables from partners consist of cash calls outstanding from joint venture partners in Colombia and Trinidad & Tobago to recover ongoing
capital costs and operating costs, or overhead recoveries outstanding from joint venture partners.
7. Exploration and Evaluation Assets
Canada Colombia Trinidad
& Tobago
Total
Cost Balance at January 1, 2010 $ - $ 9,417 $ 16,485 $ 25,902
Additions - 27,737 13,508 41,245 Transfers to PP&E - (10,525) - (10,525) Abandonment costs - 349 69 418 Other(1) - (1,188) - (1,188)
Balance at December 31, 2010 $ - $ 25,790 $ 30,062 $ 55,852 Additions - 15,791 4,915 20,706 Transfers to PP&E - (9,069) - (9,069) Abandonment costs - 95 100 195 Corporate acquisition - 80,146 - 80,146
Balance at June 30, 2011 $ - $ 112,753 $ 35,077 $ 147,830 (1) Amount relates to a reduction in carrying values of qualifying eligible capital expenditures for a government incentive that allows a
30 percent deduction for Colombian tax purposes.
E&E assets consist of the Company’s exploration projects which are pending either the determination of proven or probable reserves or impairment.
Additions represent the Company’s share of costs incurred on E&E assets during the period. Amounts transferred to PP&E of $10.5 million for the year
ended December 31, 2010 and $9.1 million for the six months ended June 30, 2011 are associated with the Kona project.

Parex Resources Inc. June 30, 2011
8. Property, Plant and Equipment
Canada Colombia
Trinidad &Tobago
Total
Cost Balance at January 1, 2010 $ 2,154 $ 633 $ 67 $ 2,854
Additions 31 1,326 162 1,519 Transfer from E&E assets - 10,525 - 10,525 Abandonment costs (4) 237 - 233 Disposals(1) (368) - - (368) Other(2) - (970) - (970)
Balance at December 31, 2010 $ 1,813 $ 11,751 $ 229 $ 13,793 Additions 65 20,698 12 20,775 Transfer from E&E assets - 9,069 - 9,069 Abandonment costs - 1,190 - 1,190 Corporate acquisition - 197,615 - 197,615
Balance at June 30, 2011 $ 1,878 $ 240,323 $ 241 $ 242,442 Accumulated Depreciation, Depletion and Amortization
Balance at January 1, 2010 $ 178 $ 101 $ 13 $ 292 Depletion and depreciation for the period 768 680 56 1,504 Disposals (368) - - (368)
Balance at December 31, 2010 $ 578 $ 781 $ 69 $ 1,428 Depletion and depreciation for the period 285 2,322 35 2,642 Disposals - - - - Other - 464 - 464
Balance at June 30, 2011 $ 863 $ 3,567 $ 104 $ 4,534 Net book value:
At January 1, 2010 $ 1,976 $ 532 $ 54 $ 2,562 At December 31, 2010 1,235 10,970 160 12,365 At June 30, 2010 $ 1,015 $ 236,756 $ 137 $ 237,908 (1) Amount relates to the disposition of insignificant Canadian properties. (2) Amount relates to a reduction in carrying values of qualifying eligible capital expenditures for a government incentive that allows a
30 percent deduction for Colombian tax purposes.
During 2010, the Company determined the Kona project in Colombia was technically feasible and commercially viable. Accordingly, $10.5 million of
accumulated E&E costs were transferred to property, plant and equipment (“PP&E”). Additional costs totaling $9.1 million relating to the Kona project were
transferred to PP&E in the first six months of 2011.
Parex increased PP&E by $197.6 million and E&E assets by $80.1 million related to recording the fair values of the assets acquired in the corporate
acquisition (see note 9 – Business Combination) including the net costs associated with the acquired assets since the January 1, 2011 effective date.
9. Business Combination
On June 29, 2011, Parex acquired Remora Energy Colombia Ltd. (“Remora”) which held the 50 percent interest Parex did not already own in four Llanos Basin
blocks in Colombia, including Block LLA-16 and the Kona discovery (the “Acquisition”). The Acquisition was funded through a bought deal public offering of
Cdn$217.35 million of subscription receipts and Cdn$85.0 million of extendible convertible unsecured subordinated debentures (the “Offering”). With the close of
the Acquisition Parex has increased its working interest from 50 percent to 100 percent and is the operator of each of the four blocks. The Acquisition is
underpinned by the Kona multi-zone light oil field and a significant inventory of exploration prospects.
The statement of comprehensive loss includes Remora’s results of operation since the date of the acquisition June 29, 2011 and expensed transaction costs
associated with the acquisition of $1.8 million.

Parex Resources Inc. June 30, 2011
This transaction has been accounted for using the acquisition method whereby the assets acquired and the liabilities assumed, excluding goodwill, are recorded at
fair values. The following table summarizes the recognizable assets acquired and consideration transferred pursuant to the acquisition:
Assets acquired and liabilities assumed PP&E $ 197,615 E&E assets 80,146 Working capital deficiency (19,794) Deferred tax liability (64,452) Goodwill 59,948 Decommissioning liabilities (470) $ 252,993
Consideration for the acquisition Amount Cash paid $ 254,335 Cash acquired (1,342) Total consideration paid net of cash acquired $ 252,993
The pro forma results for the six months ended June 30, 2011 are shown below, as if the acquisition had occurred on January 1, 2011. Pro forma
results are not indicative of actual results or future performance.
For the six months ended June 30, 2011 Oil and natural gas sales $ 40,721 Net loss (1,220) Net loss per share – basic and diluted $ (0.02)
The statement of comprehensive loss includes $211,000 of oil and natural gas sales and net income of $26,000 attributable to the assets acquired since the
acquisition date.
10. Net Finance Expense
For the three months ended June 30,
For the six months ended June 30,
2011 2010 2011 2010 Interest expense on convertible debenture $ (552) $ - $ (552) $ - Accretion on convertible debenture (8) - (8) - Accretion on decommissioning liability (11) (1) (19) (2) Loss on derivative liability (1,048) - (1,048) - Amortization of debt issuance costs (1) - (1) - Interest income 452 87 659 159
Net finance expense $ (1,168) $ 86 $ (969) $ 157
For the three months
ended June 30, For the six months
ended June 30, 2011 2010 2011 2010 Non cash finance expense $ (1,068) $ (1) $ (1,076) $ (2)Cash finance expense (100) 87 107 159
Net finance expense $ (1,168) $ 86 $ (969) $ 157
11. Other Long-Term Liabilities Other long-term liabilities are comprised of the following:
June 30, 2011 December 31, 2010 Long-term SARs payable $ 381 $ 429 Long-term equity tax payable 1,642 1,653 $ 2,023 $ 2,082
An equity tax provision of $2.3 million was accrued of which $1.6 million is classified as long term because equity tax is payable over four years starting in
2011.

Parex Resources Inc. June 30, 2011
12. Decommissioning Liabilities June 30, 2011 December 31, 2010 Balance, beginning of period $ 651 $ 52 Additions 1,283 - Corporate acquisition 470 - Liabilities incurred during the period - 650 Settlements of obligations during the period - (54) Change in estimates 101 - Accretion expense 19 3 Balance, end of period $ 2,524 $ 651
The total decommissioning liability is estimated based on the Company’s net ownership in wells drilled as at June 30, 2011, the estimated costs to abandon
and reclaim the wells and the estimated timing of the costs to be paid in future periods. The total undiscounted amount of cash flows required to settle its
decommissioning liability is approximately $5.4 million as at June 30, 2011 (December 31, 2010 – $1.4 million) with the majority of these costs anticipated to
occur in 2030 or later. A risk-free discount factor of 4 percent and an inflation rate of 3 percent were used in the valuation of the liabilities.
13. Share Capital
a) Issued and outstanding common shares
Number of shares Amount Balance, December 31, 2009 63,869,535 $ 128,726 Issued for cash 13,000,000 73,696 Issued for cash – exercise of options 98,750 297 Allocation of contributed surplus – exercise of options - 130 Share issuance costs - (3,992) Balance, December 31, 2010 76,968,285 $ 198,857 Issued for cash 31,050,000 223,958 Issued for cash – exercise of options 197,083 617 Allocation of contributed surplus – exercise of options - 269 Share issuance costs - (11,853) Balance, June 30, 2011 108,215,368 $ 411,848
The Company has authorized an unlimited number of voting common shares without nominal or par value.
On June 29, 2011, Parex closed the acquisition of a company that held the 50 percent interest Parex did not own in four Llanos Basin blocks in Colombia for
total consideration of $255.0 million, before closing adjustments. The Acquisition was effective January 1, 2011. The Acquisition was funded through a
bought deal public offering with a syndicate of underwriters which closed on May 17, 2011. Pursuant to the offering, the Company issued 31,050,000
subscription receipts at Cdn$7.00 each for gross proceeds of Cdn$217.35 million (Cdn$206.5 million net) and Cdn$85.0 million (Cdn$81.6 million net) of
5.25 percent extendible convertible unsecured subordinated debentures for total combined gross proceeds of Cdn$302.35 million (Cdn$288.1 million net).
Upon closing of the Acquisition each subscription receipt was automatically exchanged for one Parex common share.
b) Stock options
The Company has a stock option plan (the “Option Plan”) which provides for the issuance of options to the Company’s directors, officers, employees and
consultants to acquire common shares. The maximum number of options reserved for issuance under the Option Plan may not exceed 10 percent of the
number of common shares issued and outstanding. The options typically vest over a three-year period and expire five years from the date of grant.
Number of options Weighted average
exercise price Cdn$/option Balance, December 31, 2010 5,639,339 4.64 Granted 225,000 7.47 Exercised (197,083) 3.11 Forfeited (100,000) 3.04 Balance, June 30, 2011 5,567,256 4.83

Parex Resources Inc. June 30, 2011
Stock options outstanding and the weighted average remaining life of the stock options at June 30, 2011 are as follows:
Options outstanding Options vested
Exercise price Cdn$
Number of options
Weighted average remaining life (years)
Weighted average exercise price
Cdn$/option Number of
options
Weighted average remaining life (years)
Weighted average exercise price
Cdn$/option $3.04 - $4.06 2,989,167 3.3 3.05 834,996 3.3 3.04 $4.30 - $7.41 940,000 4.0 5.41 198,330 3.7 4.75 $7.67 - $7.84 1,638,089 4.4 7.76 - - -
5,567,256 3.7 4.83 1,033,326 3.4 3.37
The fair value of each option granted is estimated on the date of grant using the Black-Scholes option pricing model with the following weighted average
assumptions:
For the six months ended June 30, 2011 2010 Risk-free interest rate (%) 1.83 2.07 Expected life (years) 3 3 Expected volatility (%) 58 64 Expected dividends - -
The weighted average fair value at the grant date for the period ended June 30, 2011 was Cdn$2.99 per option (year ended December 31, 2010 – Cdn$3.08 per
option).
c) Share appreciation rights
Parex Trinidad and Parex Colombia initiated a share appreciation rights (“SARs”) plan that provides for the issuance of SARs to certain employees. The plan
entitles the holders to receive a cash payment equal to the excess of the market price of the Company’s common shares at the time of exercise over the grant
price. At any time, if the current market price of the Company’s common shares exceeds four times the grant price, Parex has the option to require the holders
to exercise all vested SARs. SARs typically vest over a three-year period and expire five years from the date of grant. The SARs liability cannot be settled by
the issuance of common shares.
Number of SARs Weighted average
exercise price Cdn$/SAR Balance, December 31, 2010 745,833 $ 6.34 Granted 243,750 8.51 Forfeited (18,750) 8.20 Balance, June 30, 2011 970,833 $ 6.84
As at June 30, 2011, 353,125 SARs were vested (year ended December 31, 2010 – nil).
Obligations for payments of cash under the SARs plan are accrued as compensation expense over the vesting period based on the fair value of SARs, subject
to appreciation limits specified in the plan. The fair value of SARs is measured using the Black-Scholes pricing model at each reporting date based on
weighted average pricing assumptions noted below:
For the six months ended June 30, 2011 2010 Risk-free interest rate (%) 1.83 1.90 Expected life (years) 3 3 Expected volatility (%) 58 67 Expected dividends - -
As at June 30, 2011, the total SARs liability accrued is $1.7 million (as at December 31, 2010 - $946,000) of which $381,000 (as at December 31, 2010 -
$429,000) is classified as long-term in accordance with the three year vesting period. For the six months ended June 30, 2011, Parex recorded $707,000 of
compensation costs related to the outstanding SARs (six months ended June 30, 2010 – $62,000).

Parex Resources Inc. June 30, 2011
d) Per share amounts
The following table summarizes the common shares used in calculating net loss per common share:
For the six months ended June 30, 2011 2010 Weighted average common shares outstanding
Basic 77,316 63,870 Effect of stock options 1,568 110 Diluted 78,884 63,980
14. Convertible Debenture
On June 29, 2011, Parex issued Cdn$85.0 million of convertible unsecured subordinated debentures (the “Debentures”) with an annual coupon of 5.25 percent
maturing on June 30, 2016. The Debentures have a face value of $1,000 per debenture, are convertible into common shares at the option of the holder at a
conversion price of Cdn$10.15 per common share and represent a conversion rate of approximately 98.52 common shares per Debenture. The Debentures pay
interest semi-annually in arrears on June 30 and December 31 of each year, commencing on December 31, 2011. In the event that a holder of Debentures
exercises the conversion feature, such holder shall be entitled to receive accrued and unpaid interest, in addition to the applicable number of common shares to
be received on conversion, for the period from the latest interest payment date to the date of conversion.
On issuance, the Debentures were split between the financial liability and the equity conversion feature (which is classified as a derivative financial liability
under IFRS). The amount of the financial liability portion was determined by subtracting issuance costs and the fair value of the conversion feature from the
principal amount of the Debentures. As at June 29, 2011, the $87.5 million (Cdn$85.0 million) gross issuance proceeds resulted in $64.3 million (Cdn$62.4
million) being classified as a liability and $23.3 million (Cdn$22.6 million) being classified as a derivative financial liability. The fair value of the conversion
feature is estimated every balance sheet date with changes in the fair value estimate between periods recognized in the statement of comprehensive loss as
finance expense.
The following table summarizes the accounting for the convertible debentures:
Liability Derivative
Liability
Total Issuance of convertible debenture on June 29, 2011 (net of $3.5 million of issuance costs)
$ 60,809 $ 23,266 $ 84,075
Accretion 8 - 8 Derivative loss - 1,048 1,048 Foreign exchange effect 383 158 541 Balance at June 30, 2011 $ 61,200 $ 24,472 $ 85,672
The liability portion is measured at amortized cost and will accrete up to the principal balance at maturity using the effective interest rate method. The
accretion and the interest paid are charged to finance expense in the consolidated statement of comprehensive loss. The derivative financial liability is
measured at fair value through profit or loss, with changes to the fair value being recorded in finance expense.
The fair value of the derivative financial liability is determined using the Black Scholes valuation model and the following assumptions were used:
2011 2010 Risk-free interest rate (%) 1.83 - Expected life (years) 5 - Expected volatility (%) 47 - Expected dividends - -
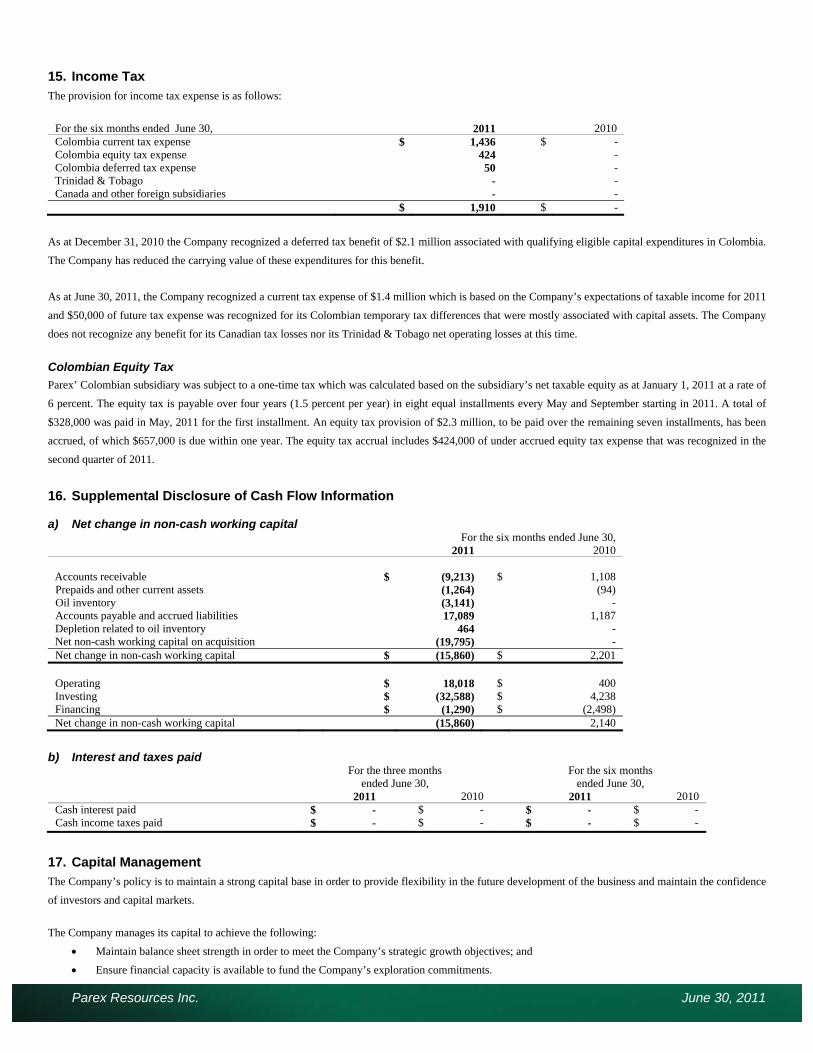
Parex Resources Inc. June 30, 2011
15. Income Tax
The provision for income tax expense is as follows:
For the six months ended June 30, 2011 2010 Colombia current tax expense $ 1,436 $ - Colombia equity tax expense 424 - Colombia deferred tax expense 50 - Trinidad & Tobago - - Canada and other foreign subsidiaries - - $ 1,910 $ -
As at December 31, 2010 the Company recognized a deferred tax benefit of $2.1 million associated with qualifying eligible capital expenditures in Colombia.
The Company has reduced the carrying value of these expenditures for this benefit.
As at June 30, 2011, the Company recognized a current tax expense of $1.4 million which is based on the Company’s expectations of taxable income for 2011
and $50,000 of future tax expense was recognized for its Colombian temporary tax differences that were mostly associated with capital assets. The Company
does not recognize any benefit for its Canadian tax losses nor its Trinidad & Tobago net operating losses at this time.
Colombian Equity Tax
Parex’ Colombian subsidiary was subject to a one-time tax which was calculated based on the subsidiary’s net taxable equity as at January 1, 2011 at a rate of
6 percent. The equity tax is payable over four years (1.5 percent per year) in eight equal installments every May and September starting in 2011. A total of
$328,000 was paid in May, 2011 for the first installment. An equity tax provision of $2.3 million, to be paid over the remaining seven installments, has been
accrued, of which $657,000 is due within one year. The equity tax accrual includes $424,000 of under accrued equity tax expense that was recognized in the
second quarter of 2011.
16. Supplemental Disclosure of Cash Flow Information a) Net change in non-cash working capital
For the six months ended June 30, 2011 2010
Accounts receivable $ (9,213) $ 1,108
Prepaids and other current assets (1,264) (94) Oil inventory (3,141) - Accounts payable and accrued liabilities 17,089 1,187 Depletion related to oil inventory 464 - Net non-cash working capital on acquisition (19,795) - Net change in non-cash working capital $ (15,860) $ 2,201 Operating $ 18,018 $ 400 Investing $ (32,588) $ 4,238 Financing $ (1,290) $ (2,498) Net change in non-cash working capital (15,860) 2,140
b) Interest and taxes paid
For the three months ended June 30,
For the six months ended June 30,
2011 2010 2011 2010 Cash interest paid $ - $ - $ - $ - Cash income taxes paid $ - $ - $ - $ -
17. Capital Management
The Company’s policy is to maintain a strong capital base in order to provide flexibility in the future development of the business and maintain the confidence
of investors and capital markets.
The Company manages its capital to achieve the following:
Maintain balance sheet strength in order to meet the Company’s strategic growth objectives; and
Ensure financial capacity is available to fund the Company’s exploration commitments.

Parex Resources Inc. June 30, 2011
The Company has not arranged a banking credit facility. However, the Company has provided a general security agreement to Export Development Canada
(“EDC”) in connection with the performance security guarantees that support letters of credit provided to the Colombian National Hydrocarbon Agency
(“ANH”) related to the initial exploration work commitments (see note 20 - Commitments).
As at June 30, 2011, the Company’s net working capital was $100.9 million (December 31, 2010 – $115.1 million), largely attributable to the November 16,
2010 bought-deal equity financing which raised gross proceeds of $73.7 million (Cdn$75.4 million) from the issuance of 13,000,000 common shares at
Cdn$5.80 per share and the May 17, 2011 offering which provided approximately $41.3 million (Cdn$40.1 million) of additional funds beyond those required
to close the Acquisition (see Note 9 – Business Combinations).
Parex has the ability to adjust its capital structure by issuing new equity and making adjustments to its capital expenditure program to the extent the capital
expenditures are not committed. The Company’s working capital is in excess of its current commitments and the Company has no bank debt. The Company
considers its capital structure to include common share capital plus the Debentures (excluding the derivative financial liability associate with the convertible
debentures) at this time. As at June 30, 2011 common share capital was $411.8 million (December 31, 2010 - $198.9 million) and the Debentures’ face value
balance was Cdn$85.0 million (December 31, 2010 – nil).
18. Financial Instruments and Risk Management
The Company’s non-derivative financial instruments recognized in the balance sheet consist of cash and cash equivalents, accounts receivable, accounts
payable and accrued liabilities and the liability portion of the convertible debenture. Non-derivative financial instruments are recognized initially at fair value.
The fair values of the current financial instruments approximate their carrying value due to their short-term maturity.
The conversion feature associated with convertible debentures is a derivative financial liability. Derivative liabilities are recorded upon recognition and
subsequently at each balance sheet date at fair value, with changes in fair value being recognized in the statement of comprehensive income (loss).
a) Credit risk
Credit risk is the risk of loss associated with the inability of a third party to fulfill its payment obligations. The Company is exposed to the risk that third
parties that owe it money do not meet their underlying obligations. A substantial portion of the Company’s accounts receivable is with joint venture partners
in the countries in which the Company operates. The Company assesses the financial strength of its joint venture partners and marketing counterparties in its
management of credit exposure.
b) Liquidity risk
The Company’s approach to managing liquidity risk is to have sufficient cash and/or credit facilities to meet its obligations when due. Management typically
forecasts cash flows for a period of 12 to 36 months to identify any financing requirements. Liquidity is managed through daily and longer-term cash, debt
and equity management strategies. These strategies include estimating future cash generated from operations based on reasonable production and pricing
assumptions, estimating future discretionary and non-discretionary capital expenditures and assessing the amount of equity or debt financing available. As at
June 30, 2011, the Company considers itself to be well-capitalized, with working capital in excess of current commitments. The Debentures are unsecured
and subordinated with expiry on June 30, 2016.
The following are the contractual maturities of financial liabilities at June 30, 2011:
Less than 1
year 1-3
Years 4-5
Years
Thereafter Total Accounts payable and accrued liabilities $ 41,224 $ - $ - $ - $ 41,224 Current and equity tax payable 2,657 - - - 2,657 SARs payable 1,272 - - - 1,272 Convertible debentures(1) - - 88,128 - 88,128 Interest on convertible debentures(1) 5,210 13,886 4,050 - 23,146 Total $ 50,363 $ 13,886 $ 92,178 $ - $ 156,427
(1) Balances denominated in Cdn$ have been translated at the June 30, 2011 exchange rate.

Parex Resources Inc. June 30, 2011
c) Commodity price risk
The Company is exposed to commodity price movements as part of its operations, particularly in relation to the prices received for its oil production. Crude
oil is sensitive to a numerous worldwide factors, many of which are beyond the Company’s control. Changes in global supply and demand fundamentals in
the crude oil market and geopolitical events can significantly affect crude oil prices. Consequently, these changes could also affect the value of the
Company’s properties, the level of spending for exploration and development and the ability to meet obligations as they come due. The Company’s oil
production is sold under short-term contracts, exposing it to the risk of near-term price movements.
d) Foreign currency risk
The Company is exposed to foreign currency risk as various portions of its cash balances are held in Canadian dollars (Cdn$), Colombian pesos (COP$) and
Trinidad & Tobago dollars (TT$) while its committed capital expenditures are expected to be primarily denominated in US dollars. The Company has not
entered into any foreign currency hedges or swaps.
The table below summarizes the annualized sensitivities of the Company’s net income to changes in the fair value of financial instruments outstanding as at
June 30, 2011, resulting from changes in the specified variable, with all other variables held constant. These sensitivities are limited to the impact of changes
in a specified variable applied to financial instruments only and do not represent the impact of a change in the variable on the operating results of the
Company taken as a whole.
The following depicts the impact to net loss for the period had the exchange rate changed by 1 cent:
Impact on net loss Foreign currency exchange rate
Cdn$/US$ $ 867 COP$/US$ $ 276 TT$/US$ $ 6
19. Segmented Information
The Company has foreign subsidiaries and the following segmented information is provided:
For the three months ended June 30, 2011
Canada Colombia
Trinidad & Tobago
Total
Oil and natural gas sales $ - $ 10,719 $ - $ 10,719 Royalties - (1,195) - (1,195) Revenue, net - 9,524 - 9,524 Expenses
Production - 817 - 817 Transportation - 1,439 - 1,439 General and administrative 1,400 1,763 447 3,610 Transaction costs - 1,846 - 1,846 Share-based compensation 1,274 211 77 1,562 Depletion, depreciation and amortization 145 1,588 18 1,751 Foreign exchange gain 1,231 (267) 11 975
4,050 7,397 553 12,000 Finance income 250 49 153 452 Finance expense (1,608) (10) (2) (1,620) (1,358) 39 151 (1,168) Net income (loss) before tax (5,408) 2,166 (402) (3,644) Current and equity tax expense 1,860 - 1,860 Deferred tax expense (recovery) - (816) - (816) Net income (loss) $ (5,408) $ 1,122 $ (402) $ (4,688) Capital assets (end of period) $ 1,016 $ 349,508 $ 35,214 $ 385,738 Capital expenditures $ 26 $ 21,764 $ 1,539 $ 23,329 Total assets (end of period) $ 108,499 $ 445,148 $ 40,052 $ 593,699

Parex Resources Inc. June 30, 2011
For the three months ended June 30, 2010
Canada Colombia
Trinidad & Tobago
Total
Oil and natural gas sales $ 32 $ - $ - $ 32 Royalties - - - - Revenue, net 32 - - 32 Expenses
Production 21 - 21 General and administrative 868 1,112 642 2,622 Share-based compensation 836 56 6 898 Depletion, depreciation and amortization 217 249 17 483 Foreign exchange loss (gain) 591 (50) 4 545
2,533 1,367 669 4,569 Finance income 53 34 - 87 Finance expense (1) - - (1) 52 34 - 86 Net income (loss) before tax (2,449) (1,333) (669) (4,451) Current and equity tax expense - - - - Deferred tax expense - - - - Net loss $ (2,449) $ (1,333) $ (669) $ (4,451) Capital assets (end of period) $ 1,566 $ 399 $ 75 $ 2,040 Capital expenditures $ 44 $ 4,134 $ 6,294 $ 10,472 Total assets (end of period) $ 68,637 $ 27,630 $ 31,522 $ 127,789
For the six months ended June 30, 2011
Canada Colombia
Trinidad & Tobago
Total
Oil and natural gas sales $ - $ 20,572 $ - $ 20,572 Royalties - (1,877) - (1,877) Revenue, net - 18,695 - 18,695 Expenses
Production - 1,235 - 1,235 Transportation - 3,684 - 3,684 General and administrative 3,097 3,194 780 7,071 Transaction costs - 1,846 - 1,846 Share-based compensation 2,583 617 216 3,416 Depletion, depreciation and amortization 285 2,322 35 2,642 Foreign exchange loss (gain) (321) (105) 13 (413)
5,644 12,793 1,044 19,481 Finance income 437 69 153 659 Finance expense (1,608) (17) (3) (1,628) (1,171) 52 150 (969) Net income (loss) before taxes (6,815) 5,954 (894) (1,755) Current and equity tax expense 1,860 - 1,860 Deferred tax expense - 50 - 50 Net income (loss) $ (6,815) $ 4,044 $ (894) $ (3,665) Capital assets (end of period) $ 1,016 $ 349,508 $ 35,214 $ 385,738 Capital expenditures $ 64 $ 36,490 $ 4,927 $ 41,481 Total assets (end of period) $ 108,499 $ 445,148 $ 40,052 $ 593,699

Parex Resources Inc. June 30, 2011
For the six months ended June 30, 2010
Canada Colombia
Trinidad & Tobago
Total
Revenue Oil and natural gas sales $ 68 $ - $ - $ 68 Royalties - - - -
Revenue, net 68 - - 68 Expenses
Production 40 - - 40 General and administrative 3,408 1,888 983 6,279 Share-based compensation 1,548 56 6 1,610 Depletion, depreciation and amortization 442 295 22 759 Foreign exchange loss (gain) (41) (411) 11 (441)
5,397 1,828 1,022 8,247 Finance income 103 53 3 159 Finance expense (2) - - (2) 101 53 3 157 Net loss before taxes (5,228) (1,775) (1,019) (8,022) Current and equity tax expense - - - - Deferred tax expense - - - - Net loss $ (5,228) $ (1,775) $ (1,019) $ (8,022) Capital assets (end of period) $ 1,566 $ 300 $ 174 $ 2,040 Capital expenditures $ 62 $ 8,742 $ 8,303 $ 17,107 Total assets (end of period) $ 68,637 $ 27,630 $ 31,522 $ 127,789
20. Commitments
a) Llanos Basin (“LLA”) Blocks (Colombia)
On June 29, 2011, Parex acquired the other 50 percent working interest Parex did not previously own in Blocks LLA-16, 20, 29 and 30 through the
acquisition of Remora. After closing of the Acquisition, Parex holds 100 percent working interest in the following exploration blocks in the Llanos Basin of
Colombia: Block LLA-16, Block LLA-20, Block LLA-29, Block LLA-30 and Block LLA-57. The Company is the operator of all five blocks. The effective
date of the exploration and production (“E&P”) contracts is April 20, 2009 for Blocks LLA-16 and LLA-20, October 20, 2009 for Blocks LLA-29 and LLA-30 and
February 17, 2011 for Block LLA-57. The E&P contracts consist of an initial exploration phase of 36 months with the option for the parties to enter into a
second 36-month exploration phase. The exploration work commitments for the initial exploration phase, before reduction for the work incurred to date, total
$102.2 million to the Company representing 21 wells and 1,003 square kilometres (“km2”) of three-dimensional (“3D”) seismic of which seven wells and 900
km2 of seismic have been completed as at June 30, 2011.
In Colombia, the Company has provided guarantees to the ANH totaling $50.0 million to support the initial exploration work commitments in respect of the
five blocks. The guarantees have been provided in the form of letters of credit for 24-month terms expiring in January 2013 for Block LLA-16 and Block
LLA-20, May 2013 for Block LLA-29 and Block LLA-30 and September 2014 for Block LLA-57.
EDC has provided the Company’s bank with performance security guarantees to support 100 percent of the letters of credit issued on behalf of Parex. The
EDC guarantees have been secured by a general security agreement issued by Parex in favour of EDC. The letters of credit issued to the ANH have not yet
been reduced for work that has been performed to date.
The value of the Company’s exploration commitments remaining at June 30, 2011 in respect of the Llanos Basin blocks are estimated to be as follows:
2011 $ 18,872 2012 35,250 Thereafter - $ 54,122

Parex Resources Inc. June 30, 2011
b) Central Range Blocks and Moruga Block (Trinidad & Tobago)
Parex holds a working interest in the Central Range Shallow and Central Range Deep Blocks located onshore Trinidad & Tobago. The blocks are subject to
Production Sharing Contracts (“PSCs”) that were signed on September 18, 2008. The Company is party to a joint venture agreement with Niko Resources
Ltd. (formerly Voyager Energy Ltd.) (“Niko”), and is operator of the blocks. During the exploration phase of the PSCs, Parex and Niko will each hold a 50
percent working interest. The Petroleum Company of Trinidad & Tobago (“Petrotrin”) has the right to participate at a 35 percent working interest in any
development on the Central Range Shallow Block and at a 20 percent working interest in any development on the Central Range Deep Block. The PSCs
provide for an initial exploration phase of 48 months. On August 9, 2010, the Ministry of Energy and Energy Affairs (“MEEA”) approved an extension of the
first exploration phase to 60 months.
The PSCs have minimum work commitments in the initial 60-month exploration phase of the contracts. The work commitments total 100 kilometres of two-
dimensional (“2D”) seismic, 168 square kilometres of 3D seismic, one deep well drilled to a minimum depth of 12,000 feet and two shallow wells drilled to a
maximum depth of 4,500 feet. Under the joint venture agreement with Niko, Parex will pay 100 percent of the first $10 million of seismic acquisition costs
during the exploration phase, of which approximately $8.5 million had been incurred as at June 30, 2011. Petrotrin is carried through the minimum work
commitments of the contracts.
The Company has purchased a performance bond and provided a guarantee to the underwriters of the bond in the amount of approximately $33 million to
cover both its and Niko’s share of the financial guarantees required under the PSCs for the initial four-year exploration phase. In the event of default by Niko,
the joint venture agreement provides that Niko’s working interest shall vest in Parex. The obligations under the PSCs are to perform the exploration work
commitments, irrespective of actual cost. Parex has no obligation to spend the actual amount guaranteed but to perform the work obligation. The amount of
the bond has not been reduced to reflect work that has been performed to date.
Parex has entered into a farm-in agreement with Primera Energy Resources Ltd. and Primera Oil and Gas Limited (together “Primera”) in 2009 to acquire a
working interest in the Moruga Block Exploration and Production Licence (“Moruga Block”). The earning terms of the Moruga Block require Parex to drill
one exploratory well to a depth of 8,600 feet or the top of the Cretaceous, whichever occurs first, and one exploratory well to 10,500 feet. Parex will earn a 50
percent working interest in the Moruga Block by paying 95 percent of all costs for drilling and evaluating these two exploration wells. The exploration term of
the Moruga Block exploration licence expires on August 29, 2013. The Company has fulfilled the earning requirements of the Moruga Block and the MEEA
provided confirmation of earning on April 27, 2011.
The Company’s share of exploration and other commitments in respect of the Central Range Blocks, including the remaining Niko carry and annual financial
obligations in the Moruga block remaining at June 30, 2011, are estimated to be as follows:
Exploration Other Total
2011 $ 7,677 $ 390 $ 8,067 2012 9,157 1,521 10678 Thereafter - 262 262 $ 16,834 $ 2,173 $ 19,007
These amounts do not include production bonuses and other payments that will vary depending on production levels due to the uncertainty of their amount
and timing.
c) Operating leases
In the normal course of business, Parex has entered into arrangements and incurred obligations that will impact the Company’s future operations and liquidity.
These commitments include leases for office space and accommodations.
The existing minimum lease payments for office space and accommodations June 30, 2011 are as follows:
Total 2011 2012 2013 2014 2015
Office and accommodations $ 2,633 $ 622 $ 717 $ 577 $ 574 $ 143

Parex Resources Inc. June 30, 2011
d) Drilling rig contracts
The Company has entered into contracts for drilling rigs in Colombia and Trinidad & Tobago. Rig contracts in both countries during the quarter included
commitments to use the rigs for a minimum period on terms consistent with normal industry practice. The Company anticipates that, given its planned level
of drilling activity to meet exploration commitments in both countries, the rigs will be fully utilized for the duration of their contracts and no material
additional charges will be incurred.
21. Transition to IFRS
As disclosed in Note 2, these interim consolidated financial statements represent Parex’ presentation of the financial results of operations and financial
position under IFRS for the period ended June 30, 2011, in conjunction with the Company’s annual audited consolidated financial statements to be issued
under IFRS as at and for the year ended December 31, 2011. As a result, the interim consolidated financial statements have been prepared in accordance with
IFRS 1, “First-time Adoption of International Financial Reporting Standards” and with IAS 34, “Interim Financial Reporting”, as issued by the IASB.
Previously, the Company prepared its interim and annual Consolidated Financial Statements in accordance with Canadian GAAP.
IFRS 1 requires the presentation of comparative information as at the January 1, 2010 transition date and subsequent comparative periods as well as the
consistent and retrospective application of IFRS accounting policies. To assist with the transition, IFRS 1 contains certain mandatory and optional exemptions
for first-time adopters to alleviate the retrospective application of all IFRS.
The following reconciliations present the adjustments made to the Company’s previous GAAP financial results of operations and financial position to comply
with IFRS 1. A summary of the significant accounting policy changes and applicable exemptions is discussed following the reconciliations. Reconciliations
include the Company’s consolidated balance sheets as at June 30, 2010, and consolidated statements of comprehensive income (loss) for the three and six
months ended June 30, 2010.
(i) Reconciliation of equity and comprehensive income as reported under previous GAAP to IFRS
Consolidated Balance Sheet IFRS Adjustments
As at June 30, 2010 Previous GAAP E&E
Note 21(ii)b
Pre-licensing costs
Note 21(ii)a SARS
Note 21(ii)c
IFRS
Assets Currents assets
Cash and cash equivalents $ 80,643 $ - $ - $ - $ 80,643 Accounts receivable 1,889 - - - 1,889 Prepaids and other current assets 444 - - - 444 82,976 - - - 82,976
Exploration and evaluation - 42,773 - - 42,773 Property, plant and equipment 45,207 (42,773) (394) - 2,040
$ 128,183 $ - $ (394) $ - $ 127,789 Liabilities and Equity Current liabilities
Accounts payable $ 10,031 $ - $ - $ 62 $ 10,093 10,031 - - 62 10,093
Decommissioning liabilities 54 - - - 54 10,085 - - - 10,147
Shareholders’ equity Share capital 128,726 - - - 128,726 Contributed surplus 2,319 - - - 2,319 Deficit (12,947) - (394) (62) (13,403)
118,098 - (394) (62) 117,642 $ 128,183 $ - $ (394) $ - $ 127,789

Parex Resources Inc. June 30, 2011
Consolidated Statements of Loss and Comprehensive Loss For the three months ended June 30, 2010 For the six months ended June 30, 2010
IFRS Adjustments
IFRS Adjustments
Previous
GAAP SARs
Note 21(ii)c IFRS Previous
GAAP SARs
Note 21(ii)c IFRS
Oil and natural gas sales $ 32 $ - $ 32 $ 68 $ - $ 68 Royalties - - - - - - Revenue, net 32 - 32 68 - 68 Expenses
Production 21 - 21 40 - 40 Transportation - - - - - - Exploration and evaluation - - - - - - Depletion, depreciation and amortization 483 - 483 759 - 759 General and administrative 2,622 - 2,622 6,279 - 6,279 Share based compensation 836 62 898 1,548 62 1,610 Foreign exchange loss (gain) 545 - 545 (441) - (441) $ 4,507 $ 62 $ 4,569 $ 8,185 $ 62 $ 8,247
Finance income 87 - 87 159 - 159 Finance expense (1) - (1) (2) - (2) Net finance expense $ 86 $ - $ 86 $ 157 $ - $ 157 Net loss before tax $ (4,389) $ (62) $ (4,451) $ (7,960) $ (62) $ (8,022) Colombian equity tax - - - - - - Deferred tax expense (recovery) - - - - - - - - - - - - Net loss and comprehensive loss for the year $ (4,389) $ (62) $ (4,451) $ (7,960) $ (62) $ (8,022)
(ii) IFRS Adjustments a) Pre-licence costs
Under previous GAAP, the Company capitalized pre-licence costs of $394,000 as at December 31, 2009. These expenditures were incurred prior to obtaining
legal rights to explore in Trinidad & Tobago and Colombia. Under IFRS, the Company is required to expense pre-licence costs resulting in a $394,000
decrease in PP&E with a corresponding charge to retained earnings.
b) Exploration and evaluation assets
E&E assets at January 1, 2010 were deemed to be $25.9 million, representing the unproved properties balance under previous GAAP. The Company
reclassified $25.9 million from PP&E to E&E assets as at January 1, 2010. As at June 30, 2010, the Company’s E&E assets were $42.8 million including
$18.1 million in Colombia and $24.7 million in Trinidad & Tobago. c) Share appreciation rights
The Company’s SARs plan was accounted for using the intrinsic value method under previous GAAP. Under IFRS, the Company is using a fair value
method, in this case the Black-Scholes pricing model to value the SARs liability. This IFRS difference has no effect on the Company’s opening balance sheet
at January 1, 2010 as the SARs plan was initiated in the second quarter of 2010. For the period ended June 30, 2010, an increase to share-based compensation
of $62,000 was recognized with a corresponding increase to accounts payable and accrued liabilities of $62,000.
iii) Adjustments to the statement of cash flows
The transition from previous GAAP to IFRS had no significant impact on cash flows generated by the Company except that, under IFRS, cash flows relating
to interest are classified as operating, investing or financing in a consistent manner each period. Under previous GAAP, cash flows relating to interest
payments were classified as operating.

Parex Resources Inc. June 30, 2011
DIRECTORS Norman F. McIntyre Chairman of the Board Curtis D. Bartlett John F. Bechtold Robert J. Engbloom Wayne K. Foo Ron D. Miller W. A. (Alf) Peneycad Paul D. Wright OFFICERS AND SENIOR EXECUTIVES Wayne K. Foo President, Chief Executive Officer Barry B. Larson VP Operations, Chief Operating Officer Kenneth G. Pinsky VP Finance, Chief Financial Officer David R. Taylor VP Exploration & Business Development
CORPORATE HEADQUARTERS Parex Resources Inc. 1900, Livingston Place, West Tower 250 Second Street S.W., Calgary, Alberta, Canada T2P 0C1 Tel: 403-265-4800 Fax: 403-265-8216 E-mail: [email protected] OPERATING OFFICES Parex Resources Colombia Ltd. Sucursal Calle 113 No. 7-21, Of. 706, Edificio Teleport, Torre A, Bogotá, Colombia Tel: 571-629-1716 Fax: 571-629-1786 Parex Resources (Trinidad) Ltd. 67 Battoo Blvd, Battoo Lands, Marabella, Trinidad & Tobago
Tel: 868-221-5868 Fax: 868-221-1486
AUDITORS PricewaterhouseCoopers LLP Calgary, Alberta LEGAL COUNSEL Burnet, Duckworth & Palmer LLP Calgary, Alberta
TRANSFER AGENT AND REGISTRAR Valiant Trust Company Calgary, Alberta
RESERVES EVALUATORS GLJ Petroleum Consultants Ltd. Calgary, Alberta
INVESTOR RELATIONS Michael Kruchten Tel: 403-517-1733 E-mail: [email protected] Kenneth G. Pinsky Tel: 403-517-1729 E-mail: [email protected]
Website: www.parexresources.com
ABBREVIATIONS
Oil and Natural Gas Liquids Natural Gas bbls barrels mcf one thousand cubic feet mbbls one thousand barrels mmcf one million cubic feet mmbbls one million barrels bcf one billion cubic feet NGLs natural gas liquids Mcf/d one thousand cubic feet per day bbls/d barrels of oil or natural gas liquids per day MMcf/d one million cubic feet per day mbbls/d one thousand barrels per day Other
BOE or boe barrel of oil equivalent, using the conversion factor of 6 Mcf: 1 bbl mboe one thousand barrels of oil equivalent mmboe one million barrels of oil equivalent bfpd barrels of fluid per day boe/d barrels of oil equivalent per day bopd barrels of oil per day WTI West Texas Intermediate
"BOEs" may be misleading, particularly if used in isolation. A BOE conversion ratio of six thousand cubic feet of natural gas to one barrel of oil equivalent (6 mcf: 1 bbl) is based on an energy equivalency conversion method primarily applicable at the burner tip and does not represent a value equivalency at the wellhead.