for the six financial (6) months ended statements …
TRANSCRIPT

FOR THE SIX(6) MONTHS ENDEDDecember 31, 2020
(UNAUDITED)
FinancialStatements
Dadex Eternit Limited
FOR THE SIX(6) MONTHS ENDEDDecember 31, 2020
(UNAUDITED)

1

2

3

4
The Directors are pleased to present their review together with the financial statements of the Company for six months ended December 31, 2020. On October 28, 2020 new board have been elected for the next term. Mrs. Amber Ahmed Motiwala and Mrs. Ayesha Allawala have been elected as independent female directors in place of Mr. Qazi Sajid Ali and Mr. Danish Dada. The Company and management would like to thank the outgoing directors for their invaluable services to the Company and welcome the new directors and hope that the Company will benefit from their experience. Economic activities had returned to the growth trajectory, despite outbreak of second wave of COVID-19 in Pakistan. Pakistani Rupee showed strong resistance against the US dollar during the period, despite serious impact of COVID-19 on the economy. The overall positive momentum reflected in improved valuations at Pakistan Stock Exchange which continued its upward trajectory. The large-scale manufacturing (LSM) sector output index increased by 11.4% in December 2020 as compared to December 2019 and current account posted a surplus with a double-digit growth in foreign remittance inflows. The Company achieved a gross sales of Rs. 1,640.216 million (December 2019: Rs. 1,601.170 million) during the six months. Net sales achieved during the period was Rs.1,391.696 million, being 2.79% higher than the last year. Company achieved gross profit margin of 13.20%. Distribution expenses increased by 2.30%, Administrative costs decreased by 4.00% as compared to last year. Company earned other operating income of Rs. 131.921 million which has resulted in the operating profit of Rs. 155.943 million (December 2019: Operating Profit of Rs. 88.17 million). Due to decrease in the markup rate, finance cost decreased by 26.97%, resulting in a net profit after tax of Rs. 47.151 million (December 2019: net loss after tax of 47.38 million). This has resulted in earning per share of Rs. 4.38 (December 2019: Loss per share of Rs. 4.40).

5
The Outlook of the Construction industry will continue to improve. It is expected that Government spending on development projects will increase resulting in increase in demand for building material products. With the government committed towards fulfillment of CPEC, construction work over CPEC related projects is expected to begin in due course. Similarly, rising population and increasing urbanization has also created shortage of houses in the country which is being addressed by the government through Naya Pakistan Housing Scheme (NPHS). These positive announcements will create additional demand for the construction industry. The Company is committed to maintaining and further increasing its customer base and exploring new markets. The Company’s operations were affected due to disconnection of gas supply by SSGC to non-export oriented
industries which has badly impacted margins of the Company as the cost of production have increased due to shifting toward diesel for generation of power for production. The management will continue to explore new sources of raw material and strict control on working capital management to achieve positive results. The Directors and Management deeply appreciate the continued support and commitment of all our stakeholders in this challenging period.
Karachi:
February 25, 2021 On Behalf of the Board of Directors
Qazi Sajid Ali Abu Talib H.K. Dada
Chief Executive Director

6

7

8
CONDENSED INTERIM STATEMENT OF FINANCIAL POSITION AS AT DECEMBER 31, 2020
December 31, June 30,2020 2020
(Unaudited) (Audited)Note
ASSETSNON - CURRENT ASSETS
Property, plant and equipmentOperating fixed assets 7 1,529,141 1,569,762 Capital work in progress 8 8,522 7,683
Intangible assets 267 88 Investment property 32,995 34,260 Long-term investment 9 - - Long-term loans and advances 1,792 2,423 Long-term security deposits 23,348 28,709 Deferred tax asset 151,981 156,981
1,748,046 1,799,906 CURRENT ASSETS
Stores, spare parts and loose tools 45,380 50,669 Stock-in-trade 10 689,477 597,668 Trade debts 11 257,118 268,897 Loans and advances 127,152 85,360 Trade deposits and short term prepayments 84,768 65,686 Other receivables 5,587 9,046 Income tax refund due from Government 129,838 145,757 Taxation - net 15,021 - Cash and bank balances 66,645 25,010 Non-current assets held for sale 358,800 358,800
1,779,786 1,606,893 TOTAL ASSETS 3,527,832 3,406,799 EQUITY AND LIABILITIES SHARE CAPITAL AND RESERVES
Authorized share capital12,000,000 (June 30, 2020: 12,000,000) ordinary shares of Rs. 10 each 120,000 120,000
8,000,000 (June 30, 2020: 8,000,000) 'B' class ordinary shares of
Rs.10 each80,000 80,000
200,000 200,000
Issued, subscribed and paid-up capital 12 107,640 107,640 Reserves (319,322) (378,866) Surplus on revaluation of property, plant and equipment 1,181,883 1,194,276
970,201 923,050 NON - CURRENT LIABILITIES
Long term financing 30,682 41,151 Lease liabilities 26,006 43,291 Deferred income 1,383 6,536 GIDC Payable 29,836 50,954
87,907 141,932 CURRENT LIABILITIES
Trade and other payables 13 1,121,092 1,033,279 Short-term borrowings 14 1,204,886 1,159,018 Accrued markup 71,372 67,427 Current portion of deferred income 3,440 2,434 Current portion of long-term financing 28,630 16,442 Current portion of lease liabilities 23,537 30,585 Taxation - net - 15,919 Unclaimed dividend 16,767 16,713
2,469,724 2,341,817 TOTAL EQUITY AND LIABILITIES 3,527,832 3,406,799 CONTINGENCIES AND COMMITMENTS 15
The annexed notes from 1 to 28 form an integral part of this condensed interim financial statement.
(Rupees in thousands)

9
CONDENSED INTERIM STATEMENT OF PROFIT OR LOSS
FOR THE PERIOD ENDED DECEMBER 31, 2020 (UN-AUDITED)
December 31, December 31, December 31, December 31,
2020 2019 2020 2019
Note
Sales - gross 1,640,216 1,601,170 964,867 813,445
Sales tax (248,520) (247,305) (146,309) (124,965)
Sales - net 16 1,391,696 1,353,865 818,558 688,480
Cost of sales 17 (1,207,973) (1,168,017) (710,475) (594,065)
Gross profit 183,723 185,848 108,083 94,415
Distribution cost (71,946) (70,327) (39,261) (34,174)
Administrative expenses (71,935) (74,935) (36,283) (36,778)
Other expenses (15,820) (17,124) (5,591) (8,165)
Other income 18 131,921 64,710 118,230 25,048
Operating profit 155,943 88,172 145,178 40,346
Finance costs (79,272) (108,546) (38,168) (52,878)
Profit / (loss) before taxation 76,671 (20,374) 107,010 (12,532)
Taxation
Current (24,520) (24,007) (14,060) (12,199)
Deferred (5,000) (3,000) (5,000) -
(29,520) (27,007) (19,060) (12,199)
Net profit / (loss) for the period 47,151 (47,381) 87,950 (24,731)
Earnings / (loss) per share - basic
and diluted19 4.38 (4.40) 8.17 (2.30)
The annexed notes from 1 to 28 form an integral part of this condensed interim financial statement.
Half year ended Quarter ended
(Rupees in thousands)
Rupees
10
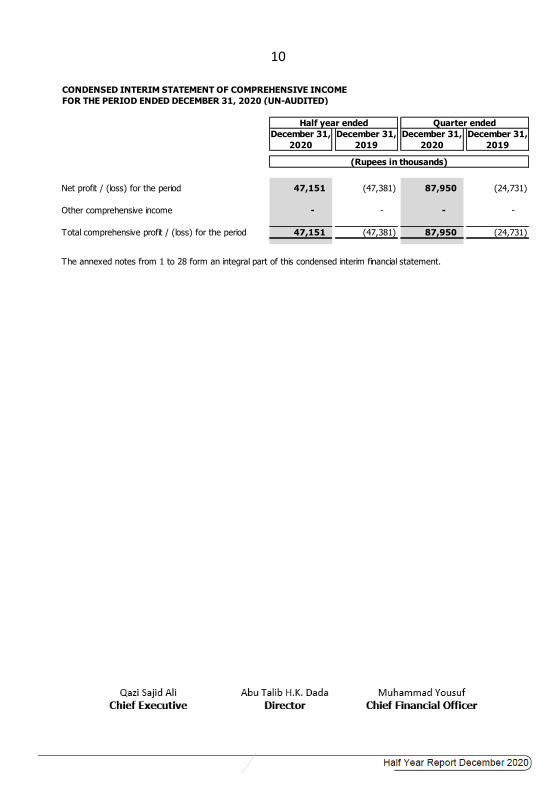
CONDENSED INTERIM STATEMENT OF COMPREHENSIVE INCOME
FOR THE PERIOD ENDED DECEMBER 31, 2020 (UN-AUDITED)
December 31, December 31, December 31, December 31,
2020 2019 2020 2019
Net profit / (loss) for the period 47,151 (47,381) 87,950 (24,731)
Other comprehensive income - - - -
Total comprehensive profit / (loss) for the period 47,151 (47,381) 87,950 (24,731)
The annexed notes from 1 to 28 form an integral part of this condensed interim financial statement.
Quarter ended
(Rupees in thousands)
Half year ended

11
CONDENSED INTERIM STATEMENT OF CHANGES IN EQUITY
FOR THE PERIOD ENDED DECEMBER 31, 2020 (UN-AUDITED)
Balance as at July 1, 2019 107,640 5,655 1,041,382 160,000 (207,786) 999,251 1,106,891
Transfer from general reserve to unappropriated profit - - - (160,000) 160,000 - -
Total comprehensive loss for the half year ended
December 31, 2019
Net loss for the period - - - - (47,381) (47,381) (47,381)
Other comprehensive income - - - - - - -
- - - - (47,381) (47,381) (47,381)
- - (12,391) - 12,391 - -
Balance as at December 31, 2019 107,640 5,655 1,028,991 - (82,776) 951,870 1,059,510
Balance as at July 1, 2020 107,640 5,655 1,194,276 - (384,521) 815,410 923,050
Total comprehensive loss for the half year ended
December 31, 2020
Net profit for the period - - - - 47,151 47,151 47,151
Other comprehensive income - - - - - - -
- - - - 47,151 47,151 47,151
- - (12,393) - 12,393 - -
Balance as at December 31, 2020 107,640 5,655 1,181,883 - (324,977) 862,561 970,201
The annexed notes from 1 to 28 form an integral part of this condensed interim financial statement.
Revenue reserve
Total Grand total
(Rupees in thousands)
Issued,
subscribed
and paid-
up capital
Transferred from surplus on revaluation of fixed
asset on account of incremental depreciation
Transferred from surplus on revaluation of fixed
asset on account of incremental depreciation
Reserves
Share
premium
Revaluation
surplus
General
reserve
Accumulated
losses
Capital reserve

12
CONDENSED INTERIM STATEMENT OF CASH FLOWS
FOR THE PERIOD ENDED DECEMBER 31, 2020 (UN-AUDITED)
December 31, December 31,
2020 2019
Note
CASH FLOWS FROM OPERATING ACTIVITIES
Cash generated from operations 20 133,228 421,404
Finance cost paid - net (75,327) (115,915)
Taxes paid (39,541) (20,306)
Net cash generated from operating activities 18,360 285,183
CASH FLOWS FROM INVESTING ACTIVITIES
Capital expenditure (3,646) (20,142)
Long term security deposits 5,361 4,731
Net cash used in investing activities 1,715 (15,411)
CASH FLOWS FROM FINANCING ACTIVITIES
Lease payments (24,334) (29,891)
Interest income received 26 -
Short term borrowings - net (14,250) (232,502)
Dividend paid - (87)
Net cash used in from financing activities (38,558) (262,480)
Net (decrease) / increase in cash and cash equivalents (18,483) 7,292
Cash and cash equivalents at the beginning of the period (607,403) (667,685)
Cash and cash equivalents at the end of the period (625,886) (660,393)
CASH AND CASH EQUIVALENTS
Cash and bank balances 66,645 38,793
Short-term borrowings (692,531) (699,186)
(625,886) (660,393)
The annexed notes from 1 to 28 form an integral part of this condensed interim financial statement.
Half year ended
(Rupees in thousands)

13
FOR THE PERIOD ENDED DECEMBER 31, 2020
1 THE COMPANY AND ITS OPERATIONS
1.1
1.2
1.3
2 GEOGRAPHICAL LOCATION AND ADDRESSES OF BUSINESS UNITS
3 BASIS OF PREPARATION
3.1 Statement of compliance
This condensed interim financial statement is unaudited but subject to limited scope review by
the auditors and being submitted to the shareholders as required under section 237 of the
Companies Act, 2017.
The Company incurred net profit after tax for the period ended December 31, 2020
amounting to Rs.47.151 million (June 30, 2020: Rs. 361.519 million) and its accumulated
losses as at December 31, 2020 amounted to Rs.324.977 million (June 30, 2020: Rs.
384.521 million). The Company's current liabilities aggregating to Rs.2,469.724 million (June
30, 2020: Rs. 2,341.817 million) exceeded the current assets by Rs. 689.938 million (June
30, 2020: Rs. 734.924) million. The Company's financial statements for the year ended
December 31, 2020 are being prepared on a going concern basis. Management believes that
they have plans to increase profitability by introducing new marketing strategies and cutting
down operational expenses which will improve profitability and meet working capital
requirements of the Company. The Company is also considering debt reprofiling and in the
intervening period, the Company has access to Sponsor support to meet any liquidity
constraints. In the opinion of the management, future profits shall wipe out the accumulated
losses and the Company shall be able to meet all its obligations.
NOTES TO THE CONDENSED INTERIM FINANCIAL INFORMATION
Dadex Eternit Limited ("the Company") was incorporated in Pakistan as a public limited
company on April 13, 1959 under the repealed Companies Ordinance, 1984 (now Companies
Act, 2017) and its ordinary shares are listed on Pakistan Stock Exchange. The principle
business of the Company is to manufacture and sell construction material, which mainly
includes piping systems and other allied products manufactured from chrysotile cement,
rubber and plastics, merchandising of imported pipe fittings, accessories and other building
As at reporting date, Sikander (Private) Limited (the Holding Company) holds 6,800,648
ordinary shares representing 63.18% shareholding.
The registered office of the Company is situated at Dadex House, 34-A/1, Block 6,
P.E.C.H.S, Sharah-e-Faisal, Karachi. The Company has three factories which are located at
the following locations:
- DEH # 21-22, Manghopir, Karachi
- Badin Road, Hyderabad
- Sunder Industrial Estate, Multan Road, Raiwind, District, Lahore

14
-
-
3.2 Basis of measurement
3.3 Functional and presentation currency
4 SIGNIFICANT ACCOUNTING POLICIES
The comparative statement of financial position presented in this condensed interim financial
statements have been extracted from the annual audited financial statements of the
Company for the year ended June 30, 2020, whereas the comparative condensed interim
statement of profit or loss, condensed interim statement of comprehensive income,
condensed interim statement of cash flows and condensed interim statement of changes in
equity are extracted from the unaudited condensed interim financial statement for the period
These condensed interim financial statements have been prepared under the historical cost
convention except for land which is stated at revalued amounts. These condensed interim
financial statements have been prepared following accrual basis of accounting except for cash
flow information
Where the provisions of and directives issued under the Companies Act, 2017 differ with the
requirements of IAS 34, the provisions of and directives issued under the Companies Act,
2017 have been followed.
These condensed interim financial statements do not include all the information and
disclosures required for full annual financial statements and should be read in conjunction with
the annual financial statements of the Company as at and for the year ended June 30, 2020,
which have been prepared in accordance with approved accounting standards as applicable in
Pakistan. However, selected explanatory notes are included to explain events and
transactions that are significant to an understanding of the changes in the Company’s
financial position and performance since the last declared financial statements.
These condensed interim financial statements have been presented in Pak Rupees, which is
the functional and presentation currency of the Company.
These condensed interim financial statements have been prepared in accordance with the
accounting and reporting standards as applicable in Pakistan for interim financial reporting.
The accounting and reporting standards as applicable in Pakistan for interim financial reporting
comprise of:
International Accounting Standard (IAS) 34, Interim Financial Reporting, issued by the
International Accounting Standards Board (IASB) as notified under the Companies Act, 2017;
and
Provisions of and directives issued under the Companies Act, 2017.
The accounting policies adopted and methods of computation followed in the preparation of
these condensed interim financial statements are same as those for the preceding annual
financial statements for the year ended June 30, 2020.

15
4.1 Initial application of standards, amendments or an interpretation to existing standards
a)
5 ESTIMATES AND JUDGMENTS
6
December 31, June 30,
2020 2020
(Unaudited) (Audited)
Note
7 OPERATING FIXED ASSETS
Fixed assets 7.1 1,435,787 1,436,220
Right-of-use assets 7.2 93,354 133,542
1,529,141 1,569,762
7.1 Fixed assets
Opening net book value (NBV) 1,436,220 1,639,723
Revaluation surplus - 177,678
Additions / transfers during the period /
year at cost 7.1.1 34,474 39,874
1,470,694 1,857,275
Disposals during the period / year at NBV 7.1.2 - (35)
Depreciation charge for the period / year (34,907) (62,220)
Transfer to non-current asset held for sale - (358,800)
(34,907) (421,055)
Closing net book value (NBV) 1,435,787 1,436,220
(Rupees in thousands)
Standards, amendments and interpretations to accounting standards that are
effective in the current period
The provisions for taxation for the half year and quarter ended December 31, 2020, have been
made using the estimated effective tax rate applicable to expected total annual earnings. The
applicable income tax rate is 29% for the Tax Year 2021 as stipulated through Finance Act 2019.
TAXATION
Certain standards, amendments and interpretations to approved accounting standards are
effective for accounting periods beginning on January 01, 2021, but are considered not to be
relevant or to have any significant effect on the Company’s operations (although they may affect
the accounting for future transactions and events) and are, therefore, not detailed in these
condensed interim financial statements.
The preparation of condensed interim financial statements requires management to make certain
judgements, estimates and assumptions that affect the application of accounting policies and the
reported amounts of assets, liabilities, income and expenses. Actual results may differ from these
estimates. The significant judgments made by management in applying the Company's accounting
policies and key sources of estimation of uncertainty are the same as those that were applied to
the financial statements for the year ended June 30, 2020.

16
December 31, June 30,
2020 2020
(Unaudited) (Audited)
7.1.1 Detail of additions (at cost) during the period / year are as follows:
Owned
Factory building on freehold and leasehold land - 110
Plant and machinery 32,799 29,070
Vehicles and transportation equipments 696 10,237
Office and factory equipments 979 457
34,474 39,874
7.1.2 Detail of disposals (at NBV) during the period / year are as follows:
Owned
Vehicles and transportation equipment - 35
7.2 Right-of-use assets
Balance as at July 1, 2020 133,542 165,313
Recognition as a result of adoption of IFRS 16 - 1,764
Transfer/Disposals (31,897) (10,237)
Depreciation charge during the period / year (8,291) (23,298)
93,354 133,542
8 CAPITAL WORK IN PROGRESS
Buildings on leasehold land 2,775 2,775
Plant and machinery 5,747 4,908
8.1 8,522 7,683
8.1 Movement of carrying amount is as follows:
Opening balance 7,683 4,226
Additions (at cost) during the period / year 3,415 33,529
11,098 37,755
Transfer to operating fixed assets during the period / year (2,576) (30,072)
Closing balance 8,522 7,683
9 LONG-TERM INVESTMENT
Investment in associate 5,000 5,000
Less: Impairment in value (5,000) (5,000)
9.1 - -
(Rupees in thousands)

17
9.1
December 31, June 30,
2020 2020
(Unaudited) (Audited)
10 STOCK-IN-TRADE
Raw materials
in hand 186,113 125,994
in transit 21,336 16,529
207,449 142,523
Work-in-process 141,081 141,612
Finished goods
manufactured 289,318 249,918
trading 51,629 63,615
10.1 340,947 313,533
689,477 597,668
10 Finished goods are net off provision of Rs. 89.835 million (June 30, 2020: 98.296 Rs. million).
11 TRADE DEBTS
(Unsecured - considered good)
Due from associated undertakings 31 -
Others
Export 244 -
Local 288,680 268,897
288,955 268,897
(Unsecured - considered doubtful)
Due from Turnkey project 17,414 17,414
Due from Others 131,793 218,103
149,207 235,517
438,162 504,414
Provision for doubtful debts
Turnkey project (17,414) (17,414)
Others 11.1 (163,630) (218,103)
(181,044) (235,517)
257,118 268,897
11 Provision for doubtful debts - others
Opening balance 218,103 130,535
Charge during the period - 87,568
Reversal (54,473) -
Closing balance 163,630 218,103
(Rupees in thousands)
The Company has 48.04 percent (June 30, 2020: 48.04 percent) shareholding i.e 625,000 (June
30, 2020: 625,000) ordinary shares of Rs.10/- each of Berdex Construction Chemicals (Private)
Limited.

18
December 31, June 30,
2020 2020
(Unaudited) (Audited)
Note
12
December 31,
2020
June 30,
2020
December
31, 2020
June 30,
2020
1,714,264 1,714,264
17,143 17,143
476,386 476,386
4,764 4,764
8,573,309 8,573,309
85,733 85,733
10,763,959 10,763,959 107,640 107,640
12.1
12.2
13
808,159 696,787
121,080 85,680
150,414 140,150
2,017 1,932
Infrastructure cess payable - 40,387
13,860 13,860
5,266 932
8,413 6,766
- 8,619
Current portion of GIDC Payable 10,684 36,395
1,199 1,771
1,121,092 1,033,279
14 SHORT TERM BORROWINGS
Secured
Karobar finance 14.1 240,000 240,000
Running finance 14.2 692,531 632,413
Finance against trust receipts 14.3 122,716 136,966
Tijarah finance 14.4 149,639 100,000
Murabaha and Istisna finance - 49,639
1,204,886 1,159,018
Sales tax and excise duty
Others
Workers' Welfare Fund
ISSUED, SUBSCRIBED AND PAID-UP CAPITAL
Ordinary shares include 4,090,536 shares of B class of Rs.10/- each converted into and deemed to be
ordinary shares on disposal by a foreign shareholder, in prior years, in accordance with the Articles of
Association of the Company.
The Holding Company holds 6,800,648 (June 30, 2020: 6,800,648) ordinary shares representing 63.18
percent (June 30, 2020: 63.18 percent) shareholding as at the reporting date.
Ordinary shares of Rs.10/-
Issued for consideration
Issued as fully paid bonus
each issued for cash
other than cash
shares
Advance from customers
Workers' Profit Participation Fund payable
Security deposits from distributors and others
Trade creditors
Accrued liabilities
Rupees in Thousand Number of shares
Advance from tenants
(Rupees in thousands)
TRADE AND OTHER PAYABLES

19
14.1
14.2
14.3
14.4
15 CONTINGENCIES AND COMMITMENTS
15.1 Contingencies
During the year ended June 30, 2010, the Environmental Protection Tribunal (EPT) initiated
proceedings against the Company, containing allegations of pollution, under the Pakistan Environmental
Protection Act, 1997 based on a complaint filed by the brother of an ex-employee of the Company.
The Company submitted a plea before the EPT raising the issue of the maintainability of the complaint
and its lack of jurisdiction to hear the same which was dismissed vide an order dated June 29, 2010.
The Company filed a constitutional petition before the Honourable High Court of Sindh (HCS) seeking
reliefs that the proceedings before EPT vis-a-vis the compliant were taken corum non judice and has
maintained that the EPT has no jurisdiction of the subject matter. The said constitutional petition was
dismissed by HCS vide its judgment dated March 9, 2011.
This facility has been obtained from Bank Islami aggregating to Rs.250 million (June 30, 2020: Rs. 250
million) out of which Rs. 10 Million ( June 30, 2020: Rs. 10 Million) remains unutilized as at the reporting
date. The facility is secured by creation of first pari-passu charge against hypothecation of the
Company's property, plant and equipment of Rs. 333.33 million ( June 30, 2020: Rs. 333.33 million)
located at Karachi and Lahore. The facility carries mark-up rates ranging from 14.25% to 16.58%
percentage ( June 30, 2020: 13.75 to 14.25 percent) per annum.
These facilities have been obtained from National Bank of Pakistan and Sindh Bank Limited aggregating
to Rs. 692.778 million (June 30, 2020: Rs. 692.778 million) out of which Rs. 0.25 million (June 30,
2020: Rs. 60.364 million) remains unutilized as at the balance sheet date. These facilities are secured
by creation of first pari-passu charge against hypothecation of the Company's stock in trade, trade
debts and property, plant and equipment of Rs. 667 million (June 30, 2020: Rs. 667 million), equitable
mortgage of Rs. 153 million over property No. 36 and 37 located in Gulberg, Lahore and first exclusive
mortgage charge of Rs. 934 million over land and building of the Company situated at 21-22 Manghopir
Road, Tapo Manghopir, Karachi. These facilities carry mark-up rates ranging from 9.51 to 10 percent
(June 30, 2020: 13.47 to 17.35 percent) per annum.
An overall facility of Rs.149.639 Million has been obtained from Al-Baraka Bank under Tijarah financing.
The facility is secured by creation of first pari-passu charge against hypothecation of the Company's
property plant and equipment (Sundar factory) located at Lahore and company's stock in trade. The
financing facility carries markup at 6 months KIBOR+3% (June 30, 2020: 6 months KIBOR+3%).
This represent working capital facilities availed from The Bank of Punjab aggregating to Rs. 150 Million (
June 30, 2020: Rs. 150 Million) out of which Rs. 27.284 million (June 30, 2020: Rs. 13.03 million)
remains unutilized as at the reporting date. The facility carries markup of 6 months KIBOR + 1.75%
(June 30, 2020: 6 months KIBOR + 1.75% per annum). The facility is secured against first exclusive
charge of Rs. 666.67 million by way of equitable mortgage on the Company's land, building and
hypothecation over machinery and equipment.

20
December 31, June 30,
2020 2020
(Unaudited) (Audited)
15.2 Commitments
Outstanding letters of credit 218,880 139,502
Outstanding letter of guarantee 96,742 96,742
Postdated cheques 146,324 271,681
Outstanding contracts 523,241 425,385
Duties payable on goods in transit 25,889 35,205
1,011,076 968,515
16 SALES
December 31, December 31, December 31, December 31,
2020 2019 2020 2019
Local sales 1,621,463 1,587,045 955,061 806,382 Export sales 18,753 14,125 9,806 7,063 Gross sales 1,640,216 1,601,170 964,867 813,445 Less:Sales tax (248,520) (247,305) (146,309) (124,965)
1,391,696 1,353,865 818,558 688,480
Half year ended
------------------------(Rupees in thousands)-----------------------
Quarter ended
(Rupees in thousands)
The Company is defending various suits filed in various courts of Pakistan for sums aggregating to Rs. 14.301
million (June 30, 2020: Rs. 14.301 million). However, in view of a legal advice, the Company’s management is
confident that these suits will be decided in its favor, and accordingly, no provision has been made in this
respect.
The Company filed petition for leave to appeal against the judgment of HCS before the Honorable Supreme
Court of Pakistan (SCP) which granted leave to appeal to the Company vide its order dated June 23, 2011 and
converted the petition into an appeal. Thereafter, after the partial hearing of the civil appeal, the SCP vide its
order dated October 25, 2011 directed a commission constituted by the EPT to submit the report of
environmental audit of the Company’s factory and surrounding premises. Pursuant to the direction of SCP, a
report was filed ostensibly on behalf of a commission constituted by the EPT to which objections have been filed
by the Company before SCP. The hearing of civil appeal on merits is now pending. Based on the opinion of the
legal counsel of the Company, the management expects a favorable outcome of the case. Accordingly, no
provision for any potential demand in respect of the above has been made in these financial statements.
(Unaudited)

21
December 31, December 31, December 31, December 31,
2020 2019 2020 2019
17 COST OF SALES
Manufactured goods
Raw materials consumed
Opening stock 142,523 214,965 220,716 282,769
Purchase 1,036,760 946,732 590,535 412,372
Closing stock (206,560) (231,110) (207,449) (231,110)
Raw materials consumed 972,723 930,587 603,802 464,031
Manufacturing overheadsStores and spares consumed 26,485 28,180 14,817 15,575 Salaries, wages and other benefits 81,960 60,773 45,734 31,032 Procured services 13,953 22,037 7,387 9,900 Fuel, water and power 82,065 79,882 45,602 38,083 Insurance 2,168 2,316 1,010 1,158 Travelling 35 137 15 129 Communication 523 670 246 368 Depreciation 26,856 25,901 13,369 13,024 Rent, rates and taxes 3,359 3,021 1,654 1,627 Repairs and maintenance 17,888 16,069 10,302 9,938 Printing and stationary 402 450 249 257 Other expenses 1,311 1,116 869 675
257,005 240,552 141,254 121,766 1,229,728 1,171,139 745,056 585,797
Work-in-processOpening stock 141,612 141,342 155,653 145,465 Closing stock (141,081) (174,092) (141,081) (174,092)
Cost of goods manufactured 1,230,259 1,138,389 759,628 557,170 Finished goods
Opening stock 249,918 196,480 231,762 236,746 Closing stock (289,318) (232,333) (289,318) (232,333)
1,190,859 1,102,536 702,072 561,583 Trading goods
Opening stock 63,615 101,487 57,135 64,914 Purchase 5,128 30,983 2,897 34,557 Closing stock (51,629) (66,989) (51,629) (66,989)
17,114 65,481 8,403 32,482 1,207,973 1,168,017 710,475 594,065
17.1 This includes bonus amounting to Rs. 0.4 million (December 31, 2019: nil).
18
Rental income 24,287 24,656 12,096 12,456 Interest income 26 20 15 11 Net income from joint service 1,469 (91) 1,195 (91) Amortisation of deferred income 2,430 2,430 1,215 1,215 Government Grant 1,718 - 1,718 - Gain on extinguishment of original GIDC Liability 43,497 - 43,497 - Reversal of provision for doubtful debts 54,473 - 54,473 - Others 4,021 37,695 4,021 11,457
131,921 64,710 118,230 25,048
Half year ended
------------------------(Rupees in thousands)-----------------------
Quarter ended
OTHER INCOME
(Unaudited)

22
December 31, December 31, December 31, December 31,
2020 2019 2020 2019
19
The basic earning per share as required under "IAS 33 Earning per share" is given below:
Net profit / (loss) for the period 47,151 (47,381) 87,950 (24,731) Weighted average number ofordinary shares 10,764 10,764 10,764 10,764 Earnings / (loss) per share - basic and diluted (Rupees) 4.38 (4.40) 8.17 (2.30)
December 31, December 31,
2020 2019
Note
20
Profit / (loss) before taxation 76,671 (20,374)
Adjustment for non-cash and other items
Depreciation
Property, plant and equipment 34,912 27,752
Right of use asset 8,291 14,299
Investment property 1,266 1,266
Amortization 48 86
Interest income (26) (20)
Finance costs 79,272 108,546
Amortization of deferred income (2,430) (2,430)
Provision against doubtful debts - 16,339
GIDC Payable (21,118) -
Working capital changes 20.1 (43,658) (80,152)
133,228 65,311
20.1 Working capital changes
(Increase) / decrease in current assets
Stores, spare parts and loose tools 5,289 4,703
Stock in trade (91,809) (106,856)
Trade debts 11,779 15,583
Loans and advances (41,161) (31,616)
Trade deposits and short-term prepayment (19,082) 26,150
Other receivable 3,459 759
(131,525) (91,277)
Increase / (decrease) in current liabilities
Trade and other payable 87,867 11,125
(43,658) (80,152)
Half year ended
------------------------(Rupees in thousands)-----------------------
Quarter ended
EARNING/(LOSS) PER SHARE - BASIC AND DILUTED
CASH GENERATED FROM OPERATIONS
Half year ended
(Rupees in thousands)
(Unaudited)

23
21 TRANSACTIONS AND BALANCES WITH RELATED PARTIES.
21.1
Relation with the companyNature of transaction December 31, December 31, December 31, December 31,
Note 2020 2019 2020 2019
Holding Company Rent paid 1,127 1,024 1,127 93
Purchase of goods 295 173 226 68
Provident fund Contribution to staff retirement
benefit plans 4,391 4,751 2,172 2,232
Key management
personnelRemuneration and other benefits 20,659 19,889 9,973 9,439
December 31, June 30,
2020 2020
(Unaudited) (Audited)
21.2 Period / year end balances
Receivable from associated companies / undertakings 104 104
Payable to related parties 295 173
21.3 The above transactions with related parties are at arm's length based on normal commercial rates.
The related parties comprise of Holding Company, group companies, other associated companies, staff retirement funds, directors and key
management personnel. Transactions with related parties and associated undertakings are as under:
Half year ended Quarter ended
(Unaudited)
Associated Companies /
Undertakings
(Rupees in thousands)

24
22 OPERATING SEGMENTS
22.1 Segment Analysis
Chrysotile
CementPlastic Others Total
(Unaudited)
Turnover 407,656 984,040 - 1,391,696
Segment result 8,029 31,813 - 39,842
Unallocated expenses
Other operating expenses (15,820)
Other income 131,921
Finance costs (79,272)
Taxation (29,520)
Profit for the period 47,151
(Unaudited)
Turnover 439,693 914,172 - 1,353,864
Segment result (3,234) 43,820 - 40,586
Unallocated expenses
Other operating expenses (17,124)
Other income 64,710
Finance costs (108,546)
Taxation (27,007)
Loss for the period (47,381)
22 Segment assets and liabilities
December 31, 2020 (Un-audited)
Segment assets 487,196 566,333 124,623 1,178,153
Unallocated corporate assets 2,349,680
Total assets 3,527,832
Segment liabilities 512,561 517,803 12,744 1,043,108
Unallocated corporate liabilities 1,514,523
Total liabilities 2,557,631
June 30, 2020 (Audited)
Segment assets 445,159 554,406 126,659 1,126,224
Unallocated corporate assets 2,280,575
3,406,799
Segment liabilities 441,061 487,583 12,744 941,388
Unallocated corporate liabilities 1,542,361
Total liabilities 2,483,749
Half year ended December 31, 2020 ------------------------(Rupees in thousands)------------------------
Half year ended December 31, 2019

25
23 FINANCIAL RISK MANAGEMENT
24 FAIR VALUE OF FINANCIAL INSTRUMENTS
Level 1:
Level 2:
Level 3:
Transfers during the period
25 DATE OF AUTHORIZATION FOR ISSUE
26 IMPACT OF COVID-19
27 CORRESPONDING FIGURES
28 GENERAL
This condensed interim financial statements was authorized for issue on February 25, 2021 by the Board of
Directors of the Company.
Amounts have been rounded off to the nearest thousands of rupees unless otherwise stated.
Corresponding figures have been rearranged and reclassified, wherever necessary for the purpose of
comparison and better presentation. However, no significant reclassification has been made during the period.
The Company uses the following hierarchy for determining and disclosing the fair value of financial instruments
by valuation technique:
As of the statement of financial statement date, no financial instruments of the Company are carried at fair
value.
Quoted prices (unadjusted) in active markets for identical assets or liabilities.
Inputs other than quoted prices included within level 1 that are observable for the asset
either directly or derived from prices.
Inputs for the asset or liability that are not based on observable market data (unadjusted)
inputs.
There was no significant impact of COVID-19 pandemic on the Company’s operations or decline in revenue
during the period ended December 31, 2020.
The Company's financial risk management objective and policies are consistent with that disclosed in the annual
financial statements for the year ended June 30, 2020.
During the six month period ended December 31, 2020, there were no transfers between level 1 and level 2 fair
value measurement and no transfer into or out of level 3 fair value measurement.
The carrying values of all financial assets and liabilities reflected in the condensed interim financial information
approximate their fair values. Fair value is the amount for which asset could be exchanged or liability settled
between knowledgeable, willing parties in an arm length transaction.
