for the six months ended 31 december 2012 - imperial · interim results presentation for the six...
TRANSCRIPT

Interim results presentation For the six months ended 31 December 2012
Agenda
2
» Highlights
» Divisional performance
» Financial Review
» Group prospects and strategy
» Questions
» Appendix
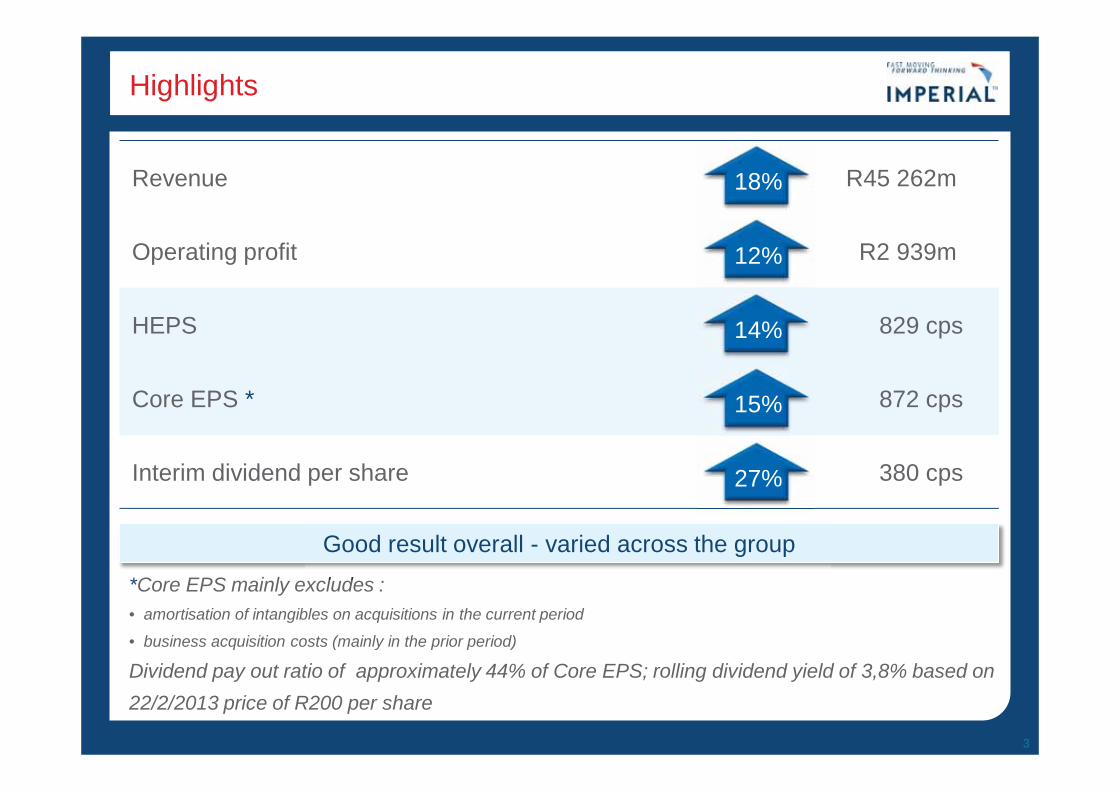
Highlights
Revenue R45 262m
Operating profit R2 939m
HEPS 829 cps
Core EPS * 872 cps
Interim dividend per share 380 cps
3
*Core EPS mainly excludes : • amortisation of intangibles on acquisitions in the current period
• business acquisition costs (mainly in the prior period)
Dividend pay out ratio of approximately 44% of Core EPS; rolling dividend yield of 3,8% based on 22/2/2013 price of R200 per share
18%
12%
15%
27%
14%
l d
Good result overall - varied across the group
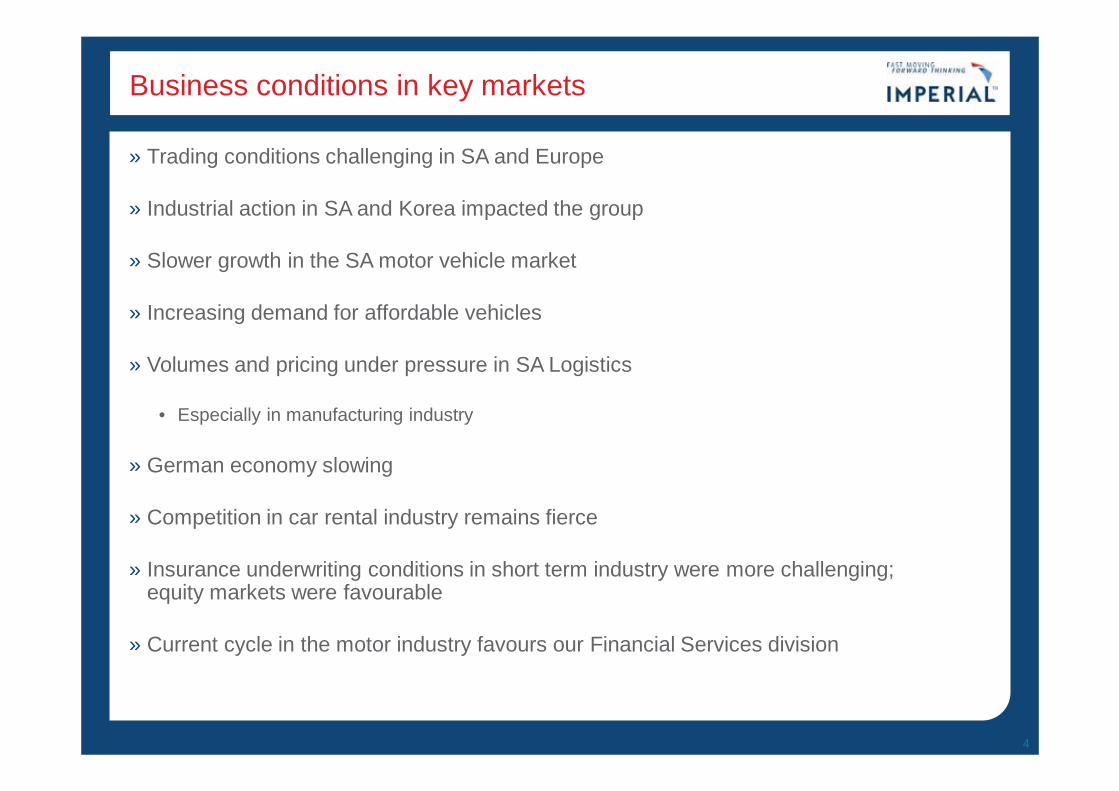
Business conditions in key markets
» Trading conditions challenging in SA and Europe
» Industrial action in SA and Korea impacted the group
» Slower growth in the SA motor vehicle market
» Increasing demand for affordable vehicles
» Volumes and pricing under pressure in SA Logistics
• Especially in manufacturing industry
» German economy slowing
» Competition in car rental industry remains fierce
» Insurance underwriting conditions in short term industry were more challenging; equity markets were favourable
» Current cycle in the motor industry favours our Financial Services division
4
Imperial’s performance during the period
» Good first half result
» Good portfolio effect
» Retail cluster of businesses performed well
» Strong growth was achieved in annuity revenue streams generated from after-sales parts, service and financial services
» Aftermarket parts, components and industrial equipment businesses continue to grow
» SA Logistics and International Logistics were under pressure
• Strike and volume pressure in SA; Slowing German economy
» Excellent growth in rest of Africa logistics; operating profit up 22%
» Acquisition of RTT Health Sciences will contribute significantly to our distribution footprint in Africa
» Strong cashflow, cash generated by operations up 111%
» Balance sheet strong – net debt/equity ratio of 52% (excl. prefs)
» Excellent returns : ROE = 22% (annualised)
5
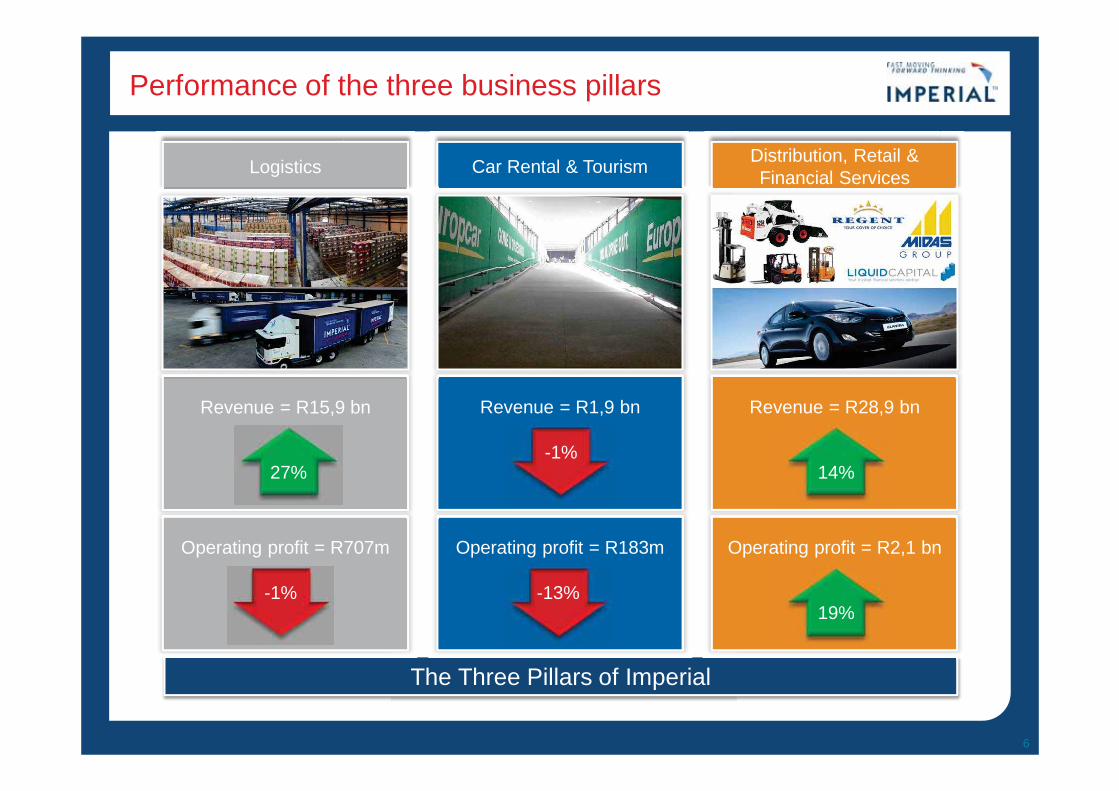
Performance of the three business pillars
6
The Three Pillars of Imperial
Logistics
Operating profit = R707m
Revenue = R15,9 bn
27%
-1%
Distribution, Retail & Financial Services
Operating profit = R2,1 bn
Revenue = R28,9 bn
14%
19%
Car Rental & Tourism
Operating profit = R183m
Revenue = R1,9 bn
-1%
-13%
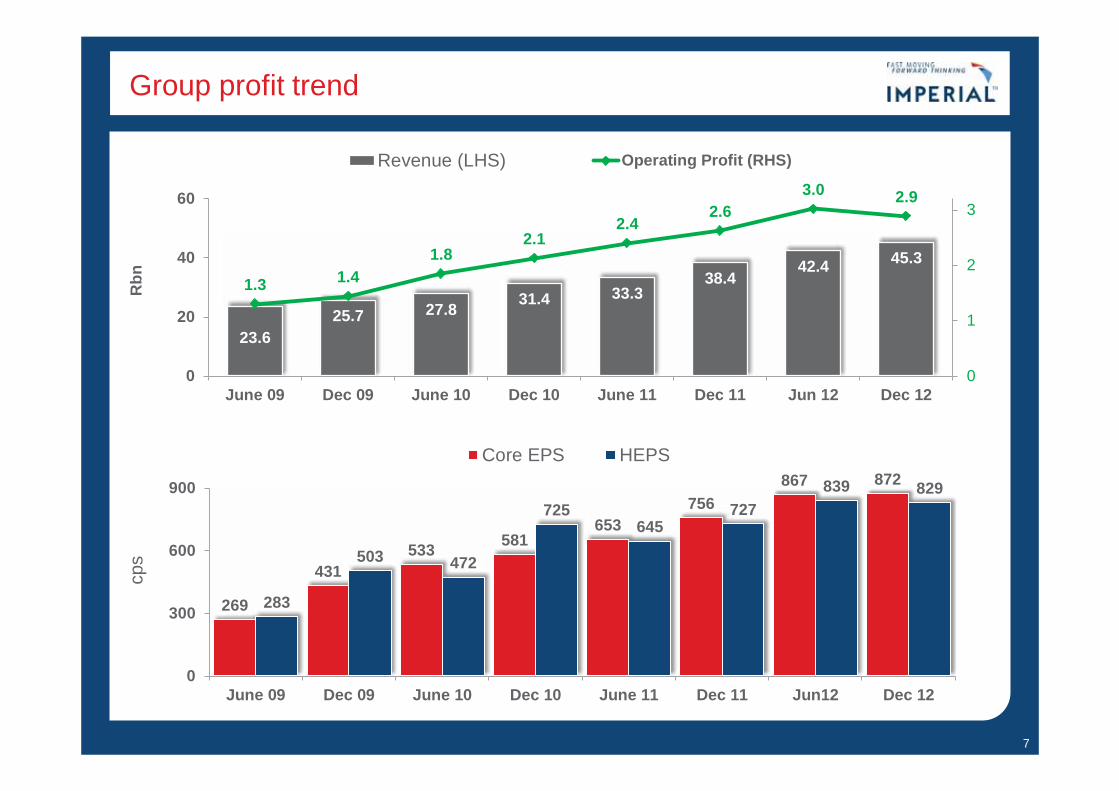
Group profit trend
7
23.6 25.7 27.8 31.4 33.3
38.4 42.4 45.3
1.3 1.4 1.8
2.1 2.4
2.63.0 2.9
0
1
2
3
0
20
40
60
June 09 Dec 09 June 10 Dec 10 June 11 Dec 11 Jun 12 Dec 12
Revenue (LHS) Operating Profit (RHS)
269
431 533 581
653 756
867 872
283
503 472
725645
727 839 829
0
300
600
900
June 09 Dec 09 June 10 Dec 10 June 11 Dec 11 Jun12 Dec 12
Core EPS HEPS
cps
Rbn
Southern Africa logistics
Southern Africa logistics
9
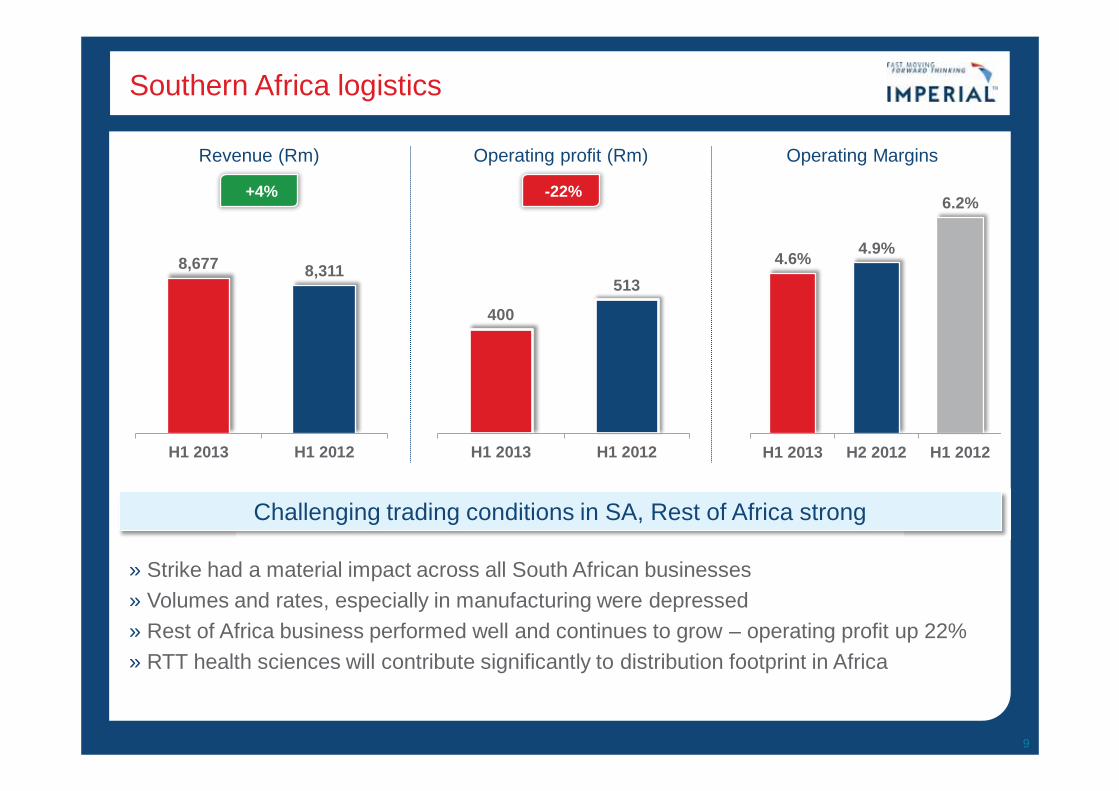
8,677 8,311
H1 2013 H1 2012
400
513
H1 2013 H1 2012
» Strike had a material impact across all South African businesses » Volumes and rates, especially in manufacturing were depressed » Rest of Africa business performed well and continues to grow – operating profit up 22% » RTT health sciences will contribute significantly to distribution footprint in Africa
4.6% 4.9%
6.2%
H1 2013 H2 2012 H1 2012
Challenging trading conditions in SA, Rest of Africa strong
Operating profit (Rm) Revenue (Rm) Operating Margins
+4% -22%
Southern Africa logistics
10
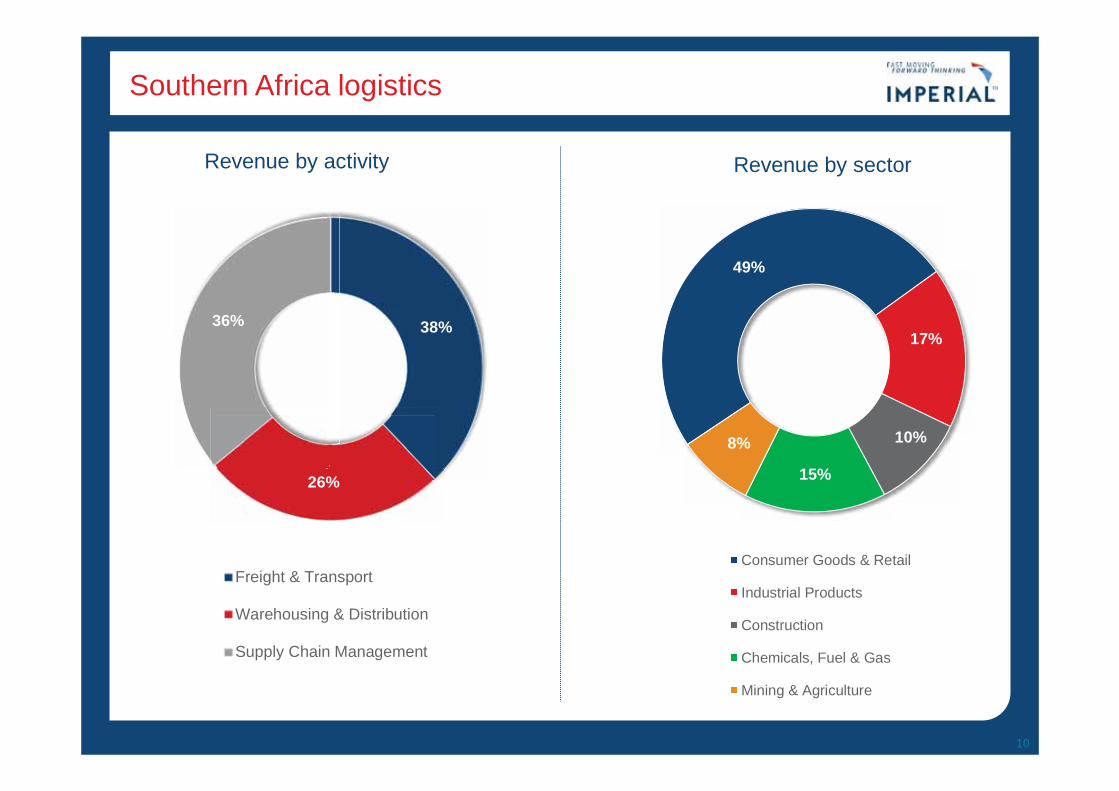
38%
26%
36%
Revenue by activity
Freight & Transport
Warehousing & Distribution
Supply Chain Management
49%
17%
10%
15%
8%
Revenue by sector
Consumer Goods & Retail
Industrial Products
Construction
Chemicals, Fuel & Gas
Mining & Agriculture
Steel and Metals 2%
Revenue split between SA and ROA
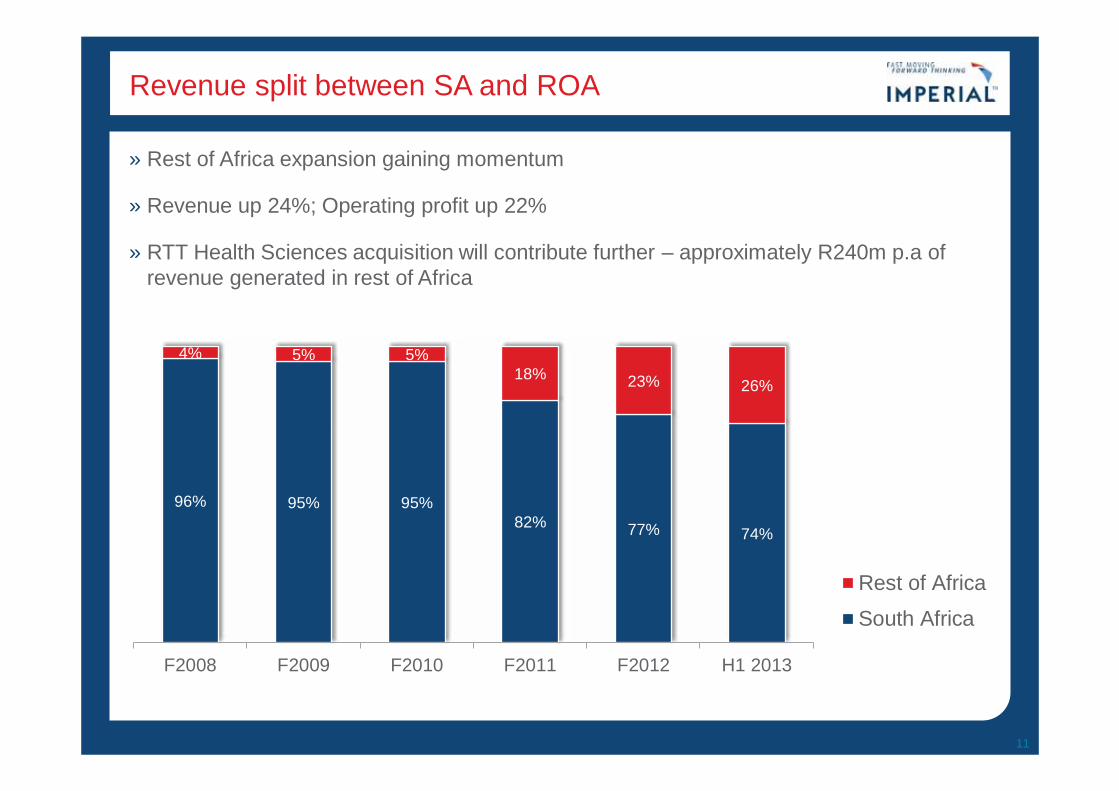
» Rest of Africa expansion gaining momentum
» Revenue up 24%; Operating profit up 22%
» RTT Health Sciences acquisition will contribute further – approximately R240m p.a of revenue generated in rest of Africa
11
96% 95% 95% 82% 77% 74%
4% 5% 5% 18% 23% 26%
F2008 F2009 F2010 F2011 F2012 H1 2013
Rest of Africa
South Africa
International logistics
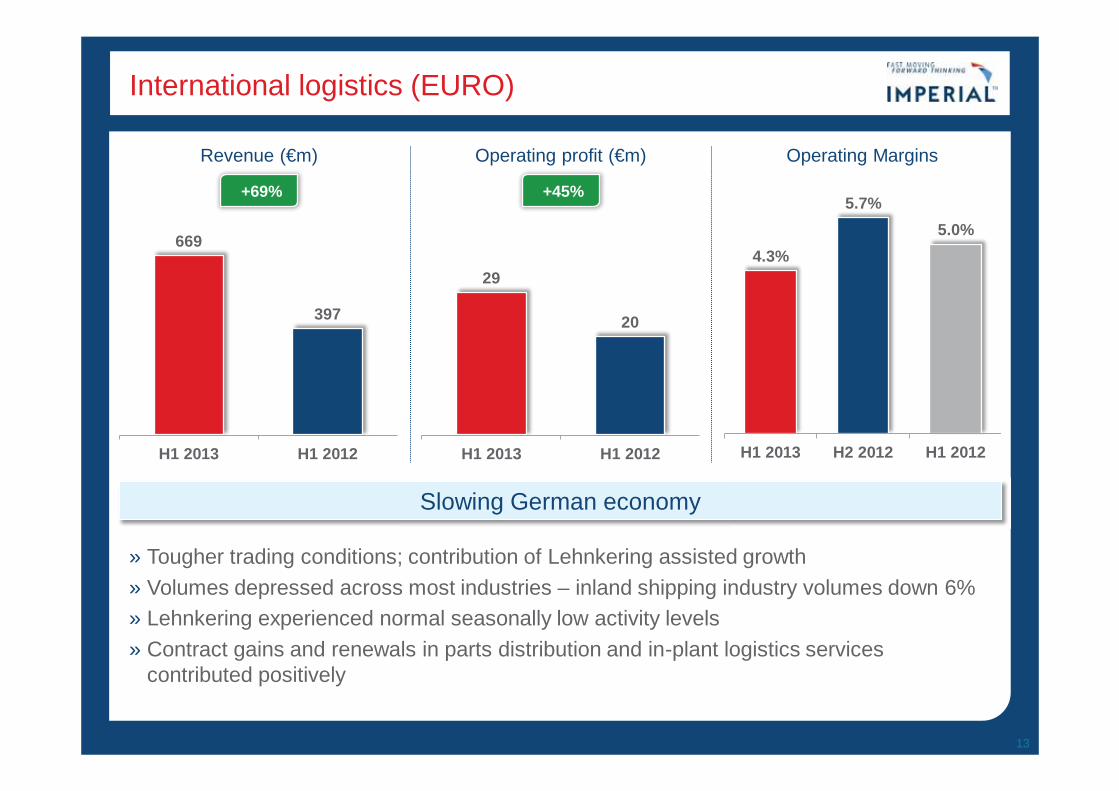
International logistics (EURO)
13
669
397
H1 2013 H1 2012
29
20
H1 2013 H1 2012
» Tougher trading conditions; contribution of Lehnkering assisted growth » Volumes depressed across most industries – inland shipping industry volumes down 6% » Lehnkering experienced normal seasonally low activity levels » Contract gains and renewals in parts distribution and in-plant logistics services
contributed positively
4.3%
5.7% 5.0%
H1 2013 H2 2012 H1 2012
Slowing German economy
Operating profit (€m) Revenue (€m) Operating Margins
+69% +45%
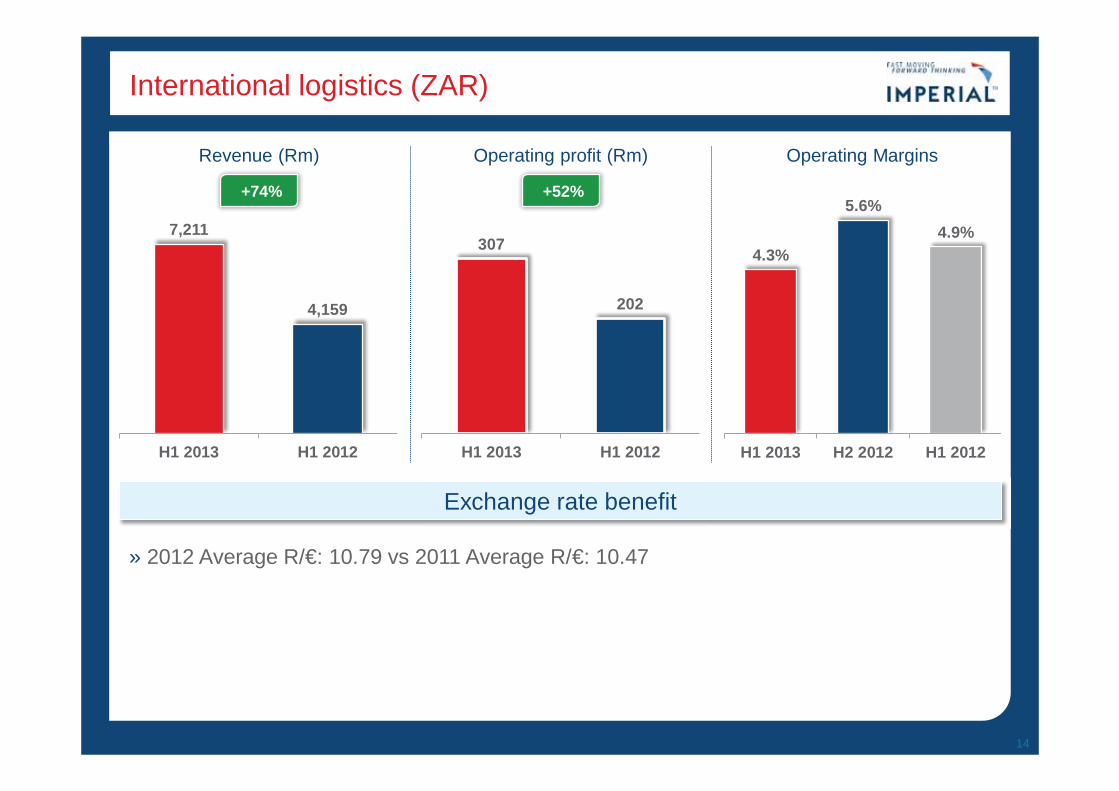
International logistics (ZAR)
14
7,211
4,159
H1 2013 H1 2012
307
202
H1 2013 H1 2012
» 2012 Average R/€: 10.79 vs 2011 Average R/€: 10.47
4.3%
5.6% 4.9%
H1 2013 H2 2012 H1 2012
Exchange rate benefit
Operating profit (Rm) Revenue (Rm) Operating Margins
+74% +52%
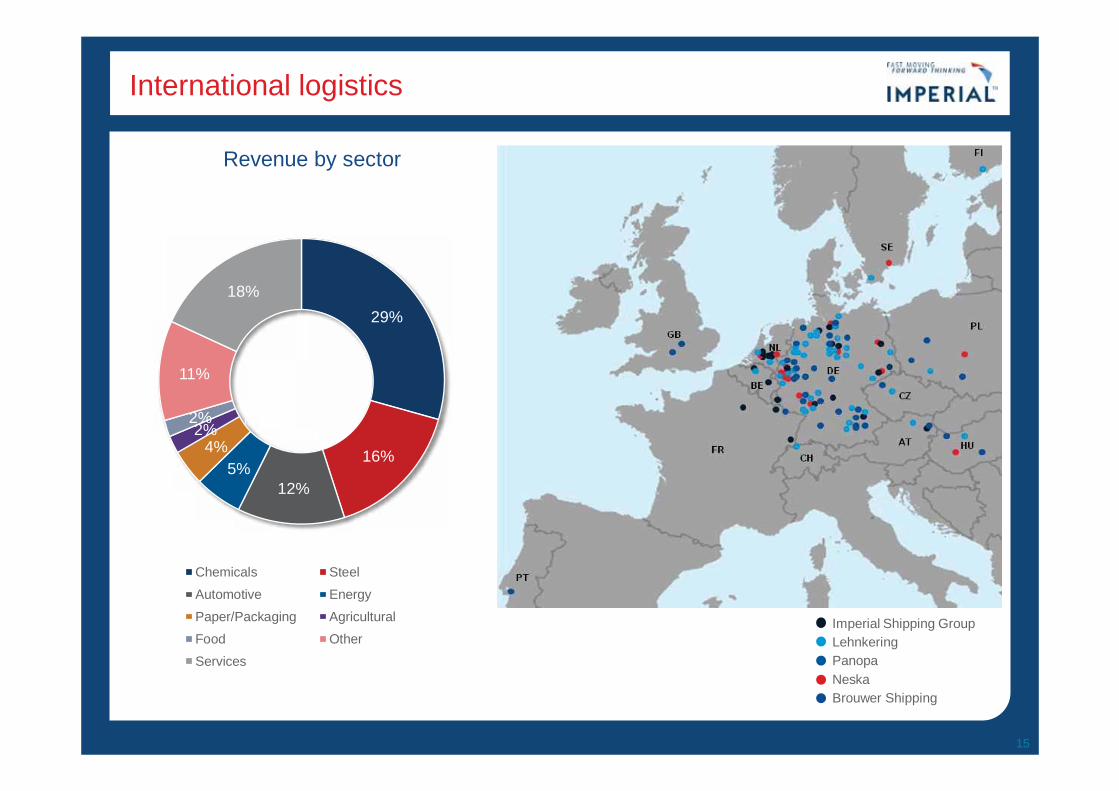
International logistics
15
Revenue by sector
Imperial Shipping Group Lehnkering Panopa Neska Brouwer Shipping
29%
16%
12% 5%
4% 2%
2%
11%
18%
Chemicals Steel
Automotive Energy
Paper/Packaging Agricultural
Food Other
Services
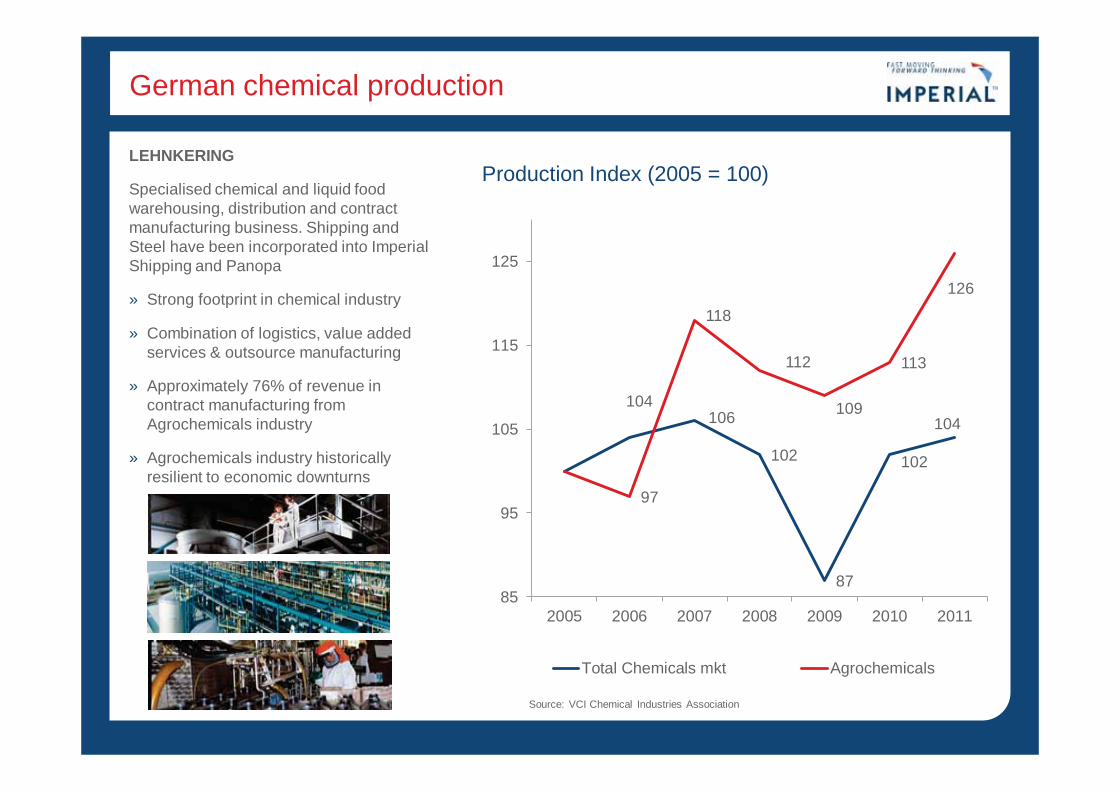
German chemical production
LEHNKERING
Specialised chemical and liquid food warehousing, distribution and contract manufacturing business. Shipping and Steel have been incorporated into Imperial Shipping and Panopa
» Strong footprint in chemical industry
» Combination of logistics, value added services & outsource manufacturing
» Approximately 76% of revenue in contract manufacturing from Agrochemicals industry
» Agrochemicals industry historically resilient to economic downturns
Source: VCI Chemical Industries Association
104 106
102
87
102
104
97
118
112
109
113
126
85
95
105
115
125
2005 2006 2007 2008 2009 2010 2011
Total Chemicals mkt Agrochemicals
Production Index (2005 = 100)
Car rental and tourism
Car Rental and Tourism
18
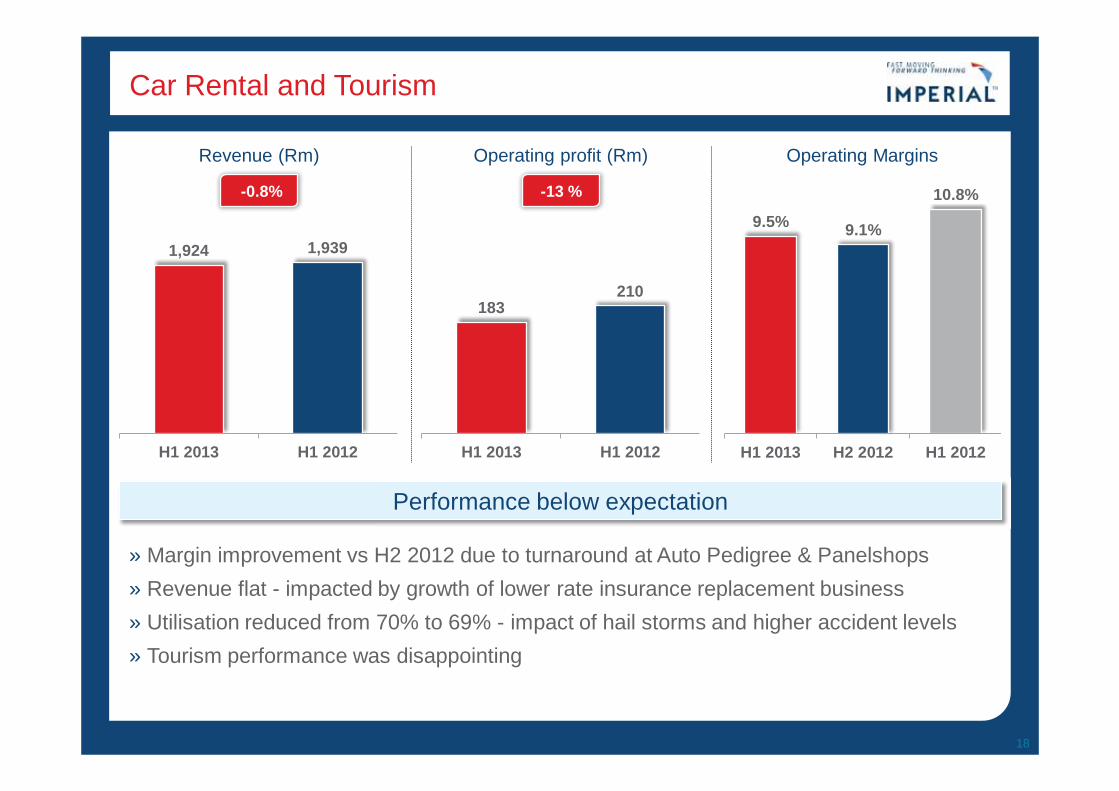
1,924 1,939
H1 2013 H1 2012
183 210
H1 2013 H1 2012
» Margin improvement vs H2 2012 due to turnaround at Auto Pedigree & Panelshops » Revenue flat - impacted by growth of lower rate insurance replacement business » Utilisation reduced from 70% to 69% - impact of hail storms and higher accident levels » Tourism performance was disappointing
9.5% 9.1%
10.8%
H1 2013 H2 2012 H1 2012
Operating profit (Rm) Revenue (Rm) Operating Margins
-0.8% -13 %
Performance below expectation
Distributorships
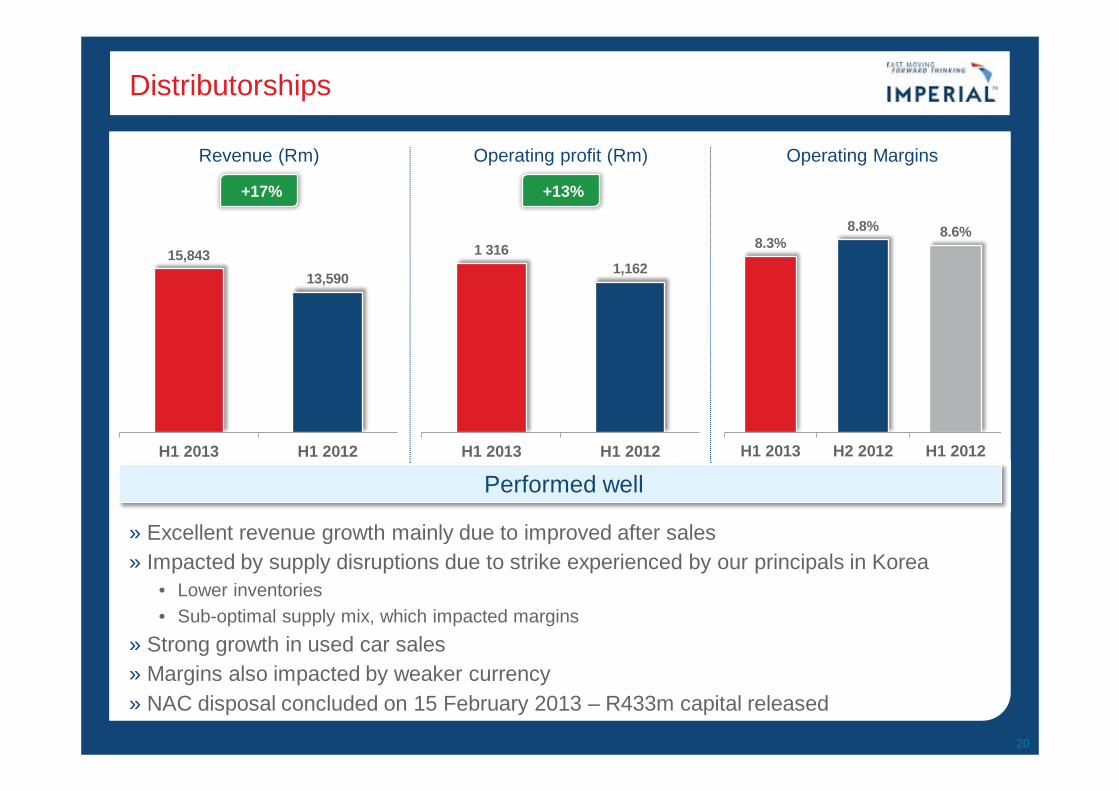
1 316 1,162
H1 2013 H1 2012
Distributorships
20
» Excellent revenue growth mainly due to improved after sales » Impacted by supply disruptions due to strike experienced by our principals in Korea
• Lower inventories • Sub-optimal supply mix, which impacted margins
» Strong growth in used car sales » Margins also impacted by weaker currency » NAC disposal concluded on 15 February 2013 – R433m capital released
Operating profit (Rm) Revenue (Rm) Operating Margins
+17% +13%
15,843 13,590
H1 2013 H1 2012
8.3% 8.8% 8.6%
H1 2013 H2 2012 H1 2012
Performed well
Drivers of SA vehicle market
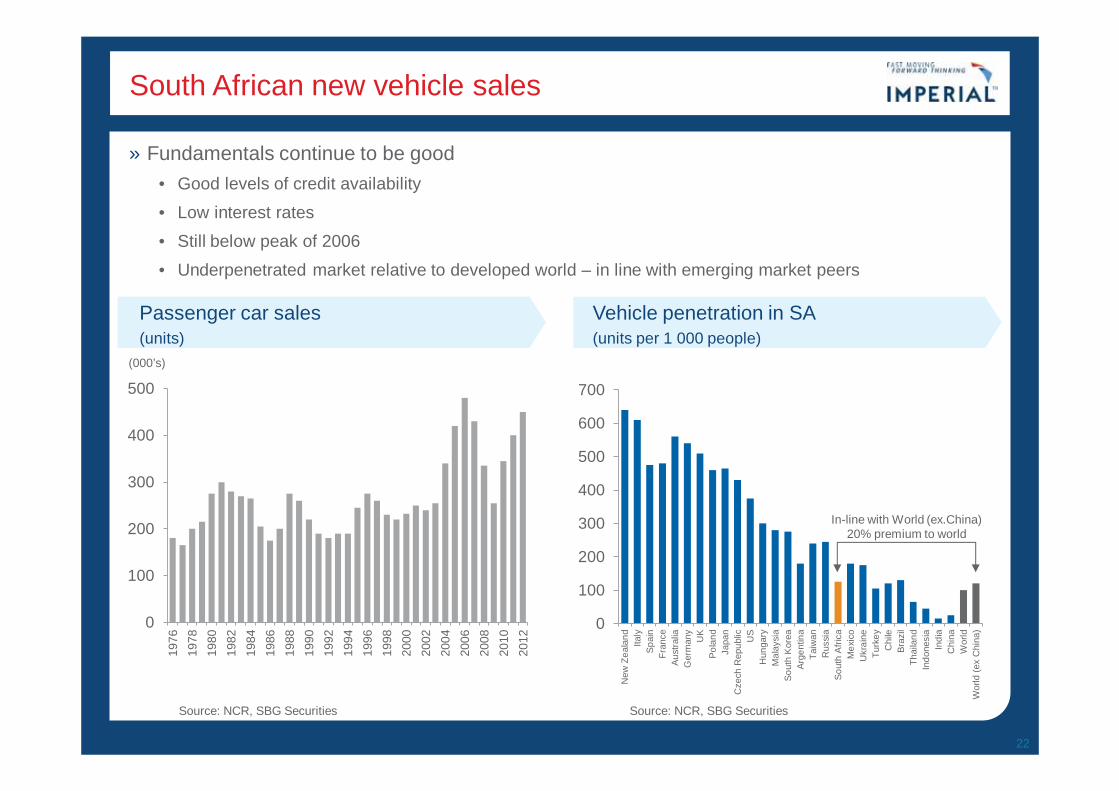
South African new vehicle sales
» Fundamentals continue to be good • Good levels of credit availability
• Low interest rates
• Still below peak of 2006
• Underpenetrated market relative to developed world – in line with emerging market peers
22
0
100
200
300
400
500
1976
1978
1980
1982
1984
1986
1988
1990
1992
1994
1996
1998
2000
2002
2004
2006
2008
2010
2012
0
100
200
300
400
500
600
700
New
Zea
land
Italy
Spai
nFr
ance
Aust
ralia
Ger
man
yU
KPo
land
Japa
nC
zech
Rep
ublic US
Hun
gary
Mal
aysi
aSo
uth
Kor
eaAr
gent
ina
Taiw
anR
ussi
aSo
uth
Afri
caM
exic
oU
krai
neTu
rkey
Chi
leBr
azil
Thai
land
Indo
nesi
aIn
dia
Chi
naW
orld
Wor
ld (e
x C
hina
)
Passenger car sales (units)
Vehicle penetration in SA (units per 1 000 people)
Source: NCR, SBG Securities
(000’s)
In-line with World (ex.China) 20% premium to world
Source: NCR, SBG Securities
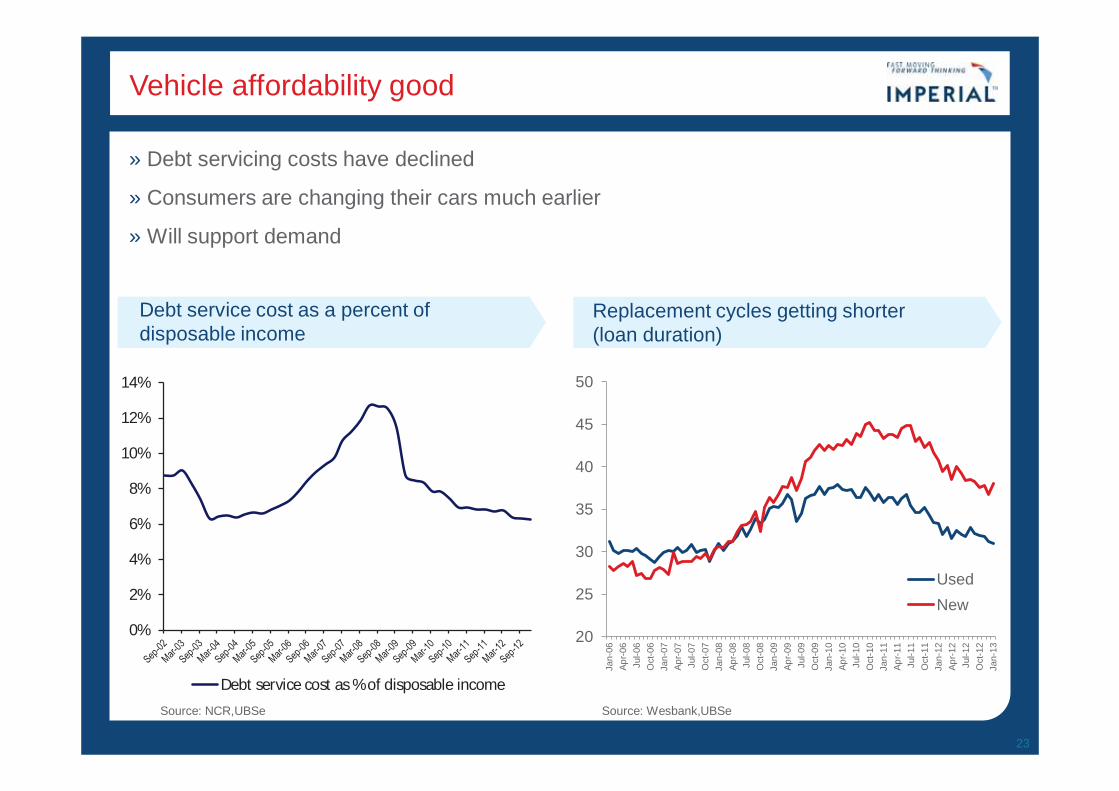
Vehicle affordability good
» Debt servicing costs have declined
» Consumers are changing their cars much earlier
» Will support demand
23
Debt service cost as a percent of disposable income
Replacement cycles getting shorter (loan duration)
20
25
30
35
40
45
50
Jan-
06Ap
r-06
Jul-0
6O
ct-0
6Ja
n-07
Apr-0
7Ju
l-07
Oct
-07
Jan-
08Ap
r-08
Jul-0
8O
ct-0
8Ja
n-09
Apr-0
9Ju
l-09
Oct
-09
Jan-
10Ap
r-10
Jul-1
0O
ct-1
0Ja
n-11
Apr-1
1Ju
l-11
Oct
-11
Jan-
12Ap
r-12
Jul-1
2O
ct-1
2Ja
n-13
UsedNew
0%
2%
4%
6%
8%
10%
12%
14%
Debt service cost as % of disposable incomeSource: NCR,UBSe Source: Wesbank,UBSe
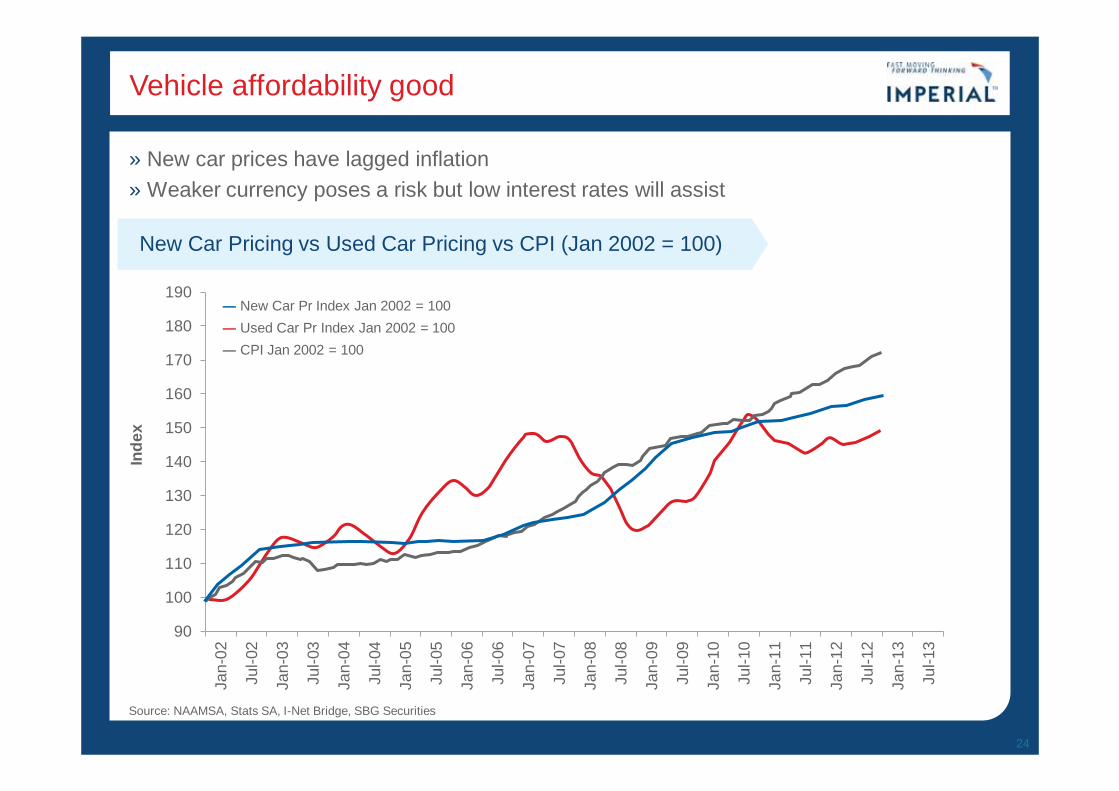
Vehicle affordability good
» New car prices have lagged inflation » Weaker currency poses a risk but low interest rates will assist
24
90
100
110
120
130
140
150
160
170
180
190
Jan-
02
Jul-0
2
Jan-
03
Jul-0
3
Jan-
04
Jul-0
4
Jan-
05
Jul-0
5
Jan-
06
Jul-0
6
Jan-
07
Jul-0
7
Jan-
08
Jul-0
8
Jan-
09
Jul-0
9
Jan-
10
Jul-1
0
Jan-
11
Jul-1
1
Jan-
12
Jul-1
2
Jan-
13
Jul-1
3
Inde
x
New Car Pricing vs Used Car Pricing vs CPI (Jan 2002 = 100)
― New Car Pr Index Jan 2002 = 100 ― Used Car Pr Index Jan 2002 = 100 ― CPI Jan 2002 = 100
Source: NAAMSA, Stats SA, I-Net Bridge, SBG Securities
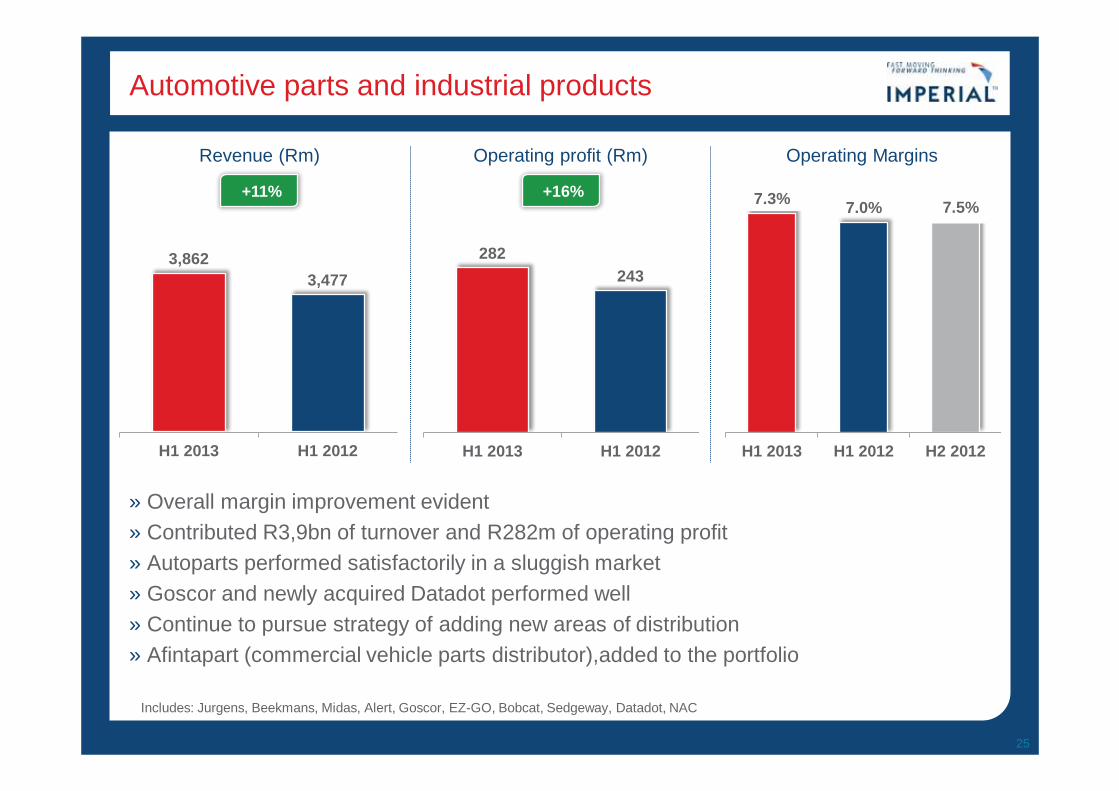
Automotive parts and industrial products
25
3,862 3,477
H1 2013 H1 2012
282 243
H1 2013 H1 2012
» Overall margin improvement evident » Contributed R3,9bn of turnover and R282m of operating profit » Autoparts performed satisfactorily in a sluggish market » Goscor and newly acquired Datadot performed well » Continue to pursue strategy of adding new areas of distribution » Afintapart (commercial vehicle parts distributor),added to the portfolio
7.3% 7.0%
H1 2013 H1 2012 H2 2012
7.5%
Operating profit (Rm)Revenue (Rm) Operating Margins
+11% +16%
Includes: Jurgens, Beekmans, Midas, Alert, Goscor, EZ-GO, Bobcat, Sedgeway, Datadot, NAC
Automotive Retail
26
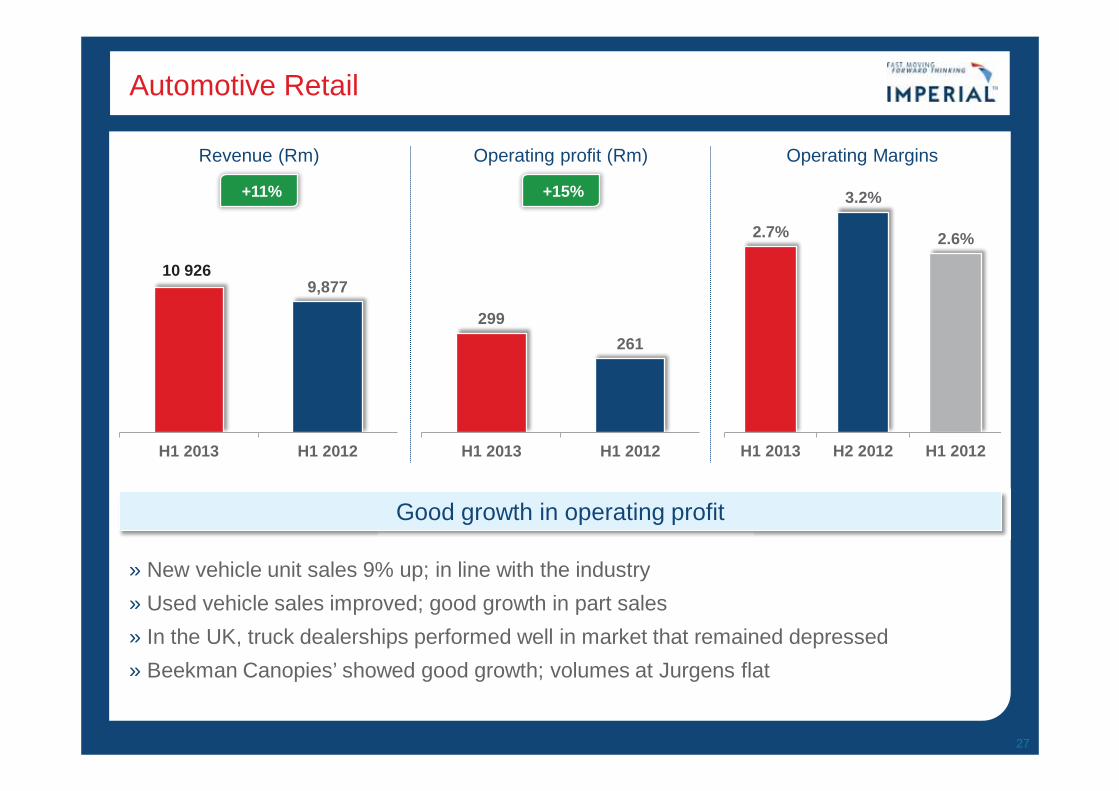
Automotive Retail
27
» New vehicle unit sales 9% up; in line with the industry » Used vehicle sales improved; good growth in part sales » In the UK, truck dealerships performed well in market that remained depressed » Beekman Canopies’ showed good growth; volumes at Jurgens flat
Good growth in operating profit
Operating profit (Rm) Revenue (Rm) Operating Margins
+11% +15%
9,877
H1 2013 H1 2012
10 926
299 261
H1 2013 H1 2012
2.7%
3.2%
2.6%
H1 2013 H2 2012 H1 2012
Financial Services
Financial Services
29
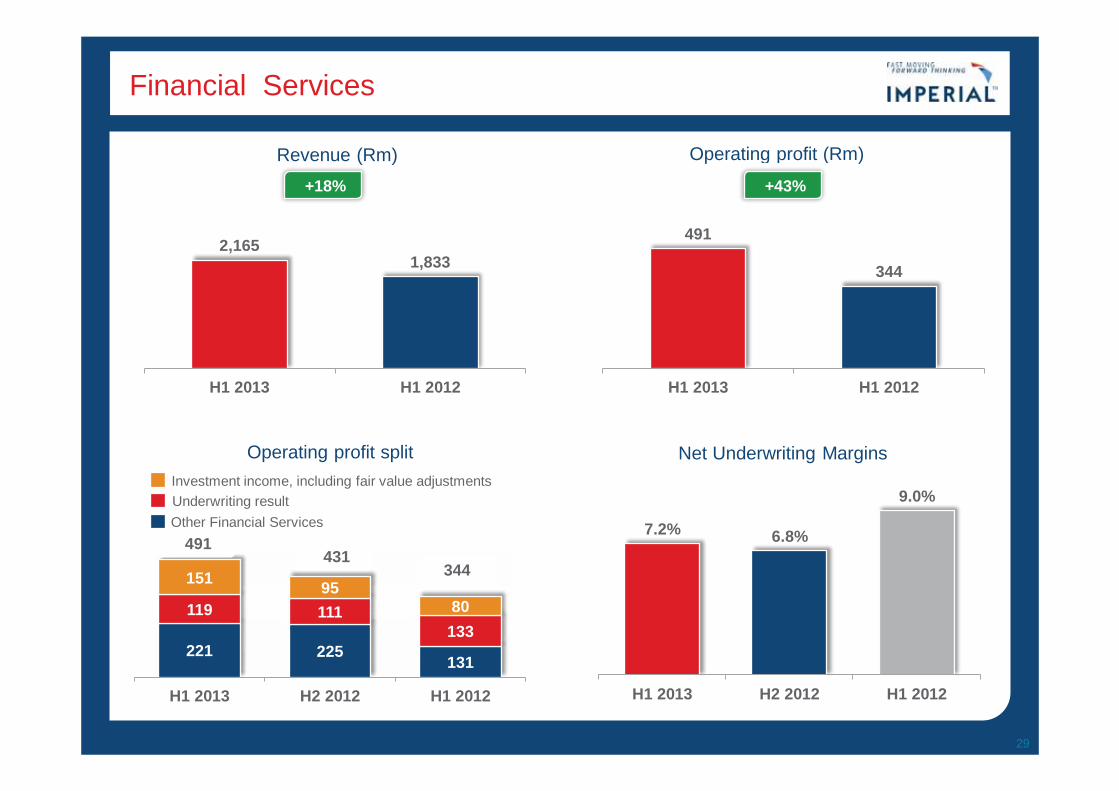
221 225 131
119 111 133
151 95 80
H1 2013 H2 2012 H1 2012
Operating profit split
344 491
7.2% 6.8%
9.0%
H1 2013 H2 2012 H1 2012
Net Underwriting Margins
2,165 1,833
H1 2013 H1 2012
Revenue (Rm)
491
344
H1 2013 H1 2012
Operating profit (Rm)
Investment income, including fair value adjustments Underwriting result Other Financial Services
( +18% +43%
431
Financial services
» Excellent performance
» Regent Life solid, with gross written premiums up 20%
» Adcover, Paintech and Warranties performed well and showed good growth
» Overall underwriting margin declined to 7,2% but up on H2 2012
» Affected by severe weather
» Investment returns higher; larger exposure to equity markets which were favourable
» Botswana and Lesotho continue to grow; operating profit doubled
» Other Financial Services performed well; growth in new maintenance plans
» Release from maintenance funds significantly higher due to change in estimate
» Strong growth in finance JV’s and new maintenance plans provides valuable annuity earnings underpin for future profits
30
Financial Review
Income statement
32
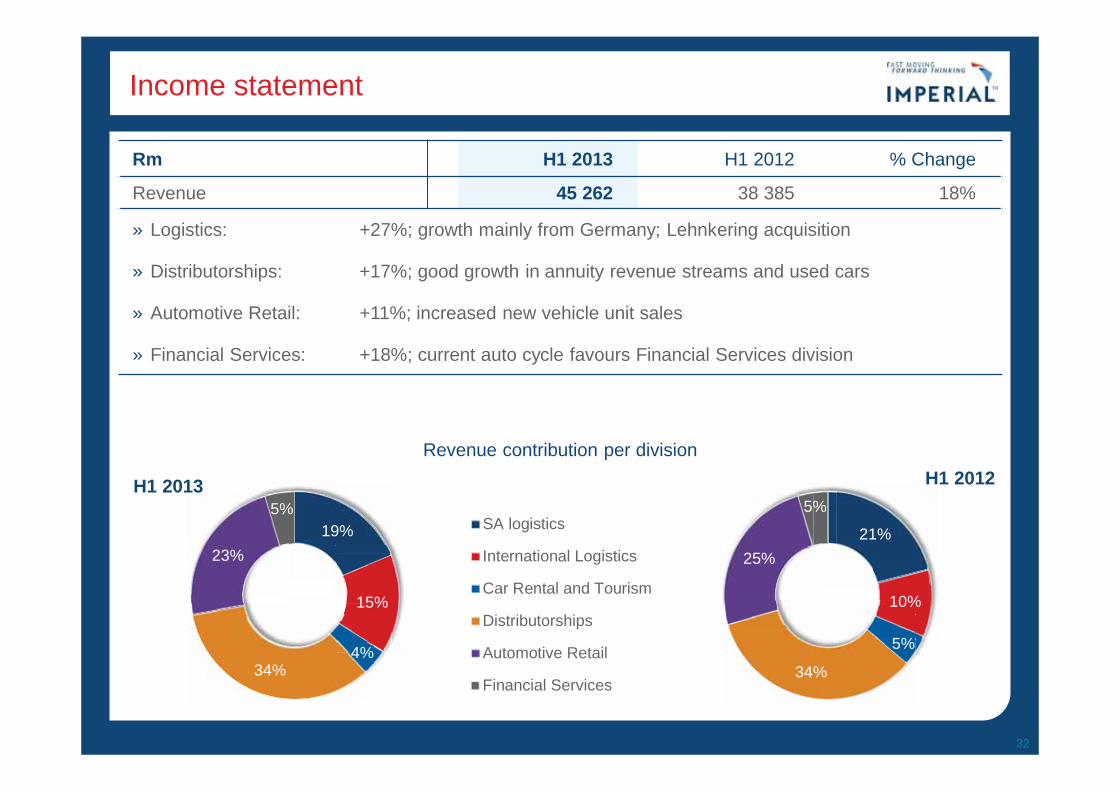
Rm H1 2013 H1 2012 % Change
Revenue 45 262 38 385 18%
» Logistics: +27%; growth mainly from Germany; Lehnkering acquisition
» Distributorships: +17%; good growth in annuity revenue streams and used cars
» Automotive Retail: +11%; increased new vehicle unit sales
» Financial Services: +18%; current auto cycle favours Financial Services division
19%
15%
4% 34%
23%
5% H1 2013
SA logistics
International Logistics
Car Rental and Tourism
Distributorships
Automotive Retail
Financial Services
21%
10%
5%
34%
25%
5%
H1 2012 Revenue contribution per division
Income statement
33
Operating profit contribution per division
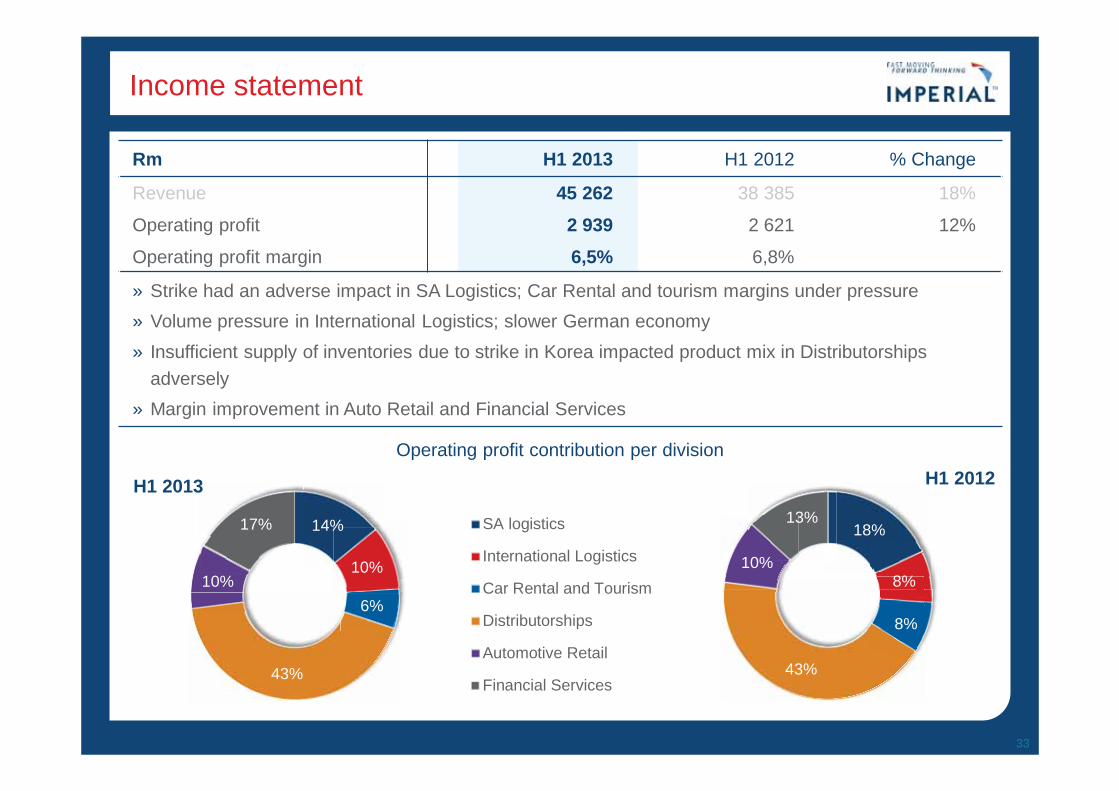
Rm H1 2013 H1 2012 % Change
Revenue 45 262 38 385 18%
Operating profit 2 939 2 621 12%
Operating profit margin 6,5% 6,8%
» Strike had an adverse impact in SA Logistics; Car Rental and tourism margins under pressure » Volume pressure in International Logistics; slower German economy » Insufficient supply of inventories due to strike in Korea impacted product mix in Distributorships
adversely » Margin improvement in Auto Retail and Financial Services
14%
10%
6%
43%
10%
17%
H1 2013
SA logistics
International Logistics
Car Rental and Tourism
Distributorships
Automotive Retail
Financial Services
18%
8%
8%
43%
10%
13%
H1 2012
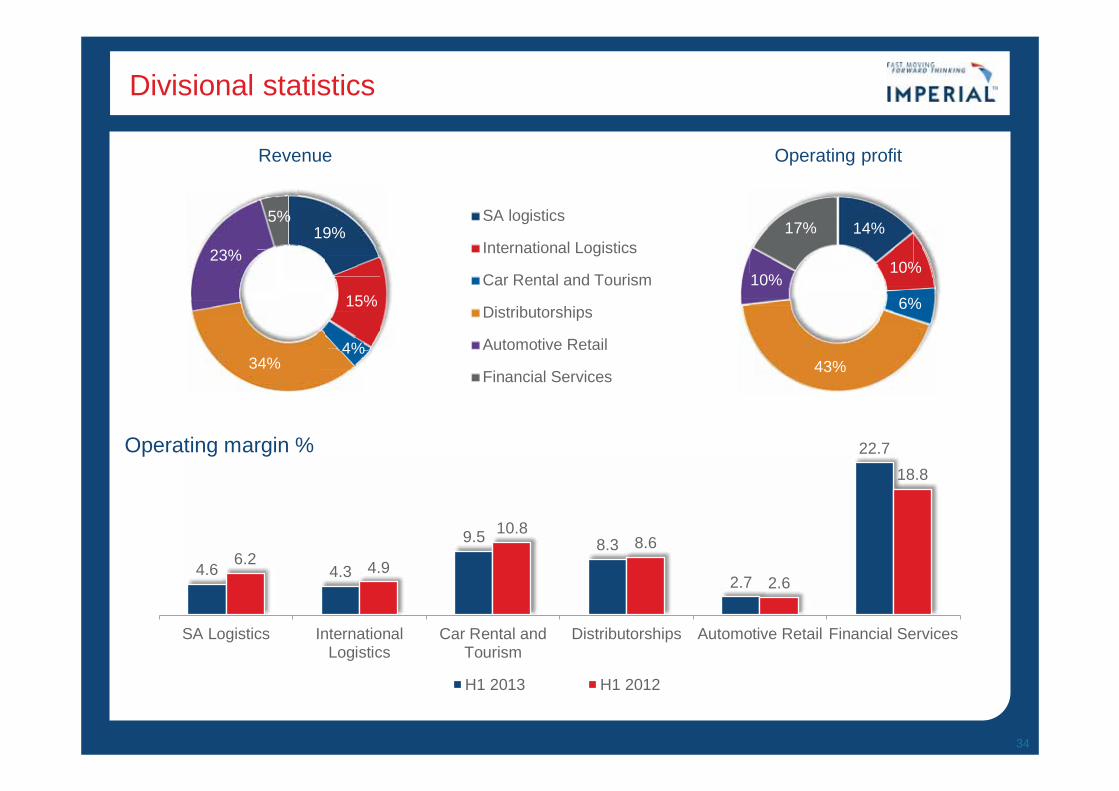
Divisional statistics
34
19%
15%
4% 34%
23%
5% SA logistics
International Logistics
Car Rental and Tourism
Distributorships
Automotive Retail
Financial Services
14%
10%
6%
43%
10%
17%
Operating profit Revenue
4.6 4.3
9.5 8.3
2.7
22.7
6.2 4.9
10.8 8.6
2.6
18.8
SA Logistics InternationalLogistics
Car Rental andTourism
Distributorships Automotive Retail Financial Services
Operating margin %
H1 2013 H1 2012
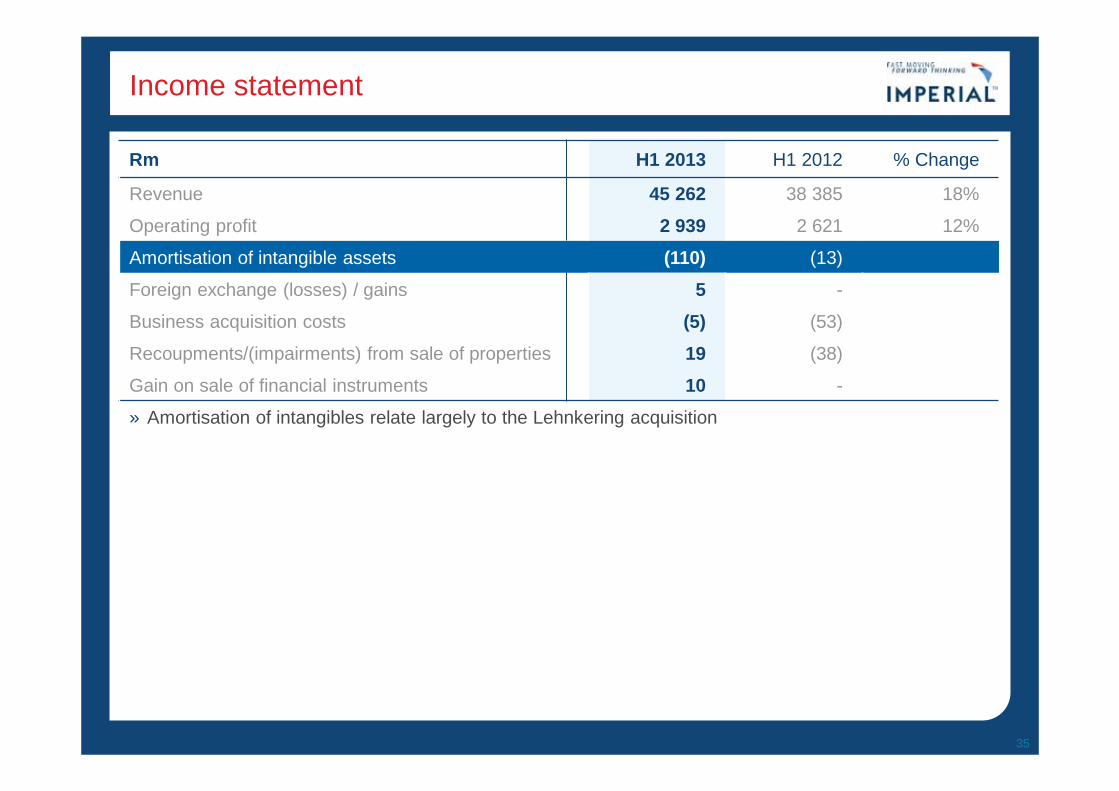
Income statement
Rm H1 2013 H1 2012 % Change
Revenue 45 262 38 385 18%
Operating profit 2 939 2 621 12%
Amortisation of intangible assets (110) (13)
Foreign exchange (losses) / gains 5 -
Business acquisition costs (5) (53)
Recoupments/(impairments) from sale of properties 19 (38)
Gain on sale of financial instruments 10 -
» Amortisation of intangibles relate largely to the Lehnkering acquisition
35
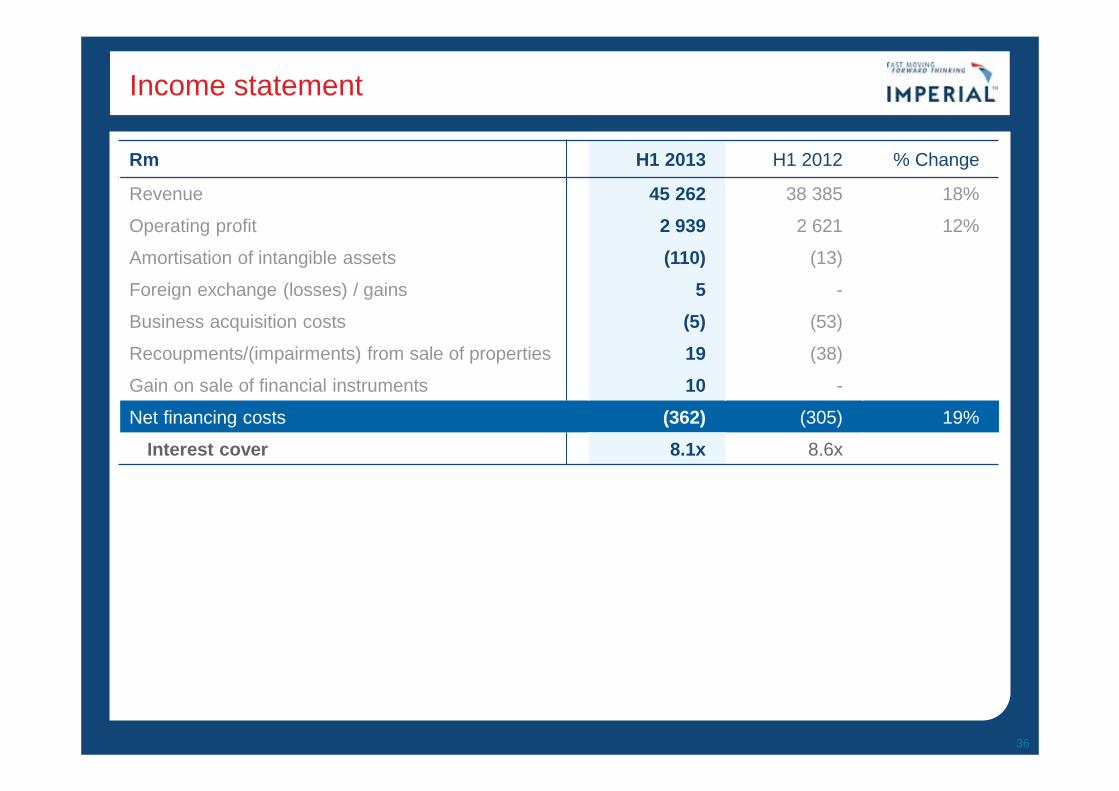
Income statement
Rm H1 2013 H1 2012 % Change
Revenue 45 262 38 385 18%
Operating profit 2 939 2 621 12%
Amortisation of intangible assets (110) (13)
Foreign exchange (losses) / gains 5 -
Business acquisition costs (5) (53)
Recoupments/(impairments) from sale of properties 19 (38)
Gain on sale of financial instruments 10 -
Net financing costs (362) (305) 19%
Interest cover 8.1x 8.6x
36
Income statement
Rm H1 2013 H1 2012 % Change
Revenue 45 262 38 385 18%
Operating profit 2 939 2 621 12%
Amortisation of intangible assets (110) (13)
Foreign exchange (losses) / gains 5 -
Business acquisition costs (5) (53)
Recoupments/(impairments) from sale of properties 19 (38)
Gain on sale of financial instruments 10 -
Net financing costs (362) (305) 19%
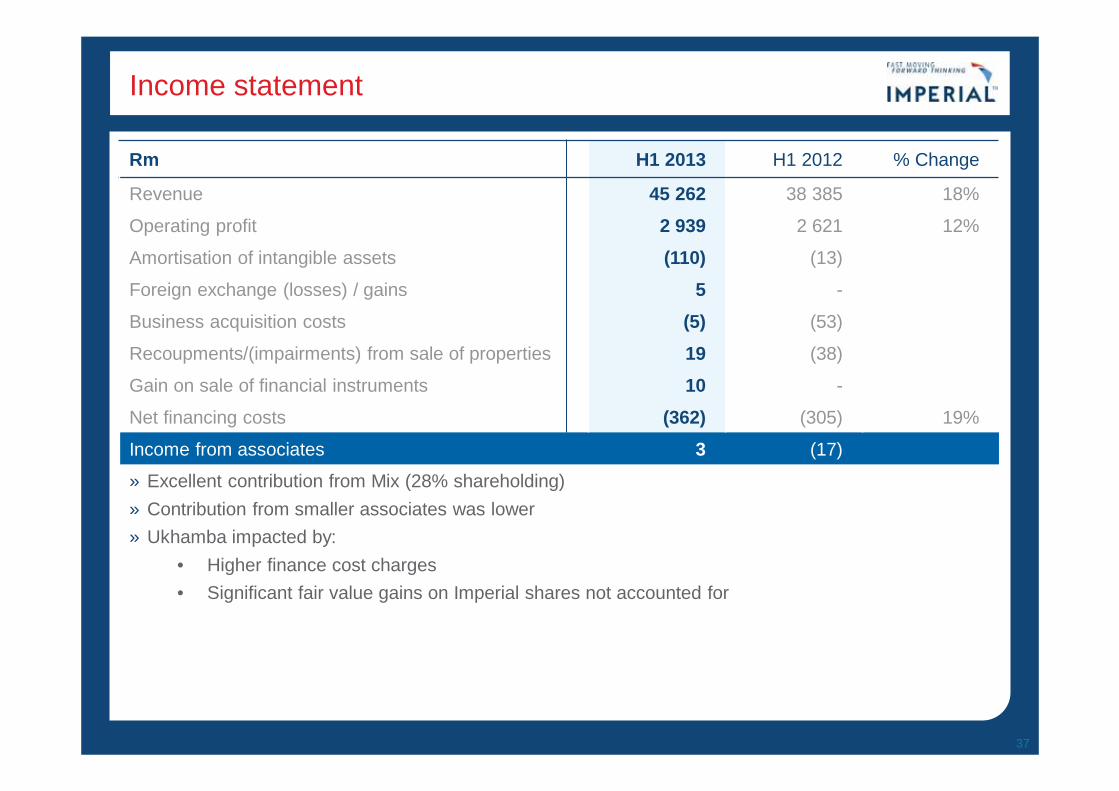
Income from associates 3 (17)
» Excellent contribution from Mix (28% shareholding) » Contribution from smaller associates was lower » Ukhamba impacted by:
• Higher finance cost charges • Significant fair value gains on Imperial shares not accounted for
37
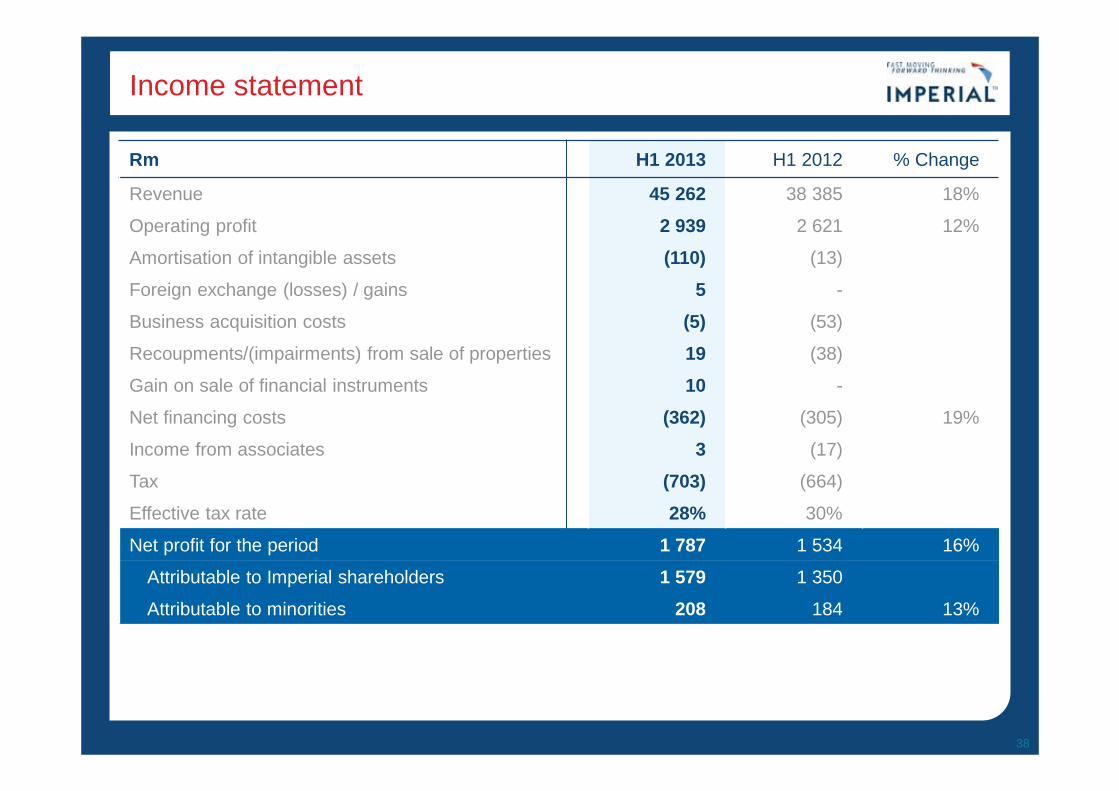
Income statement
Rm H1 2013 H1 2012 % Change
Revenue 45 262 38 385 18%
Operating profit 2 939 2 621 12%
Amortisation of intangible assets (110) (13)
Foreign exchange (losses) / gains 5 -
Business acquisition costs (5) (53)
Recoupments/(impairments) from sale of properties 19 (38)
Gain on sale of financial instruments 10 -
Net financing costs (362) (305) 19%
Income from associates 3 (17)
Tax (703) (664)
Effective tax rate 28% 30%
Net profit for the period 1 787 1 534 16%
Attributable to Imperial shareholders 1 579 1 350
Attributable to minorities 208 184 13%
38
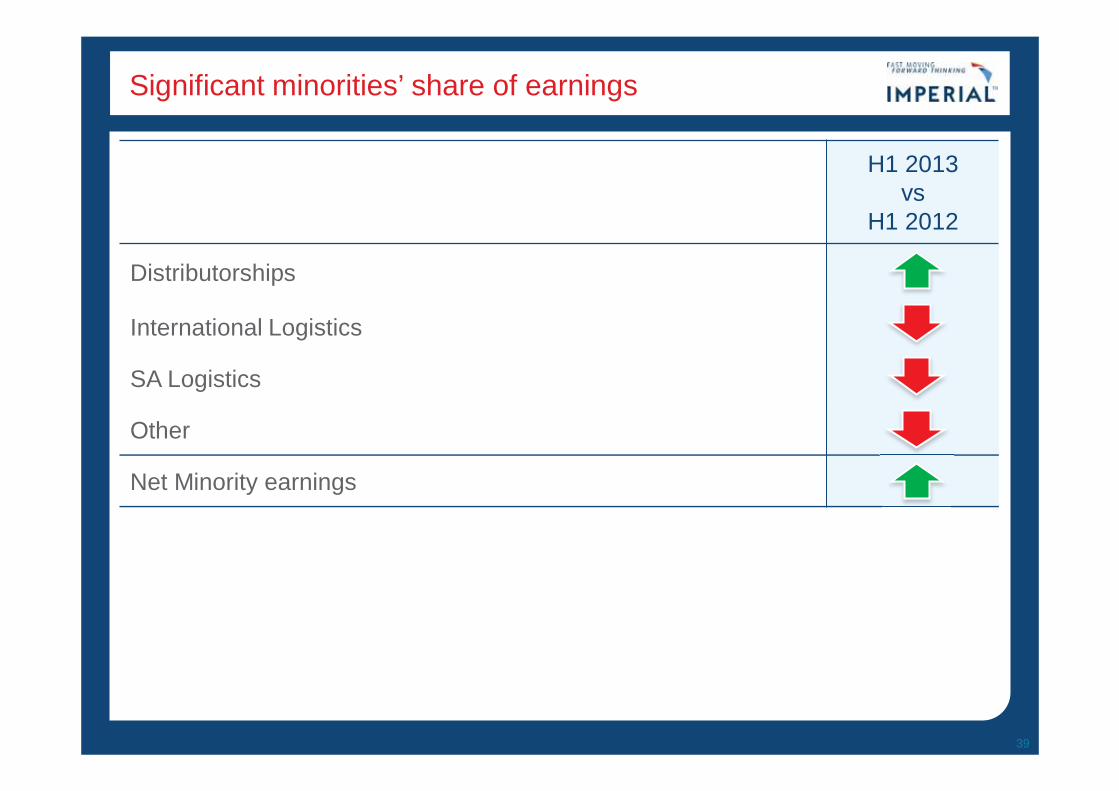
Significant minorities’ share of earnings
H1 2013 vs
H1 2012
Distributorships
International Logistics
SA Logistics
Other
Net Minority earnings
39
Balance sheet
Rm Dec 2012
Jun 2012
% change
Dec 2011
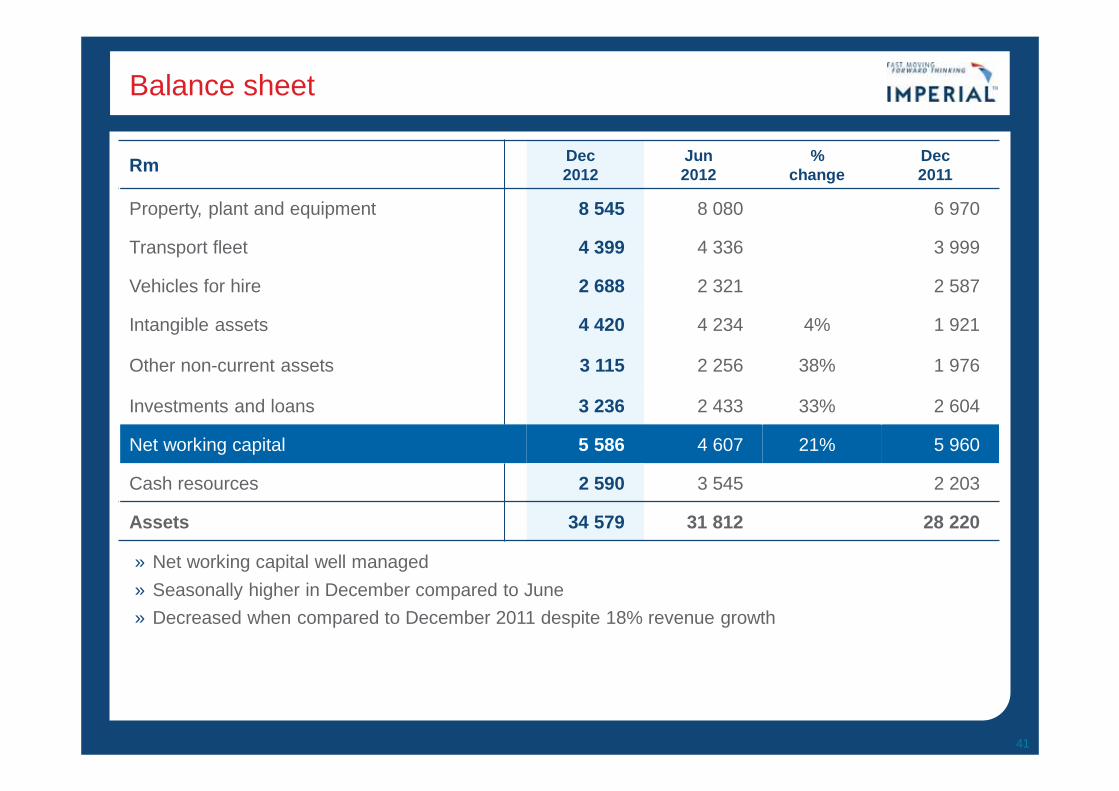
Property, plant and equipment 8 545 8 080 6 970
Transport fleet 4 399 4 336 3 999
Vehicles for hire 2 688 2 321 2 587
Intangible assets 4 420 4 234 4% 1 921
Other non-current assets 3 115 2 256 38% 1 976
Investments and loans 3 236 2 433 33% 2 604
40
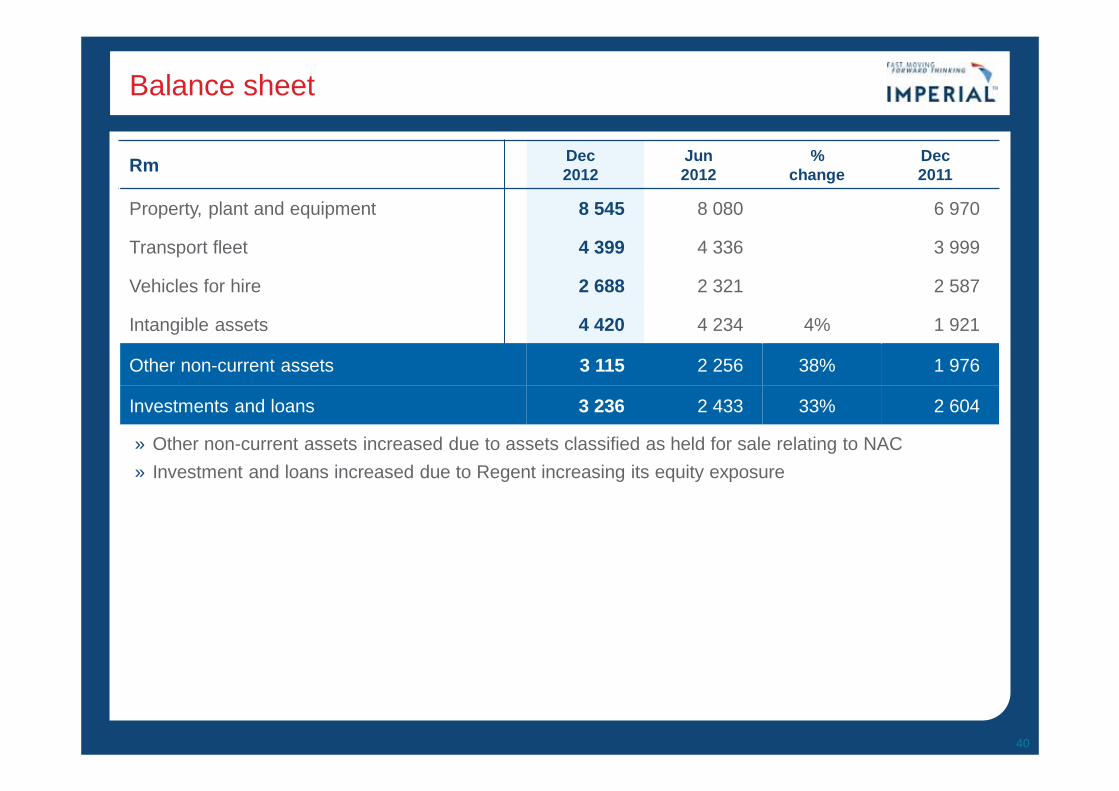
» Other non-current assets increased due to assets classified as held for sale relating to NAC » Investment and loans increased due to Regent increasing its equity exposure
Balance sheet
Rm Dec 2012
Jun 2012
% change
Dec 2011
Property, plant and equipment 8 545 8 080 6 970
Transport fleet 4 399 4 336 3 999
Vehicles for hire 2 688 2 321 2 587
Intangible assets 4 420 4 234 4% 1 921
Other non-current assets 3 115 2 256 38% 1 976
Investments and loans 3 236 2 433 33% 2 604
Net working capital 5 586 4 607 21% 5 960
Cash resources 2 590 3 545 2 203
Assets 34 579 31 812 28 220
41
» Net working capital well managed » Seasonally higher in December compared to June » Decreased when compared to December 2011 despite 18% revenue growth
Balance sheet
Rm Dec 2012
Jun 2012
% change
Dec 2011
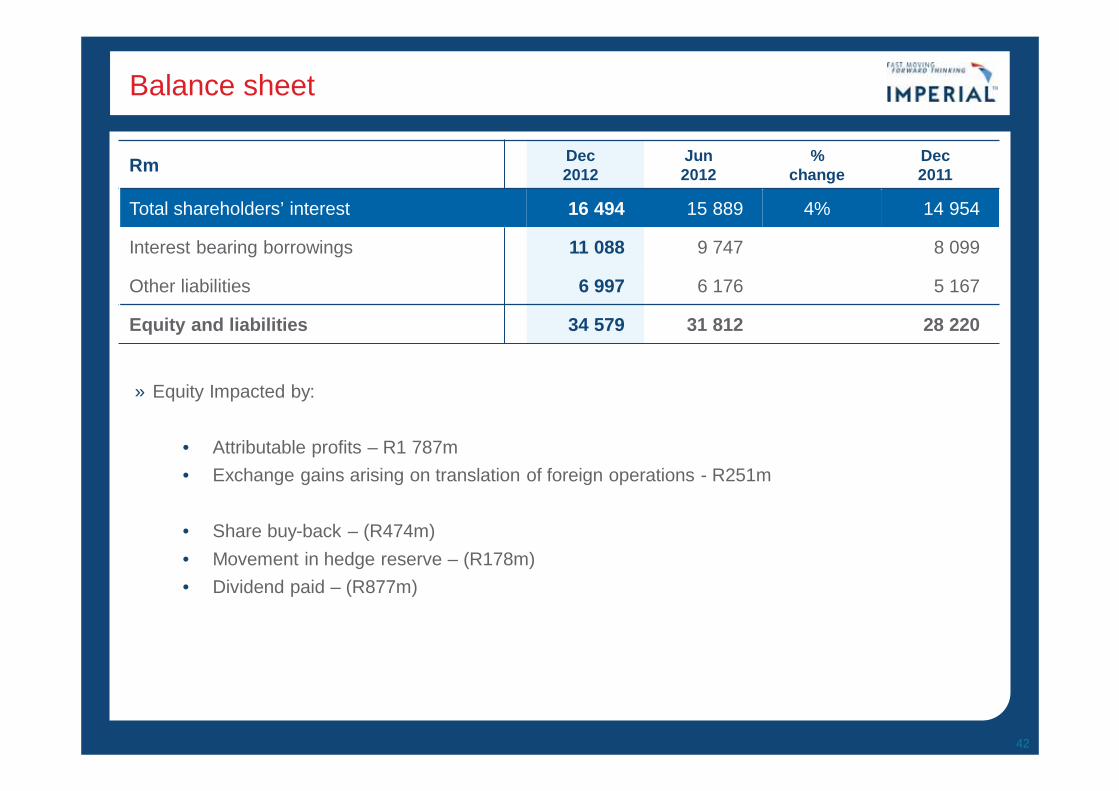
Total shareholders’ interest 16 494 15 889 4% 14 954
Interest bearing borrowings 11 088 9 747 8 099
Other liabilities 6 997 6 176 5 167
Equity and liabilities 34 579 31 812 28 220
42
» Equity Impacted by:
• Attributable profits – R1 787m • Exchange gains arising on translation of foreign operations - R251m
• Share buy-back – (R474m) • Movement in hedge reserve – (R178m) • Dividend paid – (R877m)
Gearing
43
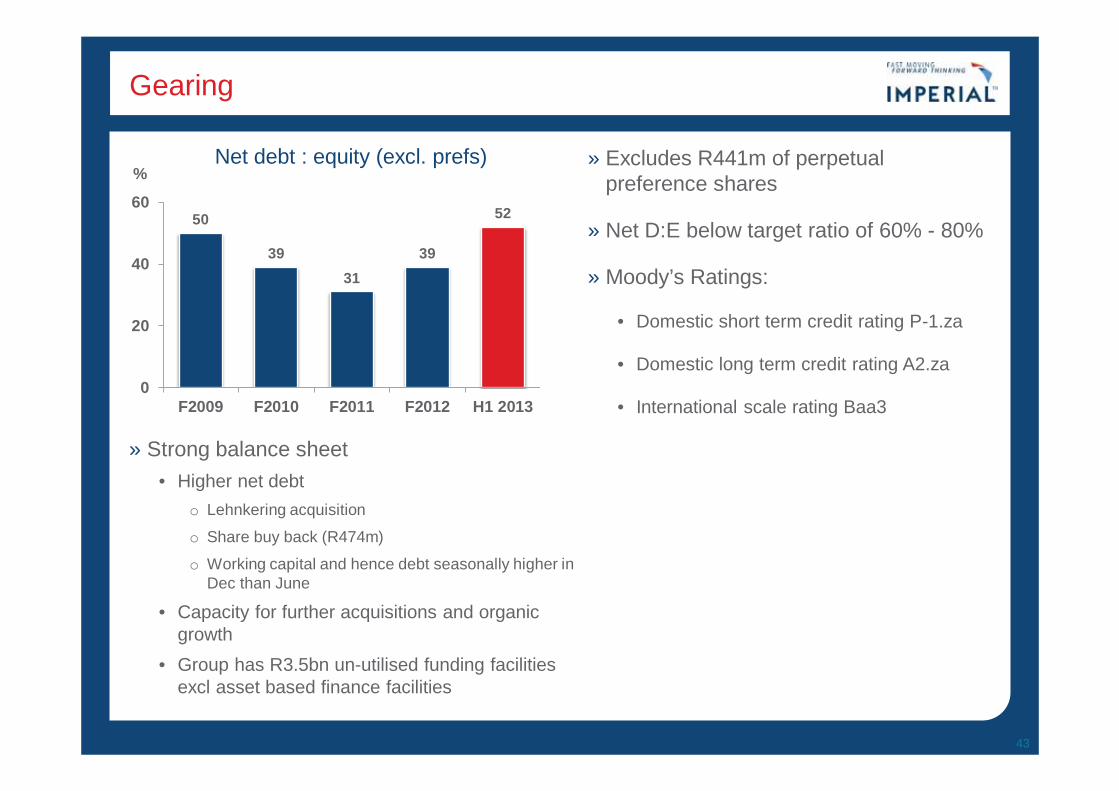
» Strong balance sheet • Higher net debt
o Lehnkering acquisition
o Share buy back (R474m)
o Working capital and hence debt seasonally higher in Dec than June
• Capacity for further acquisitions and organic growth
• Group has R3.5bn un-utilised funding facilities excl asset based finance facilities
50
39 31
39
52
0
20
40
60
F2009 F2010 F2011 F2012 H1 2013
Net debt : equity (excl. prefs) %
» Excludes R441m of perpetual preference shares
» Net D:E below target ratio of 60% - 80%
» Moody’s Ratings:
• Domestic short term credit rating P-1.za
• Domestic long term credit rating A2.za
• International scale rating Baa3
Returns
44
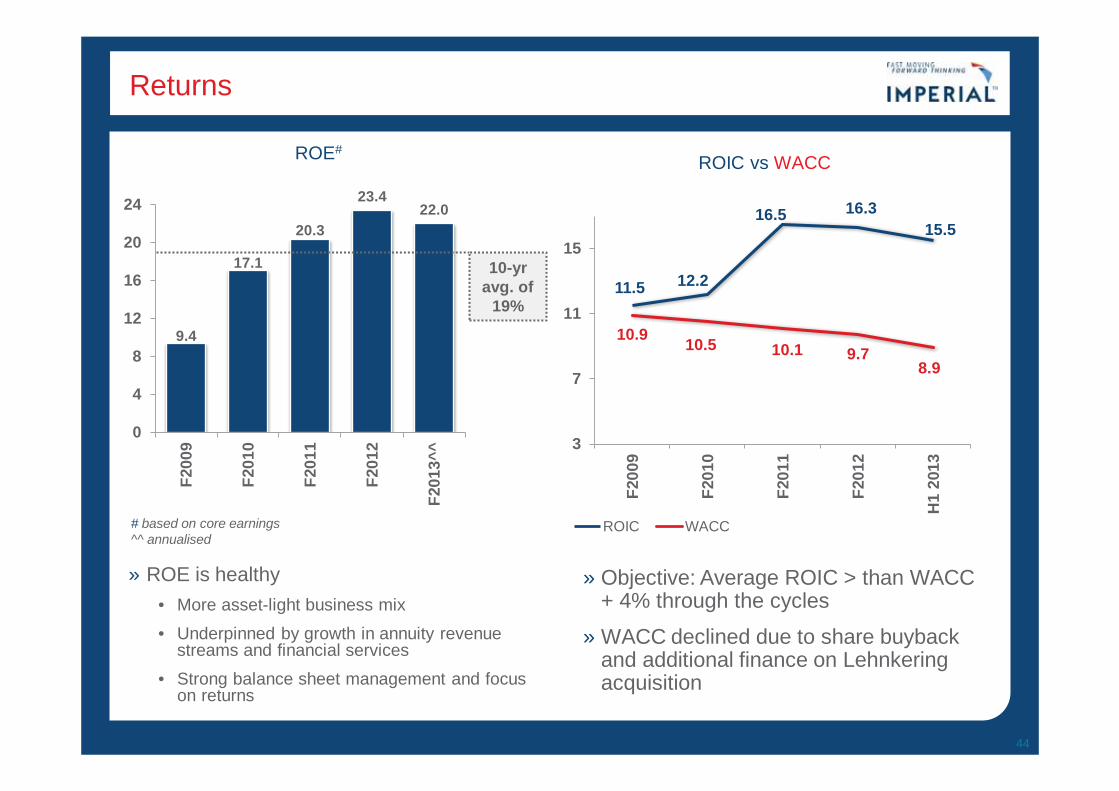
» ROE is healthy • More asset-light business mix
• Underpinned by growth in annuity revenue streams and financial services
• Strong balance sheet management and focus on returns
» Objective: Average ROIC > than WACC + 4% through the cycles
» WACC declined due to share buyback and additional finance on Lehnkering acquisition
9.4
17.1
20.3
23.4 22.0
0
4
8
12
16
20
24F2
009
F201
0
F201
1
F201
2
F201
3^^
ROE#
11.5 12.2
16.5 16.3 15.5
10.9 10.5 10.1 9.7 8.9
3
7
11
15
F200
9
F201
0
F201
1
F201
2
H1
2013
ROIC vs WACC
ROIC WACC
10-yr avg. of
19%
# based on core earnings ^^ annualised
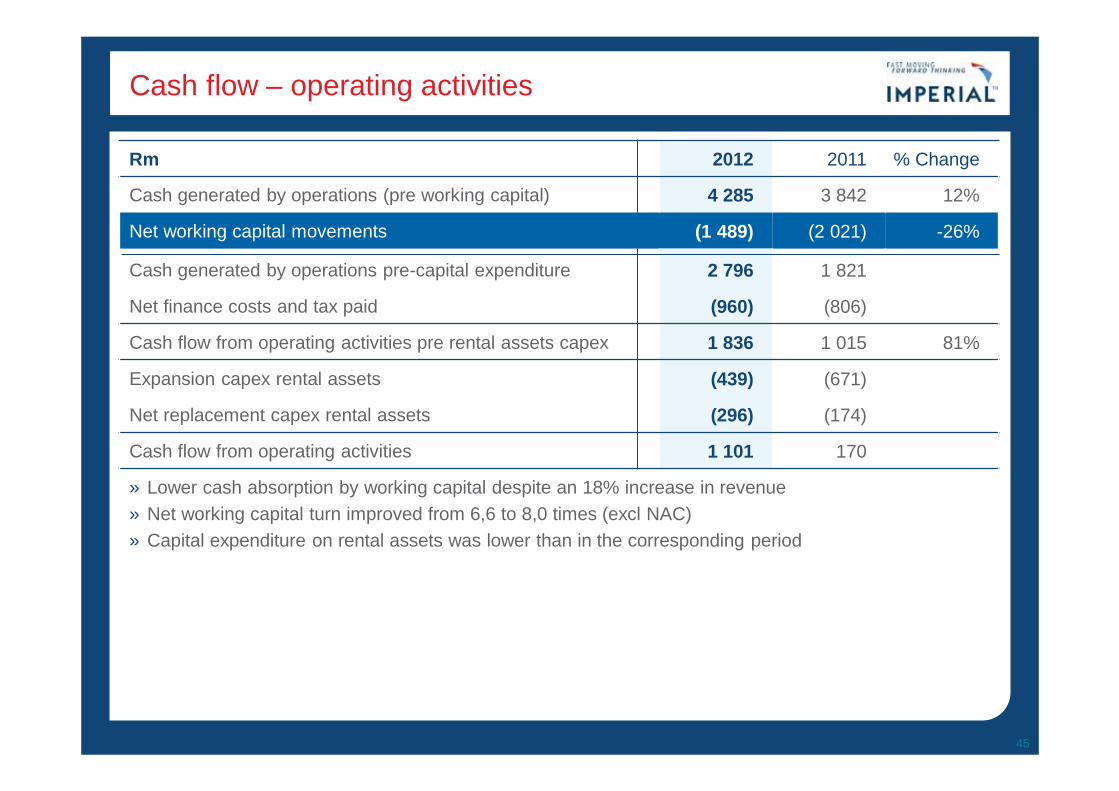
Cash flow – operating activities
Rm 2012 2011 % Change
Cash generated by operations (pre working capital) 4 285 3 842 12%
Net working capital movements (1 489) (2 021) -26%
Cash generated by operations pre-capital expenditure 2 796 1 821
Net finance costs and tax paid (960) (806)
Cash flow from operating activities pre rental assets capex 1 836 1 015 81%
Expansion capex rental assets (439) (671)
Net replacement capex rental assets (296) (174)
Cash flow from operating activities 1 101 170
» Lower cash absorption by working capital despite an 18% increase in revenue » Net working capital turn improved from 6,6 to 8,0 times (excl NAC) » Capital expenditure on rental assets was lower than in the corresponding period
45
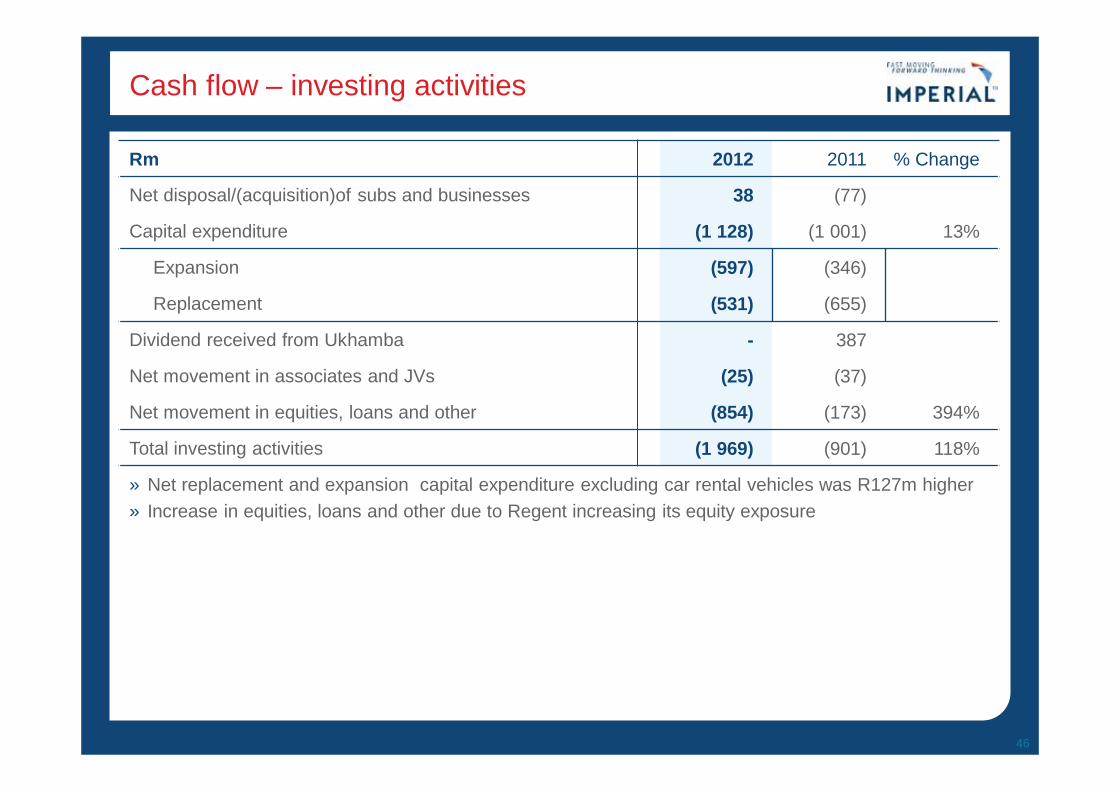
Cash flow – investing activities
Rm 2012 2011 % Change
Net disposal/(acquisition)of subs and businesses 38 (77)
Capital expenditure (1 128) (1 001) 13%
Expansion (597) (346)
Replacement (531) (655)
Dividend received from Ukhamba - 387
Net movement in associates and JVs (25) (37)
Net movement in equities, loans and other (854) (173) 394%
Total investing activities (1 969) (901) 118%
» Net replacement and expansion capital expenditure excluding car rental vehicles was R127m higher » Increase in equities, loans and other due to Regent increasing its equity exposure
46
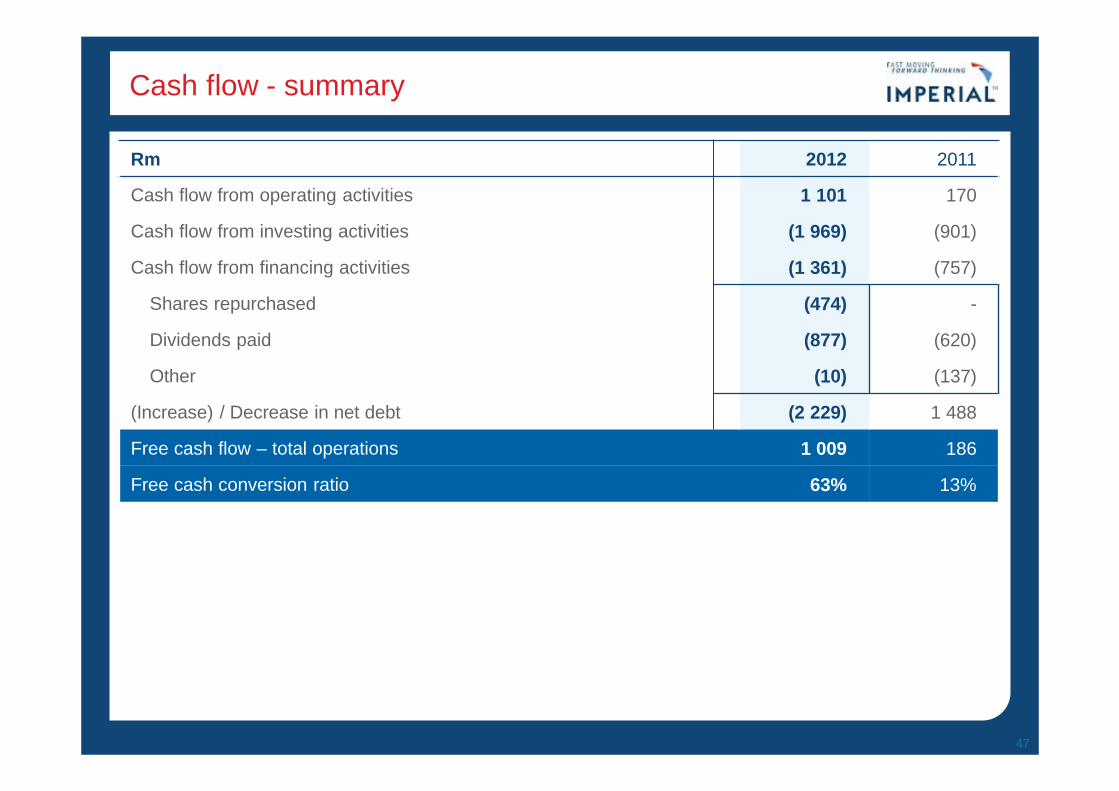
Cash flow - summary
Rm 2012 2011
Cash flow from operating activities 1 101 170
Cash flow from investing activities (1 969) (901)
Cash flow from financing activities (1 361) (757)
Shares repurchased (474) -
Dividends paid (877) (620)
Other (10) (137)
(Increase) / Decrease in net debt (2 229) 1 488
Free cash flow – total operations 1 009 186
Free cash conversion ratio 63% 13%
47
Strategy and Prospects
48
Strategy
» Focused on generating higher returns on capital
» Seeking growth opportunities in and adjacent to existing industries and geographies
» Focused on expanding our footprint in logistics industry in Africa and abroad
• Specific focus on consumer logistics in Africa
• Europe to expand around existing themes
» Maximizing position in motor value chain
• Scale and experience stands us in good stead
• Enable us to earn ever increasing annuity income streams from financial services and a growing vehicle parc (parts & services)
» Distribution of products which carry strong brands in the automotive and industrial markets remain a core focus
» Car Rental and Tourism division offers fewer opportunities for expansion
• Focus will be on improving the returns
» Regent and LiquidCapital to expand product ranges and improve market penetration
49
Recent acquisitions and disposals
» Acquisitions during the period • Midas acquired 80 % of Afintapart SA (Pty) Limited – a commercial vehicle parts distributor
• 60% of LTS Kenzam (Pty) Limited - a logistics business that distributes bituminous products throughout Southern Africa
• 100% of RTT Health Sciences (rebranded Imperial Health Sciences) – a pharmaceutical distribution and healthcare supply chain services business, effective January 2013
» Disposals during the period • 60% of Megafreight, a freight forwarding business; and
• 62% of NAC, the aircraft distributor and aviation services business. The sale of NAC was finalized on 15 February 2013 and R433m of capital was released
» Contribution to the half year results of businesses sold: • Megafreight included for two months – R87m revenue and R7m operating profit
• NAC included for the full six month period – R551m revenue and R22m operating profit
50
RTT Health Sciences acquisition
51
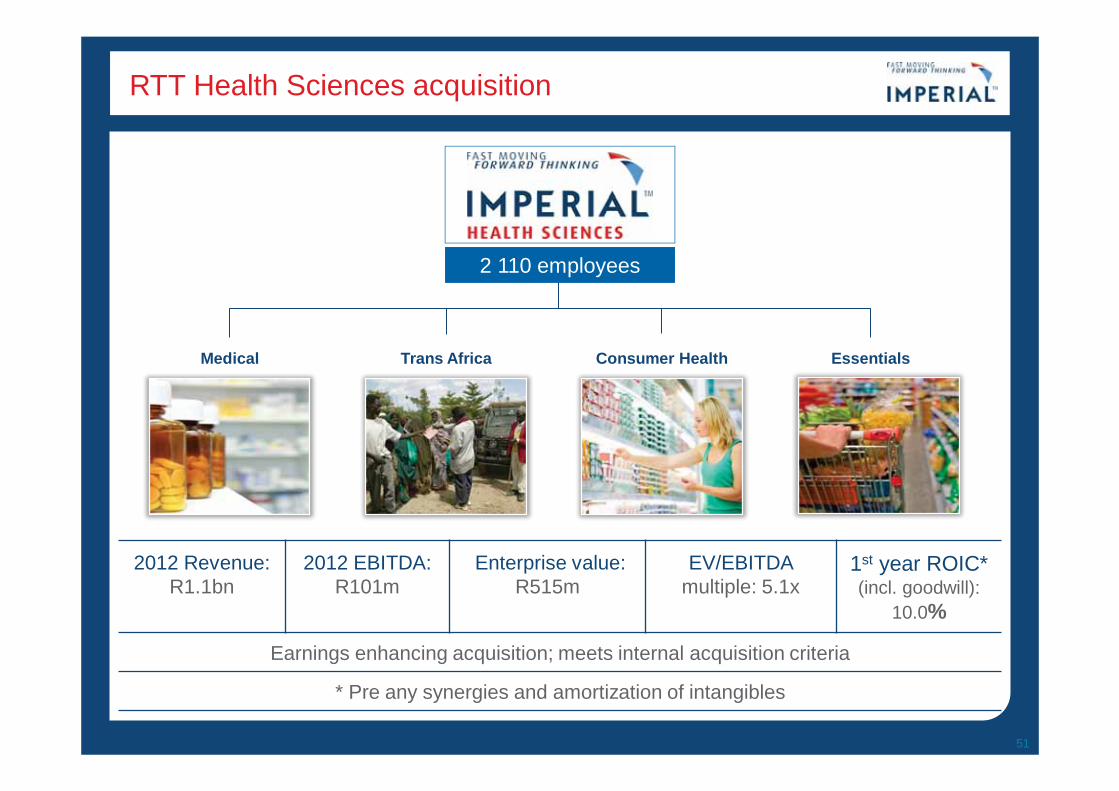
2012 Revenue: R1.1bn
2012 EBITDA: R101m
Enterprise value: R515m
EV/EBITDA multiple: 5.1x
1st year ROIC* (incl. goodwill):
10.0%
Earnings enhancing acquisition; meets internal acquisition criteria
* Pre any synergies and amortization of intangibles
Medical Trans Africa Consumer Health Essentials
2 110 employees
RTT Health Sciences presence in Africa
52
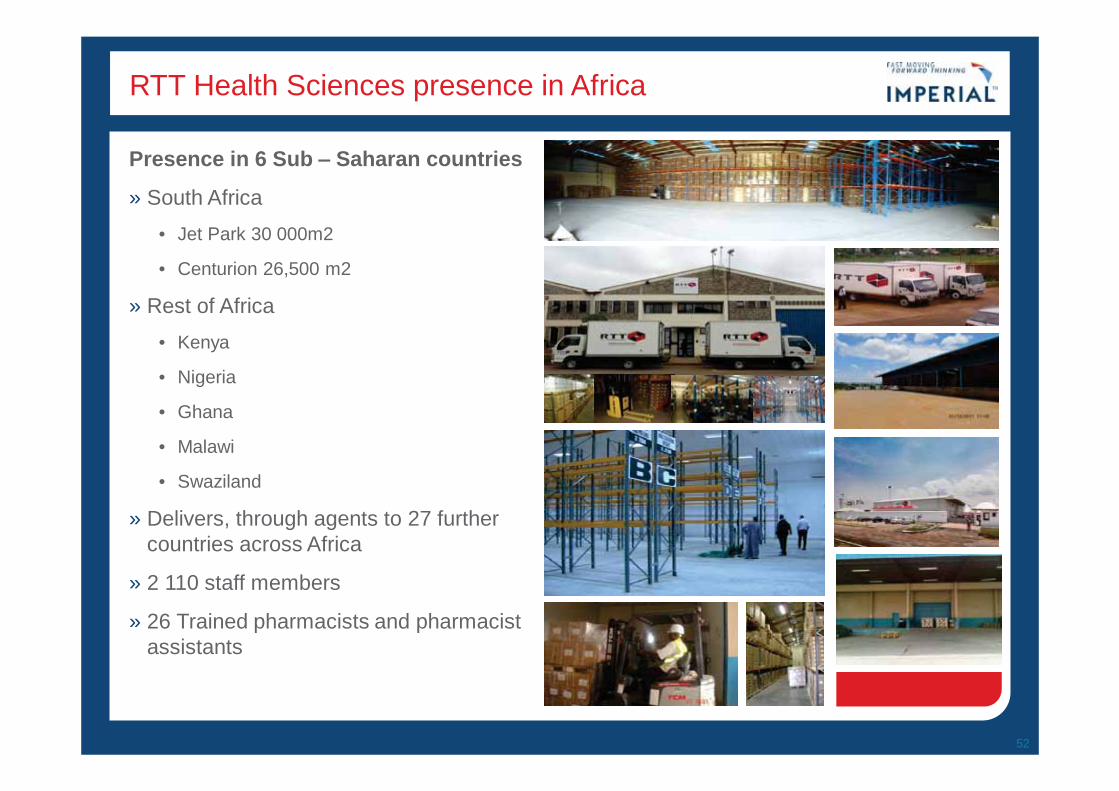
Presence in 6 Sub – Saharan countries
» South Africa • Jet Park 30 000m2
• Centurion 26,500 m2
» Rest of Africa • Kenya
• Nigeria
• Ghana
• Malawi
• Swaziland
» Delivers, through agents to 27 further countries across Africa
» 2 110 staff members
» 26 Trained pharmacists and pharmacist assistants
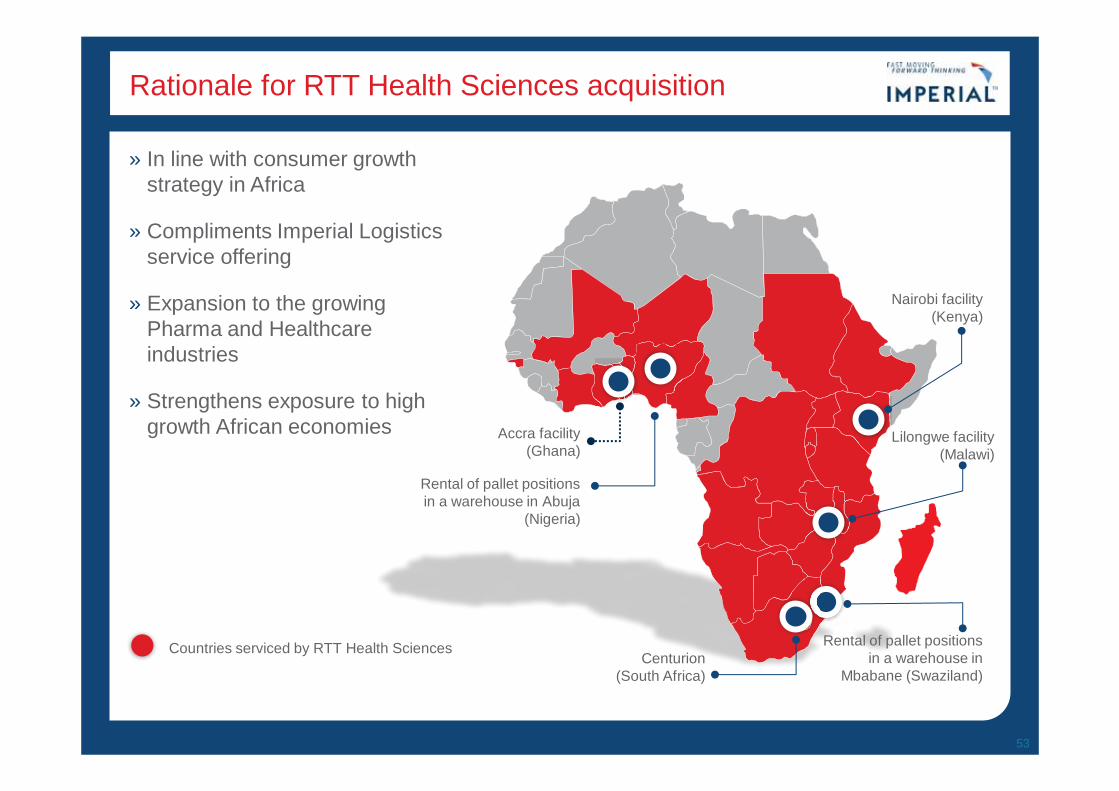
Rationale for RTT Health Sciences acquisition
53
» In line with consumer growth strategy in Africa
» Compliments Imperial Logistics service offering
» Expansion to the growing Pharma and Healthcare industries
» Strengthens exposure to high growth African economies
Accra facility (Ghana)
Rental of pallet positions in a warehouse in Abuja
(Nigeria)
Nairobi facility (Kenya)
Lilongwe facility (Malawi)
Rental of pallet positions in a warehouse in
Mbabane (Swaziland) Centurion
(South Africa)
Countries serviced by RTT Health Sciences
Prospects
» Imperial holds leading positions in its main markets
» Trading conditions in SA logistics are challenging
» RTT acquisition will contribute in second half and enhance our capabilities
» African logistics to continue gaining momentum
» International logistics – slow down expected, in line with slowing German economy
» Car rental market to remain competitive
» Growth in new car sales in South Africa expected to moderate further
• Low interest rates and credit availability to support demand
» Growth of Distributorship car parc - increasing annuity income streams from parts and service activities
» Industrial parts and components will be solid
» Improvement expected in used car market
» Earnings in Financial Services will be robust
» Strong balance sheet will allow us to take advantage of growth opportunities
» Under current conditions subdued growth is expected in 2013 financial year
54
Appendix
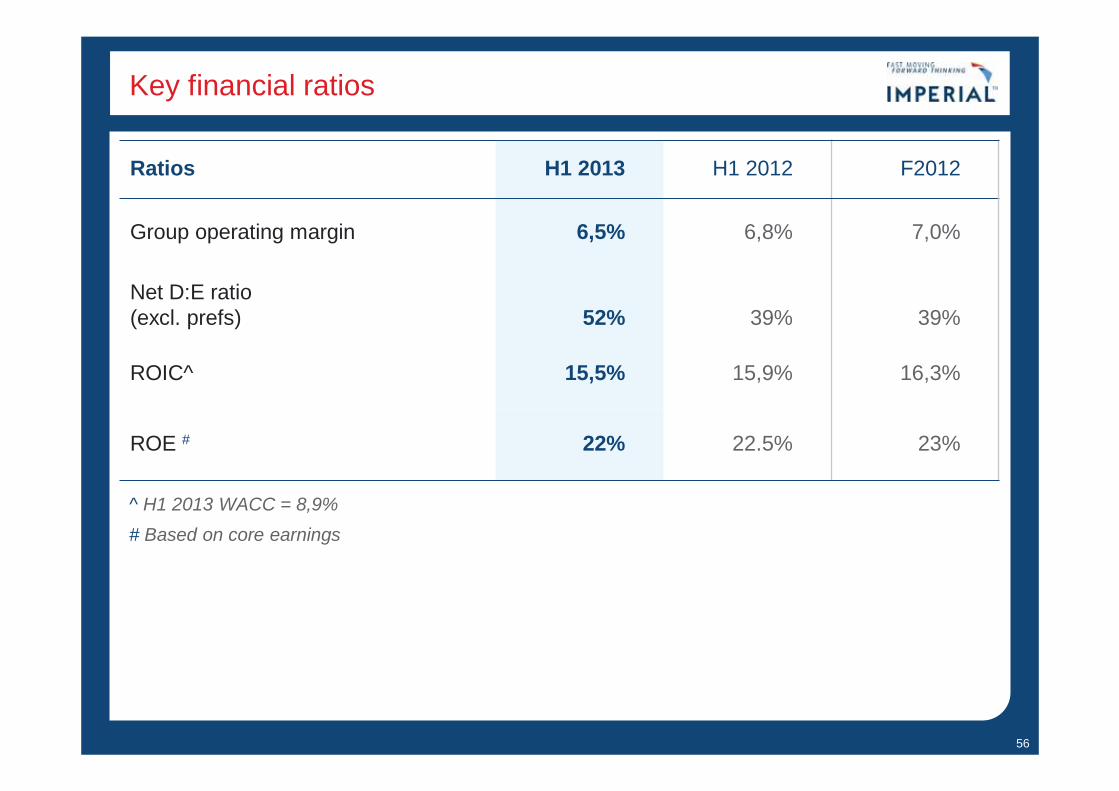
Key financial ratios
Ratios H1 2013 H1 2012 F2012
Group operating margin 6,5% 6,8% 7,0%
Net D:E ratio (excl. prefs) 52% 39% 39%
ROIC^ 15,5% 15,9% 16,3%
ROE # 22% 22.5% 23%
56
^ H1 2013 WACC = 8,9% # Based on core earnings
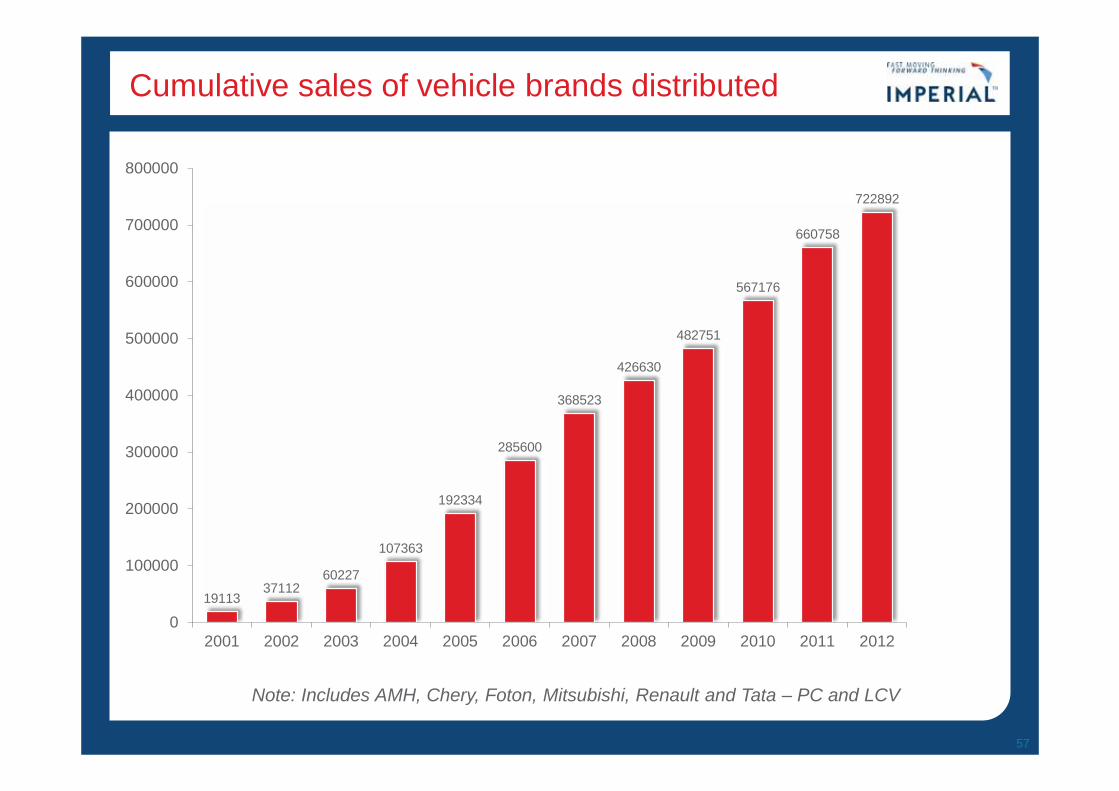
Cumulative sales of vehicle brands distributed
57
19113 37112
60227
107363
192334
285600
368523
426630
482751
567176
660758
722892
0
100000
200000
300000
400000
500000
600000
700000
800000
2001 2002 2003 2004 2005 2006 2007 2008 2009 2010 2011 2012YTD
Note: Includes AMH, Chery, Foton, Mitsubishi, Renault and Tata – PC and LCV
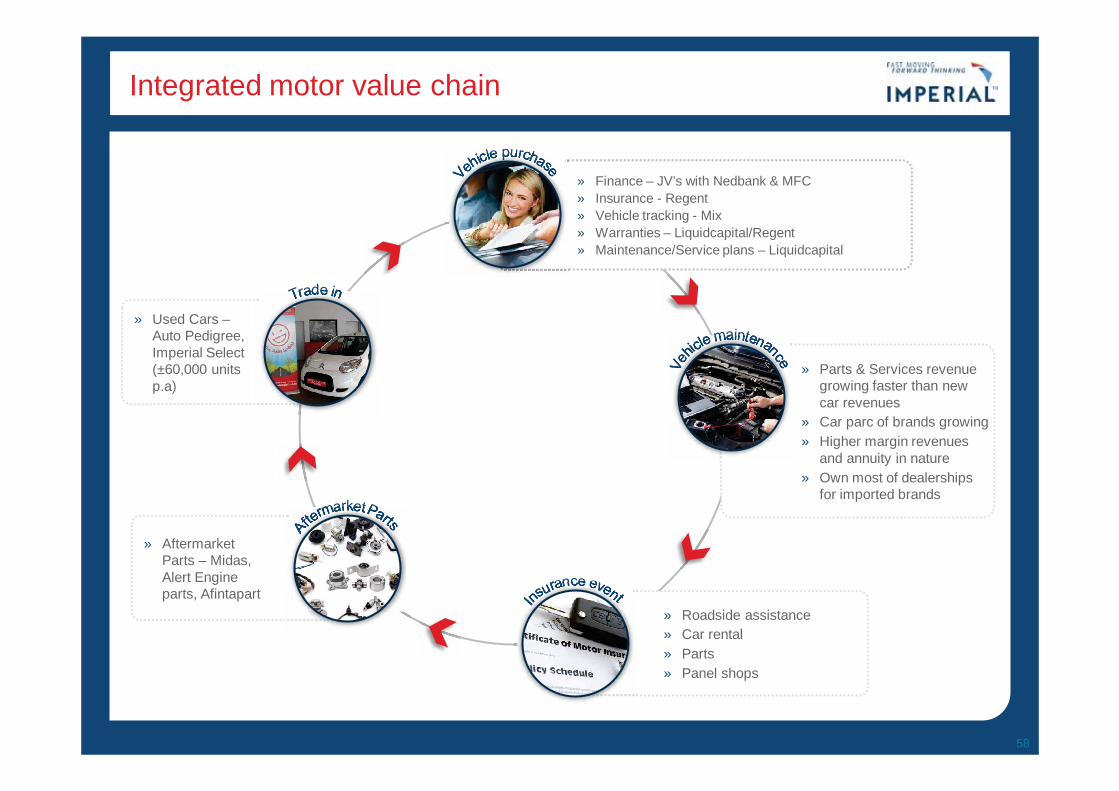
Integrated motor value chain
58
» Finance – JV’s with Nedbank & MFC » Insurance - Regent » Vehicle tracking - Mix » Warranties – Liquidcapital/Regent » Maintenance/Service plans – Liquidcapital
» Aftermarket Parts – Midas, Alert Engine parts, Afintapart
» Used Cars –Auto Pedigree, Imperial Select (±60,000 units p.a)
» Parts & Services revenue growing faster than new car revenues
» Car parc of brands growing » Higher margin revenues
and annuity in nature » Own most of dealerships
for imported brands
» Roadside assistance » Car rental » Parts » Panel shops
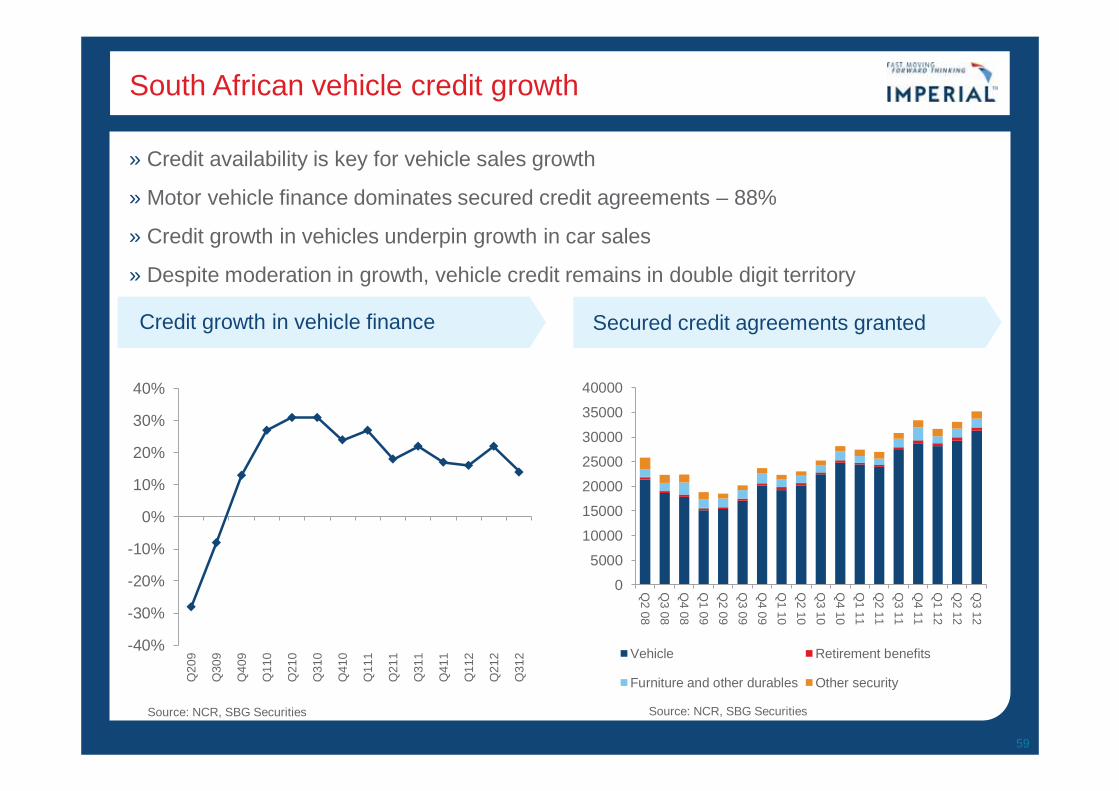
South African vehicle credit growth
» Credit availability is key for vehicle sales growth
» Motor vehicle finance dominates secured credit agreements – 88%
» Credit growth in vehicles underpin growth in car sales
» Despite moderation in growth, vehicle credit remains in double digit territory
59
-40%
-30%
-20%
-10%
0%
10%
20%
30%
40%
Q20
9
Q30
9
Q40
9
Q11
0
Q21
0
Q31
0
Q41
0
Q11
1
Q21
1
Q31
1
Q41
1
Q11
2
Q21
2
Q31
2
Credit growth in vehicle finance Secured credit agreements granted
Source: NCR, SBG Securities
0
5000
10000
15000
20000
25000
30000
35000
40000
Q2 08
Q3 08
Q4 08
Q1 09
Q2 09
Q3 09
Q4 09
Q1 10
Q2 10
Q3 10
Q4 10
Q1 11
Q2 11
Q3 11
Q4 11
Q1 12
Q2 12
Q3 12
Vehicle Retirement benefits
Furniture and other durables Other security
Source: NCR, SBG Securities
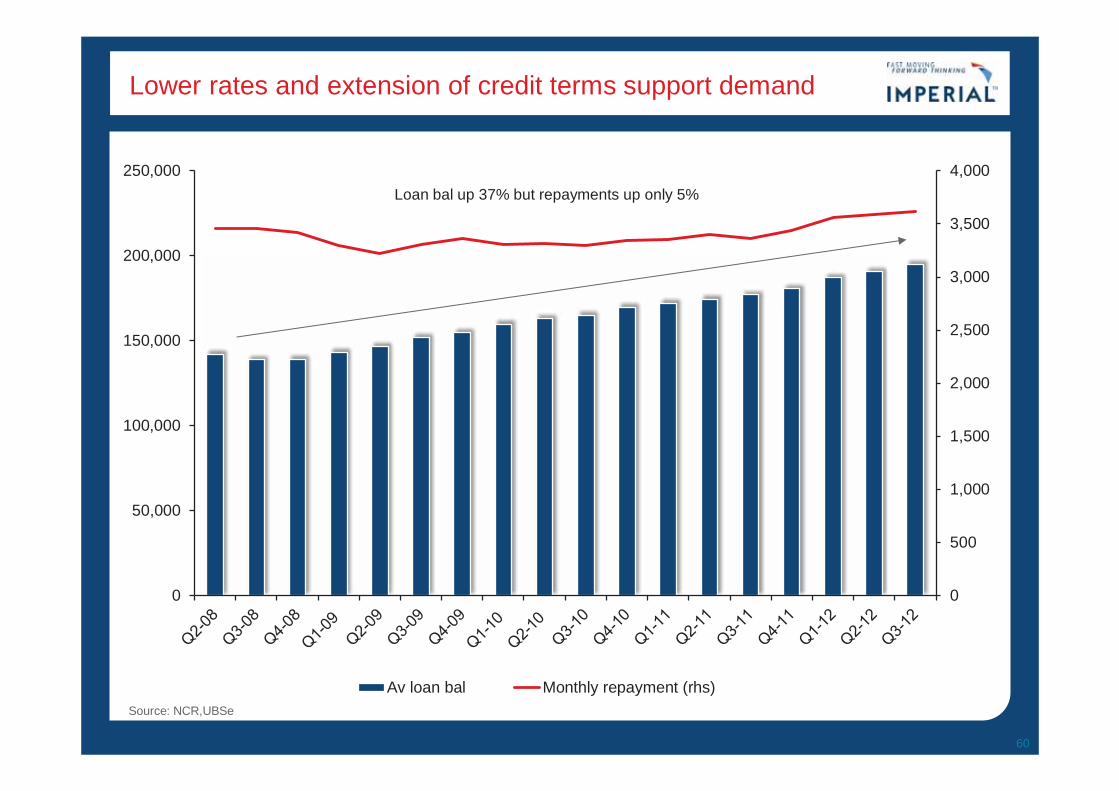
Lower rates and extension of credit terms support demand
60
0
500
1,000
1,500
2,000
2,500
3,000
3,500
4,000
0
50,000
100,000
150,000
200,000
250,000
Av loan bal Monthly repayment (rhs)
Loan bal up 37% but repayments up only 5%
Source: NCR,UBSe
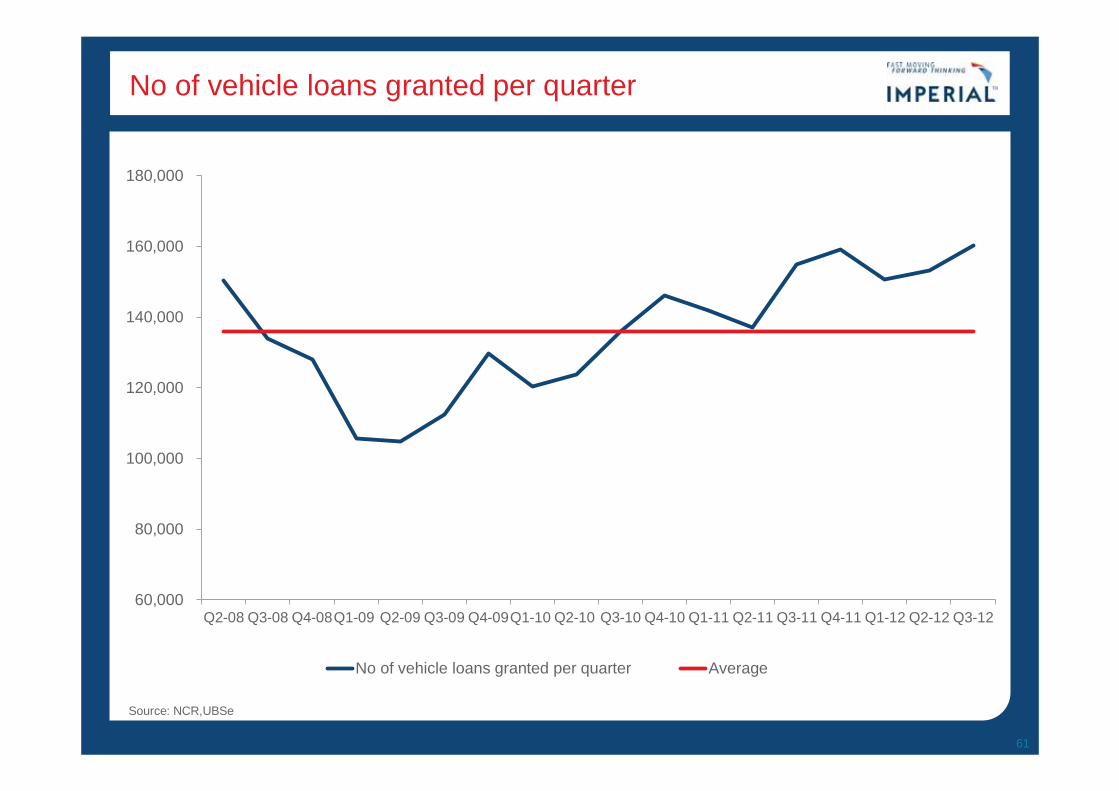
No of vehicle loans granted per quarter
61
60,000
80,000
100,000
120,000
140,000
160,000
180,000
Q2-08 Q3-08 Q4-08Q1-09 Q2-09 Q3-09 Q4-09Q1-10 Q2-10 Q3-10 Q4-10 Q1-11 Q2-11 Q3-11 Q4-11 Q1-12 Q2-12 Q3-12
No of vehicle loans granted per quarter Average
Source: NCR,UBSe
Domestic
Exports
Imports
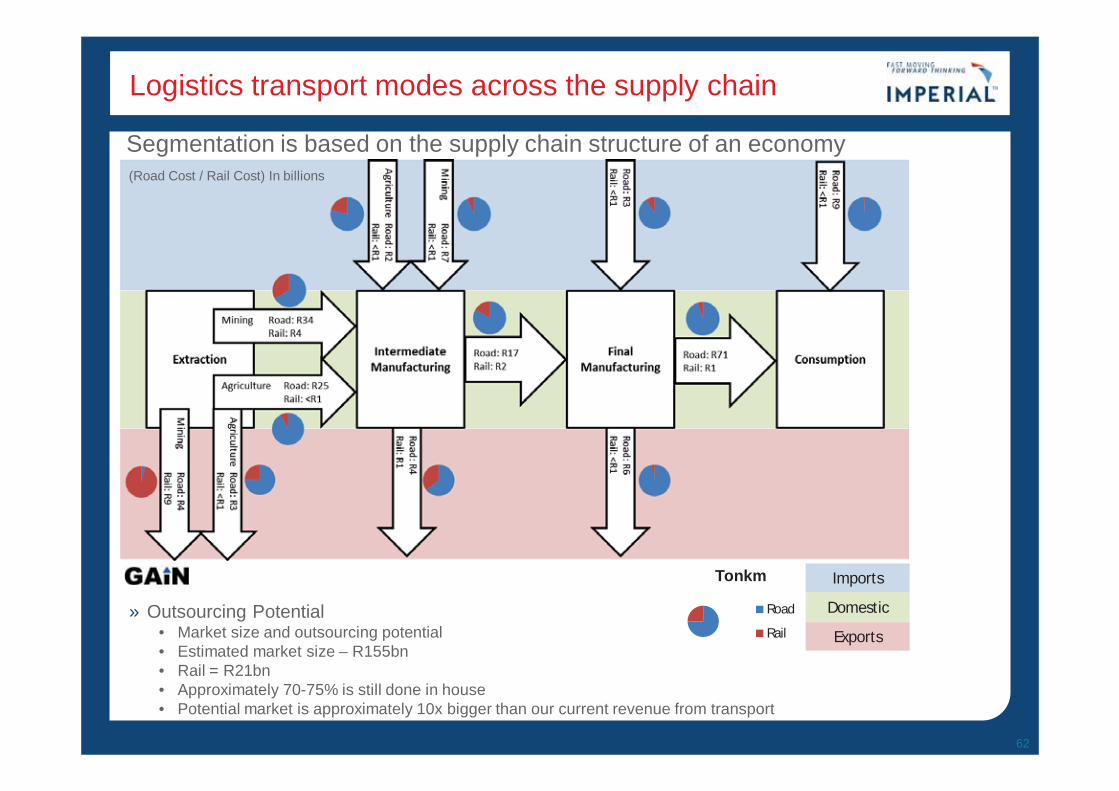
Logistics transport modes across the supply chain
62
» Outsourcing Potential • Market size and outsourcing potential • Estimated market size – R155bn • Rail = R21bn • Approximately 70-75% is still done in house • Potential market is approximately 10x bigger than our current revenue from transport
Segmentation is based on the supply chain structure of an economy (Road Cost / Rail Cost) In billions
Tonkm
Road
Rail
Southern Africa logistics
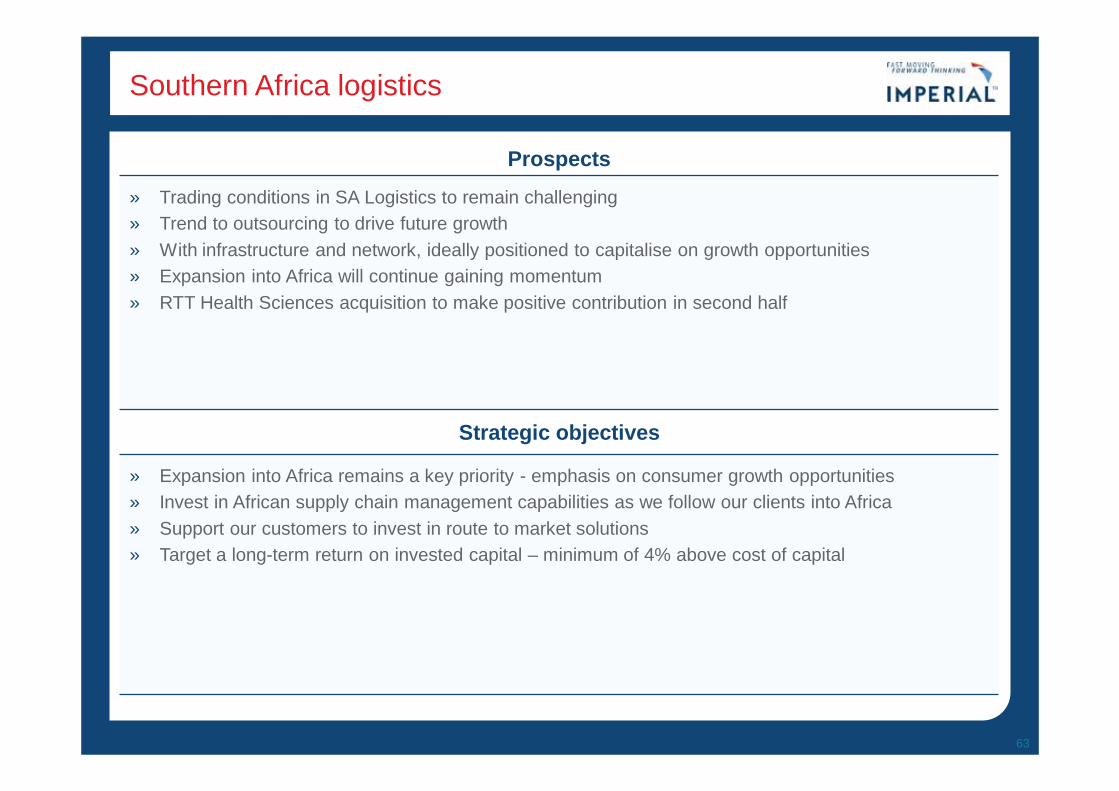
Prospects
» Trading conditions in SA Logistics to remain challenging » Trend to outsourcing to drive future growth » With infrastructure and network, ideally positioned to capitalise on growth opportunities » Expansion into Africa will continue gaining momentum » RTT Health Sciences acquisition to make positive contribution in second half
Strategic objectives
» Expansion into Africa remains a key priority - emphasis on consumer growth opportunities » Invest in African supply chain management capabilities as we follow our clients into Africa » Support our customers to invest in route to market solutions » Target a long-term return on invested capital – minimum of 4% above cost of capital
63
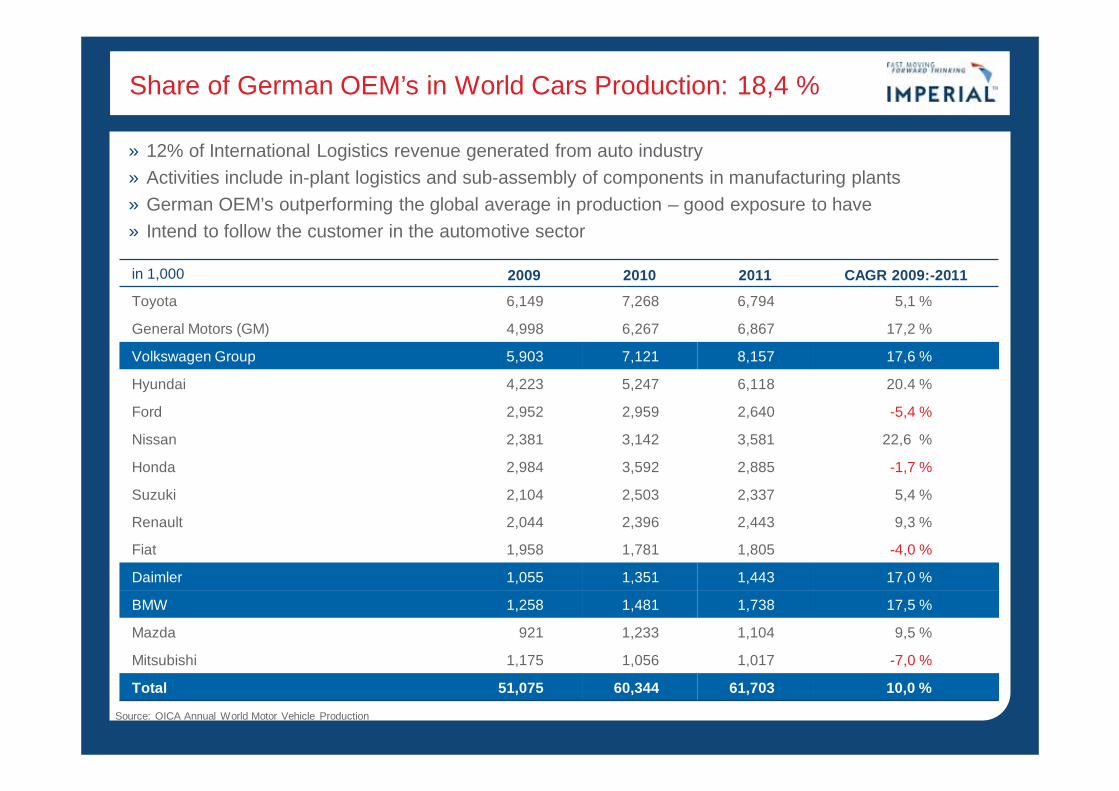
Share of German OEM’s in World Cars Production: 18,4 %
in 1,000 2009 2010 2011 CAGR 2009:-2011
Toyota 6,149 7,268 6,794 5,1 %
General Motors (GM) 4,998 6,267 6,867 17,2 %
Volkswagen Group 5,903 7,121 8,157 17,6 %
Hyundai 4,223 5,247 6,118 20.4 %
Ford 2,952 2,959 2,640 -5,4 %
Nissan 2,381 3,142 3,581 22,6 %
Honda 2,984 3,592 2,885 -1,7 %
Suzuki 2,104 2,503 2,337 5,4 %
Renault 2,044 2,396 2,443 9,3 %
Fiat 1,958 1,781 1,805 -4,0 %
Daimler 1,055 1,351 1,443 17,0 %
BMW 1,258 1,481 1,738 17,5 %
Mazda 921 1,233 1,104 9,5 %
Mitsubishi 1,175 1,056 1,017 -7,0 %
Total 51,075 60,344 61,703 10,0 %
» 12% of International Logistics revenue generated from auto industry » Activities include in-plant logistics and sub-assembly of components in manufacturing plants » German OEM’s outperforming the global average in production – good exposure to have » Intend to follow the customer in the automotive sector
» Source: OICA Annual World Motor Vehicle Production
International logistics
Prospects
» Future performance to be impacted by slowing German economy » Lehnkering to have a positive impact on results as it will make a contribution for the full year » Businesses remain well positioned in attractive niches in the logistics industry in Germany » Acquisitions could be a further growth driver
Strategic objectives
» Maximise position in current niches & segments » Take advantage of trend to outsourcing in key industries we serve » Pursue bolt-on acquisitions in areas we have expertise » Follow our customer base into other geographies, eg Eastern Europe, South America
65
Car Rental and Tourism
Prospects
» Conditions in car rental and tourism will continue to be tough » Improvement expected in used car market as price differential between used and new cars widen » Inbound travel demand expected to be slow
Strategic objectives
» Improve return on invested capital » Maximise positioning in commercial vehicle rental market » Grow unit sales and market share in Auto Pedigree’s specific target market » Improve contribution from panelshops to divisional results
66
Distributorships
Prospects
» While inventory position has improved, product supply remains tight but stable » Continue benefiting from growth in parts and service revenue streams as the car parc of imported
brands grow » Autoparts should perform solidly in competitive market » Goscor will capitalise on strong order book, growth in rental business and after sales maintenance
opportunities
Strategic objectives
» Increase market share in the SA vehicle market » Continue to focus on optimizing the value chain in motor business » Grow annuity-type income from parts, service & after-sales activities » Distribution of products which carry strong brands in automotive and industrial markets remain a core
focus
67
Automotive Retail
Prospects
» Outlook for new vehicle sales is for a slower growth » Well balanced portfolio – ideally positioned to take advantage of any growth opportunities presented
by market » Used car market should improve further
Strategic objectives
» Target best in industry ROIC & operating margins » Focus on organic growth & optimising synergies between vehicle sales, related financial services
and parts and service » Increase parts & accessory sales
68
Financial Services
Prospects
» Earnings in Financial Services division should be robust » Increasing annuity income due to new business being placed on its book
» Investment portfolio continues to be conservatively managed despite increased exposure to equity markets
Strategic objectives » Increase market share in motor and non-motor related insurance by leveraging off the Imperial dealer
network and using other innovative distribution channels » Exploit the opportunity of selling more financial products to the growing car parc of vehicles we
import » Continue to develop life insurance business in the emerging market » Seek new strategic partnerships where we can leverage off each other skills set and add value
69