for the six months june 30, 2017 - bank of khyber information... · corporate information...
TRANSCRIPT

for the six months June 30, 2017


Corporate Information
Directors’ Review
1
2
Auditor’s Review Report 4
Condensed Interim Cash Flow Statement
8
Condensed Interim Statement of Comprehensive Income 7
Condensed Interim Statement of Financial Position 5
Condensed Interim Profit and Loss Account 6
9
Notes to the Financial InformationCondensed Interim 10
Condensed Interim Statement of Changes in Equity

Board of Directors
Managing Director / CEO
Audit Committee
HR&R Committee
Risk Management Committee
Chief Financial Officer
Company Secretary
Registered Office / Head Office
Auditors
Legal Advisors
Registrar and Share Registration Office
Muhammad Azam Khan Chairman
Shakeel Qadir Khan
Maqsood Ismail Ahmad
Asad Muhammad Iqbal
Javed Akhtar
Rashid Ali Khan
Shams-ul-Qayyum
Asad Muhammad Iqbal Chairman
Shakeel Qadir Khan
Javed Akhtar
Rashid Ali Khan
Rashid Ali Khan Chairman
Maqsood Ismail Ahmad
Asad Muhammad Iqbal
The Managing Director
Mr. Maqsood Ismail Ahmad Chairman
Mr. Rashid Ali Khan
The Managing Director
Rahat Gul
Zahid Sahibzada
The Bank of Khyber,
24-The Mall, Peshawar Cantt.
1st Floor, State Life Building
34-The Mall, Peshawar Cantt.
UAN#00-92-91-111 95 95 95
URL: www.bok.com.pk
Grant Thornton Anjum Rahman
Chartered Accountants
Mr. Nisar Ahmed Khan
Advocate, Peshawar
M/s. Mohsin Tayebaly & Co., Karachi
THK Associates (Pvt) Ltd.
1st Floor, 40-C, Block 6
P.E.C.H.S, Karachi – 75530
Pakistan.
31
CORPORATE INFORMATION

3
DIRECTORS’ REVIEW
2
On behalf of the Board of Directors of the Bank of Khyber, I am pleased to present the condensed
interim financial information of the Bank along with Auditors' Review Report for the half year
ended June 30, 2017. The results are inclusive of Islamic Banking Operations.
The financial results of the Bank of Khyber for the half year ended June 30, 2017 are as under:
Total Assets 261,874 206,400
Deposits 152,247 157,020
Advances (Gross) 61,774 36,054
Investments (Net) 181,001 141,602
Operating Profit 1,862 2,109
Provision against non-performing advances/Others (210) (365)
Reversal against other assets - 2
Profit before taxation 1,652 1,746
Taxation (713) (725)
Profit after tax 939 1,021
The Bank continues to maintain its performance during the period under review. The Bank posted a
pre-tax profit of Rs. 1,652 million against Rs. 1,746 million of the corresponding period of 2016.
After tax profit stood at Rs. 939 million.
An encouraging growth of 27% has been witnessed in the balance sheet size which reached
Rs. 261,874 million from Rs. 206,400 million as at December 31, 2016. Deposits with slight
decrease from the year end 2016, stood at Rs. 152,247 million. Advances remarkably increased by
71% and settled at Rs. 61,774 million mainly due to commodity and power sector financing.
Investments increased by 28% to Rs. 181,001 million as compared to Rs. 141,602 million at the
close of year end 2016.
Since start of the year 2017, the economy has shown continued progression in economic activity.
Benefitting from the trend, the Bank is making steady progress in all operational areas and have
launched different attractive products on the assets and liabilities side. In order to supplement
deposit flow, different schemes are being offered with attractive terms and efforts are being made
to interact with new customers not only to meet their banking needs but to generate core deposits
and reduce its cost.
With a network of 155 branches including 79 dedicated Islamic Banking Branches, the Bank
provides comprehensive banking services across the country. Continuing with our branch
Financial Highlights
(Rs. in Million)
June 30 December 31
2017 2016
(Rs. in Million)
Period Ended June 30
2017 2016
Future Outlook
Financial Overview

3
expansion policy, the Bank will complete the process of opening of 25 new branches by the year end
2017.
The JCR-VIS Credit Rating Company Limited (JCR-VIS) has reaffirmed the medium to long term and
short term entity ratings of the Bank at “A” (Single A) and “A-1” (A One) respectively. Outlook on the
assigned rating is “Stable”.
The Pakistan Credit Rating Agency Limited (PACRA) has maintained the long term and short term
entity ratings of the Bank at “A” (Single A) and “A1” (A One) respectively. Rating outlook is “Stable”.
These ratings denote low expectation of credit risk emanating from a strong capacity for timely
payment of financial commitments.
The Board would like to thank the Provincial Government, State Bank of Pakistan and other
regulatory authorities for their support and continued guidance. We are grateful to our valued
customers for their trust and support whereas dedicated efforts of the staff is very much
appreciated.
For and on behalf of the Board of Directors
Islamabad: August 18, 2017 Managing Director
Shams-ul-Qayyum
Credit Rating
Acknowledgment

Introduction
Conclusion
We have reviewed the accompanying condensed interim financial position of The Bank of Khyber
(the bank) as at June 30, 2017 and the related condensed interim profit and loss account,
condensed interim statement of comprehensive income, condensed interim cash flow statement
and condensed interim statement of changes in equity together with the notes forming part
thereof for the six months then ended (here-in-after referred to as the “interim financial
information”). Management is responsible for the preparation and presentation of this interim
financial information in accordance with approved accounting standards as applicable in Pakistan
for interim financial reporting. Our responsibility is to express a conclusion on this interim financial
information based on our review. The figures of the condensed interim profit and loss account and
the condensed statement of comprehensive income for the three months ended June 30, 2017 and
2016 have not been reviewed and we do not express a conclusion on them, as we are required to
review only the cumulative figures for the half year ended June 30, 2017.
We conducted our review in accordance with International Standard on Review Engagements
2410, "Review of Interim Financial Information Performed by the Independent Auditor of the
Entity." A review of interim financial information consists of making inquiries, primarily of persons
responsible for financial and accounting matters, and applying analytical and other review
procedures. A review is substantially less in scope than an audit conducted in accordance with
International Standards on Auditing and consequently does not enable us to obtain assurance that
we would become aware of all significant matters that might be identified in an audit. Accordingly,
we do not express an audit opinion.
Based on our review, nothing has come to our attention that causes us to believe that the
accompanying interim financial information as of and for the six months ended June 30, 2017 is not
prepared, in all material respects, in accordance with approved accounting standards as applicable
in Pakistan for interim financial reporting.
Chartered Accountants
Engagement Partner: Nadeem Tirmizi
Date: August 18, 2017
Islamabad
Scope of Review
GRANT THORNTON ANJUM RAHMAN
INDEPENDENT AUDITORS' REPORT TO THE MEMBERS
ON REVIEW OF INTERIM FINANCIAL INFORMATION
34
5
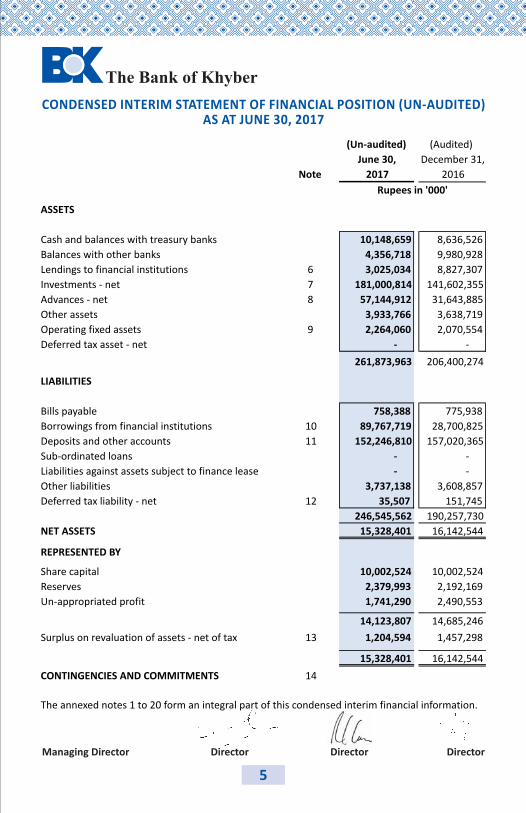
CONDENSED INTERIM STATEMENT OF FINANCIAL POSITION (UN-AUDITED)AS AT JUNE 30, 2017
(Un-audited) (Audited)
June 30, December 31,
Note 2017 2016
ASSETS
Cash and balances with treasury banks 10,148,659 8,636,526
Balances with other banks 4,356,718 9,980,928
Lendings to financial institutions 6 3,025,034 8,827,307
Investments - net 7 181,000,814 141,602,355
Advances - net 8 57,144,912 31,643,885
Other assets 3,933,766 3,638,719
Operating fixed assets 9 2,264,060 2,070,554
Deferred tax asset - net - -
261,873,963 206,400,274
LIABILITIES
Bills payable 758,388 775,938
Borrowings from financial institutions 10 89,767,719 28,700,825
Deposits and other accounts 11 152,246,810 157,020,365
Sub-ordinated loans - -
Liabilities against assets subject to finance lease - -
Other liabilities 3,737,138 3,608,857
Deferred tax liability - net 12 35,507 151,745
246,545,562 190,257,730
NET ASSETS 15,328,401 16,142,544
REPRESENTED BY
Share capital 10,002,524 10,002,524
Reserves 2,379,993 2,192,169
Un-appropriated profit 1,741,290 2,490,553
14,123,807 14,685,246
Surplus on revaluation of assets - net of tax 13 1,204,594 1,457,298
15,328,401 16,142,544
CONTINGENCIES AND COMMITMENTS 14 -
-
The annexed notes 1 to 20 form an integral part of this condensed interim financial information.
Rupees in '000'
Managing Director Director Director Director

6
CONDENSED INTERIM PROFIT AND LOSS ACCOUNT (UN-AUDITED)FOR THE SIX MONTHS ENDED JUNE 30, 2017
Three months Six months Three months Six months
ended ended ended ended
June 30, June 30, June 30, June 30,Note 2017 2017 2016 2016
Mark-up / return / interest earned 3,664,383 6,731,479 2,792,844 5,587,822
Mark-up / return / interest expensed 2,467,770 4,504,826 1,637,222 3,348,163
Net mark-up / return/ interest income 1,196,613 2,226,653 1,155,622 2,239,659
Provision against loans and advances - net 198,131 218,126 338,199 421,891
(Reversal) / provision for diminution in value
of investments - net (8,213) (8,378) 24,078 (57,169)
Bad debts written off directly - - 111 111
189,918 209,748 362,388 364,833
Net mark-up / return / interest income after provisions 1,006,695 2,016,905 793,234 1,874,826
NON MARK-UP / INTEREST INCOME
Fee, commission and brokerage income 101,168 157,301 65,471 124,568
Dividend income 17,304 36,557 10,426 86,055
Income from dealing in foreign currencies 16,385 35,948 21,346 44,626
Gain on sale of securities - net 915,761 1,156,509 717,558 1,093,657
Unrealised gain on revaluation of investments
classified as held-for-trading - net 371 527 255 -
Other income 22,650 53,019 16,451 40,774
Total non mark-up / interest income 1,073,639 1,439,861 831,507 1,389,680
2,080,334 3,456,766 1,624,741 3,264,506
NON MARK-UP / INTEREST EXPENSES
Administrative expenses 979,111 1,804,429 805,233 1,520,812
Provisions/ (reversals) against other assets - - 14,065 (2,299)
Other charges (87) (87) 20 28
Total non mark-up / interest expenses 979,024 1,804,342 819,318 1,518,541
PROFIT BEFORE TAXATION 1,101,310 1,652,424 805,423 1,745,965
Taxation
- Current 369,263 558,514 327,991 634,904
- Prior 134,958 134,958 90,643 90,643
- Deferred 16,200 19,834 (29,529) 595
520,421 713,306 (389,105) (724,952)
PROFIT AFTER TAXATION 580,889 939,118 416,318 1,021,013
Earnings per share - Basic and Diluted (in Rupees) 15 0.58 0.94 0.42 1.02
The annexed notes 1 to 20 form an integral part of this condensed interim financial information.
--------------------------- Rupees in '000' ----------------------------
Managing Director Director Director Director
7
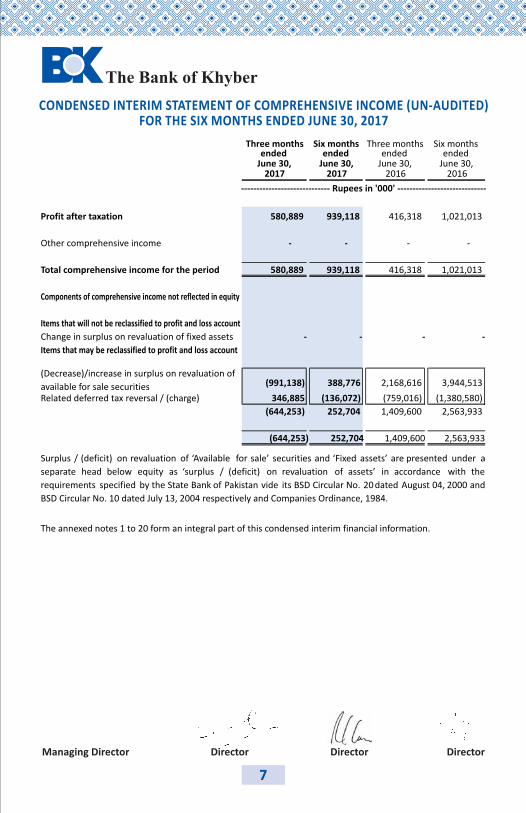
CONDENSED INTERIM STATEMENT OF COMPREHENSIVE INCOME (UN-AUDITED)FOR THE SIX MONTHS ENDED JUNE 30, 2017
Three months Six months Three months Six monthsended ended ended ended
June 30, June 30, June 30, June 30,2017 2017 2016 2016
Profit after taxation 580,889 939,118 416,318 1,021,013
Other comprehensive income - - - -
Total comprehensive income for the period 580,889 939,118 416,318 1,021,013
Components of comprehensive income not reflected in equity
Items that will not be reclassified to profit and loss account
Change in surplus on revaluation of fixed assets - - - -
Items that may be reclassified to profit and loss account
(991,138) 388,776 2,168,616 3,944,513
Related deferred tax reversal / (charge) 346,885 (136,072) (759,016) (1,380,580)
(644,253) 252,704 1,409,600 2,563,933
(644,253) 252,704 1,409,600 2,563,933
The annexed notes 1 to 20 form an integral part of this condensed interim financial information.
----------------------------- Rupees in '000' -----------------------------
Surplus / (deficit) on revaluation of ‘Available for sale’ securities and ‘Fixed assets’ are presented under a
separate head below equity as ‘surplus / (deficit) on revaluation of assets’ in accordance with the
requirements specified by the State Bank of Pakistan vide its BSD Circular No. 20 dated August 04, 2000 and
BSD Circular No. 10 dated July 13, 2004 respectively and Companies Ordinance, 1984.
(Decrease)/increase in surplus on revaluation of
available for sale securities
Managing Director Director Director Director

8
CONDENSED INTERIM STATEMENT OF CHANGES IN EQUITY (UN-AUDITED)FOR THE SIX MONTHS ENDED JUNE 30, 2017
Balance as at January 1, 2016 - Audited 10,002,524 1,788,074 2,182,400 13,972,998
Changes in equity during the six months ended June 30, 2016
- - (1,250,464) (1,250,464)
Total comprehensive income
Profit after taxation for the six months
ended June 30, 2016 - - 1,021,013 1,021,013
Other comprehensive income - net of tax - - - -
- - 1,021,013 1,021,013
Transfer to statutory reserve - 204,203 (204,203) -
Balance as at June 30, 2016 - Unaudited 10,002,524 1,992,277 1,748,746 13,743,547
Changes in equity during the six months ended December 31, 2016
Total comprehensive income
Profit after taxation for the six months
ended December 31, 2016 - - 999,463 999,463
Other comprehensive income - - (57,764) (57,764)
- - 941,699 941,699
Transfer to statutory reserve - 199,892 (199,892) -
Balance as at December 31, 2016 - Audited 10,002,524 2,192,169 2,490,553 14,685,246
Changes in equity during the six months ended June 30, 2017
- - (1,500,557) (1,500,557)
Total comprehensive income
Profit after taxation for the six months
ended June 30, 2017 - - 939,118 939,118
Other comprehensive income - net of tax - - - -
- - 939,118 939,118
Transfer to statutory reserve - 187,824 (187,824) -
Balance as at June 30, 2017 - Unaudited 10,002,524 2,379,993 1,741,290 14,123,807
The annexed notes 1 to 20 form an integral part of this condensed interim financial information.
Final cash dividend for the year ended December
31, 2016 declared at Rs 1.50 per share
Transactions with owners recorded
directly in equity
------------------------ Rupees in '000' -----------------------
Sharecapital
Statutoryreserve
Un-appropriated
profitTotal
Transactions with owners recorded
directly in equity
Final cash dividend for the year ended December
31, 2015 declared at Rs 1.25 per share
Managing Director Director Director Director

9
CONDENSED INTERIM CASH FLOW STATEMENT (UN-AUDITED)FOR THE SIX MONTHS ENDED JUNE 30, 2017
Six months Six monthsended ended
June 30, June 30,2017 2016
CASH FLOWS FROM OPERATING ACTIVITIES
Profit before taxation 1,652,424 1,745,965
Less: Dividend income 36,557 86,055
1,615,867 1,659,910
Adjustments:
Depreciation 122,757 97,160
Amortisation 16,091 9,537
Provision against loans and advances - net 218,126 421,891
Reversal of provision for diminution in value of investments-net (8,378) (57,169)
Reversal of provision against non-banking assets - (2,299)
Unrealised gain on revaluation of investments classified as held-for-trading (527) -
Gain on sale of operating fixed assets (1,807) (394)
Bad debts written off directly - 111
346,262 468,837
1,962,129 2,128,747
(Increase) / decrease in operating assets
Lendings to financial institutions 5,802,273 (19,370,277)
Held-for-trading securities (1,859,557) 1,028,528
Advances (25,719,153) 10,580,582
Others assets (excluding advance taxation) (295,047) (572,925)(22,071,484) (8,334,092)
Increase / (decrease) in operating liabilities
Bills payable (17,550) 232,518
Borrowings from financial institutions 61,066,894 (11,181,896)
Deposits and other accounts (4,773,555) 28,727,783
Other liabilities (excluding current taxation) 185,222 (115,511)
56,461,011 17,662,894
36,351,656 11,457,549
Income taxes paid (763,279) (773,852)
Net cash generated from operating activities 35,588,377 10,683,697
CASH FLOWS FROM INVESTING ACTIVITIES
Net investment in available-for-sale securities (35,162,502) (9,161,418)
Net investment in held-to-maturity securities (2,756,271) 16,690
Dividend income received 36,557 86,055
Investment in operating fixed assets (333,173) (106,599)
Sale proceeds from disposal of property and equipment 2,626 2,672
Net cash used in investing activities (38,212,763) (9,162,600)
CASH FLOWS FROM FINANCING ACTIVITIES
Dividends paid (1,487,691) (1,239,659)
Net cash used in financing activities (1,487,691) (1,239,659)
(Decrease) / increase in cash and cash equivalents during the period (4,112,077) 281,438
Cash and cash equivalents at beginning of the period 18,617,454 12,060,293
Cash and cash equivalents at end of the period 14,505,377 12,341,731
The annexed notes 1 to 20 form an integral part of this condensed interim financial information.
Rupees in '000'
Managing Director Director Director Director

10
1 STATUS AND NATURE OF BUSINESS
3 BASIS OF MEASUREMENT
4 STATEMENT OF COMPLIANCE
2.3 This condensed interim financial information has been presented in Pakistani Rupee, which
is the Bank's functional and reporting currency. The figures have been rounded off to the
nearest thousand rupees, unless otherwise stated.
This condensed interim financial information has been prepared under the historical cost
convention except that certain fixed assets are stated at revalued amounts and certain
investments, commitments in respect of employee benefits, forward exchange contracts
and derivative financial instruments have been marked to market and are carried at fair
value.
4.1 This condensed interim financial information has been prepared in accordance with the
requirements of International Accounting Standards (IAS - 34), Interim Financial Reporting,
Islamic Financial Accounting Standards (IFAS) issued by the Institute of Chartered
Accountants of Pakistan (ICAP), Companies Ordinance, 1984, Banking Companies
Ordinance, 1962 and the directives issued by the Securities and Exchange Commission of
Pakistan (SECP) and the State Bank of Pakistan (SBP). In case the requirements differ, the
1.1 The Bank of Khyber ("The Bank") was established under The Bank of Khyber Act, 1991 and is
principally engaged in the business of commercial banking and related services. The Bank
acquired the status of a scheduled bank in 1994 and is listed on the Karachi Stock Exchange
(KSE). The registered office of the Bank is situated at 24 the Mall, Peshawar Cantt, Peshawar
and it has been temporarily shifted to 1st Floor, State Life Building, 34 - the Mall, Peshawar
Cantt. The Bank operates 155 branches including 79 Islamic Banking Branches as at June 30,
2017 (December 31, 2016: 150 branches including 77 Islamic banking branches). The long
term credit rating of the Bank assigned by The Pakistan Credit Rating Agency (PACRA) and
JCR-VIS are 'A' and 'A' respectively and the short-term credit ratings assigned are 'A1' (A-
One) and 'A-1' (A-One) respectively.
2.1 In accordance with the directives of the Federal Government regarding the shifting of the
banking system to Islamic modes, the SBP has issued various circulars from time to time.
Permissible forms of trade-related modes of financing include purchase of goods by the
banks from their customers and immediate resale to them at appropriate mark-up in price
on deferred payment basis. The purchases and sales arising under the respective
arrangements (except for murabaha financings accounted for under Islamic Financial
Accounting Standard - 1 "Murabaha") are not reflected in this condensed interim financial
information as such but are restricted to the amount of facility actually utilized and the
appropriate portion of mark-up thereon.
2.2 The financial results of the Islamic Banking Group have been consolidated in this financial
information for reporting purpose, after eliminating the effects of intra-bank transactions
and balances. Key financial figures of the Islamic Banking Group are disclosed in note 17 to
this condensed interim financial information.
2 BASIS OF PRESENTATION
NOTES TO THE CONDENSED INTERIM FINANCIAL INFORMATION (UN-AUDITED)FOR THE SIX MONTHS ENDED JUNE 30, 2017

11
requirements of the Companies Ordinance, 1984, the Banking Companies Ordinance, 1962
and the said directives have been followed.
4.2 The SBP vide BSD Circular No. 10, dated August 26, 2002 has deferred the applicability of
International Accounting Standard (IAS) 39, "Financial Instruments: Recognition and
Measurement" and International Accounting Standards (IAS) 40, "Investment Property" for
banking companies till further instructions. Further, according to a notification of SECP dated
April 28, 2008, IFRS 7 "Financial Instruments: Disclosure" has not been made applicable for
banks. Accordingly, the requirements of these standards have not been considered in the
preparation of this condensed interim financial information. However, investments have
been classified and valued in accordance with the requirements of various circulars issued by
the SBP.
4.3 The disclosures made in this condensed interim financial information have been limited
based on the format prescribed by the SBP vide BSD Circular Letter No. 2, dated May 12,
2004 and IAS 34 "Interim Financial Reporting" and do not include all the information
required for the annual financial statements. Accordingly, this condensed interim financial
information should be read in conjunction with the annual financial statements of the Bank
for the year ended December 31, 2016. This condensed interim financial information is
being submitted to the shareholders in accordance with section 245 of the Companies
Ordinance, 1984 and is un-audited but subject to limited scope review by the statutory
auditors.
5.1 The accounting policies, underlying estimates and judgments and methods of computation
followed in the preparation of this condensed interim financial information are same as
those applied in preparing the most recent annual financial statements of the Bank for the
year ended December 31, 2016.
5.2 The financial risk management objectives and policies adopted by the Bank are consistent
with those disclosed in the financial statements of the Bank for the year ended December 31,
2016.
5 SUMMARY OF SIGNIFICANT ACCOUNTING POLICIES, ESTIMATES AND JUDGEMENTS AND
FINANCIAL RISK MANAGEMENT POLICIES
(Un-audited) (Audited)June 30, December 31,
2017 2016
6 LENDINGS TO FINANCIAL INSTITUTIONS
Call money lendings 600,000 5,475,000
Bai Muajjal receivable from other financial institution 1,529,106 -
Repurchase agreement lendings (Reverse Repo) 895,928 192,307
Placements with other financial institutions 238,944 3,398,944
3,263,978 9,066,251
Provision against lendings to financial institutions (238,944) (238,944)
3,025,034 8,827,307
Rupees in '000'
NOTES TO THE CONDENSED INTERIM FINANCIAL INFORMATION (UN-AUDITED)FOR THE SIX MONTHS ENDED JUNE 30, 2017

12
7 INVESTMENTS
NoteHeld by bank
Given as
collateralTotal Held by bank
Given as
collateralTotal
7.1 Investments by types
Held-for-trading securities
Market Treasury Bills 243,097 - 243,097 - - -
Pakistan Investment Bonds 1,961,714 - 1,961,714 360,081 - 360,081
Ordinary shares of listed companies 15,543 - 15,543 - - -
2,220,354 - 2,220,354 360,081 - 360,081
Available-for-sale securities
Market Treasury Bills 49,641,737 39,916,177 89,557,914 43,620,749 14,420,352 58,041,101
Pakistan Investment Bonds 23,826,448 45,878,026 69,704,474 55,822,793 9,695,393 65,518,186
Government of Pakistan Sukuk 6,250,444 - 6,250,444 7,250,546 - 7,250,546
Ordinary shares of listed companies 1,004,902 - 1,004,902 888,612 - 888,612
Ordinary shares of unlisted companies 30,487 - 30,487 30,487 - 30,487
112,500 - 112,500 112,500 - 112,500
Preference shares of unlisted company 195,000 - 195,000 195,000 - 195,000
Listed term finance certificates 338,345 - 338,345 138,550 - 138,550
Unlisted term finance certificates 86,881 - 86,881 168,762 - 168,762
Sukuks 3,454,083 - 3,454,083 3,228,784 - 3,228,784
84,940,827 85,794,203 170,735,030 111,456,783 24,115,745 135,572,528
Held-to-maturity securities
Pakistan Investment Bonds 8,162,414 - 8,162,414 5,372,809 - 5,372,809
Sukuks 33,333 - 33,333 66,667 - 66,667
8,195,747 - 8,195,747 5,439,476 - 5,439,476
Investment in associate 40,504 - 40,504 40,504 - 40,504
Investments at cost 95,397,432 85,794,203 181,191,635 117,296,844 24,115,745 141,412,589
Provision for diminution in
value of investments 7.2 (853,519) - (853,519) (861,897) - (861,897)
Investments - net of provisions 94,543,913 85,794,203 180,338,116 116,434,947 24,115,745 140,550,692
Surplus on revaluation of
held-for-trading securities - net 527 - 527 716 - 716
Surplus on revaluation of
available-for-sale securities - net 13 662,171 - 662,171 1,050,947 - 1,050,947
Total investments 95,206,611 85,794,203 181,000,814 117,486,610 24,115,745 141,602,355
----------------------------------------------- Rupees in '000' -----------------------------------------
June 30, 2017 (Un-audited) December 31, 2016 (Audited)
Ordinary shares of related party -
Unlisted
NOTES TO THE CONDENSED INTERIM FINANCIAL INFORMATION (UN-AUDITED)FOR THE SIX MONTHS ENDED JUNE 30, 2017

13
(Un-audited) (Audited)June 30, December 31,
2017 2016
Note
7.2 Provision for diminution in value of investments
Opening balance 861,897 958,614
Charge for the period / year - 46,820
Reversal on disposal (8,378) (143,537)
(8,378) (96,717)
Closing balance 853,519 861,897
8 ADVANCES
Loans, cash credits, running finances, etc.
In Pakistan 33,928,409 29,845,102
Outside Pakistan - -
33,928,409 29,845,102
Islamic financing and related assets 26,555,842 5,275,801
Net investment in Ijarah:
In Pakistan 727,963 581,858
Outside Pakistan - -
727,963 581,858
Bills discounted and purchased (excluding treasury bills)
Payable in Pakistan 386,806 204,902
Payable outside Pakistan 174,612 146,816
561,418 351,718
Advances - gross 8.1 61,773,632 36,054,479
Provision against loan and advances 8.2
Specific (4,591,246) (4,379,722)
General (37,474) (30,872)
(4,628,720) (4,410,594)
Advances - net of provision 57,144,912 31,643,885
8.1
Category of classification Domestic Overseas Total
Other Assets Especially Mentioned * 127,517 - 127,517 86 86
Substandard 57,287 - 57,287 6,115 6,115
Doubtful 117,160 - 117,160 3,809 3,809
Loss 5,117,526 - 5,117,526 4,581,236 4,581,236
5,419,490 - 5,419,490 4,591,246 4,591,246
Rupees in '000'
Classified advances
June 30, 2017 (Un-audited)
Advances include Rs. 5,419.490million (December 31, 2016:Rs. 5,456.524million) which have been placed
under non-performing status as detailed below:
Provision
required
Provision
held
------------------------------- Rupees in '000' ------------------------------------------
NOTES TO THE CONDENSED INTERIM FINANCIAL INFORMATION (UN-AUDITED)FOR THE SIX MONTHS ENDED JUNE 30, 2017

14
Category of classification Domestic Overseas Total
Other Assets Especially Mentioned * 87,643 - 87,643 - -
Substandard 288,582 - 288,582 55,851 55,851
Doubtful 627,585 - 627,585 302,838 302,838
Loss 4,452,714 - 4,452,714 4,021,033 4,021,033
5,456,524 - 5,456,524 4,379,722 4,379,722
* Other Assets Especially Mentioned category pertains to agricultural finance and small enterprise finance.
8.1.1
8.2 Particulars of provision against loans and advances
Specific General Total Specific General Total
Opening balance 4,379,722 30,872 4,410,594 3,655,490 28,046 3,683,536
Charge for the period / year 372,664 6,602 379,266 1,060,047 2,826 1,062,873
Reversals (161,140) - (161,140) (335,815) - (335,815)
211,524 6,602 218,126 724,232 2,826 727,058
Amounts written off - - - - - -
Closing balance 4,591,246 37,474 4,628,720 4,379,722 30,872 4,410,594
(Un-audited) (Audited)
June 30, December 31,2017 2016
9 OPERATING FIXED ASSETS
Capital work-in-progress 368,771 430,319
Property and equipment 1,831,488 1,597,222
Intangible assets 63,801 43,013
2,264,060 2,070,554
9.1 Following additions / disposals have been made to / from property and equipment;
Additions Disposals Additions Disposals
Building on leasehold - - 11,620
Building 153,001 - -
Furniture and fixtures 29,157 4,425 11,033 3,435
Office equipment 94,023 6,821 53,562 8,556
Vehicles 1,850 3,210 766 1,370
Renovations / Premises 79,826 13,223 34,507 11,072
357,857 27,679 99,868 36,053
9.2 Additions to intangible assets 36,879 - 17,474 -
------------------------------- Rupees in '000' -----------------------------------------
State Bank of Pakistan through various circulars has allowed benefit of the forced sales value (FSV) of Plant
& Machinery under charge, pledged stock and mortgaged residential, commercial and industrial properties
(land and building only) held as collateral against Non-Performing Loans (NPLs) for a maximum of five years
from the date of classification. As at June 30, 2017, the Bank has availed cumulative benefit of forced sale
values of Rs. 596.831million (December 31, 2016:Rs. 453.778million). Increase in unappropriated profit net
of tax amounting to Rs. 387.940million (December 31, 2016:Rs.294.956)is not available for the distribution
of cash or stock dividend to the shareholders or bonus to employees.
Provision
required
Provision
held
Rupees in '000'
June 30, 2017
(Un-audited)
-------------------------------------- Rupees in '000' ---------------------------------------------------
December 31, 2016 (Audited)
Classified Advances
June 30, 2017 (Un-audited) December 31, 2016 (Audited)
June 30, 2016
(Un-audited)
--------------------------- Rs. in '000' ----------------------------------
NOTES TO THE CONDENSED INTERIM FINANCIAL INFORMATION (UN-AUDITED)FOR THE SIX MONTHS ENDED JUNE 30, 2017

15
(Un-audited) (Audited)
June 30, December 31,Note 2017 2016
10 BORROWINGS FROM FINANCIAL INSTITUTIONS
Secured
Borrowings from State Bank of Pakistan under:
Export refinance scheme 1,824,900 1,698,000
Long term financing for export oriented projects 152,524 13,805
Refinance facility for SME 719 1,006
1,978,143 1,712,811
Repurchase agreement borrowings 10.1 66,112,753 14,420,352
Borrowing from financial institution 10.2 19,681,450 9,695,393
85,794,203 24,115,745
Unsecured
Call borrowings 1,995,373 2,872,269
89,767,719 28,700,825
10.1
10.2
(Un-audited) (Audited)
June 30, December 31,
2017 2016
11 DEPOSITS AND OTHER ACCOUNTS
Customers
Fixed deposits 52,676,968 61,494,660
Savings deposits 57,992,967 60,140,991
Current accounts - non-remunerative 35,216,444 28,280,085
Call deposits 3,920,723 5,316,386
Margin and sundry deposits 2,422,603 1,754,950152,229,705 156,987,072
Financial Institutions
Remunerative deposits 15,928 32,224
Non-remunerative deposits 1,177 1,06917,105 33,293
152,246,810 157,020,365
12 DEFERRED TAX LIABILITY
Deferred tax asset arising in respect of:
Provision for balances with other banks 3,510 3,510
Provision against loans and advances 25,619 43,027
Provision for diminution in value of investments 87,203 87,203
Provision for other assets 3,448 3,448
Re-measurement of defined benefit plan 31,103 31,103
Accelerated tax depreciation 3,018 4,859
Islamic Pool Management reserve 42,352 42,937
196,253 216,087
Deferred tax liability arising in respect of:
Surplus on revaluation of investment (231,760) (367,832)
(231,760) (367,832)
Deferred tax liability - net (35,507) (151,745)
Secured borrowing from financial institution carry interest rate ranging from 5.79 % to 5.83% (2016:5.80%
to 5.81 %) per annum with maturities up to April 09, 2018.
Rupees in '000'
Rupees in '000'
Repurchase agreements with financial institutions carry interest rate of 5.96 % (2016: 5.96%) per annum
with maturities up to July 07, 2017.
NOTES TO THE CONDENSED INTERIM FINANCIAL INFORMATION (UN-AUDITED)FOR THE SIX MONTHS ENDED JUNE 30, 2017

16
(Un-audited) (Audited)
June 30, December 31,
2017 2016
13 SURPLUS ON REVALUATION OF ASSETS - NET OF TAX
Surplus / (deficit) on revaluation of available-for-sale securities
Federal government securities:
- Market Treasury Bills (25,543) (19,676)
- Pakistan Investment Bonds 410,537 495,268
- Government of Pakistan Sukuks 113,481 124,554
Fully paid up ordinary shares - listed 163,696 450,801
662,171 1,050,947Surplus on revaluation of fixed assets
Leasehold land 774,183 774,183
1,436,354 1,825,130
Deferred tax liability - net (231,760) (367,832)
1,204,594 1,457,298
14 CONTINGENCIES AND COMMITMENTS
14.1 Direct credit substitutes
Contingent liabilities in respect of guarantees given favouring:
Banks - -
Others 556,378 539,084
556,378 539,084
14.2 Transaction-related contingent liabilities
Government 9,201,189 6,935,508
Others 3,853,901 4,211,008
13,055,090 11,146,516
(Un-audited) (Audited)
June 30, December 31,
2017 2016
14.3 Trade-related contingent liabilities
Letters of credit
Sight 2,289,536 1,790,467Usance 572,027 360,776
2,861,563 2,151,243
Acceptances 381,057 848,219
3,242,620 2,999,462
14.4 Commitments in respect of forward exchange contracts
Purchase 1,024,356 3,368,458
Sale 1,304,551 3,655,998
Rupees in '000'
This includes expired letters of guarantee aggregating to Rs. 3,687.174 million as at June 30, 2017
(December 31, 2016: Rs. 3,496.433 million) for which the formalities relating to return of the original documents
are in process.
Rupees in '000'
Contingent liabilities in respect of performance bonds, bid
bonds, warranties etc. given favouring:
NOTES TO THE CONDENSED INTERIM FINANCIAL INFORMATION (UN-AUDITED)FOR THE SIX MONTHS ENDED JUNE 30, 2017

17
14.6 Commitments to extend credit
The Bank makes commitments to extend credit in the normal course of its business but these
being revocable commitments do not attract any significant penalty if the facility is
unilaterally withdrawn.
Commitments as on reporting date amounts to Rs. 164.577 million (December 31, 2016 : Rs.
256.979 million).
The income tax assessments of the Bank have been finalized upto tax year 2016.
During financial year 2011, the tax authorities issued an amended order for the tax year 2009
disallowing certain expenditure on account of lack of evidence for such expenditure
resulting in an additional tax demand of Rs. 308.900 million. The Bank filed an appeal as well
as rectification application against the said order. Based on rectification application, the
order was amended and accordingly the additional demand was reduced to Rs. 256.349
million. During 2012, the Commissioner Inland Revenue (Appeals) [CIR (A)] through an order
dated June 01, 2012 has deleted certain additions on account of disallowances except for the
additions under certain heads of expenses having tax impact of approximately Rs. 23 million.
The Bank had filed an appeal against the order of the Appellate Tribunal Inland Revenue
(ATIR) in respect of remaining additions which also decided in favor of the Bank.
Subsequently, CIR went in to appeal in Peshawar High Court.The management is confident
that matter will be decided in Bank's favor.
The liquidator of the Indus Bank Limited (IBL), which is under liquidation since January 29,
2001, has lodged a claim of Rs. 11.518 million against the Bank in relation to a reverse repo
transaction of Rs. 100 million with a maturity of February 08, 2001 secured against Federal
Investment Bonds. The management of the Bank is confident that the above will have no
financial impact as IBL is a defaulter of the Bank to the tune of Rs. 10.028 million which is
already provided in these financial statements.
14.7 Commitment for the acquisition of operating fixed assets
14.8
14.9
14.10
(Un-audited) (Audited)
June 30, December 31,
2017 2016
14.5 Other commitments
Bills for collection
Inland bills 79,375 117,019
Foreign bills 402,432 659,128
481,807 776,147
Rupees in '000'
All forward exchange contracts are backed by trade related transactions to meet the needs of the Bank's
clients to generate trading revenues and, as part of its asset and liability management activity, to hedge its
own exposure to currency risk. At the period end, all foreign exchange contracts have a remaining maturity
of less than one year.
NOTES TO THE CONDENSED INTERIM FINANCIAL INFORMATION (UN-AUDITED)FOR THE SIX MONTHS ENDED JUNE 30, 2017

18
Three months Six months Three months Six months
ended ended ended ended
June 30, June 30, June 30, June 30,
2017 2017 2016 2016
15 EARNINGS PER SHARE - BASIC AND DILUTED
Profit after taxation for the period attributable
to ordinary shareholders 580,889 939,118 416,318 1,021,013
Weighted average number of ordinary shares
outstanding during the period 1,000,252,485 1,000,252,485 1,000,252,485 1,000,252,485
Earnings per share - basic and diluted
for the period (in Rupees) 0.58 0.94 0.42 1.02
There is no dilution effect on basic earnings per share.
--------------------------------- Rupees in '000' ------------------------------------------
----------------------------------Number of Shares--------------------------------------
16 FAIR VALUE OF FINANCIAL INSTRUMENTS
16.1
The fair value of quoted investments other than those classified as held to maturity is based
on quoted market prices. The fair value of unquoted equity investments is determined on
the basis of break-up value of these investments as per their latest available audited
financial statements.
The fair value of fixed term loans, other assets, other liabilities and fixed term deposits
cannot be calculated with sufficient reliability due to the absence of current and active
market for these assets and liabilities and reliable data regarding market rates for similar
instruments. The provision for impairment of loans and advances has been calculated in
accordance with the Bank's accounting policy.
In the opinion of the management, the fair value of the remaining financial assets and
liabilities are not significantly different from their carrying values since assets and liabilities
are either short-term in nature or in the case of customer loans and deposits, are frequently
re-priced.
The Bank measures fair values using the following fair value hierarchy that reflects the
significance of the inputs used in making the measurements:
Level 1: Fair value measurements using quoted prices (unadjusted) in active markets for
identical assets or liabilities.
Level 2: Fair value measurements using inputs other than quoted prices included within
Level 1 that are observable for the assets or liability, either directly (i.e. as prices) or
indirectly (i.e. derived from prices).
Level 3: Fair value measurements using input for the asset or liability that are not based on
observable market data (i.e. unobservable inputs).
The table below analyses the financial and non-financial assets carried at fair values, by
valuation methods. For financial assets, the Bank essentially carries its investments in debt
and equity securities at fair values. Valuation of investments is carried out as per guidelines
specified by the SBP. In case of non-financial assets, the Bank has adopted revaluation model
(as per IAS 16) in respect of leasehold land.
NOTES TO THE CONDENSED INTERIM FINANCIAL INFORMATION (UN-AUDITED)FOR THE SIX MONTHS ENDED JUNE 30, 2017

19
Level 1 Level 2 Level 3 Total
On balance sheet financial instruments
Financial assets measured at fair value
Held for trading securities
- Shares in listed companies 14,477 - - 14,477
- Market Treasury Bills - 243,048 - 243,048
- Pakistan Investment Bonds - 1,963,356 - 1,963,356
14,477 2,206,404 - 2,220,881
Available-for-sale securities
- Market Treasury Bills - 89,532,371 - 89,532,371
- Pakistan Investment Bonds - 70,115,011 - 70,115,011
- Shares in listed companies 1,168,598 - - 1,168,598
- GOP Ijarah Sukuk 6,363,925 - 6,363,925
- Term Finance Certificates (TFCs) - 338,345 - 338,345
1,168,598 166,349,652 - 167,518,250
Non - Financial Assets measured at fair value
Operating fixed assets (Leasehold land) - 891,441 - 891,441
Off balance sheet financial instruments
- 1,024,356 - 1,024,356
Foreign exchange contracts sale - 1,304,551 - 1,304,551
June 30, 2017 (Un-audited)
Fair Value
--------------------- Rupees in '000' ---------------------
Foreign exchange contracts purchase
Level 1 Level 2 Level 3 Total
On balance sheet financial instruments
Financial assets measured at fair value
Held for trading securities
- Shares in listed companies - - - -
- Pakistan Investment Bonds - 360,081 - 360,081
- 360,081 - 360,081
Available-for-sale securities
- Market Treasury Bills - 58,021,425 - 58,021,425
- Pakistan Investment Bonds - 66,013,454 - 66,013,454
- Shares in listed companies 1,339,413 - - 1,339,413
- GOP Ijarah Sukuk - 7,375,100 - 7,375,100
- Term Finance Certificates (TFCs) - 307,312 - 307,312
1,339,413 131,717,291 - 133,056,704
Non - Financial Assets measured at fair value
Operating fixed assets (Leasehold land) - 891,441 - 891,441
Off balance sheet financial instruments
- 3,368,458 - 3,368,458
Foreign exchange contracts - 3,655,998 - 3,655,998
Foreign exchange contracts purchase
----------------- Rupees in '000' -----------------
December 31, 2016 (Audited)
Fair Value
The valuation techniques used for above assets are same as disclosed in annual audited
financial statements for the year ended December 31, 2016.
NOTES TO THE CONDENSED INTERIM FINANCIAL INFORMATION (UN-AUDITED)FOR THE SIX MONTHS ENDED JUNE 30, 2017

The Bank's policy is to recognize transfers into and out of the different fair value hierarchy
levels at the date the event or change in circumstances that caused the transfer occurred.
There were no transfers between levels 1 and 2 during the year.
Financial instruments included in level 1 comprise of investments in listed ordinary shares
and units of mutual funds.
Financial instruments included in level 2 comprise of Sukuks Bonds, Pakistan Investment
Bonds, Market Treasury Bills, Term Finance certificates, FX options and Forward Exchange
Contracts.
Currently, no financial instruments are classified in level 3.
Fully paid-up ordinary shares Fair values of investments in listed equity securities are
valued on the basis of closing quoted market prices
available at the Pakistan Stock Exchange.
Units of mutual funds Fair values of investments in units of mutual funds are
determined based on redemption prices as at the close
of the business day.
Pakistan Investment Bonds Fair values of Pakistan Investment Bonds and Treasury
/ Market Treasury Bills Bills are derived using the PKRV rates (Reuters page).
Government of Pakistan (GoP) - Fair values of GoP Ijarah Sukuks are derived using the
Ijarah Sukuks PKISRV rates announced by the Financial Market
Association (FMA) through Reuters. These rates
denote an average of quotes received from eight
different pre-defined / approved dealers / brokers.
Term Finance, Bonds and Investments in debt securities (comprising term
Sukuk certificates finance certificates, bonds, Sukuk certificates and any
other security issued by a company or a body corporate
for the purpose of raising funds in the form of
redeemable capital) are valued on the basis of the rates
announced by the Mutual Funds Association of
Pakistan (MUFAP) in accordance with the methodology
prescribed by the Securities and Exchange Commission
of Pakistan. In the determination of the rates, the
MUFAP takes into account the holding pattern of these
securities and categorises these as traded, thinly
traded and non-traded securities.
Operating fixed assets Leasehold land are revalued on regular basis using
(Leasehold land) professional valuers on the panel of Pakistan Banker's
Association. The valuation is based on their assessment
of market value of the properties.
(a) Financial instruments in level 1
(b) Financial instruments in level 2
(c) Financial instruments in level 3
Valuation techniques and inputs used in determination of fair values within level 1
Valuation techniques and inputs used in determination of fair values within level 2
20
NOTES TO THE CONDENSED INTERIM FINANCIAL INFORMATION (UN-AUDITED)FOR THE SIX MONTHS ENDED JUNE 30, 2017

17
(Un-audited) (Audited)
June 30, December 31,
Note 2017 2016
KEY FINANCIAL FIGURES OF ISLAMIC BANKING GROUP
ASSETS
Cash and balances with treasury banks 3,297,592 2,480,843
Balances with other banks 1,845,154 7,964,712
Due from financial institutions 1,529,106 8,635,000
Investments 9,725,334 10,541,155
Islamic financing and related assets A-1 27,045,244 5,626,934
Operating fixed assets 324,170 280,468
Other assets 904,265 107,98544,670,865 35,637,097
LIABILITIES
Bills payable 276,358 312,720
Due to Financial Institutions 450,000 -
Deposits and other accounts
- Current accounts 19,601,478 13,647,809
- Saving accounts 15,327,715 12,665,688
- Term deposits 2,321,150 2,982,985
- Others 1,761,416 1,534,628
Deposits from financial institutions - remunerative 30 30
Deposits from financial institutions - non-remunerative - -
Other liabilities 633,120 416,387
40,371,267 31,560,247
NET ASSETS 4,299,598 4,076,850
REPRESENTED BY
Islamic banking fund 460,000 460,000
Profit equalization reserves 38,678 38,125
Unappropriated profit 3,699,115 3,461,284
4,197,793 3,959,409
Surplus on revaluation of assets 101,805 117,441
4,299,598 4,076,850
Remuneration to Shariah Advisor during the period / year 2,035 3,713
CHARITY FUND
Opening balance - -
Additions during the period / year
Default obligations amount (on delay payments) 1,931 4,755
Income from transactions declared in Non-Shariah Compliance 5 280
Purification of dividend/Income from shares 444 120
Others 20 94
2,400 5,249
Distribution of charity
Welfare (100) (1,749)
Health - (3,500)
Payments during the period / year (100) (5,249)
Closing balance 2,300 -
Rupees in '000'
NOTES TO THE CONDENSED INTERIM FINANCIAL INFORMATION (UN-AUDITED)FOR THE SIX MONTHS ENDED JUNE 30, 2017
21

(Un-audited) (Un-audited)
June 30, June 30,Note 2017 2016
Income / return / profit earned 1,099,071 892,857
Income / return / profit expensed (315,730) (258,016)
783,341 634,841
7,836 25,224
(Reversal) / provision for diminution in value of investments (7,951) 7,951
(115) 33,175
Net income / return / profit after provisions 783,456 601,666
OTHER INCOME
Fee, commission and brokerage income 36,887 40,709
Dividend income 893 1,585
Income from dealing in foreign currencies 18,221 25,752
Unrealised gain / (loss) on revaluation of held-for-trading securities - -
Gain on sale of securities - 218
Other income 19,560 12,823
Total other income 75,561 81,087
859,017 682,753
OTHER EXPENSES
Administrative expenses 621,173 536,260
Other provision / write-off - -
Other charges 13 12
Total other charges 621,186 536,272
Net profit for the period 237,831 146,481
(Un-audited) (Audited)
June 30, December 31,
2017 2016
A-1 Islamic Financing and Related Assets
Murabaha financings A-1.1 2,379,580 1,643,500
Ijarah financings A-1.2 727,963 581,858
Diminishing musharaka A-1.3 1,962,391 2,426,660
Istisna work-in-progress A-1.4 2,200,000 1,200,000
Salam financing A-1.5 20,000,000 -
Qarz-e-Hasna 13,871 5,641
Others - -
27,283,805 5,857,659
Provision for non-performing facilities (238,561) (230,725)
27,045,244 5,626,934
Rupees in '000'
Provision against loans and advances - net
The profit and loss account of the Islamic Banking Group for the six months ended June 30, 2017 is as
Rupees in '000'
NOTES TO THE CONDENSED INTERIM FINANCIAL INFORMATION (UN-AUDITED)FOR THE SIX MONTHS ENDED JUNE 30, 2017
22

23
(Un-audited) (Audited)
June 30, December 31,
2017 2016
A-1.1 Murabaha financings
Murabaha receivable 1,562,610 1,426,245
Assets / Inventories 816,970 217,255
2,379,580 1,643,500
A-1.2 Ijarah financings
Net investment in Ijarah 5,307 6,785
Ijarah under IFAS-II
- Ijarah 643,540 554,439
- Advances 79,116 20,634
Assets/Inventories/Advances 722,656 575,073
727,963 581,858
A-1.3 Diminishing musharaka
Diminishing musharaka 1,877,237 2,385,860
Advances / Inventories 85,154 40,800
1,962,391 2,426,660
A-1.4 Istisna Work in process
Istisna work in process 1,750,000 1,200,000
Istisna sales receivable 450,000 -
2,200,000 1,200,000
A-1.5 Salam Financing
Salam financing 8,500,000 -
Salam sales receivable 11,500,000 -
20,000,000 -
Rupees in '000'
NOTES TO THE CONDENSED INTERIM FINANCIAL INFORMATION (UN-AUDITED)FOR THE SIX MONTHS ENDED JUNE 30, 2017

24
18 RELATED PARTY TRANSACTIONS
The Bank has related party relationships with Government of Khyber Pakhtunkhwa (majority shareholder), associates,
directors, key management personnel, staff retirement benefit plans and other related parties.
Banking transactions with related parties are carried out in the normal course of business at agreed terms. Contributions
to and accruals in respect of staff retirement benefit plans are made in accordance with actuarial valuation. Refer to note
No. 7.1 of the condensed interim financial statements for investment in related party.
Transactions with key management personnel are in accordance with the terms of their employment. Other transactions
are at agreed terms.
18.1
Advances:
At January 1, 193,406 - - 157,795 - -
Disbursed during the period / year 75,151 - - 91,027 - -
Repaid during the period / year (28,973) - - (55,416) - -
Balance as at June 30 /
December 31239,584 - - 193,406 - -
Deposits:
At January 1, 43,360 21,677 281,325 18,216 15,852 74,963
Deposited during the period / year 260,910 29,672 936,624 241,700 37,685 555,817
Repaid during the period / year (260,157) (29,602) (262,408) (216,556) (31,860) (349,455)
Balance as at June 30 /
December 3144,113 21,747 955,541 43,360 21,677 281,325
Mark-up / return / interest earned 4,648 - - 1,614 - -
902 707 22,354 280 347 1,193
Fees and expenses 3,354 - - 2,406 - -
18.2
Mark-up / return / interest
expensed
Details of transactions with related parties as at the period / year end are as follows:
Transactions, income and
expenditure
------------------------------------------ Rupees in '000' -------------------------------------------------------
June 30, 2017 (Un-audited) December 31, 2016 (Audited)
Directors
and key
management
personnel
AssociateEmployee
Funds
Directors
and key
management
personnel
AssociateEmployee
Funds
------------------------------------------- Rupees in '000' -------------------------------------------------------
For the six months ended
June 30, 2017 (Un-audited)
For the six months ended
June 30, 2016 (Un-audited)
AssociateEmployee
Funds
Directors
and key
management
personnel
AssociateEmployee
Funds
Directors
and key
management
personnel
Although the Government of Khyber Pakhtunkhwa holds 70.20% shares of the Bank (December 31, 2016: 70.20%), the
transactions with it have not been treated as related party transactions for the purpose of this disclosure.
NOTES TO THE CONDENSED INTERIM FINANCIAL INFORMATION (UN-AUDITED)FOR THE SIX MONTHS ENDED JUNE 30, 2017

Managing Director Director Director Director
19 SEGMENT DETAILS WITH RESPECT TO BUSINESS ACTIVITIES
The segment analysis with respect to business activity is as follows:-
Total income 3,240,507 1,468,750 79,850 3,382,233 8,171,340
Total expenses (2,837,438) (1,119,429) (55,387) (3,219,969) (7,232,222)
Net income 403,069 349,321 24,463 162,264 939,118
Total income 3,560,988 1,415,270 127,918 1,873,326 6,977,502
Total expenses (3,424,971) (737,341) (100,249) (1,693,928) (5,956,489)
Net income 136,017 677,929 27,669 179,398 1,021,013
20 GENERAL
20.1 Date of authorisation for issue
This condensed interim financial information was authorised for issue on ______________________by the Board of
Directors of the Bank.
Retail
Banking
Commercial
BankingTotal
---------------------------------------- Rupees in '000' ----------------------------------------
For the six months ended June 30, 2016 (Un-audited)
Trading &
Sales
Corporate
Finance
Retail
Banking
Commercial
BankingTotal
---------------------------------------- Rupees in '000' ----------------------------------------
Corporate
Finance
Trading &
Sales
For the six months ended June 30, 2017 (Un-audited)
August 18, 2017
NOTES TO THE CONDENSED INTERIM FINANCIAL INFORMATION (UN-AUDITED)FOR THE SIX MONTHS ENDED JUNE 30, 2017
25