forced dispersion of liquefied natural gas vapor clouds with water
TRANSCRIPT

FORCED DISPERSION OF LIQUEFIED NATURAL GAS VAPOR CLOUDS
WITH WATER SPRAY CURTAIN APPLICATION
A Dissertation
by
MORSHED ALI RANA
Submitted to the Office of Graduate Studies of
Texas A&M University
in partial fulfillment of the requirements for the degree of
DOCTOR OF PHILOSOPHY
December 2009
Major Subject: Chemical Engineering

FORCED DISPERSION OF LIQUEFIED NATURAL GAS VAPOR CLOUDS
WITH WATER SPRAY CURTAIN APPLICATION
A Dissertation
by
MORSHED ALI RANA
Submitted to the Office of Graduate Studies of
Texas A&M University
in partial fulfillment of the requirements for the degree of
DOCTOR OF PHILOSOPHY
Approved by:
Chair of Committee, M. Sam Mannan
Committee Members, Mahmoud El-Halwagi
Charles J. Glover
Dan Zollinger
Head of Department, Michael Pishko
December 2009
Major Subject: Chemical Engineering

iii
ABSTRACT
Forced Dispersion of Liquefied Natural Gas Vapor Clouds with Water Spray Curtain
Application. (December 2009)
Morshed Ali Rana, B.S., Bangladesh University of Engineering and Technology;
M.S., University of South Alabama
Chair of Advisory Committee: Dr. M. Sam Mannan
There has been, and will continue to be, tremendous growth in the use and
distribution of liquefied natural gas (LNG). As LNG poses the hazard of flammable
vapor cloud formation from a release, which may result in a massive fire, increased
public concerns have been expressed regarding the safety of this fuel. In addition,
regulatory authorities in the U.S. as well as all over the world expect the implementation
of consequence mitigation measures for LNG spills. For the effective and safer use of
any safety measure to prevent and mitigate an accidental release of LNG, it is critical to
understand thoroughly the action mechanisms. Water spray curtains are generally used
by petro-chemical industries to prevent and mitigate heavier–than-air toxic or flammable
vapors. It is also used to cool and protect equipment from heat radiation of fuel fires.
Currently, water spray curtains are recognized as one of the economic and promising
techniques to enhance the dispersion of the LNG vapor cloud formed from a spill.
Usually, water curtains are considered to absorb, dilute, disperse and warm a
heavier-than-air vapor cloud. Dispersion of cryogenic LNG vapor behaves differently
from other dense gases because of low molecular weight and extremely low temperature.
So the interaction between water curtain and LNG vapor is different than other heavier

iv
vapor clouds. Only two major experimental investigations with water curtains in
dispersing LNG vapor clouds were undertaken during the 1970s and 1980s. Studies
showed that water spray curtains enhanced LNG vapor dispersion from small spills.
However, the dominant phenomena to apply the water curtain most effectively in
controlling LNG vapor were not clearly demonstrated.
The main objective of this research is to investigate the effectiveness of water
spray curtains in controlling the LNG vapor clouds from outdoor experiments. A
research methodology has been developed to study the dispersion phenomena of LNG
vapor by the action of different water curtains experimentally. This dissertation details
the research and experiment development. Small scale outdoor LNG spill experiments
have been performed at the Brayton Fire Training Field at Texas A&M University. Field
test results regarding important phenomena are presented and discussed. Results have
determined that the water curtains are able to reduce the concentration of the LNG vapor
cloud, push the vapor cloud upward and transfer heat to the cloud. These are being
identified due to the water curtain mechanisms of entrainment of air, dilution of vapor
with entrained air, transfer of momentum and heat to the gas cloud. Some of the
dominant actions required to control and disperse LNG vapor cloud are also identified
from the experimental tests. The gaps are presented as the future work and
recommendation on how to improve the experiments in the future. This will benefit
LNG industries to enhance its safety system and to make LNG facilities safer.

v
DEDICATION
To the memory of my father - who has been my role-model for hard work, persistence
and personal sacrifices, who emphasized the importance of education and who instilled
in me the inspiration to set high goals and the confidence to achieve them.
To my mother - who made all of this possible with her endless love, sacrifices, patience,
encouragement and continuous prayers.
To my wife - who has been proud and supportive of my work and who has shared all the
uncertainties and challenges for completing this dissertation.
To my son - who has grown into a wonderful 2 year old in spite of his father spending so
much time away from him working.
To my brothers and sisters - who have been my emotional anchors my entire life.

vi
ACKNOWLEDGMENTS
I would like to express my profound gratitude and thanks to my advisor and
mentor, Dr. Mannan, for his guidance, instruction and encouragement during the course
of this research. I would also like to thank Dr. El-Halwagi, Dr. Glover, and Dr. Zollinger
for assisting on my committee and for their constructive suggestions and help.
I would like to thank BP Global Gas SPU for the research funding. Special
thanks are extended to Dr. Benedict Ho and Robin Passmore for their continuous
attention and valuable guidance throughout the progress of my research. I greatly
appreciate Kirk Richardson and his team at Brayton Fire Training Field. I would like to
thank Dr. Cormier and Dr. Suardin for their support and contributions to the research.
Without them, the field experiments would not be possible. Thanks to Geunwoong Yun,
Ruifeng Qi, Dr. Zhang, Dr. Guo and Dr. Ng for their hard work and support.
I am very grateful to all members and staff of the MKOPSC. Valerie Green,
Mary Cass, and Donna Startz helped me whenever I needed anything. All the students at
the center were like a second family to me. Special thanks to Towanna Arnold for
helping me with the administrative matters throughout my involvement at TAMU.
I want to express my sincere gratitude to my mother, brothers, sisters, and my
wife and my son for their unconditional support and encouragement during my graduate
studies. I would also like to thank Baba and Ma for their encouragement and prayers.
Finally, I am grateful to all my friends who make my life here joyful and happy.

vii
NOMENCLATURE
Ad droplet surface area m2
Am entrained air molar flow rate kmol/s
Apool area of the LNG pool m2
As spray (/curtain) area m2
C specific heat capacity J/kgK
CD the drag coefficient
CFD gas concentration during forced dispersion
CM momentum coefficient (nozzle)
CND gas concentration during natural dispersion
gpC
heat capacity of the gas mixture J/kgK
12txC concentration at x2 at any time t1
25t
xC concentration at x5 at time t2
Cfree_dispersion open field dispersion concentration
Cforced_dispersion concentration in presence of the water spray
D base diameter (eqn 6 and 7) m
D droplet diameter (eqn 17) m
DF dilution factor
Dn diameter of nozzle m
DRm maximum water spray dilution ratio
Dw diameter of solid water jet at the breakup region m
F flow number of a nozzle m3s
-1kPa
-0.5
FD forced dilution
Fd the drag force per droplet N
Hwo height of the water-curtain m
L latent heat of vaporization (of the liquid) J/kg
Li characteristics length of the pool m

viii
M mass of the pool kg
MW molecular weight kmol/kg
N number of droplets falling through the cloud per unit time s-1
Nd number of droplets produced from nozzle per unit time s-1
P and Pw water pressure (gauge) at the nozzle kPa
Q heat flux into the pool J/s
Q rate of heat transfer from the droplets to the cloud kJ/s
Qa volumetric flow of air m3/s
Qliquid average volumetric flow rate of LNG m3/s
Qs entrainment flow rate m3/s
Qw volumetric flow rate of water m3/s
R radius of the spray at that level m
Re Reynolds number
RM momentum ratio
T pool temperature K
Ta temperature of ambient air K
Tb pool boiling temperature K
Tg ambient ground temperature K
mgT and diT temperature of gas mixture and water droplet of class i K
TL temperature of the liquid K
Ts temperature of the ground K
waterT average water temperature during the test day °C
Treading temperature of the spray region after spray activation °C
mwT
mean temperature difference between the droplets (water)
and the vapor cloud K
miT
mean temperature difference between the droplets (ice)
and the vapor cloud K
U air velocity m/s

ix
Ud0 initial droplet velocity at the nozzle orifice m/s
Un average water velocity from the spray nozzle m/s
V entrained air velocity m/s
Vw wind speed m/s
W vaporization rate kg/s
Yin molar fractions of the toxic gas before dilution
Yout molar fractions of the toxic gas after dilution
ah average heat transfer coefficient (gas to droplets) W/m2K
ca heat capacity of ambient air at film conditions J/kg K
cpwater specific heat of water J/gm°C
dd diameter of a droplet m
di diameter of droplet of class i m
dw average droplet diameter m
f fraction of liquid LNG flashed
g gravity acceleration m/s2
ha heat transfer coefficient between air and the pool, W/m2K
gch
gas phase enthalpy entering the spray envelop
gh , vh sh ah
enthalpy of gas mixture, water vapor, pollutant and air (eqn 14)
hw and hi convective heat transfer coefficient of water and ice kJ/s m2K
k thermal conductivity of the ground W/m K
ka thermal conductivity of air at film conditions W/m K
ks thermal conductivity of the ground W/m K
vil
total volumetric flow rate of water droplet of class i m3/s
md average mass of a single droplet kg
am
mass flow rate of air kg/s
airm
rate of vapor due to heat transfer from the air kg/s
evapm rate of vapor due to evaporation of liquid kg/s
flashm rate of vapor due to flashing kg/s

x
liquidm average rate of liquid flow kg/s
radm
rate of vapor due to solar radiation above the pool kg/s
subm rate of vapor due to heat transfer from the ground, kg/s
m mass release rate of toxic gas kg/s
lm liquid-flow rate per unit length kg/m s
mgm mass flow rate of gas mixture in the spray kg/s
gcm mass flow rate of gas mixture entering the spray envelop kg/s
n number of nozzles per unit length m-1
q heat transfer per unit mass of water J/gm
qrad radiative heat flux W/m2
r proportionality constant of a the nozzle ms-2/3
t, t1 and t2 time sec
ua velocity of entrained air m/s
ua0 initial entrained air velocity m/s
ua* dimensionless entrained air velocity
ud velocity of the upward moving droplet m/s
ud0 initial droplet velocity m/s
ud* dimensionless drop velocity
udi velocity of droplet of class i m/s
ur the relative velocity between the droplet and air m/s
uW average wind speed m/s
x2 downwind distance 3.3 m
x5 downwind distance 11.3 m
vx and sx
mass fraction of water vapor and pollutant
z vertical direction (z is positive in the upward direction) m
z* dimensionless vertical distance
thermal diffusivity of the ground m2/s
α gravity parameter (eqn 33)

xi
β viscous-interaction parameter (eqn 34)
γ geometric parameter (eqn 35)
ξ alternative gravity parameter (eqn 36)
µa viscosity of ambient air at film condition kg/ms
f latent heat of freezing kJ/kg
νa kinematic viscosity of air m2/s
ρa density of ambient air density at film condition kg/m3
c cloud density kg/m3
ρdw water droplet density kg/m3
l liquid density kg/m3
LNG
density of liquid LNG kg/m3
ρw density of water kg/m3
θ spray angle (degree)
w and i
residence time of droplet (w: water, i: ice) s

xii
TABLE OF CONTENTS
Page
ABSTRACT ..................................................................................................................... iii
DEDICATION ................................................................................................................... v
ACKNOWLEDGMENTS .................................................................................................vi
NOMENCLATURE ........................................................................................................ vii
TABLE OF CONTENTS ................................................................................................ xii
LIST OF FIGURES .......................................................................................................... xv
LIST OF TABLES ..........................................................................................................xxi
1 INTRODUCTION ...................................................................................................... 1
1.1 Liquefied Natural Gas ..................................................................................... 1
1.2 LNG Demand .................................................................................................. 3
1.3 LNG Concerns ................................................................................................ 4
1.4 Hazards of LNG .............................................................................................. 5
1.4.1 Cryogenic Hazards ............................................................................. 5
1.4.2 Flash Fire ........................................................................................... 6
1.4.3 Pool Fire ............................................................................................. 6
1.4.4 Jet Fire ............................................................................................... 7
1.4.5 Rapid Phase Transition (RPT) ........................................................... 7
1.4.6 Rollover ............................................................................................. 7
1.5 Motivation ....................................................................................................... 8
1.6 Water Spray Curtain ....................................................................................... 9
1.7 Statement of Problem and Significance ........................................................ 10
1.8 Research Objective ....................................................................................... 11
1.9 Organization of the Dissertation ................................................................... 11
2 WATER SPRAY CURTAIN MECHANISM AND DISPERSION OF LNG –
REVIEW ................................................................................................................... 13
2.1 Background ................................................................................................... 13
2.2 Phenomenology of LNG Vapor Cloud ......................................................... 14
2.2.1 Vaporization of LNG ....................................................................... 14
2.2.2 Natural Dispersion of LNG Vapor................................................... 16

xiii
Page
2.2.3 Forced Dispersion of LNG Vapor Cloud ......................................... 17
2.3 Physical Phenomena of Water Curtain Action ............................................. 18
2.3.1 Air Entrainment into the Spray and Dilution ................................... 19
2.3.2 Forced Dispersion ............................................................................ 25
2.3.3 Heat Transfer ................................................................................... 29
2.3.4 Mass Transfer and Chemical Reaction ............................................ 31
2.4 Effects of Spray Parameters on Physical Phenomena .................................. 31
2.5 Research on the Application of Water Curtain to Disperse LNG Vapor
Cloud ............................................................................................................. 34
2.5.1 Effectiveness in Reducing Concentration ........................................ 34
2.5.2 Study of Heat Transfer ..................................................................... 46
2.5.3 Research Gaps.................................................................................. 48
3 EXPERIMENTAL DEVELOPMENT ..................................................................... 50
3.1 Introduction ................................................................................................... 50
3.2 Experiment Facility....................................................................................... 51
3.3 Field Experiments ......................................................................................... 56
3.3.1 Experiment: April 2006 ................................................................... 58
3.3.2 Experiments: November 2007 and March 2008 .............................. 62
3.3.3 Experiment: March 2009 ................................................................. 74
3.4 Equipment and Data Acquisition .................................................................. 79
3.4.1 Gas Detection ................................................................................... 80
3.4.2 Temperature Measurement .............................................................. 83
3.4.3 Flow and Pressure Measurement ..................................................... 83
3.4.4 Weather Monitor .............................................................................. 84
3.4.5 Imaging ............................................................................................ 85
3.4.6 Data Acquisition .............................................................................. 85
3.5 Spray Nozzle Specification ........................................................................... 86
3.6 Summary ....................................................................................................... 94
4 STUDY OF AIR ENTRAINMENT INTO SPRAYS ............................................... 96
4.1 Introduction ................................................................................................... 96
4.2 Simple Air Entrainment Theory ................................................................... 97
4.3 Discussion on the Equations ....................................................................... 100
4.4 Nondimensionalized Equations .................................................................. 103
4.5 Numerical Solution ..................................................................................... 105
4.6 Summary ..................................................................................................... 108
5 EXPERIMENTAL RESULTS ................................................................................ 109

xiv
Page
5.1 Introduction ................................................................................................. 109
5.2 Experiment of 2006 .................................................................................... 110
5.2.1 General Description ....................................................................... 110
5.2.2 Results and Discussion .................................................................. 111
5.3 Experiment of 2007 .................................................................................... 114
5.3.1 General Description ....................................................................... 114
5.3.2 Results and Discussion .................................................................. 120
5.4 Experiment of 2008 .................................................................................... 140
5.4.1 General Description ....................................................................... 140
5.4.2 Results and Discussion .................................................................. 141
5.5 Experiment of 2009 .................................................................................... 146
5.5.1 General Description ....................................................................... 146
5.5.2 Results and Discussion .................................................................. 150
5.6 Study of Water Spray Action Mechanisms................................................. 164
5.6.1 Heat Transfer by the Sprays........................................................... 165
5.6.2 Air Entrainment into Sprays .......................................................... 169
5.6.3 Momentum by the Upward Sprays ................................................ 175
5.7 Overall Effects in Forced Dispersion.......................................................... 177
5.8 Summary ..................................................................................................... 193
6 CONCLUSIONS AND RECOMMENDATIONS FOR FUTURE WORK ........... 195
6.1 Conclusions ................................................................................................. 195
6.2 Future Work ................................................................................................ 198
REFERENCES ............................................................................................................... 203
VITA .............................................................................................................................. 211

xv
LIST OF FIGURES
Page
Fig. 1. Densities of methane (vapor) and air at different temperatures. .......................... 2
Fig. 2. Temperature and specific gravity of methane, air and methane-air mixture
at atmospheric pressure ........................................................................................ 4
Fig. 3. Typical representation of an LNG base load terminal ......................................... 8
Fig. 4. Air entrainment for a water spray ...................................................................... 22
Fig. 5. Air entrainment flows and ratios for a single nozzle spray ............................... 24
Fig. 6. Effect of curtain-to-cloud height on the forced dispersion factor ...................... 27
Fig. 7. Effect of water droplet size on water curtain action mechanism. ...................... 33
Fig. 8. Gas detectors placements ................................................................................... 36
Fig. 9. Effects of water spray conditions on methane concentration downwind of
the LNG pool ..................................................................................................... 37
Fig. 10. Methane concentrations downwind of the LNG pool, with and without
water spray ......................................................................................................... 37
Fig. 11. Illustration of mixing effect of water spray ....................................................... 38
Fig. 12. Calculated ground level methane concentrations with and without water
spray (neutrally buoyant plume model) ............................................................. 41
Fig. 13. Calculated ground level methane concentrations with and without water
spray (positive buoyant dispersion model) ........................................................ 42
Fig. 14. Layout of test pit area ........................................................................................ 44
Fig. 15. Effect of water drop size on heat transfer by water spray. ................................. 47
Fig. 16. Aerial view of the LNG training facility ............................................................ 53
Fig. 17. North side view of the LNG training facility. .................................................... 53

xvi
Page
Fig. 18. LNG training facility layout ............................................................................... 54
Fig. 19. Searchline Excel IR open path gas detector. ...................................................... 55
Fig. 20. LNG spill location in 2006 experiment (marine pit). ........................................ 58
Fig. 21. Angus Hydroshield HSC water spray head. ...................................................... 59
Fig. 22. Setup of 2006 experiment. ................................................................................. 60
Fig. 23. Location and ID of the four open path gas detectors (E, N, W and S). ............. 61
Fig. 24. Location of 2007 and 2008 experiments. ........................................................... 63
Fig. 25. Photographs of water spray nozzles used in 2007 and 2008 ............................. 64
Fig. 26. Enclosed spill area in 2007 experiment. ............................................................ 65
Fig. 27. Enclosed spill area in 2008 experiment. ............................................................ 65
Fig. 28. Overall setup of 2007 experiment. ..................................................................... 67
Fig. 29. Overall setup of 2008 experiment. ..................................................................... 70
Fig. 30. Thermocouple placement inside the concrete base for 2008 experiment .......... 72
Fig. 31. Spill area of 2009 experiment. ........................................................................... 74
Fig. 32. Overall setup of 2009 experiment. ..................................................................... 76
Fig. 33. Thermocouple placement inside the spill area for 2009 experiment ................. 78
Fig. 34. IR gas detector-Teflon tube connection. ............................................................ 82
Fig. 35. Gas detector installation in chambers ................................................................ 82
Fig. 36. Flow rate- pressure relationship of the nozzles. ................................................. 88
Fig. 37. Drop size (SMD) versus pressure characteristics of the nozzles. ...................... 90
Fig. 38. Coverage of the full cone nozzle at 690 kPa pressure ....................................... 91

xvii
Page
Fig. 39. Coverage of flat fan nozzle at two pressures. .................................................... 92
Fig. 40. Rate of momentum calculated at the nozzle tip ................................................. 93
Fig. 41. Upward water spray from a conical nozzle. ..................................................... 101
Fig. 42. Dimensionless air entrainment velocities into different conical sprays. .......... 106
Fig. 43. Dimensionless entrainment rate into different conical sprays. ........................ 107
Fig. 44. Ground level (0.3m elevation) methane concentration at two downwind
distances ........................................................................................................... 112
Fig. 45. LNG dispersion tests ........................................................................................ 115
Fig. 46. Water curtain coverage in 2007 experiments. .................................................. 119
Fig. 47. Spill and natural dispersion .............................................................................. 120
Fig. 48. Forced dispersion with full cone spray curtain ................................................ 121
Fig. 49. Forced dispersion with flat fan curtain ............................................................ 121
Fig. 50. Concentration and temperature measurement during test 1a at 0.5 m
elevation of three downwind locations ............................................................ 123
Fig. 51. Test procedure and dispersion process............................................................. 124
Fig. 52. Average data at (x2=) 3.3m downwind: full cone spray curtain, test 1a. ......... 126
Fig. 53. Average data at (x5=) 11.3m downwind: full cone spray curtain, test 1a. ....... 126
Fig. 54. Average data at (x2=) 3.3m downwind of release: fan spray curtain, test 2a .. 127
Fig. 55. Average data at (x5=) 11.3m downwind: fan spray curtain, test 2a ................. 127
Fig. 56. Formation of LNG vapor cloud from continuous liquid release ...................... 132
Fig. 57. Vapor flow rate for full cone curtain tests (test 1a and 1b). ............................ 135
Fig. 58. Vapor flow rate for flat fan curtain tests (test 2a and test 2b). ......................... 135

xviii
Page
Fig. 59. Dilution and strength ratio: test 1a ................................................................... 138
Fig. 60. Dilution and strength ratio: test 2a ................................................................... 139
Fig. 61. Concentration and temperature reading at the spill source: 2008 experiment . 142
Fig. 62. Temperature of the concrete surface. ............................................................... 143
Fig. 63. Formation of LNG vapor cloud from continuous liquid release, 2008 tests. .. 144
Fig. 64. Vapor rate for test 1 of 2008 experiment. ........................................................ 145
Fig. 65. LNG dispersion test of 2009. ........................................................................... 147
Fig. 66. Water curtain coverage in 2009 experiments ................................................... 150
Fig. 67. Average concentration (natural dispersion) data at the pit edge (0 m
downwind) all four tests of 2009. .................................................................... 152
Fig. 68. Average concentration (both natural and forced dispersion) data 10 m from
the pit edge for all four tests of 2009. .............................................................. 153
Fig. 69. LFL concentration (both natural and forced dispersion) data 14 m from the
pit edge for all four tests of 2009. .................................................................... 157
Fig. 70. Temperature measurement of the liquid pool at different heights for 2009
experiment........................................................................................................ 158
Fig. 71. Vapor rate from the LNG pool for 2009 experiment. ...................................... 159
Fig. 72. Concentration ratio at 0.5m elevation in 2009 experiment. ............................. 161
Fig. 73. Concentration ratio at 1.2 m elevation in 2009 experiment. ............................ 162
Fig. 74. Concentration ratio at 2.1 m elevation in 2009 experiment. ............................ 162
Fig. 75. Change in water spray temperature reading in 2007 experiment. ................... 166
Fig. 76. Change in water spray temperature reading in 2009 experiment. ................... 166
Fig. 77. Entrained air velocity into the sprays from 2007 experiment. ......................... 171

xix
Page
Fig. 78. Entrained air velocity into the sprays from 2009 experiment. ......................... 171
Fig. 79. Volumetric rate of entrained air into the sprays from 2007 experiment. ......... 173
Fig. 80. Volumetric rate of entrained air into the sprays from 2009 experiment. ......... 174
Fig. 81. Upward momentum from the water droplets from 2007 experiment. ............. 176
Fig. 82. Upward momentum from the water droplets from 2009 experiment. ............. 176
Fig. 83. Downwind concentration near ground level (at 0.5m elevation): full cone
curtain test 2007. .............................................................................................. 178
Fig. 84. Downwind concentration near ground level (at 0.5m elevation): flat fan
curtain test 2007. .............................................................................................. 178
Fig. 85. Downwind concentration at 1.2m elevation: full cone curtain test 2007. ....... 181
Fig. 86. Downwind concentration at 1.2m elevation: flat fan curtain test 2007. .......... 181
Fig. 87. Downwind concentration at 2.1m elevation: full cone curtain test 2007. ....... 182
Fig. 88. Downwind concentration at 2.1m elevation: flat fan curtain test 2007. .......... 183
Fig. 89. Concentration contour without and with full cone water curtain action in
2007 experiment............................................................................................... 184
Fig. 90. Concentration contour without and with flat fan water curtain action in
2007 experiment............................................................................................... 185
Fig. 91. Downwind concentration at three different heights without and with full
cone water curtain in 2009 experiment. ........................................................... 187
Fig. 92. Downwind concentration at three different heights without and with flat fan
water curtain in 2009 experiment. ................................................................... 187
Fig. 93. Downwind concentration at three different heights without and with mist
drop downward water curtain in 2009 experiment. ......................................... 188
Fig. 94. Downwind concentration at three different heights without any spray and
with combined water curtain system in 2009 experiments. ............................. 188

xx
Page
Fig. 95. Concentration contour without and with full cone water curtain action in
2009 experiment............................................................................................... 190
Fig. 96. Concentration contour without and with fan type water curtain action in
2009 experiment............................................................................................... 191
Fig. 97. Concentration contour without and with mist type water curtain action in
2009 experiment............................................................................................... 191
Fig. 98. Concentration contour without and with combined water curtain action in
2009 experiment............................................................................................... 192

xxi
LIST OF TABLES
Page
Table 1. LNG properties and storage conditions in LNG tanks ....................................... 2
Table 2. U.S. LNG facilities ............................................................................................. 3
Table 3. Summary of LNG spill experiments with water curtains. ................................ 57
Table 4. Location of gas detectors on poles: 2006 experiment. ..................................... 61
Table 5. Location of tripod poles and positions of gas detectors and thermocouples
on poles: 2007 experiment. ............................................................................... 69
Table 6. Location of tripod poles and positions of gas detectors and thermocouples
on poles: 2008 experiment. ............................................................................... 71
Table 7. Location of tripod poles and positions of gas detectors and thermocouples
on poles: 2009 experiment. ............................................................................... 77
Table 8. Location of the water curtains: 2009 experiment. ............................................ 77
Table 9. Types of equipment used in the experiments. .................................................. 80
Table 10. Weather conditions during the experiments. ................................................. 110
Table 11. Average flow rate and pressure data for 2007 experiment ........................... 116
Table 12. Heights covered by the water curtains in 2007 experiment. ......................... 119
Table 13. Average flow and pressure data for 2008 experiment. ................................. 141
Table 14. Average water flow rate and pressure data for 2009 experiment. ................. 148
Table 15. Heights covered by the upward water curtains in 2009 experiment. ............ 150
Table 16. Average temperature change and heat loss calculation. ................................ 167

1
1 INTRODUCTION
1.1 Liquefied Natural Gas
Liquefied Natural Gas (LNG) refers to natural gas converted into liquid state by
super cooling to 111K (-162.2°C/-260°F) at ambient pressure. LNG commonly consists
of 85%-98% methane with the remainder as a combination of nitrogen, carbon dioxide,
ethane, propane, and other heavier, less volatile hydrocarbon gases. At normal
temperature and pressure, the density of natural gas is 0.667 kg/m3. When it is cooled to
111 K at 1 atmosphere, the liquid density becomes 425-450 kg/m3; that is the gas
volume reduce by a factor of about 640-670 (CLNG, 2008; Raj, 2007). This large
reduction in volume has made the transportation and storage of natural gas more
economic and easier. LNG is usually stored at 111K and atmospheric pressure in heavily
insulated tanks. Properties of LNG at the storage conditions are given in Table 1. The
change of density of methane vapor and air at different temperatures is demonstrated in
Fig. 1.
____________
This dissertation follows the style of Journal of Loss Prevention in the Process
Industries.

2
Table 1. LNG properties and storage conditions in LNG tanks (MKOPSC, 2008).
Property Value Units
Molecular weight 16.043 kmol/kg
Critical temperature 190.6 K
Critical pressure 4.64E+06 Pa
Freezing temperature 111.6 K
Liquid density at boiling point (for pure methane) 422.6 kg/m3
Liquid density at boiling point (Commercial LNG) 450.0 kg/m3
Vapor density at boiling point 1.82 kg/m3
Density of gas at NTP (1 atm, 20 oC) 0.651 kg/m
3
Heat of vaporization 510 kJ/kg
Heat of combustion (lower) - LHC 50.0 MJ/kg
Heat of combustion (higher) - HHC 55.5 MJ/kg
Specific heat of vapor @ constant pressure 2200 J/kg K
Ratio of specific heats 1.30815
Stoichiometric air-fuel mass ratio 17.17
Stoichiometric methane vapor concentration in air
(volumetric) 9.5 %
Upper flammability limit (UFL) in air (volumetric
concentration) 15 %
Lower flammability limit (LFL) in air (volumetric
concentration) 5 %
Fig. 1. Densities of methane (vapor) and air at different temperatures. Modified
from CMS (1962).
0.00
0.25
0.50
0.75
1.00
1.25
1.50
1.75
2.00
2.25
2.50
2.75
3.00
3.25
3.50
-165 -150 -135 -120 -105 -90 -75 -60 -45 -30 -15 0 15
Den
sity
, kg/
m3
Temperature, deg C
Methane Air
Properties at 0.1 mPa

3
1.2 LNG Demand
Natural gas has been used as an industrial and residential fuel for heating and
other purposes for over a century (Raj, 2007). The natural gas energy consumption in the
United States (US) is about 25% of the overall energy. As forecasted by the U.S.
Department of Energy, demand for natural gas in the US is increasing by 20% over the
next 25 years because of its clean-burning characteristics (FERC, 2008). Due to this
increasing demand for natural gas, LNG has been considered as an alternate fuel that can
meet the demand because of its low production cost and practicability in transportation
and storage. Thus LNG has become an important energy source as well as a vital
industrial feedstock in the economy of the United States. Several active LNG facilities
are operating across the US, including marine terminals, operating and storage facilities
for use during periods of peak natural gas demand (“peak shaving”) or as a base load
source of natural gas. Table 2 includes the list LNG facilities currently (as of October,
2008) active in the U.S. More LNG receiving terminals are under construction and
several more are proposed to be constructed in the US.
Table 2. U.S. LNG facilities (CLNG, 2008; FERC, 2008).
LNG Facilities
113 active LNG facilities
58 facilities to liquefy and store natural gas
39 used for LNG storage only
5 facilities receive imported gas and regasify for domestic use
1 export terminal

4
1.3 LNG Concerns
The density of methane at normal temperature and pressure is lighter than air.
However, methane at its boiling point (111 K) is significantly denser (factor of 1.5) than
the ambient air. The cryogenic liquid, LNG, when released on land or water vaporizes by
boiling or evaporation due to heat transfer from the substrate and environment and forms
a heavier-than-air vapor cloud at atmospheric conditions (Ivings et al., 2007; Raj, 2007).
Temperature and specific gravity of methane cloud can be realized from Fig. 2.
Fig. 2. Temperature and specific gravity of methane, air and methane-air mixture
at atmospheric pressure. Modified from CMS (1962).
-165
-145
-125
-105
-85
-65
-45
-25
-5
15
0.0
0.1
0.2
0.3
0.4
0.5
0.6
0.7
0.8
0.9
1.0
1.1
1.2
1.3
1.4
1.5
1.6
1.7
1.8
1.9
2.0
2.1
2.2
2.3
2.4
2.5
2.6
2.7
2.8
2.9
3.0
Tem
pe
ratu
re, d
eg
C
SP GR (AIR = 1 at 101.3 kPa and 15 C)
AIRMETHANE
METHANE AIR MIXTURE

5
The very cold, methane rich and heavy vapor cloud formed from an LNG spill as
disperses in the prevailing wind direction, becomes warmer, diluted and lighter due the
heat transfer from surroundings and other effects. When the methane concentrations are
between the lower and upper flammability limits (LFL and UFL), 5% and 15% by
volume in air, the vapor cloud becomes flammable. The massive volume of LNG storage
tanks therefore poses fire and explosion hazards due to its highly flammable feature.
1.4 Hazards of LNG
Several potential hazards can arise from an uncontrolled LNG spill. The
following potential hazards of an LNG spill are of major concern for the LNG industries.
1.4.1 Cryogenic Hazards
LNG is stored and transported at very low temperature, around 111 K. Cryogenic
hazards include extreme thermal effects associated with freezing of living tissue as a
result of direct contact with very cold liquid. Cryogenic fluids may cause the
embrittlement and subsequent failure of containment materials and structure. For
instance, carbon steel loses ductility and impact strength (ability to withstand an impact
force) at cryogenic temperature. Thus, careful selection of materials for equipment
involved in the process (e.g., tank, pipe, pump, gas detector, valve, flow meter, etc.) is
critical for the LNG industry.

6
1.4.2 Flash Fire
LNG will vaporize upon release and the vapor generated by this boiling liquid
will start to mix with the surrounding air and will be carried downwind with the air
creating a heavier-than-air, cold vapor. As the cold vapor cloud continues to be carried
downwind, it will mix with additional air and be further diluted. However, some portion
of the vapor cloud will be within the flammable limits (between 4.4-16.5% volumetric
concentration mixtures with air). If this flammable portion comes in contact with an
ignition source, the vapor cloud may ignite. The flame might then propagate through the
cloud, back to the source of the vapor, particularly if the flammable portion of the cloud
is continuous. This simple burn-back of an unconfined vapor cloud can cause secondary
fires by igniting materials in the path of the flame and can cause severe burns to persons
caught within the cloud. Damage to equipment will generally be limited since the time of
exposure to the fire will be relatively short (West & Mannan, 2001; Qiao, West &
Mannan, 2005).
1.4.3 Pool Fire
LNG may accumulate as liquid on the ground from an accidental release if the
spill is of sufficient size. If any ignition source is encountered, a pool fire can occur.
Ignition can occur at the pool location (either immediately or delayed), or the pool can
be ignited by a vapor cloud fire. The pool fire will continue if the spill expands from its
source and continues evaporating. Compared to a vapor cloud fire, the effects are more
localized, but of longer duration (Qiao, West & Mannan, 2005; Zinn, 2005).

7
1.4.4 Jet Fire
When a flammable liquid is accidentally released from pressurized containment,
the leak may form a spray of liquid droplets and vapor. If ignited, the resulting fire is
termed jet fire. Such a fire also can result from a pressurized vapor leak. Jet fires present
the same types of hazards as pool fires, i.e., direct flame contact and radiant heat.
However, the radiant heat from a jet fire is often greater than that from a pool fire of
similar size.
1.4.5 Rapid Phase Transition (RPT)
The phenomenon of rapid vapor formation with loud "bangs" has been observed
when LNG is released under water. This non-flaming physical interaction is referred to
as "rapid phase transition" or "flameless explosion" (Qiao, West & Mannan, 2005; Zinn,
2005).
1.4.6 Rollover
The addition of LNG with different densities to partially filled LNG tanks or the
preferable evaporation of nitrogen has been known to lead to the formation of stratified
layers. The density difference may be due to different sources of LNG or the weathering
of LNG in the tank. Due to heat and mass transfer, the densities of the two layers
approach each other. Eventually, these two layers mix resulting in a sudden increase in
the vapor evolution and sometimes tank pressure. Rollover may result in excessive loss

8
of valuable fuel at best, or lead to an incident under extreme conditions (Qiao, West &
Mannan, 2005; Zinn, 2005).
1.5 Motivation
The development of LNG terminals requires a thorough evaluation of potential
release consequence associated with the installations. Usually an LNG terminal is
composed of an off loading deck, storage tanks, control room and re‐gasification unit.
Fig. 3 shows a typical configuration of an LNG base‐load terminal. The off loading deck
is where the LNG tanker is anchored and then loading arms are used to transfer the LNG
from the ship to the storage tanks. The storage tanks may be located near off‐shore or
inland (Cormier, 2008). Safety barriers such as dikes or impounding walls are usually
designed and built around the LNG storage tanks for holding accidentally spilled LNG to
protect adjacent properties.
Fig. 3. Typical representation of an LNG base load terminal. Adopted from
Cormier (2008).

9
Safety standards require LNG facilities to have a “dispersion exclusion zone” so
that flammable vapor cloud from an accidental release will not propagate beyond the
plant boundaries (FERC, 2008). This exclusion zone is defined from the LNG spill
source to the predicted distance at which the average vapor concentration is one-half of
the LFL, i.e. 2.5% volume in air. This distance is estimated with various dispersion
modeling techniques incorporating appropriate control and mitigation measures.
Effective control and mitigation measures are required to reduce the size of the
flammable vapor cloud, created by liquefied gas spills, by enhancing the dispersion of
vapors.
1.6 Water Spray Curtain
Water spray curtains have been considered by industry to be a valuable tool for
mitigating toxic and flammable vapor hazards because of its availability and simplicity,
efficiency and adaptability in gas dispersion, absorption, and fire inhibition (Uzanski &
Buchlin, 1998; Hald et al., 2005). Water sprays are also reliable and inexpensive and
their installation can be either fixed or mobile. A water spray curtain is composed of a
line of spray nozzles which creates a curtain of water droplets in the path of a naturally
moving gas cloud or to the radiant heat from a fire. It has been demonstrated that water
spray curtains significantly reduce the gas cloud concentration or fire heat radiation
through several physical actions. The performance of water spray curtain depends on its
own characteristics and extrinsic parameters. The types and application methods also
vary widely. Generally, water sprays can be classified as full cone, full square cone,

10
hollow cone and flat-fan type nozzles characterized by water droplet size is a function of
both pressure and flow rate. The spray can be directed downward and upward, vertically
or inclined.
Water curtain has also been considered as one of the most economic and
promising techniques to reduce flammable LNG vapor concentration. The ability of
water curtain to show different effects initiated an interest in the utilization of water
curtain as a potential LNG vapor cloud mitigation measure in the late 70’s (Atallah,
Guzman & Shah, 1988). The effectiveness of water curtain in controlling LNG vapor
depends on: (a) parameters of its own characteristics: water droplet distribution, nozzle
type and size, direction, width and height, water pressure etc.; and (b) external
parameters: vapor cloud features, LNG properties, wind speed, atmospheric stability etc.
1.7 Statement of Problem and Significance
Fixed water spray curtains are being installed to a limited extent at some LNG
storage facilities for the purpose of dissipating the vapor cloud that may be generated
during an accidental release. So far no definitive engineering guideline has been
developed to design a water curtain system to control LNG vapor cloud effectively. This
is because the interaction between an LNG vapor cloud (methane and air mixture) and
water droplet of a water curtain is a sophisticated phenomenon to predict and model.
Development of comprehensive and authentic design guidelines for water curtain to
mitigate LNG release thus still requires a thorough understanding of the underlying
physical phenomena through a reasonable amount of experimental works. Because of

11
many uncertainties present in the water curtain – LNG vapor interaction, representative
water curtain types need to be studied experimentally with real LNG spills under
simulated conditions before installation for specific applications.
1.8 Research Objective
Development of comprehensive and authentic design guidelines for water curtain
to mitigate LNG release requires a thorough understanding of the underlying physical
phenomena through a reasonable amount of experimental and theoretical works. This
research has been developed to investigate the interaction of representative types of
water curtains with LNG vapor clouds. The main purpose is to experimentally study the
effect of water curtain parameters on the interaction phenomena during a LNG spill.
Overall, the extent of LNG vapor concentration reduction and temperature increase
downwind of a curtain and effect of significant parameters of various water curtains will
be studied from experiments. Finally, this work will identify the effectiveness of water
curtain in controlling LNG vapor mainly from LNG spill experiments.
1.9 Organization of the Dissertation
This dissertation presents the research on the application of different water spray
curtains on controlling LNG vapor dispersion. Therefore, this dissertation is arranged to
meet its objectives.
Section 1 provides the introduction of this research. Background information
regarding LNG and its associated hazards, and water curtain applications are described

12
in this section. In addition, the frameworks of the research are also explained by the
problem statement and research significance and objectives.
Section 2 describes the background knowledge of water curtain application, its
action phenomena as well as LNG dispersion characteristics. Action of water curtain on
LNG vapor dispersion and identification of pertinent parameters that affects its
performances is crucial to understand. This section also provides the literature review of
previous work by other researchers to support the significance of this research. Previous
studies and experiments are explained and compared with the pertinent parameters. This
is to identify the gaps and to ensure this research is part of an attempt to fill the
identified-gaps.
Once the research gaps are recognized, a detailed experiment plan was developed
to meet the research objectives. Section 3 illustrates the experiment development. Each
of the experiment was conducted in sequence with improvement in between one
experiment to another. Equipment and sensors played important roles in this research.
Thus, all equipments, data acquisition system, and its setup are illustrated in Section 3.
Section 4 describes the simple theoretical model used in the research to study two
mechanisms of spray action. This section also includes parametric studies conducted
with a computer program, developed to solve the model numerically.
Section 5 discusses the detailed experiment results related as well as some
theoretical calculations and summarizes the findings. This dissertation is completed by
Section 6 where all conclusions, limitation, and recommendations, and future researches
are presented.

13
2 WATER SPRAY CURTAIN MECHANISM AND DISPERSION OF LNG –
REVIEW*
2.1 Background
The mitigation of accidental releases of flammable LNG has been a great
concern in the LNG industry. Theoretically, water curtains will enhance LNG vapor
cloud dispersion and reduce the “vapor cloud exclusion zone” effectively, if properly
designed (Atallah, Guzman & Shah, 1988). However, their effectiveness for the control
of a specific hazard requires careful evaluation of credible release scenario, chemical
characteristics, action mechanisms and spray hydrodynamics (or characteristics). The
variables which can affect the efficiency of a water-spray curtain for the case of LNG
release are described in the section. This section also summarizes previous research on
water spray curtain application to disperse LNG vapor cloud.
____________
* Part of this section is reprinted with permission from “Development of Design and
Safety Specifications for LNG Facilities Based on Experimental and Theoretical
Research” by Cormier, B, R., Suardin, J, A., Rana, M. A., Zhang, Y. and Mannan, M. S.,
2009. OPEC, Oil Prices and LNG, 12, 295-424, Copyright [2009] by Nova Science
Publishers Inc.

14
2.2 Phenomenology of LNG Vapor Cloud
LNG is stored at the boiling temperature of methane (111 K) at atmospheric
pressure. Therefore a breach in LNG-pipe or LNG tank may results in a boiling liquid
pool. LNG will vaporize immediately and form a cold, denser-than-air, flammable gas
cloud if it escapes from its containment (Ivings et al., 2007). This cold vapor cloud will
condense the water content in the air (humidity) and create a visible white condensate
cloud, which may or may not represent the actual methane cloud. If the cloud is not
ignited immediately, it will entrain in the atmospheric air and disperse downwind at
wind speed. These complicated processes of vapor cloud formation and dispersion can
be divided into: (1) the source term and (2) the vapor dispersion. The source term
includes the physical process of the LNG pool to transform into the gas phase and is
mainly characterized by vaporization and spreading of the pool. The vapor dispersion
includes the physical process of the entrainment of the vapor cloud into the air and
dilution. Understanding those two mechanisms is important for the effective application
of any LNG vapor control and mitigation device. The mechanisms are as follows.
2.2.1 Vaporization of LNG
The generation of flammable LNG vapor cloud crucially depends on the area of
the liquid pool and its rate of vaporization. Generally vaporization of LNG pool depends
on the temperature of the pool, the heat transfer to the pool from the surroundings, and
heat removal from the liquid to provide the heat of vaporization (Webber et al., 2009).
The rate of vaporization can be slow or very rapid depending on the circumstances of the

15
release scenario as well as on the surface where the release occurs. Sometimes these
circumstances can be described as evaporation or boiling. If the vaporization occurs well
below the boiling point, where the vapor pressure is much lower than atmospheric
pressure, then it is refers as evaporation. Whereas the vaporization at, or very close, to
the boiling point, where the vapor pressure is atmospheric, or very close to it, is
recognized as boiling. Usually evaporation occurs from the upper surface of a pool and
boiling often occurs primarily at nucleation sites on an adjacent solid surface, or on the
underside of a liquid undergoing film boiling (Webber et al., 2009). However the overall
physical processes involved are the same but cause and effect in this process can appear
differently in different situations. The heat balance for the entire pool can be written as
(Ivings et al., 2007):
LWQdt
dTMC (1)
Upon release, initially the LNG pool will boil very rapidly, and the vaporization
rate is the controlled mainly by the heat flux into the pool from the ground. If the pool is
confined, the surface beneath it will cool down and the heat flux form the surface will
diminish with time, leaving a still very hazardous pool though vaporizing more slowly.
If the pool is unconfined then it will be able to spread on to new warm surface and rapid
boiling may continue. The rate of production of flammable vapor also increases with
increasing surface area of the pool. The heat transfer to a circular confined pool on
ground can be estimated by assuming perfect thermal contact between pool and ground,
and only vertical temperature gradients in the ground. The conduction is thus modeled
by the one-dimensional simple Fourier conduction equation in the ground, with an initial

16
state where the ground is uniformly at ambient temperature and an initially singular
boundary condition whereby its top surface is held at the boiling point of the pool
(Briscoe & Shaw, 1980). The simple governing equations and boundary conditions are:
2
2
z
T
t
T
(2)
T (0, z) = Tg ; z > 0
T (t, 0) = Tb ; t ≥ 0
The solutions for temperature and heat flux are:
t
zerfcTTTztT gbg
4)(),( (3)
t
z
t
kTT
z
TkQ gb
4exp
4)(
2
(4)
where, at the surface (z=0), thermal conductivity, k is inversely proportional to the
square root of time.
2.2.2 Natural Dispersion of LNG Vapor
Usually LNG is composed of methane, which is lighter than air. However LNG
vapor is heavier-than-air because of its high gas density at a cold temperature. A heavy
cloud usually forms above the liquid pool after any LNG release because of vaporization
and very cold temperature of LNG. This heavy cloud will then slump and progress
towards the prevailing wind direction. This natural transport of the vapor cloud is called
the natural dispersion. During this downwind progression of the cloud, two dilution

17
mechanisms might occur: (1) heat transfer from the surroundings may warm and then
expand the vapors to the point that the cloud start to lift off, and/or (2) wind entrainment
may dilute the concentration. Other factors like the ground roughness, obstacles, wind
and weather conditions, heat flux from ground and atmosphere, etc. affect the natural
dispersion of LNG. The dispersing cloud approaches air density asymptotically from
above, just as it approaches ambient temperature from below, as it dilutes and warms
(Ivings et al., 2007). Understanding of this natural dispersion for the development of an
effective safety measure to prevent and mitigate accidental releases of LNG is critical.
2.2.3 Forced Dispersion of LNG Vapor Cloud
Like any other vapor suppression devices, the water curtain is used to enhance
the dispersion process. If any external force is applied to the naturally dispersed LNG
vapor cloud to enhance the entrainment and heat transfer, then the dispersion is referred
as the forced dispersion. The physical processes involved in using a water curtain to
reduce the concentration of any vapor cloud include (1) dilution effects of mixing the
gas cloud with entrained air; (2) mechanical effects of creating a barrier to the passage of
a gas cloud, imparting momentum to the gas cloud to disperse it upwards, downwards or
sideways; (3) thermal effects between the gas cloud, water, and entrained air; and (4)
mass transfer effects of absorbing gases with or without chemical reaction (Dusserre,
Dandrieux & Thomas, 2003; Hald et al., 2005). The actions of a water spray in
mitigating a vapor cloud may consist of all or any combination of these mechanisms
(McQuaid & Fitzpatrick, 1981; McQuaid & Fitzpatrick, 1983; Moodie, 1985; Moore &

18
Rees, 1981). However to enhance LNG vapor cloud dispersion, any combination of the
first three mechanisms are considered as water curtain actions. As the solubility of CH4
in water is minimal, the mass transfer effects can be ignored (Rojey, Jaffret & Marshall,
1997). Because of low molecular weight (methane) and extremely low temperature,
LNG vapor cloud dispersion behaves differently from other dense gases (Raj, 2007). The
physical mechanisms involved in the LNG vapor and water curtain action are described
in the following.
2.3 Physical Phenomena of Water Curtain Action
There is substantial literature on modeling momentum transfer, air entrainment,
and mass transfer processes within a single water droplet or whole spray region. These
models, derived for evaluating the effectiveness of water sprays in mitigating accidental
releases, fall into two broad categories: macroscopic and microscopic. Macroscopic
models are usually based on semi-empirical formulations (Moore & Rees, 1981;
Buchlin, 1994) and describe the interaction between the two phases, gas and liquid
phases. However, microscopic models are based on fluid dynamics and reproduce the
movement and mass transfer between the liquid phase and the gas phase (Buchlin &
Alessandri, 1997). The microscopic models, generally, only specify the mitigation
ability of the water curtain without assessing downwind concentration which is essential
for assessing the effectiveness of water spray for an accidental release of LNG. Neither
macroscopic nor microscopic models have been widely used in the process industry
because of the unavailability, unfamiliarity or lack of full validation (Hald et al., 2003;

19
2005). Most of the work in the publically available literature focuses on mitigation of
Cl2, CO2, NH3 or HF release. The published works on the effective use of water curtain
in mitigating LNG vapor releases is, however, very limited. Some of the main research
on general water curtain applications are as follows.
2.3.1 Air Entrainment into the Spray and Dilution
The use of water spray curtains for the dispersion of hazardous vapor clouds
mainly applies the feature of air entrainment into the spray. Water spray can dilute a gas
cloud by mixing it with the entrained air. When the spray is activated, mixing and
dilution result from momentum transfer between the air and water droplets. The mixing
of the entrained air and the gas cloud reduces the gas concentration in the downstream
region of the water spray. According to the design requirements, it is necessary to
deliver air not only in sufficient quantity, but also at a sufficient velocity to ensure
dilution. It should also be noted that the turbulence induced by the spray may aggravate
the intensity of combustion if the vapors are flammable and are somehow ignited
(Fthenakis, 1991).
Air entrainment is a strong function of spray configuration, droplet size, droplet
velocity, and spray arrangements. Large droplets entrain less air than smaller droplets
but induce better mixing and dispersion. Although smaller droplets entrain more air, they
have smaller terminal velocities which are almost constant and cause poor mixing and
dilution due to less turbulence (CCPS, 1997; Fthenakis, 1991).

20
The fluid mechanics of liquid sprays into a gas phase received substantial
attention in the past. Measurements of air velocities and entrainment rates were reported
in literature (Bennat & Eisenklam, 1969; Binark & Ranz, 1958; Briffa & Dombrowski,
1966; Gluckert, 1962; Ito, 1970; Nakakuki, 1973; Rabash & Stark, 1962). Two
theoretical studies of air entrainment into liquid sprays were first reported by Briffa and
Dombrowski (1966), and Bennet and Eisenklam (1969). The first one treated a flat fan
spray theoretically and the second one proposed a theory for hollow cone sprays. Neither
of these theories incorporated momentum exchange between the liquid drops and
entrained air, the dominant mechanism for considered in this research. The works
conducted by Heskestad et al. (1981) and Rothe and Block (1977) presented similar
entrainment models incorporating momentum exchange.
An approach for the design and application of a water spray to entrain air into a
gas cloud were presented by McQuaid (1977) who developed a correlation between air
entrainment rates and water flow rates using experimental data assuming that adequate
mixing requires an induced air velocity of 6 m/s (McQuaid, 1977; McQuaid &
Fitzpatrick, 1983). With his correlation, McQuaid described a design methodology for a
water spray system depending upon the entrainment rate and the assumed air velocity.
To ensure necessary airflow, the author considered five parameters as the design
requirement, two of which are fixed and three adjustable (McQuaid, 1977). The fixed
parameters are gas flow rate and water pressure. The adjustable parameters are water
flow rate, nozzle type, and number of spray nozzles. A single parameter, called the

21
“Flow Number”, was incorporated to demonstrate the influence of the nozzle type on the
rate of air entrainment. Flow number was defined as:
w
w
P
QF (5)
“Flow number” was also considered as a constant discharge coefficient for a given
nozzle provided the flow rate is large enough to ensure a turbulent flow in the nozzle.
The relationship among the flow rate of air, the air velocity V at the base of the spray
cone, and the base diameter was simply expressed by the following:
V
QD a
4 (6)
McQuaid finally obtained a correlation of the ratio of the volumetric air rate to
volumetric water rate as function of flow number. The equations are shown below and
represented in Fig. 4.
F
DA
D
Ff
Q
Qw
w
a
2
2 (7)
here, wP
VA
4
(8)
22
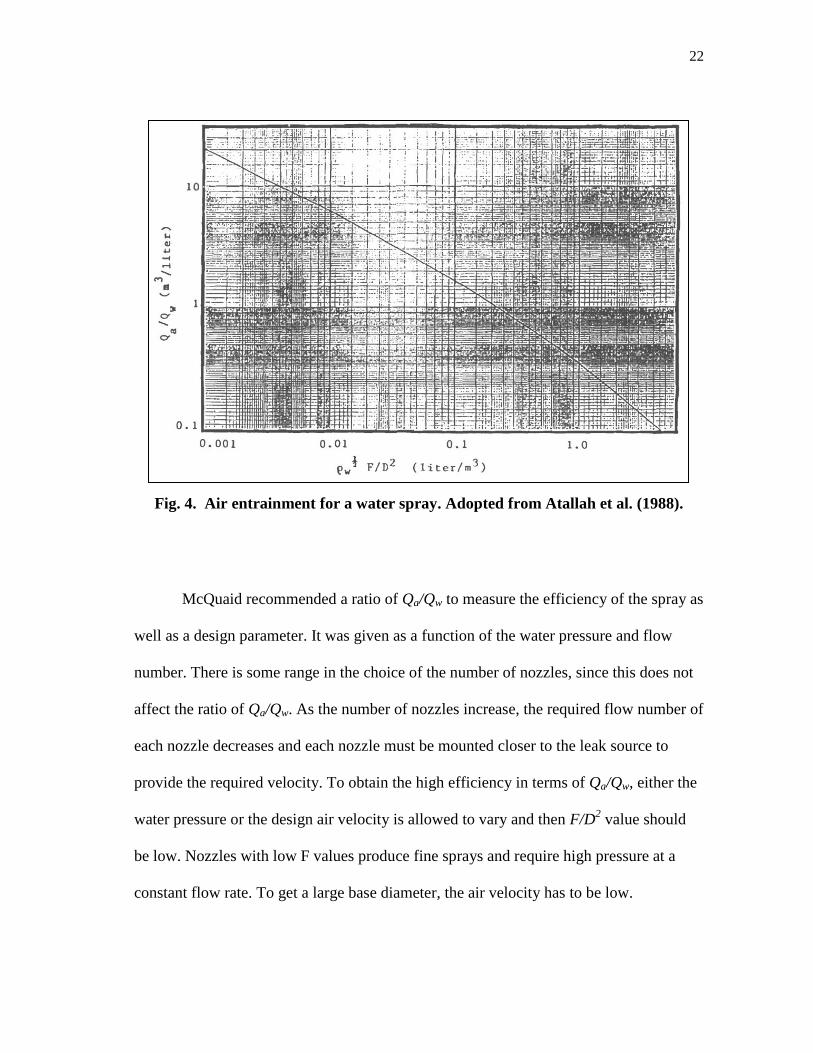
Fig. 4. Air entrainment for a water spray. Adopted from Atallah et al. (1988).
McQuaid recommended a ratio of Qa/Qw to measure the efficiency of the spray as
well as a design parameter. It was given as a function of the water pressure and flow
number. There is some range in the choice of the number of nozzles, since this does not
affect the ratio of Qa/Qw. As the number of nozzles increase, the required flow number of
each nozzle decreases and each nozzle must be mounted closer to the leak source to
provide the required velocity. To obtain the high efficiency in terms of Qa/Qw, either the
water pressure or the design air velocity is allowed to vary and then F/D2 value should
be low. Nozzles with low F values produce fine sprays and require high pressure at a
constant flow rate. To get a large base diameter, the air velocity has to be low.

23
The effectiveness of a water spray in diluting a gas also can be determined from
the “air entrainment ratio,” expressed as the volume of entrained air per unit volume of
water sprayed (m3 air/m
3 water). Heskestad et al (1976, 1981) carried out experiments
and theoretical studies to establish methods for predicting air entrainment rates into
water spray systems. In these experiments, water was sprayed vertically downwards into
an uninterrupted enclosed space. A simple theoretical model (eqn 9) was also developed
for determining the entrainment flow rate.
RdRU
UUURdRQ
n
n
n
n
s
0022 (9)
This equation was used to determine the air entrainment rate across any level of a
single spray. It was integrated numerically by curve fitting from the plots of the
measured U/Un versus R. A comparison of the theoretical entrainment flow values with
the experimental results showed that the agreement was within 17% for a single nozzle
and 11% for multiple nozzles. The models were capable of predicting air entrainment for
single sprays and water curtains, provided the spray boundary was known. The
experimentally determined air entrainment flow rates and efficiencies for single nozzle
are given in Fig. 5. The figure is plotted from experimental data from Heskestad et al.
(1981) for a single Rockwood T-4 ¼ inch nozzle. In the figure the solid lines represent
entrainment flow and dotted lines represented entrainment ratio.

24
Fig. 5. Air entrainment flows and ratios for a single nozzle spray. Reprinted with
permission from “Development of Design and Safety Specifications for LNG
Facilities Based on Experimental and Theoretical Research” by Cormier, B, R.,
Suardin, J, A., Rana, M. A., Zhang, Y. and Mannan, M. S., 2009. OPEC, Oil Prices
and LNG, 12, 295-424, Copyright [2009] by Nova Science Publishers Inc.
Fthenakis and Zakkay (1990) derived an equation to assess the dilution provided
by a water spray. Under the assumption that only gas free ambient air is entrained by the
spray and it “perfectly mixes” with the gas, maximum water spray dilution ratio was
estimated from the gas mass balance (Fthenakis, 1991):
MW
m
AYMW
m
Y
YDR
min
out
in
m
(10)
0
1
2
3
4
5
6
7
8
0
2
4
6
8
10
12
14
16
0 1 2 3 4 5 6 7
en
trai
nm
en
t ra
tio
, m
3/l
itre
en
trai
nm
en
t fl
ow
, m3/s
distance from the nozzle, m
Air Entrainment Flows and Ratios for a Single Nozzle Sprayat different water pressures and associated flow rates
20 psig 8.1 gpm: Flow 40 psig 11.4 gpm: Flow 90 psig 17.1 gpm: Flow
20 psig 8.1 gpm: Ratio 40 psig 11.4 gpm: Ratio 90 psig 17.1 gpm: Ratio

25
2.3.2 Forced Dispersion
Hald, et al. (2003, 2005) proposed a research methodology to quantify the forced
dispersion factor provided by a water curtain with respect to its configuration. An
engineering code CASIMIRE was developed to design water curtains for the chemical
industry. This code can evaluate the mitigation efficiency for different water curtain
configurations (type of nozzles, nozzle spacing, operation, pressure, height) by
predicting the dilution factor. This code uses information on spray hydro-dynamics and
physical and chemical properties of gases. In this work, dispersion of CO2 and Cl2 has
been studied in field and wind gallery tests, as well as CFD simulation.
In the CFD simulation of forced dispersion of a heavy cloud like Cl2 by water
spray curtain, behavior of the gas phase is modeled by the averaged Navier-Stokes
equations coupled with the RNG k- model for the turbulence. The droplet phase is
described by a Lagrangian approach where single droplet injections model the
particulate flow at the nozzle exit. The droplet velocity is calculated by solving the
motion equations. The Rosin-Rammler droplet size distribution models the poly-
dispersed nature of the spray.
The dilution factor is defined as the ratio of the ground concentration with and
without sprays. The momentum ratio is defined as ratio of the momentum of the water
curtain to a representative momentum of the gas cloud (Hald, et al., 2003; 2005):
dispersionforced
dispersionfree
FC
CD
_
_ (11)

26
wo
do
wc
l
MH
U
V
mR
2
(12)
Plots of dilution factor versus momentum ratio, based on results from both
experimental tests and simulation analysis, indicated DF as a good gauge for potency of
water curtain. If the curtain-to-cloud height ratio is sufficiently large, an RM value of 10
should lead to a DF value of 10. At low momentum ratio, the gas cloud goes through the
curtain without noticeable change in concentration. As RM increases, the strength of the
curtain with respect to the wind intensifies, and at high RM values, typically 10, the water
spray curtain has a significant effect and behaves as an active obstacle for the gas cloud.
The effect of the curtain-to-cloud height ratio, Hwc/Hc, on the dispersion factor
also has been investigated by Hald et al. (2003, 2005). The height of the gas cloud
considered is the cloud thickness at the curtain location during free dispersion
experiment. Typical results are plotted in Fig. 6. The effect of the height ratio on the
dispersion factor becomes more significant as RM increases. However, at high RM the
trend tends to saturate as shown by the dashed curve (ΔDF/DF) plotted in Fig. 6. As a
practical rule, a water spray with more than twice the height of the gas cloud is
recommended.

27
Fig. 6. Effect of curtain-to-cloud height on the forced dispersion factor. Reprinted
with permission from “Development of Design and Safety Specifications for LNG
Facilities Based on Experimental and Theoretical Research” by Cormier, B, R.,
Suardin, J, A., Rana, M. A., Zhang, Y. and Mannan, M. S., 2009. OPEC, Oil Prices
and LNG, 12, 295-424, Copyright [2009] by Nova Science Publishers Inc.
Moore and Rees (1981) tried to find the most effective way of increasing natural
dispersion of an explosive or toxic gas following an accidental release. They mainly
concentrated on forced dispersion, which is the dilution of gas caused by entrainment of
air with gas, entrainment of gas with air, momentum, turbulence and speed of the gas.
They derived a “semi-empirical” model, built on Bosanquet’s equation of air
entrainment (Bosanquet, 1957), for the forced dispersion of gases by water or steam
curtains and then applied that model in eight experiments to dilute dense gas plumes.

28
The authors extended the pioneering work of McQuaid (1977) by concentrating
on the central question of mixing. One of the key parameters controlling the
effectiveness of forced dispersion is the ratio of the air velocity to the wind speed. They
developed new theories on the assumption that the mixing of gas with air could be
described by empirical entrainment parameters which made the results semi-empirical.
Three different spray configurations were considered to give three different
relationships: (1) theory A: downward pointing spray and gas cloud from a point source;
(2) theory B: upward pointing spray and gas cloud from a point source; and (3) theory C:
upward pointing spray and gas cloud from a line source.
Moore and Rees (1981) used water and steam curtains to mitigate a vapor
release. The effectiveness of water and steam curtains was defined as the ratio of gas
concentration during natural and forced dispersion. The defined relationship was as
follows:
FD
ND
DC
CF (13)
Moore and Rees also described field trials conducted to validate their models
using water spray and steam curtains. The trials included a continuous release of propane
gas at 2 kg/min, a spill of 60 kg of liquid propane and a continuous release of liquid
propane at 10 kg/min. The barrier was generally located 1 meter downwind of the
source. The concentration was measured at 15 meters downwind. Other experiments
were conducted with argon and sulfur hexafluoride at much lower flows and different
downwind measurement distances. For downward pointing nozzles, the FD factors were

29
in the range of 1.1-3.3, and for upward pointing nozzles, they were in the range of 2.5-
6.3. The upward pointing nozzles were more effective. The experimental data and
models showed that forced dispersion works best for small leaks, low wind speeds, and
over short distances.
2.3.3 Heat Transfer
Heat transfer between water droplets and cold vapor also has been thought to
play an important role in dissipating cold clouds by enhancing their buoyancy. However,
very little literature dealt with this complex phenomenon of heat transfer by water
sprays. St.-Georges and Buchlin (1995) presented a simple one-dimensional spray model
to evaluate the heat transfer action by water curtain. The model was based on
macroscopic mass and heat transfer balances and was developed considering three-fold
spray actions: (1) gas (air and pollutant) entrainment and gas mixing; (2) absorption of
pollutant in water droplets; (3) aerosol evaporation and dispersion enhancement by spray
heating. It was also considered that (1) heat transfer between the phases to be induced by
conduction and convection in the gaseous and liquid boundary layers, (2) temperature
gradients inside the droplets to be small and constant, and (3) mass transfer between the
phases to be induced by convection and diffusion. The final enthalpy balance for the
spray envelope and single spray was derived as the following equation.
dn dimg
dii
vihvigTdivl
s
as
v
avmgggc
gcmg
pgmg
TTud
la
dz
dlhh
dz
dxhh
dz
dxhhmhh
dz
md
dz
dTCm
6
(14)
30
Simulations were performed with two full cone sprays with chlorine clouds, and
the results concluded that the heat transfer could be high enough to make the cloud
buoyant and greatly increase the dispersion. The pollutant cloud temperature was
increased by several degrees during the simulation. The authors also found that spray
with smaller droplets gave higher heat transfer rates, but induced less momentum and
was more affected by wind. The spray height must be higher than cloud height to gain
more mechanical mixing with fresh air.
Alessandri et al. (1996) presented a mixed Lagrangian-Eulerian model of a water
curtain where heat, mass and momentum processes were modeled in a Lagrangian
framework for the dispersion phase and in an Eulerian framework for the carrier phase.
Simulation and tests of full cone spray curtains with nitrogen-air mixture were
performed. Both upward and downward pointing sprays were simulated to identify the
gas and droplet temperature in the spray region with the consideration of simultaneous
mass transfer. The water curtain performance in changing the gas cloud height also was
studied. Results indicated that the downward pointing nozzle configuration was
preferable to the upward pointing one, when both heat and mass transfer processes were
considered. There were indications of droplets freezing by premixing the cold gas with
the entrained air, before interacting with the spray droplets for the case of upward
pointing nozzles. In the simulations, the downward nozzles actually increased the cloud
height significantly as compared to the upward nozzles.

31
2.3.4 Mass Transfer and Chemical Reaction
Some research indicates that water spray can more effectively control unconfined
releases of gases which are highly soluble in water. However, there is limited
information on the effectiveness of this control option with less soluble gases. Prugh
(1987) has quantitatively assessed the effectiveness of water sprays on several gases,
based on differences in the Henry’s law constant. According to his findings, water spray
is effective for highly soluble chemicals such as many acid vapors; however, total
absorption should not be expected. Water sprays are marginally effective in reducing the
hazard of vapors with limited solubility in water (Prugh, 1987; Prugh & Johnson, 1988).
Prugh (1985, 1986) also has presented mass balance to relate the theoretical
effectiveness of water sprays/curtains with the water and gas flow rates, the initial gas
concentration and the Henry’s law constants. Although useful for the estimation of the
maximum effectiveness, these equations do not consider the influences of several other
parameters, e.g., droplet size, spray pattern, gas and liquid mass-transfer coefficients,
which are important in the design of an effective system (Fthenakis, 1991).
2.4 Effects of Spray Parameters on Physical Phenomena
The sprays produced by a nozzle can be categorized by their shapes as conical,
fans, or fogs. The spray pattern that will be used is highly dependent on the planned
application. Conical sprays can be further broken down into either full-cone or hollow-
cone sprays. In the hollow cone pattern all of the spray is located at the surface of the
cone produced by the nozzle and none of it is inside the cone. In the full cone pattern the

32
liquid being sprayed fills the cone pattern produced by the nozzle. Conical sprays
produce medium size droplets. Nozzles that spray water as a sheet of liquid produce a
pattern known as a fan. The droplet sizes produced by fan nozzles are usually coarse.
The fog nozzles atomize the liquid stream into a mass of very fine droplets (CCPS,
1997).
Water spray curtains are mainly curtains of water droplets. Information of the
size of the droplets produced by a spray nozzle is essential as it affects the action
mechanisms. The droplet size of a certain type of curtain provides a certain surface area.
When a water curtain control a vapor cloud by diluting it, then the volume of the
droplets (i.e., its momentum) is important. A spray nozzle actually produces a range of
droplet sizes. The simplest approach is to define a representative droplet diameter in
terms of mean or median. The Sauter Mean Diameter (SMD) defines a droplet with
mean surface area and volume for the whole spray. It is calculated from the sum of the
droplet volumes in a given spray divided by the sum of their surface areas. Another
commonly used representative diameter is the Volume Median Diameter. Half of the
droplets in a spray have diameters greater than this value and half of the droplets smaller
(CCPS, 1997; Gant, 2006). Fig. 7 illustrates the effects of drop size on water curtain
mechanism.

33
Fig. 7. Effect of water droplet size on water curtain action mechanism.
The spray flow direction is another important factor to consider when dealing
with a vapor cloud of specific nature. The primary purpose of a water curtain to control a
flammable gas release is the attainment of a suitable dilution of the released gas, so that
the cloud reach lower flammability limit rapidly before dispersing too far. When dealing
with toxic cloud water curtains are used to ensure a partial abatement of the released
compound by chemico-physical absorption, in addition to the dilution phenomenon.
Usually downward water curtains are used for heavier than air flammable and toxic
gases to contain the gas cloud in an area. Downward curtains create a barrier to the gas
cloud by the air vortex created by the spray and force the gas downwards (Palazzi et al.,
2004). In the LNG industry, upward-pointing water curtains should be used to facilitate
LNG dispersion. Though LNG is a heavier than air vapor cloud, it becomes lighter when
Air entrainment (vol)
Mixing & Dilution Air entrainment (rate)
Momentum
Heat transfer
min max
DROP SIZE
Mechanism

34
gets diluted and warmer. For this water curtains with an upward flow should show better
effectiveness to control LNG than those with a downward flow (Atallah, Guzman, &
Shah, 1988). The momentum from an upward spray can enhance air entrainment through
the lower surface of the LNG cloud and influences the mixing between the LNG cloud
and entrained air. Thus a better dilution could be achieved. The upward momentum
imparted to the LNG cloud, also pushes it from the bottom and facilitates the cloud’s
dispersion upward. However care should be given to prevent water entering the LNG
pool, as it will increase vaporization rate.
2.5 Research on the Application of Water Curtain to Disperse LNG Vapor
Cloud
2.5.1 Effectiveness in Reducing Concentration
It is a complex problem to predict downwind concentration or quantify the
effectiveness of water sprays in mitigating accidental releases of toxics. Both theoretical
and experimental work has been carried out to capture the underlying mechanisms and
the parameters in the use of water spray. However, a very limited number of these
published works are on the use of water curtains to control LNG vapor clouds.
Experiments on using water curtains for small LNG spills by University Engineers for
the US Coast Guard in the mid- 1970’s, and modeling, wind tunnel and small scale spill
tests by Factory Mutual Research Corporation for Gas Research Institute in the early
1980’s are the major published works to date. The former conducted experiments to

35
simulate spills on LNG ships and used fan-shaped sprays; the later one developed
models as well as performed tests considering a spill contained in a dike and used solid
and flat sprays, to determine the effectiveness of water spray curtain.
Martinsen and Muhenkamp (1977), and Brown, Martinsen and Cornwell (1983)
summarized the small scale experiments by the U.S. Coast Guard in 1976. Those small-
scale experiments were performed to determine the effectiveness of water sprays to
disperse LNG vapors using spray nozzles, available aboard LNG ships. The type of
nozzle used in the tests were fan shaped sprays and produced a wide angle, flat spray
pattern in the shape of a circular segment with a radius of 2.44 to 3.05 m and an arc of
150 to 160 degrees. The spray pattern created by these nozzles was a sheet of water for
the first few inches of spray and then the remaining spray consisted of water drops. To
study a spill which can occur on a ship, a 3.05 m diameter pan was used to test 15.24 cm
of LNG dispersion. Ten catalytic bead-type combustible gas detectors were used to
measure the gas concentration downwind of the pan 2.13 m (7 feet) and 0.61 m (2 feet)
above the ground. Fig. 8 shows the gas sensors layout for the test.
During the experiments, the numbers of nozzles as well as water flow rates were
varied in twelve different runs. The nozzles were located about 0.46 m (1.5 feet) below
the edge of the LNG container. The closest nozzle was placed about 1.68 m (5.5 feet)
downwind from the leading edge of the pool and the second and third nozzles were 25.4
cm (10 inches) and 50.8 cm (20 inches) downwind of the first nozzle, respectively. The
wind speed during that day was 4 m/s (9 mph) with gusts up to 7.6 m/s (17-mph).

36
Fig. 8. Gas detectors placements. In FPS unit system. Reprinted from Martinsen &
Muhenkamp (1977) with permission from the authors.
Gas concentrations were measured first with no water spray, then with one, then
two and finally with three nozzles. The readings were time-averaged over 5 or 10-
minutes period by graphical integration because of fluctuations of methane concentration
caused by wind gustiness’ crosswind turbulence. Due to some sensors’ failure during the
test, 33 data points of 48 tests were reliable. Twelve of these data were gathered without
water spray. Fig. 9 and Fig. 10 show the results:

37
Fig. 9. Effects of water spray conditions on methane concentration downwind of
the LNG pool. x axis: water flow rate (gpm), y axis: reduction in concentration
(%); correlation coefficient = 0.802 and standard error of estimate = 0.0963. In FPS
unit system. Reprinted from Martinsen & Muhenkamp (1977) with permission
from the authors.
Fig. 10. Methane concentrations downwind of the LNG pool, with and without
water spray. In FPS unit system. Reprinted from Martinsen & Muhenkamp (1977)
with permission from the authors.

38
Fig. 9 summarizes the data to determine the percentage reduction in gas
concentration for the various water flow rates conditions. The best-fit straight line was
drawn by linear regression. Fig. 10 shows gas concentration at 2.13 m (7 feet) and 0.61
m (2 feet) levels downwind of the LNG pool. From the 2.13 m (7-feet) high sensors, the
readings of sensor 6 and 7, before and after water spray, shows increase in plume height.
Fig. 11 shows the effects of water sprays in dispersing LNG vapor cloud.
Fig. 11. Illustration of mixing effect of water spray. Reprinted from Martinsen &
Muhenkamp (1977) with permission from the authors.
Only a few tests were performed to observe water spray dispersion of LNG
vapor, but no theoretical model was suggested in this research. The experimental results
proved that methane concentration reduction did occur with the water spray. However,

39
the authors neither gave any precise method of designing an effective water spray system
for vapor concentration reduction, nor gave any information about the materials of the
pan where LNG was spilled. The material of construction of the pan is important as it
affects the vaporization rate. Their experiments were not concerned with the vapor
concentration in front of the spray nozzles. They also made conclusions about two
mechanisms that caused the concentration reduction. Between the two mechanisms, the
increase in mechanical turbulence caused by the decrease in the concentration was
clearly indicated from the results. However, as the heating of the vapor plume was not
measured, the effect of heating on vapor dispersion was not clearly identifiable from the
experiments.
Heskestad et al. (1981, 1983) summarized the three-phase research program to
develop engineering design guidelines for the use of water spray curtains to disperse
LNG vapor cloud. The Gas Research Institute contracted with Factory Mutual Research
Corporation (FMRC) to develop this research program. In this program, theoretical
models were developed according to the previous calculations of air entrainment rate by
spray nozzles. To understand LNG vapor dispersion, a design methodology for water
spray curtains was formulated and small-scale experiments were then designed based on
this model. The experimental results were summarized later several articles.
In the earlier phase of the work, a theoretical steady-state model of the
interaction of a line spray with a vapor cloud driven by atmospheric wind was
formulated. Interaction and downwind vapor dispersion calculations to determine the
state of the diluted gas leaving the interaction region were performed with the FMRC

40
computer code, SPRAY. In order to develop engineering design guidelines for water
spray systems based on these theories, small-scale experiments were designed. These
experiments were guided by a simple entrainment theory for spray discharging vertically
downward in quiescent air (Heskestad, Kung & Todtenkopf, 1976; 1981).
To formulate and calculate the interaction of spray and vapor, droplet
evaporation, drag, mass, momentum and energy were considered. Two-dimensional flow
field was assumed by ignoring all the variations in the third dimension (perpendicular to
the wind and parallel to the ground). This is an inherent limitation of the two-
dimensional flow approximation. To theoretically analyze the effectiveness of a water
curtain in dispersing LNG vapor, a hypothetical large diked LNG spill was assumed. A
spray-vapor-wind interaction was calculated for the cited LNG spill from the derived
model. The assumptions for formulating the interaction model were: (1) methane layer
approached from the dike and mixes with ambient air; (2) the concentration of methane
in the layer is close to 100%; (3) in the spray-vapor layer interaction region the mixing
was adiabatic and flow was two-dimensional; and (4) water condensed from the ambient
air due to layer heating.
The calculated results for a 2-m thick vapor cloud and a variety of spray
configurations and wind speeds clearly indicate that for a given spray configuration,
effective dilution and heating occurs at lower wind speed (Heskestad, Meroney &
Kothari, 1983). For standard downward spray configuration, a 65% reduction in methane
mass fraction occurs at the lowest wind speed of 1 m/s, but at the highest considered

41
wind speed of 4 m/s, the decrease is only 18% and the highest cloud temperature at the
layer is 275 K for the lowest wind speed.
The calculated results at the downwind end of the spray-vapor-wind interaction
regions were used as inputs for downwind plume dispersion calculations. These
calculations were performed to determine the significance of spray dilution and heating
of the LNG vapor cloud in reducing the size of the dispersion exclusion zone. Fig. 12
and Fig. 13 show the calculated ground-level methane vapor mass fractions calculated
with neutrally buoyant plume and positive buoyant dispersion models for the spray and
no-spray situations.
Fig. 12. Calculated ground level methane concentrations with and without water
spray (neutrally buoyant plume model). Reprinted with permission from
“Dispersal of LNG Vapor Clouds with Water Spray Curtains,” Report No GRI-
80/0107 by Gas Research Institute.

42
Fig. 13. Calculated ground level methane concentrations with and without water
spray (positive buoyant dispersion model). Reprinted with permission from
“Dispersal of LNG Vapor Clouds with Water Spray Curtains,” Report No GRI-
80/0107 by Gas Research Institute.
Theoretical results of the study concluded that water sprays can provide
significantly enhanced dispersion at a low wind speed, but the usefulness of water
curtain decreases as wind speed increases beyond 4 m/s. The figure also indicates that
water curtain causes the downwind zone of high vapor concentration to be substantially
smaller at low speed than at high wind speeds (>4 m/s). The formulated results were
used afterwards to design small-scale outdoor experiments, as well as model
experiments based on wind tunnel simulations. The experiments were guided by a
simple entrainment theory for conical sprays discharging vertically downward in

43
quiescent air. The average entrained-air velocity in the spray was determined by the
theory as a function of vertical distance below the spray nozzle for given water pressure,
nozzle diameter and spray cone angle. For the downward pointing spray, the effect of
atmospheric wind on the air entrainment and any additional entrainment that could occur
in the ground jets were ignored for the sake of simple design calculations. It was
assumed that air entrainment rate is some multiple of the spill rate in order to make the
spray system capable of entraining surrounding air and mixing it with the vapor flow.
Heskestad, et al. (1983) also presented the results from initial experiments to
study the effectiveness of water spray curtains in dispersing LNG vapor. The tests
consisted of outdoor experiments with LNG spills into a 3 m by 3 m diked area, as well
as reduced scale, model experiments in a wind tunnel simulating massive spills of LNG
into a 60 m by 60 m diked area, both surrounded by water spray nozzles. For the outdoor
tests, LNG was spilled into a 3 m by 3 m pit. The LNG entered through an insulated 1.5
inch stainless steel pipe that was welded to a 6 inches diameter discharge elbow. As the
expansion in the pipe reduced the velocity of any vapor in the flow, the elbow
discharged on a 1 m by 1 m evaporator pad consisting of a stainless steel embossed plate
heat exchanger carrying high flow rates of water covered by a stone layer approximately
0.05 m thick which was framed by bricks. The LNG discharge rate measured to be about
0.45 kg/s and considered equivalent to the evaporation rate at steady state.
In the outdoor tests, infrared type gas sensors were used to monitor gas
concentration. Twenty-four nozzle sites were chosen to use “swirl” type nozzle of 4 mm
diameter, which produced “full cone” sprays. For downward spray, the nozzles were

44
installed at an elevation of 0.99 m, which produced a spray impact diameter of 0.49 m at
the test pressure (84 psig). Fig. 14 shows the layout of gas sensors, wind station, spray
nozzles and a meteorological station for the outdoor tests. Among the 33 regular
experiments performed, 11 were analyzed. Upward pointing spray configurations were
also studied.
Fig. 14. Layout of test pit area. Reprinted with permission from “Dispersal of LNG
Vapor Clouds with Water Spray Curtains,” Report No GRI-80/0107 by Gas
Research Institute.

45
From the outdoor test results, the authors only analyze three runs for downward
spray, which was not sufficient for validating the theoretical calculations (Gas Research
Institute, 1982). The placement of sprays was very close to the pit, which might spray
water into the pool and increase the boil-off rate and the concentration in the air. The
results did not suggest any precise method of designing an effective water spray for a
small spill on the ground. Based on the model and theoretical calculations, it was
expected that for a ground entrained air velocity of 6 m/s, twelve vertical downward
sprays would reduce the downwind vapor concentrations to near 5% by volume (spill
rate 0.45 kg/s and 87.4 % methane in LNG). The expectation was met although the pre-
spray concentrations were already very low. This configuration diluted the vapor
concentration to the anticipated level from the ratio of the LNG-vapor rate versus the
theoretical entrainment rate in quiescent air. Results show that twelve and twenty-four
upward sprays dilute the concentrations to about 2% and 1%, respectively. The vapor
plume was lofted above the diked area by the sprays, producing a low ground level
concentration downwind with some vapor potentially escaping between adjacent sprays.
The associated water rates were somewhat higher than the minimum estimated
theoretically.
The main part of this study was carried out on 1:100 model scales in a wind
tunnel, simulating massive spills of LNG into a 60 m by 60 m diked area. At room-
temperature, CO2 was used to simulate LNG-vapor. Experiments with vertical
downward and vertical upward sprays showed disappointing results because of poor
mixing between entrained air and ground level vapor. However, the downward sprays

46
inclined 45° toward the dike wall and increased water pressure improved the dilution
performance of water per unit flow rate of water. For the vertical upward spray, high
water pressure also enhanced the dilution performance per unit flow rate of water. Other
wind tunnel experiments in the same available literature indicated that storage tanks and
increased dike heights had little effect on the dilution performance of the downward
inclined and vertical upward spray curtains. Regarding the nozzle diameter in case of
upward sprays, substituting a larger spray nozzle at a decreased water pressure
theoretically having a similar entrainment rate and entrained air velocity in quiescent
surroundings compared to the original pressure and nozzle size, resulted in similar
dilution performance. However, for reasons unknown, downward inclined sprays
resulted in inferior performance (Gas Research Institute, 1982).
2.5.2 Study of Heat Transfer
A rigorous heat transfer analysis was carried out by Atallah et al. (1988) to
determine the required amount of water and droplet size for warming a cold LNG vapor
cloud, from its boiling temperature (110 K) to the neutral buoyancy temperature (165 K).
The authors derived an equation based on the consideration and assumption that: (1)
downward water spray was located above the LNG vapor cloud; (2) droplets had a
uniform and spherical diameter d; and (3) water spray produced N droplets per second.
The rate of heat transfer between the droplets and the cloud was given by the equation:
imiiwwmwwwfwd
w ThdThdd
NQ 22
3
6 (15)

47
The water flow rate in the spray barrier was derived as (in kg/s):
w
wdNm
6
3
(16)
A parametric study was carried out for four droplet sizes (0.3, 0.5, 1.0 and 1.3
mm) and two assumed cloud heights (1 and 2 meters). They found that droplet sizes
required to warm up an LNG cloud to the point of its neutral buoyancy were achievable
by commercial spray nozzles operating at reasonable pressures of 4 to 7 bar. In addition,
the droplets must be as small as feasible and applied as close as possible to the LNG
source as per their calculations. Fig. 15 shows the results of the parametric study
conducted by Atallah et al. (1988).
Fig. 15. Effect of water drop size on heat transfer by water spray.
0
200
400
600
800
1000
1200
0 0.2 0.4 0.6 0.8 1 1.2 1.4
He
at t
ran
sfe
r pe
r u
nit
mas
s o
f w
ate
r Q
/m, k
J/kg
Spray droplet diameter, mm
1m Cloud Height
2m Cloud Height

48
Arthur D. Little, Inc. (1974) evaluated several LNG vapor control methods and
considered upward water curtains as one of those methods. The upward spray was
evaluated with regard to warming LNG vapor clouds. A gross heat balance was the basis
for the evaluation. They determined that to bring an LNG vapor cloud, vaporized from
104 to 15x104 gpm LNG spilled in a soil floored 91.44 m by 91.44 m (300 ft by 300 ft)
dike with 6.3 m (20.6 ft) wall, to neutral buoyancy point (165 K), a water curtain must
transfer 30,000 to 50,000 Btu/s heat. Then, the corresponding water requirement would
be 1300 to 2200 gpm, assuming all of the water would transfer heat to the cloud. This
result was fully dependent upon other heat balance assumptions. Also, they determined
the optimal water droplet size to be in the range of 0.3 to 0.4 mm in diameter, for which
the upward spray would only reach 0.9 to 1.2 m.
2.5.3 Research Gaps
Previous work has confirmed that the water curtain represents one promising
technique to mitigate the hazards of an accidental LNG release. However, it is not clear
from such work how to design an effective water curtain. It is also true that at this time
there is no simple set of optimum parameters, rather there will be a specific set of design
parameters for the water curtain to be effective for each particular type of circumstances
(Harris, 1981). As there are wide differences in nozzle and design variables, some
researchers believe that for each orientation, a unique combination of nozzle type,
spacing, orientation and water pressure can provide equally effective performance. The
effectiveness of water curtains can also be affected by the LNG source and wind

49
velocity. The rate of LNG vaporization also will increase if water droplets are deposited
on the LNG spill; thus, the effectiveness of the water curtain may be affected.
Minimizing water consumption and draining water are another two factors in designing a
water curtain system. So, more studies are needed to determine the main controlling
factors in designing an effective water curtain for the purpose of controlling LNG vapor
clouds.
50
3 EXPERIMENTAL DEVELOPMENT*
3.1 Introduction
The effectiveness of water curtain to disperse any vapor cloud depends on its
own characteristics, unique properties of the vapor cloud as well as on the environment.
Therefore development of comprehensive and authentic design guidelines for water
curtain to mitigate LNG release require a thorough understanding of the underlying
physical phenomena from a reasonable amount of research especially experimental
works. The purposes of this research are to (i) study the interaction of representative
types of water curtains with real vapor clouds produced from LNG spills, and (ii)
determine the effectiveness of the water curtains in controlling the LNG cloud. The
research plan includes multiple sets of outdoor field experiments with different types of
upward water curtains and LNG release. The overall experimental methodology is
developed according to the basic scientific investigation procedure which follows 4
____________
* Parts of this section are reprinted with permissions from (1) “Experimental Study of
Effective Water Spray Curtain Application in Dispersing Liquefied Natural Gas Vapor
Clouds” by Rana, M. A., Cormier, B. R., Suardin, J. A., Zhang, Y. and Mannan, M. S.,
2008. Process Safety Progress, 27 (4), 345-353, Copyright [2008] by John Wiley &
Sons, Inc., and (2) “Use of Water Spray Curtain to Disperse LNG Vapor Clouds” by
Rana, M. A., Guo, Y. and Mannan, M. S., 2009. Journal of Loss Prevention in the
Process Industries, 22, 707-718, Copyright [2009] by Elsevier Ltd.
51
steps: (1) identification of the variables; (2) design of the experiments; (3) careful
observation and measurements; and (4) interpretation of experimental data. The
experiments for this research are designed based on the previous experiments,
experiences and preliminary calculations.
3.2 Experiment Facility
Outdoor experiments are designed to spill LNG onto confined land and water.
The individually or combined use of different types of water spray curtains to control the
LNG vapor cloud are tested. Experiments are carried out in the LNG test facility at the
Brayton Fire Training Field (BFTF) of Texas Engineering Extension (TEEX) Service at
Texas A&M University, College Station. Located adjacent to the Texas A&M
University campus, the 120-acre training field is the largest live-fueled, firefighter
training facility in the world and provides realistic, large-scale and hands-on emergency
response and fire training. The field is equipped with 132 props or training stations and
21 live-fire props (TEEX, 2009). A liquefied natural gas (LNG) emergency response
training facility has been constructed in the training school to conduct hands-on spill
control and fire suppression training to personnel involved in LNG production,
transportation, storage, and response activities.
The Mary Kay O'Connor Process Safety Center of Texas A&M University has
been involved in research on LNG safety and mitigation system since 2005. One of the
main focuses of the research is to study water curtain application to suppress LNG
vapor. The Mary Kay O’ Connor Process Safety Center is using the LNG training

52
facility of BFTF as well as the help of the experienced training personnel to conduct
LNG spill experiments. The LNG training facility has three concrete containment-pits,
and one L-trench, described as below:
i. Two 1.22 m (4ft) deep pits below the ground with areas of 3m x 3m (10ft x10ft)
and 10m x 6.7m (33ftx22 ft), called Small Pit (Pit 1) and Large Pit (Pit 2)
respectively
ii. One L-shaped trench (L-trench) used to simulate the trenches whose purpose is to
divert any LNG spills into the containment pits
iii. One 2.44 m (8ft) deep pit (1.22 m below and 1.22 m above the ground) with an
area of 6.7 m x 6.7 m (22 ft x 22 ft) called Marine Pit (Pit 3). This pit includes a
high dike wall, typical of the containment facilities used during LNG offloading
The flat ground of the LNG facility is also made of concrete. Photographs of the LNG
training facility area are shown in Fig. 16 and Fig. 17.

53
1. Small Pit (Pit 1): 3.05m×3.05m×1.22m 2. Large Pit (Pit 2): 10.06m×6.71m×1.22m
3. L Trench 4. Marine Pit (Pit 3): 6.71m×6.71m×2.44m
Fig. 16. Aerial view of the LNG training facility. Adopted from Suardin (2008).
Fig. 17. North side view of the LNG training facility.
123
4
1. Small pit : 3.05 m x 3.05 m x 1.22 m
4. Small pit : 6.71 m x 6.71 m x 2.44 m
2. Large pit (65 m2 pit) : 10.06 m x 6.71 m x 1.22 m
3. L-Trench

54
To ensure safety within the facility, a series of water curtains are installed around
the LNG training site to control the dispersion of spilled LNG. Three water monitors (or
hydrants) are also installed in three corners of the LNG props. The Brayton Field LNG
facility is equipped with a 20.3cm (8") water pipe loop. Sufficient water supply is
available during an LNG training workshop or a spill test, from the city water supply,
with the aid of a pump powered by a pumper truck. Additional use of the pumper truck
confirms adequate water supply to operate multiple water curtain heads and water
monitors simultaneously when necessary. Fig. 18 shows a detailed diagram of the
facility layout.
Fig. 18. LNG training facility layout. Courtesy of Brayton Fire Training Field.

55
Four open path detectors are permanently installed around the LNG training
facility to detect any methane cloud dispersed outside the perimeter. These four
“Searchline Excel IR” open path detectors are installed on four separate fixed concrete
poles (South, East, North and West) in four corners of the field. Each open path detector
is constituted of two parts, sender and receiver. The sender part of one detector mounted
on one pole sends a laser beam to a receiver installed on another pole. Because of laser
beam, the detectors need to be fixed on poles. Any hydrocarbon gas cloud crossing the
path of laser beam changes the intensity of the laser beam and this change in intensity is
used to estimate the linear concentration of the cloud along the open beam path. The
measurement unit of these open path detectors is “% LFL (/LEL) per meter” of methane.
Fig. 19 shows photographs of a open path detector.
Fig. 19. Searchline Excel IR open path gas detector.

56
A 53 meters long insulated cryogenic pipe line is installed near the LNG training
field. During a spill an LNG tanker truck is usually connected to the end of the pipe line
which is far away from the field boundary. LNG flow rate in the pipe line is controlled
by the valve of the LNG tanker and the flow from the tanker through the line is gravity
pressure driven. Normal practice is to add a few psi pressures inside the truck to speed
up the process of discharge. The added pressure is obtained by boiling LNG inside the
tanker. There is no system to pre-cool the delivery pipe line prior to a spill.
3.3 Field Experiments
A total of four sets of LNG spill experiments have been conducted so far from
the year 2006 until 2009 to determine the effectiveness of different water curtains in
dispersing LNG vapor. All of the tests were conducted in the LNG fire fighting training
facility at BFTF in presence of real medium scale LNG spills. In each experiment LNG
was spilled on confined area of either concrete land or water. Thus LNG vapor was
produced due to the vaporization phenomena. In the LNG industry, upward-pointing
water curtains are mainly used to facilitate LNG dispersion. So in the experiments
upward water curtains were considered and placed downwind of the LNG release
location. The extent of LNG vapor concentration and temperature change by a water
curtain are studied to determine the effectiveness. The experiments also focused on the
effects of significant parameters, such as size, location, terminal height and width of a
certain type of water curtain on the dispersion of LNG vapor cloud. Table 3 shows list of
the field experiments.

57
Table 3. Summary of LNG spill experiments with water curtains.
Field
Expt.
Spill
Location
Spill
Surface
Water Curtain Measurement
Type Nozzles Tests
April 2006 Marine Pit
(Pit 3) Water
Flat Fan
(upward) 3 1
LNG flow
Gas conc.
Weather
November
2007
Flat
Ground Concrete
Full Cone
(upward) 7 2
LNG flow
Water flow
Water pressure
Gas conc.
Gas temp.
Water (curtain)
temp.
Weather
Flat Fan
(upward) 1 2
March
2008 Box Concrete
Full Cone
(upward) 8 1
LNG flow
Water flow
Water pressure
Gas conc.
Gas temp.
Water (curtain)
temp.
Concrete temp.
Weather
Flat Fan
(upward) 1 1
March
2009 Pit 1 Water
Full Cone
(upward) 8 1
LNG flow
Water flow
Water pressure
Gas conc.
Gas temp.
Water (curtain)
temp.
Water (spill)
temp.
Weather
Flat Fan
(upward) 1 1
Full cone
Mist
(downward)
6 1
Combined 15 1

58
3.3.1 Experiment: April 2006
3.3.1.1 General Description
On April 20, 2006, LNG spill tests was conducted by spilling LNG onto water
surface to test LNG vapor dispersion (natural) and then effectiveness of water curtain
and foam to disperse LNG vapor. The test was conducted in the Marine Pit (Pit 3 in Fig.
16 and Fig. 17 ) by filling it with water up to the top (2.3 m deep water pool). LNG was
delivered on the top of the water surface in the middle of the water pool. Fig. 20 shows a
photograph of the marine pit used during the test.
Fig. 20. LNG spill location in 2006 experiment (marine pit).
This experiment was considered to be unconfined LNG spill on water, because the
pit geometry did not constrain the vapor cloud migration. The experiment consisted of
three phases:

59
1. Phase (a) when LNG was continuously spilled on water and no mitigation measures
were applied to control the vapor dispersion;
2. Phase (b) when LNG was continuously spilled on water and water curtains were used
to control the downwind vapor dispersion; and
3. Phase (c) when LNG was continuously spilled on water and hi-expansion foam were
applied on LNG pool to suppress the vapor dispersion.
This research only focuses on the phase (b) of the experiment as it is the main interest of
the research. In phase (b) the effectiveness of current methods for LNG spill mitigations
such as water curtains were studied. Three spray nozzles already installed in the south-
west side of the LNG training field, were used in the. These spray nozzle heads produce
flat fan patterned water spray. They are called “Hydoshield HSC” and are manufactured
by Angus (Fig. 21).
Fig. 21. Angus Hydroshield HSC water spray head.

60
3.3.1.2 Setup
The effect of the mitigation systems in changing the methane concentration in the
cloud (%LFL levels) were studied by detecting the gas concentrations downwind of the
cloud before and after the activation of the mitigation system. Sixteen “Searchpoint
Optima Plus” hydrocarbon point gas detectors were used for the gas detection purpose.
Eight tripod poles were used to mount the detectors and on each pole, two detectors were
mounted at 0.3m (1ft) and 1.2m (4ft) elevations. The poles were arranged at different
downwind distance from the spill area during the experiment. The measurement range of
these point gas detectors is 0-100 %LFL of LNG (/methane) concentration. Two
additional hydrocarbon point gas detectors were placed at a higher elevation above the
water surface. The experimental setup for this phase is shown in Fig. 22 and Table 4
shows the gas detector identification number (ID) on each tripod pole.
Fig. 22. Setup of 2006 experiment.
-11-10
-9-8-7-6-5-4-3-2-10123456789
1011
-11 -10 -9 -8 -7 -6 -5 -4 -3 -2 -1 0 1 2 3 4 5 6 7 8 9 10 11
Do
wn
win
d d
ista
nce
, (m
)
Crosswind distance, (m)
Poles
GD17
GD18
P-1
P-3P-2
P-4
P-5
P-8 P-7P-6
North
LNG spill line
Open Path GD: south end
Marine Pit
filled with Water
water curtain heads

61
Table 4. Location of gas detectors on poles: 2006 experiment.
Pole ID
Gas Detector (GD) ID
Elevation =0.3m Elevation =1.2m
1 15 16
2 14 13
3 6 5
4 2 1
5 12 11
6 8 7
7 10 9
8 4 3
The fixed open path gas detectors installed in the LNG field were also used in the
experiment. Fig. 23 below shows the location of the fixed open path gas detectors in the
field.
Fig. 23. Location and ID of the four open path gas detectors (E, N, W and S).
Large
Pit
Small
Pit
Marine
Pit
Open Path Gas Detector (GD) Location
NW
SW S
W
NE
GD WN
GD EN
GD ES
GD WS

62
3.3.1.3 Procedure
In the experiment, LNG was spilled on water surface at low flow rate and vapor
cloud concentrations were measured in both upwind and downwind locations of the
water curtain region, without and with spray activation. Other than gas concentration,
LNG pool temperature and weather data were also recorded. A weather station, provided
by Texas Mesonet at TAMU, was used to measure wind direction and wind speed at two
heights of 2 and 10 meters. The weather station was mounted on the south-east side of
the LNG test facility boundary. Humidity and atmospheric pressure data were collected
as well. The weather data were collected and stored every three seconds.
3.3.2 Experiments: November 2007 and March 2008
3.3.2.1 General Description
Two sets of similar outdoor spill experiments were conducted on November 16,
2007 and March 25, 2008. Both of the experimental sets were conducted on the flat
concrete ground of the north-east side of the Marine Pit, by spilling LNG on concrete. In
each set of experiments multiple tests were conducted. The scenario of continuous LNG
flow through a pipe on the concrete ground was simulated in both the experiments by
supplying LNG continuously from a tanker truck to the spill location with a flexible
discharge hose connected to the insulated, fixed Aluminium pipe line. One cryogenic
volumetric flow meter was installed close to the truck to measure LNG flow rate. Fig. 24
shows the location of these tests.

63
Fig. 24. Location of 2007 and 2008 experiments. Reprinted from Rana et al. (2008).
Two types of portable upward directed spray curtains were employed in both the
experiments. One was constructed with several 60º full cone, spiral, (1-inch) nozzles
installed on a carbon steel pipe. These nozzles are manufactured by BETE Fog Nozzles.
The other one was Angus Hydroshield HSC 180º flat fan spray head. This portable water
curtain device is available through the Brayton Fire School. During the experiments, the
water curtains were placed at specific downwind distances from the LNG spill, allowing
some free area between the spill location and the water curtain. Water was supplied from
the water line to the water spray curtain with 64 mm (2.5 inch) OD fire hoses. Flow
meters and pressure gages were connected at the exit of the fire hose to measure the
volumetric flow rate and pressure of water at the inlet of the curtain during the tests.
D
C
B
A
52.43m long, 76.2 mm (3")
OD, insulated LNG
Discharge Pipe (Al)
LNG Truck
Position
Water
Curtain Test
Area
Pumper Truck
& Pump
LocationWater Drainage
20.3 cm (8")
Water Line
Water Monitor/
Hydrant
50.8 mm (2") Water
Discharges, Valves & Water
Spray Heads
N
safe area outside
the boundary
LNG Discharge Line

64
Water flow was turned on and off with ball valves connected to the water supply line.
Fig. 25 shows the photographs of the water curtains used the experiments.
Fig. 25. Photographs of water spray nozzles used in 2007 and 2008. Left: full cone
spray nozzle, right: flat fan spray nozzle. Reprinted from Rana et al. (2009).
In 2007, the LNG spill area was enclosed with 1.52m × 1.52m (5ft × 5ft) inner
and 1.83m × 1.83m (6ft × 6ft) outer wooden frames. The space between the frames was
filled with wet sand during the tests. The intention of using wet sand was that when LNG
contacted wet sand it would freeze immediately and stop liquid LNG flow out of the
spill area through the gaps. LNG was discharged at the spill location with a flexible
discharge hose (15.2 m long, 7.6 cm OD), connected to the 52.4 m long pipe line from
the tanker truck. Fig. 26 shows the photograph of the enclosed spill area.

65
Fig. 26. Enclosed spill area in 2007 experiment.
In 2008, LNG spill location area was changed to a square shaped enclosed box.
The spill box was a 1.52m × 1.52m × 0.152m (5ft × 5ft × 6in) box with 1.52m × 0.152m
wooden frames as the side walls and 2 inch thick concrete as the base. In this test, LNG
was discharged inside the spill box with an insulated L-shaped discharge pipe (18 cm ID
2.1 m long) connected to the Aluminium pipe line (52.4 m long and 10.16 cm OD). Fig.
27 shows a photograph of the enclosed spill area for 2008 experiment.
Fig. 27. Enclosed spill area in 2008 experiment.

66
3.3.2.2 Setup
The effect of the mitigation systems in changing the methane concentration (%
v/v) and temperature in the cloud were studied by detecting the concentrations and
temperature downwind of the cloud before and after the activation of the water curtains.
In 2007, 34 IR point gas detectors and 32 type K thermocouples were used and installed
on 14 tripods at different heights to measure the methane gas concentration at 0.5 m, 1.2
m and 2.1 m elevations and temperature of air-methane mixture at 0.5 m, 1.0 m and 2.0
m elevations. The sensor placement heights were chosen on the basis of prior simulation
and previous research. During the tests, the tripods were placed at different downwind
and crosswind distances from the LNG spill area to measure the concentration and
temperature both up and downstream of the water curtain. The instruments were placed
according to the predicted wind direction of the experiment day. The water curtain was
positioned downwind from the spill area and the location was identified considering the
flow pattern of full cone nozzles to avoid any water spillage onto the LNG spill area
during tests. One cryogenic turbine meter, two flow sensors, two pressure transducers
and three weather stations were the other major equipment used in tests. Fig. 28 shows
tripod and water curtain placements during the 2007 tests.

67
Fig. 28. Overall setup of 2007 experiment. Top: schematic, bottom: photograph.
Reprinted from Rana et al. (2009).
The wind velocity, direction, temperature, humidity and heat index were
measured in 2007 with three weather stations. Two stations were placed in two separate
positions, 2.1m above ground-level and the third was installed around 15.2 m east of the
test ground at 9.1 m height. Hydrocarbon and IR cameras were used to observe the
actual dispersion of invisible flammable hydrocarbons (mainly methane). The cameras
WC 1
WC 2 Water
supply
Water spray
curtain (WC)
y0 0 my1 0.8 m
y2 1.2 m
y3 3.7 m
y-1 -0.8 m
y-2 -1.2 m
y-3 -3.7 m
1
2
3
4
56
7
8
9
10
1112
13
14
+y
-y
LNG spill
Concrete
ground
x0
0 m
x1
1 m
x2
3.3 mx3
5.5 m
x4
7.0 mx5
11.3 m
x6
13.7 m+x
+z
Ground z1 0.5m
z2 1.2m
z3 2.1m
z
Position of sensors in each poleWIND (N)
Tripod pole for gas &
temperature sensors
C C
Camera: regular digital, hydrocarbon (IR)
Weather station 2 (2 m)
Weather station 3 (1.2 m)

68
were positioned at 90º to each other, so that they can capture the whole dispersion
process during the tests.
The detectors were not physically installed on the tripods, but were installed in a
wooden vacuum chamber. Teflon tubes were used for the purpose of flowing methane
from the field to the detectors. One end of each tube was connected to a gas detector and
the other end was placed on the tripod pole. A vacuum pump was used to pull LNG
vapors at 0.3 l/min to the detector through the tubes and then released to the
environment. Table 5 shows the position of tripod poles and gas detectors and
temperature sensors on those poles.
Experiment of 2008 experiment was a repetition of previous experiment with
some modification in the spill location, LNG discharge pipe and water curtain pipe
design. In 2008, 40 IR point gas detectors and 43 type K thermocouples were used and
installed on 14 tripods at different heights to measure the methane gas concentration and
temperature of air-methane mixture at 0.5m, 1.2m, 2.1m and 3.4m above ground. Like
the previous year’s experiments, the detectors were not actually installed on the tripods.
Gas detectors were placed in a steel cabinet in 2008 experiments instead of a wooden
chamber.

69
Table 5. Location of tripod poles and positions of gas detectors and thermocouples
on poles: 2007 experiment.
Pole
no.
Downwind
position,
x (m)
Crosswind
position,
y (m)
Gas Detector ID
(GD #)
Thermocouple ID
(TG #)
Elevation, z (m) Elevation, z (m)
0.5 1.2 2.1 0.5 1.2 2.1
1 1
-1.2 22 21 --- 3 4 ---
2 1.2 24 23 --- 1 2 ---
3
3.3
-3.7 25 26 36 5 6 7
4 -1.2 27 28 35 8 9 10
5 1.2 30 29 39 11 12 13
6 3.7 38 37 40 14 15 16
7 5.5
-1.2 --- --- --- 29 30 ---
8 1.2 --- --- --- 31 32 ---
9
11.3
-3.7 13 12 11 17 18 19
10 -1.2 01 15 07 20 21 22
11 1.2 19 18 17 23 24 25
12 3.7 20 02 10 26 27 28
13 13.7
-1.2 06 34 04 --- --- ---
14 1.2 08 32 31 --- --- ---
Fig. 29 shows the experimental set up and the sensors, detectors and water
curtain placements for 2008 experiment. The figure is followed by Table 6, which shows
the position of tripod poles and gas detectors and temperature sensors heights on the
poles.

70
Fig. 29. Overall setup of 2008 experiment. Top: schematic, bottom: photograph.
Ground level0.5m
1.0m
2.1m
21
4
5
6
7
0m
0.9m
7.0m
12.5
16.2m
z
-3.1m
3.1m
-1.5
-0.8m0m
0.8m
1.5m
y
x
z
Water Spray
Curtain
Concrete
ground
3
8
9
11
13
1410
12
21.6
3.4m

71
Table 6. Location of tripod poles and positions of gas detectors and thermocouples
on poles: 2008 experiment.
Pole
no
Downwind
position,
x (m)
Crosswind
position,
y (m)
Thermocouple ID
(TG #)
Gas Detector ID
(GD #)
Elevation, z (m) Elevation=z (m)
3.4 2.1 1.0 0.5 3.4 2.1 1.0 0.5
1
0.9
-1.5 - 38 39 40 - 2 4 3
2 0 - 42 43 41 - - - -
3 1.5 - 37 36 35 - 8 7 9
4
12.5
-3.1 - 10 9 8 - 6 10 5
5 -1.5 1 34 33 - 27 28 29 -
6 1.5 - 25 27 26 - 16 14 15
7 3.1 - 19 21 20 - 11 12 13
8
16.2
-3.1 - 6 7 5 - 22 26 25
9 -1.5 3 4 2 - 20 19 1 -
10 1.5 - 24 23 22 - 24 21 23
11 3.1 - 30 28 29 - 18 17 30
12
21.6
-1.5 - 32 31 14 - 31 33 32
13 0 15 13 11 18 34 40 37 36
14 1.5 - 17 16 12 - 38 35 39
To measure the evaporation of LNG, five N-type thermocouples were installed in
the spill area (box) inside the concrete, in 2008. Fig. 30 shows the thermocouple set up
diagram.

72
Fig. 30. Thermocouple placement inside the concrete base for 2008 experiment.
Top: top view, bottom: side view.
3.3.2.3 Procedure
Four similar spill tests were conducted in 2007 to evaluate the effectiveness of
two types of water spray curtains in controlling an LNG vapor cloud. Each curtain was
tested twice with a separate spill. The first two tests were conducted with a full cone
0.43 m
0.58 m
1.45 m
0.43 m0.71 m
1.52 m
TN-1
TN-2 TN-3
TN-4
TN-5
Wooden
Bar
Concrete
Base
N-Type
Thermocouple
x d
ow
nw
ind
dis
tan
ce
0 m
y crosswind distance 0 m
0.43 m0.71 m1.52 m
TN-1TN-4 TN-5
Wooden Bar
Concrete Base
1.27 cm
3.81 cm
2.54cm
0.15 m
5.08 cm
0 m
0 m
y crosswind distance
z height

73
spray curtain. Then it was replaced with the Hydro-Shield flat fan spray and two more
similar tests were conducted.
Each test started with continuous release of liquid LNG onto the enclosed spill
area. Initially only LNG vapor started to emerge from the hose and within a couple of
minutes liquid stared to flow from the hose. As soon as the liquid touched the concrete
ground it vaporized and dispersed naturally towards the prevailing wind direction.
Several minutes after start of the LNG release, the water spray curtain was turned on to
disperse the cloud forcefully. The flow of LNG was also continued for a few minutes
during forced dispersion. When the LNG pool reached about 5 cm to 8 cm (2" to 3")
height, the LNG flow was turned off while continuing the water curtain operation. The
curtain was kept on until the visible white cloud disappeared.
In 2008, experiments started with continuous release of liquid LNG onto the
enclosed spill area (box). Spill was continued for several minutes and when there was a
liquid pool in the spill area, the LNG release discontinued. Natural dispersion data were
collected during the whole time. In this natural dispersion test none of the water curtains
were used. After the natural dispersion test, tests with the full cone water curtains
started. LNG was again spilled in the spill box and several minutes after the start of the
LNG release, the full cone water spray curtain was turned on to disperse the cloud. The
flow of LNG was also continued for a few minutes during the forced dispersion by water
curtain. The LNG flow was turned off after several minutes while continuing the water
curtain operation. The curtain was kept on until the visible white cloud disappeared. The
last test was with the fan type curtain and the procedure was similar to the second test.

74
3.3.3 Experiment: March 2009
3.3.3.1 General Description
The fourth LNG spill experiment was performed on March 5, 2009. This time the
Pit 1 (3.05 m × 3.05 m × 1.22 m) was filled with water up to 1.2 m and LNG was spilled
on top of the water surface. LNG was spilled on water to create steadier vapor flow from
the spill area. To confine the LNG spill to a smaller area, four wooden frames were used
to make an enclosed area of dimension 1.52 m × 1.52 m × 0.31 m on the water. LNG
was discharged at the spill location with the similar pipe line configuration used in 2008
experiment. The two sides of LNG spill area and LNG vapor path were blocked with 1.2
m high wooden walls to guide the vapor straight to the water curtain by preventing LNG
vapor to drift crosswind. Fig. 31 shows the photographs of the enclosed spill area.
Fig. 31. Spill area of 2009 experiment.

75
Three types of portable spray curtains were employed. Two of them were the
similar upward directed water curtains used in previous experiment of 2008 and the third
one was a downward spray which produces much smaller droplets. The downward spray
was constructed with six spray nozzles (½-inch TF 24 NN BETE Fog Nozzles) installed
at 3.05 m height. Each of these nozzles produces 60º full cone type spray and its working
pressure and flow rate were much lower than the other two types. So the nozzles of this
water curtain are named here mist full cone nozzles.
3.3.3.2 Setup
36 IR point gas detectors were used and installed on several tripods at different
heights to measure the methane gas concentration at 0.5 m, 1.0 m and 2.0 m above
ground. Four portable LFL gas meters were also used to identify LFL distance far
downwind from the spill area. The heights were chosen based on the previous research.
Six type-K thermocouples were installed to measure the water curtain temperature at
three different heights. Fig. 32 shows the experimental set up of 2009 experiment.

76
Fig. 32. Overall setup of 2009 experiment. Top: schematic, bottom: photograph.
Table 7 shows the positions of tripod poles and gas detectors and temperature
sensors’ locations on the tripod poles. Table 8 shows the position of the water curtains.
.
2.5 5.0 7.5 10.0 12.5 15.0 17.5 20.0-2.5 0
Downwind distance, x (m)
2.5
5.0
7.5
0
-2.5
-5.0Cro
ss w
ind
dis
tan
ce, y (
m)
P01
P03
P02P04
P05
P06
P07
P08P09
P10
P11
P12
P13
P14
P15 P16
Water Curtain 1: fullcone up
Water Curtain 2: flatfan up
Water Curtain 3:
down P: Tripod Pole
wall

77
Table 7. Location of tripod poles and positions of gas detectors and thermocouples
on poles: 2009 experiment.
Pole
no.
Downwind
position,
x (m)
Crosswind
position,
y (m)
Gas Detector ID
(GD #)
Thermocouple ID
(TG #)
Elevation, z (m) Elevation, z (m)
0.5 1.2 2.1 0.5 1.2 2.1
1
0
1.5 1 2 3 -- -- --
2 0 11 8 7 -- -- --
3 -1.5 14 12 13 -- -- --
4 2.6 0 -- -- -- 1 2 3
5 8 -0.5 33 -- 32 31 32 33
6
9.7
-3 37 34 35 -- -- --
7 -2 16 36 4 -- -- --
8 0 22 24 23 -- -- --
9 1.3 39 26 29 -- -- --
10 2 40 25 10 -- -- --
11 4.4 28 31 9 -- -- --
12
12
0 17 -- 18 -- -- --
13 2.5 19 -- 30 -- -- --
14 4.4 20 38 27 -- -- --
15 14.4 0 Port*
02
Port
03
Port
04 -- -- --
16 18.7 0 Port0
1 -- -- -- -- --
*Port #: portable gas detector (LFL meters) identification number.
Table 8. Location of the water curtains: 2009 experiment.
Water Curtain Downwind distance ,
x (m)
Full cone upward water curtain 4.75
Flat fan upward water curtain 5
Mist type full cone downward water curtain 2.5
Twelve K-type thermocouples were installed in the spill area in two bars to
measure the evaporation rate of LNG. Each bar contained six thermocouples and

78
distance between two adjacent thermocouples was 3.175 cm (1.25 in). These
thermocouples were installed to cover both under and above the water surface
temperature. Fig. 33 shows the thermocouple set up diagram.
Fig. 33. Thermocouple placement inside the spill area for 2009 experiment.
Top: top view, bottom: side views.
3.3.3.3 Procedure
Test started with continuous release of liquid LNG onto the water surface. Spill
was continued for several minutes and natural dispersion data were collected during this
time. As no water curtains were used in the first test, it is called natural dispersion test.
TP1TP2
TP3
TP5
TP7
TP9
TP11
TP4
TP6
TP8
TP10
TP12
0 -0.25 -0.75-0.501.00 0.75 0.250.50
y (crosswind, meter)
0
6.35
12.7
19.05
25.4
-6.35
-12.7
z (
he
igh
t, c
m)
water Wooden frame
Bar 1 Bar 2
TP1TP2
TP3
TP5
TP7
TP9
TP11
TP4
TP6
TP8
TP10
TP12
0-1.00 -0.75 -0.25-0.50
x (downwind, meter)
0
6.35
12.7
19.05
25.4
-6.35
-12.7
z (
he
igh
t, c
m)
-1.25-1.50

79
Continuing the natural dispersion test for several minutes the tests with the water
curtains started. The water curtain tested first was the full cone water curtain. The water
curtain test procedure was similar to previous years’ tests: at first LNG was released
continuously, then after several minutes the water curtain was turned on. Full cone
curtain test was followed by two more tests with flat fan and mist cone water sprays with
similar procedure. After testing the mist cone spray, a final test was conducted by
activating all of the curtains altogether. The intention of this test was to observe the
effects of the combined curtains on LNG vapor cloud. During the whole test period LNG
spill was turned on and off to maintain a steady flow from the pool.
3.4 Equipment and Data Acquisition
Gas concentration, gas, water curtain and spill surface temperature, LNG and
water flow rate and water pressure were measured in the experiments with multiple gas
detectors, K and N type thermocouples, cryogenic and regular flow sensors and pressure
transducers. Table 9 shows the list of equipment used in the experiments.

80
Table 9. Types of equipment used in the experiments.
Measurement Equipment Experiment
Gas concentration Gas detector (%LFL/m)
Gas detector (%LFL)
Gas detector (% v/v)
Port detector (%LFL)
2006
2006
2007-2009
2009
Gas temperature Type K-thermocouple 2007-2009
Water curtain temperature Type K-thermocouple 2007-2009
Spill surface temperature Type K-thermocouple
Type N-thermocouple
2009
2008
LNG flow Cryogenic flow meter (volumetric) 2007-2009
Water flow Regular flow sensor (volumetric) 2007-2009
Water pressure Pressure transducer 2007-2009
Weather Weather station
Anemometer
2006-2009
2007-2009
3.4.1 Gas Detection
Four different types of gas detectors were used to measure methane gas
concentration in the air in different experiment. The detectors are IR open path detectors,
IR point gas detectors (%LEL), IR point gas detectors (% v/v) and portable gas
detectors. The IR open path detectors were only used in 2006 experiment and
information about the detectors are already provided in section 3.2. The IR point gas
detectors (%LEL) and (% v/v) are actually similar type detectors only deference is in
their measurement range. In 2006 experiment the measurement unit of % LEL (methane)
was used and in rest of the experiments, multiple IR point gas detectors in the
measurement unit of 0-100% v/v (methane) were used. These detectors are “Searchpoint
Optima Plus Infrared Pint Gas detector” by Honeywell Analytic. They are designed for
use in potentially hazardous areas where it provides gas and vapor detection which is
free from poisoning and independent of the presence of oxygen. Searchpoint optima plus

81
is a micro-processor controlled, infrared gas detector with comprehensive built-in self
diagnostic and fault finding facilities. It produces output signal of 4 – 20 mA with power
requirement of 5 watts per detector (Honeywell, 2005).
The “Searchpoint Optima Plus” is originally designed for industrial application
where detecting methane leak and its concentration in the range of 0% volume by
volume (v/v) to 5% v/v (Low flammability level, LFL) is important. Since the
experiment is to measure the methane concentration up to 100 % v/v, “Searchpoint
Optima Plus” was be modified to measure 0% v/v to 100% v/v methane concentration.
The application of this modified point gas detectors required the suction of methane gas
sample by using vacuum into the detector gas cell. This cell is able to measure high
concentration methane gas. While it is possible to install them directly at the field for the
experiment, this configuration is not very flexible due to the size and the weight of
detectors. Again as LNG vapor dispersion movement is very dynamic depending the
wind speed and direction, the detector set up needs to be flexible to relocate easily
depending on the wind direction during an experiment. So it is recommended to gather
all “Searchpoint Optima Plus” in one place and then pull the measurement gas from
different location with tubes into the detectors (Suardin, 2008). To reduce the
uncertainty, each “Searchpoint Optima Plus” should be connected with the same type
and length of tubing. That is why, though the detectors were placed in the gas cloud in
the 2006 experiment, the detectors were not physically placed in the gas cloud in other
experiments. They were installed in a wooden vacuum chamber (in 2007) or metal
cabinet away from the gas cloud. Teflon tubes were used for the purpose of flowing

82
methane from the field to the detectors. One end of each tube was connected to a gas
detector and the other end was placed on the tripod pole in the field. A vacuum pump
was used to draw LNG vapors at 0.3 l/min to the detector through the tubes and then
released to the environment. Fig. 34 and Fig. 35 show the gas detector connection and
photograph of detector chambers.
Fig. 34. IR gas detector-Teflon tube connection.
Fig. 35. Gas detector installation in chambers. Left: 2007 experiment, right: 2008
& 2009 experiments.
Methane
Gas IN
To tripod
To vacuum pumpTeflon tube
Teflon tube
IR Point
Gas
Detector
Tripod
Gas Out
Gas In

83
Four portable gas detectors (MiniMax X4) manufactured by Honeywell
Analytics were also used in 2009 experiments. The application of these detectors is to
measure gas concentration at a certain point where the point gas detectors are not
available as well as for the safety of the person conducting the experiment. MiniMax X4
has the capability to store data using a regular memory card and the data can be retrieved
later. These detectors measure methane concentration in 0-5% v/v level (% LEL).
3.4.2 Temperature Measurement
Temperature measurement was conducted by using K and N type thermocouples.
The type-K thermocouples, manufactured by Omega Engineering, were used to measure
gas temperature. These thermocouples are capable of measuring temperature as low as
173K (-100ºC) up to 373K (100ºC). Gas temperature measurement also required the
protection of the thermocouples from the surrounding, e.g. heat from the sun, wind, etc.
Thus, partial enclosure was provided around the thermocouples installed in the tripod
pole. N type thermocouples, also manufactured by Omega Engineering, were used to
measure cryogenic temperature as this type of thermocouple is more stable at extreme
temperature. The application includes the measurement of LNG pool spreading on water.
3.4.3 Flow and Pressure Measurement
Two types of flow meters were used in the experiments to measure volumetric
flow rate. The LNG flow rate was continuously measured with a cryogenic flow meter
connected between the pipe line and the discharge hose during the tests. The cryogenic

84
flow meter used was a 3-inch FTB-911 turbine meter with male NPT end fittings. It is
recommended that the meter should be placed at the beginning of the discharge pipeline.
As some of the LNG release from the truck might flash at the end of the pipe and
produced two phase flow, installing it at the end of the pipe may cause the measurement
of both liquid and vapor thus giving incorrect reading.
Water was supplied from the water line to the water spray curtain with 6.4 cm
(2½") OD fire hose. For the measurement of non-cryogenic liquid, e.g. water supply for
water curtains, non-cryogenic volumetric flow meters, FP-2540 stainless steel flow-
meter was used. DPG1000 series pressure was used for the purpose of measuring water
pressure. Both FP-2540 and DPG1000 produce 4-20 mA output. Flow meters and
pressure transducers were connected at the exit of the fire hose to measure the water
flow rate and water pressure at the inlet of the curtain during the tests. Water flow was
turned on and off with the ball valve already connected to the water supply line.
3.4.4 Weather Monitor
The meteorological conditions were measured with multiple weather stations.
Purpose of these stations was to measure the wind velocity, direction, temperature,
humidity and heat index. Weather stations manufactured by Davis Instruments were
used in 2007 to 2009 experiments. The wind speed at the test field was measured with
commercially available three axis cup and vane anemometers. This product is also
manufactured by available at Davis Instruments or at Campbell Science Inc. This type of

85
anemometer measures the wind speed directly without any signal conditioning. Signal is
then sent to computer using cable or built in wireless system.
3.4.5 Imaging
Hydrocarbon (H/C), IR and regular digital cameras were used in 2007, 208 and
2009 experiments to capture the experiments. The hydrocarbon and IR cameras were
used to observe the actual dispersion of invisible flammable hydrocarbons (mainly
methane). All of the cameras were placed away at a safer location from the visible cloud
region. Two H/C cameras were positioned at 90º to each other, so that they can capture
the whole dispersion process during the tests.
3.4.6 Data Acquisition
Gas detector, temperature sensor, flow meter and pressure gauge data were
acquired at an interval of 1 second with an Ethernet based data acquisition system and
recorded simultaneously in computers. The experiments form 2007-2009 utilized one
data acquisition system (DAS) with the exception of the weather station and
hydrocarbon imaging cameras. DaqScan 2005 data acquisition system, manufactured by
IOTECH was used. This data acquisition system is able to handle up to 896
thermocouple channels or up to 256 channels when used with other cards. As the
computer was placed at safe location, far away from DAS and sensor, the chosen DAS
was able to send data to computer from a long distance. The weather stations have built-

86
in data record system, which could save data for three days. The weather data were
transferred to computers after the experiments.
3.5 Spray Nozzle Specification
Water curtains are mainly curtains of water droplets produced from spray nozzles
at higher pressure. The sprays produced by a nozzle can be categorized by their shapes
as conical, fans, or fogs. Conical sprays can be further broken down into either full-cone
or hollow-cone sprays. In the hollow cone pattern all of the spray is located at the
surface of the cone produced by the nozzle and none of it is inside the cone. In the full
cone pattern the liquid being sprayed fills the cone pattern produced by the nozzle.
Nozzles that spray water as a sheet of liquid produce a pattern known as a fan. The fog
nozzles atomize the liquid stream into a mass of very fine droplets (CCPS, 1997).
Three types of portable curtains were used in the experiments. The first one was
the flat fan spray head where water flows out through a pipe (2 inch ID) of half circular
end, and hits a half circular flat metallic plate at the exit (Fig. 21) . Because of the
obstacle created by the flat plate, the spray head produces 180° flat fan shaped spray
pattern. This nozzle is called “Angus Hydroshield HSC”. The second one was
constructed of seven or eight 1-inch 60° full cone spiral nozzles installed in a carbon
pipe (2 inch ID). These nozzles are named TF 48 NN by BETE Fog Nozzles. Both of the
above water curtains are vertically upward directed spray (Fig. 25). The third one was
made with six ½ inch 60° full cone spiral nozzles installed in a pipe to flow downward.
These are TF 24 NN nozzles by BETE Fog Nozzles. In this report these nozzles are

87
addresses as mist-full cone nozzles. Table 3 provides information on the types of water
curtains used in the experiments.
Some of the key parameters, like (i) the flow-rate-versus-pressure characteristics
of a nozzle, (ii) the droplet size produced from a nozzle, (iii) the droplet distribution in
the spray area, and (iv) the coverage of the spray are very important to understand in
detail the role of a spray nozzle. The volume of liquid flowing through a nozzle depends
primarily on the difference in fluid pressure upstream of its orifice and the pressure into
which the nozzle discharges (normally the atmosphere). Usually nozzle manufacturers
provide this information as catalog flow rate table. The following equation is also used
to calculate the flow rates for different pressure.
𝐹𝑙𝑜𝑤 𝑟𝑎𝑡𝑒 = 𝐾 √𝑃𝑟𝑒𝑠𝑠𝑢𝑟𝑒 (16)
Here, the factor K depends on the nozzle. Fig. 36 shows the flow rate versus pressure
specification of each nozzle used in the experiments (Angus, 2005; BETE Fog Nozzles,
2007).

88
Fig. 36. Flow rate- pressure relationship of the nozzles.
The droplet size of a certain type of curtain provides a certain surface area. So
the information of the size of the droplets produced by a spray nozzle is essential as it
affects the action mechanisms. Usually conical sprays produce small to medium size
droplets and the size of droplet produced by fan nozzles are usually coarse. The full cone
nozzles (TF 48) used in the experiments can create smaller droplets of sauter mean
diameter (SMD or D32) of 580 microns. This SMD value is based on vendors’
information which was calculated at 0 m/s wind speed and 690 kPa absolute pressure.
Simulated SMD value of the mist-full cone nozzles (TF 24) is approximately 361.5
microns at 690 kPa. A nozzle actually produces a range of droplet sizes from the solid
liquid stream. Since it is inconvenience to list all the sizes produced, droplet size (in
0.00E+00
2.50E-03
5.00E-03
7.50E-03
1.00E-02
1.25E-02
1.50E-02
1.75E-02
2.00E-02
2.25E-02
2.50E-02
2.75E-02
3.00E-02
3.25E-02
3.50E-02
0 250 500 750 1,000 1,250 1,500 1,750 2,000 2,250 2,500 2,750 3,000
Flo
w ra
te, m
3 /se
c
Pressure, kPa
TF48NN
HydroShield
TF 24 NN

89
micron) is usually expressed by a mean or mean diameter. SMD or D32 is the diameter of
a droplet whose ratio of volume to surface area is equal to that of the complete spray
sample (BETE Fog Nozzles, 2007). It was observed that the drops of the flat fan spray
nozzle are almost two to two and half times larger than the full cone nozzle. So in the
research it is considered that the mean drop size of the flat fan nozzle is two and half
time larger than the mean drop size of full cone (TF 48) nozzles. The actual drop size
was not measured in the tests because of unavailability of appropriate measuring device
which could be used safely outdoor conditions in the presence of a flammable vapor
cloud. As the drop size depends based on pressure, the effect of a change in pressure (P)
on the drop size (D) can be predicted with following equation (BETE Fog Nozzles,
2007).
𝐷2
𝐷1=
𝑃2
𝑃1 −.3
(17)
Based on the above equation and drop size information from vendors and observation,
Fig. 37 was developed to realize the effect of pressure on drop size (SMD).
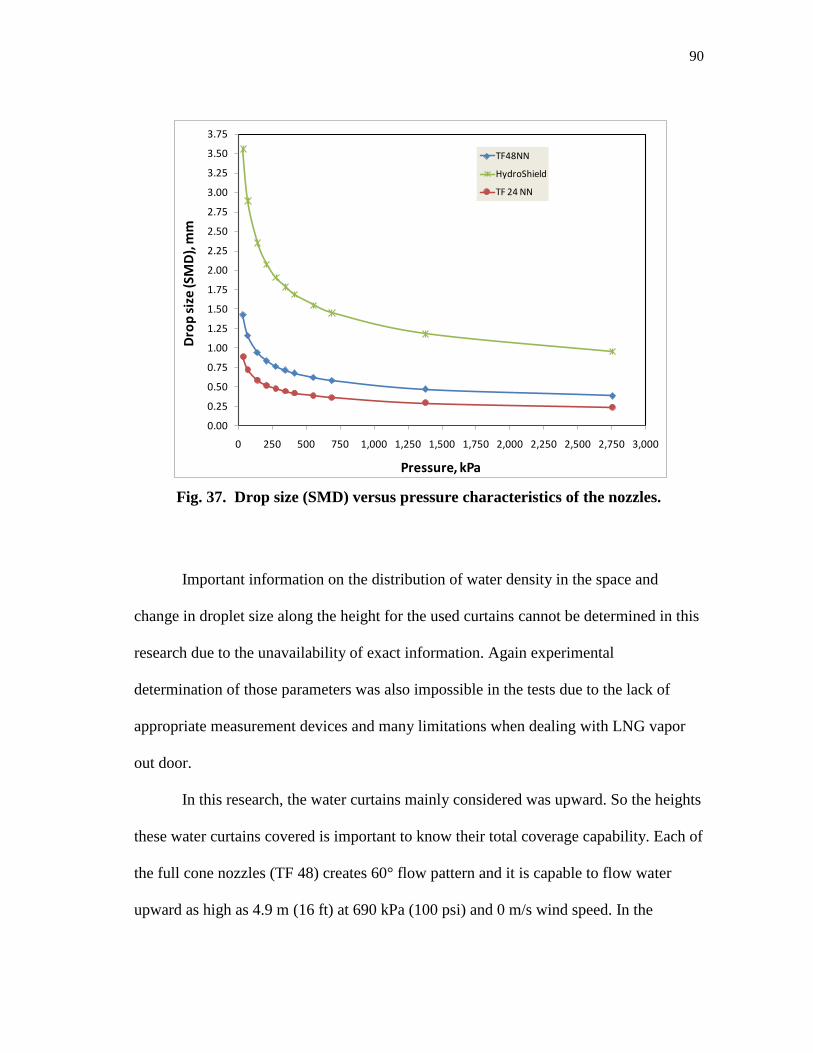
90
Fig. 37. Drop size (SMD) versus pressure characteristics of the nozzles.
Important information on the distribution of water density in the space and
change in droplet size along the height for the used curtains cannot be determined in this
research due to the unavailability of exact information. Again experimental
determination of those parameters was also impossible in the tests due to the lack of
appropriate measurement devices and many limitations when dealing with LNG vapor
out door.
In this research, the water curtains mainly considered was upward. So the heights
these water curtains covered is important to know their total coverage capability. Each of
the full cone nozzles (TF 48) creates 60° flow pattern and it is capable to flow water
upward as high as 4.9 m (16 ft) at 690 kPa (100 psi) and 0 m/s wind speed. In the
0.00
0.25
0.50
0.75
1.00
1.25
1.50
1.75
2.00
2.25
2.50
2.75
3.00
3.25
3.50
3.75
0 250 500 750 1,000 1,250 1,500 1,750 2,000 2,250 2,500 2,750 3,000
Dro
p s
ize
(SM
D),
mm
Pressure, kPa
TF48NN
HydroShield
TF 24 NN

91
experiment of 2007, the water curtain created with seven TF 48 nozzles actually covered
around 7 m (23 ft) wide, 2.9 m (9.5 ft) high. However in 2008 and 2009 tests eight TF 48
nozzles were used and divided into two pipes (4 on each) to get more pressure in each
nozzle. This modification helped the water curtain to reach up to 3.35 m (11 ft) in 2008
and 4.57 m (15 ft) in 2009. Fig. 38 shows the simulated coverage of the full cone nozzle
at 0 m/s wind speed and 690 kPa pressure.
Fig. 38. Coverage of the full cone nozzle at 690 kPa pressure. Reprinted from Rana
et al. (2009).
The fan nozzle creates 180° flat flow pattern. According to product specification
this device is capable of projecting a fan shaped water curtain covering about 22 m
0
0.5
1
1.5
2
2.5
3
3.5
4
4.5
5
-5 -4 -3 -2 -1 0 1 2 3 4 5
He
igh
t, m
Width, m
coverage at 690 kPa & 0 wind

92
crosswind distance and 6 m height at 600 kPa (Angus, 2005). Basically it forms sheets of
water and produces 0.5-1.5 m wide curtain which does not vary that much with height at
low wind speed. So its width can be considered as flat rectangular shape. Note that the
water curtain actually produced around 15.2 m (50ft) crosswind and 6.0 m (20 ft) high
coverage in the experiments. Fig. 39 shows the simulated coverage of the flat fan nozzle
at two different pressures.
Fig. 39. Coverage of flat fan nozzle at two pressures.
Upward momentum at each of the nozzle tip was calculated from the nozzle flow
rate versus pressure information, to understand the spray effects. Fig. 40 shows the
0.00.51.01.52.02.53.03.54.04.55.05.56.06.57.07.5
-14-13-12-11-10-9 -8 -7 -6 -5 -4 -3 -2 -1 0 1 2 3 4 5 6 7 8 9 1011121314
He
igh
t, m
Width, m
at 600 kPa, 0 wind
at 900 kPa, 0 wind

93
calculated momentum at the nozzle tips for two upward nozzles. As these curves are
represents momentum at the nozzle tip (z=0), the momentum along the vertical axis
would decrease with the decrease of droplet velocity. The figure also indicates that the
flat fan spray is capable of imparting more momentum to any cloud than the full cone
spray.
Fig. 40. Rate of momentum calculated at the nozzle tip. Reprinted from Rana et al.
(2009).
0
100
200
300
400
500
600
700
0 200 400 600 800 1000 1200 1400
mom
entu
m ra
te, [
kg m
/sec
/sec
]
pressure, [kPa]
FullCone
FlatFan
M = ρ Q vtip

94
3.6 Summary
Three representative water curtains were studied with real LNG spills in four sets
of out-door experiments, conducted in consecutive four years, from the year 200. All of
the experiments were conducted in the LNG training facility at Brayton Fire Training
Field. In the experiments, LNG was released either on concrete or water surface to
simulate spill from pipe and the water curtain and LNG vapor interaction phenomena
was evaluated. Each experiment consists of LNG source, water curtain, placements of
the measurement devices and meteorological measurements. The procedure was to
create natural and forced dispersion of LNG to evaluate the effectiveness of the water
spray curtain in terms of concentration and temperature change. Multiple numbers of gas
detectors, thermocouples, cryogenic flow meters, regular flow meters weather stations
were employed in each experiment to gather data. The types of water curtain used were:
(i) upward water curtain of single/multiple 180° flat fan spray head(s) (ii) upward water
curtain of multiple 60° full cone spray nozzles, and (iii) downward water curtain of 60°
full cone spray nozzles. The nozzles used to make three water curtains were 2-inch
Hydroshield HSC, 1-inch TF48NN spiral, and ½-inch TF24NN spiral nozzles
respectively.
In 2006 experiment, LNG was spilled on large water surface to simulate LNG
release on unconfined water and multiple flat fan water curtains were used to control the
vapor cloud. In 2007 and 2008 experiments, LNG was spilled on concrete to simulate
LNG release from pipe on ground, and fan and upward cone type water curtains were
tested. The 2009 experiment evaluated all of three types of water curtains individually
95
and all together. LNG was spilled on confined water surface to simulate LNG spill from
pipe and to produce steadier vapor cloud.
The water curtains represent three main classes of water curtains used in the
industries. The ranges of water droplets generated by the nozzles are different at same
gage pressure. Drop size of the upward cone spray is considered small to medium where
the upward fan spray is considered to be coarse. The downward cone spray produces
smaller droplets and considered as mist type drops. The coverage and imparted
momentum by the two upward sprays are also different. The conical spray gives large
width (downwind coverage) than the fan spray. Again the fan spray is able to impart
more momentum to any cloud as because it operates at higher pressure. Thus the effects
of these sprays in controlling LNG vapor clouds are expected to be different in terms of
the action mechanisms.

96
4 STUDY OF AIR ENTRAINMENT INTO SPRAYS
4.1 Introduction
The feature of air entrainment into a water spray is considered as the major and
most dominating physical action to control and disperse a hazardous vapor cloud. When
water comes out from a pressurized spray nozzle, it breaks down to water droplets and
thus creates a curtain of water drops. Air entrainment takes place into the spray region as
a result of momentum transfer from the water droplets to the ambient air. Vapor cloud
can get diluted by mixing with the entrained air when comes inside a spray. Thus
entrained air, flowing inside the spray, interacting with the cloud can reduce the gas
cloud concentration downstream region of the water spray (Van Doorn, 1981). Overall
the mixing and dilution can result from the momentum transfer between the air, gas and
water droplets.
Air entrainment is a strong function of spray configuration, droplet size, droplet
velocity, and spray arrangements. Large droplets entrain less air than smaller droplets
but induce better mixing and dispersion. Although smaller droplets entrain more air, they
have smaller terminal velocities which are almost constant and cause poor mixing and
dilution due to less turbulence. According to the design requirements, it is necessary to
deliver air not only in sufficient quantity, but also at a sufficient velocity to ensure
dilution (CCPS, 1997; Fthenakis, 1991).
Study of entrainment into water sprays has received much attention by the
researchers. Though most of the works were focused on experimental measurements as

97
well as theoretical study of different types of water sprays, those were mainly for
downward spray configuration. Usually downward water sprays, used for heavier than
air flammable and toxic gases to contain the gas cloud in an area, stand as a barrier to a
drifting gas cloud by the air vortex created by the spray and force the gas downwards
(Palazzi et al., 2004). LNG vapor is initially a heavier than air vapor cloud and becomes
lighter when gets diluted and warmer. For this water curtains with an upward flow might
show better effectiveness to control LNG than those with a downward flow. However
neither detail experimental studies nor simple entrainment models could be identified to
characterize air entrainment into upward water sprays.
This study includes development of a simple air entrainment theory and
theoretical estimation of entrainment velocity and volumetric entrainment rates for the
upward spray nozzles used in the experiments. The basis of this theoretical study is the
research reported by Heskestad et al. (1976, 1981), in which a simple physical model of
air entrainment into downward conical spray in quiescent, surrounding air condition has
been developed. So this study uses the similar model of Heskestad by modifying it for
the upward flow. The numerical calculation procedure is developed with Visual C plus
program by using 4th
order Ranga-Kutta method.
4.2 Simple Air Entrainment Theory
In this study estimates of air entrainment flow rate inside a spray can be obtained
by examining in detail, the momentum exchange between the droplet and the
surrounding air. A simple air entrainment model can be derived for a vertically upward

98
pointing spray by assuming: (1) one dimensional flow and air flow is incompressible, (2)
spherical drop size and spray droplet size distribution is uniform, (3) aerodynamic drag
on a drop is not influence by its neighboring droplets, (4) air flow in a spray cross-
section is uniform; and (5) the frequency of coalescence of droplets in the spray volume
is negligible. A force balance on a single drop of mass, md can be expressed as:
dd
d
d Fgmdt
dum (18)
Since at steady state the velocity of the drops crossing a particular observation
point does not vary in time, i.e. at fixed vertical position from the drop source (z), ud = ud
(z). Then eqn (18) can be written:
dd
d
dd Fgmdz
duum
dd
d
d
d
um
F
u
g
dz
du (19)
In the air phase, the cross-sectional flux of momentum increases along the spray
axis because of a steady force exerted by the droplets, generated through a nozzle. If am
is the mass flow rate of air in any cross sectional area (As) of the spray, ua is the velocity
of entrained air and Nd represents the number of droplet generated per unit time at the
drop source, then force exerted by the water drops:
dd
aa NFdt
umd
d
ddsaa
u
NF
dz
Aud
2 (20)
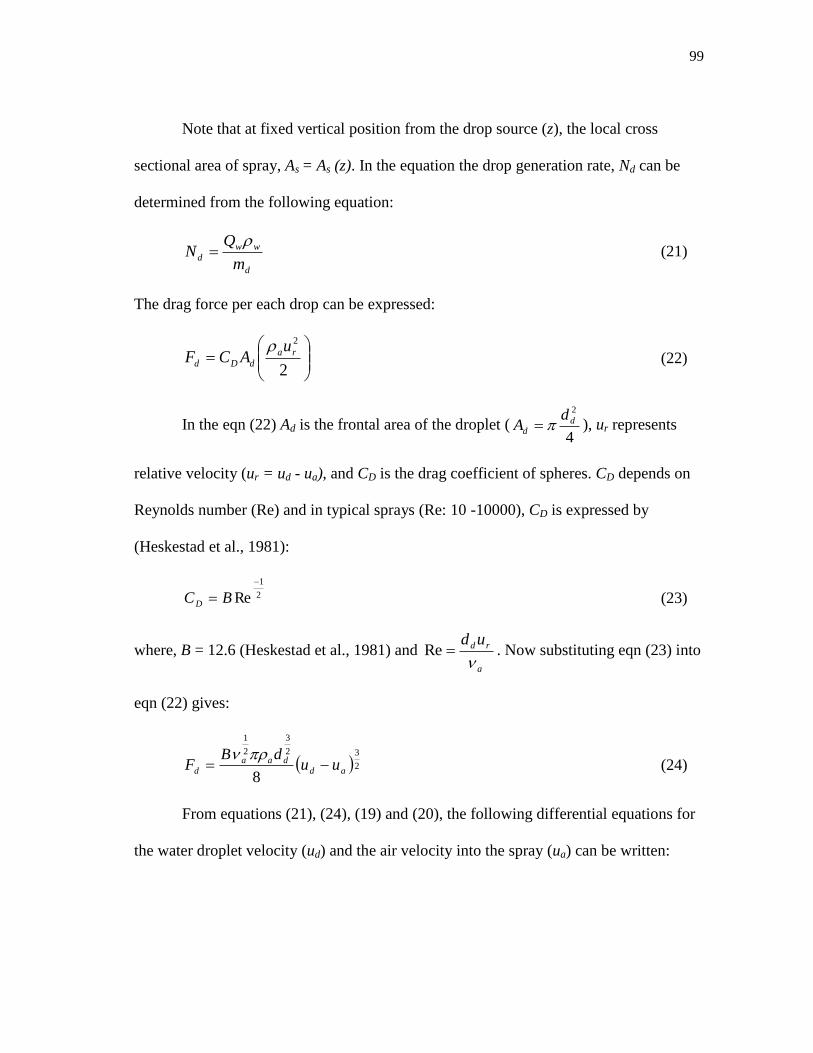
99
Note that at fixed vertical position from the drop source (z), the local cross
sectional area of spray, As = As (z). In the equation the drop generation rate, Nd can be
determined from the following equation:
d
ww
dm
QN
(21)
The drag force per each drop can be expressed:
2
2
ra
dDd
uACF
(22)
In the eqn (22) Ad is the frontal area of the droplet (4
2
d
d
dA ), ur represents
relative velocity (ur = ud - ua), and CD is the drag coefficient of spheres. CD depends on
Reynolds number (Re) and in typical sprays (Re: 10 -10000), CD is expressed by
(Heskestad et al., 1981):
2
1
Re
BCD (23)
where, B = 12.6 (Heskestad et al., 1981) and a
rd ud
Re . Now substituting eqn (23) into
eqn (22) gives:
2
32
3
2
1
8ad
daad uu
dBF
(24)
From equations (21), (24), (19) and (20), the following differential equations for
the water droplet velocity (ud) and the air velocity into the spray (ua) can be written:

100
d
ad
d
w
a
d
d
u
uudB
u
g
dz
du 2
3
2
3
2
1
4
3
(25)
ad
addw
s
s
aa
uu
uudBQ
dz
dA
A
u
dz
du 2
3
2
3
2
1
8
3
2
1
(26)
4.3 Discussion on the Equations
Integration of the above equations should provide an estimate of the air
entrainment into a spray. However, equations (25) and (26) are difficult to solve
analytically because the initial drop and air velocities need to be specified at a certain
location near the drop source (nozzle), not exactly at the drop source. Water emerging
from a spray actually does not break up into droplets at the nozzle tip. Usually flow from
a nozzle can be divided into three regions. In the first region water comes and remains as
solid water jet until the jet reaches a certain diameter. The second region is where the
droplets are formed. Finally in the third region the flow of water drops is actually
occurred. The following sketch shows conical spray pattern from a nozzle (Fig. 41).

101
Fig. 41. Upward water spray from a conical nozzle.
In Fig. 41, Dw is the diameter of the solid water jet which breaks up into droplets
at zw vertical distance from the nozzle and zs is the vertical location where droplets starts
to flow. Generally to solve equations (25) and (26), initial air and water drop velocities
should be specified at a location, zs, just beyond the boundary of the spray nozzle. It
turns out that if zs/zw remains within certain limits, the solutions of the flow is insensitive
to (1) the precise value of zs/zw and (2) the value of initial air velocity imposed for a
given initial drop velocity. It was also identified that at zs/zw =1 and initial air velocity
(ua0) equal to the initial drop velocity (ud0) is acceptable for a large variety of spray
nozzles (Heskestad et al., 1981). Thus the equations appeared be solvable numerically
considering the above facts. However, it is still necessary to know the spray cross
sectional area, As (z), the effective drop diameter, dd, and the initial drop velocity, ud0 in
order to solve the equations.
zs
Dw zw
nozzle
Solid
water jet
Water
droplets
θRegion I
Region II
Region III

102
The spray cross sectional area, As (z), at any axial distance can actually be
replaced with spray angle. If a nozzle creates a conical angle of θ, then, instead of As (z),
the following relationships can be used in equation (26):
2
2
2tan
)(
zzAs (27)
and 2
2tan
2
z
dz
dAs (28)
For a practical spray nozzle, the initial drop velocity can be related to the average
velocity from the nozzle. This relationship is expressed as
n
d
nww
dww
MU
u
UQ
uQC 00
(29a)
where CM is called momentum coefficient and Un is the water velocity from the nozzle.
Or, 20
4
n
wMdD
QCu
(29b)
where Dn is the nozzle diameter.
Usually nozzle diameter and flow rates at different pressure are provided in any
nozzle specification. A nozzle actually produces a range of droplet sizes from the solid
liquid stream. It is found that effective diameter lies somewhere between the sauter mean
diameter to volume mean diameter (Heskestad et al., 1981). These diameters do not
differs greatly in water sprays and since the air entrainment is not very sensitive to the
difference between these two sizes, the sauter mean diameter is considered for this
research as effective drop diameter. Literature search has revealed the existence of a

103
relationship to determine the effective drop size from any nozzle specification (Bennet &
Eisenklam, 1969; Briffa & Dombrowski, 1966; Heskestad et al., 1981). The relationship
is expressed as
3
2
n
nd
U
Drd (30)
where, r is a constant of proportionality generally dependent on the relative geometry of
the nozzle.
Now the equations (27)-(30) can be used to identify the necessary spray
information of spray cross sectional area, As (z), the initial drop velocity, ud0 and the
effective drop diameter, dd in order to solve the equations (25) and (26). After careful
analysis of their developed model, for a downward spray, Heskestad et al. (1981)
discovered that nondimensional forms of the equation produced accurate results. The
same method is utilized here to solve the equations for the studied upward flow.
4.4 Nondimensionalized Equations
Considering the initial drop velocity, ud0 as the characteristic velocity, and the
diameter of the solid water jet, Dw which carries the flow rate Qw at a velocity of ud0 as
the characteristic length, the following normalized relationship was obtained.
0d
d
du
uu , normalized drop velocity
0d
a
au
uu
, normalized air velocity

104
wD
zz , normalized axial distance
The normalized relationships are also based on the idea of Heskestad et al. (1981). The
governing equations (25) and (26) are normalized with the characteristic quantities and
expressing the local sectional flow area As, in terms of spray angle θ. Finally the
following nondimensional relationships are obtained:
d
ad
d
d
u
uu
udz
du 2
3
(31)
2
2
3
zuu
uu
z
u
dz
du
ad
adad (32)
Here the parameters α, β, γ and ξ can be called as gravity parameter, viscous-interaction
parameter (related to discharge velocity), geometric parameter (related to cone angle)
and geometric parameter (related to nozzle size) respectively.
4
(33)
2
1
02
3
2
1
4
3
ddw
w
a udDB
(34a)
Or,
2
3
5.0
2
1
4
3
rC
UB
M
n
w
a
(34b)
2tan
1
8
1
2
a
w (35)
105
2
3
8
13
25.0
4
1
2
1
4
3
rC
DgB
M
n
w
a
(36)
4.5 Numerical Solution
The normalized equations (31) and (32) have been solved numerically to estimate
the air entrainment rate into a large number of upward conical sprays selecting
systematic variations in the parameters γ, β, and ξ. A Visual C++
program has been
developed to solve the normalized differential equations using fourth order Ranga-Kutta
method. The program was verified with the results from the downward spray model of
Heskestad et al. (1981). The program showed good agreements with their published data.
Fig. 42 and Fig. 43 show the results of non dimensional entrainment velocity,
au
and entrainment flow, w
a
aQ
QQ , at different non dimensional axial locations from the
apex of the spray cone, wD
zz . In the study two cone angles (30 and 60), two nozzle
pressures (P1 and P2 where P2=2*P1) and two flow directions have been chosen to
study effect of spray cone and discharge velocity (i.e. pressure) for both upward and
downward spray of constant diameter nozzle in entrainment velocity and entrainment
rate.

106
Fig. 42. Dimensionless air entrainment velocities into different conical sprays.
Fig. 42 shows that non dimensional velocities of entrained air for the nozzles of
same cone angle and pressure but different directions (downward and upward) are
exactly similar for the same distance from the nozzle. Only difference is that the curve
for the upward spray (solid red line with red square marker) ends at z*=325 where the
curve for the downward spray (solid blue line with solid blue diamond marker) becomes
flatter at higher z*. This indicates that the upward flow for a spray is limited to certain
axial distance at certain pressure and angle, where as a nozzle can be mounted at much
higher location to flow downward. However for both sprays velocity decreases as the
distance increases. If a upward spray is at same angle and diameter but operates at two
times higher pressure (red dotted line), very less change in the velocity is observed.
0
0.1
0.2
0.3
0.4
0.5
0.6
0.7
0.8
0.9
1
0 50 100 150 200 250 300 350 400 450 500 550 600
Entr
ain
ed
air
ve
loci
ty (d
ime
nsi
on
less
), U
*
Vertical distance from nozzle (dimensionless), z*
angle:60-Press:P1-Dia:D1 Down
angle:60-Press:P1-Dia:D1 Up
angle:60-Press:P2-Dia:D1 Up
angle:30-Press:P1-Dia:D1 Up
angle:30-Press:P2-Dia:D1 Up

107
Higher pressure only helps the water drops to reach higher elevation. Instead of doubling
the pressure, if the cone angle is reduced to half (solid brown line with triangular
marker) then the entrainment velocity increases quite a bit, though the distance covered
is the same. Finally if both the pressure and angle is changed (double pressure and half
angle) the velocity as well as the coverage increases (purple solid line with circular
marker). Thus the results show that spray angle is more important than pressure to
increase air velocity inside a spray. For an upward spray, pressure is the important factor
only when we care about height coverage.
Fig. 43. Dimensionless entrainment rate into different conical sprays.
0
2000
4000
6000
8000
10000
12000
14000
16000
18000
0 50 100 150 200 250 300 350 400 450 500 550 600
Entr
ain
ed
air
rate
into
the
sp
ray
(vo
l flo
w)
(dim
en
sio
nle
ss),
Q*
Vertical distance from the nozzle (dimensionless), z*
angle:60-Press:P1-Dia:D1 Down
angle:60-Press:P1-Dia:D1 Up
angle:60-Press:P2-Dia:D1 Up
angle:30-Press:P1-Dia:D1 Up
angle:30-Press:P2-Dia:D1 Up

108
Fig. 43 shows that volumetric air flow rate increases as the distance from the
nozzle increases. This is obvious as the conical spray area increases along the spray axis.
Results of the sprays at similar conditions (angle 60° and pressure P1) and different flow
directions (up and down) show that entrainment flow rates do not vary at all, only the
distance covered are changed. Increasing the pressure of the upward 60° spray does not
provide any higher air rate only it covers much higher elevation. However reducing the
angle to 30° for the upward spray significantly decreases the air rate, as the spray area
decreases. The overall study clearly indicates that the width (angle) of a spray
significantly affects the air entrainment rate into the spray.
4.6 Summary
A simple theoretical model has been developed for air entrainment flow in a
water spray discharging vertically upward in quiescent space. The equations were
derived and solved based on the model developed by Heskestad et al. (1981). To solve
the model equation a Visual C++
program has been developed with fourth order Ranga-
Kutta method. The program has been verified with results of Heskestad et al. (1981). In
the study two cone angles (30° and 60°), two nozzle pressures (P1 and P2 where
P2=2*P1) and two flow directions (up and down) have been chosen to study effect of
spray cone and discharge velocity (i.e. pressure) of constant diameter nozzles in
entrainment velocity and entrainment rate. It appears that the theoretical solution of the
model can be used to obtain good estimates for the entrainment flow in sprays of
different configurations.

109
5 EXPERIMENTAL RESULTS*
5.1 Introduction
The objective of the experiments are to determine the effectiveness of different
representative types of water curtains in controlling LNG vapor produced from the liquid
spills. The change in concentration and temperature of an LNG vapor cloud, dispersing
both naturally (by wind) and forcefully (by water curtain), was the main focus of these
experiments. Therefore concentration (methane) and temperature data were measured at
different downwind distances and elevations, to evaluate the acting mechanisms of a
water curtain when interact with an LNG vapor cloud. The water spray nozzles used in
the experiments were chosen to represent the three main categories of nozzles, full cone,
fan, and fog. Generally, sizes of the droplet sizes produced by the conical, fan and fog
nozzles are respectively considered as medium, coarse and very fine. Detail information
on the nozzles and types of water curtains used in the experiments is provided previously
in section 3.
____________
* Parts of this section are reprinted with permissions from (1) “Experimental Study of
Effective Water Spray Curtain Application in Dispersing Liquefied Natural Gas Vapor
Clouds” by Rana, M. A., Cormier, B. R., Suardin, J. A., Zhang, Y. and Mannan, M. S.,
2008. Process Safety Progress, 27 (4), 345-353, Copyright [2008] by John Wiley &
Sons, Inc., and (2) “Use of Water Spray Curtain to Disperse LNG Vapor Clouds” by
Rana, M. A., Guo, Y. and Mannan, M. S., 2009. Journal of Loss Prevention in the
Process Industries, 22, 707-718, Copyright [2009] by Elsevier Ltd.

110
This section details the results of the experiments conducted in this study. So far
four out-door experiments were conducted on different weather conditions and Table 10
shows the weather conditions during the experiments.
Table 10. Weather conditions during the experiments.
Conditions 2006 Expt. 2007 Expt. 2008 Expt. 2009 Expt.
Month April November March March
Wind speed (m/s) 2.5 ±0.8 2.2 ± 0.6 4.5 ±1.0 5.1 ± 1.2
Wind direction (from) North to
east
South-west to
south-east
South to
east
South-
south-east
Ambient temperature (°C) 26 ± 0.1 22.5 ± 1.5 22.5 ±0.2 28.4 ±0.3
Relative humidity (%) 64.5 ± 0.6 25.5 ± 3.5 50.6 ±0.7 38 ±0.5
Solar Flux (W/m2) N/A 250 ± 12 N/A 590.7±87.5
Water temperature (°C) N/A 19.5 ± 1.5 17.5 ± 2.5 26.5 ± 1.5
5.2 Experiment of 2006
5.2.1 General Description
In this experiment, LNG was continuously released from the tanker onto the
water surface with a discharge pipe connected to the insulated pipe line. The end of the
discharge pipe was bended to 45° angle to reduce turbulence. The average flow rate from
the pipe was 7.5 × 10⁻²
m3/min (20 GPM). An LNG pool of 2.5 m diameter
(approximately) was observed to be formed on the water surface almost instantly and the
pool geometry reached steady state rapidly in 1 to 2 minutes. Vapor produced from the
pool evaporation dispersed downwind (towards south-west) as a vapor cloud and the
cloud concentrations were measured in different points with point gas detectors. The

111
measurement unit is %LFL (or % LEL). Note that 100% LFL equals 5% v/v methane
concentration in air.
5.2.2 Results and Discussion
Three flat fan nozzles were used in the experiments. About 13 minutes after the
start of LNG release, the water curtains were activated to control the concentration of the
dispersing vapor cloud. The LNG release was continued during the entire time the water
curtains were active. Gas detectors were located in both upwind and downwind locations
of the water curtain region, and the data were recorded without and with spray
activation. Water flow rate and water curtain pressure were not measured in this
experiment. Fig. 44 shows continuous gas concentration (% LFL) reading versus time at
two points, just before and after the water curtain location.

112
Fig. 44. Ground level (0.3m elevation) methane concentration at two downwind
distances. Locations of Pole 2, Pole 6 and the water curtain are 4.0m, 10.0m and
8.5m respectively, from the pit edge.
Fig. 44 shows the ground level (0.3 m from ground) gas concentration data
recorded at 4 m and 10 m downwind from the pit edge. Blue line (Pole 2) in the figure
represents data at 4 m and the red line (Pole 6) represents data at 10 m. The water curtain
was placed 8.5 m downwind (Fig. 22). It is already mentioned before that the water
curtain was activated approximately 766 s after starting the continuous LNG release. So
for each measurement point concentration data before 766 s is without the water curtain
action and after that it is with the action. After the water curtain activation, it actually did
not affect the vapor cloud concentration at 4.0 m location (before the water curtain
region). However it did affect the vapor concentration at 10 m location (after the water
0
10
20
30
40
50
60
70
80
90
100
0
60
120
180
240
300
360
420
480
540
600
660
720
780
840
900
960
1,02
0
1,08
0
1,14
0
1,20
0
1,26
0
1,32
0
Co
nce
ntr
atio
n (
% L
FL o
f m
eth
ane
)
Test time, sec
Pole 2: upwind of WC
Pole 6: downwind of WC
Water Curtain ON

113
curtain region). The average peak concentration at 4 m location (blue line) is 61.7 (±
25.1) % LFL. The average peak concentration at 10 m is divided into two parts (red
line). Without the water curtain action the average was 32.6 (± 10.3) % LFL and with the
action it was very close to 0 % LFL. This data indicate that actually the water curtain did
reduce the LNG vapor concentration. However the concentration at the smaller distance,
closer to the spill, was already very low (below LFL, i.e. 5% v/v). So the location of the
water curtain needed to be much closer to the spill to actually identify the effectiveness
of the water curtain. The low concentration reading at this distance was mainly due to
early dilution of the gas cloud from air entrainment from the high wind speed and high
evaporation rate. That is why the cloud already stated to move up before reaching 4 m
and 10 m distance. So when the light cloud interacted with the water curtain, the
dispersion was facilitated by the higher momentum from the spray. That is why the
concentration at 10 m distance after the curtain activation was almost zero.
During the experiment though the average wind speed was around 2.5 m/s, the
high wind speed was almost 5.3 m/s. The higher evaporation rate was due to the spill
surface. In this experiment, LNG was released on 45 m2 of water surface at a very low
rate. So the water acted as an infinite heat source for the LNG pool and produced vapor
at a higher evaporation rate. Cormier (2008) discussed in detail about the evaporation
rate calculation procedure for the experiment and estimated that the mass evaporation
rate from the water surface was between 0.2 kg/m2s and 0.8 kg/m
2, in different location
of the pool, depending on the region of turbulence. The highest value of the evaporation
rate (0.8 kg/m2 s) was estimated almost underneath of the pipe where the LNG was

114
discharged. Again the lowest evaporation rate (0.2 kg/m2 s) was estimated near the outer
edge of the LNG pool where the LNG steadily spread onto the water surface. Thus the
high evaporation rate and wind speed reduced the LFL distance significantly. Cormier
(2008) also discussed that the total LFL distance observed without using any water
curtain was 18.2 meters, where as with the water curtain it reduced to 15 meters. Thus
the water curtains used in April 2006 showed that can control and disperse LNG vapor
cloud. The experiment also proved their effectiveness in reducing downwind LFL
concentration (methane). However the experiment did not identify the actual mechanism
behind the effectiveness. So more experiments were developed to fill up the gap and the
experiments conducted in the following years were more detailed.
5.3 Experiment of 2007
5.3.1 General Description
A total of four tests were completed in a 1½ hour period. Two types of water
spray curtains were used in individual test sets. The first set of tests was conducted with
the full cone spray curtain and the second set was with flat fan curtain. The water
curtains were directed vertically upward and positioned perpendicularly to the prevailing
wind direction, at a fixed downwind distance from the spill location. Test started with
continuous spill of liquid LNG onto the concrete ground. As soon as the liquid touched
the concrete ground it vaporized. A visible white condensate cloud was then produced as
the very cold vapor condenses the water content in the air. The white vapor cloud was
observed to disperse naturally towards the prevailing wind direction. The white cloud

115
formation mainly depends on the humidity of the ambient air, so it may or may not
totally represent the actual size of a methane cloud. After achieving a reasonable sized
visible vapor cloud flow, the water spray curtain was turned on to disperse the cloud
forcefully, continuing the LNG release on the ground. Several minutes after the water
activation, the LNG flow was turned off from the tanker. The curtain was kept on until
the visible white cloud almost disappeared. Fig. 45 shows two photographs captured
from the test.
Fig. 45. LNG dispersion tests. Top: without water curtain, bottom: with full cone
water curtain. Reprinted from Rana et al. (2009).

116
During the tests, the wind speed averaged 2 m/s (4.5 miles per hour) and blew
mainly from the south-west to south-east region. The average ambient temperature
during the tests was 22.5 (± 1.5) °C and humidity was 25.5 (± 3.5) %. Table 11 includes
the average flow rates and total flow time of LNG and water and average pressure of
water at the curtain inlet for each test.
Table 11. Average flow rate and pressure data for 2007 experiment. Modified from
Rana et al. (2009).
Measured
Parameters
Conical Water Curtain
(7 nozzles)
Fan Water Curtain
(1 nozzle)
Test 1a Test 1b Test 2a Test 2b
LNG flow rate, m3/s
LNG total, m3
Water pressure, kPa
[psi]
Total water flow
rate, m3/s
Water flow rate per
nozzle, m3/s
Water total, m3
(2.5± 0.5) ×
10-3
1.35 ± 0.3
275.8 ± 34.5
[40 ± 5]
(15.5 ± 4.7)
× 10-3
(2.2± 0.7) ×
10-3
9.1± 2.8
(3.8± 0.7) ×
10-3
1.87 ± 0.3
304.5 ± 34.5
[45 ± 5]
(15.5 ± 1.0)
× 10-3
(2.2 ± 0.14)
× 10-3
5.4 ± 0.35
(3.5 ± 0.25) ×
10-3
1.25 ± 0.09
551.4 ± 34.5
[80 ± 5]
(15.1 ± 4.6) ×
10-3
(15.1 ± 4.6) ×
10-3
5.3 ± 1.6
(3.4 ± 0.75) ×
10-3
0.71 ± 0.16
620.4 ± 34.5
[90 ± 5]
(15.5 ± 2.3) ×
10-3
(15.1 ± 4.6) ×
10-3
3.16 ± 0.47
Procedures for the entire experiment were similar as mentioned earlier in section
3. However Table 11 clearly indicates that the times of water turning on and LNG
release discontinuing are different for the tests. As these field tests deal with flammable
LNG vapor, whose phenomena of flow and dispersion are still completely unknown, the
decisions of turning on the water curtain and turning off the LNG flow mostly depended
on the situation during each test. For example, the water curtain was activated much later

117
for test 1a than the test 2a (480 s for 1a and 231 s for 2a). The first reason for this was
that the LNG pipeline was not pre-cooled before conducting the full cone test (1a),
which reduced liquid flow at the discharge point and all of LNG was coming as vapor
initially until the pipeline was completely cooled down. However during the test 2a, as
the pipe line was already used twice, it was somewhat cooled, and it took much shorter
time to get liquid out at the pipe discharge. So the water curtain activation time is higher
in the first test.
Another main reason of the long wait in the first test was the wind’s behavior. As
already mentioned the test set up was based on predicted wind direction. At the start of
test 1a, wind direction suddenly changed from the setup direction. So initially LNG
vapor cloud was not exactly moving towards the water curtain, which was placed 7m
downwind from the spill location. However the wind direction changed back towards the
setup again within short time. This major factor of change in wind direction mainly
delayed the water curtain activation time even though the wait for the pipe cooling was
over. The readings of the gas detectors located at different downwind direction presented
later in this section also identifies the situation that initial concentration sensing times
are different for two the tests.
LNG was continuously released on concrete ground surface and the spill area
was fixed by enclosing the area with wooden bars (1.5m × 1.5m × 0.13m) to obtain a
fixed pool size. LNG flow was discontinued when a pool of a reasonable depth
(approximately 0.1-0.13 m) was achieved, to avoid overflow from the enclosure. In test
1a LNG was released for a long period of time inside the enclosed spill area due to the

118
late activation of water curtain. So a reasonable liquid pool was created within 70
seconds of the water activation. However during test 2a, to achieve a reasonable LNG
depth in the spill, it took almost 125 s after the curtain activation. That is why the LNG
release discontinuing times are also different from each other. However the slight
difference in the procedure should not have significant effect in the test results. Only the
sizes of the vapor cloud during the LNG- water curtain interaction were slightly different
due to the time difference. As the evaporation rate of LNG reduces overtime from
spilling on concrete, the vapor cloud for test 1a was expected to be slightly smaller than
test 2a at the time when the water curtains were activated.
Full cone curtain pressure was measured at the curtain pipe inlet and flat fan
curtain pressure was measured at the spray head. As the full cone curtain was fabricated
with seven smaller nozzles where as only one nozzle was used for the flat fan curtain,
less pressure was achieved in the full cone curtain. Studying the test data, Fig. 36 and
Fig. 37, it can be identified that each full cone nozzle operated around 34 – 42 kPa and at
these pressures, the range of SMD of the droplets is 1.4 – 1.3 mm. On the other hand the
flat fan curtain operated around 516 -586 kPa range and thus the range of SMD of the
droplets at these pressures is 1.6-1.5 mm.
Water curtain coverage depended on the water pressure. So the heights of the
curtains were different for different test. Fig. 46 and Table 12 show the average water
curtain heights in the experiment. The total height of the water curtains were measured
from pictures and videos. The height was measured by comparing with 2.3 m high tripod
poles.

119
Fig. 46. Water curtain coverage in 2007 experiments.
Table 12. Heights covered by the water curtains in 2007 experiment.
Test Water Curtain Coverage (Avg Height), m
1a Full Cone
2.8
1b 2.9
2a Flat Fan
4.64
2b 6.55
Approximated widths of the water curtains are also determined from the
experiment. This width, which is the downwind length of the curtain, is approximated
form the shape of the water curtain actually produced during the tests. The upward full
cone curtain though created a conical spray shape; it leaned towards the wind direction
by wind speed. As the shape was conical, the width changes along the height. At 2.1-
2.4m height from the nozzle the width was observed to be approximately 3.23m. For the
convenience of analysis, the shape of this curtain is assumed rectangular for simplicity
and a constant value of 1.6m (half of 3.23m) is considered as the width from the spray
point. On the other hand the fan spray created a flat flow and also leaned towards

120
downwind due to wind speed. Its width fluctuated between 0.45-0.55 m during the test.
In this analysis the shape of this curtain is also assumed rectangular and a constant value
of 0.5m (average) is considered as the width, from the spray point.
5.3.2 Results and Discussion
5.3.2.1 Imaging
All tests were videotaped using digital, hydrocarbon and Infrared (IR) cameras.
The hydrocarbon and IR cameras were used to differentiate between the dispersion of
flammable hydrocarbon and the visible condensate cloud. Fig. 47- Fig. 49 show clips
from the videos of the tests captured with the regular and hydrocarbon cameras, almost
at the same time.
Fig. 47. Spill and natural dispersion. Left: regular image, right: hydrocarbon
camera image.

121
Fig. 48. Forced dispersion with full cone spray curtain. Left: regular image, right:
hydrocarbon camera image.
Fig. 49. Forced dispersion with flat fan curtain. Left: regular image, right:
hydrocarbon camera image. Reprinted from Rana et al. (2008).
The regular image in Fig. 47 shows a smaller visible condensate cloud but
hydrocarbon camera image shows actual size of the flammable cloud. In Fig. 48 and Fig.
49, the regular camera image shows that white condensate cloud becomes invisible after
it crosses the spray area. The black areas of the hydrocarbon camera image show the
presence of colder hydrocarbon in the gas-air-water vapor cloud. The light darker area
after the spray indicates that still there are some colder hydrocarbons (which are not
visible) and the concentration/temperature is lower.

122
5.3.2.2 Concentration and Temperature
LNG was continuously released on concrete ground surface into an enclosed area
(1.5m × 1.5m × 0.13m) to obtain a fixed pool size. Concentration and temperature of the
dispersing LNG vapor (methane) cloud was measured continuously during each test.
Prior to the experiment, the gas detectors were calibrated with methane gas (50-50%
CH4-Air Mixture) to measure methane concentration in % volume/volume unit. The
schematic of the setup (Fig. 28) indicates that the data collection points in each test were
distributed at five different downwind distances from the spill (x1-x3 & x5-x6) and at two
(y-2, y2) or four (y-3, y-2, y2 & y3) crosswind positions and three elevations (z1-z3). The
water curtains were positioned at x4 (= 7.0m) downwind distance from the LNG release
spot in both the tests. Fig. 50 is an example of readings at 0.5m elevation and three
downwind locations. In the figure, red, brown and blue colors represent measurement at
1 m, 3.3 m and 11.3 m downwind distances respectively.

123
Fig. 50. Concentration and temperature measurement during test 1a at 0.5 m
elevation of three downwind locations. Modified from Rana et al. (2008).
From the above figure it is clear that during the time of continued LNG release,
near ground level concentration, closer to the release point is higher and becomes lower
as the cloud proceeds downwind. And for the temperature, cloud temperature is colder
near the release and approaches atmospheric temperature as the cloud moves further. So
the data shows dispersion of LNG vapor cloud. Measurements can be divided in to two
parts: (i) natural dispersion of LNG vapor measurements: when there is no interaction
between water and LNG vapor; and (ii) forced dispersion of the LNG vapor
measurements: after the interaction between water curtain and the LNG vapor. Fig. 51
shows the schematic of the test procedure and the natural and the forced dispersion
processes considered in a test.
-120
-100
-80
-60
-40
-20
0
20
0.0
5.0
10.0
15.0
20.0
25.0
30.0
35.0
40.0
05
01
00
15
02
00
25
03
00
35
04
00
45
05
00
55
06
00
65
07
00
75
08
00
85
09
00
95
01
00
0
tem
pe
ratu
re, C
CH
4 c
on
cen
trat
ion
, % v
/v
time, sec
RED: x=1m
BROWN: x=3.3mBLUE: x=11.3m
water ON LNG OFF

124
Fig. 51. Test procedure and dispersion process. Reprinted from Rana et al. (2009).
To determine the effect of water curtain in controlling LNG vapor cloud, data
collected at three elevations of x2 (=3.3m) and x5 (=11.3m) downwind distances are
considered in the research for analysis purpose. Here one test for the full cone (test 1a)
and one test for flat fan (test 2a) curtain are considered to discuss in detail.
Before the analysis all the flow sensor, thermocouple and gas detector data were
carefully reviewed and synchronized with the captured video as there was time lag
among the LNG flow, temperature and concentration data. Some fluctuations were
observed in the recorded concentration and temperature data, especially close to the spill
area, due to the wind gustiness and crosswind turbulence. Turbulence created very close
to the spill spot due to momentum of LNG flow from the pipe, flashing and evaporation
VaporizationLNG vapor cloud
Natural dispersion
Natural Forced
LNG vapor cloud
LNG vapor cloud
LNG Releasecontinued
Water curtain active
LNG Releasediscontinued
Water curtain active
LNG Releasecontinued
Water curtain inactive
time: to (=LNG release) to t1 (=curtain activation)
Natural
Natural Forced
Natural
time: t1 (=curtain activation) to t2 (=LNG off)
time: t2 (=LNG off) to t3 (=curtain deactivation)

125
speed might cause additional fluctuation in the reading. Concentration and temperature
data at three elevations (z1-z3) of the two horizontal locations (x2 and x5) are first
averaged and then analyzed. The readings of the similar four crosswind (y direction)
sensors located at one elevation (z direction) of one horizontal position (x direction) are
averaged to get one concentration or temperature data at that (x, z) location. Fig. 52 to
Fig. 55 summarize the average concentration and temperature readings for two tests with
two types of water curtain. The charts show average data at three heights (z1= 0.5 m, z2=
1.2 m and z3= 2.1 m) of two (x2= 3.3 m and x5= 11.3 m) downwind distances.
In the analysis, the selected downwind positions are just before and after the
water curtain region. This means that data at 3.3m (x2) distance are always due to natural
dispersion of LNG, considering the fact that the vapor never interacted with the water
curtain at this position. As the 3.3m downwind location is in between the spill area and
the spray, LNG vapor was observed to have very insignificant effects by the spray here.
Due to the wind, the water spray was also observed to lean towards the wind direction
and thus not affecting the vapor coming to it. For these reasons, it is assumed that there
is no effect of the water spray on the LNG vapor before the spray area. However, as 11.3
m (x5) downwind position is after the water curtain region, the test data here are divided
into two parts based on the test procedure: (i) natural dispersion data before the water
curtain activation and (ii) forced dispersion data after the water curtain activation.

126
Fig. 52. Average data at (x2=) 3.3m downwind: full cone spray curtain, test 1a.
Reprinted from Rana et al. (2009).
Fig. 53. Average data at (x5=) 11.3m downwind: full cone spray curtain, test 1a.
Reprinted from Rana et al. (2009).
-105-95-85-75-65-55-45-35-25-15-551525
0.02.55.07.5
10.012.515.017.520.022.525.027.530.032.535.037.5
0
50
100
150
200
250
300
350
400
450
500
550
600
650
700
750
800
850
900
950
1000
tem
pe
ratu
re, o
C
con
cen
trat
ion
, %v/
v
time, sec
conc 0.5m conc 1.2m conc 2.1mtemp 0.5m temp 1.2m temp 2.1m
LNG release OFF
Average air temperature
-10.0-7.5-5.0-2.50.02.55.07.510.012.515.017.520.022.525.0
0.0
2.5
5.0
7.5
10.0
12.5
15.0
17.5
20.0
22.5
25.0
0
50
100
150
200
250
300
350
400
450
500
550
600
650
700
750
800
850
900
950
1000
tem
pe
ratu
re, o
C
con
cen
trat
ion
, %v/
v
time, sec
conc 0.5m conc 1.2m conc 2.1m
temp 0.5m temp 1.2m temp 2.1m
LNG release OFFWater
turned on
Average air temperature
Average water temperature

127
Fig. 54. Average data at (x2=) 3.3m downwind of release: fan spray curtain, test 2a.
Reprinted from Rana et al. (2009).
Fig. 55. Average data at (x5=) 11.3m downwind: fan spray curtain, test 2a.
Reprinted from Rana et al. (2009).
-40.0
-35.0
-30.0
-25.0
-20.0
-15.0
-10.0
-5.0
0.0
5.0
10.0
15.0
20.0
25.0
0.02.55.07.5
10.012.515.017.520.022.525.027.530.032.535.037.540.0
02
55
07
51
00
12
51
50
17
52
00
22
52
50
27
53
00
32
53
50
37
54
00
42
54
50
47
55
00
52
55
50
57
56
00
tem
pe
ratu
re, o
C
con
cen
tra
tio
n, %
v/v
time, sec
conc 0.5m conc 1.2m conc 2.1m
temp 0.5m temp 1.2m temp 2.1m
LNG release OFF
Average air temperature
-20.0
-15.0
-10.0
-5.0
0.0
5.0
10.0
15.0
20.0
25.0
0.0
2.5
5.0
7.5
10.0
12.5
15.0
17.5
20.0
22.5
25.0
025 5
0 751
00
12
51
50
17
52
00
22
52
50
27
53
00
32
53
50
37
54
00
42
54
50
47
55
00
52
55
50
57
56
00
tem
per
atu
re, o
C
con
cen
tra
tio
n, %
v/v
time, sec
conc 0.5m conc 1.2m conc 2.1m
temp 0.5m temp 1.2m temp 2.1m
LNG release OFF
Average air temperature
Average water temperature
Water turned on

128
Natural dispersion: Concentration at 3.3 m downwind of the spill started to
increase as LNG release was continuous (Fig. 52 and Fig. 54). Average CH4
concentrations at 3.3m continued to increase as the LNG release was continued for some
time after turning the water sprays on. This is obvious as water action does not affect the
LNG vapor at this location. 3.3m downwind concentrations at 0.5m above the ground
are higher than concentrations at 1.2 m and 2.1 m elevation for both the tests. However,
Fig. 53 and Fig. 55 show that concentration reading, due to natural dispersion, near the
ground (0.5 m) at 11.3 m downwind, is smaller than the higher elevations (both 1.2 m
and 2.1 m) readings. Thus data clearly demonstrates that LNG vapor naturally gets
diluted, lighter and disperses upward as it travels further downwind.
Temperature data recorded during the natural dispersion actually demonstrate air
temperature. Fig. 52 and Fig. 54 show that average temperature 0.5 m above the ground
is lower than temperatures at 1.2 m and 2.1 m heights for both the tests. The temperature
data during the natural dispersion are consistence with the average concentration data,
but only closer to the spill location (3.3 m). It means that the cloud is colder and heavier
near the ground. Fig. 53 and Fig. 55 show that temperature data during natural dispersion
at 11.3 m downwind distance become inconsistent with the concentration data of the
same location. Though ground level concentration (0.5 m) is low at this location (11.3
m), temperature is still lower than the two upper elevations (1.2 m and 2.1 m). It means
that though LNG vapor naturally disperses upward and ground concentration reduces as
it travels downwind, vapors close to the ground are still cold and heavy.

129
Forced dispersion: Data at 11.3 m, after the water curtain activation (at 480 s
for test 1a and at 240 s for test2a) are considered effected by the forced dispersion (Fig.
53 and Fig. 55). Different behavior of concentrations due to forced dispersion at 11.3 m
downwind distance in two tests proves that the action mechanisms are different for the
two curtains. In the full cone test, concentrations at 1.2 m and 2.1 m heights started
decreasing immediately after the spray was turned on. The concentration plot at 0.5 m
height indicates a slight reduction in the rate of increase in concentration when the LNG
release was still continued. Again for the flat fan test, rate of concentration increase was
reduced due to the forced dispersion when the LNG was still releasing from the pipe.
Gas concentrations at 11.3 m downwind of the release for both the curtains continued to
decrease after discontinuing the LNG flow.
Fig. 53 shows concentration at 1.2 m height becomes the lowest and at 2.1 m
becomes the highest by the full cone curtain action. The change in CH4 concentrations
after the full cone spray region (11.3 m) at 2.1 m high is not very significant as the vapor
cloud could cross over the top of the water curtain without complete interaction. The
results indicate that the full cone water curtain could not provide enough momentum to
the cloud. Observation during the tests showed that this curtain produced enough
turbulence around it due to spiral flow pattern. Therefore the reduction in gas
concentration is mainly by better mixing with air. This discussion is also supported by
analysis provided later in this section.
Fig. 55 shows that the concentration at 0.5 m height is the lowest and 2.1 m
height is the highest for the flat fan test. The change in concentration at 2.1 m height for

130
the flat fan curtain is very significant. Comparison of CH4 concentration profiles at 0.5
m above ground for 11.3 m and 3.3 m downwind (Fig. 54 and Fig. 55) show significant
difference. For 1.2m above ground, average concentrations at 3.3 m downwind are
higher than 11.3 m downwind, both before and during water curtain application.
However for 2.1 m above ground, average concentrations at 11.3 m downwind are
higher than 3.3 m downwind, both before and during the entire period of water curtain
action. This difference indicates that the flat fan water curtain was dispersing the LNG
vapor upward through mainly by imparting momentum to the cloud than mixing and
diluting it with air. This discussion is also supported by analysis provided later in this
section.
The temperature data recorded during the forced dispersion at 11.3 m downwind
distance were not the air temperature any more. When the water was turned on all of the
sensors at this position got wet and read only the water temperature. The average water
temperature during the tests was 19.5° C. Average temperature profile at 0.5 m height is
always the lowest for both the test, which indicates the cloud is still heavier at ground
level than higher level. In Fig. 53, temperature at all the heights starts to decrease
initially when the curtain was turned on. The curves become constant below 15° C after
the release was stopped. In Fig. 55 temperature profile is consistent with the previous
test only during water curtain action and continued LNG flow. After the release was
discontinued, temperature starts to increase. The difference between the temperature data
from these two tests indicates that the full cone water curtain warms up the cloud more
than the flat fan spray curtain by transferring more heat.

131
5.3.2.3 Vaporization of LNG
One of the critical parameters controlling the dispersion of LNG vapor is the rate
of vapor produced. To understand the effect of a water curtain of a certain size, the
information on the size of the vapor cloud is essential. During the tests LNG was
delivered from the tanker with a stainless steel pipeline connected to a flexible hose and
released to the LNG release spot. The tanker contained commercially available LNG
with a composition of 99.8% methane. Thus, the hydrocarbon vapor generated was
mainly composed of methane. The temperature and pressure were 100 kPa and 110 K in
the tanker. LNG was released from the truck at an average rate of 2.5 ×10⁻³
m3/s (39.3
GPM) for 9.8 minutes and 3.5 ×10⁻³
m3/s (55.9 GPM) for 6 minutes in the full cone (1a)
and fan curtain (2a) tests, respectively. It was observed that when LNG comes out of the
pipe, some vapors were generated immediately due to flashing. It is also possible to form
some aerosol, which is a suspension of liquid droplets so small that they will not settle
out of the vapor/air mixture. The vapor and aerosol immediately contributed to the vapor
cloud that formed. Most of the liquid reached the concrete surface and formed a liquid
pool that evaporated. The total vapor evolved from the pool was the primary source for
the vapor cloud. Fig. 56 illustrates the vapor formation process from the liquid spill.

132
Fig. 56. Formation of LNG vapor cloud from continuous liquid release. Reprinted
from Rana et al. (2009).
Direct measurements to determine the vapor generation during the LNG release
were not taken. Only the liquid (LNG) flow rate in the pipeline was measured 1.5-2.5 m
away from the LNG truck. So in this analysis, analytical relationships for the LNG vapor
production are used. One relationship derived by Briscoe and Shaw (1980), and Hissong
(2007) are used to calculate total vapor generation or vaporization rate. The final form of
the relationship is:
evapflashvapor mmm (kg/s) (37)
Here liquidflash mfm (kg/s) (38)
liquidLNGliquid Qm (kg/s) (39)
radairsubevap mmmm (kg/s) (40)
Insulated Al Pipe:
OD 3-inch Flashed vapor
mv1 kg/s
Liquid
LNG
Qavg gal/min
ml kg/s
Concrete groundLNG Pool0.15 m
1.52mX1.52mX0.15m
enclosed spill location
Evaporated vapor
mv2 kg/s
Wind
u m/s
LNG vapor
mv = (mv1+mv2) kg/s

133
pool
Lsssub A
tL
TTkm
2/1
)(
(kg/s) (41)
L
TTAhm La
poolaair
(kg/s) (42)
L
Aqm
poolrad
rad (kg/s) (43)
Vapor coming out from the discharge pipeline was observed during the tests. Due
to the specification of the LNG discharge line, some of the LNG flashes before reaching
the discharge point of the hose because of heat transfer and some pressure drop. Study
with the piping system of the Fire School has shown that 5 to 20 % hydrocarbon vapors
can be produced along the pipeline, used in the tests, due to heat transfer from the
pipeline (Cormier, 2007). Since this vapor fraction was not measured in the test, and it
was observed that the volume of the flashed white vapor cloud emerging from the pipe is
large, an average of 20% flashing at the pipe outlet due to heat transfer is assumed
constant throughout the vaporization calculation, ignoring the pressure drop effects.
Though an enclosed area of 1.52m × 1.52m was made to contain LNG release
with several precautions to stop leakage, LNG leaked outside of the area. Approximate
size of the pool was measured after each test from the ice footprint remained on the
ground. The average measured pool area was approximately 5m2. Temperature of the
ground surface was approximately 25°C during the tests. Main difficulty in the
application of this relationship (Eqn 37) is the choice of appropriate values for the
thermodynamic properties. Vapor rate calculations are conducted considering pure

134
methane’s physical properties; liquid temperature (-160°C), liquid density (450 kg/m3)
and heat of vaporization (510 kJ/kg). Calculations also assume constant LNG flow rate
(mass flow rate) from the pipe. For the ground thermodynamic property, ks= 1.7 W/mK
and α = 4.16 × 10⁻⁷
m2/s are assumed as the properties of concrete. The assumptions are
based on the values provided by Briscoe and Shaw (1980). To determine the heat
transfer to the LNG pool from the air, ha is calculated from the formula provided by
Hissong (2007). The formula for ha for heat transfer to horizontal surface is:
ℎ𝑎 = 0.037 𝐿𝑖𝑢𝑎𝜌𝑎
𝜇𝑎
0.8
𝐶𝑎𝜇𝑎
𝑘𝑎
1
3 𝑘𝑎
𝐿𝑖 𝑇𝑎 − 𝑇𝐿 𝐴𝑝𝑜𝑜𝑙 (44)
All of the values required to solve the above equation are the properties of
ambient air at film conditions except Li, which is the length of the liquid pool. Here
“film conditions” means the average of the ambient air temperature and the pool (liquid
LNG) temperature (Hissong, 2007). Fig. 57 and Fig. 58 show vapor rates calculated for
the tests.

135
Fig. 57. Vapor flow rate for full cone curtain tests (test 1a and 1b).
Fig. 58. Vapor flow rate for flat fan curtain tests (test 2a and test 2b).

136
The figures indicate that the LNG vaporization rate decreased overtime as the
spill surface cooled down. During the continued LNG flow, due to the flashing from the
pipe, vaporization rate is higher than when LNG flow was turned off. The calculations
assume that the vaporization rate is uniform throughout the spill surface area of 5m2.
5.3.2.4 Dilution by Water Curtain
The main purpose of water curtain is to reduce the LNG vapor concentration
downwind of the curtain through forced dispersion. So the curtain effectiveness is
analyzed in terms of dilution and strength ratio in this paper. Dilution ratio is defined
here as the ratio of the average concentrations at 3.3 m and 11.3 m downwind distances
and at each height. In the calculations, the downwind progress of cloud is considered by
assuming that the cloud moves downwind with the constant speed of the wind. The
following relationship illustrates dilution ratio (DR) at a certain height:
ztx
tx
C
CDR
12
25
(45)
The time required for a parcel of the cloud to travel a certain distance is given by:
Wu
xxttt 25
12
(s) (46)
During the tests the total volumetric flow rate of water was measured. The effect
of water curtain in diluting the vapor cloud is analyzed in terms of strength ratio.
Strength ratio (SR) is defined as the ratio of water mass flux and LNG vapor mass flux at

137
the curtain location. The calculation of SR also considers the downwind progression of
cloud assumption stated before. The following equation illustrates the strength ratio (SR)
at the curtain location at a certain height:
zvapor
water
m
mSR
)
/
/(
2
2
smkg
smkg (47)
As DR is the ratio of concentration at two downwind positions, an effective
water curtain is expected to reduce the ratio to very lower value. Again as the water flux
is always almost constant; SR is then inversely proportional to the vapor flux. So a lower
SR value indicates larger vapor flux and vice versa. The area considered for the water
mass flux is the water flow surface area and the area considered for the vapor flux is the
measure pool area. Fig. 59 and Fig. 60 show the dilution and strength ratio results for the
two tests.

138
Fig. 59. Dilution and strength ratio: test 1a. Reprinted from Rana et al. (2009).
In Fig. 59, the dilution ratio decreases after the water application for each height
until the LNG release was continued. The curves then become almost flat for the higher
elevations but slightly increase at 0.5m after the LNG release was discontinued. DR for
2.1 and 1.2 meters, which are greater than 1.0, indicate that initially concentrations at
11.3m downwind distance were much higher than 3.3m distance for these heights.
Eventually during the forced dispersion, when the water curtain is active, the ratios
become lower than 1.0. The average concentration change by the full cone spray
decrease but the curves become flat over time after the LNG spill was stopped. This
curtain shows more effectiveness during the lower SR. Because of spiral flow nature, it
creates turbulence near the spray region, which allows better and efficient interaction of
air with larger vapor flux could than the interaction of the same air with smaller cloud.
0.0
0.5
1.0
1.5
2.0
2.5
3.0
3.5
4.0
4.5
5.0
5.5
0.0
0.5
1.0
1.5
2.0
2.5
45
0
50
0
55
0
60
0
65
0
70
0
75
0
80
0
85
0
90
0
95
0
10
00
SRDR
time, sec
Test 1- Concentration & Source Strength Ratio
DR 0.5m DR 1.2m DR 2.1mWC On LNG Off SR
LNG release discontinued
Water turned on

139
Again concentration change at ground level is not very significant because vapor might
escape through the gaps. The concentration change for this curtain should be mainly due
to effective mixing with air as it failed to push the vapor upward efficiently.
Fig. 60. Dilution and strength ratio: test 2a. Reprinted from Rana et al. (2009).
In Fig. 60, because of the water action, the dilution ratios decrease at 1.2 m and
2.1 m but remains constant at 0.5m after LNG release was discontinued. The curves
remain almost steady for lower heights but increase at 2.1 m when the release was still
continued. The dilution ratios at 2.1 m are always greater than 1.0. This indicates that
concentrations at 11.3 m downwind distance were always much higher than the
concentrations at 3.3 m distance at this height. The average concentration change by the
0.0
0.5
1.0
1.5
2.0
2.5
0.0
0.5
1.0
1.5
2.0
2.5
3.0
3.5
4.0
20
0
25
0
30
0
35
0
40
0
45
0
50
0
55
0
60
0
SRDR
time, sec
Test 3- Concentration and Source Strength Ratio
DR 0.5m DR 1.2m DR 2.1m WC on LNG off SR
LNG release discontinued
Water turned on

140
flat fan spray is because of momentum effect. This curtain shows more effectiveness
during the higher strength ratio (SR). This is because of the fact that larger momentum
creates a solid barrier to the passage of the cloud and pushes it upward. So the dilution
by this curtain is mainly through mechanical effects, not by mixing. Above discussion
are also supported by the study stated later in this section.
5.4 Experiment of 2008
5.4.1 General Description
The 2008 experiment was the repetition the previous experiment, with some
modification in the spill area and spill discharge line. Similar water spray curtains were
used in individual test sets and the first water curtain tests was conducted with the full
cone spray curtain and the second set was with flat fan curtain. A total of three tests were
completed during 2008 tests. The wind speed averaged 4.5 meters per second (10.3
miles per hour) and blew mainly from the south-west to south region. The average
ambient temperature during the tests was 296 K and humidity was 50.6%. Table 13
includes the average flow rates and total flow time of LNG and water and average
pressure of water at the curtain inlet for each test.

141
Table 13. Average flow and pressure data for 2008 experiment.
Measured Parameters
Test 1
Test 2:
Full Cone
Test 3:
Flat Fan
LNG flow rate, m3/s
LNG total, m3
Water pressure, kPa [psi]
Total water flow rate, m3/s
Water flow rate per nozzle, m3/s
Water total, m3
3.2 × 10⁻³
2.50
N/A
[N/A]
N/A
N/A
N/A
2.9 × 10⁻³
1.74
241.3 ± 34.5
[35 ± 5]
26.3 × 10⁻³
3.3 × 10⁻³
26
2.6 × 10⁻³
1.87
317.1 ± 34.5
[46 ± 5]
13.3 × 10⁻³
13.1 × 10⁻³
10
5.4.2 Results and Discussion
During the experiment, gas detectors and thermocouples were placed so that they
could cover more downwind distance than the 2007 experiment. The tests were
conducted for longer time than the previous year. However data shows very small
concentrations and almost ambient temperatures of the LNG vapor cloud were recorded
at in different downwind distances and heights. Only the sensors placed much closed to
the spill area (at 1m distance) detected concentration and temperature. Readings in
further downwind locations were so low that it seemed that the detectors and
thermocouples did not sense any vapor cloud to respond. Fig. 61 shows the detector and
thermocouple reading 1 m downwind from the spill for test 1 and test 2.

142
Fig. 61. Concentration and temperature reading at the spill source: 2008
experiment.
In the above figure, the blue line, red line and the brown line is for the sensors at
0.5 m, 1.2 m and 2.1 m elevations respectively The second spill in the figure represent
start of the second test. Two causes were identified for the very low readings (almost 0
%v/v) at far downwind distances. First one is the very high wind speed and turbulence
occurred during the tests. Because of these, LNG vapor might got diluted and dispersed
very early and fast. The higher wind speed expedited the natural dispersion process and
the cloud was diluted below flammable limit without the aid of the water curtain.
The second cause is the low rate of evaporation. The setup of the spill area for
these tests slightly differs from 2007 tests. The spill container in these tests was a box
with 2-inches thick concrete base. The LNG release pipe size was also modified to L-
shaped pipe with larger diameter. These two changes affected a lot in vapor generation.
-60.0
-50.0
-40.0
-30.0
-20.0
-10.0
0.0
10.0
20.0
0.0
10.0
20.0
30.0
40.0
50.0
01
20
24
03
60
48
06
00
72
08
40
96
01
08
01
20
01
32
01
44
01
56
0
16
80
18
00
19
20
20
40
21
60
22
80
24
00
25
20
26
40
tem
pe
ratu
re, d
eg
C
CH
4co
nc.
% v
/v
time, sec
LNG spillLNG spill
OFFLNG spill

143
The pipe shape and size reduced vapor flashing (almost none) and turbulence and the
spill box reduced heat from the base. Thus the vapor production was significantly
reduced and it affected the downwind concentration.
In the tests temperatures of concrete surface were measured. The thermocouple
positions inside the base are shown in Fig. 30. Fig. 62 shows the temperature inside the
concrete base during the LNG spill for test 1 and test 2.
Fig. 62. Temperature of the concrete surface.
The above figure shows the effect of the temperature of LNG in cooling down
the concrete base. The mid thermocouple (TN-5) cool down faster than the others as it
was closer to the top surface. So it is obvious that the heat transfer from the base reduces

144
significantly and heat transfer from the surroundings dominates in LNG vaporization.
The volumetric LNG flow rate from the truck to the spill location was also recorded in
the tests. The vaporization process for these tests is described by the following Fig. 63.
Fig. 63. Formation of LNG vapor cloud from continuous liquid release, 2008 tests.
Vapor generation from the spill for the tests was calculated with the similar
analytical relationships described in section 5.3.2.3 are used. Average temperature of the
Insulated Al Pipe:
OD 3-inch
Liquid
LNG
Qavg gal/min
ml kg/s
ConcreteLNG Pool0.15 m
1.52 m X 1.52 m X 0.15 m
enclosed spill area
Evaporated vapor
mv2 kg/s
Wind
u m/s
LNG vapor
mv = (mv2) kg/s
OD 7-inch
Tg
Concrete ground

145
base is considered in this calculation. Fig. 64 illustrates the vapor rate from the liquid
spill for test 1. Here calculation assumes that vaporization rate is uniform throughout the
spill surface area.
Fig. 64. Vapor rate for test 1 of 2008 experiment.
The above plot, which is for the first spill, demonstrates that the surface cooled
very fast and vapor was generated only due to heat transfer from the air. The second and
third spill started within a very short time after the first and second spill respectively.
From Fig. 62 and Fig. 64, it can be stated that, vaporization rate during the second and
third spill, in which water curtains were tested, were relatively lower and produced vapor
cloud with smaller size which could not travel further downwind distance.

146
It is obvious from the test results that only heats from the air and atmosphere
cannot produce significant amount of LNG vapor though the liquid release is continuous.
In the tests the surface cooled down faster due to very small thickness of the base. Heat
transfer from the surface/substrate is the main factor in vapor generation from LNG pool
to create a reasonable vapor cloud to travel far downwind distances. Because of higher
wind speed, turbulence and atmospheric temperature, the smaller vapor cloud produced
from the pool was diluted very early and quite rapidly to become a lighter cloud and thus
dispersed upward. Thus as the vapor could not travel much longer horizontal distances,
the gas detectors placed in far downwind locations, after the spray area, did not record
any significant concentration for further analysis.
5.5 Experiment of 2009
5.5.1 General Description
Spill tests were conducted with three types of water curtains. A total of four spill
tests were completed in a 1½ to 2 hour period. The simulated scenario for the tests was
continuous LNG release from pipe on a surface. In each test, release was conducted from
the 7" OD heavily insulated Al-pipe on top of the surface of water which filled Pit 1
(3.05 m x 3.05 m x 1.22 m). To limit the spread of the LNG pool only to the area of
1.52 m x1.52 m, on the water surface, it was enclosed with four wooden bars of 0.15 m
heights. 1.22m deep water settled below the LNG spill area. The test data can be divided
into four tests with three water curtains. Two of these water curtains were directed
vertically upward and the other one was downward and all positioned perpendicularly to

147
the prevailing wind direction, at fixed downwind distances from the spill location. The
downward curtain was placed closer to the spill than the others. All of the curtains were
tested individually at first and finally all together. The chronological order of the curtain
tests was: (a) test 1: upward conical, (b) test 2: upward fan, (c) test 3: downward conical,
(d) test 4: all three combined. LNG vapor was allowed to disperse naturally for some
time between consecutive two tests. The following figure (Fig. 65) shows a snapshot
from the first test.
Fig. 65. LNG dispersion test of 2009.
It was observed during the 2007 and 2008 experiments that due to unsteady wind
direction and wind’s crosswind turbulence, LNG vapor did not always travel straight to
the setup. As the outdoor LNG test setup is always based on predicted wind direction
and working in the flammable and cryogenic LNG cloud is restricted, the setup cannot
be relocated according to the change of wind direction once a test is started. So this time

148
the vapor dispersion path was covered with barrier walls on the two sides to prevent the
vapor from going sideways and escaping the setup. The new setup with barriers
performed well as expected.
During the tests, wind blew mainly from the south to north region at 5 m/s
average speed and wooden walls were placed in the east and west sides of the dispersion
path to guide the vapor towards the curtains and sensors. The average ambient
temperature was 28.3º C and humidity was around 40% (RH). Approximately 8.5 m3
(2300 gal) LNG and 36 m3 (9600 gal) water were used in the tests. Table 14 includes the
average flow rates and total flow time of water and average pressure of water at the
curtain inlet for each test.
Table 14. Average water flow rate and pressure data for 2009 experiment.
Measured
Parameters
Test 1 Test 2 Test 3 Test 4
Upward
conical (8)
Upward
fan (1)
Downward
Conical (6)
All:
combined
Water pressure, kPa
[psi]
Total water flow rate,
m3/s
Water flow rate per
nozzle, m3/s
Water total, m3
327.4 ± 17
[47.5 ± 2.5]
36.5 × 10⁻³
4.6 × 10⁻³
14.6
534.2 ± 17
[77.5 ± 2.5]
11.4 × 10⁻³
11.4 × 10⁻³
3.9
227.5 ± 13.8
[33 ± 2]
8.0 × 10⁻³
1.33 × 10⁻³
1.84
--
--
4.55 × 10⁻²
--
16.38
Both LNG release time and water flow time (turning on and off) were different
for the tests. As these field tests deal with flammable LNG vapor, whose phenomena of
flow and dispersion are still completely unknown, the decisions of turning on and off the

149
water curtain and the LNG flow mostly depended on the situation during each test. The
detail causes are similar to what has been discussed in section 5.3.
Pressures of both the conical curtains were measured at the curtain pipe inlets
and flat fan curtain pressure was measured at the spray head. The conical curtains were
fabricated with eight (for upward) and six (for downward) nozzles where as only one
nozzle head was used for the flat fan curtain. So less pressure was achieved in the
conical curtains. Studying the test data, Fig. 36 and Fig. 37, it can be identified that each
upward cone nozzle (TF48) operated around 119-159 kPa and at these pressures, the
range of SMD of the droplets is 0.98-0.89 mm. The pressure range was higher than 2007
tests and thus smaller drops could be produced this time. On the other hand the flat fan
curtain operated around 259 kPa, which is much less than 2007 (and 2008) tests and the
SMD of the droplets at these pressures is 1.94 mm (larger than 2007 and 2008). The
working pressure for the downward nozzles (TF24) were 114-170 kPa at which it
produces drops of diameter 0.62-54 mm.
Water curtain heights depended on the water pressure. So the heights of the
curtains were different for different test. Table 15 lists the average water curtain heights
achieved by the upward sprays during the tests. Fig. 66 shows the water curtain heights
from snap shots. The total height of the water curtains were measured from pictures and
videos. The height was measured by comparing with 2.3 m high tripod poles.

150
Table 15. Heights covered by the upward water curtains in 2009 experiment.
Test Water Curtain Coverage (Avg Height), m
1 Upward conical 4.6
2 Upward fan 4.9
4 All:
Conical
Fan
3
4
Fig. 66. Water curtain coverage in 2009 experiments. Top left: conical upward, top
right: fan, bottom left: conical downward, and bottom right: combined.
5.5.2 Results and Discussion
5.5.2.1 Concentration
LNG was continuously released on water surface to obtain a fixed pool and
produce almost a steady cloud. This time only concentration of the dispersing LNG

151
vapor (methane) cloud was measured continuously in different downwind distance.
Though all of the gas detectors sense methane in % v/v level, the three detectors placed
in the furthest distance measured methane in % LFL unit. Prior to the experiment, all the
gas detectors were calibrated with methane gas to check their accuracy and sensing time.
Fig. 32 and Table 7 of section 1 provide information of the test setup and sensors’
position. The following figure (Fig. 67) shows average gas detector reading during the
entire experiment at the pit edge (0 m) in three elevations. Blue, brown and purple colors
represent concentration at 0.5 m, 1.2 m and 2.1 m respectively. The water curtains were
located further downwind (see Table 8 for water curtain location). So the vapor cloud at
this location was always free from the water curtains’ affect when they were activated
and gas concentration reading is for natural dispersion.

152
Fig. 67. Average concentration (natural dispersion) data at the pit edge (0 m
downwind) all four tests of 2009.
Fluctuations are identified in the methane concentration readings because of
location. This location was very close to the spill area and turbulence created by the
momentum of the spill and vapor flow from the surface cause the fluctuations. Again as
the wind’s direction was frequently changing, vapor tried to drift sideways but the
barriers prevented the cloud and guide it towards the water spray region. Thus the
barriers also take part n creating the turbulence, which might also affect in dilution at
this stage.
Concentration at 0 m downwind of the spill started to increase as LNG release
was continuous. After the activation of the water curtains in different tests, it is
0.0
5.0
10.0
15.0
20.0
25.0
30.0
35.0
40.0
45.0
50.0
55.0
60.0
65.0
70.0
0
12
0
24
0
36
0
48
0
60
0
72
0
84
0
96
0
10
80
12
00
13
20
14
40
15
60
16
80
18
00
19
20
20
40
21
60
22
80
24
00
25
20
26
40
CH
4C
on
cen
trat
ion
(%
v/v
)
Relative Time, [sec]
z=0.5 x0
z=1.2 x0
z=2.1 x0
UFL
LFL

153
considered here that they did not affect the LNG vapor at this location because of the
wind and vapor direction. Peaks of the concentrations indicate that at 0.5 m above the
ground concentration are always higher than the other elevations during the whole time.
Again reading at 1.2 m elevation, in this location, is smaller than 0.5 m but higher than
2.1 m. This is obvious as the LNG vapor was coming from the ground surface,
concentration should be the maximum at the surface and the concentration should
decrease along the cloud height near the spill source. Data also shows that the cloud
concentration is always in the flammable region (5-15% v/v). Fig. 68 shows
concentration reading approximately 10 m from the pit edge.
Fig. 68. Average concentration (both natural and forced dispersion) data 10 m
from the pit edge for all four tests of 2009.
0.0
2.5
5.0
7.5
10.0
12.5
15.0
17.5
20.0
0
12
0
24
0
36
0
48
0
60
0
72
0
84
0
96
0
10
80
12
00
13
20
14
40
15
60
16
80
18
00
19
20
20
40
21
60
22
80
24
00
25
20
26
40
CH
4C
on
cen
trat
ion
(%
v/v
)
Relative Time, [sec]
z=0.5 x10
z=1.2 x10
z=2.1 x10
FC ON FC OFF FF ON FF OFF MS ON MS OFF ALL ON ALL OFF
FC: Full ConeFF: Flat FanMS: Mist SprayALL: FC+FF+MS
UFL
LFL
FC Water Curtain FF Water Curtain MS Water Curtain ALL Water Curtain

154
In the above figure, the blue, brown and purple colors represent data at 0.5 m, 1.2
m and 2.1 m respectively. The figure shows data for all the four runs. Due to time
limitations, all of the tests were conducted simultaneously without allowing sufficient
time between two runs to completely evaporate the pool from the previous spill.
However this limitation should not affect the test result as the main objective of the tests
was to identify the effects of each water curtain on continuous LNG release. Thus the
figure shows both natural and forced dispersion data and it can be divided into four
independent tests and each test duration is as follow:
Test 1: upward conical curtain (0 s < t ≤ 1000 s)
o 0 s < t ≤ 600 s: natural dispersion – without curtain activation
o 600 s < t ≤ 1000 s: forced dispersion – with water curtain
Test 2: upward flat-fan curtain (1005 s < t ≤ 1445 s)
o 1005 s < t ≤ 1110 s: natural dispersion – without curtain activation
o 1110 s < t ≤ 1445 s: forced dispersion – with water curtain
Test 3: downward conical curtain (1450 s < t ≤ 1920 s)
o 1450 s < t ≤ 1650 s: natural dispersion – without curtain activation
o 1650 s < t ≤ 1920 s: forced dispersion – with water curtain
Test 4: combination of all curtains (1925 s < t ≤ 2280 s)
o 1925 s < t ≤ 2010 s: natural dispersion – without curtain activation
o 2010 s < t ≤ 2280 s: forced dispersion – with water curtain
At 10 m downwind location, the ground level (0.5 m) concentration is the
minimum and concentration at 2.1 m elevation is the maximum. Thus it is clear that

155
LNG vapor gets diluted, lighter and disperses upward as it travels further downwind
even when the water curtains were inactive. The purpose of the water curtain is to
enhance this dispersion process with some external force. The figure also shows that the
ground level concentration at 10 m from the pit edge is almost below the lower
flammability limit (5% v/v) but higher elevation cloud concentration is in the flammable
zone.
From the spill time to the end of the data recording time, the cloud concentration
at different height changed continuously. When no curtains were activated,
concentrations continuously increased. Sharp increase in the concentration at the highest
elevation demonstrates the natural dispersion process of LNG. Right after the water
curtain activation, the concentration data can be considered to be affected by the forced
dispersion. Different behavior of concentrations due to forced dispersion in four
individual tests proves that the action mechanisms to control LNG vapor cloud were
different for the three curtains as well as for the combined curtain. In test 1,
concentration trends at all three heights started to decrease immediately after the spray
was turned on and the trend continued. In test 2, although concentrations at all three
elevations started to decrease immediately after the spray was turned on, concentration
readings at 2.1 m started to rise, after some time. This increasing trend became higher
than the natural dispersion case. However the concentrations at the lower elevations kept
decreasing. In the third test, ground concentration (0.5 m) shows inconsistent decrease
but the concentrations at higher elevations continued the increasing trend, but at smaller

156
rate. Finally the combined effect of all the curtains decreased the concentration in all
elevations, but the decreasing rate at 2.1 m was lower than the other two elevations.
Thus all of the curtains show some effects in the LNG vapor cloud
concentrations but the effects are different in terms of the mechanisms. The full cone
water curtain could not provide enough momentum to the cloud. The reduction in gas
concentration was mainly by mixing with air. However, the flat fan water curtain was
dispersing the LNG vapor upward mainly by imparted momentum to the cloud, not by
effective mixing and dilution with air. The results from the downward spray showed
concentration increase in upper elevations. As the sprays were down facing, it was not
possible for the water curtain to impart upper momentum to the cloud. Only potential
cause is that the vapor became warm and dilute by the spray action. So the cloud
dispersed upward and concentration at 2.1 m height increased. The analysis discussed
more elaborately later in this current and the next sections.
To understand the effectiveness of the water curtains in reducing LFL distance,
%LFL (0-5% v/v) concentration at similar elevations was measured 14 m from the spill
edge in the tests. Data showed that LFL concentration was reduced significantly in all
the three heights, in all four tests. Fig. 69 illustrates the LFL concentration data recorded
at 14 m downwind distance from the spill.

157
Fig. 69. LFL concentration (both natural and forced dispersion) data 14 m from
the pit edge for all four tests of 2009.
5.5.2.2 Vaporization of LNG
In 2009 experiment, several thermocouples were placed in the LNG spill area
below and above the water surface. Thermocouple locations are given in Fig. 33.
Difference between two consecutive thermocouples’ heights was 3.175 cm. The purpose
of using these thermocouples was to measure the evaporation rate during the LNG
release. The LNG spill area was enclosed to contain the liquid LNG during the tests with
wooden bars. The area of the spill location was 1.52 m × 1.52 m and the depth of the
enclosed area was 30.48 cm above the water surface. Nine thermocouples were placed in
nine different elevations to cover 25.4 cm height from the water surface. Fig. 70 shows
0.0
10.0
20.0
30.0
40.0
50.0
60.0
70.0
80.0
90.0
100.0
0
12
0
24
0
36
0
48
0
60
0
72
0
84
0
96
0
10
80
12
00
13
20
14
40
15
60
16
80
18
00
19
20
20
40
21
60
22
80
24
00
25
20
26
40
CH
4C
on
cen
trat
ion
(%
LFL)
Relative Time, [sec]
z=0.5m conc % LFL
z=1.2m conc % LFL
z=2.1m conc % LFL
FC ON FC OFF FF ON FF OFF MS ON MS OFF ALL ON ALL OFF
FC: Full ConeFF: Flat FanMS: Mist SprayALL: FC+FF+MS
FC Water CurtainFF Water Curtain MS Water Curtain ALL Water Curtain

158
the thermocouples’ temperature reading at eight different heights from the water surface.
One thermocouple installed at 22.225 cm elevation failed during the experiment.
Fig. 70. Temperature measurement of the liquid pool at different heights for 2009
experiment.
When LNG was spilled onto the water surface, initially all of the liquid
evaporated instantly due to large temperature difference between the LNG and the water.
However continuous release of LNG eventually started to cool down the water and then
LNG started to accumulate above water. As the pool was contained with a wooded
enclosure, liquid level started to rise. Portion of the pool continued to evaporate due to
the heat transfer from the water and the surrounding. A constant rate of 6×10⁻³
m3/s

159
(approx) LNG release rate was maintained during the tests and it was turned on and off
to avoid overflow from the spill enclosure. The above figure shows that the cryogenic
LNG cooled down the water surface and the thermocouples, placed in different heights,
rapidly. It indicates that the heat transfer from the water was enough to instantly
vaporize the all of the continuously released liquid. Fig. 71 shows the vaporization rate
calculated from the temperature data. Evaporation rate is calculated from the
temperature reading by using the following relationship:
Evaporation Rate = Release Rate – Accumulation Rate (48)
Fig. 71. Vapor rate from the LNG pool for 2009 experiment.

160
As the release rate is considered to be constant, accumulation rate is the main
factor in calculating the evaporation rate. The accumulation rate was calculated form the
temperature reading. Due to continuous LNG release (and evaporation), when LNG pool
reached a certain height, the thermocouple positioned at that location instantly read the
liquid temperature, -165° C (approximately). As LNG was continuously flowing, the
thermocouple at that level and all the thermocouples below remain at -165° C (or very
close). After some time, the temperature of another thermocouple installed at upper
elevation changed to -165° C, as the liquid level continued to increase. The ratio of the
difference between the heights (∆h) of the thermocouples and the time difference (∆t=t2-
t1) for the liquid pool to reach from one thermocouple to another, gives the velocity
(∆h/∆t) of liquid level rising. Accumulation rate is then calculated by multiplying this
ratio with LNG density (450 kg/m3). The accumulation rate calculated for a certain time
difference is considered to happen at the average of those two times, i.e. at (t1+t2)/2.
Results show that vaporization rate initially was close to the spill rate and then it
decreased rapidly almost to a constant value. Throughout the period the water curtain
remained active the vaporization rate remained constant at 0.2 (±0.05) kg/m2s. The
calculation assumes that the vaporization rate is uniform throughout the 1.52 m × 1.52 m
spill surface area.
5.5.2.3 Dilution by Water Curtain
The water curtain effectiveness is analyzed here in terms of concentration ratio
(dilution ratio). The ratio is defined here as the ratio of the average concentrations at 0 m

161
and 10 m downwind distances and at each height. The dilution ratio (DR) relationship
provided earlier (eqn 45) in section 5.3.2.4 is similar to this concentration ratio used
here. It is assumed that for each height concentration at 0 m is what coming into the
water spray and concentration at 10 m is what going out of the spray. As this ratio is the
ratio of concentrations at two downwind positions, an effective water curtain is expected
to reduce the ratio to very lower value. In the calculations, the downwind progress of
cloud is considered by assuming that the cloud moves downwind with the constant speed
of the wind (5.1 m/s). Fig. 72 to Fig. 74 show the concentration ratio calculation results
for the tests.
Fig. 72. Concentration ratio at 0.5m elevation in 2009 experiment.

162
Fig. 73. Concentration ratio at 1.2 m elevation in 2009 experiment.
Fig. 74. Concentration ratio at 2.1 m elevation in 2009 experiment.

163
The figures identify that during the times when any of the sprays was active, the
concentration ratios show increasing trends in all heights. This is obvious as the LNG
spill on the water surface was continuous, concentration at 10 m distance should keep on
increasing over time if there are no interruptions for any mitigation device. In the first
test with the upward conical curtain, the ratios decreased right after the water application
for each height. Decrease in the ratios for all the heights indicates that the curtain
controlled the cloud mainly through dilution and mixing effects. As the concentration at
2.1 m did not increase, it means that it did not lift the cloud upward and thus could not
provide enough momentum from the droplet velocity to the cloud. Results after the fan
spray action show that the ratios decreased in 0.5 m and 1.2 m elevations but
significantly increased at 2.1 m height. The larger (coarser) droplets of the spray mainly
imparted high momentum to the cloud, which reduced the concentrations at the lower
elevations but increased the 2.1 m elevation concentration right after the spray region. In
the downward spray (mist type) calculations, the concentration ratio decreased at the
ground level and remains almost constant throughout the water flow time at higher
elevations of 1.2 m and 2.1 m. The fact is this spray could not impart upward momentum
as it is faced downward. The concentrations at the upper portion of the vapor cloud only
could increase if the cloud disperses upward by becoming lighter. So the spray was
effective in warming or diluting the LNG cloud. The action of the combined water
curtain system reduced the concentration ratio in all heights of the vapor cloud. So each
of the curtains showed their efficiencies in different mechanisms and thus the cloud
concentration downwind of the spray region was reduced. However, the reduction by the

164
combined action is not very significant compared to the single upward conical spray
action. Based on the above results the conical spray was much more effective than the
other two and combined in terms of dilution and mixing. The downward spray showed
better results in terms of heat transfer. To support the above discussion and to determine
the actual effectiveness of the sprays of different drop size, width and flow pattern, more
analysis of the experimental data is conducted later in the section with support from
some theoretical calculations.
5.6 Study of Water Spray Action Mechanisms
Generally some physical processes are involved when a water spray is used to
control and disperse LNG vapor cloud. These processes may include (i) mechanical
effects of creating a barrier to the passage of a gas cloud, (ii) entrainment of air into the
water spray and dilution of the gas cloud with entrained air, (iii) thermal effects between
the gas cloud, water droplets, and entrained air, and (iv) imparting upward momentum to
an incoming cloud when the water flow is upward. Actual actions of a water spray may
consist of all or any combination of these mechanisms. Since the overall interaction
process among the vapor cloud, air and water droplets of a spray is a sophisticated
phenomenon as well as complex, study of the spray mechanisms and their effects has
been conducted individually in this research. As the effect of barrier was observed
during the experiments; the study includes effects of heat transfer, air entrainment and
momentum.

165
5.6.1 Heat Transfer by the Sprays
Heat transfer calculation is performed to identify the rate of heat transferred to
the cloud by the water curtain during forced dispersion process. In the experiments,
thermocouples were installed in the spray regions to measure the water temperature
when the sprays were activated. Thus the water spray temperature was monitored.
During the natural dispersion process, when the sprays were inactive, temperature
readings were indicating the air/cloud temperature. As soon as the water was turned on
the reading started to indicate the water drop temperatures because the thermocouples
were in the spray area and water influenced the reading. Form the temperature reading
the heat loss to the cloud (and air) per unit mass of water was determined by the
following relationship:
readingwaterp TTcqwater
(49)
Thermocouples were installed in three elevations and in different crosswind
locations in the spray area. It was observed that after the water curtain activation and due
to LNG vapor –water interaction, the temperature reading reached water temperature
instantly and then started to drop. The thermocouples placed in the LNG vapor cloud
path showed more effective readings. These thermocouples were mainly located in the
middle of the spray region. This phenomenon indicates that the water curtain was losing
heat due to the better interaction with colder cloud (and also the air). Temperatures
recorded in three elevations (0.5 m, 1.2 m and 2.1 m) were very close and so in the heat
transfer calculation average of temperature recorded in different heights is used to
represent average temperature of the spray region. Fig. 75 and Fig. 76 show the average

166
temperature change with respect to test time, calculated from average spray temperature
in 2007 and 2009 experiments.
Fig. 75. Change in water spray temperature reading in 2007 experiment.
Fig. 76. Change in water spray temperature reading in 2009 experiment.
0.00.51.01.52.02.53.03.54.04.55.05.56.06.57.07.58.08.59.09.5
10.0
0
30
60 90
120
150
180
210
240
270
300
330
360
Ch
ange
in te
mp
era
ture
, de
g C
Relative test time, sec
Full Cone Test 1: Avg 6.6 C
Full Cone Test 2: Avg 8.0 C
Flat Fan Test 1: Avg 5.5 C
Flat Fan Test 2: Avg 5.7 C
0.0
0.5
1.0
1.5
2.0
2.5
3.0
3.5
4.0
4.5
5.0
5.5
6.0
6.5
7.0
7.5
8.0
0
30 60 90
120
150
180
210
240
270
300
Ch
ange
in t
em
pe
ratu
re, d
eg
C
Relative test time, sec
Test 1: Full ConeAverage: 4.5 C
Test 3: Mist (down)Average: 6.5 C
Test 2: Flat FanAverage: 2.5 C

167
Initial water temperature for 2007 and 2009 experiments were 19.64 (±0.51) °C
and 28 (±0.5) °C respectively. Table 16 lists the average temperature changes and
calculations of heat loss by the water spray from the two experiments. Calculations were
performed assuming cp (water) = 4.186 J/gm°C.
Table 16. Average temperature change and heat loss calculation.
Experiment
Water
Curtain
[# of
nozzle]
Water flow
rate/nozzle
×103 [m
3/s]
Droplet size
(SMD)
[mm]
Change in spray
temperature,
∆Tw [°C]
Heat
transfer by
spray, qavg
[J/gm]
2007
Full Cone
[7]
2.2 ±0.70 1.35 ±0.05
6.61 ± 2.2 27.67
2.2 ±0.14 8.03 ± 0.65 33.61
Flat Fan
[1]
15.1 ±0.46 1.55 ±0.05
5.47 ± 0.98 22.90
15.5 ±2.30 5.68 ± 0.50 23.78
2009
Full Cone
[8] 4.6 ±0.70 0.935 ±0.045 4.50 ± 0.4 18.84
Flat Fan
[1] 11.4 ±0.50 1.94 ±0.05 2.50 ± 0.27 10.47
Mist
Cone
[6]
1.33 ±0.07 0.58±0.04 6.50±0.55 27.21
The water curtain temperature change was not very significant and thus
calculated heat released by the water curtain is also low. However it is clear from the
results that full cone spray provides higher heat than the fan spray. Though the fan spray
can give higher flow rate and larger crosswind coverage, temperature change by the cone
spray is larger due to relatively smaller drop size and wider spray area (downwind).
Although curtains were closer to the spill source as well as the water flow rates and
water curtain coverage were relatively higher in 2009 tests compared to 2007 tests, the

168
temperature change and thus the calculated heat losses by the water were lower in 2009.
It may be because the LNG vapor was already warmed up due to the difference in
atmospheric conditions. The temperature, heat flux and wind speed were higher in 2009
than 2007. Therefore it can be concluded that water curtain is able to provide heat to the
cloud due to heat transfer between droplets and LNG vapor cloud. Overall the results
show that water curtain can provide heat to the mixed gas cloud and the full cone curtain
is more effective in terms of heat transfer than the flat fan spray. However the mist type
spray provided highest heat to the cloud in 2009 tests. So the heat transfer mainly
depends on drop size and spray width.
It was also observed that methane concentration was somewhat little higher
further downwind (13.7 m) than right after the spray region (11.3 m), for all the tests in
2007. This indicated that LNG vapor was not warm enough to become positively
(/neutrally) buoyant. So instead of dispersing upward by the curtain action, LNG vapor
fell down to the ground at further downwind distances. Ineffective heat transfer between
water, LNG and air could not dilute the LNG vapor significantly. It could be implied
from the results that the heat from both curtains was not adequate in 2007. This might be
because of the water drop sizes and droplet terminal velocities. Both the droplet size and
droplet velocity were not adequate enough to create large surface area and higher contact
time to heat the vapor adequately. This situation did not repeat in 2009 because when the
water curtain interacts with the LNG vapor, the cloud was already warmer naturally.
Higher atmospheric temperature, solar flux and wind speed made the LNG vapor cloud
warmer and lighter near the spill source, before it reaches the water curtain. So the heat

169
exchange between the water and vapor/air was not very significant and the water curtain
increased the vapor cloud’s dispersion process mainly by dilution and momentum
effects.
5.6.2 Air Entrainment into Sprays
Water sprays are used for the dispersion of hazardous vapor clouds mainly using
the feature of air entrainment into the spray. Air entrainment into the water spray occurs
due to the momentum transfer between the water droplet and surrounding air. When
entrained air comes into the cloud, the gas cloud concentration can be reduced
depending on the degree of the mixing between them. A theoretical analysis of the air
entrainment into the sprays is carried out in this research with the simple air entrainment
model discussed earlier in section 4. 60° full cone and 180° fan type nozzles were used
in 2007 experiment to make full cone and flat fan water curtains. Both of them were
upward water curtains. In the 2009 experiments an additional downward water curtain
made with 60° full cone spray were introduced.
This study mainly focuses on determining the entrained air velocity and
volumetric air entrainment rate along the axis of the sprays used in the experiments.
Though the experiments were conducted in an outdoor facility, this analysis considers
quiescent surroundings and assumes that wind velocity has no effect on the air
entrainment into the spray. The model, used for the analysis, can solve for both upward
and downward conical sprays. However it was studied and mentioned with evidence by
Heskestad et al. (1981) that this type of model can also accommodate nonconical spray

170
with appropriate approximation. The fan spray used in the research produces flat shaped
flow pattern which is not constant along the height. It was observed that flow pattern
makes approximately 15° angle at the nozzle tip. So to conduct calculation for the fan
spray, a 15° conical flow pattern is considered to resemble a flatter spray pattern than
usual wide conical spray. For the calculation it is necessary to have information on some
parameters. The parameters, γ, β and ξ in the model depend on spray cone angle,
discharge velocity and nozzle diameter. Information on cone angles and diameters are
specified in the spray specifications and the discharge velocities used in the calculation
were determined from experimental measurements of water flow rate and water
pressure. The solution of the model is nondimensional form. The parameter CM was used
to convert the nondimensional result to dimensional form assuming CM = 0.95. The
assumption was made by considering the initial droplet velocity was almost equal (95%)
to the nozzle discharge velocity. Sauter mean diameter (SMD) was considered for the
drop size. For the water and air property it was assumed that ρw = 1000 kg/m3, ρa = 1.2
kg/m3
and νa = 15.11×10⁻⁵
m2/s. Fig. 77 and Fig. 78 show the theoretical calculation of
entrained air velocity into the spray used in the experiments.

171
Fig. 77. Entrained air velocity into the sprays from 2007 experiment.
Fig. 78. Entrained air velocity into the sprays from 2009 experiment.
0.01.02.03.04.05.06.07.08.09.0
10.011.012.013.014.015.016.017.0
0.0
0
0.2
5
0.5
0
0.7
5
1.0
0
1.2
5
1.5
0
1.7
5
2.0
0
Entr
ain
ed
air
ve
loci
ty
into
the
sp
ray,
ua
(m/s
)
Vertical distance from the nozzle, z (m)
Cone (1)(2)
Fan (1)
Fan (2)
0.0
1.0
2.0
3.0
4.0
5.0
6.0
7.0
8.0
9.0
10.0
11.0
12.0
13.0
14.0
15.0
0.0
0
0.2
5
0.5
0
0.7
5
1.0
0
1.2
5
1.5
0
1.7
5
2.0
0
2.2
5
2.5
0
Entr
ain
ed
air
ve
loci
ty
into
the
sp
ray,
ua
(m/s
)
Vertical distance from the nozzle, z (m)
Cone (1) Fan (1) Down Spray (1)
Cone (2) Fan (2) Down Spray (2)

172
Fig. 77 shows theoretical calculation of upward air entrainment velocity along
the axis of a single spray pointed vertically upward. The 2007 experiments included two
tests with the full cone sprays and two tests with the fan sprays. As the conditions for the
conical spray in two tests were almost similar, the figure shows one solid red line for this
spray. The dotted and broken blue lines are for the fan spray tests. So from the figure it
is clear that air velocity along the conical spray axis was much lower than for the fan
spray. It also indicates that the conical spray could not provide higher coverage. This
indicates that lower nozzle pressure and smaller drop size is not sufficient enough to
entrain air of higher velocity and to create higher coverage when the flow is upward.
Due to improved water curtain design, in the 2009 experiments (Fig. 78) higher pressure
was achieved at the nozzle inlet and thus the upward conical spray entrained air at higher
velocity along the axis and close to the nozzle tip it was almost close to the velocity of
air entrained into fan spray. The downward conical spray entrained air at higher velocity
than the upward conical spray as it was flowing in the downward direction. Downward
spray also provided higher coverage depending on how high it was installed. The
entrained air velocity into the upward fan spray was always larger than conical sprays,
both upward and downward. This was because its nozzle pressure was much higher than
the other two and its drops are also larger. For a similar flow direction large droplets
entrain air at higher velocity than smaller droplets. Entrained air velocity creates air
turbulence inside the spray region and thus influences the mixing of travelling vapor
cloud with the entrained air. Overall the results show that air entrainment velocity is a
strong function of spray angle, droplet size, droplet velocity, and spray direction.

173
According to the requirements, it is also necessary to flow air not only at a sufficient
velocity, but also to deliver air in a sufficient quantity to ensure adequate dilution. The
volumetric air entrainment rates were also calculated for each different spray nozzle
used in the experiments. Fig. 79 and Fig. 80 show the theoretical calculation of
volumetric air entrainment rate into the spray.
Fig. 79. Volumetric rate of entrained air into the sprays from 2007 experiment.
0.0
0
0.2
5
0.5
0
0.7
5
1.0
0
1.2
5
1.5
0
1.7
5
2.0
00.0
0.5
1.0
1.5
2.0
2.5
3.0
3.5
Vertical distance from the nozzle, z (m)
Air
en
trai
nm
en
t rat
e
insi
de
the
sp
ray,
Qa
(m3 /
s)
Q: Cone(1)(2) Q: Fan (1) Q: Fan (2)

174
Fig. 80. Volumetric rate of entrained air into the sprays from 2009 experiment.
Volumetric air entrainment rate calculations show that the upward conical spray
delivered more quantity of air inside the spray region among the three spray nozzles
used in the tests. As the air entrainment rate depends both on air velocity along the spray
and cross sectional area of the spray, the results show higher value for the upward
conical spray. Therefore though the air velocity inside this spray is smaller than the
upward fan spray, it should provide better dilution due to the larger quantity of air. The
downward conical spray should deliver largest quantity of air inside the spray, as the
droplets are the smallest among the three sprays. For the downward spray the volumetric
air rate increases sharply along the vertical distance. The figure only shows the value up
to certain heights. However the air velocity would also decrease along the distance until
0.0
0.5
1.0
1.5
2.0
2.5
3.0
3.5
4.0
0.0
0
0.2
5
0.5
0
0.7
5
1.0
0
1.2
5
1.5
0
1.7
5
2.0
0
2.2
5
2.5
0
Air
en
trai
nm
en
t rat
e
insi
de
the
sp
ray,
Qa
(m3 /
s)
Vertical distance from the nozzle, z (m)
Q: Cone (1) Q: Fan (1) Q: Down Spray (1)
Q: Cone (2) Q: Fan (2) Q: Down Spray (2)

175
it reaches the terminal velocity. Terminal velocity usually remains almost constant and
causes poor mixing and dilution at that height due to less turbulence. So it can be
concluded here that the upward conical spray with medium drop size and wider spray
coverage shows best performance among the three sprays in terms of air entrainment and
dilution.
5.6.3 Momentum by the Upward Sprays
The momentum imparted to the LNG vapor cloud by the water sprays depends
on the nozzle pressure, droplet velocity and droplet size. Rate of momentum imparted to
the cloud by the water droplets along the vertical spray distance were calculated
theoretically with air entrainment model and are shown in Fig. 81 and Fig. 82. The
calculations show that the momentum imparted by the fan spray along the spray axis is
much higher than the momentum by the conical spray in both the experiments. So this
indicates that the LNG vapor was uplifted to higher elevation by the fan spray where as
the conical spray could not provide enough momentum to disperse the cloud upward.

176
Fig. 81. Upward momentum from the water droplets from 2007 experiment.
Fig. 82. Upward momentum from the water droplets from 2009 experiment.
0
25
50
75
100
125
150
175
200
225
250
275
0.00 0.25 0.50 0.75 1.00 1.25 1.50 1.75 2.00 2.25 2.50
Rat
e o
f m
om
en
tum
imp
arte
d, k
gm/s
/s
Vertical distance from the nozzle, (m)
Cone (1)(2)
Fan (1)
Fan (2)
0
25
50
75
100
125
150
175
0.00 0.25 0.50 0.75 1.00 1.25 1.50 1.75 2.00 2.25 2.50
Rat
e o
f m
om
en
tum
imp
arte
d, k
gm/s
/s
Vertical distance from the nozzle, (m)
Cone Fan
Cone (2) Fan (2)

177
5.7 Overall Effects in Forced Dispersion
More analyses are performed to determine the downwind trend of concentration
at a certain height. Concentration profiles at three elevations (0.5m, 1.2m and 2.1m) is
preferred for the analysis to study the overall dispersion effect of water curtain in
reducing CH4 concentration of the vapor cloud. Downwind concentrations at higher
elevations (1.2 m and 2.1m) in this analysis also give an idea about the momentum effect
of the water curtains to disperse LNG vapor upward. Previously, data showed
concentrations at certain height and downwind locations at different times. This analysis
selects point values of concentrations at different downwind distances by averaging
concentration data within 1 to 1½ minutes before and after the water curtain activation,
and after the LNG flow discontinuation. Fig. 83 and Fig. 84 show the effect of the two
water curtains, in the downwind concentration trends near the ground level (at z=0.5 m).
These figures are based on four tests conducted in 2007; two of which were with full
cone curtains and the rest two were with the flat fan water curtains.

178
Fig. 83. Downwind concentration near ground level (at 0.5m elevation): full cone
curtain test 2007.
Fig. 84. Downwind concentration near ground level (at 0.5m elevation): flat fan
curtain test 2007.
0.0
2.0
4.0
6.0
8.0
10.0
12.0
14.0
16.0
18.0
20.0
0.0
0.5
1.0
1.5
2.0
2.5
3.0
3.5
4.0
4.5
5.0
5.5
6.0
6.5
7.0
7.5
8.0
8.5
9.0
9.5
10.0
10.5
11.0
11.5
12.0
12.5
13.0
13.5
14.0
14.5
15.0
CH
4co
nc.
at
0.5
m a
bo
ve g
rou
nd
, %
(v/v
)
downwind distance, m
Expt data (avg): w/o WC & w/ LNG ON
Expt data (avg): w/ WC & w/ LNG ON
Expt data (avg): w/ WC & w/o LNG
water curtain location1.5m x 1.5m spill edge
0.0
2.0
4.0
6.0
8.0
10.0
12.0
14.0
16.0
18.0
20.0
0.0
0.5
1.0
1.5
2.0
2.5
3.0
3.5
4.0
4.5
5.0
5.5
6.0
6.5
7.0
7.5
8.0
8.5
9.0
9.5
10.0
10.5
11.0
11.5
12.0
12.5
13.0
13.5
14.0
14.5
15.0
CH
4co
nc.
at
0.5
m a
bo
ve g
rou
nd
, %
(v/v
)
downwind distance, m
Expt data (avg): w/o WC & w/ LNG ON
Expt data (avg): w/ WC & w/ LNG ON
Expt data (avg): w/ WC & w/o LNG
water curtain location1.5m x 1.5m spill edge

179
Near ground level concentration lines (at z=0.5 m) before the water curtain
application (natural dispersion) show similar trends for downwind concentration profile
for both the tests (red solid lines with solid red diamond markers). The trend changed
after the water curtain application in both cases due to the forced dispersion process and
the concentrations were different just after the water curtain region (blue solid lines with
blue circular markers). Red dotted lines in the figures are the same lines as natural
dispersion lines and represent the concentration line that would be expected if the water
curtains were not active when they were activated. The brown triangular markers
represent the data when there was no LNG release on the ground and water curtain
action was continued.
According to the assumptions, forced dispersions should only be observed when
the vapor passes through the water curtain width. As it is already mentioned earlier in
that LNG vapor concentration eventually decreases as it travels downwind distances, the
water curtains are expected to enhance this reduction of concentration by forced
dispersion. In the following discussions, the location right after the water curtain (at 11.3
m) is the location of our interest to understand the water curtain effects. From the
expected and actual data at the position just after the water curtain, additional decrease
of LNG concentration by the water curtain is identified. For the full cone curtain the
additional decrease in concentration is 30.5% where as for the flat fan curtain it is 70%.
Use of the full cone water curtain (Fig. 83) for both discontinuous and continuous LNG
flow situation shows similar results. However, the use of the flat fan curtain for the
discontinuous flow situation failed (Fig. 84) to show any significant decrease in

180
concentration compared to the natural dispersion process. Again, from the careful
observation of the above figures it can be stated that by placing the curtains closer to the
spill location as well as increasing the spray width could give much higher reduction in
ground level concentrations. This statement considers that the water curtain effect is
more when the vapor concentration is higher or when the vapor is more concentrated.
Though LNG vapor concentration should eventually decrease as the cloud travels
further downwind, concentrations (due to natural dispersion) at 13.7 m are higher than
the previous location (11.3 m). Similar trends were identified in both the tests. It may be
because the cloud was not quite light to disperse upward and/or vapor from the surface
level (0 m < z <0.5 m) moved to that elevation to increase the concentration. The data
after the water curtain activation followed the similar trend and so at this point vapor
came down as it was not lighter enough (the buoyancy was not changed from negative to
positive effectively) or the vapor came up from the surface level. The causes of the
effect of the curtains in decreasing CH4 concentration can be studied more from the
following concentration analysis at higher elevations. Fig. 85 and Fig. 86 show
downwind concentration at 1.2 m elevations.

181
Fig. 85. Downwind concentration at 1.2m elevation: full cone curtain test 2007.
Fig. 86. Downwind concentration at 1.2m elevation: flat fan curtain test 2007.
0.0
2.0
4.0
6.0
8.0
10.0
12.0
14.0
16.0
18.0
20.0
0.0
0.5
1.0
1.5
2.0
2.5
3.0
3.5
4.0
4.5
5.0
5.5
6.0
6.5
7.0
7.5
8.0
8.5
9.0
9.5
10.0
10.5
11.0
11.5
12.0
12.5
13.0
13.5
14.0
CH
4co
nc.
at
1.2
m a
bo
ve g
rou
nd
, %
(v/v
)
downwind distance, m
Expt data (avg): w/o WC & w/ LNG ON
Expt data (avg): w/ WC & w/ LNG ON
Expt data (avg): w/ WC & w/o LNG ON
water curtain
0.0
2.0
4.0
6.0
8.0
10.0
12.0
14.0
16.0
18.0
20.0
0.0
0.5
1.0
1.5
2.0
2.5
3.0
3.5
4.0
4.5
5.0
5.5
6.0
6.5
7.0
7.5
8.0
8.5
9.0
9.5
10.0
10.5
11.0
11.5
12.0
12.5
13.0
13.5
14.0
CH
4co
nc.
at
1.2
m a
bo
ve g
rou
nd
, %
(v/v
)
downwind distance, m
Expt data (avg): w/ WC & w/o LNG ON
Expt data (avg): w/o WC & w/ LNG ON
Expt data (avg): w/ WC & w/ LNG ON
water curtain

182
The downwind concentration trends at 1.2 m are different for the two tests. In
Fig. 85 and Fig. 86, the red lines represent concentration trend when the curtain was not
applied and the blue lines represent the case of curtain application during LNG flow. The
brown triangles represent the data of water curtain application when LNG flow was
discontinuous. The full cone test data shows that the water curtain reduced the CH4
concentration at 11.3 m distance for both LNG continuous and discontinuous situations.
However Fig. 86 shows that the CH4 concentration at 11.3m location actually is higher
after water curtain activation. These observation imply that the full cone curtain actually
diluted the vapor where as the fan curtain pushed the vapor upward more than diluting it.
Higher elevation (2.1m) data presented in Fig. 87 and Fig. 88 are further studied to
understand the dispersion process.
Fig. 87. Downwind concentration at 2.1m elevation: full cone curtain test 2007.
0.0
2.0
4.0
6.0
8.0
10.0
12.0
14.0
16.0
18.0
20.0
0.0
0.5
1.0
1.5
2.0
2.5
3.0
3.5
4.0
4.5
5.0
5.5
6.0
6.5
7.0
7.5
8.0
8.5
9.0
9.5
10.0
10.5
11.0
11.5
12.0
12.5
13.0
13.5
14.0
CH
4co
nc.
at
2.1
m a
bo
ve g
rou
nd
, %
(v/v
)
downwind distance, m
Expt data (avg): w/ WC & w/ LNG ON
Expt data (avg): w/o WC & w/ LNG ON
Expt data (avg): w/ WC & w/o LNG ON
water curtain

183
Fig. 88. Downwind concentration at 2.1m elevation: flat fan curtain test 2007.
Both the figures (Fig 87 and Fig 88) show that concentration of CH4 increases at
higher elevation as it travels forward naturally and that is obvious. By the flat fan curtain
action the concentration increased to much more higher value when both the water and
LNG flow was continued than natural dispersion situation (Fig. 88). CH4 concentration
increase during the discontinued LNG flow is lower even though it is higher than natural
dispersion situation. However by the full cone curtain action (Fig. 87) the concentration
is actually reduced for both LNG on and off situations.
To understand the overall effect of water curtains on the vapor cloud the
following concentration contours (Fig. 89 and Fig. 90) were developed from the average
experimental data. These contours show average vapor cloud concentrations, used in the
above analysis, at different elevations and downwind distances.
0.0
2.0
4.0
6.0
8.0
10.0
12.0
14.0
16.0
18.0
20.0
22.0
24.0
0.0
0.5
1.0
1.5
2.0
2.5
3.0
3.5
4.0
4.5
5.0
5.5
6.0
6.5
7.0
7.5
8.0
8.5
9.0
9.5
10.0
10.5
11.0
11.5
12.0
12.5
13.0
13.5
14.0
CH
4co
nc.
at
2.1
m a
bo
ve g
rou
nd
, %
(v/v
)
downwind distance, m
Expt data (avg): w/o WC & w/ LNG ON
Expt data (avg): w/ WC & w/ LNG ON
Expt data (avg): w/ WC & w/o LNG ON
water curtain

184
(Concentration range in the contour: 4 - 16 % v/v methane in air)
Fig. 89. Concentration contour without and with full cone water curtain action in
2007 experiment.

185
(Concentration range in the contour: 4 - 16 % v/v methane in air)
Fig. 90. Concentration contour without and with flat fan water curtain action in
2007 experiment.
The contours were developed with 3D Field Pro® software using minimum
curvature method. It is already mentioned that these contours are developed from the
experimental data of average concentration. Above figures show the LNG vapor
dispersion process by the two types of water curtains from 2007 experiments. These

186
phenomena indicate that full cone actually reduced CH4 methane concentration by
mixing it with air and the flat fan imparted so much momentum to the cloud that the
ground level concentration becomes very low and higher level concentration increased to
a very high value. So it can be concluded that both of the curtains reduced the ground
level concentration when LNG release was continued. During the time when LNG spill
was discontinued the full cone curtain showed better efficiency than the fan curtain.
Again the figures also indicate that none of the curtains were able to reduce the
concentration below LFL within the measured distance in 2007 experiment.
In 2009 dispersed LNG vapor concentration data were collected without and with
water curtains both before and after the water curtain regions. To understand the effects
of the water curtains similar concentration trend analysis is conducted with the test data.
Fig. 91 to Fig. 94 show the trend of downwind concentration (% v/v CH4) of LNG vapor
cloud at three different heights without and with water curtain action. Each of the
individual figures is for individual tests conducted in 2009.

187
Fig. 91. Downwind concentration at three different heights without and with full
cone water curtain in 2009 experiment.
Fig. 92. Downwind concentration at three different heights without and with flat
fan water curtain in 2009 experiment.
0.0
2.5
5.0
7.5
10.0
12.5
15.0
17.5
20.0
22.5
25.0
-1.0
-0.5 0.0
0.5
1.0
1.5
2.0
2.5
3.0
3.5
4.0
4.5
5.0
5.5
6.0
6.5
7.0
7.5
8.0
8.5
9.0
9.5
10.0
10.5
11.0
11.5
12.0
12.5
13.0
13.5
14.0
14.5
15.0
CH
4co
nc.
, % (
v/v)
downwind distance, m
No Spray z=0.5m FC Spray z=0.5m
No Spray z=1.2m FC Spray z=1.2m
No Spray z=2.1m FC Spray z=2.1m
LNG Spill edge Full Cone (FC) water curtain
0.0
2.5
5.0
7.5
10.0
12.5
15.0
17.5
20.0
22.5
25.0
27.5
-1.0
-0.5 0.0
0.5
1.0
1.5
2.0
2.5
3.0
3.5
4.0
4.5
5.0
5.5
6.0
6.5
7.0
7.5
8.0
8.5
9.0
9.5
10.0
10.5
11.0
11.5
12.0
12.5
13.0
13.5
14.0
14.5
15.0
CH
4co
nc.
, % (
v/v)
downwind distance, m
No Spray z=0.5m FF Spray z=0.5m
No Spray z=1.2m FF Spray z=1.2m
No Spray z=2.1m FF Spray z=2.1m
LNG Spill edge Flat Fan (FF) water curtain

188
Fig. 93. Downwind concentration at three different heights without and with mist
drop downward water curtain in 2009 experiment.
Fig. 94. Downwind concentration at three different heights without any spray and
with combined water curtain system in 2009 experiments.
0.0
2.5
5.0
7.5
10.0
12.5
15.0
17.5
20.0
22.5
25.0
27.5
30.0
32.5
35.0
37.5
-1.0
-0.5 0.0
0.5
1.0
1.5
2.0
2.5
3.0
3.5
4.0
4.5
5.0
5.5
6.0
6.5
7.0
7.5
8.0
8.5
9.0
9.5
10.0
10.5
11.0
11.5
12.0
12.5
13.0
13.5
14.0
14.5
15.0
CH
4co
nc.
, % (
v/v)
downwind distance, m
No Spray z=0.5m MS Spray z=0.5m
No Spray z=1.2m MS Spray z=1.2m
No Spray z=2.1m MS Spray z=2.1m
LNG Spill edge Mist Drop (MS)downward water curtain
0.0
2.5
5.0
7.5
10.0
12.5
15.0
17.5
20.0
22.5
25.0
27.5
30.0
32.5
35.0
-1.0
-0.5 0.0
0.5
1.0
1.5
2.0
2.5
3.0
3.5
4.0
4.5
5.0
5.5
6.0
6.5
7.0
7.5
8.0
8.5
9.0
9.5
10.0
10.5
11.0
11.5
12.0
12.5
13.0
13.5
14.0
14.5
15.0
CH
4co
nc.
, % (
v/v)
downwind distance, m
No Spray z=0.5m ALL Spray z=0.5m
No Spray z=1.2m ALL Spray 1.2m
No Spray z=2.1m ALL Spray z=2.1 m
LNG Spill
FC and FF water curtains
Downward MS Water Curtain

189
Dotted lines in the figures represent concentration trend without water spray and
solid lines are for concentration trend with water spray action. Red, blue and brown is
for concentration at 0.5 m, 1.2 m and 2.1 m respectively. Ground level concentration (at
z=0.5 m) trend for each figure are similar, i.e., the water curtains were able to reduce the
concentration at this height. The percent reduction in ground level concentration by the
full cone, the fan, the mist (downward) and the mixed (combined) were 83, 86, 83 and
13% respectively. However the upper level concentration trends are different for
different tests. Again it is noted that this time the concentration of CH4 decreased for
each height as it traveled forward further downwind distances which means the cloud
was dispersing and moving upward (positive buoyancy) more efficiently than 2007
experiment.
Results show that water curtain reduced LNG vapor concentration as well as LFL
distance in all the tests. From Fig. 91 it is clear that the gas concentration was reduced
after the spray region in all three heights by the full cone water curtain. However Fig. 92
clearly shows that though the flat fan spray significantly reduced the ground level (0.5m)
concentration, concentrations at higher levels (1.2m and 2.1m heights) were actually
increased after the spray region (9.7 m). The result repeated the mechanisms identified in
the 2007 experiments where the flat fan actually pushed the LNG vapor cloud upward to
reduce the ground level concentration.
The downward conical curtain, mist curtain, reduced the ground concentration
and increased the concentration at 2.1 m (Fig. 93). As this curtain could not provide
upward momentum, this increase is due to the vapor’s upward dispersion. So it is

190
obvious that this curtain warmed up the cloud to make it positively buoyant. In Fig. 94
the effect of all the curtains acting together is pictured. The mixed or combined curtains
test show that the concentrations at 0.5 and 1.2 m were reduced; concentration at 2.1 m
was increased. This can be caused by uplifting mechanism of the fan type curtain.
Concentration contours are developed to understand the dispersion mechanisms of the
water curtains with the similar procedure discussed earlier. Fig. 95 to Fig. 98 show the
contours developed from 2009 experimental data.
(Concentration range in the contour: 4 - 20 % v/v methane in air)
Fig. 95. Concentration contour without and with full cone water curtain action in
2009 experiment.

191
(Concentration range in the contour: 4 - 25 % v/v methane in air)
Fig. 96. Concentration contour without and with fan type water curtain action in
2009 experiment.
(Concentration range in the contour: 5 - 30 % v/v methane in air)
Fig. 97. Concentration contour without and with mist type water curtain action in
2009 experiment.

192
(Concentration range in the contour: 5 - 30 % v/v methane in air)
Fig. 98. Concentration contour without and with combined water curtain action in
2009 experiment.
The contours show that all of the water curtains reduced the downwind
concentration of the LNG vapor cloud. However the performances of the water curtains
are different in controlling the vapor cloud based on their drop size, width and flow
pattern. The water curtain with higher width and medium droplet size, represented by the
full cone curtain, implies very less momentum to the cloud to lift it upward and is more
effective to reduce the LNG vapor concentration with the aid of dilution. On the other
hand, water curtain with smaller width and larger droplet size, represented by the flat fan
spray, provides effective momentum to reduce concentration. The water spray curtain
with smaller droplets and downward flow reduced the concentration and shows good
performance in warming up the cloud. Each water curtain effectively reduced the LFL

193
distance. The combined system though used more water and compared with all the
action mechanisms it was not as effective as the individual ones. Overall the upward full
cone water curtain, which has medium droplet size and wider coverage (60° conical)
showed better performance.
5.8 Summary
Studies were performed to comprehend the effectiveness of different types of
water curtain as LNG vapor control methods. Four experiments, in consecutive four
years from 2006, were conducted to examine representative type upward conical,
upward fan and downward mist (conical) spray curtains in dispersing LNG vapor cloud
from a continuous release from pipe to the ground or water. The water curtains represent
three main classes of water curtains used in the industries. The ranges of water droplets
generated by the nozzles are different at same gage pressure.
Experimental data are analyzed to study the physical phenomena of air
entrainment and dilution, heat transfer and mechanical effects of these water curtains.
Study was performed to determine the effectiveness of these water curtains in reducing
LNG vapor cloud concentration downwind. Results identify that the actions of all three
water sprays can reduce the LNG concentration to some degree by dilution with air as
well as by pushing the vapor upward. Water curtains also provide some amount of heat
to the mixed gas cloud and air. If ineffective heat transfer between water, LNG and air
fails to warm and dilute the LNG vapor significantly, the LNG vapor will rise up only
for some instance due to curtain action (momentum) and then it will definitely fall back

194
at further distance. Difference in results from different experiments indicates that the
effectiveness of the water curtain also depends on the weather condition and
vaporization rate.
The overall performance of a water curtain depends on the magnitude of physical
effects introduced by the curtain to the LNG cloud. But the magnitude of each
mechanism introduced by different sprays is different based on the spray angle and
direction, and water droplet size and velocity. Full cone reduced CH4 concentration by
mixing it with air and the flat fan imparted so much momentum to the cloud that the
ground level concentration becomes very low and higher level concentration increased to
a very high value. The downward mist sprays reduced concentration by warming up the
cloud near ground level. So it can be concluded that all three curtains reduced the ground
level concentration. However the upward full cone curtain (a) mixes vapor efficiently,
(b) changes the cloud temperature; (c) provides inefficient momentum to the cloud to lift
it upward; the flat fan curtain (a) imparts very high momentum; (b) provides very
inefficient mixing with air as well as heating; and the downward mist spray (a) provides
higher heat to the cloud compared to the other two sprays, (b) delivers some air into the
spray to dilute the cloud; (c) does impart some upward momentum to uplift the cloud.
Overall the upward conical sprays show best overall performance amongst the three
sprays in terms of action mechanisms. Therefore in conclusion the air entrainment and
dilution with some heat transfer is the dominant mechanism to control LNG vapor cloud.

195
6 CONCLUSIONS AND RECOMMENDATIONS FOR FUTURE WORK
6.1 Conclusions
The ability of water curtain to show different physical effects initiated an interest
in the utilization of water curtain as a potential LNG vapor cloud mitigation measure. It
is generally accepted that water curtains can be deployed to control vapor cloud
movement from LNG spillages, which can reduce the flammable LNG vapor
concentration effectively, by forced dispersion. At present the Mary Kay O’Connor
Process Safety Center (MKOPSC) is conducting experimental and theoretical research
on number of issues involved in LNG safety. The purpose of the research is to combine
the theoretical understanding of the phenomenon with the field tests to make the results
directly applicable to the current LNG industry needs. The research on the application of
water curtain to control LNG vapor cloud, a part of the LNG safety research, has been
presented in this dissertation.
A thorough literature review has revealed that water spray curtains are able to
control an LNG vapor cloud and can reduce the methane concentration to some degree.
Four physical mechanisms are involved when a water spray is activated on a vapor
cloud. Among the four mechanisms, (1) air entrainment and dilution, (2) heat transfer,
and (3) overall momentum actions are considered to be useful when applied to handle an
LNG vapor cloud. However insufficient experimental work, conducted in late 70’s and
early 80’s, could not establish the actual and most dominant phenomena involved during
the LNG-water spray interaction. Because of low molecular weight (of methane) and

196
extremely low temperature, LNG vapor cloud dispersion behaves differently from other
dense gases. Effectiveness of a water curtain, in terms of the degree of LNG vapor
concentration reduction and temperature increase, of different types of water sprays of
different flow configurations, drop sizes, covered heights and covered widths yet
remained undetermined.
Four field experiments have been conducted in the last four consecutive years
(since 2006) to (1) understand the underlying physical phenomena, and (2) determine the
effect of several parameters controlling the physical processes during LNG vapor-water
spray interaction. These experiments were developed from the knowledge of previous
research, simulation works and experience to test representative types of water curtains
with LNG spills under simulated conditions. Overall three types of water sprays are used
in the research to represent three main classes of water curtains used in the industries.
The sprays used are upward conical, upward fan and downward conical. The ranges of
water droplets generated by the nozzles are different at the same gage pressure. Droplet
sizes of the upward conical spray are small to medium where droplets produced by the
upward fan spray are coarse. The downward cone spray produces mist like smaller
droplets. The coverage by the two upward sprays is also different. The conical spray
provides more downwind coverage (conical pattern) than the fan spray.
Experimental observation and detailed experimental data analysis, supported by
some theoretical study prove that water curtains are able to control a drifting LNG vapor
cloud and change the concentration along the cloud height. But the effectiveness of
different water curtains is different, as the magnitude of the mechanisms involved are

197
different. The intent of this research is not to identify the type of water spray effective
for LNG vapor, the intent is to determine the dominant mechanisms to control and
disperse the cloud.
The upward full cone spray with wider spray angle and medium droplet size and
droplet velocity creates high turbulence closer to the spray region. As it induces more air
inside the spray, the mixing between the gas cloud and air is enhanced, though the air
velocity into the spray is low to medium. The applied momentum to the cloud is not
significant because of drop size and water pressure. On the other hand the upward fan
spray cannot produce wide spray coverage as it is flat shaped. But it can create a solid
barrier in the path of the cloud covering larger crosswind length and height, because of
its coarse droplet size and water pressure. So the amount of air induced inside the spray
is low though the air velocity is high. And the momentum it can apply from the bottom
of a cloud is very high. In case of downward conical spray with smaller drop size, the
heat transfer effects are better than the other two and the amount of air induced inside
the spray is less than the upward conical spray with larger drop. It can warm up the LNG
cloud more effectively than the other two because of drop size. However it is not
realistic to warm up the cloud to a higher extent in outside spill conditions with the
commercially available sprays. Overall it is concluded from the test that the upward full
conical spray controlled and disperse more effectively. Therefore higher air entrainment
and significant mixing with some heat transfer will more effectively handle an LNG
vapor cloud, depending on the weather conditions and wind speed.

198
It should be noted that other factors also influence the water curtain actions. The
performance of any water curtain also depends on the weather condition and
vaporization from the substrate. It was determined from the experiments that the same
water spray acts more effectively in a favorable weather (high wind and solar flux) than
an unfavorable weather (low wind and solar flux) conditions. On the other hand the size
of the cloud which interacts with the spray depends on the vaporization rate. A water
curtain of a certain size only could handle a vapor cloud of a certain size. These
experiments only deal with smaller spill size. The rate of evaporation mainly depends on
the heat from the spill surface. Evaporation rate is higher when the release is on
unconfined land or water than on confined land or water. A water curtain will show
better performance if it interacts with a cloud which has high turbulence inside the cloud
perimeter, i.e., when it is installed closer to the spill location. Shorter distance between
the curtains and spill location also provides better coverage and high LNG-water spray
interaction and thus the methane concentration can be significantly reduce to lower
values.
6.2 Future Work
This section explains the limitations on the measurement, validation, and
statistical problems that are encountered. While some of the gaps are identified, some of
the findings in this research provide stepping stones for future research in order to close
the gaps. There are several limitations in these experiments, as follows:

199
Due to the gas detectors setup with long tubes a time lag of around 3 to 4 minutes
was observed. The time to measure the gas concentration should be increased. Another
problem was to keep a constant flow inside the tube. To overcome this limitation more
detectors need to be placed physically in the test area.
It was observed that cloud concentration reached lower value far downwind due
to natural dilution. More gas detectors with lower level concentration measurement
(100% LFL) should be used at further distances from the spill location.
The gas detectors used in the experiments were not able to measure gas inside the
spray. So alternate detectors are required to collect gas cloud information inside the
spray.
The water curtains could not be placed very close to the spill pit because of the
downward slopes close to the pits. This design allows flowing water inside the LNG
pool if the curtains are within 2 m of the pit. So alternate test setup should be considered
to test the effect of water curtain location.
Water pressure around the test site is limited which limits the use of number of
nozzles during the tests. Also the size of the pipeline around the LNG training facility is
not adequate to use multiple nozzles at higher pressure. This limitation affected the tests
in creating a water curtain with a higher coverage.
Some of the key parameters, like (i) the droplet size produced from a nozzle, and
(ii) the droplet distribution in the spray area are very important to understand in detail
the role of a spray nozzle. The actual drop size was not measured in the tests because of
unavailability of appropriate measuring device which could be used safely outdoor

200
conditions in the presence of a flammable vapor cloud. Similarly the information on the
distribution of water density in the space and change in droplet size along the height for
the used curtains cannot be determined in this research due to the unavailability of exact
information, lack of appropriate measurement devices and many limitations when
dealing with LNG vapor out door. So future research should include these
measurements.
Each test had to stop within a short time because the large amount of water used
would cause problems to some of the instruments located near the test area because of
insufficient water drainage. All of the tests used LNG release with low flow rate to
simulate a small spill. This also indicates that to control a large spill the required system
has to provide sufficient water. In addition, draining the large amounts of water can
present problems. In future this limitation should be considered.
Humidity might have significant effects on both natural and forced dispersion of
LNG vapor cloud. Though this research considered measuring the humidity in the
dispersing cloud, due to some limitations (i.e. placement of the equipment away from
water spray) measurements were not possible. So future research can determine the
effect from experimental evidence.
One of the gaps in water curtain application research is that it is hard to predict
the LNG vapor-water spray interaction as it is a complex phenomenon. An appropriate
model for the case of an LNG release should describe the interaction of water droplets,
LNG vapor, and air almost exactly in a certain atmospheric condition and should also be
validated with field tests. This research produced many data that could be analyzed in

201
many different ways as well. Calculation or modeling of heat transfer and upward
momentum has not been done rigorously in this research. Thus, future works must
include more thorough measurement of water temperature, gas concentration and LNG
vapor size by improving the experiment. Then, dilution and heat transfer in the spray can
be modeled so it can be used for industrial scale-up where the possible release is larger
than release used in this experiment. These calculations are also useful in determining
the minimum required water droplet, width, location and height to reach effective
suppression.
Currently, the knowledge and interest in computational fluid dynamics (CFD) is
increasing specially in the LNG safety area. Some researchers also started working on
CFD models to understand spray hydrodynamics. So water curtain models can also be
developed through CFD modeling for LNG issues. The characteristics of the LNG vapor
before and after water spray identified here can be used with proper scale-up. CFD
models of sprays generally fall into two categories: Eulerian models and Lagrangian (or
particle tracking) models. The first one usually models the spray as a continuum across
the whole flow domain, while the latter model tracks the paths of droplets through
domain. These models are useful, rapid and relatively inexpensive in providing almost
accurate results. Most of these CFDs mainly focus on mitigating Cl2, CO2, NH3 or HF
release through dilution and absorption. However, for the case of LNG vapor release
dispersion the absorption of gas into water should not be a contributing factor at all.
Therefore, to disperse an LNG vapor cloud effectively, and to develop design guidelines
for water curtain installation, these or other available CFD models can be studied

202
thoroughly and their assumptions can be modified accordingly. The applicability range
of the CFD modeling also needs to be extended so that it can be used for any scale and
comprehensive and authentic design guidelines of water curtain can be developed.
The research shows three types of representative water sprays of three different
flow patterns of different droplet sizes control the LNG vapor cloud in terms of different
physical processes. However to identify the effect of droplet sizes in forced dispersion of
LNG, more tests need to be conducted with the same type of spray at different pressure
or flow rate, i.e., with different droplet sizes. Future work of this research should address
this effect as well as the effects of spray angle, spray momentum and location of the
water curtain in controlling LNG cloud. However, to establish a definitive engineering
guideline on water curtain design for LNG cloud dispersion controlled experiments for
longer times and with different wind conditions are needed.
In the summary, this research is expected to help LNG industry by advancing the
current understanding regarding suppression of LNG vapor dispersion and pool fire.
203
REFERENCES
Alessandri, E., Buchlin, J.M., Cavallini, A., Patel, M.K., & Galea, E. (1996). On the
modelling of the thermal interactions between a spray curtain and an impinging
cold gas cloud. In Centre for Numerical Modelling and Process Analysis, School
of Computing and Mathematical Sciences, London, UK.
Angus. (2005). Product specification sheet. Oxfordshire, UK: Angus Fire Armour
Limited.
Arthur D. Little. (1974). Evaluation of LNG vapor control methods. Report No 76285,
submitted to the American Gas Association, Boston, MA: Arthur D. Little, Inc.
Atallah, S., Guzman, E., & Shah, J.N. (1988). Water spray barriers for LNG vapor
mitigation. Report No 4015.1, Des Plaines, IL: Risk and Industrial Safety
Consultants, Inc.
Bennat, F. G. S., & Eisenklam, P. (1969). Gaseous entrainment into axisymetric liquid
sprays. Journal of the Institute of Fuel, 42, 309.
BETE Fog Nozzle. (2007). Product specification catalog: manual 110METRIC.
Greenfield, MA: BETE Fog Nozzle, Inc.
Binark, H., & Ranz, W.E. (1958). Induced air flows in fuel sprays. In Annual Meeting of
American Society of Mechanical Engineers, Paper no 58-A-284, New York.
Bosanquet, C.H. (1957). The rise of a hot waste gas plume. Journal of the Institute of
Fuel, 30, 322-328.
Briffa, F., & Dombrowski, N. (1966). Entrainment of air into a liquid spray. AIChE
Journal, 12 (4), 708-717.

204
Briscoe, F., & Shaw, P. (1980). Spread and evaporation of liquid. Progress in Energy
and Combustion Science, 6 (2), 127–140.
Brown, L.E., Martinsen, W.E., and Cornwell, J.B. (1983). Spill protection for liquefied
gas facilities. In Spring Meeting of the American Petroleum Institute Committee
on Safety and Fire Protection. Ft. Lauderdale, Florida.
Buchlin, J.M. (1994). Mitigation of problem clouds. Journal of Loss Prevention in the
Process Industries, 7, 167-174.
Buchlin, J.M., & Alessandri,E. (1997). Numerical simulation of the thermo hydraulic
behavior of liquid sprays. In 13th
Annual Conference on Liquid Atomization and
Spray Systems, Florence, Italy.
Center for Chemical Process Safety (CCPS). (1997). Guidelines for post release
mitigation technology in the chemical process industry. 58-90, New York:
AIChE.
Center for Liquefied Natural Gas (CLNG). (2008). LNG Today, http://www.lngfacts.org
/ LNG-Today/Need-More.asp., Accessed December 2008.
Conch Methane Services (CMS). (1962). Characteristics of liquefied natural gas and
their evaluation in relation to safe handling and above-ground storage practices.
Technical Report - vol 1. London, England: Conch Methane Services, Ltd.
Cormier, B.R. (2007). Effect of tank pressure and insulation on LNG liquid flow rate -
experience at Brayton Fire School. In Mary Kay O'Connor Process Safety Center
Centerline Newsletters, 11 (2), 12-21.
Cormier, B. R. (2008). Computational fluid dynamics for LLNG vapor dispersion
modeling: a key parameters study. PhD dissertation, Department of Chemical
Engineering, Texas A&M University, College Station.

205
Cormier, B. R., Suardin, J. A., Rana, M.A., Zhang, Y., & Mannan, M. S. (2009).
Development of design and safety specifications for LNG facilities based on
experimental and theoretical research. OPEC, Oil Prices and LNG, 12, 295-424,
Nova Science Publishers Inc. ISBN: 978-1-60692-897-4.
Dusserre, G., Dandrieux, A., & Thomas, O. (2003). The DVS model: a new concept for
heavy gas dispersion by water curtain. Environmental Modeling and Software,
18, 253-259.
Federal Energy Regulatory Commission (FERC). (2008). For Citizens, http://ferc.gov/
for-citizens/citizen-guides/citz-guide-lng.pdf., Accessed August 2008.
Fthenakis, V. M. (1991). Modeling of water spraying of toxic gas releases. Ph.D.
dissertation, Fluid Dynamics and Atmospheric Science Department, New York
University, New York.
Fthenakis, V.M., & Zakkay, V. (1990). A theoretical study of absorption of toxic gases
by spraying. Journal of Loss Prevention in the Process Industries, 3, 197-206.
Gant, S. E. (2006). CFD modelling of water spray barriers. Report No. HSL/2006/7,
Derbyshire, UK: Health and Safety Laboratory.
Gas Research Institute. (1982). Dispersal of LNG vapor clouds with water spray
curtains. Annual Report – Phase 1, Report No GRI-80/0107, Chicago, IL: Gas
Research Institute.
Gluckert, F.A. (1962). A theoretical correlation of spray-dryer performance. AIChE
Journal, 8, 460-466.
Hald, K., Dusserre, G., Dandrieux, A., & Buchlin, J.M. (2003). A methodology to
investigate heavy gas dispersion by water-curtains. In Proceedings of European
Safety and Reliability (ESREL) Conference, 741-746, Maastricht, Netherlands.

206
Hald, K., Dusserre, G., Dandrieux, A., & Buchlin, J.M. (2005). Heavy gas dispersion by
water spray curtains: a research methodology. Journal of Loss Prevention in the
Process Industries, 18, 506-511.
Harris, N.C. (1981). The design of effective water sprays – what we need to know. In the
Containment and Dispersion of Gases by Water Sprays, 7.1-7.5, North Western
Branch Papers, Manchester, UK: Institution of Chemical Engineers.
Heskestad, G., Kung, H. C., & Todtenkopf, N. F. (1976). Air entrainment into water
sprays and spray curtains. In Annual Meeting of American Society of
Mechanical Engineers, Paper No 76-WA/FE-40, New York.
Heskestad, G., Kung, H. C., & Todtenkopf, N. (1981). Air entrainment into water
sprays. Report No 22533, Reissue of RC77-TP-7 November 1977, Norwood,
MA: Factory Mutual Research Corporation.
Heskestad, G., Meroney, R.N., & Kothari, K.M. (1983). Effectiveness of water spray
curtains in dispersing LNG vapor clouds. In Proceedings of the American Gas
Association Transmission Conference, Paper No 83-T-69, 169-183, Seattle,
Washington.
Hissong, D.W. (2007). Keys to modeling LNG spills on water. Journal of Hazardous
Materials, 140 (3), 465-477.
Honeywell. (2005). Operating instructions: searchpoint optima plus IR gas detectors,
Sunrise, FL: Honeywell Analytics Distribution, Inc.
Ito, I. (1970). Studies on the spray with single hole cylindrical nozzles. Bulletin of
Japanese Society of Mechanical Engineers, 36, 759-772.

207
Ivings, M.J., Jagger, S.F., Lea, C.J., & Webber, D.M. (2007). Evaluating vapor
dispersion models for safety analysis of LNG facilities. HSL Report No
MSU/2007/04, Quincy, MA: Fire Protection Research Foundation.
Martinsen, W.E., & Muhenkamp, S.P. (1977). Disperse LNG vapors with water.
Hydrocarbon Processing, 56 (7), 261-266.
Mary Kay O’Connor Process Safety Center (MKOPSC). (2008). LNG pool fire
modeling. White Paper by Mary Kay O’Connor Process Safety Center, Texas
A&M University, College Station.
McQuaid, J. (1977). The design of water spray barriers for chemical plants. In 2nd
International Loss Prevention Symposium, Heidelberg, Germany.
McQuaid, J., & Fitzpatrick, R.D. (1981). The uses and limitations of water-spray
barriers. In the Containment and Dispersion of Gases by Water Sprays, 1.1-1.13,
North Western Branch Papers, Manchester, UK: Institution of Chemical
Engineers.
McQuaid, J., & Fitzpatrick, R.D. (1983). Air entrainment by water sprays: strategies for
application to the dispersion of gas plumes. Journal of Occupational Accidents,
5, 121-133.
Moodie, K. (1985). The use of water spray barriers to disperse spill in the event of heavy
gases – the performance characteristics of full-scale water spray barriers when
dispersing spills of heavy gases. Plant Operation Progress, 4, 234-241.
Moore, P.A.C., & Rees, W.D. (1981). Forced dispersion of gases by water and steam. In
the Containment and Dispersion of Gases by Water Sprays, 4.1-4.14, North
Western Branch Papers, Manchester, UK: Institution of Chemical Engineers.

208
Nakakuki, A. (1973). Properties of sprays injected into compressed atmospheres. In
Annual Meeting of American Society of Mechanical Engineers, Paper No 73-
WA/FE-18, New York.
Palazzi, E., Curro, F., Pastorino, R., & Fabiano, B. (2004). Liquid spray curtains design
to contain and mitigate toxic and flammable jets and releases. In Proceedings of
11th
International Loss Prevention Symposium, Loss Prevention and Safety
Promotion in the Process Industries, 3127-3136, Praha, Czech Republic.
Prugh, R.W. (1985). Mitigation of vapor cloud hazards: part I. Plant Operation
Progress, 4 (2), 95-103.
Prugh, R.W. (1986). Mitigation of vapor cloud hazards: part II. Plant Operation
Progress, 5 (3), 169-174.
Prugh, R.W. (1987). Guidelines for vapor release mitigation. Plant Operation Progress,
6 (3), 171-174.
Prugh, R.W., & Johnson, R.W. (1988). Guidelines for vapor release mitigation. Center
for Chemical Process Safety (CCPS). AIChE, New York.
Qiao, Y., West, H.H., & Mannan, M.S. (2005). Assessment of the effects of release
variables on the consequences of LNG spillage onto water using FERC models.
Journal of Hazardous Materials, 130, 155-162.
Rabash, D.J., & Stark, G.W.V. (1962). Some aerodynamic properties of sprays. The
Chemical Engineer, 40, 0.A.83.
Raj, P.K. (2007). LNG fires: a review of experimental results, models, and hazard
prediction challenges. Journal of Hazardous Materials, 140 (3), 444-464.

209
Rana, M. A., Cormier, B. R., Suardin, J. A., Zhang, Y., & Mannan, M. S. (2008).
Experimental study of effective water spray curtain application in dispersing
liquefied natural gas vapor clouds. Process Safety Progress, 27 (4), 345-353.
Rana, M. A., Guo, Y., & Mannan, M. S. (2009). Use of water spray curtain to disperse
LNG vapor clouds. Journal of Loss Prevention in the Process Industries, 22,
707-718.
Rojey, A., Jaffret, C., & Marshall, N. (1997). Natural gas: production, processing,
transport. 205-207, Paris, France: Editions TECHNIP.
Rothe, P. H., & Block, J.A. (1977). Aerodynamic behavior of liquid sprays.
International Journal of Multiphase Flow, 3, 263-270.
St-Georges, M., & Buchlin, J.M. (1995). Heat transfer in liquid curtains mitigating
pollutant releases. Loss Prevention and Safety Promotion in the Process
Industries, 2, 495-506.
Suardin, J. A. (2008). The application of expansion foam on liquefied natural gas (LNG)
to suppress LNG vapor and LNG pool fire thermal radiation, PhD dissertation,
Department of Chemical Engineering, Texas A&M University, College Station.
Texas Engineering Extension Service (TEEX). (2009). Brayton Fire Training Field, http:
//www.teex.com., Accessed August 2009.
Uzanski, D.T., & Buchlin, J.M. (1998). Mitigation of industrial hazards by water spray
curtains. In 5th
Conference of the International Emergency Management Society
(TIEMS). Washington, DC.
Van Doorn, M. (1981). The control and dispersion of hazardous gas clouds with water
sprays, PhD Thesis, University of Delft, Holland.

210
Webber, D.M., Gant, S. E., Ivings, M.J., & Jagger, S. F. (2009). LNG source term
models for hazard analysis: a review of the state-of-the-art and an approach to
model assessment. HSL Report No MSU/2008/24, Quincy, MA: Fire Protection
Research Foundation.
West, H.H., & Mannan, M.S. (2001). LNG safety practice & regulations: from the 1944
East Ohio tragedy to today’s safety record. In Mary Kay O'Connor Process
Safety Center Symposium, Houston, Texas.
Zinn, C.D. (2005). LNG codes and process safety. Process Safety Progress, 24 (3), 158-
167.

211
VITA
Morshed Ali Rana was born in Dhaka, Bangladesh. He received his B.S. degree
in chemical engineering from Bangladesh University of Engineering and Technology.
He started his career as a young chemical engineer in Bangladesh and after several years
he moved to the U.S. to pursue graduate studies. He received his M.S. in chemical
engineering from the University of South Alabama in December 2004. He then entered
the graduate program at Texas A&M University in August 2005 and received his PhD in
chemical engineering in December 2009. His research interests include chemical process
and process safety. He can be reached at 3132 Chemical Engineering Department, Mary
Kay O’Connor Process Safety Center, Texas A&M University, College Station, TX
77843 and his email is [email protected].