forces in pvd - zlepšovanie vlastností podložia ... · forces in plastic vertical drains during...
TRANSCRIPT

Forces in Plastic Vertical Drains during installation
Nico Cortlever, Cofra, Amsterdam Ger Dijst, Omegam, Amsterdam
ABSTRACT: During installation of Plastic Vertical Drains (PVD) large forces can occur that rupture the drain or filter fabric. To determine these forces laboratory and field tests are executed whereby the forces are measured by strain gages during installation of the drains. The tests showed that under circumstances these forces could exceed the requirements mentioned in certain norms. The forces were caused by the fact that high performance PVD installation rigs were used in combination with large depths and hard top layers. Also other circumstances can influence the forces in drains during installation. This paper describes all the factors that influence the forces in PVD. 1. INTRODUCTION On many occasions in the past, PVD drains have been damaged during installation. Such damage had various causes: • Weakness of the drain or filter fabric • Long exposure of the drain to sunlight • Unsuitable installation techniques • Inadequate installation machines Weakness of filter; Until 1982, paper filters were used for PVD. The filter sleeve broke often when it passed the top roll in the installation mast. This was seldom noticed because the damaged part was only visible when the rupture was revealed between the mandrel and the surface. Exposure to sunlight; If drain rolls are stored outside and unprotected against sunlight the filter fabric can deteriorate and the strength decreases rapidly. Unsuitable installation techniques; Up to 1998 machines with a rod installed PVD instead of a hollow mandrel. During installation the filter rubbed against the adjacent soil causing possible rupture of the fabric. On top of that the clay layers smeared the filter. Inadequate stitchers; PVD stitchers should ensure a smooth undisturbed installation of drains. Friction in the rig and mandrel should be avoided and guide rolls must have a large diameter. Tapered mandrel tips and sharp mandrel tops should be avoided. PVD installation machines are becoming taller and faster. These machines demand stronger drains to withstand the large forces, which occur during installation. 2. PVD REQUIREMENTS A number of requirements are proposed to avoid damaging PVD’s. These requirements vary from country to country. Only the Netherlands has a national PVD standard (National Directive for the KOMO product certificate of PVD’s). In Singapore every Public Department has its own PVD standard.
The following table shows the requirements related to drain strength. Unit Dutch
Standard Tuas Changi
Strain at brake % > 2 - - Drain strength kN > 1.0 > 2.5 > 1 Strain at 0.5 kN % < 10 < 10 < 10 Filter strength kN/m > 6 > 10 > 7
Table 1. Drain requirements
Figure 1. Graphical display of the Dutch standard. The Dutch requirements are based more on theoretical calculations and expected forces on the PVD during installation than on field experience. 3. THEORETICAL FORCES IN PVD The theoretical forces in PVD are described in two papers. The calculations were based on the most unfavourable circumstances, which means that the rotation of a full roll with a weight of 25 Kg was accelerated to 9,81 m/s² (free fall of the mandrel). The modulus of the drain was taken into account since this has a large influence on the actual forces. Also lab tests and field tests were executed to determine the mobilised forces during installation. Load cells and strain gages were used to make accurate measurements. The results from these calculations and tests can be summarised as follows:
0 2 4 6 8 10
0.5
1.0
Dra
in s
treng
th (k
N)
Strain (%)
breakingstrength drain
allowed area fortensile/strain diagram
min.strain
max.strain

Theory Lab. Field Kremer et al. (1983) 500 - - Voskamp et al. (1998) 103 250 390 Chew Soon Hoe (2001) 1400 (filter) Table 2. Forces (N) in PVD Three very important phenomena, which particularly influence the forces in the filter fabric, have however not fully been investigated. • Strain in the filter fabric during passage of the top
roll. • Strain in the filter fabric due to soil that enters the
top of the mandrel and gets stuck between the drain and the tapered mandrel tip
• Strain in the filter fabric due to the soil that enters the bottom of the mandrel during extraction of the mandrel.
Deformation at Top Roll; During the passage over a top roll the filter fabric is subjected theoretically its maximum load. 120 m drain can hang on the roll and it is bent over a relatively small diameter of 150 mm. During passage over this roll measurements have shown that the forces in the fabric can increase to 10 times the normal force. Strain at the mandrel tip. After a certain installation period, soil from the mandrel gets stuck in the guiding system of the mandrel. This soil can enter the mandrel at the top during extraction of the mandrel. If the bottom of the mandrel is tapered and there is only limited space for the PVD the soil will accumulate in the mandrel and rupture the drain. Of course this type of damage is immediately visible and a replacement drain can be installed.
Strain at the mandrel tip; If the mandrel is extracted in very weak soil with a low speed, soil will enter the open end of the mandrel and will be pushed up several metres. This creates large friction between the soil and the filter fabric and the filter fabric can tear if it is not strong enough. So high-speed extraction of the mandrel is favourable to low-speed extraction. 4. FIELD TEST ZEEBURG To determine the forces on the drain / filter fabric, a field test was performed whereby strain gages glued to the filter fabric will measure the forces in the drain during installation. Preliminary tests were made in the laboratory to investigate which type of strain gage was most susceptible to high strain as can be expected in geotextiles. A Post-Yield strain gage of Micro Measurement, type EP-08-40CBY-120, was found to be the most suitable. To determine the ratio between the elongation of the strain gage and the actual force in the drain, a tensile strength test was made on a drain sample provided with a strain gage. Figure 6 gives the result of this test. The test shows that the strain, measured with the strain gage, is lower than the calculated externally applied strain by the tensile testing machine. There are 2 reasons for this: 1. Because the length of the drain sample is short the machine does not only apply a force in de direction of loading but also a force perpendicular to this direction.
Figure 4. Mandrel i
Figure 3 Mandrel tip Figure 5. Drain sample with strain gage after break in tensile tester
Figure 2. Drain over top guide roll.

2. Due to the side effects at the clamps the displacement is more then may be expected. For the interpretation of the field tests the relationship between the measured strain by the strain gage and the externally applied force is much more important. It is clear that there is no linear relationship between the mobilised force and the elongation of the strain gage. The middle curve (green) shows the relation between the strain gage elongation and the elongation measured in the tensile tester. The top curve (blue) shows the relation between strain gage elongation and the applied force on the drain and the bottom curve (red) the relation between strain gage elongation and the applied force in the filter fabric. The field test was executed on a PVD project in Zeeburg, Amsterdam. The installation machine was a Cofra MY-200 stitcher with a maximum installation depth of 15 m. The installation speed of the mandrel was about 100 m/min. The test procedure was as follows: The strain gages were attached to a 5 m drain sample, which was connected between the drain roll and the drain that goes up in the rig at position 1 (figure 8). The drain was installed to 11 m depth and the distance from the drain roll to the top roll was about 17 m. The strain in the drain was monitored at 4 stages.
1. Going up in the rig to position 2 2. Going up in the rig, passing the top roll and going
down again to position 3. 3. Going down the rig to position 4 4. Going down in the ground to position 5 To create maximum resistance, a full drain roll was placed behind the drain sample. Because the cables from the strain gages had to follow the drain, the starting acceleration of the installation was however reduced. Therefore the measured elongation was limited at the start. The strain gage was attached to the drain so that the gages passed the top roll at the outside of the drain. As expected the force increased a lot during passing of the roll. At this point the maximum strain measured was 0.65% (figure 7), which equals a force of 1030 N in the drain. During the second part of the installation the strain was low as expected and never exceeded 0.1 %, which equals only 165 N. After extraction of the mandrel the strain increased to a maximum of 0.15% due to the load of the soil against the filter fabric. 5. FIELD TESTS SINGAPORE
In July 2001 a number of field test were conducted on the reclamation project Pulau Ubin Tekong in Singapore. The tests were executed on Cofra Rig C1 type O&K RH40E with a MZ325 stitcher, total assemble height of 40m. A total of 8 tests were performed on the site at Pulau Tekong. Two test on 11/07/2001 failed because of guiding problems in the rig. The rig was converted to improve the guiding system.
Figure 8. Stages of measurement
Figure 7. Test results strain gage at Zeeburg.
Figure 6. Ratio between Strain and Force

On the 12/07/01 6 additional test were performed. Test 3: drain sample 5, maximum speed first phase
was 1 m/s, at phases 2 and 3 full speed was applied (2m/s). During extraction of the mandrel at phase 3 the wire broke at the strain gage.
Test 4: Drain sample 3. Installed successfully
Test 5: Drain sample 6. Installed successfully witnessed by Robert Cortlever, Stefan Moens from Jan De Nul , Tim Helbo from Van Oord/Ballast Nedam
Test 6: drain sample 7. Drain pulled out and strain gauge wire snapped.
Test 7: Drain sample 8. Strain gauge test wire snapped. The client (HDB) witnessed the test.
Test 8: Drain sample 9. Installed successfully A summary of all tests is given in table 3. A typical CPT test of the test location is given in figure 10. The test shows that to a depth of approx. 30 m below the surface the cone resistance is very low. The drains at this site are installed in the compact layer below that level to a depth between 32 and 36 m. On the Pulau Tekong test site the same installation procedure and measurement techniques are applied that were used in the Zeeburg test in The Netherlands. During the test period 3 instead of 4 full installation sequences were monitored, comprising of 2 stages where the forces were measured while the drain was passing the rig and 1 stage were the drain was actually installed in the ground. Phase 3 as shown in fig. 8 was skipped. To get the strain gage on the right place a drain section of a few metres must be pulled by hand.
Tes
t
Date
Time
Max. Force
Depth
Sam
ple
Remarks
14:58:04 72 22.08 1 11/jul 15:33:32 180 31.06
1 Damaged
15:42:56 202 31.08 16:02:00 216 33.24
2 11/jul
16:09:26 213 33.43
2 Damaged
13:18:40 206 32.26 13:21:38 211 33.40
3 12/jul
13:25:58 217 33.26
5 OK
13:44:38 204 32.86 13:47:26 203 32.61
4 12/jul
13:53:46 206 32.94
3 OK
14:51:20 208 32.40 14:53:28 210 34.07
5 12/jul
14:55:58 204 33.98
6 OK
15:23:42 202 35.29 6 12/jul 15:26:28 210 34.75
7 Damaged
15:54:02 201 34.14 OK 7 12/jul 16:01:32 0 0.00
8 Damaged
16:58:34 205 33.55 17:00:56 201 34.02
8 12/jul
17:03:54 203 34.09
9 OK
Table 3. Summary of tests The results of the measurements of the drains with the strain gages 3, 5, 6, 8 and 9 are shown in the diagrams in Figure 11 to 15. In the diagrams the strain as a function of time is shown. In all the diagrams the passing of the bottom roll in the 1st stage is clearly visible. Because the strain gage Figure 10. CPT test at Pulau Tekong
Figure 9. Situation at Pulau Tekong
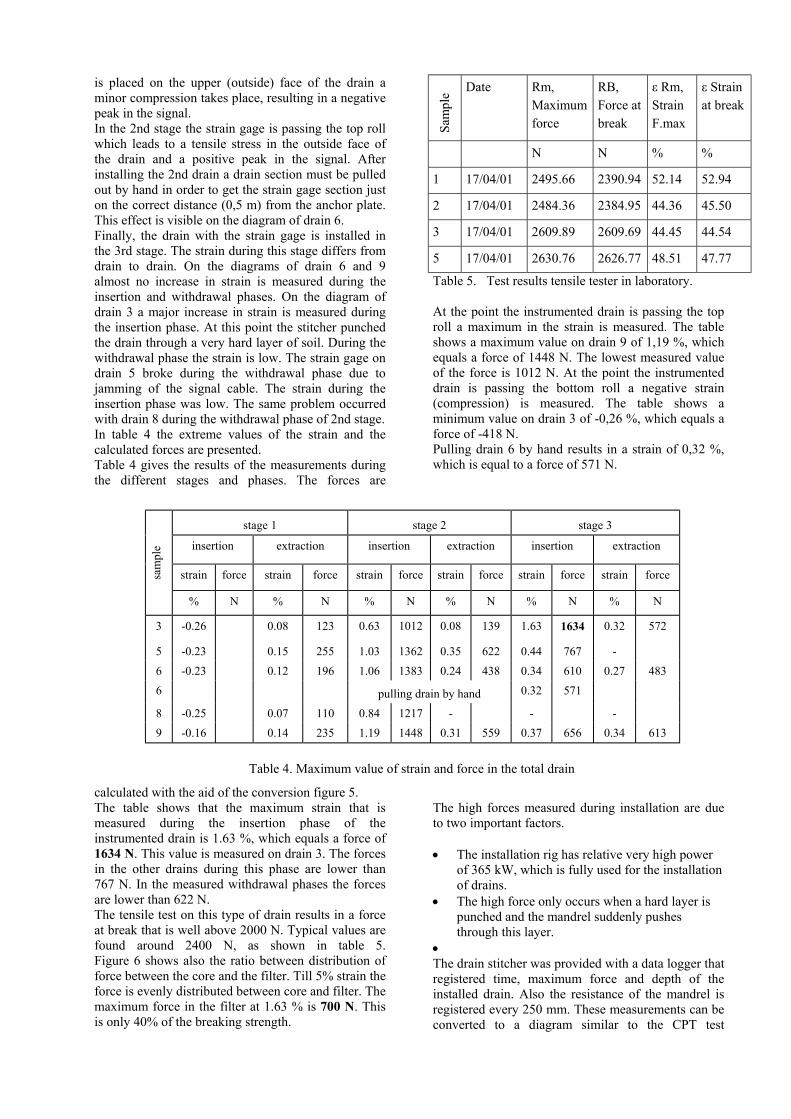
is placed on the upper (outside) face of the drain a minor compression takes place, resulting in a negative peak in the signal. In the 2nd stage the strain gage is passing the top roll which leads to a tensile stress in the outside face of the drain and a positive peak in the signal. After installing the 2nd drain a drain section must be pulled out by hand in order to get the strain gage section just on the correct distance (0,5 m) from the anchor plate. This effect is visible on the diagram of drain 6. Finally, the drain with the strain gage is installed in the 3rd stage. The strain during this stage differs from drain to drain. On the diagrams of drain 6 and 9 almost no increase in strain is measured during the insertion and withdrawal phases. On the diagram of drain 3 a major increase in strain is measured during the insertion phase. At this point the stitcher punched the drain through a very hard layer of soil. During the withdrawal phase the strain is low. The strain gage on drain 5 broke during the withdrawal phase due to jamming of the signal cable. The strain during the insertion phase was low. The same problem occurred with drain 8 during the withdrawal phase of 2nd stage. In table 4 the extreme values of the strain and the calculated forces are presented. Table 4 gives the results of the measurements during the different stages and phases. The forces are
calculated with the aid of the conversion figure 5. The table shows that the maximum strain that is measured during the insertion phase of the instrumented drain is 1.63 %, which equals a force of 1634 N. This value is measured on drain 3. The forces in the other drains during this phase are lower than 767 N. In the measured withdrawal phases the forces are lower than 622 N. The tensile test on this type of drain results in a force at break that is well above 2000 N. Typical values are found around 2400 N, as shown in table 5. Figure 6 shows also the ratio between distribution of force between the core and the filter. Till 5% strain the force is evenly distributed between core and filter. The maximum force in the filter at 1.63 % is 700 N. This is only 40% of the breaking strength.
Sam
ple
Date
Rm, Maximum force
RB, Force at break
ε Rm, Strain F.max
ε Strain at break
N
N
%
%
1
17/04/01
2495.66
2390.94
52.14
52.94
2
17/04/01
2484.36
2384.95
44.36
45.50
3
17/04/01
2609.89
2609.69
44.45
44.54
5
17/04/01
2630.76
2626.77
48.51
47.77
Table 5. Test results tensile tester in laboratory. At the point the instrumented drain is passing the top roll a maximum in the strain is measured. The table shows a maximum value on drain 9 of 1,19 %, which equals a force of 1448 N. The lowest measured value of the force is 1012 N. At the point the instrumented drain is passing the bottom roll a negative strain (compression) is measured. The table shows a minimum value on drain 3 of -0,26 %, which equals a force of -418 N. Pulling drain 6 by hand results in a strain of 0,32 %, which is equal to a force of 571 N.
The high forces measured during installation are due to two important factors. • The installation rig has relative very high power
of 365 kW, which is fully used for the installation of drains.
• The high force only occurs when a hard layer is punched and the mandrel suddenly pushes through this layer.
• The drain stitcher was provided with a data logger that registered time, maximum force and depth of the installed drain. Also the resistance of the mandrel is registered every 250 mm. These measurements can be converted to a diagram similar to the CPT test
stage 1
stage 2
stage 3
insertion
extraction
insertion
extraction
insertion
extraction
strain
force
strain
force
strain
force
strain
force
strain
force
strain
force
sa
mpl
e
%
N
%
N
%
N
%
N
%
N
%
N
3
-0.26
0.08
123
0.63
1012
0.08
139
1.63
1634
0.32
572
5
-0.23
0.15
255
1.03
1362
0.35
622
0.44
767
-
6
-0.23
0.12
196
1.06
1383
0.24
438
0.34
610
0.27
483
6
pulling drain by hand
0.32
571
8
-0.25
0.07
110
0.84
1217
-
-
-
9
-0.16
0.14
235
1.19
1448
0.31
559
0.37
656
0.34
613
Table 4. Maximum value of strain and force in the total drain

diagrams. A sample of such a diagram is given in figure 16. This is phase 3 of test number 4 where large forces were measured due to punching the hard top layer. The same layers can be determined in the CPT test in figure 10. 6. SUMMARY AND CONCLUSIONS In the period 9-13 July 2001 a field investigation has been carried out on the island of Tekong, Singapore, to determine the actual strain and associated forces that occur in vertical drains during the installation process, by measuring the strain by means of strain gages. The investigated drain was a Mebradrain, type MD7007, which was installed to a depth of about 32-34 m below the surface. The force in the drain was calculated with the aid of a conversion table, which was derived from the results of a tensile test in the laboratory. The strain was continuously measured during a number of sequences, each comprising of 2 measurements in the rig and 1during the installation in the ground. Relative high values of the strain and force were measured during the passing of the drain at the bottom roll, the top roll and the insertion phase of the instrumented drain. During the passing of the bottom roll the forces were theoretical in the range of -257 N to -418 N, also a minor compression occurred due to the fact that the strain gage was placed on the upper (outside) face of the drain. In reality there are no compression forces possible, because of the flexibility of the drain. During the passing of the top roll the forces were in the range of 1012 N to 1448 N. The insertion phase of the instrumented drain produces force values between 571 N and 1634 N. During the withdrawal phase the force range is 483 N to 622 N. The tensile test on the Mebradrain, type MD7007, shows that the force at break is higher than 2000 N. Typical values are found around 2400 N. The measurements results demonstrate that the calculated forces stay below these values that are found during the tensile tests. 7. LITERATURE Crow Publication 77 “Verticale Drainage” The Mobilised strength of Prefabricated Vertical Drains, 1998, W. Voskamp Installation Forces in PVD Filter Sleeve For Flexidrain FD767, 2001, Chew Soon Hoe and G.P. Karunaratne
Photo 3. Samples used at the lab tests
Photo 2. Drain samples used for field tests
Photo 4. Strain gage glued to the sample

Drain log test 4 at 13:53:46 (drain 3) Figure 16. Resistance according data logger
0 4 8 12 16 20 24 28 32 360123456789
101112131415161718192021222324252627282930
31.532.533.534.535.5
Dep
th (m
)
(Mpa)
Figure 13. Test 5, drain 6
Figure 14. Test 7, drain 8
Figure 15. Test 8, drain 9 Figure 11. Test 3, drain 5
Figure 12. Test 4, drain 3