forecast 2016 - · pdf fileforecast 2016. berkadia is an ... berkadia’s 2015 loan...
TRANSCRIPT

N AT I O N A L A PA R T M E N T R E S E A R C H R E P O R T
a Berkshire Hathaway and Leucadia National company
FORECAST 2016

Berkadia is an industry-leading real estate company. We provide comprehensive capital solutions and
investment sales advisory and research services for multifamily and commercial properties, and
rank among the largest, highest rated and most respected primary, master
and special servicers in the industry.
$26 BILLIONBerkadia’s 2015 loan origination volume surpassed $20 billion, while investment sales exceeded $6 billion.
$18 BILLIONSince 2012, our investment sales division has closed more than 1,700 transactions, totaling $18 billion.
16,500 TRANSACTIONSOver 16,500 transactions financed throughout our history.
$86 BILLIONTotal historical sales by our investment sales advisors exceed $86 billion.
$235 BILLIONOne of the largest loan and servicing portfolios worldwide at $235 billion.
65 OFFICES65 offices nationwide, covering all major markets.
a Berkshire Hathaway and Leucadia National company
The Value of Certainty®

NATIONAL TRENDS 2
ALBUQUERQUE 4
ATLANTA 5
AUSTIN 6
BATON ROUGE 7
BIRMINGHAM 8
BOSTON 9
CENTRAL VALLEY | CA 10
CHARLESTON 11
CHATTANOOGA 12
CHICAGO 13
COLUMBUS 14
DALLAS-FORT WORTH 15
DENVER 16
DETROIT 17
HOUSTON 18
INLAND EMPIRE | CA 19
JACKSONVILLE 20
KANSAS CITY 21
LAS VEGAS 22
LOS ANGELES-NORTH 23
LOS ANGELES-SOUTH 24
LOS ANGELES-WEST 25
MEMPHIS 26
NEW YORK-NEW JERSEY 27
OKLAHOMA CITY 28
ORANGE COUNTY | CA 29
ORLANDO 30
PHILADELPHIA 31
PHOENIX 32
PORTLAND 33
RALEIGH-DURHAM 34
SACRAMENTO 35
SALT LAKE CITY 36
SAN ANTONIO 37
SAN DIEGO 38
SAN FRANCISCO-OAKLAND 39
SEATTLE-TACOMA 40
SOUTH FLORIDA 41
ST. LOUIS 42
TAMPA-ST. PETERSBURG 43
TUCSON 44
TULSA 45
VIRGINIA BEACH 46
WASHINGTON, D.C. 47
DISCLAIMER AND SOURCES 48
TABLE OF CONTENTS
FORECAST 2016

-4%
-2%
0%
2%
4%
-6
-4
-2
0
2
4
2007 2008 2009 2010 2011 2012 2013 2014 2015* 2016**
Employment Percentage Change
U.S. EMPLOYMENT GROWTH
Em
plo
ym
en
t C
han
ge (
mil) E
mp
loym
en
t Ch
an
ge
2 Data and images pertaining to employment, income, permits, population, rents, single-family housing and vacancy are year-end figures. Absorption, construction and apartment sales figures are full-year totals. Numbers for 2015 are estimated values, while 2016 figures are forecast projections. Apartment market data criteria and methodologies vary by market.
The U.S. economy closed 2015 on a strong note with healthy late-year job creation, despite international headwinds and the milder pace of hiring earlier in the fall. National employment expanded by approximately 2.5 million jobs in 2015. Staffing additions came in lower than the 3.1 million workers added in 2014; though, rising wages indicate ancillary employment-market strength despite the dip in the headline reading. Third-quarter GDP registered a 2.1% increase, following a stout 3.9% midyear gain. The U.S. consumer buoyed the economy in the face of international distress such as weakness in the Chinese economy that is stifling emerging foreign markets. U.S. hourly wages surged 2.5% annually in October, compared to a 1.8% rise in 2014. Additionally, consumer credit notched the largest increase on record by ascending $28.9 billion in September. With healthy consumer activity expected to persist, private consumption will soften downside risks from abroad in 2016, with U.S. payrolls forecast to rise by 2.4 million jobs.
The New York-New Jersey and Dallas-Fort Worth markets again claimed the top spots in job creation in 2015, adding 119,000 and 88,900 workers, respectively. Los Angeles employers, meanwhile, hired 85,600 personnel, as the impact of plunging oil prices pushed Houston out of third place and limited gains to 16,700 positions in 2015. The San Francisco-Oakland, Salt Lake City and San Antonio markets led in percent growth, each expanding 4.2% or more last year. In 2016, the Bay Area, Austin and San Antonio are projected to lead employment gains, all on pace to rise by 2.8% or more.
ECONOMY AND APARTMENT SUPPLY
The employment-driven apartment demand was met with significant supply-side pressure last year. Developers added 355,000 market-rate units to inventory over the course of 2015, putting upward pressure on vacancy in some metros. The Dallas-Fort Worth and Houston metros led inventory expansion, registering 19,200 and 16,700 new units, respectively. Deliveries were also elevated in primary, barrier-to-entry markets, with 9,900 rentals in Washington, D.C., 9,200 apartments in the New York-New Jersey area and 7,400 units in Los Angeles. Supply growth will moderate in 2016 yet remain elevated. Builders are on pace to complete 340,000 units this year, with New York-New Jersey, Dallas-Fort Worth and Houston each adding 15,000 rentals or more.
2015 PERFORMANCE HIGHLIGHTS
0 BPS YOY
VACANCY5.2%
21.4% YOY
CONSTRUCTION355,000 UNITS
1.8% YOY
EMPLOYMENTCHANGE
2,500,000
4.9% YOY
ASKING RENTS$1,250
*Estimate | Source: Berkadia, BLS, Moody’s Analytics
0%
1%
2%
3%
4%
0
30
60
90
120
N.Y
.-N
.J.
Dal
las-
Fo
rt W
ort
h
L.A
.
Atl
anta
D.C
.
Sea
ttle
Bo
sto
n
Inla
nd E
mp
ire
So
. Flo
rid
a
Chi
cag
o
Employment Percentage Change
TOP METROS: EMPLOYMENT GROWTH
Em
plo
ym
en
t C
han
ge 2
015
(th
s)*
Em
plo
ym
en
t Ch
an
ge 2
015
*
*Estimate; **Forecast | Source: Berkadia, BLS, Moody’s Analytics
0%
2%
4%
6%
0
5
10
15
20 Units Vacancy
Dal
las-
Fo
rt W
ort
h
Ho
ust
on
D.C
.
Den
ver
Atl
anta
N.Y
.-N
.J.
Au
stin
Sea
ttle
L.A
.
So
. Flo
rid
a
TOP METROS: SUPPLY GROWTH
Un
its
Co
mp
lete
d 2
015
(th
s)*
Vaca
ncy 2
015
*
*Estimate | Source: Berkadia Research, Axiometrics
0
100
200
300
400
2007 2008 2009 2010 2011 2012 2013 2014 2015* 2016**
U.S. CONSTRUCTION PIPELINE
Un
its
Co
mp
lete
d (
ths)
*Estimate; **Forecast | Source: Berkadia, Axiometrics, Moody’s Analytics
NATIONAL TRENDS

3Data and images pertaining to employment, income, permits, population, rents, single-family housing and vacancy are year-end figures. Absorption, construction and apartment sales figures are full-year totals. Numbers for 2015 are estimated values, while 2016 figures are forecast projections. Apartment market data criteria and methodologies vary by market.
0%$1,330 $2,776 $1,373 $1,598 $1,254 $1,852 $1,390 $1,088 $914 $2,250
3%
6%
9%
12%
Po
rtla
nd
Den
ver
Sea
ttle
Sac
ram
ento
San
Die
go
Inla
nd
Em
pir
e
Orl
and
o
Ph
oen
ix
Bo
sto
n
San
Fra
nci
sco
-Oak
lan
d
TOP METROS: ASKING RENT GROWTH
Ask
ing
Re
nt
Gro
wth
20
15*
VACANCY, RENTS AND INVESTMENT TRENDS
Persistent apartment absorption and job creation facilitated robust rent gains. National asking rents appreciated 4.9% to $1,250 per month in the past four quarters. Moreover, national effective rents rose at a quicker rate, ascending 5.3% to $1,244 per month. The effective rent improvement put the concessions gap at 0.5% of asking rents at year-end 2015, 50 basis points below the previous year and the lowest in a decade. With vacancy edging higher this year, operators will begin to expand renter incentives. Asking and effective rents are projected to rise 3.7% and 3.4% to $1,296 and $1,286 per month, respectively. As a result, concessions will tick up to 0.8% of asking rents by year-end.
Historically low interest rates and favorable apartment fundamentals bolstered multifamily investment activity in 2015; preliminary sales data indicates a 12% rise in the number of apartment transactions. Buyer competition was evident with the average cap rate compressing 30 basis points to 5.9% nationwide. Meanwhile, the average price increased 9% to $124,500 per unit. Demand for Class A assets was evident, though values for middle- and lower-tier communities advanced more rapidly. The average price per unit for B-grade apartments advanced 12% to $120,200, dropping first-year yields 40 basis points to an average of 5.9%. Class C pricing surged 15% to $84,200 per unit as cap rates descended 40 basis points to 6.2%. Class A initial yields receded 20 basis points to 5.4% due to the 5% rise in per-unit pricing to $187,700.
Despite the sharp rise in apartment stock, pent-up demand from previous years’ limited supply increases mitigated the impact of new units in many markets. Consequently, nationwide apartment vacancy ended 2015 at 5.2%, unchanged year over year. Operators in Detroit recorded the steepest decline in vacancy, which plunged 150 basis points to 4.6% as local builders added just 400 rentals last year. Among metros with considerable supply growth, resilient demand resulted in 80-basis-point vacancy decreases in Dallas-Fort Worth and Atlanta, to 4.3% and 5%, respectively. A second-consecutive year of steep supply additions, however, will cause U.S. apartment vacancy to tick up 10 basis points to 5.3% in 2016.
5%
6%
7%
8%
$1,000
$1,075
$1,150
$1,225
$1,300
2007 2008 2009 2010 2011 2012 2013 2014 2015* 2016**
Asking Rents Vacancy
U.S. VACANCY AND RENT
*Estimate; **Forecast | Source: Berkadia, Axiometrics
5.5%
6.0%
6.5%
7.0%
7.5%
$50,000
$75,000
$100,000
$125,000
2006 2007 2008 2009 2010 2011 2012 2013 2014 2015*
Price Per Unit Cap Rate
U.S. APARTMENT INVESTMENT
*Estimate; Property Sale +$5 Million and +100 Units | Source: Berkadia, CoStar Group, Inc.
*Estimate | Source: Berkadia, Axiometrics
3.0%
3.5%
4.0%
4.5%
5.0%
5.5%
N.Y
.-N
.J.
Po
rtla
nd
Sac
ram
en
to
L.A
. Ora
ng
e C
o. |
CA
So
. Flo
rid
a
Orl
and
o Dal
las
Ce
n. V
alle
y |
CA
San
Fra
nci
sco
-Oak
lan
d
2014 Vacancy 2015 Vacancy*
TOP METROS: LOWEST VACANCY
*Estimate | Source: Berkadia, Axiometrics
2016 PERFORMANCE HIGHLIGHTS
VACANCY5.3%
-4.2% YOY
CONSTRUCTION340,000 UNITS
1.7% YOY
EMPLOYMENTCHANGE
2,400,000
3.7% YOY
ASKING RENTS$1,296
10 BPS YOY

5.0%
6.0%
7.0%
8.0%
$700
$750
$800
$850
2012 2013 2014 2015* 2016**
Albuquerque payrolls expanded 1.7% in 2015, marking the fourth-consecutive year of job growth. Approximately 3,400 of the 6,500 total jobs created last year were in the professional and business services sector, supported by the new Convergys call center in Rio Rancho that hired the first of 250 workers in June. Sustained economic expansion lifted apartment demand as vacancy fell 80 basis points to 5.9%. Builders moved to satisfy this demand with 860 completions in 2015, two-thirds of which came online in the northwest quadrant of the metro. Renters gravitated to the new product as more than 50% of leasing activity occurred in the Northwest submarket. Robust apartment absorption was also present in the Southeast submarket, where vacancy plummeted 340 basis points, though asking rents dipped 0.5%. Operators took advantage of heightened demand, raising asking rents 2.5% metrowide to $826 per month.
2015 REVIEW
Limited completions and persistent leasing activity will push down multifamily vacancy in 2016. Prompted by favorable demand, multifamily developers will request permits for 410 apartments by year-end, while an additional 370 units are in various stages of the planning process. In the near term, builders are slated to deliver 180 apartments in 2016. Of those new apartments, approximately 100 units at the Broadstone Promenade in the North Central submarket are scheduled to come online by mid-year. Renters are expected to absorb 490 apartments metrowide, depressing vacancy 60 basis points to 5.3%. Rent appreciation of 2.1% is anticipated during this time, with asking rents reaching $843 per month by December. Effective rents will rise at a faster rate, 2.5% growth, to $834 per month. Consequently, concessions will fall from an average of 1.5% to 1.1% of asking rents. The improved apartment fundamentals will be supported by 1.5% employment growth as 5,800 workers are added to local payrolls. Call-center expansion will once again boost professional and business services sector employment as S&P Data LLC hires 425 workers in Rio Rancho in the next few years.
2016 PREVIEW
4
2015 PERFORMANCE HIGHLIGHTS
1.7% YOY
EMPLOYMENT6,500
2.5% YOY
ASKING RENTS$826
-80 BPS YOY
VACANCY5.9%
139.2% YOY
CONSTRUCTION860 Units
-10 BPS YOY
UNEMPLOYMENT RATE5.8%
-120 BPS YOY
CONCESSIONS1.5%
MARKET FACTS
POPULATION905,000
MEDIANHOUSEHOLD
INCOME$51,100
HOUSEHOLDS357,600
RENTSHARE OFWALLET19.4%
-15,000
-10,000
-5,000
0
5,000
10,000
2007 2008 2009 2010 2011 2012 2013 2014 2015* 2016**
ASKING RENTS AND VACANCY
*Estimate; **Forecast | Source: Berkadia, Moody’s Analytics
$50,000
$70,000
$90,000
$110,000
5.5%
6.0%
6.5%
7.0%
2011 2012 2013 2014 2015*
CAP RATE | PRICE PER UNIT
*Estimate | Source: Berkadia, CoStar Group
0
500
1,000
1,500
2011 2012 2013 2014 2015*
SALES ACTIVITY INDEX
*Estimate | Source: Berkadia, CoStar Group
0
400
800
1,200
2012 2013 2014 2015* 2016**
EMPLOYMENT CHANGE
YE 2015 0.1% YOY YE 2015 0.2% YOY YE 2015 1.6% YOY YE 2015 20 BPS YOY
Ind
ex
Valu
e (
Base
Ye
ar
20
10 =
10
0)
*Estimate; **Forecast | Source: Berkadia, Axiometrics, Moody’s Analytics
*Estimate; **Forecast | Source: Berkadia, Axiometrics, Moody’s Analytics
PERMITS AND DELIVERIES
ALBUQUERQUE
Data and images pertaining to employment, income, permits, population, rents, single-family housing and vacancy are year-end figures. Absorption, construction and apartment sales figures are full-year totals. Numbers for 2015 are estimated values, while 2016 figures are forecast projections. The sales information represents transactions of apartment properties with 20 or more units and sales price of $1 million or more. Apartment market data criteria and methodologies vary by market.

3.5%
4.5%
5.5%
6.5%
7.5%
$800
$900
$1,000
$1,100
2012 2013 2014 2015* 2016**
Intense multifamily development and planning occurred last year amid a robust local economy. Developers requested permits for 10,000 apartments, the most since 2007. Similarly, deliveries were the greatest in seven years as builders completed 9,350 units. The brisk pace of development, however, lagged demand, causing vacancy to fall 80 basis points to 5%. Market rents increased 5.5% to $1,041 per month as operators noted reduced availability. These healthy advances in apartment fundamentals were supported by 82,200 new jobs in 2015, a 3.2% year-over-year gain. Nearly one-third of the increase came from the professional and business services sector, where 26,200 jobs were created, 5.6% expansion. Another significant contributor to growth was the trade, transportation and utilities segment with 16,600 workers recruited for a 2.9% gain. The greatest rate of growth was a 6.5% surge, with the addition of 6,700 workers in the construction industry.
2015 REVIEW
Metro employment is projected to grow 2.7% in 2016 with 71,000 new workers. Construction payrolls will expand with approximately 5,000 jobs at the Atlanta Braves SunTrust Park development. Another 5,000 workers will be added through corporate expansions from State Farm, Mercedes-Benz, Kaiser Permanente, Stefanini and Sage Group over the next several years. The aggressive hiring will push down vacancy 50 basis points this year. Asking rents are expected to rise 4.7% to $1,090 per month. The favorable conditions will continue to attract investors in 2016. The most aggressive buyers will look to Gwinnett and Cobb counties, where cap rates are in the high-5% to high-6% range, depending on location and quality. Additionally, many Class B/C investors seek value-add properties among 1970s- through 1990s-vintage stock, where cap rates are compressing. Properties built in the 1970s and 1980s are frequently trading with cap rates in the mid-6% range, while 1990s inventory is averaging roughly 5.5%. Meanwhile, conservative investors are targeting Class A product in Buckhead and Midtown, often at first-year yields below 5%.
2016 PREVIEW
5
2015 PERFORMANCE HIGHLIGHTS
5.5% YOY
3.2% YOY
EMPLOYMENT82,200
ASKING RENTS$1,041
-80 BPS YOY
VACANCY5.0%
63.5% YOY
CONSTRUCTION9,350 Units
-100 BPS YOY
UNEMPLOYMENT RATE5.3%
-40 BPS YOY
CONCESSIONS0.4%
MARKET FACTS
POPULATION5,763,700
MEDIANHOUSEHOLD
INCOME$58,900
HOUSEHOLDS2,119,600
RENTSHARE OFWALLET21.2%
-150,000
-100,000
-50,000
0
50,000
100,000
2007 2008 2009 2010 2011 2012 2013 2014 2015* 2016**
ASKING RENTS AND VACANCY
*Estimate; **Forecast | Source: Berkadia, Moody’s Analytics
$30,000
$50,000
$70,000
$90,000
6.0%
6.5%
7.0%
7.5%
2011 2012 2013 2014 2015*
CAP RATE | PRICE PER UNIT
*Estimate | Source: Berkadia, CoStar Group
0
100
200
300
400
2011 2012 2013 2014 2015*
SALES ACTIVITY INDEX
*Estimate | Source: Berkadia, CoStar Group
0
4,000
8,000
12,000
2012 2013 2014 2015* 2016**
YE 2015 1.8% YOY YE 2015 2.0% YOY YE 2015 2.6% YOY
Ind
ex
Valu
e (
Base
Ye
ar
20
10 =
10
0)
YE 2015 60 BPS YOY
*Estimate; **Forecast | Source: Berkadia, Axiometrics, Moody’s Analytics
*Estimate; **Forecast | Source: Berkadia, Axiometrics, Moody’s Analytics
PERMITS AND DELIVERIES
ATLANTA
Data and images pertaining to employment, income, permits, population, rents, single-family housing and vacancy are year-end figures. Absorption, construction and apartment sales figures are full-year totals. Numbers for 2015 are estimated values, while 2016 figures are forecast projections. The sales information represents transactions of apartment properties with 20 or more units and sales price of $1 million or more. Apartment market data criteria and methodologies vary by market.
EMPLOYMENT CHANGE

3.5%
4.0%
4.5%
5.0%
$1,000
$1,050
$1,100
$1,150
$1,200
$1,250
2012 2013 2014 2015* 2016**
Austin employers accelerated hiring in 2015, driving apartment demand. Headcounts swelled 3.7%, or by 34,200 positions, in the prior four quarters, up from a 3.2% increase in 2014. The local rise outpaced the 1.8% national average during the last 12 months. The metro-leading 10,300 positions created in the professional and business services sector contributed to the upswing. With steady population growth and more job opportunities, household formation rose 2.9% in 2015. As a result, occupied stock grew by 8,750 apartments in 2015, the highest annual absorption in more than 15 years. Leasing exceeded the 8,590 deliveries since January, resulting in vacancy tightening 30 basis points to 4.6%. Heightened demand for apartments spurred operators to accelerate rent growth. After rising 3.8% in 2014, asking rents advanced 4.4% to $1,154 per month in December. Simultaneously, average concessions lowered from 0.5% to 0.3% of asking rents.
2015 REVIEW
With unemployment dropping below 3% in 2015, Austin is nearing full employment this year. As such, hiring will decelerate, though remain healthy in 2016. Headcounts are forecast to rise by 27,800 positions for a 2.9% increase. Technology companies will provide a boost to the metro, highlighted by the scheduled completion of the $304 million expansion of the Apple campus this year. The 1.1 million-square-foot addition will hold 3,600 more employees. The campus growth will help drive demand in the Far Northwest submarket, where vacancy fell 30 basis points to 4.9% last year and should continue to lower as limited new inventory comes online in 2016. Overall, vacancy is expected to decrease 20 basis points to 4.4% by December as elevated demand surpasses additions. Of the 8,010 apartments scheduled to come online this year, the largest community is the 444-unit Pearl Lantana in the West submarket. Operators will advance rents at a healthy clip, while moderately increasing concessions amid greater competition for renters. Asking rents will rise 4.3% to $1,204 per month in 2016 as concessions reach an average of two days of free rent.
2016 PREVIEW
6
2015 PERFORMANCE HIGHLIGHTS
3.7% YOY
EMPLOYMENT34,200
4.4% YOY
ASKING RENTS$1,154
-30 BPS YOY
VACANCY4.6%
8.2% YOY
CONSTRUCTION8,590 Units
-90 BPS YOY
UNEMPLOYMENT RATE2.9%
-20 BPS YOY
CONCESSIONS0.3%
MARKET FACTS
POPULATION2,031,600
MEDIANHOUSEHOLD
INCOME$65,200
HOUSEHOLDS770,000
RENTSHARE OFWALLET21.2%
-20,000
0
20,000
40,000
2007 2008 2009 2010 2011 2012 2013 2014 2015* 2016**
ASKING RENTS AND VACANCY PERMITS AND DELIVERIES
*Estimate; **Forecast | Source: Berkadia, Moody’s Analytics
$50,000
$75,000
$100,000
$125,000
5.5%
6.0%
6.5%
7.0%
2011 2012 2013 2014 2015*
CAP RATE | PRICE PER UNIT
*Estimate | Source: Berkadia, CoStar Group
0
100
200
300
400
2011 2012 2013 2014 2015*
SALES ACTIVITY INDEX
*Estimate | Source: Berkadia, CoStar Group
YE 2015 3.0% YOY YE 2015 2.9% YOY YE 2015 1.9% YOY
Ind
ex
Valu
e (
Base
Ye
ar
20
10 =
10
0)
0
4,000
8,000
12,000
2012 2013 2014 2015* 2016**
YE 2015 50 BPS YOY
*Estimate; **Forecast | Source: Berkadia, Axiometrics, Moody’s Analytics
*Estimate; **Forecast | Source: Berkadia, Axiometrics, Moody’s Analytics
AUSTIN
Data and images pertaining to employment, income, permits, population, rents, single-family housing and vacancy are year-end figures. Absorption, construction and apartment sales figures are full-year totals. Numbers for 2015 are estimated values, while 2016 figures are forecast projections. The sales information represents transactions of apartment properties with 20 or more units and sales price of $1 million or more. Apartment market data criteria and methodologies vary by market.
EMPLOYMENT CHANGE

4.0%
6.0%
8.0%
10.0%
$1,000
$1,025
$1,050
$1,075
$1,100
2012 2013 2014 2015* 2016**
Companies in Baton Rouge advanced headcounts by 10,400 workers last year, an increase of 2.6%. The construction industry added 3,600 workers, a 6.9% gain. Supporting the robust sector hiring was a significant number of industrial projects that progressed in 2015, including the $55 million IBM Technology Center, Thermaldyne’s $19 million waste remediation facility and the $45 million Water Campus project. Employment gains were also brisk among the professional and business services sector which expanded payrolls by 4,000 employees. Multifamily builders, attempting to take advantage of the surging economic development, stepped up supply, delivering 360 apartments. However, positive net absorption fell to 300 units last year. Consequently, vacancy edged up 10 basis points annually to 5.7% in December. Operators advanced asking rents, nevertheless, up 2.1% to $1,063 per month.
2015 REVIEW
Employment growth is forecast to reach 2.1% with 8,600 job additions by year-end. Shintech expects to break ground in the second quarter on a $1.4 billion ethylene plant at its Iberville Parish facility, creating work for 2,100 tradesmen; completion is slated for early 2018. Florida Fuel Connection will build a $75 million petroleum terminal in East Feliciana Parish and plans to recruit 250 total workers before completion in 2017. These industrial expansions, coupled with the ongoing downtown development, will bolster construction payrolls. Apartment developers will complete 890 units this year, the highest annual output since 2009. Absorption will again trail deliveries, causing vacancy to expand 20 basis points to 5.9%. Asking rents will appreciate 1.9% to $1,083 per month by December. In the investment arena, annual sales prices have varied greatly due to a small sample of sales and differing quality and size of assets trading hands. Despite the uneven year-over-year sales investment landscape, it is clear that buyers, particularly from out of state, will continue to pursue both Class A and value-add investments in Baton Rouge throughout 2016.
2016 PREVIEW
7
2015 PERFORMANCE HIGHLIGHTS
2.6% YOY
EMPLOYMENT10,400
2.1% YOY
ASKING RENTS$1,063
10 BPS YOY
VACANCY5.7%
123.3% YOY
CONSTRUCTION360 Units
-110 BPS YOY
UNEMPLOYMENT RATE5.5%
-20 BPS YOY
CONCESSIONS1.0%
MARKET FACTS
POPULATION828,800
MEDIANHOUSEHOLD
INCOME$53,600
HOUSEHOLDS311,900
RENTSHARE OFWALLET23.8%
-12,000
-6,000
0
6,000
12,000
18,000
2007 2008 2009 2010 2011 2012 2013 2014 2015* 2016**
ASKING RENTS AND VACANCY
*Estimate; **Forecast | Source: Berkadia, Moody’s Analytics
$0
$50,000
$100,000
$150,000
6.5%
7.0%
7.5%
8.0%
2011 2012 2013 2014 2015*
CAP RATE | PRICE PER UNIT
*Estimate | Source: Berkadia, CoStar Group
0
100
200
300
400
2011 2012 2013 2014 2015*
SALES ACTIVITY INDEX
*Estimate | Source: Berkadia, CoStar Group
0
300
600
900
2012 2013 2014 2015* 2016**
YE 2015 0.3% YOY YE 2015 1.0% YOY YE 2015 0.9% YOY
Ind
ex
Valu
e (
Base
Ye
ar
20
10 =
10
0)
YE 2015 30 BPS YOY
*Estimate; **Forecast | Source: Berkadia, Axiometrics, Moody’s Analytics
*Estimate; **Forecast | Source: Berkadia, Axiometrics, Moody’s Analytics
PERMITS AND DELIVERIES
BATON ROUGE
Data and images pertaining to employment, income, permits, population, rents, single-family housing and vacancy are year-end figures. Absorption, construction and apartment sales figures are full-year totals. Numbers for 2015 are estimated values, while 2016 figures are forecast projections. The sales information represents transactions of apartment properties with 20 or more units and sales price of $1 million or more. Apartment market data criteria and methodologies vary by market.
EMPLOYMENT CHANGE

6.5%
7.0%
7.5%
8.0%
$800
$850
$900
$950
2012 2013 2014 2015* 2016**
The local labor force expanded by 4,100 workers in the past 12 months, adding onto the 5,000 jobs created in 2014. Companies in the construction sector led job creation in which 1,700 positions were added, a 6.8% increase. Augmenting construction jobs was the development of Oxford Pharmaceuticals’ $29 million manufacturing plant which broke ground in the third quarter. An upswing in hiring among employers in the trade, transportation and utilities sector, as well as the education and health services segment, resulted in 2,300 combined new hires. Employment gains helped reduce metrowide apartment vacancy, ending the year down 20 basis points annually at 7.4%. Meanwhile, effective rents ascended 2% to $886 per month. After builders completed 1,110 units in 2014, supply growth eased to 830 rentals in 2015. Nevertheless, developers were particularly active in the Highway 280 and downtown areas.
2015 REVIEW
Blue-collar hiring will help lift overall payrolls this year. Kamtek is planning a $530 million expansion that will create 350 manufacturing jobs. Meanwhile, Publix will invest $34 million to build a distribution facility staffed with 200 trade and transportation workers. These additions will help boost metrowide employment by 3,500 jobs in 2016. Despite the modest slowdown in hiring, developers will ramp up completions to 1,120 units. Sturdy rental demand will outweigh deliveries, compressing vacancy another 20 basis points to 7.2%. Owners will raise asking rents 1.3% to $910 per month.
Robust demand for Class B/C apartment assets will drive deal flow this year. With fewer top-tier assets trading, annual pricing declined; however, acute competition for Class B/C apartment product is pulling down cap rates both in this segment and overall. Going-in rates for Class A communities are in the broad 5% range, though best-in-class properties will average 5.25%. Among middle- and lower-tier assets, cap rates typically start at 6% for ideally located, operationally sound communities, but can exceed 7% for more aggressive investments.
2016 PREVIEW
8
2015 PERFORMANCE HIGHLIGHTS
0.8% YOY
EMPLOYMENT4,100
2.0% YOY
ASKING RENTS$898
-20 BPS YOY
VACANCY7.4%
-25.1% YOY
CONSTRUCTION830 Units
0 BPS YOY
UNEMPLOYMENT RATE5.3%
10 BPS YOY
CONCESSIONS1.3%
MARKET FACTS
POPULATION1,153,200
MEDIANHOUSEHOLD
INCOME$50,700
HOUSEHOLDS457,100
RENTSHARE OFWALLET21.3%
-30,000
-20,000
-10,000
0
10,000
2007 2008 2009 2010 2011 2012 2013 2014 2015* 2016**
ASKING RENTS AND VACANCY
*Estimate; **Forecast | Source: Berkadia, Moody’s Analytics
$40,000
$50,000
$60,000
$70,000
$80,000
6.0%
6.5%
7.0%
7.5%
2011 2012 2013 2014 2015*
CAP RATE | PRICE PER UNIT
*Estimate | Source: Berkadia, CoStar Group
0
200
400
600
800
2011 2012 2013 2014 2015*
SALES ACTIVITY INDEX
*Estimate | Source: Berkadia, CoStar Group
0
500
1,000
1,500
2012 2013 2014 2015* 2016**
YE 2015 0.6% YOY YE 2015 1.1% YOY YE 2015 2.0% YOY
Ind
ex
Valu
e (
Base
Ye
ar
20
10 =
10
0)
YE 2015 0 BPS YOY
*Estimate; **Forecast | Source: Berkadia, Axiometrics, Moody’s Analytics
*Estimate; **Forecast | Source: Berkadia, Axiometrics, Moody’s Analytics
PERMITS AND DELIVERIES
BIRMINGHAM
Data and images pertaining to employment, income, permits, population, rents, single-family housing and vacancy are year-end figures. Absorption, construction and apartment sales figures are full-year totals. Numbers for 2015 are estimated values, while 2016 figures are forecast projections. The sales information represents transactions of apartment properties with 20 or more units and sales price of $1 million or more. Apartment market data criteria and methodologies vary by market.
EMPLOYMENT CHANGE

3.5%
4.0%
4.5%
5.0%
5.5%
$2,000
$2,100
$2,200
$2,300
$2,400
2012 2013 2014 2015* 2016**
More than 49,200 workers were added to local payrolls last year as employment expanded 1.9%. Professional and business services companies hired 18,100 workers. Aggressive recruiting at Liberty Mutual Insurance supported expansion in the financial activities segment where 2,300 staffers were recruited. Economic resiliency extended to the manufacturing industry, aided by 1366 Technologies, which began filling the first of 150 newly created positions. Healthy job growth supported multifamily absorption, which advanced 5.9% during 2015 with 6,480 newly occupied apartments. Vacancy was unchanged year over year at 4.6%. New inventory filled quickly as vacancy fell in the Cambridge/Watertown/Waltham and Central City/Back Bay/Beacon Hill submarkets, the two areas with the greatest number of completions. Operators across the metro area took advantage of heightened apartment demand, raising asking rents 5.9% to $2,250 per month.
2015 REVIEW
Favorable economic conditions and apartment fundamentals are expected to persist in the Boston metro area in 2016. Robust multifamily deliveries are anticipated, despite a projected 39.5% annual decrease to 4,110 units. Approximately 20% of new inventory in the metro will come online among several mid-rise apartment communities in the Mystic River North/Route 128 submarket. Significant completions are also scheduled in the Cambridge/Watertown/Waltham and Boston City submarkets. Brisk leasing activity is predicted with the absorption of 5,640 apartments marketwide. Demand will outpace completions by 37.3%, resulting in vacancy falling 40 basis points to 4.2% by December, the lowest year-end rate since 2000. The elevated leasing activity will be supported by the addition of 44,900 workers to the labor force, a 1.7% annual increase, and the seventh-consecutive year of job growth. Developers, anticipating sustained apartment demand, will augment the planning pipeline with 8,470 permits this year. Meanwhile, multifamily operators will capitalize on economic expansion and shrinking apartment availability by raising asking rents 3.4% to $2,327 per month.
2016 PREVIEW
9
2015 PERFORMANCE HIGHLIGHTS
1.9% YOY
EMPLOYMENT49,200
5.9% YOY
ASKING RENTS$2,250
0 BPS YOY
VACANCY4.6%
22.5% YOY
CONSTRUCTION6,800 Units
-80 BPS YOY
UNEMPLOYMENT RATE4.0%
-20 BPS YOY
CONCESSIONS0.2%
MARKET FACTS
POPULATION4,783,700
MEDIANHOUSEHOLD
INCOME$77,200
HOUSEHOLDS1,853,100
RENTSHARE OFWALLET35.0%
-75,000
-50,000
-25,000
0
25,000
50,000
2007 2008 2009 2010 2011 2012 2013 2014 2015* 2016**
ASKING RENTS AND VACANCY
*Estimate; **Forecast | Source: Berkadia, Moody’s Analytics
$125,000
$150,000
$175,000
$200,000
4.0%
5.0%
6.0%
7.0%
2011 2012 2013 2014 2015*
CAP RATE | PRICE PER UNIT
*Estimate | Source: Berkadia, CoStar Group
0
100
200
300
2011 2012 2013 2014 2015*
SALES ACTIVITY INDEX
*Estimate | Source: Berkadia, CoStar Group
0
3,000
6,000
9,000
2012 2013 2014 2015* 2016**
YE 2015 0.7% YOY YE 2015 1.3% YOY YE 2015 2.1% YOY
Ind
ex
Valu
e (
Base
Ye
ar
20
10 =
10
0)
YE 2015 130 BPS YOY
*Estimate; **Forecast | Source: Berkadia, Axiometrics, Moody’s Analytics
*Estimate; **Forecast | Source: Berkadia, Axiometrics, Moody’s Analytics
PERMITS AND DELIVERIES
BOSTON
Data and images pertaining to employment, income, permits, population, rents, single-family housing and vacancy are year-end figures. Absorption, construction and apartment sales figures are full-year totals. Numbers for 2015 are estimated values, while 2016 figures are forecast projections. The sales information represents transactions of apartment properties with 20 or more units and sales price of $1 million or more. Apartment market data criteria and methodologies vary by market.
EMPLOYMENT CHANGE

3.0%
4.0%
5.0%
6.0%
$800
$850
$900
$950
2012 2013 2014 2015* 2016**
Central Valley total nonfarm employment increased 1.6%, or by 18,800 workers, in 2015. With Amazon and Walmart expanding their presence in the area by creating more than 1,000 combined jobs, the trade, transportation and utilities sector was a major economic boost. The sector expanded 1.6% with 4,000 positions since January. The leisure and hospitality industry led hiring with 5,800 additions for a 5% increase. An improving job market led to leasing activity at twice the pace of inventory growth as vacancy lowered 50 basis points to 3.5%, the lowest year-end rate since 2001 when vacancy was 3.1%. A total of 750 apartments came online in 2015, up from 240 deliveries during the prior year. Spurred by rising demand, the average asking rent advanced 3.3% annually to $918 per month in December. Simultaneously, effective rents increased 3.9% to $913 per month, lowering concessions to an average of two days of free rent.
2015 REVIEW
After an ease in hiring in 2015, Central Valley businesses will again accelerate job creation to 1.9% with 22,700 new hires this year, as more warehouse and distribution centers emerge. The first phase of the International Park of Commerce development in Tracy is scheduled to open this year, which includes FedEx as a tenant. Development of the high-speed rail will boost employment, which already supported a sharp drop in vacancy in Fresno County last year. Central Valley could grow as a transportation hub as Hyperloop Transportation Technologies announced a plan to launch a five-mile Hyperloop test track in Kings County this year. Developers are focusing construction around these potential transportation hubs, with nearly three quarters of the 590 metrowide completions scheduled for this year in Fresno and San Joaquin counties. Rental demand will persist throughout Central Valley, as vacancy lowers 20 basis points to 3.3% by December. Operators will capitalize on heightened leasing activity by lifting asking rents 2.8% annually to $944 per month, while holding concessions at an average of two days of free rent.
2016 PREVIEW
10
2015 PERFORMANCE HIGHLIGHTS
1.6% YOY
EMPLOYMENT18,800
3.3% YOY
ASKING RENTS$918
-50 BPS YOY
VACANCY3.5%
206.1% YOY
CONSTRUCTION750 Units
-100 BPS YOY
UNEMPLOYMENT RATE10.1%
-60 BPS YOY
CONCESSIONS0.5%
MARKET FACTS
POPULATION4,038,100
MEDIANHOUSEHOLD
INCOME$47,500
HOUSEHOLDS1,240,500
RENTSHARE OFWALLET23.2%
-75,000
-50,000
-25,000
0
25,000
50,000
2007 2008 2009 2010 2011 2012 2013 2014 2015* 2016**
ASKING RENTS AND VACANCY
*Estimate; **Forecast | Source: Berkadia, Moody’s Analytics
$35,000
$45,000
$55,000
$65,000
6.5%
7.0%
7.5%
8.0%
8.5%
2011 2012 2013 2014 2015*
CAP RATE | PRICE PER UNIT
*Estimate | Source: Berkadia, CoStar Group
0
200
400
600
2011 2012 2013 2014 2015*
SALES ACTIVITY INDEX
*Estimate | Source: Berkadia, CoStar Group
0
500
1,000
1,500
2012 2013 2014 2015* 2016**
YE 2015 1.3% YOY YE 2015 1.7% YOY YE 2015 2.4% YOY
Ind
ex
Valu
e (
Base
Ye
ar
20
10 =
10
0)
YE 2015 20 BPS YOY
*Estimate; **Forecast | Source: Berkadia, Axiometrics, Moody’s Analytics
*Estimate; **Forecast | Source: Berkadia, Axiometrics, Moody’s Analytics
PERMITS AND DELIVERIES
CENTRAL VALLEY | CA
Data and images pertaining to employment, income, permits, population, rents, single-family housing and vacancy are year-end figures. Absorption, construction and apartment sales figures are full-year totals. Numbers for 2015 are estimated values, while 2016 figures are forecast projections. The sales information represents transactions of apartment properties with 20 or more units and sales price of $1 million or more. Apartment market data criteria and methodologies vary by market.
EMPLOYMENT CHANGE

4.5%
5.5%
6.5%
7.5%
$800
$900
$1,000
$1,100
2012 2013 2014 2015* 2016**
Apartment construction was well paced throughout 2015, allowing supply and demand to remain relatively balanced. Apartment developers added 1,620 units, boosting inventory by 3.1%. Builders concentrated deliveries in the submarkets of Berkeley County/Other and Central Charleston where there was ample demand. Brisk leasing provided vacancy improvements in both submarkets, where Berkeley County/Other vacancy tightened 90 basis points to 5.1% and Central Charleston rates compressed 80 basis points to 4.1%. The metrowide rate was 5.2%, the lowest year-end vacancy in nine years. Amid the vacancy decline, asking rents in Charleston elevated 5% to $1,031 per month. Underpinning the multifamily improvements was an annual employment gain of 1.6% in which employers added 5,300 total positions. Companies in the leisure and hospitality industry, along with education and health services employers, led hiring, collectively adding 3,800 workers.
2015 REVIEW
Hiring will accelerate in 2016, helping ameliorate supply-side vacancy pressure. Builders will complete 2,610 units this year, which is forecast to lift vacancy 70 basis points to 5.9% by December. Following recent robust rent gains, annual asking rent appreciation will slow to a still-healthy 3.1%, reaching $1,063 per month. Additionally, concessions will increase 50 basis points to 1.3% of asking rents. On the job front, payrolls will expand by 6,600 workers. Mercedes-Benz Vans and Volvo will separately begin construction in 2016 on assembly factories, bringing 3,300 manufacturing jobs to Charleston.
Meanwhile, investment activity will persist at a healthy pace due to demand for Class A and B apartment assets. Both in-state and East Coast buyers are driving velocity for top-tier assets. In this segment, cap rates are pushing toward the low- to mid-5% range, with pricing gravitating to $140,000 per unit, though values can rise by 50% for best-in-class communities. For middle-tier product, initial yields for well-run and located communities will near 6%, but rise to the high-6% range for B-minus assets.
2016 PREVIEW
11
2015 PERFORMANCE HIGHLIGHTS
1.6% YOY
EMPLOYMENT5,300
5.0% YOY
ASKING RENTS$1,031
-10 BPS YOY
VACANCY5.2%
-11.6% YOY
CONSTRUCTION1,620 Units
-50 BPS YOY
UNEMPLOYMENT RATE5.3%
30 BPS YOY
CONCESSIONS0.8%
MARKET FACTS
POPULATION746,500
MEDIANHOUSEHOLD
INCOME$54,700
HOUSEHOLDS293,700
RENTSHARE OFWALLET22.6%
-18,000
-12,000
-6,000
0
6,000
12,000
2007 2008 2009 2010 2011 2012 2013 2014 2015* 2016**
ASKING RENTS AND VACANCY
*Estimate; **Forecast | Source: Berkadia, Moody’s Analytics
$60,000
$80,000
$100,000
$120,000
5.0%
5.5%
6.0%
6.5%
7.0%
2011 2012 2013 2014 2015*
CAP RATE | PRICE PER UNIT
*Estimate | Source: Berkadia, CoStar Group
0
300
600
900
2011 2012 2013 2014 2015*
SALES ACTIVITY INDEX
*Estimate | Source: Berkadia, CoStar Group
0
1,000
2,000
3,000
2012 2013 2014 2015* 2016**
YE 2015 1.7% YOY YE 2015 2.5% YOY YE 2015 2.4% YOY
Ind
ex
Valu
e (
Base
Ye
ar
20
10 =
10
0)
YE 2015 60 BPS YOY
*Estimate; **Forecast | Source: Berkadia, Axiometrics, Moody’s Analytics
*Estimate; **Forecast | Source: Berkadia, Axiometrics, Moody’s Analytics
PERMITS AND DELIVERIES
CHARLESTON
Data and images pertaining to employment, income, permits, population, rents, single-family housing and vacancy are year-end figures. Absorption, construction and apartment sales figures are full-year totals. Numbers for 2015 are estimated values, while 2016 figures are forecast projections. The sales information represents transactions of apartment properties with 20 or more units and sales price of $1 million or more. Apartment market data criteria and methodologies vary by market.
EMPLOYMENT CHANGE

3.5%
4.5%
5.5%
6.5%
$800
$825
$850
$875
$900
2012 2013 2014 2015* 2016**
Aggressive hiring in the trade, transportation and utilities sector accounted for nearly one-third of the 4,000 jobs created in the metro area in 2015 as overall employment expanded 1.7%. Amazon filled 500 positions during this time, the primary contributor to 1,300 new jobs in the sector. The greatest rate of growth, however, occurred in the professional and business services segment, which advanced 4.3% with 1,200 workers added. Multifamily developers, confident in sustained economic expansion, requested permits for 750 apartments. The broad-based job growth supported a 16.3% increase in absorption. Renters had a broader choice of apartments last year as 870 units came online, a 3.2% annual increase in rental inventory. Builders concentrated much of the new stock in the southern portion of the metro. By year-end, overall vacancy was 4.8%, 30 basis points lower than one year prior. Market rents advanced 2.7% to $866 per month as vacancy decreased.
2015 REVIEW
Fallout from Volkswagen’s emissions scandal poses modest downside risk to job creation due to the company’s large presence in the metro. Nevertheless, at the close of 2015, the automaker remained committed to expanding local manufacturing operations. With no imminent autoworker layoffs on the horizon, metrowide employment is forecast to rise by 3,600 workers this year, a gain of 1.5% that will support apartment absorption of 460 units. Vacancy will descend 50 basis points to 4.3%, while operators lift market rents 2.1% to $884 per month by year-end. Similarly, effective rents are on pace to appreciate 2.1% to $878 per month. Improving apartment fundamentals will encourage developers to increase planning activity as they request permits for 940 apartments, a 24.9% increase over issuance in 2015. Meanwhile, 340 units are scheduled to come online. Approximately half of the deliveries will be completed among two mid-rise developments in the Central submarket, The Mission at Main and Vista Cameron Harbor apartment communities. Additionally, more than a dozen multifamily developments with nearly 3,500 total units are in various stages of the planning process.
2016 PREVIEW
12
2015 PERFORMANCE HIGHLIGHTS
1.7% YOY
EMPLOYMENT4,000
2.7% YOY
ASKING RENTS$866
-30 BPS YOY
VACANCY4.8%
68.2% YOY
CONSTRUCTION870 Units
-80 BPS YOY
UNEMPLOYMENT RATE5.5%
-70 BPS YOY
CONCESSIONS0.7%
MARKET FACTS
POPULATION549,800
MEDIANHOUSEHOLD
INCOME$51,300
HOUSEHOLDS222,600
RENTSHARE OFWALLET20.3%
-15,000
-10,000
-5,000
0
5,000
2007 2008 2009 2010 2011 2012 2013 2014 2015* 2016**
ASKING RENTS AND VACANCY
*Estimate; **Forecast | Source: Berkadia, Moody’s Analytics
$40,000
$50,000
$60,000
$70,000
$80,000
6.0%
6.5%
7.0%
7.5%
8.0%
2011 2012 2013 2014 2015*
CAP RATE | PRICE PER UNIT
*Estimate | Source: Berkadia, CoStar Group
0
100
200
300
2011 2012 2013 2014 2015*
SALES ACTIVITY INDEX
*Estimate | Source: Berkadia, CoStar Group
0
400
800
1,200
2012 2013 2014 2015* 2016**
YE 2015 0.6% YOY YE 2015 1.2% YOY YE 2015 2.6% YOY
Ind
ex
Valu
e (
Base
Ye
ar
20
10 =
10
0)
YE 2015 0 BPS YOY
*Estimate; **Forecast | Source: Berkadia, Axiometrics, Moody’s Analytics
*Estimate; **Forecast | Source: Berkadia, Axiometrics, Moody’s Analytics
PERMITS AND DELIVERIES
CHATTANOOGA
Data and images pertaining to employment, income, permits, population, rents, single-family housing and vacancy are year-end figures. Absorption, construction and apartment sales figures are full-year totals. Numbers for 2015 are estimated values, while 2016 figures are forecast projections. The sales information represents transactions of apartment properties with 20 or more units and sales price of $1 million or more. Apartment market data criteria and methodologies vary by market.
EMPLOYMENT CHANGE

4.0%
4.5%
5.0%
5.5%
6.0%
$1,350
$1,400
$1,450
$1,500
$1,550
2012 2013 2014 2015* 2016**
Despite contracting manufacturing payrolls, hiring in several other sectors helped lift overall employment and maintain apartment demand. Chicago-area payrolls expanded by 44,000 positions in the past 12 months. The 18,600 workers added in the professional and business services segment led the metro in 2015. The education and health services and the trade, transportation and utilities industries, meanwhile, combined to recruit 18,100 personnel. Conversely, the reduction of 5,500 manufacturing jobs was the largest drag on the economy. Despite this decline, overall hiring was sufficient to depress vacancy amid a 29.5% year-over-year rise in completions. The 4,770 apartment units that came online marketwide in 2015 trailed absorption of 7,120 units, underpinning a 30-basis-point annual decline in vacancy to 4.7%. Occupancy improvements supported operators’ ability to raise rents, with asking rents advancing 3.4% annually to $1,504 per month at the end of 2015.
2015 REVIEW
Although the ease in job creation this year will be modest, completions will accelerate causing vacancy to edge higher. The 41,200 new hires expected this year will increase Chicago-area payrolls by 0.9%. Meanwhile, metrowide inventory will rise by 7,740 units, a 62.3% annual increase in deliveries. Supply growth will be greatest within the city, with The Loop, City West and Gold Coast/River North submarkets expected to register more than 3,900 total new apartments this year. In the suburbs, at least 500 units will come online in the near-in Glenview/Evanston submarket.
While vacancy will rise in 2016, the supply imbalance will be modest and temporary. Marketwide vacancy will tick up 20 basis points to 4.9% by December. In comparison, vacancy averaged 6.3% in the three years preceding the recession. The mild vacancy rise will allow operators to continue to raise rents, though concessions will expand. Asking rents are forecast to rise 2.9% to $1,547 per month this year. Effective rents will advance 2.3% to $1,525 per month, expanding average concessions to 1.4% of asking rents.
2016 PREVIEW
13
2015 PERFORMANCE HIGHLIGHTS
1.0% YOY
EMPLOYMENT44,000
3.4% YOY
ASKING RENTS$1,504
-30 BPS YOY
VACANCY4.7%
29.5% YOY
CONSTRUCTION4,770 Units
-90 BPS YOY
UNEMPLOYMENT RATE5.3%
-10 BPS YOY
CONCESSIONS0.9%
MARKET FACTS
POPULATION9,598,800
MEDIANHOUSEHOLD
INCOME$64,400
HOUSEHOLDS3,557,600
RENTSHARE OFWALLET28.0%
-240,000
-160,000
-80,000
0
80,000
2007 2008 2009 2010 2011 2012 2013 2014 2015* 2016**
ASKING RENTS AND VACANCY
*Estimate; **Forecast | Source: Berkadia, Moody’s Analytics
$80,000
$90,000
$100,000
$110,000
$120,000
6.5%
7.0%
7.5%
8.0%
2011 2012 2013 2014 2015*
CAP RATE | PRICE PER UNIT
*Estimate | Source: Berkadia, CoStar Group
0
100
200
300
2011 2012 2013 2014 2015*
SALES ACTIVITY INDEX
*Estimate | Source: Berkadia, CoStar Group
0
3,000
6,000
9,000
2012 2013 2014 2015* 2016**
YE 2015 0.3% YOY YE 2015 0.9% YOY YE 2015 2.9% YOY
Ind
ex
Valu
e (
Base
Ye
ar
20
10 =
10
0)
YE 2015 10 BPS YOY
*Estimate; **Forecast | Source: Berkadia, Axiometrics, Moody’s Analytics
*Estimate; **Forecast | Source: Berkadia, Axiometrics, Moody’s Analytics
PERMITS AND DELIVERIES
CHICAGO
Data and images pertaining to employment, income, permits, population, rents, single-family housing and vacancy are year-end figures. Absorption, construction and apartment sales figures are full-year totals. Numbers for 2015 are estimated values, while 2016 figures are forecast projections. The sales information represents transactions of apartment properties with 20 or more units and sales price of $1 million or more. Apartment market data criteria and methodologies vary by market.
EMPLOYMENT CHANGE

4.0%
4.5%
5.0%
5.5%
$750
$800
$850
$900
2012 2013 2014 2015* 2016**
Education and health services employment surged 6.8% in 2015 with the addition of 10,500 workers. The sector was the largest contributor to 23,500 new jobs in the metro, equating to 2.3% annual growth. Substantial increases were also recorded in the professional and business services segment as 4,300 jobs were created. In the trade, transportation and utilities sector, 4,200 workers were hired, supported by 120 new positions at online pet retailer BarkBox. The broad-based hiring fueled healthy apartment demand in step with supply growth, keeping vacancy at 4.9%, the same as one year earlier. Builders finished 3,300 apartments last year, the greatest annual completions since 2004. Monthly asking rents appreciated at a quicker 3% rate in 2015, compared to 2.9% in the prior year, reaching $845 by December. Meanwhile, effective rents advanced 3.1% to $833 per month.
2015 REVIEW
Metrowide employment is projected to expand 1.8% this year with the addition of 18,900 workers. Apartment fundamentals will continue to improve with the sustained economic growth. Renters are forecast to occupy 1,650 additional units this year, outpacing the 1,080 rentals that come online. More than one-quarter of the new stock is slated for the University/Downtown submarket. Builders will deliver an even assortment of garden and mid-rise communities across the metro. The largest development, the three-story, 326-unit District at Linworth, is slated for completion late in the year. As deliveries trail absorption, metrowide vacancy is predicted to fall 40 basis points to 4.5% by December, the lowest year-end rate since 2000. The downward trend in availability will enable further rent appreciation. Landlords are expected to increase market rents 2.6% to $867 per month, while effective rents reach $857 per month, a 2.9% gain. Operators will generate additional revenue by cutting average concessions from 1.4% to 1.2% of asking rents over the course of the year.
2016 PREVIEW
14
2015 PERFORMANCE HIGHLIGHTS
2.3% YOY
EMPLOYMENT23,500
3.0% YOY
ASKING RENTS$845
0 BPS YOY
VACANCY4.9%
59.9% YOY
CONSTRUCTION3,300 Units
-80 BPS YOY
UNEMPLOYMENT RATE3.6%
-10 BPS YOY
CONCESSIONS1.4%
MARKET FACTS
POPULATION2,029,900
MEDIANHOUSEHOLD
INCOME$56,700
HOUSEHOLDS802,600
RENTSHARE OFWALLET17.9%
-40,000
-20,000
0
20,000
40,000
2007 2008 2009 2010 2011 2012 2013 2014 2015* 2016**
ASKING RENTS AND VACANCY
*Estimate; **Forecast | Source: Berkadia, Moody’s Analytics
$30,000
$40,000
$50,000
$60,000
7.0%
7.5%
8.0%
8.5%
2011 2012 2013 2014 2015*
CAP RATE | PRICE PER UNIT
*Estimate | Source: Berkadia, CoStar Group
0
100
200
300
400
2011 2012 2013 2014 2015*
SALES ACTIVITY INDEX
*Estimate | Source: Berkadia, CoStar Group
0
2,000
4,000
6,000
2012 2013 2014 2015* 2016**
YE 2015 1.2% YOY YE 2015 2.0% YOY YE 2015 1.1% YOY
Ind
ex
Valu
e (
Base
Ye
ar
20
10 =
10
0)
YE 2015 30 BPS YOY
*Estimate; **Forecast | Source: Berkadia, Axiometrics, Moody’s Analytics
*Estimate; **Forecast | Source: Berkadia, Axiometrics, Moody’s Analytics
PERMITS AND DELIVERIES
COLUMBUS
Data and images pertaining to employment, income, permits, population, rents, single-family housing and vacancy are year-end figures. Absorption, construction and apartment sales figures are full-year totals. Numbers for 2015 are estimated values, while 2016 figures are forecast projections. The sales information represents transactions of apartment properties with 20 or more units and sales price of $1 million or more. Apartment market data criteria and methodologies vary by market.
EMPLOYMENT CHANGE
3.0%
4.0%
5.0%
6.0%
$800
$900
$1,000
$1,100
2012 2013 2014 2015* 2016**
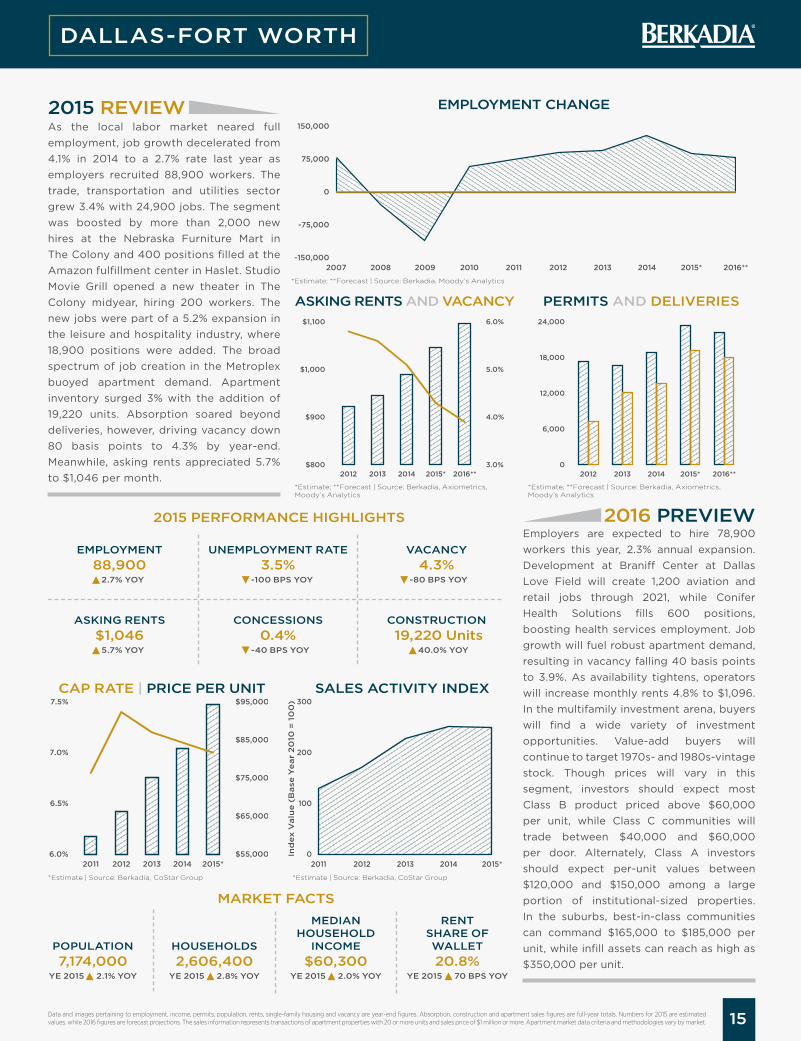
As the local labor market neared full employment, job growth decelerated from 4.1% in 2014 to a 2.7% rate last year as employers recruited 88,900 workers. The trade, transportation and utilities sector grew 3.4% with 24,900 jobs. The segment was boosted by more than 2,000 new hires at the Nebraska Furniture Mart in The Colony and 400 positions filled at the Amazon fulfillment center in Haslet. Studio Movie Grill opened a new theater in The Colony midyear, hiring 200 workers. The new jobs were part of a 5.2% expansion in the leisure and hospitality industry, where 18,900 positions were added. The broad spectrum of job creation in the Metroplex buoyed apartment demand. Apartment inventory surged 3% with the addition of 19,220 units. Absorption soared beyond deliveries, however, driving vacancy down 80 basis points to 4.3% by year-end. Meanwhile, asking rents appreciated 5.7% to $1,046 per month.
2015 REVIEW
Employers are expected to hire 78,900 workers this year, 2.3% annual expansion. Development at Braniff Center at Dallas Love Field will create 1,200 aviation and retail jobs through 2021, while Conifer Health Solutions fills 600 positions, boosting health services employment. Job growth will fuel robust apartment demand, resulting in vacancy falling 40 basis points to 3.9%. As availability tightens, operators will increase monthly rents 4.8% to $1,096. In the multifamily investment arena, buyers will find a wide variety of investment opportunities. Value-add buyers will continue to target 1970s- and 1980s-vintage stock. Though prices will vary in this segment, investors should expect most Class B product priced above $60,000 per unit, while Class C communities will trade between $40,000 and $60,000 per door. Alternately, Class A investors should expect per-unit values between $120,000 and $150,000 among a large portion of institutional-sized properties. In the suburbs, best-in-class communities can command $165,000 to $185,000 per unit, while infill assets can reach as high as $350,000 per unit.
2016 PREVIEW
15
2015 PERFORMANCE HIGHLIGHTS
2.7% YOY
EMPLOYMENT88,900
5.7% YOY
ASKING RENTS$1,046
-80 BPS YOY
VACANCY4.3%
-100 BPS YOY
UNEMPLOYMENT RATE3.5%
-40 BPS YOY
CONCESSIONS0.4%
MARKET FACTS
POPULATION7,174,000
MEDIANHOUSEHOLD
INCOME$60,300
HOUSEHOLDS2,606,400
RENTSHARE OFWALLET20.8%
-150,000
-75,000
0
75,000
150,000
2007 2008 2009 2010 2011 2012 2013 2014 2015* 2016**
ASKING RENTS AND VACANCY
*Estimate; **Forecast | Source: Berkadia, Moody’s Analytics
$55,000
$65,000
$75,000
$85,000
$95,000
6.0%
6.5%
7.0%
7.5%
2011 2012 2013 2014 2015*
CAP RATE | PRICE PER UNIT
*Estimate | Source: Berkadia, CoStar Group
0
100
200
300
2011 2012 2013 2014 2015*
SALES ACTIVITY INDEX
*Estimate | Source: Berkadia, CoStar Group
0
6,000
12,000
18,000
24,000
2012 2013 2014 2015* 2016**
YE 2015 2.1% YOY YE 2015 2.8% YOY YE 2015 2.0% YOY
Ind
ex
Valu
e (
Base
Ye
ar
20
10 =
10
0)
40.0% YOY
CONSTRUCTION19,220 Units
YE 2015 70 BPS YOY
*Estimate; **Forecast | Source: Berkadia, Axiometrics, Moody’s Analytics
*Estimate; **Forecast | Source: Berkadia, Axiometrics, Moody’s Analytics
PERMITS AND DELIVERIES
DALLAS-FORT WORTH
Data and images pertaining to employment, income, permits, population, rents, single-family housing and vacancy are year-end figures. Absorption, construction and apartment sales figures are full-year totals. Numbers for 2015 are estimated values, while 2016 figures are forecast projections. The sales information represents transactions of apartment properties with 20 or more units and sales price of $1 million or more. Apartment market data criteria and methodologies vary by market.
EMPLOYMENT CHANGE

4.0%
4.5%
5.0%
5.5%
$1,000
$1,200
$1,400
$1,600
2012 2013 2014 2015* 2016**
Denver headcounts expanded 2.1%, or by 29,200 jobs, in 2015, as the pace of growth eased with metro-area payrolls approaching full employment. The latest increase was the sixth year of rising staffing levels. Sustained hiring spurred developers to elevate multifamily permitting activity beginning in 2012, supporting the 9,790 apartments coming online in 2015, and nearing the past peak of 10,480 additions during 2002. Development remained concentrated in the Denver-Downtown submarket, accounting for more than one out of every four metrowide additions during the last 12 months. Overall, vacancy lifted 50 basis points to 4.7% by year-end 2015, as the influx of inventory exceeded healthy demand by 24.3%. With vacancy still lower than the 4.8% five-year average, asking rents surged 9% to $1,373 per month by December. Simultaneously, operators lifted effective rents 9.1% to $1,371 per month.
2015 REVIEW
Several employers committed to expanding their presence in the Denver metropolitan area during the upcoming years, the largest announcements coming from the financial activities sector. Charles Schwab plans to hire more than 500 workers by 2018, while OnDeck Capital Inc. committed to add 400 jobs by 2019. In the near term, total nonfarm employment is forecast to elevate 2% year over year with 28,000 additions by December. As job creation remains healthy, so will leasing activity. Residents will newly occupy 6,460 units during the next four quarters, 30.1% higher than the five-year average. Builders are working to meet the demand by adding 9,060 apartments to market inventory, with 3,680 apartments scheduled to come online in the Denver-Downtown submarket. Metrowide supply growth will again exceed the elevated leasing activity, resulting in vacancy increasing 70 basis points annually to 5.4%. As operators increase efforts to entice renters amid stiff competition, average concessions will increase to six days of free rent. Nevertheless, operators are projected to lift asking rents 5.6% to $1,450 per month during the next four quarters.
2016 PREVIEW
16
2015 PERFORMANCE HIGHLIGHTS
2.1% YOY
EMPLOYMENT29,200
9.0% YOY
ASKING RENTS$1,373
50 BPS YOY
VACANCY4.7%
60.6% YOY
CONSTRUCTION9,790 Units
-30 BPS YOY
UNEMPLOYMENT RATE3.8%
-10 BPS YOY
CONCESSIONS0.1%
MARKET FACTS
POPULATION2,829,900
MEDIANHOUSEHOLD
INCOME$68,500
HOUSEHOLDS1,135,700
RENTSHARE OFWALLET24.1%
-60,000
-30,000
0
30,000
60,000
2007 2008 2009 2010 2011 2012 2013 2014 2015* 2016**
ASKING RENTS AND VACANCY
*Estimate; **Forecast | Source: Berkadia, Moody’s Analytics
$0
$50,000
$100,000
$150,000
5.5%
6.0%
6.5%
7.0%
2011 2012 2013 2014 2015*
CAP RATE | PRICE PER UNIT
*Estimate | Source: Berkadia, CoStar Group
0
100
200
300
400
2011 2012 2013 2014 2015*
SALES ACTIVITY INDEX
*Estimate | Source: Berkadia, CoStar Group
0
2,500
5,000
7,500
10,000
2012 2013 2014 2015* 2016**
YE 2015 1.7% YOY YE 2015 2.5% YOY YE 2015 3.0% YOY
Ind
ex
Valu
e (
Base
Ye
ar
20
10 =
10
0)
YE 2015 130 BPS YOY
*Estimate; **Forecast | Source: Berkadia, Axiometrics, Moody’s Analytics
*Estimate; **Forecast | Source: Berkadia, Axiometrics, Moody’s Analytics
PERMITS AND DELIVERIES
DENVER
Data and images pertaining to employment, income, permits, population, rents, single-family housing and vacancy are year-end figures. Absorption, construction and apartment sales figures are full-year totals. Numbers for 2015 are estimated values, while 2016 figures are forecast projections. The sales information represents transactions of apartment properties with 20 or more units and sales price of $1 million or more. Apartment market data criteria and methodologies vary by market.
EMPLOYMENT CHANGE

3.5%
4.5%
5.5%
6.5%
$850
$875
$900
$925
$950
2012 2013 2014 2015* 2016**
Apartment fundamentals continued to improve in the Detroit metro area last year as payrolls grew. Developers added 400 units to local inventory, more than 80% of which came online downtown. Metrowide, the vacancy rate plunged 150 basis points to 4.6%, while asking rents advanced to $924 per month, 3% annual appreciation. Apartment demand surged with 4,620 newly occupied units last year, the greatest annual absorption since 2010, when foreclosures propped up leasing activity. The sturdy demand was supported by a 1.6% increase in employment as businesses recruited 30,600 workers. The largest contributor to growth was the trade, transportation and utilities sector, where 9,400 workers were recruited, a 2.5% increase. The manufacturing industry followed with 7,800 new hires, a gain of 3.2%. Rounding out the high-growth sectors was the professional and business services segment, which expanded 1.9% with 7,100 newly created jobs.
2015 REVIEW
Manufacturing will be a major driver in the local economy in 2016. General Motors will continue adding hundreds of technicians at its Warren Tech Center as part of a five-year expansion resulting in 2,600 new jobs. During the same period, up to 10,000 research and manufacturing jobs in metallurgy, stamping and casting will be created in the area through public-private initiatives administered through the American Lightweight Materials Manufacturing Innovation Institute in Canton, Michigan. Significant hiring will also occur in the financial activities sector as Quicken fills 1,100 positions following rehabilitation of the Detroit Media Partnership building in downtown Detroit. These additions will be part of 27,200 newly created jobs in 2016, 1.4% annual growth. The sustained expansion will spur already elevated apartment demand, which developers will accommodate with 1,050 new units. Renters are projected to absorb 2,710 apartments, resulting in a 60-basis-point decrease in vacancy to 4%. As availability diminishes, operators are expected to boost asking rents 2.6% to $948 per month and reduce concessions to 0.4% of average asking rents.
2016 PREVIEW
17
2015 PERFORMANCE HIGHLIGHTS
1.6% YOY
EMPLOYMENT30,600
3.0% YOY
ASKING RENTS$924
-150 BPS YOY
VACANCY4.6%
28.6% YOY
CONSTRUCTION400 Units
-260 BPS YOY
UNEMPLOYMENT RATE5.1%
-30 BPS YOY
CONCESSIONS0.9%
MARKET FACTS
POPULATION4,301,800
MEDIANHOUSEHOLD
INCOME$56,900
HOUSEHOLDS1,716,500
RENTSHARE OFWALLET19.5%
-180,000
-120,000
-60,000
0
60,000
2007 2008 2009 2010 2011 2012 2013 2014 2015* 2016**
ASKING RENTS AND VACANCY
*Estimate; **Forecast | Source: Berkadia, Moody’s Analytics
$20,000
$30,000
$40,000
$50,000
7.5%
8.0%
8.5%
9.0%
2011 2012 2013 2014 2015*
CAP RATE | PRICE PER UNIT
*Estimate | Source: Berkadia, CoStar Group
0
100
200
300
400
2011 2012 2013 2014 2015*
SALES ACTIVITY INDEX
*Estimate | Source: Berkadia, CoStar Group
0
1,000
2,000
3,000
2012 2013 2014 2015* 2016**
YE 2015 0.1% YOY YE 2015 1.1% YOY YE 2015 4.2% YOY
Ind
ex
Valu
e (
Base
Ye
ar
20
10 =
10
0)
YE 2015 -20 BPS YOY
*Estimate; **Forecast | Source: Berkadia, Axiometrics, Moody’s Analytics
*Estimate; **Forecast | Source: Berkadia, Axiometrics, Moody’s Analytics
PERMITS AND DELIVERIES
DETROIT
Data and images pertaining to employment, income, permits, population, rents, single-family housing and vacancy are year-end figures. Absorption, construction and apartment sales figures are full-year totals. Numbers for 2015 are estimated values, while 2016 figures are forecast projections. The sales information represents transactions of apartment properties with 20 or more units and sales price of $1 million or more. Apartment market data criteria and methodologies vary by market.
EMPLOYMENT CHANGE

5.0%
5.5%
6.0%
6.5%
7.0%
$950
$1,000
$1,050
$1,100
$1,150
2012 2013 2014 2015* 2016**
After years of rising multifamily permitting issuance, 16,660 apartments came online in Houston during 2015. Deliveries were more than double the five-year average. Construction was focused in the Montrose/River Oaks submarket, accounting for more than one out of every four new apartments in the metro added during the last 12 months. Resilient demand in the area resulted in vacancy decreasing 60 basis points annually to 5.4%. Conversely, metrowide vacancy ticked up 10 basis points to 5.8% as hiring slowed amid losses in the energy industry when the manufacturing and the natural resources and mining sectors shed a combined 16,300 jobs since January. Overall, employers added 16,700 positions, a modest 0.6% year-over-year expansion, following a 3.8% rise in payrolls in 2014. Even with the slowdown, asking rents advanced 3.4% annually to $1,091 per month in December, while concessions held at an average of three days of free rent.
2015 REVIEW
Hiring will remain moderate this year as headcounts grow by 12,000 positions, for a 0.4% increase by year-end. The opening of the $417 million heating, ventilation and air conditioning manufacturing facility for Daikin Industries Ltd. is scheduled for mid-year and will create 500 jobs in the previously contracting manufacturing sector. Despite the rising payrolls, leasing activity should ease amid an influx of new inventory. Renters, especially millennials, will continue to seek apartments near employment hubs in the east side of Houston where the health care and technology industries are growing. The largest community to come online in the area is the 361-unit Catalyst Houston in the Interloop/South Houston submarket. Overall, demand will not keep pace with the 15,450 apartments scheduled to come online metrowide, as vacancy elevates 40 basis points to 6.2%. Even with the increase, vacancy will remain well below the 7.3% 10-year average. With vacancy rising, annual effective rent growth will slow to 1.7% and reach $1,099 per month by December, resulting in a rise in concessions to an average of six days of free rent. The move will allow asking rents to rise 2.4% simultaneously to $1,117 per month.
2016 PREVIEW
18
2015 PERFORMANCE HIGHLIGHTS
0.6% YOY
EMPLOYMENT16,700
3.4% YOY
ASKING RENTS$1,091
10 BPS YOY
VACANCY5.8%
18.6% YOY
CONSTRUCTION16,660 Units
-20 BPS YOY
UNEMPLOYMENT RATE4.2%
0 BPS YOY
CONCESSIONS0.9%
MARKET FACTS
POPULATION6,688,000
MEDIANHOUSEHOLD
INCOME$61,000
HOUSEHOLDS2,336,300
RENTSHARE OFWALLET21.5%
-120,000
-60,000
0
60,000
120,000
2007 2008 2009 2010 2011 2012 2013 2014 2015* 2016**
ASKING RENTS AND VACANCY
*Estimate; **Forecast | Source: Berkadia, Moody’s Analytics
$50,000
$70,000
$90,000
$110,000
6.5%
7.0%
7.5%
8.0%
2011 2012 2013 2014 2015*
CAP RATE | PRICE PER UNIT
*Estimate | Source: Berkadia, CoStar Group
0
100
200
300
2011 2012 2013 2014 2015*
SALES ACTIVITY INDEX
*Estimate | Source: Berkadia, CoStar Group
0
9,000
18,000
27,000
2012 2013 2014 2015* 2016**
YE 2015 2.0% YOY YE 2015 2.7% YOY YE 2015 1.8% YOY
Ind
ex
Valu
e (
Base
Ye
ar
20
10 =
10
0)
YE 2015 30 BPS YOY
*Estimate; **Forecast | Source: Berkadia, Axiometrics, Moody’s Analytics
*Estimate; **Forecast | Source: Berkadia, Axiometrics, Moody’s Analytics
PERMITS AND DELIVERIES
HOUSTON
Data and images pertaining to employment, income, permits, population, rents, single-family housing and vacancy are year-end figures. Absorption, construction and apartment sales figures are full-year totals. Numbers for 2015 are estimated values, while 2016 figures are forecast projections. The sales information represents transactions of apartment properties with 20 or more units and sales price of $1 million or more. Apartment market data criteria and methodologies vary by market.
EMPLOYMENT CHANGE

4.0%
4.5%
5.0%
5.5%
$1,200
$1,300
$1,400
$1,500
2012 2013 2014 2015* 2016**
The local economic revitalization that began in 2012 continued in 2015. Employers augmented payrolls 3.7% year over year in Riverside and San Bernardino counties with the creation of 48,300 jobs. The largest contributor to this growth was the trade, transportation and utilities sector, gaining 10,000 workers, an increase of 3.1%. A significant portion of expansion in the sector was attributed to hundreds of jobs created among retail operators Smart & Final Extra! in Moreno Valley, The Fresh Market in Palm Desert and Mountain Grove Citrus Plaza in Redlands. Brisk job growth enabled multifamily operators to boost asking rents 6.5% to $1,390 per month by year-end. Robust rent appreciation occurred despite a 20-basis-point rise in vacancy to a still-healthy 4.5%. Completions numbering 1,690 units were the highest-recorded annual total since 2009, a factor in the uptick in vacancy. Long-term planning activity remained elevated as developers requested permits for 2,830 apartments.
2015 REVIEW
An additional 35,200 job seekers will procure employment this year, equating to a 2.6% gain. Logistics expansion in the two-county area will be a key contributor to overall growth. Australian-based Goodman Group has more than 4.9 million square feet of light-industrial space in various stages of development that, when completed, will provide space for numerous logistics companies, creating thousands of jobs. In the manufacturing industry, Fisker Automotive Inc. will open an assembly plant in Moreno Valley, hiring 150 workers. Economic expansion will sustain apartment demand with 1,300 additional units occupied by year-end. During this time, builders will deliver 1,760 rentals, more than 80% of which will be concentrated in the western portion of the metro. With the short-term supply imbalance, vacancy is forecast to edge up 20 basis points to 4.7%. Despite the upturn in vacancy, multifamily operators are expected to raise asking rents 5.2% this year to $1,462 per month. Meanwhile, effective rents will appreciate 4.9% to $1,455 per month as concessions rise from 0.2% to 0.5% of average asking rents.
2016 PREVIEW
19
2015 PERFORMANCE HIGHLIGHTS
3.7% YOY
EMPLOYMENT48,300
6.5% YOY
ASKING RENTS$1,390
20 BPS YOY
VACANCY4.5%
30.0% YOY
CONSTRUCTION1,690 Units
-150 BPS YOY
UNEMPLOYMENT RATE6.1%
-30 BPS YOY
CONCESSIONS0.2%
MARKET FACTS
POPULATION4,526,400
MEDIANHOUSEHOLD
INCOME$56,000
HOUSEHOLDS1,405,200
RENTSHARE OFWALLET29.8%
-80,000
-40,000
0
40,000
80,000
2007 2008 2009 2010 2011 2012 2013 2014 2015* 2016**
ASKING RENTS AND VACANCY
*Estimate; **Forecast | Source: Berkadia, Moody’s Analytics
$0
$40,000
$80,000
$120,000
5.0%
5.5%
6.0%
6.5%
2011 2012 2013 2014 2015*
CAP RATE | PRICE PER UNIT
*Estimate | Source: Berkadia, CoStar Group
0
100
200
300
2011 2012 2013 2014 2015*
SALES ACTIVITY INDEX
*Estimate | Source: Berkadia, CoStar Group
0
1,000
2,000
3,000
4,000
2012 2013 2014 2015* 2016**
YE 2015 1.3% YOY YE 2015 2.4% YOY YE 2015 1.6% YOY
Ind
ex
Valu
e (
Base
Ye
ar
20
10 =
10
0)
YE 2015 140 BPS YOY
*Estimate; **Forecast | Source: Berkadia, Axiometrics, Moody’s Analytics
*Estimate; **Forecast | Source: Berkadia, Axiometrics, Moody’s Analytics
PERMITS AND DELIVERIES
INLAND EMPIRE | CA
Data and images pertaining to employment, income, permits, population, rents, single-family housing and vacancy are year-end figures. Absorption, construction and apartment sales figures are full-year totals. Numbers for 2015 are estimated values, while 2016 figures are forecast projections. The sales information represents transactions of apartment properties with 20 or more units and sales price of $1 million or more. Apartment market data criteria and methodologies vary by market.
EMPLOYMENT CHANGE

4.5%
5.5%
6.5%
7.5%
$850
$900
$950
$1,000
2012 2013 2014 2015* 2016**
Leisure and hospitality employment surged 5.9% last year as 4,600 workers were added to payrolls. Overall job growth of 1.7% was recorded with 10,800 jobs. The rate of expansion was also significant in the education and health services sector, where 4,000 positions were filled, a gain of 4.2%. Additionally, Walmart recruited 300 workers following completion of a Supercenter on the west side of the metro, supporting 2.6% growth in the trade, transportation and utilities segment, which had 3,500 newly created jobs. Apartment demand surged amid the broad-based hiring, with 2,540 units absorbed metrowide, driving down vacancy. Although deliveries more than doubled to 1,950 units, the new inventory trailed leasing activity. By year-end, the vacancy rate was 5.7%, a reduction of 60 basis points from 2014. Operators capitalized on the elevated demand, raising asking rents 5.2% to $957 per month. Meanwhile, concessions were slashed from 1.1% to 0.5% of asking rents.
2015 REVIEW
Multifamily sales velocity enters 2016 at a healthy clip. The bulk of market activity will continue to be driven by demand for 1970s- and 1980s-vintage stock. Values will vary depending on location and quality of asset, but yield-driven buyers will find pricing in the low-$40,000 to low-$60,000 per-unit range. Meanwhile, investors searching for B-plus or well-located repositioning plays are expected to find opportunities at $70,000 to $90,000 per unit. Alternately, Class A acquisitions will persist this year at a conservative pace. In this segment, per-unit pricing typically starts at $130,000.
Local payrolls are forecast to expand 1.6% in 2016. Employers will recruit 10,300 workers, with a major boost in the manufacturing sector as aggressive hiring among General Electric Co. Oil & Gas and Vistakon results in hundreds of new jobs. The elevated hiring will sustain apartment demand, which will outpace the 800 apartments that are scheduled to come online. By year-end, vacancy is projected to plummet 110 basis points to 4.6%. Operators will take advantage of the heightened leasing activity, increasing asking rents 4% to $995 per month.
2016 PREVIEW
20
2015 PERFORMANCE HIGHLIGHTS
1.7% YOY
EMPLOYMENT10,800
5.2% YOY
ASKING RENTS$957
-60 BPS YOY
VACANCY5.7%
103.2% YOY
CONSTRUCTION1,950 Units
-60 BPS YOY
UNEMPLOYMENT RATE5.1%
-60 BPS YOY
CONCESSIONS0.5%
MARKET FACTS
POPULATION1,456,200
MEDIANHOUSEHOLD
INCOME$53,900
HOUSEHOLDS565,700
RENTSHARE OFWALLET21.3%
-30,000
-20,000
-10,000
0
10,000
20,000
2007 2008 2009 2010 2011 2012 2013 2014 2015* 2016**
ASKING RENTS AND VACANCY
*Estimate; **Forecast | Source: Berkadia, Moody’s Analytics
$40,000
$50,000
$60,000
$70,000
6.0%
6.5%
7.0%
7.5%
2011 2012 2013 2014 2015*
CAP RATE | PRICE PER UNIT
*Estimate | Source: Berkadia, CoStar Group
0
200
400
600
2011 2012 2013 2014 2015*
SALES ACTIVITY INDEX
*Estimate | Source: Berkadia, CoStar Group
0
1,000
2,000
3,000
2012 2013 2014 2015* 2016**
YE 2015 1.8% YOY YE 2015 2.7% YOY YE 2015 2.9% YOY
Ind
ex
Valu
e (
Base
Ye
ar
20
10 =
10
0)
YE 2015 50 BPS YOY
*Estimate; **Forecast | Source: Berkadia, Axiometrics, Moody’s Analytics
*Estimate; **Forecast | Source: Berkadia, Axiometrics, Moody’s Analytics
PERMITS AND DELIVERIES
JACKSONVILLE
Data and images pertaining to employment, income, permits, population, rents, single-family housing and vacancy are year-end figures. Absorption, construction and apartment sales figures are full-year totals. Numbers for 2015 are estimated values, while 2016 figures are forecast projections. The sales information represents transactions of apartment properties with 20 or more units and sales price of $1 million or more. Apartment market data criteria and methodologies vary by market.
EMPLOYMENT CHANGE

4.5%
5.0%
5.5%
6.0%
$800
$850
$900
$950
2012 2013 2014 2015* 2016**
In the Downtown/East Kansas City submarket, builders could not keep up with demand for multifamily housing in 2015. Construction completed on 1,050 apartments in the area, accounting for more than one out of every four additions in the metro since January. Even with the influx of new inventory, pent-up demand forced Downtown/East Kansas City vacancy down 80 basis points year over year to a metro-low 2.9%, compared to the metrowide rate of 5.4% in December. Operators in the submarket responded in kind by raising rents a hefty 7.1% annually to $1,184 per month. Overall, the average asking rent was $902 per month by year-end, up 2.6% from the close of 2014. While rents steadily rose, operators lowered concessions to an average two days of free rent. Healthy apartment fundamentals occurred while businesses lifted headcounts by 7,900 positions, expanding employment 0.8%.
2015 REVIEW
Demand for apartments will persist in Kansas City this year as accelerated hiring will drive leasing activity. Vacancy is forecast to decline 20 basis points to 5.2% in December. The decrease comes as an elevated 2,410 apartments come online. Builders will strive to meet the need for rentals in the Downtown/East Kansas City submarket with 1,090 deliveries scheduled by year-end. The largest project to complete this year is the 268-unit Power and Light Historic North Building. Developers will also accelerate multifamily issuance for 3,490 apartments this year, up 7.6% from 2015. This show of sustained demand will be supported by a 1.2% rise in payrolls. With office expansions set to complete this year in the Downtown/East Kansas City submarket for Sungevity Inc., the solar power company will contribute 600 positions to the 12,500 new jobs expected metrowide over the next four quarters. Spurred by increased hiring and lower vacancy, asking rents will lift 2% annually to $920 per month in December. Simultaneously, operators will hold concessions at an average of two days of free rent.
2016 PREVIEW
21
2015 PERFORMANCE HIGHLIGHTS
0.8% YOY
EMPLOYMENT7,900
2.6% YOY
ASKING RENTS$902
0 BPS YOY
VACANCY5.4%
77.5% YOY
CONSTRUCTION3,790 Units
20 BPS YOY
UNEMPLOYMENT RATE5.1%
-70 BPS YOY
CONCESSIONS0.7%
MARKET FACTS
POPULATION2,086,600
MEDIANHOUSEHOLD
INCOME$59,400
HOUSEHOLDS829,700
RENTSHARE OFWALLET18.2%
-40,000
-20,000
0
20,000
40,000
2007 2008 2009 2010 2011 2012 2013 2014 2015* 2016**
ASKING RENTS AND VACANCY
*Estimate; **Forecast | Source: Berkadia, Moody’s Analytics
$20,000
$40,000
$60,000
$80,000
6.5%
7.0%
7.5%
8.0%
2011 2012 2013 2014 2015*
CAP RATE | PRICE PER UNIT
*Estimate | Source: Berkadia, CoStar Group
0
200
400
600
2011 2012 2013 2014 2015*
SALES ACTIVITY INDEX
*Estimate | Source: Berkadia, CoStar Group
0
1,200
2,400
3,600
4,800
2012 2013 2014 2015* 2016**
YE 2015 0.5% YOY YE 2015 1.2% YOY YE 2015 2.6% YOY
Ind
ex
Valu
e (
Base
Ye
ar
20
10 =
10
0)
YE 2015 0 BPS YOY
*Estimate; **Forecast | Source: Berkadia, Axiometrics, Moody’s Analytics
*Estimate; **Forecast | Source: Berkadia, Axiometrics, Moody’s Analytics
PERMITS AND DELIVERIES
KANSAS CITY
Data and images pertaining to employment, income, permits, population, rents, single-family housing and vacancy are year-end figures. Absorption, construction and apartment sales figures are full-year totals. Numbers for 2015 are estimated values, while 2016 figures are forecast projections. The sales information represents transactions of apartment properties with 20 or more units and sales price of $1 million or more. Apartment market data criteria and methodologies vary by market.
EMPLOYMENT CHANGE

5.0%
6.0%
7.0%
8.0%
9.0%
$800
$850
$900
$950
2012 2013 2014 2015* 2016**
Las Vegas apartment operators recorded measurable vacancy and asking rent improvements as broad-based hiring underpinned healthy rental demand in 2015. Continuing the hiring trend from 2014, leisure and hospitality employers led job creation last year, adding 7,600 workers for a 2.7% gain. MGM Resorts bolstered headcounts in the industry, recruiting 500 staffers earlier in the year. Meanwhile, the construction and professional and business services sectors contributed a combined 10,200 positions in the past 12 months, though the 11.2% surge in construction payrolls constituted the largest percent increase. The 26,300 total jobs added to metro employment in the past year kept downward pressure on vacancy. The marketwide rate ended the year at 6.2%, down 50 basis points annually amid a supply increase of 2,280 units. New apartment product and resilient absorption helped operators boost asking rents 5.4% to $886 per month by December.
2015 REVIEW
Employment growth of 2.7% and easing deliveries will tamp down apartment vacancy in 2016. Businesses will hire 24,900 workers while builders will complete 1,610 apartments over the next four quarters. The 29.4% year-over-year decline in inventory growth will support the 50-basis-point decrease in vacancy to 5.7% this year. Asking rents are forecast to grow at a more sustainable pace this year, rising 3.7% to $919 per month. Meanwhile, effective rents will rise 3.9% to $910 per month, with concessions falling to an average of 1% of asking rents. In the investment arena, out-of-state investors will continue to compete for Class A apartment assets and prop up local deal flow in 2016. In this segment, per-unit pricing fluctuates based on size and location, though cap rates are gravitating to the low-5% range. Local and out-of-state buyers will continue to drive velocity in the Class B market. Buyers are particularly bullish regarding 1980s product. Middle-tier prices are moving toward $65,000 per unit with cap rates averaging 5.6%. Nevertheless, newer and well-located Class B communities will likely trade at initial yields 30 basis points lower, with prices ranging from $85,000 to $130,000 per unit.
2016 PREVIEW
22
2015 PERFORMANCE HIGHLIGHTS
2.9% YOY
EMPLOYMENT26,300
5.4% YOY
ASKING RENTS$886
-50 BPS YOY
VACANCY6.2%
126.3% YOY
CONSTRUCTION2,280 Units
-50 BPS YOY
UNEMPLOYMENT RATE6.6%
-90 BPS YOY
CONCESSIONS1.1%
MARKET FACTS
POPULATION2,140,400
MEDIANHOUSEHOLD
INCOME$54,300
HOUSEHOLDS799,600
RENTSHARE OFWALLET19.6%
-80,000
-40,000
0
40,000
2007 2008 2009 2010 2011 2012 2013 2014 2015* 2016**
ASKING RENTS AND VACANCY
*Estimate; **Forecast | Source: Berkadia, Moody’s Analytics
$30,000
$40,000
$50,000
$60,000
$70,000
5.5%
6.0%
6.5%
7.0%
7.5%
2011 2012 2013 2014 2015*
CAP RATE | PRICE PER UNIT
*Estimate | Source: Berkadia, CoStar Group
0
200
400
600
2011 2012 2013 2014 2015*
SALES ACTIVITY INDEX
*Estimate | Source: Berkadia, CoStar Group
0
1,000
2,000
3,000
4,000
2012 2013 2014 2015* 2016**
YE 2015 2.3% YOY YE 2015 2.8% YOY YE 2015 2.5% YOY
Ind
ex
Valu
e (
Base
Ye
ar
20
10 =
10
0)
YE 2015 50 BPS YOY
*Estimate; **Forecast | Source: Berkadia, Axiometrics, Moody’s Analytics
*Estimate; **Forecast | Source: Berkadia, Axiometrics, Moody’s Analytics
PERMITS AND DELIVERIES
LAS VEGAS
EMPLOYMENT CHANGE
Data and images pertaining to employment, income, permits, population, rents, single-family housing and vacancy are year-end figures. Absorption, construction and apartment sales figures are full-year totals. Numbers for 2015 are estimated values, while 2016 figures are forecast projections. The sales information represents transactions of apartment properties with 20 or more units and sales price of $1 million or more. Apartment market data criteria and methodologies vary by market.

2.5%
3.5%
4.5%
5.5%
$1,400
$1,600
$1,800
$2,000
2012 2013 2014 2015* 2016**
Sustained price appreciation in the single-family home market kept many potential homeowners on the sidelines and propelled apartment demand in Los Angeles North. Consequently, vacancy fell 60 basis points to 3.5%. The reduction in vacancy occurred amid the completion of 1,940 apartments, the greatest number of deliveries since 2008. More than 90% of the new stock came online in the South Glendale/Highland Park and Woodland Hills/Tarzana/Encino submarkets. As availability dwindled metrowide, multifamily operators raised monthly rents 6.5% to $1,824 and cut concessions from 1% to 0.3% of asking rents. Healthy job growth, in addition to high single-family housing costs, boosted the multifamily market. Businesses added 85,600 workers to countywide payrolls, annual expansion of 2%. The leader in job growth was the education and health services sector, which advanced 3.8% with 29,000 new hires.
2015 REVIEW
Approximately 78,500 workers are expected to find employment in Los Angeles County in 2016, 1.8% expansion. This growth will spur healthy apartment absorption. Multifamily developers, confident this demand will continue over the next several years, have 7,600 identified units in various stages of the planning process. In the near term, builders will complete 1,420 rentals by the end of this year, 50% of which are slated to come online in the South Glendale/Highland Park submarket. The largest fully completed community, however, will be in Van Nuys, the five-level, 350-unit IMT Sherman Circle apartment community, which will be finished in early 2016. An additional 450 apartments are scheduled for delivery late this year at the 507-unit North Central Avenue mid-rise development in Glendale. Despite the elevated completions, new inventory will trail leasing activity, causing vacancy to descend 50 basis points to 3% by year-end. Operators will capitalize on shrinking availability by increasing market rents 4.7% to $1,910 per month. Effective rents are projected to reach $1,906 per month, 4.8% appreciation, as concessions diminish to 0.2% of asking rents.
2016 PREVIEW
23
2015 PERFORMANCE HIGHLIGHTS
2.0% YOY
EMPLOYMENT85,600
6.5% YOY
ASKING RENTS$1,824
-60 BPS YOY
VACANCY3.5%
163.4% YOY
CONSTRUCTION1,940 Units
-150 BPS YOY
UNEMPLOYMENT RATE6.5%
-70 BPS YOY
CONCESSIONS0.3%
MARKET FACTS
POPULATION10,222,200
MEDIANHOUSEHOLD
INCOME$58,100
HOUSEHOLDS3,361,300
RENTSHARE OFWALLET33.7%
-240,000
-120,000
0
120,000
240,000
2007 2008 2009 2010 2011 2012 2013 2014 2015* 2016**
ASKING RENTS AND VACANCY
*Estimate; **Forecast | Source: Berkadia, Moody’s Analytics
$125,000
$150,000
$175,000
$200,000
4.5%
5.0%
5.5%
6.0%
6.5%
2011 2012 2013 2014 2015*
CAP RATE | PRICE PER UNIT
*Estimate | Source: Berkadia, CoStar Group
0
100
200
300
2011 2012 2013 2014 2015*
SALES ACTIVITY INDEX
*Estimate | Source: Berkadia, CoStar Group
0
3,000
6,000
9,000
2012 2013 2014 2015* 2016**
YE 2015 0.7% YOY YE 2015 1.0% YOY YE 2015 2.8% YOY
Ind
ex
Valu
e (
Base
Ye
ar
20
10 =
10
0)
YE 2015 130 BPS YOY
*Estimate; **Forecast | Source: Berkadia, Axiometrics, Moody’s Analytics
*Estimate; **Forecast | Source: Berkadia, Axiometrics, Moody’s Analytics
PERMITS AND DELIVERIES
LOS ANGELES-NORTH
Data and images pertaining to employment, income, permits, population, rents, single-family housing and vacancy are year-end figures. Absorption, construction and apartment sales figures are full-year totals. Numbers for 2015 are estimated values, while 2016 figures are forecast projections. The sales information represents transactions of apartment properties with 20 or more units and sales price of $1 million or more. Apartment market data criteria and methodologies vary by market.
EMPLOYMENT CHANGE

3.0%
3.5%
4.0%
4.5%
$1,600
$1,700
$1,800
$1,900
$2,000
2012 2013 2014 2015* 2016**
Countywide employment expanded 2% over the past four quarters as companies created 85,600 jobs. Approximately one-third of the expansion was attributed to 29,000 new hires in the education and health services sector, a 3.8% year-over-year gain. Additionally, a 4.9% increase was recorded in the leisure and hospitality industry with the creation of 23,200 positions. Robust hiring also occurred in the professional and business services sector as 17,500 personnel were brought onboard, a gain of 2.8%. Meanwhile, 12,900 workers were recruited in the trade, transportation and utilities segment, 1.6% expansion. Despite the sturdy pace of job creation, apartment absorption trailed completions last year. As a result, vacancy edged up 20 basis points to a still-healthy 3.9%. Asking rents maintained an upward trajectory, increasing 5% to $1,838 per month, while effective rents reached $1,834 per month, 5% appreciation.
2015 REVIEW
Apartment deliveries will soar this year as 2,280 units are completed in the Los Angeles South market. Nearly one-quarter of the new inventory will come online in the West Long Beach/Signal Hill submarket. Absorption is expected to rebound this year, though demand will still trail deliveries, resulting in a 30-basis-point increase in vacancy to 4.2%. Meanwhile, asking rents will rise at a more sustainable rate of 4.4%, reaching $1,919 per month, underpinned by the countywide employment expansion of 78,500 workers, 1.8% annual growth.
In-state acquisitions of 1960s- and 1970s-vintage stock in inland locations will continue to be the primary driver of deal flow in 2016. Initial yields for these apartment communities will vary, but overall are expected to hover near 5%. While a significant share of this older product on the market has already been renovated, unimproved apartment communities will also remain sought after by more aggressive investors. For these buyers, renovation expenditures of $8,000 to $10,000 per unit may yield a $200 to $300 monthly increase in asking rents.
2016 PREVIEW
24
2015 PERFORMANCE HIGHLIGHTS
2.0% YOY
EMPLOYMENT85,600
5.0% YOY
ASKING RENTS$1,838
20 BPS YOY
VACANCY3.9%
-2.4% YOY
CONSTRUCTION910 Units
-150 BPS YOY
UNEMPLOYMENT RATE6.5%
0 BPS YOY
CONCESSIONS0.2%
MARKET FACTS
POPULATION10,222,200
MEDIANHOUSEHOLD
INCOME$58,100
HOUSEHOLDS3,361,300
RENTSHARE OFWALLET38.0%
ASKING RENTS AND VACANCY
*Estimate; **Forecast | Source: Berkadia, Moody’s Analytics
$100,000
$125,000
$150,000
$175,000
4.5%
5.0%
5.5%
6.0%
6.5%
2011 2012 2013 2014 2015*
CAP RATE | PRICE PER UNIT
*Estimate | Source: Berkadia, CoStar Group
0
100
200
300
2011 2012 2013 2014 2015*
SALES ACTIVITY INDEX
*Estimate | Source: Berkadia, CoStar Group
0
1,000
2,000
3,000
4,000
2012 2013 2014 2015* 2016**
YE 2015 0.7% YOY YE 2015 1.0% YOY YE 2015 2.8% YOY
Ind
ex
Valu
e (
Base
Ye
ar
20
10 =
10
0)
-240,000
-120,000
0
120,000
240,000
2007 2008 2009 2010 2011 2012 2013 2014 2015* 2016**
YE 2015 80 BPS YOY
*Estimate; **Forecast | Source: Berkadia, Axiometrics, Moody’s Analytics
*Estimate; **Forecast | Source: Berkadia, Axiometrics, Moody’s Analytics
PERMITS AND DELIVERIES
LOS ANGELES-SOUTH
Data and images pertaining to employment, income, permits, population, rents, single-family housing and vacancy are year-end figures. Absorption, construction and apartment sales figures are full-year totals. Numbers for 2015 are estimated values, while 2016 figures are forecast projections. The sales information represents transactions of apartment properties with 20 or more units and sales price of $1 million or more. Apartment market data criteria and methodologies vary by market.
EMPLOYMENT CHANGE

3.5%
4.0%
4.5%
5.0%
$2,400
$2,600
$2,800
$3,000
2012 2013 2014 2015* 2016**
Multifamily developers added 4,530 apartments to inventory last year in Los Angeles West. Brisk leasing activity persisted in the market, though completions outpaced demand, resulting in a 10-basis-point increase in vacancy to 4.1%. The selection of apartments was particularly limited in the West L.A./Westwood/Brentwood and Mar Vista/Palms/Culver City submarkets, where vacancy was below 3%. Operators raised marketwide asking rents 5.6% to $2,770 per month, despite the uptick in overall vacancy. The hearty rent appreciation was facilitated by countywide employment expansion of 2% with the creation of 85,600 jobs. The greatest contributor to the increase was the education and health services sector, where 29,000 positions were filled, a gain of 3.8%. Significant growth was also present in the leisure and hospitality industry as 23,200 workers were hired, a 4.9% surge.
2015 REVIEW
Employers are projected to recruit 78,500 workers this year, growing countywide payrolls 1.8%. A variety of companies are choosing Silicon Beach for operations, noting favorable office selection and rents. This activity will boost apartment fundamentals in the Marina Del Rey area. Builders will deliver 800 rentals in the submarket, though most of the 7,650 marketwide completions will be located inland. Marketwide absorption will rise but will trail deliveries, causing vacancy to ascend 30 basis points to 4.4%. The vacancy uptick will slow annual rent appreciation to 4.4%, reaching $2,892 per month. Deal flow in 2016 will continue to be propelled by both value-add and Class A buyers. Aggressive investors will target middle- and lower-tier assets. Though values vary depending on location and quality, marketwide prices are averaging $180,000 per unit. In this segment, value-add buyers can lift rents $200 to $300 per month following $5,000 to $10,000 in per-unit renovations. Alternately, foreign buyers will help drive velocity among Class A investments, with robust competition driving cap rates for top-quality product into the mid-3% range.
2016 PREVIEW
25
2015 PERFORMANCE HIGHLIGHTS
2.0% YOY
EMPLOYMENT85,600
5.6% YOY
ASKING RENTS$2,770
10 BPS YOY
VACANCY4.1%
28.3% YOY
CONSTRUCTION4,530 Units
-150 BPS YOY
UNEMPLOYMENT RATE6.5%
10 BPS YOY
CONCESSIONS0.4%
MARKET FACTS
POPULATION10,222,200
MEDIANHOUSEHOLD
INCOME$58,100
HOUSEHOLDS3,361,300
RENTSHARE OFWALLET57.2%
ASKING RENTS AND VACANCY
*Estimate; **Forecast | Source: Berkadia, Moody’s Analytics
$125,000
$150,000
$175,000
$200,000
$225,000
4.5%
5.0%
5.5%
6.0%
6.5%
2011 2012 2013 2014 2015*
CAP RATE | PRICE PER UNIT
*Estimate | Source: Berkadia, CoStar Group
0
100
200
300
2011 2012 2013 2014 2015*
SALES ACTIVITY INDEX
*Estimate | Source: Berkadia, CoStar Group
0
2,500
5,000
7,500
10,000
2012 2013 2014 2015* 2016**
YE 2015 0.7% YOY YE 2015 1.0% YOY YE 2015 2.8% YOY
Ind
ex
Valu
e (
Base
Ye
ar
20
10 =
10
0)
-240,000
-120,000
0
120,000
240,000
2007 2008 2009 2010 2011 2012 2013 2014 2015* 2016**
YE 2015 150 BPS YOY
*Estimate; **Forecast | Source: Berkadia, Axiometrics, Moody’s Analytics
*Estimate; **Forecast | Source: Berkadia, Axiometrics, Moody’s Analytics
PERMITS AND DELIVERIES
LOS ANGELES-WEST
Data and images pertaining to employment, income, permits, population, rents, single-family housing and vacancy are year-end figures. Absorption, construction and apartment sales figures are full-year totals. Numbers for 2015 are estimated values, while 2016 figures are forecast projections. The sales information represents transactions of apartment properties with 20 or more units and sales price of $1 million or more. Apartment market data criteria and methodologies vary by market.
EMPLOYMENT CHANGE

5.5%
6.5%
7.5%
8.5%
$750
$775
$800
$825
2012 2013 2014 2015* 2016**
Retail expansion was a key economic driver last year in Memphis. More than 2,300 jobs were created among new store openings at Tanger Outlets Southaven, Bass Pro Shops, Sprouts Farmers Market and Whole Foods. Total job growth of 0.3% was recorded as businesses added 1,900 workers to payrolls. Education and health services companies were also a substantial source of expansion, 1.2% growth, as 1,100 positions were filled. Public-sector cutbacks partially offset these gains with 1,900 government layoffs, contraction of 2.2%. Nevertheless, overall employment expansion fueled apartment demand, resulting in a 70-basis-point decrease in vacancy as absorption outpaced the 390 multifamily deliveries by nearly three to one. By year-end, vacancy was 7%. The elevated apartment demand enabled 1.5% rent appreciation, as asking rents reached $805 per month. At the same time, operators enhanced revenues by reducing concessions from 1.9% to 1.4% of asking rents.
2015 REVIEW
Employment is forecast to expand at an accelerated pace in 2016, a 0.9% increase, with the addition of 5,600 workers. The education and health services sector will be boosted by 200 newly created jobs at the Crestwyn Behavioral Health hospital in late 2016. In the trade, transportation and utilities segment, 175 positions will be filled following the completion of IKEA in the fall. During this time, approximately 530 apartments will be completed metrowide, two-thirds of which will come online in the East Memphis/University submarket. The new inventory, however, will be insufficient to accommodate demand stemming from job growth. Consequently, the vacancy rate is projected to fall 40 basis points to 6.6% by year-end. Multifamily developers will continue filling the planning pipeline in anticipation of sustained demand, requesting permits for 1,290 apartments. An additional 2,020 units are in various stages of the planning process. Meanwhile, landlords are predicted to keep upward pressure on asking rents with a 1.2% increase to $815 per month. A reduction of concessions from 1.4% to 1% of asking rents is also expected.
2016 PREVIEW
26
2015 PERFORMANCE HIGHLIGHTS
0.3% YOY
EMPLOYMENT1,900
1.5% YOY
ASKING RENTS$805
-70 BPS YOY
VACANCY7.0%
-33.8% YOY
CONSTRUCTION390 Units
-30 BPS YOY
UNEMPLOYMENT RATE6.6%
-50 BPS YOY
CONCESSIONS1.4%
MARKET FACTS
POPULATION1,357,700
MEDIANHOUSEHOLD
INCOME$49,300
HOUSEHOLDS515,800
RENTSHARE OFWALLET19.6%
-30,000
-20,000
-10,000
0
10,000
2007 2008 2009 2010 2011 2012 2013 2014 2015* 2016**
ASKING RENTS AND VACANCY
*Estimate; **Forecast | Source: Berkadia, Moody’s Analytics
$40,000
$45,000
$50,000
$55,000
5.5%
6.5%
7.5%
8.5%
2011 2012 2013 2014 2015*
CAP RATE | PRICE PER UNIT
*Estimate | Source: Berkadia, CoStar Group
0
100
200
300
2011 2012 2013 2014 2015*
SALES ACTIVITY INDEX
*Estimate | Source: Berkadia, CoStar Group
0
600
1,200
1,800
2012 2013 2014 2015* 2016**
YE 2015 0.7% YOY YE 2015 1.3% YOY YE 2015 2.5% YOY
Ind
ex
Valu
e (
Base
Ye
ar
20
10 =
10
0)
YE 2015 -20 BPS YOY
*Estimate; **Forecast | Source: Berkadia, Axiometrics, Moody’s Analytics
*Estimate; **Forecast | Source: Berkadia, Axiometrics, Moody’s Analytics
PERMITS AND DELIVERIES
MEMPHIS
Data and images pertaining to employment, income, permits, population, rents, single-family housing and vacancy are year-end figures. Absorption, construction and apartment sales figures are full-year totals. Numbers for 2015 are estimated values, while 2016 figures are forecast projections. The sales information represents transactions of apartment properties with 20 or more units and sales price of $1 million or more. Apartment market data criteria and methodologies vary by market.
EMPLOYMENT CHANGE

2.5%
3.0%
3.5%
4.0%
$2,600
$2,800
$3,000
$3,200
2012 2013 2014 2015* 2016**
Despite a dip in hiring in the New York-Jersey City-White Plains metro area during 2015, apartment demand kept pace with supply. Local businesses hired 119,000 workers in the past year, a 1.8% rise that followed expansion of 2.2% in 2014. The education and health services sector added a metro-leading 39,300 workers in 2015. Meanwhile, the professional and business services and the leisure and hospitality industries recruited 25,500 and 16,200 personnel, respectively. Government payrolls were the largest drag on the economy, shedding 2,100 positions. The 9,200 new market-rate rentals were countered by apartment absorption, with marketwide vacancy registering 3.1% in December, unchanged from late 2014. Completions were heavy in the Hudson Waterfront submarket with 1,360 units and in Brooklyn with 1,280 apartments. The new, expensive supply, coupled with healthy vacancy, underpinned annual asking rent appreciation of 4.2% to $3,030 per month.
2015 REVIEW
This year’s pace of completions will be well below the 28,600 units averaged between 2006 and 2009, when the robust economic expansion and development transitioned into the recession and a sharp supply overhang. Nevertheless, completions will accelerate nearly 150% to 22,920 units in 2016. The largest delivery of new market-rate units will be in Manhattan, as builders are expected to add 7,650 rentals, over half of which will be in the Midtown West submarket. Brooklyn apartment operators will contend with more than 6,100 units, while northern and central New Jersey inventory grows by 5,650 rentals in 2016. Employment growth will partially offset supply-side pressure. Payrolls are projected to increase by 110,000 positions this year, a 1.6% addition to headcounts. As a result, the rise in apartment vacancy will be limited to 30 basis points over the course of the year, reaching 3.4% by December. Asking rent gains will ease slightly, advancing 3.1% to $3,124 per month. Effective rents will appreciate 2.4% to $3,074 per month, causing concessions to rise 60 basis points annually to an average of 1.6% of asking rents.
2016 PREVIEW
27
2015 PERFORMANCE HIGHLIGHTS
1.8% YOY
EMPLOYMENT119,000
4.2% YOY
ASKING RENTS$3,030
0 BPS YOY
VACANCY3.1%
32.1% YOY
CONSTRUCTION9,200 Units
-110 BPS YOY
UNEMPLOYMENT RATE5.1%
-20 BPS YOY
CONCESSIONS1.0%
MARKET FACTS
POPULATION14,445,900
MEDIANHOUSEHOLD
INCOME$64,300
HOUSEHOLDS5,262,100
RENTSHARE OFWALLET56.5%
-180,000
-90,000
0
90,000
180,000
2007 2008 2009 2010 2011 2012 2013 2014 2015* 2016**
ASKING RENTS AND VACANCY
*Estimate; **Forecast | Source: Berkadia, Moody’s Analytics
$125,000
$175,000
$225,000
$275,000
4.0%
5.0%
6.0%
7.0%
2011 2012 2013 2014 2015*
CAP RATE | PRICE PER UNIT
*Estimate | Source: Berkadia, CoStar Group
0
100
200
300
2011 2012 2013 2014 2015*
SALES ACTIVITY INDEX
*Estimate | Source: Berkadia, CoStar Group
0
20,000
40,000
60,000
80,000
2012 2013 2014 2015* 2016**
YE 2015 0.6% YOY YE 2015 1.0% YOY YE 2015 2.4% YOY
Ind
ex
Valu
e (
Base
Ye
ar
20
10 =
10
0)
YE 2015 100 BPS YOY
*Estimate; **Forecast | Source: Berkadia, Axiometrics, Moody’s Analytics
*Estimate; **Forecast | Source: Berkadia, Axiometrics, Moody’s Analytics
PERMITS AND DELIVERIES
NEW YORK-NEW JERSEY
Data and images pertaining to employment, income, permits, population, rents, single-family housing and vacancy are year-end figures. Absorption, construction and apartment sales figures are full-year totals. Numbers for 2015 are estimated values, while 2016 figures are forecast projections. The sales information represents transactions of apartment properties with 20 or more units and sales price of $1 million or more. Apartment market data criteria and methodologies vary by market.
EMPLOYMENT CHANGE

2.0%
4.0%
6.0%
8.0%
$600
$650
$700
$750
2012 2013 2014 2015* 2016**
Companies in the Oklahoma City metro area recruited 11,000 workers in 2015. Job growth decelerated from 2.1% in 2014 to 1.8% last year as the labor force neared full employment. Expansion of 5.2% was recorded in the leisure and hospitality industry as 3,400 workers were added. In the trade, transportation and utilities segment, 2,800 jobs were created, a gain of 2.6%. Employment expansion was partially offset by an 8.9% contraction in the natural resources and mining sector, where 1,900 positions were eliminated. The overall slowdown in hiring diminished apartment demand 21.4% from the prior year. Renters filled 620 apartments as builders completed 1,630 units, driving vacancy up 110 basis points to 7.3%. Developers responded by scaling back planning activity by more than half to mitigate a future supply imbalance. Despite the increase in vacancy, operators increased market rents 1.1% during the year, as asking rents reached $731 by December.
2015 REVIEW
Employment expansion of 1.5% is forecast for 2016 as businesses are projected to add 9,500 workers to local payrolls. Several hundred jobs among the health care, retail and hospitality industries will be created following completion of the Chisholm Creek mixed-use development in north Oklahoma City early this year. Additionally, Boeing will conclude the transfer of 900 jobs from Seattle to its Oklahoma City technology center by year-end. The wide array of new jobs will facilitate demand for all classes of multifamily properties. Absorption, however, will not keep pace with the 990 apartments that come online this year, causing vacancy to rise 30 basis points to 7.6%. Of the total number of completions, more than half will come online among three mid-rise communities, the 329-unit Lift, the 329-unit The Metropolitan and the 160-unit Maywood Apartments II, all in the East Central Oklahoma City submarket. The continued supply imbalance will prompt operators to increase concessions from 1.1% to 1.5% of asking rents by year-end. Meanwhile, asking rents are projected to rise to $741 per month, 1.4% annual appreciation.
2016 PREVIEW
28
2015 PERFORMANCE HIGHLIGHTS
1.8% YOY
EMPLOYMENT11,000
1.1% YOY
ASKING RENTS$731
110 BPS YOY
VACANCY7.3%
28.6% YOY
CONSTRUCTION1,630 Units
0 BPS YOY
UNEMPLOYMENT RATE3.5%
40 BPS YOY
CONCESSIONS1.1%
MARKET FACTS
POPULATION1,355,200
MEDIANHOUSEHOLD
INCOME$53,500
HOUSEHOLDS526,400
RENTSHARE OFWALLET16.4%
-30,000
-20,000
-10,000
0
10,000
20,000
2007 2008 2009 2010 2011 2012 2013 2014 2015* 2016**
ASKING RENTS AND VACANCY
*Estimate; **Forecast | Source: Berkadia, Moody’s Analytics
$30,000
$40,000
$50,000
$60,000
7.0%
7.5%
8.0%
8.5%
2011 2012 2013 2014 2015*
CAP RATE | PRICE PER UNIT
*Estimate | Source: Berkadia, CoStar Group
0
100
200
300
2011 2012 2013 2014 2015*
SALES ACTIVITY INDEX
*Estimate | Source: Berkadia, CoStar Group
0
500
1,000
1,500
2,000
2012 2013 2014 2015* 2016**
YE 2015 1.0% YOY YE 2015 1.8% YOY YE 2015 2.7% YOY
Ind
ex
Valu
e (
Base
Ye
ar
20
10 =
10
0)
YE 2015 -30 BPS YOY
*Estimate; **Forecast | Source: Berkadia, Axiometrics, Moody’s Analytics
*Estimate; **Forecast | Source: Berkadia, Axiometrics, Moody’s Analytics
PERMITS AND DELIVERIES
OKLAHOMA CITY
Data and images pertaining to employment, income, permits, population, rents, single-family housing and vacancy are year-end figures. Absorption, construction and apartment sales figures are full-year totals. Numbers for 2015 are estimated values, while 2016 figures are forecast projections. The sales information represents transactions of apartment properties with 20 or more units and sales price of $1 million or more. Apartment market data criteria and methodologies vary by market.
EMPLOYMENT CHANGE

3.5%
4.0%
4.5%
5.0%
$1,500
$1,700
$1,900
$2,100
2012 2013 2014 2015* 2016**
Orange County developers ramped up multifamily permitting activity starting in 2010. Consequently, 3,060 apartments came online last year, well above the 1,770-unit five-year average. Development was focused in the Irvine submarket, where nearly one out of every four apartments metrowide came online during the last four quarters. The numerous multifamily projects supported the construction industry, which swelled 7.9% with 6,700 new jobs. Overall, Orange County companies created 41,000 positions to expand employment 2.7% in 2015. Local growth significantly outpaced the 1.8% national average in that time. Despite robust hiring in Orange County, apartment demand could not keep pace with the elevated deliveries as vacancy rose 40 basis points to 4.2%. With vacancy still at a healthy level, operators advanced market rents 4.4% annually to $1,955 per month while holding concessions to 0.2% of asking rents.
2015 REVIEW
Local apartment inventory will expand by 4,060 units this year, the highest annual deliveries since 2008 when 4,450 apartments came online. While additions will again be concentrated in the Irvine submarket with 1,570 apartments, development in the South Anaheim submarket will rise from 320 deliveries in 2015 to 1,140 apartments coming online this year. Beyond apartment development, the construction industry will be boosted by expansion at Disneyland and Disneyland California Adventure. Walt Disney Co. will begin $1 billion in improvements that will extend until 2024 and create 1,400 jobs. Overall, headcounts are forecast to rise 2.5% this year with 39,000 positions.
The steady hiring will boost apartment demand. Leasing activity will accelerate with 3,060 newly occupied apartments this year. Even with the rise, the supply imbalance will push vacancy up 30 basis points to 4.5% by December. Operators will slow effective rent growth to entice renters, increasing concessions to 0.6% of asking rents. Simultaneously, asking rent growth will accelerate to a 3.9% annual increase as market rents reach $2,031 per month.
2016 PREVIEW
29
2015 PERFORMANCE HIGHLIGHTS
2.7% YOY
EMPLOYMENT41,000
4.4% YOY
ASKING RENTS$1,955
40 BPS YOY
VACANCY4.2%
-1.5% YOY
CONSTRUCTION3,060 Units
-90 BPS YOY
UNEMPLOYMENT RATE4.2%
0 BPS YOY
CONCESSIONS0.2%
MARKET FACTS
POPULATION3,188,600
MEDIANHOUSEHOLD
INCOME$77,900
HOUSEHOLDS1,048,600
RENTSHARE OFWALLET30.1%
-100,000
-50,000
0
50,000
100,000
2007 2008 2009 2010 2011 2012 2013 2014 2015* 2016**
ASKING RENTS AND VACANCY
*Estimate; **Forecast | Source: Berkadia, Moody’s Analytics
$150,000
$175,000
$200,000
$225,000
4.0%
5.0%
6.0%
7.0%
2011 2012 2013 2014 2015*
CAP RATE | PRICE PER UNIT
*Estimate | Source: Berkadia, CoStar Group
0
50
100
150
2011 2012 2013 2014 2015*
SALES ACTIVITY INDEX
*Estimate | Source: Berkadia, CoStar Group
0
2,000
4,000
6,000
8,000
2012 2013 2014 2015* 2016**
YE 2015 1.0% YOY YE 2015 1.4% YOY YE 2015 2.5% YOY
Ind
ex
Valu
e (
Base
Ye
ar
20
10 =
10
0)
YE 2015 50 BPS YOY
*Estimate; **Forecast | Source: Berkadia, Axiometrics, Moody’s Analytics
*Estimate; **Forecast | Source: Berkadia, Axiometrics, Moody’s Analytics
PERMITS AND DELIVERIES
ORANGE COUNTY | CA
Data and images pertaining to employment, income, permits, population, rents, single-family housing and vacancy are year-end figures. Absorption, construction and apartment sales figures are full-year totals. Numbers for 2015 are estimated values, while 2016 figures are forecast projections. The sales information represents transactions of apartment properties with 20 or more units and sales price of $1 million or more. Apartment market data criteria and methodologies vary by market.
EMPLOYMENT CHANGE

2.0%
4.0%
6.0%
8.0%
$900
$1,000
$1,100
$1,200
2012 2013 2014 2015* 2016**
Single-family home sales ramped up 15% alongside elevated apartment absorption in the last 12 months. A 2.9% surge in population growth and employment expansion of 2.9% facilitated the heightened demand for housing in the metro. In the largest employment sector, leisure and hospitality, 9,500 positions were filled, the most significant contributor to the 32,500 workers hired overall. The diverse job creation supported demand among all classes of apartments. Renters occupied 6,780 units in 2015, outpacing 6,160 completions, resulting in a 40-basis-point decrease in vacancy to 4.2%. Availability became particularly limited in the Kissimmee/Osceola and Lake County submarkets, where vacancy fell below 3%. Multifamily developers, anticipating sustained apartment demand, filled the planning pipeline with permits for 6,460 apartments, up 2.4% from 2014. Meanwhile, operators pushed asking rents up 6.4% to $1,088 per month.
2015 REVIEW
With heavy demand from out-of-state buyers, multifamily investment activity is entering 2016 at a robust pace. Sales of Class A communities will continue to comprise a major share of deals, especially in the highest-rent areas in the east metro and in southwest Orlando, where significant job growth is occurring. Cap rates at these apartment communities are hovering in the low-5% range. While Class A values are averaging approximately $160,000 per unit metrowide, investors should expect average prices near $180,000 per unit for assets built in the last five years.
Apartment fundamentals will continue to improve this year, buoyed by 2.2% employment expansion as 25,600 workers are recruited. Multifamily developers will accommodate the growth, delivering 4,980 apartments. Absorption will once again outpace completions. By year-end, vacancy is projected to fall 70 basis points to 3.5%. As apartment availability diminishes, operators will raise monthly asking rents 4.9% to $1,141, while effective rents advance 4.7% to $1,136 per month.
2016 PREVIEW
30
2015 PERFORMANCE HIGHLIGHTS
2.9% YOY
EMPLOYMENT32,500
6.4% YOY
ASKING RENTS$1,088
-40 BPS YOY
VACANCY4.2%
23.7% YOY
CONSTRUCTION6,160 Units
-70 BPS YOY
UNEMPLOYMENT RATE4.7%
-50 BPS YOY
CONCESSIONS0.3%
MARKET FACTS
POPULATION2,422,900
MEDIANHOUSEHOLD
INCOME$49,400
HOUSEHOLDS943,100
RENTSHARE OFWALLET26.4%
-60,000
-30,000
0
30,000
60,000
2007 2008 2009 2010 2011 2012 2013 2014 2015* 2016**
ASKING RENTS AND VACANCY
*Estimate; **Forecast | Source: Berkadia, Moody’s Analytics
$50,000
$70,000
$90,000
$110,000
5.5%
6.0%
6.5%
7.0%
2011 2012 2013 2014 2015*
CAP RATE | PRICE PER UNIT
*Estimate | Source: Berkadia, CoStar Group
0
100
200
300
2011 2012 2013 2014 2015*
SALES ACTIVITY INDEX
*Estimate | Source: Berkadia, CoStar Group
0
2,000
4,000
6,000
8,000
2012 2013 2014 2015* 2016**
YE 2015 2.9% YOY YE 2015 4.1% YOY YE 2015 2.5% YOY
Ind
ex
Valu
e (
Base
Ye
ar
20
10 =
10
0)
YE 2015 100 BPS YOY
*Estimate; **Forecast | Source: Berkadia, Axiometrics, Moody’s Analytics
*Estimate; **Forecast | Source: Berkadia, Axiometrics, Moody’s Analytics
PERMITS AND DELIVERIES
ORLANDO
Data and images pertaining to employment, income, permits, population, rents, single-family housing and vacancy are year-end figures. Absorption, construction and apartment sales figures are full-year totals. Numbers for 2015 are estimated values, while 2016 figures are forecast projections. The sales information represents transactions of apartment properties with 20 or more units and sales price of $1 million or more. Apartment market data criteria and methodologies vary by market.
EMPLOYMENT CHANGE

3.0%
4.0%
5.0%
6.0%
$1,200
$1,300
$1,400
$1,500
2012 2013 2014 2015* 2016**
Employment gains kept downward pressure on apartment vacancy despite quickening supply growth. Metrowide, 23,200 workers were hired in the past 12 months. The trade, transportation and utilities sector provided a substantial boost to the economy, adding 10,900 personnel. The recently expanded XFINITY Live! entertainment complex added more than 100 jobs, supporting 8,600 new hires in the leisure and hospitality industry. In contrast, manufacturing and government headcounts declined by a collective 6,200 jobs. Overall employment levels grew 0.8% in 2015, supporting leasing activity and the 10-basis-point annual decline in vacancy to 4.6%. Moreover, owners advanced marketwide asking rents 3% to $1,385 per month. Builders completed 3,210 apartments last year, more than double the volume in the prior year. Operators in the Center City submarket lifted asking rents 6.8% to $2,165 while vacancy tightened 130 basis points to 4.3%.
2015 REVIEW
Vacancy will improve in 2016 as hiring accelerates. Apartment demand will compress vacancy 20 basis points to 4.4% by December as 2,330 units come online. Conversely, vacancy will rise to the low- to mid-5% range in the Center City submarket as approximately eight out of every 10 metro additions are in the area. Meanwhile, local companies will create 28,300 new positions. Employment-driven demand will support asking rent appreciation of 2.6%, ascending to $1,421 per month.
Investment activity is surging with steady deal flow expected in 2016. Velocity is up in all segments, particularly among larger assets. Competition for Class B/C properties is bolstering values, with the per-unit price approaching $125,000. Consequently, cap rates for these assets are compressing, reaching as low as 5.5%. Demand will persist for Class A multifamily product; however, only a small number will be brought to market. Pricing for top-tier assets will vary widely, though initial yields are gravitating to the low-5% range.
2016 PREVIEW
31
2015 PERFORMANCE HIGHLIGHTS
0.8% YOY
EMPLOYMENT23,200
3.0% YOY
ASKING RENTS$1,385
-10 BPS YOY
VACANCY4.6%
136.8% YOY
CONSTRUCTION3,210 Units
-30 BPS YOY
UNEMPLOYMENT RATE5.2%
-60 BPS YOY
CONCESSIONS0.3%
MARKET FACTS
POPULATION6,083,300
MEDIANHOUSEHOLD
INCOME$64,800
HOUSEHOLDS2,313,600
RENTSHARE OFWALLET25.6%
-100,000
-50,000
0
50,000
2007 2008 2009 2010 2011 2012 2013 2014 2015* 2016**
ASKING RENTS AND VACANCY
*Estimate; **Forecast | Source: Berkadia, Moody’s Analytics
$60,000
$80,000
$100,000
$120,000
6.0%
6.5%
7.0%
7.5%
2011 2012 2013 2014 2015*
CAP RATE | PRICE PER UNIT
*Estimate | Source: Berkadia, CoStar Group
0
100
200
300
2011 2012 2013 2014 2015*
SALES ACTIVITY INDEX
*Estimate | Source: Berkadia, CoStar Group
0
2,000
4,000
6,000
8,000
2012 2013 2014 2015* 2016**
YE 2015 0.4% YOY YE 2015 1.0% YOY YE 2015 2.4% YOY
Ind
ex
Valu
e (
Base
Ye
ar
20
10 =
10
0)
YE 2015 20 BPS YOY
*Estimate; **Forecast | Source: Berkadia, Axiometrics, Moody’s Analytics
*Estimate; **Forecast | Source: Berkadia, Axiometrics, Moody’s Analytics
PERMITS AND DELIVERIES
PHILADELPHIA
Data and images pertaining to employment, income, permits, population, rents, single-family housing and vacancy are year-end figures. Absorption, construction and apartment sales figures are full-year totals. Numbers for 2015 are estimated values, while 2016 figures are forecast projections. The sales information represents transactions of apartment properties with 20 or more units and sales price of $1 million or more. Apartment market data criteria and methodologies vary by market.
EMPLOYMENT CHANGE

4.5%
5.5%
6.5%
7.5%
$800
$850
$900
$950
$1,000
2012 2013 2014 2015* 2016**
Phoenix employers increased headcounts 2.3%, or by 43,000 jobs, supporting a rise in apartment demand in 2015. Hiring was spread throughout the metro. New offices for Zenefits, Groupon and Weebly in Scottsdale contributed to the escalating need for rentals. Vacancy tightened 60 basis points annually to 5% in the South Scottsdale submarket, despite 1,510 apartments coming online since the close of 2014. Operators in this area capitalized on the demand by advancing rents 3.2% year over year to a metro-high $1,178 per month in December. The healthy apartment fundamentals in the submarket reflected the trend across the market. Metrowide asking rents advanced 6.2% annually to $914 per month, up from 4.9% growth in the preceding year. At the same time, overall vacancy lowered 30 basis points to 5.6% while inventory expanded by 6,920 apartments, the greatest supply growth since 2008.
2015 REVIEW
Demand for apartments will persist this year as vacancy reaches 5.4% by December, down 20 basis points annually. The 7,740 new units will be significant but will not exceed demand in 2016. A metro-leading 1,000 apartments are slated to come online in the popular South Scottsdale submarket. Meanwhile, operational improvements in the West Valley are building momentum and the modest inventory expansion this year of 300 units will support greater submarket rent and occupancy gains. Construction and economic development will extend beyond the multifamily market. Northern Trust is building a 450,000-square-foot regional operations center in Tempe that will start hiring for the 1,000 jobs needed beginning this year. Also in Tempe, the next phases of the 1.9 million-square-foot State Farm Insurance regional headquarters will come online, eventually hosting approximately 8,000 workers. Overall, 42,400 hires are forecast for 2.2% growth this year. Bolstered by employment-driven demand, operators will lift metrowide asking rents 4.7% to $957 per month by December. Simultaneously, concessions will slightly tick up to 1.3% of asking rents.
2016 PREVIEW2015 PERFORMANCE HIGHLIGHTS
2.3% YOY
EMPLOYMENT43,000
6.2% YOY
ASKING RENTS$914
-30 BPS YOY
VACANCY5.6%
55.9% YOY
CONSTRUCTION6,920 Units
-60 BPS YOY
UNEMPLOYMENT RATE5.2%
0 BPS YOY
CONCESSIONS0.9%
MARKET FACTS
POPULATION4,654,700
MEDIANHOUSEHOLD
INCOME$54,100
HOUSEHOLDS1,765,600
RENTSHARE OFWALLET20.3%
-180,000
-120,000
-60,000
0
60,000
2007 2008 2009 2010 2011 2012 2013 2014 2015* 2016**
ASKING RENTS AND VACANCY
*Estimate; **Forecast | Source: Berkadia, Moody’s Analytics
$50,000
$60,000
$70,000
$80,000
5.5%
6.0%
6.5%
7.0%
2011 2012 2013 2014 2015*
CAP RATE | PRICE PER UNIT
*Estimate | Source: Berkadia, CoStar Group
0
100
200
300
2011 2012 2013 2014 2015*
SALES ACTIVITY INDEX
*Estimate | Source: Berkadia, CoStar Group
0
3,000
6,000
9,000
2012 2013 2014 2015* 2016**
YE 2015 2.4% YOY YE 2015 3.4% YOY YE 2015 2.7% YOY
Ind
ex
Valu
e (
Base
Ye
ar
20
10 =
10
0)
32
YE 2015 70 BPS YOY
*Estimate; **Forecast | Source: Berkadia, Axiometrics, Moody’s Analytics
*Estimate; **Forecast | Source: Berkadia, Axiometrics, Moody’s Analytics
PERMITS AND DELIVERIES
PHOENIX
Data and images pertaining to employment, income, permits, population, rents, single-family housing and vacancy are year-end figures. Absorption, construction and apartment sales figures are full-year totals. Numbers for 2015 are estimated values, while 2016 figures are forecast projections. The sales information represents transactions of apartment properties with 20 or more units and sales price of $1 million or more. Apartment market data criteria and methodologies vary by market.
EMPLOYMENT CHANGE

3.5%
4.0%
4.5%
5.0%
$1,000
$1,100
$1,200
$1,300
$1,400
$1,500
2012 2013 2014 2015* 2016**
An influx of jobs fueled the Portland multifamily apartment market in 2015. Rent growth soared 12% year over year and vacancy compressed 30 basis points to 3.9%. Metro employment increased by 38,100 positions, a sizeable gain of 3.5%. The improvement followed a 2.9% rise in the preceding 12 months. Companies in the professional and business services sector led job creation, adding 10,600 workers. Hiring was also robust in the education and health services industry with 6,300 new employees. The employment expansion contributed to the 13.8% increase in absorption. Builders stepped up deliveries throughout 2015, adding 2,700 units to stock with 70% of the apartments completed in the second half of the year. Approximately two out of every five apartments came online in the Beaverton submarket, where brisk leasing activity resulted in a 50-basis-point reduction in vacancy to 3.7% by year-end.
2015 REVIEW
Steady employment growth will nearly offset the accelerating supply in 2016. While businesses will add a projected 29,400 workers to headcounts, builders will complete 4,050 rental units in the next four quarters. Consequently, vacancy is forecast to rise 10 basis points annually to a still-healthy 4%. Additionally, asking rents are predicted to ascend 7.5% to $1,430 per month. In the investment arena, the strong job creation and apartment fundamentals will support investment activity in Portland in 2016. While demand will persist for top-tier assets, buyers will increasingly compete for Class B and C stock. Values for middle-tier product are advancing quickly, starting the year at approximately $165,000 per unit. In this segment, out-of-state buyers are outnumbering local investors, compressing cap rates to the low- to mid-5% range. Among Class C investments, demand is pushing prices to an average of $90,000 per unit and tamping down cap rates to nearly 6%. Nevertheless, initial yields in this segment fell nearly 100 basis points in the past two years, indicating that prices may rise at a more sustainable pace in 2016.
2016 PREVIEW
33
2015 PERFORMANCE HIGHLIGHTS
3.5% YOY
EMPLOYMENT38,100
12.0% YOY
ASKING RENTS$1,330
-30 BPS YOY
VACANCY3.9%
-7.6% YOY
CONSTRUCTION2,700 Units
-110 BPS YOY
UNEMPLOYMENT RATE5.2%
20 BPS YOY
CONCESSIONS0.4%
MARKET FACTS
POPULATION2,400,900
MEDIANHOUSEHOLD
INCOME$63,300
HOUSEHOLDS973,100
RENTSHARE OFWALLET25.2%
-50,000
-25,000
0
25,000
50,000
2007 2008 2009 2010 2011 2012 2013 2014 2015* 2016**
ASKING RENTS AND VACANCY
*Estimate; **Forecast | Source: Berkadia, Moody’s Analytics
$75,000
$100,000
$125,000
$150,000
5.5%
6.0%
6.5%
7.0%
2011 2012 2013 2014 2015*
CAP RATE | PRICE PER UNIT
*Estimate | Source: Berkadia, CoStar Group
0
100
200
300
400
2011 2012 2013 2014 2015*
SALES ACTIVITY INDEX
*Estimate | Source: Berkadia, CoStar Group
0
2,000
4,000
6,000
8,000
2012 2013 2014 2015* 2016**
YE 2015 1.4% YOY YE 2015 2.5% YOY YE 2015 2.9% YOY
Ind
ex
Valu
e (
Base
Ye
ar
20
10 =
10
0)
YE 2015 210 BPS YOY
*Estimate; **Forecast | Source: Berkadia, Axiometrics, Moody’s Analytics
*Estimate; **Forecast | Source: Berkadia, Axiometrics, Moody’s Analytics
PERMITS AND DELIVERIES
PORTLAND
Data and images pertaining to employment, income, permits, population, rents, single-family housing and vacancy are year-end figures. Absorption, construction and apartment sales figures are full-year totals. Numbers for 2015 are estimated values, while 2016 figures are forecast projections. The sales information represents transactions of apartment properties with 20 or more units and sales price of $1 million or more. Apartment market data criteria and methodologies vary by market.
EMPLOYMENT CHANGE

5.0%
5.1%
5.2%
5.3%
5.4%
5.5%
$800
$900
$1,000
$1,100
2012 2013 2014 2015* 2016**
Raleigh-Durham employers created 13,800 jobs for a 1.6% rise in headcounts from one year ago. The trade, transportation and utilities sector, along with the professional and business services segment, led job creation, collectively adding 7,200 employees. Hiring was also strong in the leisure and hospitality industry with 3,200 new workers. Favorable economic conditions sustained multifamily development. Builders delivered 4,640 apartments, after peaking at 5,010 completions in the prior year. One out of every four deliveries was in the Central Raleigh submarket. Despite the surge in metrowide inventory over the past 24 months, vacancy was unchanged year over year at 5.2% in December. Asking rents climbed to $970 per month by the fourth quarter, up 4.4% annually. Effective rents, meanwhile, advanced 4.9% to $966 per month, causing concessions to fall to an average of 0.4% of asking rents, a 50-basis-point decline.
2015 REVIEW
Raleigh-Durham businesses will accelerate hiring, supporting healthy rental demand throughout the metro. Approximately 16,700 workers will be hired in 2016, a gain of 1.9%. Over the next two years, IT firm HCL Technologies announced they will expand its workforce by 1,200 employees in Cary. Drugmaker Novo Nordisk is building a $1.2 billion manufacturing facility in Johnston County creating 700 jobs in the coming five years. Fidelity Investments also announced they will invest $8.1 million upgrading its research campus in Durham while adding 600 technology jobs in the next three years. Multifamily development is poised to capitalize on employment-driven residential demand. Construction is scheduled to complete on 3,530 apartments this year. Deliveries will be elevated in the submarkets of Central Raleigh, Cary and Northeast Raleigh where approximately 50% of the units will come online. Further, developers will keep the planning pipeline full. Permit requests for 4,650 apartments are forecast. Rent gains will persist as operators are expected to lift asking rents 4.2% to $1,011 per month by year-end. Vacancy is again expected to end the year at 5.2%.
2016 PREVIEW
34
2015 PERFORMANCE HIGHLIGHTS
1.6% YOY
EMPLOYMENT13,800
4.4% YOY
ASKING RENTS$970
0 BPS YOY
VACANCY5.2%
-7.5% YOY
CONSTRUCTION4,640 Units
-30 BPS YOY
UNEMPLOYMENT RATE4.4%
-50 BPS YOY
CONCESSIONS0.4%
MARKET FACTS
POPULATION1,837,800
MEDIANHOUSEHOLD
INCOME$60,300
HOUSEHOLDS715,300
RENTSHARE OFWALLET19.3%
-40,000
-20,000
0
20,000
40,000
2007 2008 2009 2010 2011 2012 2013 2014 2015* 2016**
ASKING RENTS AND VACANCY
*Estimate; **Forecast | Source: Berkadia, Moody’s Analytics
$80,000
$90,000
$100,000
$110,000
5.0%
5.5%
6.0%
6.5%
2011 2012 2013 2014 2015*
CAP RATE | PRICE PER UNIT
*Estimate | Source: Berkadia, CoStar Group
0
100
200
300
2011 2012 2013 2014 2015*
SALES ACTIVITY INDEX
*Estimate | Source: Berkadia, CoStar Group
0
3,000
6,000
9,000
2012 2013 2014 2015* 2016**
YE 2015 2.0% YOY YE 2015 2.6% YOY YE 2015 2.4% YOY
Ind
ex
Valu
e (
Base
Ye
ar
20
10 =
10
0)
YE 2015 40 BPS YOY
*Estimate; **Forecast | Source: Berkadia, Axiometrics, Moody’s Analytics
*Estimate; **Forecast | Source: Berkadia, Axiometrics, Moody’s Analytics
PERMITS AND DELIVERIES
RALEIGH-DURHAM
Data and images pertaining to employment, income, permits, population, rents, single-family housing and vacancy are year-end figures. Absorption, construction and apartment sales figures are full-year totals. Numbers for 2015 are estimated values, while 2016 figures are forecast projections. The sales information represents transactions of apartment properties with 20 or more units and sales price of $1 million or more. Apartment market data criteria and methodologies vary by market.
EMPLOYMENT CHANGE

3.0%
4.0%
5.0%
6.0%
$1,000
$1,100
$1,200
$1,300
$1,400
2012 2013 2014 2015* 2016**
Job growth in the Sacramento metro area was broad-based, with nine of the 11 employment sectors posting gains in 2015. Employers added 21,700 workers, an increase of 2.4% from one year prior. In the construction industry, several hundred specialty trade and general labor positions were supported during development of the Golden 1 Center downtown. Encouraged by favorable job growth and apartment demand, multifamily operators aggressively increased rents for the second-consecutive year. By December, asking rents reached $1,254 per month, 7.5% appreciation, following a 7.8% gain in 2014. In the highest-rent submarket, Downtown Sacramento, asking rents advanced 3.8%, the slowest rent appreciation among the submarkets, suggesting the possibility of early rent-increase resistance. Nevertheless, demand persisted, as vacancy of 3.9% was recorded across the metro, the same as year-end 2014.
2015 REVIEW
Employment expansion will remain healthy as metro-area businesses add 19,400 workers to payrolls this year, a 2.1% annual increase. Along with sustained job growth, apartment demand is expected to rise 80% year over year with 730 newly occupied units. The completion of 610 units will fall short of absorption, resulting in a 10-basis-point dip in vacancy to 3.8%. Decreasing apartment availability will spur operators to continue raising asking rents, though rent appreciation is forecast to grow at a more sustainable rate, a 5.1% annual increase to $1,318 per month. Yield-driven buyers will continue to drive deal flow in 2016. These investors will primarily target 1960s through 1980s apartment stock. Among these assets, buyers should anticipate Class C pricing to typically range between $60,000 and $80,000 per unit, with initial yields in the low-6% range. Meanwhile, Class B values will often start near $90,000 per unit, reaching $120,000 per unit for best-in-class product. Investors can expect first-year yields in the mid-5% range for these mid-tier communities.
2016 PREVIEW
35
2015 PERFORMANCE HIGHLIGHTS
2.4% YOY
EMPLOYMENT21,700
7.5% YOY
ASKING RENTS$1,254
0 BPS YOY
VACANCY3.9%
90.0% YOY
CONSTRUCTION420 Units
-130 BPS YOY
UNEMPLOYMENT RATE5.4%
-10 BPS YOY
CONCESSIONS0.2%
MARKET FACTS
POPULATION2,287,800
MEDIANHOUSEHOLD
INCOME$59,700
HOUSEHOLDS835,700
RENTSHARE OFWALLET25.2%
-60,000
-30,000
0
30,000
2007 2008 2009 2010 2011 2012 2013 2014 2015* 2016**
ASKING RENTS AND VACANCY
*Estimate; **Forecast | Source: Berkadia, Moody’s Analytics
$60,000
$70,000
$80,000
$90,000
$100,000
5.5%
6.0%
6.5%
7.0%
7.5%
2011 2012 2013 2014 2015*
CAP RATE | PRICE PER UNIT
*Estimate | Source: Berkadia, CoStar Group
0
100
200
300
2011 2012 2013 2014 2015*
SALES ACTIVITY INDEX
*Estimate | Source: Berkadia, CoStar Group
0
600
1,200
1,800
2012 2013 2014 2015* 2016**
YE 2015 1.3% YOY YE 2015 1.5% YOY YE 2015 2.8% YOY
Ind
ex
Valu
e (
Base
Ye
ar
20
10 =
10
0)
YE 2015 110 BPS YOY
*Estimate; **Forecast | Source: Berkadia, Axiometrics, Moody’s Analytics
*Estimate; **Forecast | Source: Berkadia, Axiometrics, Moody’s Analytics
PERMITS AND DELIVERIES
SACRAMENTO
Data and images pertaining to employment, income, permits, population, rents, single-family housing and vacancy are year-end figures. Absorption, construction and apartment sales figures are full-year totals. Numbers for 2015 are estimated values, while 2016 figures are forecast projections. The sales information represents transactions of apartment properties with 20 or more units and sales price of $1 million or more. Apartment market data criteria and methodologies vary by market.
EMPLOYMENT CHANGE

3.0%
4.0%
5.0%
6.0%
$800
$900
$1,000
$1,100
2012 2013 2014 2015* 2016**
Metro job growth in 2015 ramped up to 4.2% compared to 2% expansion in the prior year. Employers added 27,800 workers as growth occurred in all employment sectors. Substantial hiring was present in the white-collar segments, as professional and business services payrolls expanded 3.9% with 4,700 workers, while 2,000 jobs were created in the financial activities industry, a gain of 3.6%. In the information sector, 1,900 jobs were added for a 10.1% year-over-year surge. Economic growth boosted apartment demand, which developers attempted to accommodate as 1,490 apartments were delivered, a 2% annual increase in total inventory. Nearly one-third of deliveries were in the Midvale/Sandy submarket. The new stock in the area filled quickly as vacancy fell 100 basis points to 3%. Overall vacancy of 4.3% was recorded in December, 50 basis points lower than year-end 2014. Meanwhile, asking rents advanced a healthy 4.6% to $985 per month.
2015 REVIEW
Employment growth will ease in 2016 as the job base approaches capacity. Payrolls are projected to expand 2.2% with 15,200 new hires. The area will continue to attract manufacturing activity, with medical product manufacturer BioFire Diagnostics LLC filling 750 positions over the next seven years. The leisure and hospitality sector will be supported with nearly 200 jobs created among four Zaxby’s restaurant locations that open through 2018. The broad-based hiring will perpetuate brisk multifamily leasing activity and new inventory will satisfy a portion of the immediate demand as 1,120 apartments come online this year. More than half of the completions will be in the Central Salt Lake City submarket among four mid-rise apartment communities. The elevated deliveries across the metro, however, will trail absorption, resulting in a 50-basis-point decrease in vacancy to 3.8% by year-end. With vacancy remaining within a healthy range, operators will keep rents on an upward track, lifting asking rents 3.2% to $1,017 per month this year. Meanwhile, effective rents are forecast to reach $1,014 per month, a 3.3% annual gain.
2016 PREVIEW
36
2015 PERFORMANCE HIGHLIGHTS
4.2% YOY
EMPLOYMENT27,800
4.6% YOY
ASKING RENTS$985
-50 BPS YOY
VACANCY4.3%
25.9% YOY
CONSTRUCTION1,490 Units
-40 BPS YOY
UNEMPLOYMENT RATE3.1%
-90 BPS YOY
CONCESSIONS0.3%
MARKET FACTS
POPULATION1,175,100
MEDIANHOUSEHOLD
INCOME$65,400
HOUSEHOLDS392,400
RENTSHARE OFWALLET18.1%
-30,000
-15,000
0
15,000
30,000
2007 2008 2009 2010 2011 2012 2013 2014 2015* 2016**
ASKING RENTS AND VACANCY
*Estimate; **Forecast | Source: Berkadia, Moody’s Analytics
$70,000
$90,000
$110,000
$130,000
5.5%
6.0%
6.5%
7.0%
2011 2012 2013 2014 2015*
CAP RATE | PRICE PER UNIT
*Estimate | Source: Berkadia, CoStar Group
0
100
200
300
2011 2012 2013 2014 2015*
SALES ACTIVITY INDEX
*Estimate | Source: Berkadia, CoStar Group
0
1,000
2,000
3,000
4,000
2012 2013 2014 2015* 2016**
YE 2015 1.3% YOY YE 2015 2.0% YOY YE 2015 3.2% YOY
Ind
ex
Valu
e (
Base
Ye
ar
20
10 =
10
0)
YE 2015 20 BPS YOY
*Estimate; **Forecast | Source: Berkadia, Axiometrics, Moody’s Analytics
*Estimate; **Forecast | Source: Berkadia, Axiometrics, Moody’s Analytics
PERMITS AND DELIVERIES
SALT LAKE CITY
Data and images pertaining to employment, income, permits, population, rents, single-family housing and vacancy are year-end figures. Absorption, construction and apartment sales figures are full-year totals. Numbers for 2015 are estimated values, while 2016 figures are forecast projections. The sales information represents transactions of apartment properties with 20 or more units and sales price of $1 million or more. Apartment market data criteria and methodologies vary by market.
EMPLOYMENT CHANGE

4.0%
5.0%
6.0%
7.0%
$800
$850
$900
$950
2012 2013 2014 2015* 2016**
Infill apartment demand was evident last year, as asking rents surged 6.3% to $974 per month in the Central San Antonio submarket, while vacancy fell below 4%. Metrowide, market rents appreciated a healthy 3.8% to $911 per month. Operators further enhanced revenue by cutting concessions from 1.8% to 1.2% of average asking rents. Job growth across the metro boosted apartment demand, resulting in a 30-basis-point reduction in vacancy to 6.3%. Employers added 40,400 workers to local payrolls by year-end, a 4.2% annual increase. Growth occurred in all employment sectors. Staffing levels soared 6.8% in the professional and business services segment as 8,300 jobs were created. Expansion was similar in the leisure and hospitality industry, where 7,300 workers were recruited, a 6.1% gain. Apartment inventory for the rapidly growing workforce spiked, expanding 4.4% with 7,120 completions.
2015 REVIEW
Multifamily fundamentals will continue to improve in 2016. Completions totaling 4,440 units are slated for this year, more than one-quarter of which will come online in the Bexar County/Other submarket. Renters are expected to occupy 5,200 apartments in 2016, driving vacancy down 60 basis points to 5.7%. Meanwhile, asking rents are projected to increase 2.9% to $937 per month. Effective rents will rise faster, a 3.3% increase to $930 per month, as operators optimize rental income by reducing concessions to 0.7% of asking rents.
This sustained rent appreciation will be supported by the addition of 28,000 workers as employment expands 2.8%. The professional and business services sector will be a significant contributor to job growth as Intel and Rackspace collaborate in hiring several hundred IT specialists through mid-2017, while Alorica recruits 300 workers by the end of summer this year. Additionally, hundreds of specialty trade and general labor positions will be filled in the construction sector through 2019 as the downtown Frost Bank Tower is built.
2016 PREVIEW
37
2015 PERFORMANCE HIGHLIGHTS
4.2% YOY
EMPLOYMENT40,400
3.8% YOY
ASKING RENTS$911
-30 BPS YOY
VACANCY6.3%
53.7% YOY
CONSTRUCTION7,120 Units
-100 BPS YOY
UNEMPLOYMENT RATE3.1%
-60 BPS YOY
CONCESSIONS1.2%
MARKET FACTS
POPULATION2,390,900
MEDIANHOUSEHOLD
INCOME$55,600
HOUSEHOLDS853,300
RENTSHARE OFWALLET19.7%
-25,000
0
25,000
50,000
2007 2008 2009 2010 2011 2012 2013 2014 2015* 2016**
ASKING RENTS AND VACANCY
*Estimate; **Forecast | Source: Berkadia, Moody’s Analytics
$50,000
$75,000
$100,000
$125,000
6.0%
6.5%
7.0%
7.5%
2011 2012 2013 2014 2015*
CAP RATE | PRICE PER UNIT
*Estimate | Source: Berkadia, CoStar Group
0
100
200
300
2011 2012 2013 2014 2015*
SALES ACTIVITY INDEX
*Estimate | Source: Berkadia, CoStar Group
0
2,000
4,000
6,000
8,000
2012 2013 2014 2015* 2016**
YE 2015 1.8% YOY YE 2015 2.5% YOY YE 2015 2.4% YOY
Ind
ex
Valu
e (
Base
Ye
ar
20
10 =
10
0)
YE 2015 30 BPS YOY
*Estimate; **Forecast | Source: Berkadia, Axiometrics, Moody’s Analytics
*Estimate; **Forecast | Source: Berkadia, Axiometrics, Moody’s Analytics
PERMITS AND DELIVERIES
SAN ANTONIO
Data and images pertaining to employment, income, permits, population, rents, single-family housing and vacancy are year-end figures. Absorption, construction and apartment sales figures are full-year totals. Numbers for 2015 are estimated values, while 2016 figures are forecast projections. The sales information represents transactions of apartment properties with 20 or more units and sales price of $1 million or more. Apartment market data criteria and methodologies vary by market.
EMPLOYMENT CHANGE

4.0%
4.5%
5.0%
5.5%
6.0%
$1,550
$1,650
$1,750
$1,850
$1,950
2012 2013 2014 2015* 2016**
San Diego employers accelerated hiring in 2015. Employment expanded 2.9%, or by 39,700 jobs, in the last 12 months, up from 2.7% growth during 2014. An upswing in hiring in the professional and business services sector contributed to the overall increase as 8,000 workers were added to the workforce. More jobs combined with the steady population growth of 1.2% spurred elevated rental demand, especially in the Clairemont/Linda Vista Mission submarket where 1,600 apartments were absorbed. Renters were attracted to the metro-high 1,260 deliveries in the area. This trend extended throughout the metro as leasing activity exceeded the 3,570 additions, resulting in vacancy lowering 10 basis points to 4.6%. Operators moved to capitalize on heightened demand by lifting asking rents 7.2% year over year to $1,852 per month in December, the sharpest year-end increase in more than a decade.
2015 REVIEW
Demand for apartments in the San Diego metro will heighten amid healthy job growth this year. Renters will absorb 3,960 net apartments by December, up from 3,740 units in 2015 and above the five-year average of 2,770 apartments. Builders will move to fulfill the demand by completing construction on 3,080 apartments by December, with more than one out of every four additions in the metro in the Downtown San Diego submarket. Despite still-elevated supply growth, leasing activity will outpace apartment deliveries, driving vacancy down 30 basis points to 4.3%, the lowest year-end level since 2003. Also this year, operators will advance asking rents 4.7% to $1,939 per month. Underpinning the improving apartment fundamentals is the expanding workforce. Employers are projected to create 31,000 jobs, to increase payrolls 2.2%. The construction industry will be boosted by developments at the 201-acre Millenia urban hub at Otay Ranch in the San Diego County/Other submarket. Construction of an 11-acre retail center, 135-room hotel, 176 townhomes and a 210-unit affordable housing community are set to start at the site this year.
2016 PREVIEW
38
2015 PERFORMANCE HIGHLIGHTS
2.9% YOY
EMPLOYMENT39,700
7.2% YOY
ASKING RENTS$1,852
-10 BPS YOY
VACANCY4.6%
30.7% YOY
CONSTRUCTION3,570 Units
-120 BPS YOY
UNEMPLOYMENT RATE4.8%
10 BPS YOY
CONCESSIONS0.6%
MARKET FACTS
POPULATION3,324,400
MEDIANHOUSEHOLD
INCOME$64,600
HOUSEHOLDS1,162,300
RENTSHARE OFWALLET34.4%
-60,000
-30,000
0
30,000
60,000
2007 2008 2009 2010 2011 2012 2013 2014 2015* 2016**
ASKING RENTS AND VACANCY
*Estimate; **Forecast | Source: Berkadia, Moody’s Analytics
$100,000
$125,000
$150,000
$175,000
4.5%
5.0%
5.5%
6.0%
6.5%
2011 2012 2013 2014 2015*
CAP RATE | PRICE PER UNIT
*Estimate | Source: Berkadia, CoStar Group
0
100
200
300
2011 2012 2013 2014 2015*
SALES ACTIVITY INDEX
*Estimate | Source: Berkadia, CoStar Group
0
2,000
4,000
6,000
2012 2013 2014 2015* 2016**
YE 2015 1.2% YOY YE 2015 1.5% YOY YE 2015 2.7% YOY
Ind
ex
Valu
e (
Base
Ye
ar
20
10 =
10
0)
YE 2015 140 BPS YOY
*Estimate; **Forecast | Source: Berkadia, Axiometrics, Moody’s Analytics
*Estimate; **Forecast | Source: Berkadia, Axiometrics, Moody’s Analytics
PERMITS AND DELIVERIES
SAN DIEGO
Data and images pertaining to employment, income, permits, population, rents, single-family housing and vacancy are year-end figures. Absorption, construction and apartment sales figures are full-year totals. Numbers for 2015 are estimated values, while 2016 figures are forecast projections. The sales information represents transactions of apartment properties with 20 or more units and sales price of $1 million or more. Apartment market data criteria and methodologies vary by market.
EMPLOYMENT CHANGE

3.0%
3.5%
4.0%
4.5%
$2,000
$2,250
$2,500
$2,750
$3,000
2012 2013 2014 2015* 2016**
San Francisco-Oakland payrolls surged 4.3%, or by 44,400 jobs, in 2015. Local growth was more than double the national 1.8% average during the same time. The latest increase was the sixth year of rising headcounts in the metro. Developers ramped up multifamily permitting issuance in that time, leading to 3,470 apartments coming online in 2015, 71% higher than the five-year average. Construction was focused in the South of Market submarket, accounting for more than one out of every three metrowide additions during the last 12 months. As the influx of new inventory exceeded healthy leasing activity across the San Francisco-Oakland market, vacancy ticked up 10 basis points to 3.5%, though was still lower than the 4% five-year average. Operators capitalized on robust apartment demand by raising market rents 11% annually to $2,776 per month, while tightening average concessions from 0.4% to 0.3% of asking rents.
2015 REVIEW
While national employment growth slows in 2016, San Francisco-Oakland hiring will also slightly taper to 4.2%. Local employers will create 45,700 positions by December. Part of the additions will come as Dunkin’ Donuts enters the market, creating 700 to 1,400 jobs as 35 locations open beginning in January of this year. Construction will extend beyond the retail market as inventory will expand by 8,500 apartments by year-end, the largest annual influx in more than 15 years. While additions will again be concentrated in the South of Market submarket with 2,850 apartments, development in the South San Mateo submarket will rise from 300 deliveries in 2015 to 1,530 apartments coming online this year. Metrowide leasing activity will be elevated with 4,700 newly occupied apartments in 2016, though demand will trail inventory growth. The supply imbalance will lift vacancy 70 basis points to 4.2%. Operators will respond by elevating average concessions to 0.5% of asking rents to entice renters amid rising competition. This adjustment will provide leeway for market rents to increase 7.5% year over year to $2,984 per month by December.
2016 PREVIEW
39
2015 PERFORMANCE HIGHLIGHTS
4.3% YOY
EMPLOYMENT44,400
11.0% YOY
ASKING RENTS$2,776
10 BPS YOY
VACANCY3.5%
-0.9% YOY
CONSTRUCTION3,470 Units
-90 BPS YOY
UNEMPLOYMENT RATE3.9%
-10 BPS YOY
CONCESSIONS0.3%
MARKET FACTS
POPULATION4,417,800
MEDIANHOUSEHOLD
INCOME$85,700
HOUSEHOLDS1,607,100
RENTSHARE OFWALLET38.9%
-50,000
-25,000
0
25,000
50,000
2007 2008 2009 2010 2011 2012 2013 2014 2015* 2016**
ASKING RENTS AND VACANCY
*Estimate; **Forecast | Source: Berkadia, Moody’s Analytics
$175,000
$200,000
$225,000
$250,000
4.5%
5.0%
5.5%
6.0%
2011 2012 2013 2014 2015*
CAP RATE | PRICE PER UNIT
*Estimate | Source: Berkadia, CoStar Group
0
100
200
300
2011 2012 2013 2014 2015*
SALES ACTIVITY INDEX
*Estimate | Source: Berkadia, CoStar Group
0
3,000
6,000
9,000
2012 2013 2014 2015* 2016**
YE 2015 1.3% YOY YE 2015 1.1% YOY YE 2015 3.3% YOY
Ind
ex
Valu
e (
Base
Ye
ar
20
10 =
10
0)
YE 2015 270 BPS YOY
*Estimate; **Forecast | Source: Berkadia, Axiometrics, Moody’s Analytics
*Estimate; **Forecast | Source: Berkadia, Axiometrics, Moody’s Analytics
PERMITS AND DELIVERIES
SAN FRANCISCO-OAKLAND
Data and images pertaining to employment, income, permits, population, rents, single-family housing and vacancy are year-end figures. Absorption, construction and apartment sales figures are full-year totals. Numbers for 2015 are estimated values, while 2016 figures are forecast projections. The sales information represents transactions of apartment properties with 20 or more units and sales price of $1 million or more. Apartment market data criteria and methodologies vary by market.
EMPLOYMENT CHANGE

4.0%
4.5%
5.0%
5.5%
$1,200
$1,400
$1,600
$1,800
2012 2013 2014 2015* 2016**
Seattle-Tacoma employment expanded 3%, or by 56,100 jobs, in 2015, significantly outpacing the 1.8% national average. Robust hiring drove household formation up 2.3% in 2015, supporting demand for both multi- and single-family dwellings. As single-family home sales accelerated 10.3%, multifamily leasing activity was elevated with 8,830 newly occupied apartments last year, 36% higher than the five-year average. Leasing exceeded the 8,010 deliveries in 2015, even in the Downtown/Capitol Hill/Queen Anne submarket where vacancy lowered 50 basis points annually to 4.6% as a metro-high 2,180 apartments came online. Metrowide, vacancy decreased 30 basis points to 4.4% in 2015, the lowest year-end rate in more than two decades. Operators capitalized on heightened demand by accelerating rent growth. Monthly asking rents increased 7.6% annually to $1,598, up from a 6.1% rise in the preceding year. Operators also lowered concessions to 0.5% from 0.7% of asking rents.
2015 REVIEW
With Seattle-Tacoma nearing full employment as unemployment reached the low-4% range to close last year, hiring will slow, though remain healthy across the metro during the upcoming four quarters. Headcounts will increase 2.5% with 48,100 new positions by December. Several projects under development across the metro, from the new $228.9 million Expedia campus to the $30 million upgrade to Pier 66 by Norwegian Cruise Lines, are providing a boost to the construction industry and creating demand for apartments. The multifamily market will also contribute to the construction sector as 9,530 apartments are scheduled to come online this year, the highest annual output since 2008 when vacancy elevated by 80 basis points. Unlike the prior spike in apartment additions, vigorous leasing activity will keep pace with inventory growth this year as vacancy holds at 4.4%. As operators entice renters amid increased competition, concessions are forecast to rise to an average of three days of free rent in 2016 from two days during last year. The adjustment will provide leeway for operators to advance asking rents 6.3% year over year to $1,699 per month by December.
2016 PREVIEW
40
2015 PERFORMANCE HIGHLIGHTS
3.0% YOY
EMPLOYMENT56,100
7.6% YOY
ASKING RENTS$1,598
-30 BPS YOY
VACANCY4.4%
-7.0% YOY
CONSTRUCTION8,010 Units
-110 BPS YOY
UNEMPLOYMENT RATE4.0%
-20 BPS YOY
CONCESSIONS0.5%
MARKET FACTS
POPULATION3,747,000
MEDIANHOUSEHOLD
INCOME$72,500
HOUSEHOLDS1,487,600
RENTSHARE OFWALLET26.4%
-90,000
-60,000
-30,000
0
30,000
60,000
2007 2008 2009 2010 2011 2012 2013 2014 2015* 2016**
ASKING RENTS AND VACANCY
*Estimate; **Forecast | Source: Berkadia, Moody’s Analytics
$100,000
$120,000
$140,000
$160,000
$180,000
4.5%
5.0%
5.5%
6.0%
2011 2012 2013 2014 2015*
CAP RATE | PRICE PER UNIT
*Estimate | Source: Berkadia, CoStar Group
0
100
200
300
400
2011 2012 2013 2014 2015*
SALES ACTIVITY INDEX
*Estimate | Source: Berkadia, CoStar Group
0
5,000
10,000
15,000
20,000
2012 2013 2014 2015* 2016**
YE 2015 1.4% YOY YE 2015 2.3% YOY YE 2015 3.1% YOY
Ind
ex
Valu
e (
Base
Ye
ar
20
10 =
10
0)
YE 2015 110 BPS YOY
*Estimate; **Forecast | Source: Berkadia, Axiometrics, Moody’s Analytics
*Estimate; **Forecast | Source: Berkadia, Axiometrics, Moody’s Analytics
PERMITS AND DELIVERIES
SEATTLE-TACOMA
Data and images pertaining to employment, income, permits, population, rents, single-family housing and vacancy are year-end figures. Absorption, construction and apartment sales figures are full-year totals. Numbers for 2015 are estimated values, while 2016 figures are forecast projections. The sales information represents transactions of apartment properties with 20 or more units and sales price of $1 million or more. Apartment market data criteria and methodologies vary by market.
EMPLOYMENT CHANGE

3.5%
4.0%
4.5%
5.0%
5.5%
$1,300
$1,400
$1,500
$1,600
$1,700
2012 2013 2014 2015* 2016**
Apartment demand rose across the Tri-County metropolitan area in 2015, fueling a drop in vacancy. After 8,650 units were absorbed in 2014, residents occupied 9,920 additional apartments during the last four quarters. Leasing activity was elevated in the Miami submarket, where 1,610 units were absorbed in 2015. With demand outpacing the 670 rentals that came online in the area, vacancy dropped sharply from 6% at the close of 2014 to 4.1% a year later. Heightened leasing activity across the South Florida market led to vacancy declining 30 basis points to 4.2% by December. Apartment demand was supported by the 45,900 workers added since January, a 1.9% annual increase in headcounts. The professional and business services sector led hiring, adding 15,000 personnel. Rising payrolls and healthy leasing prompted operators to advance asking rents 5.4% annually to $1,541 per month, while holding concessions at 0.3% of asking rents.
2015 REVIEW
Following several years of steady permitting activity, apartment inventory will surge by 9,030 apartments during the next four quarters across the South Florida market, the highest annual total since 2007. Development will be concentrated in Miami-Dade County as inventory swells with 4,210 new apartments in 2016, up from 2,770 deliveries last year. An additional 2,520 units in Palm Beach County and 2,300 units in Broward County are scheduled to come online by year-end. The supply spike will result in metrowide vacancy ticking up 20 basis points to 4.4% by December. Even with the rise, the rate will be well below the 6% average during the prior decade. With occupancy at acceptable levels, operators will advance asking rents 4.3% annually to $1,607 per month. At the same time, effective rents will appreciate 3.8% to $1,595 per month, causing concessions to rise 40 basis points to an average of 0.7% of asking rents. The increase in rents will be supported by job creation. Businesses are forecast to add 45,300 jobs to expand employment 1.8% over the next four quarters. The Tri-County metro gains will slightly outpace the 1.7% national average at the same time.
2016 PREVIEW
41
2015 PERFORMANCE HIGHLIGHTS
1.9% YOY
EMPLOYMENT45,900
5.4% YOY
ASKING RENTS$1,541
-30 BPS YOY
VACANCY4.2%
21.0% YOY
CONSTRUCTION7,360 Units
-30 BPS YOY
UNEMPLOYMENT RATE5.4%
0 BPS YOY
CONCESSIONS0.3%
MARKET FACTS
POPULATION6,081,700
MEDIANHOUSEHOLD
INCOME$50,100
HOUSEHOLDS2,346,800
RENTSHARE OFWALLET36.9%
-150,000
-100,000
-50,000
0
50,000
100,000
2007 2008 2009 2010 2011 2012 2013 2014 2015* 2016**
ASKING RENTS AND VACANCY
*Estimate; **Forecast | Source: Berkadia, Moody’s Analytics
$70,000
$90,000
$110,000
$130,000
5.5%
6.0%
6.5%
7.0%
2011 2012 2013 2014 2015*
CAP RATE | PRICE PER UNIT
*Estimate | Source: Berkadia, CoStar Group
0
100
200
300
2011 2012 2013 2014 2015*
SALES ACTIVITY INDEX
*Estimate | Source: Berkadia, CoStar Group
0
5,000
10,000
15,000
2012 2013 2014 2015* 2016**
YE 2015 1.7% YOY YE 2015 2.7% YOY YE 2015 2.9% YOY
Ind
ex
Valu
e (
Base
Ye
ar
20
10 =
10
0)
YE 2015 90 BPS YOY
*Estimate; **Forecast | Source: Berkadia, Axiometrics, Moody’s Analytics
*Estimate; **Forecast | Source: Berkadia, Axiometrics, Moody’s Analytics
PERMITS AND DELIVERIES
SOUTH FLORIDA
Data and images pertaining to employment, income, permits, population, rents, single-family housing and vacancy are year-end figures. Absorption, construction and apartment sales figures are full-year totals. Numbers for 2015 are estimated values, while 2016 figures are forecast projections. The sales information represents transactions of apartment properties with 20 or more units and sales price of $1 million or more. Apartment market data criteria and methodologies vary by market.
EMPLOYMENT CHANGE

6.5%
7.0%
7.5%
8.0%
$850
$900
$950
$1,000
2012 2013 2014 2015* 2016**
Continual improvement in the St. Louis economy boosted apartment fundamentals. Employment expanded 1.3%, or by 17,100 jobs in 2015. Trade, transportation and utilities businesses added 6,300 positions. Walmart and IKEA contributed to the annual rise of 2.4% by filling approximately 700 positions with the opening of three locations. Job creation helped boost apartment occupancy, as positive net absorption registered 1,080 units by year-end. Demand outpaced new inventory at the same time as vacancy tightened 30 basis points to 6.8%. Operators capitalized on the improved occupancy by raising asking rents 3% to $931 per month. Operations were particularly healthy in the St. Charles County submarket, where three out of every 10 units were absorbed. Competition for rentals in this area resulted in an 80-basis-point improvement in vacancy to 5.5%, while asking rents surged 7.9% to $914 per month.
2015 REVIEW
Hiring in the construction and distribution sectors will support metrowide gains in 2016. Retailer Menards is building a $29 million distribution facility with the first phase finishing in late 2016, adding 130 initial workers. Development will also persist at several multifamily properties, maintaining staffing levels in the construction industry. These segments will help lift overall employment by 14,700 positions this year; however, employment-driven demand will fall just shy of the 1,480 new rental units. These completions will cause vacancy to edge up 10 basis points to 6.9% by year-end. Meanwhile, in the Clayton/Mid-County submarket, builders are on pace to deliver as many as 525 units in the next 12 to 18 months. Metrowide asking rents will appreciate 2.4% to $953 per month. With a manageable uptick in vacancy, still-rising rents and investors’ increasing confidence in outlying submarkets like St. Charles and Madison counties, deal flow will persist at a healthy clip in 2016. Ideally located, B-plus communities will remain highly sought after and are expected to trade as high as $90,000 per unit. Additionally, more aggressive buyers will find repositioning plays at prices less than $40,000 per unit.
2016 PREVIEW
42
2015 PERFORMANCE HIGHLIGHTS
1.3% YOY
EMPLOYMENT17,100
3.0% YOY
ASKING RENTS$931
-30 BPS YOY
VACANCY6.8%
-11.7% YOY
CONSTRUCTION640 Units
-30 BPS YOY
UNEMPLOYMENT RATE5.3%
-70 BPS YOY
CONCESSIONS1.1%
MARKET FACTS
POPULATION2,813,600
MEDIANHOUSEHOLD
INCOME$57,400
HOUSEHOLDS1,131,700
RENTSHARE OFWALLET19.5%
-50,000
-25,000
0
25,000
2007 2008 2009 2010 2011 2012 2013 2014 2015* 2016**
ASKING RENTS AND VACANCY
*Estimate; **Forecast | Source: Berkadia, Moody’s Analytics
$40,000
$50,000
$60,000
$70,000
$80,000
6.0%
8.0%
10.0%
12.0%
2011 2012 2013 2014 2015*
CAP RATE | PRICE PER UNIT
*Estimate | Source: Berkadia, CoStar Group
0
100
200
300
2011 2012 2013 2014 2015*
SALES ACTIVITY INDEX
*Estimate | Source: Berkadia, CoStar Group
0
1,000
2,000
3,000
2012 2013 2014 2015* 2016**
YE 2015 0.2% YOY YE 2015 0.9% YOY YE 2015 2.5% YOY
Ind
ex
Valu
e (
Base
Ye
ar
20
10 =
10
0)
YE 2015 10 BPS YOY
*Estimate; **Forecast | Source: Berkadia, Axiometrics, Moody’s Analytics
*Estimate; **Forecast | Source: Berkadia, Axiometrics, Moody’s Analytics
PERMITS AND DELIVERIES
ST. LOUIS
Data and images pertaining to employment, income, permits, population, rents, single-family housing and vacancy are year-end figures. Absorption, construction and apartment sales figures are full-year totals. Numbers for 2015 are estimated values, while 2016 figures are forecast projections. The sales information represents transactions of apartment properties with 20 or more units and sales price of $1 million or more. Apartment market data criteria and methodologies vary by market.
EMPLOYMENT CHANGE

3.5%
4.5%
5.5%
6.5%
$800
$900
$1,000
$1,100
2012 2013 2014 2015* 2016**
Population gains and robust job creation are driving demand for housing in the Tampa-St. Petersburg metropolitan area. While the population grew by 1.6%, employment expanded 3.2% in 2015. The leisure and hospitality industry was a major contributor last year, adding 10,400 of the net 39,200 new jobs metrowide. Part of the additions came when Topgolf opened in the Brandon/Plant City submarket, creating 450 positions. The hiring boosted household formation and residential demand 2.6% year over year. Consequently, home sales jumped 20.2% and 4,650 apartments were absorbed. Leasing exceeded the 3,310 newly completed units, resulting in vacancy decreasing 50 basis points annually to 4.5%. Developers responded by accelerating multifamily permitting to 6,930 units, the highest annual issuance since 2003. Operators also capitalized on heightened absorption by raising monthly market rents 5.6% during the last 12 months to $1,052.
2015 REVIEW
Job growth in the Tampa-St. Petersburg metro will continue to outpace the nation this year. Local payrolls are expected to rise 2.3%, or by 29,100 positions, compared with the 1.7% national average. The education and health services sector will be boosted this year by the completions of the $60 million expansion of Brandon Regional Hospital and the $56 million new Laser Spine campus in Westshore. Healthy hiring will again drive vigorous leasing activity across the metro as vacancy decreases 20 basis points to 4.3%, the lowest year-end rate since 2005.
Builders are moving to meet the demand as construction is scheduled to complete on 3,880 apartments by December, with more than half of the additions in the Central Tampa submarket. The largest project under construction—in the submarket and the metro—set to come online this year is the 374-unit Crescent Communities. Operators will capitalize on hearty demand by advancing market rents 3.8% to $1,092 per month in 2016. Simultaneously, effective rents will rise 3.8%, holding average concessions at a tight 0.3% of asking rents.
2016 PREVIEW
43Data and images pertaining to employment, income, permits, population, rents, single-family housing and vacancy are year-end figures. Absorption, construction and apartment sales figures are full-year totals. Numbers for 2015 are estimated values, while 2016 figures are forecast projections. The sales information represents transactions of apartment properties with 20 or more units and sales price of $1 million or more. Apartment market data criteria and methodologies vary by market.
2015 PERFORMANCE HIGHLIGHTS
3.2% YOY
EMPLOYMENT39,200
5.6% YOY
ASKING RENTS$1,052
-50 BPS YOY
VACANCY4.5%
-14.8% YOY
CONSTRUCTION3,310 Units
-70 BPS YOY
UNEMPLOYMENT RATE4.9%
-20 BPS YOY
CONCESSIONS0.3%
MARKET FACTS
POPULATION2,986,800
MEDIANHOUSEHOLD
INCOME$48,500
HOUSEHOLDS1,259,200
RENTSHARE OFWALLET26.0%
-80,000
-40,000
0
40,000
2007 2008 2009 2010 2011 2012 2013 2014 2015* 2016**
ASKING RENTS AND VACANCY
*Estimate; **Forecast | Source: Berkadia, Moody’s Analytics
$50,000
$60,000
$70,000
$80,000
6.0%
6.5%
7.0%
7.5%
2011 2012 2013 2014 2015*
CAP RATE | PRICE PER UNIT
*Estimate | Source: Berkadia, CoStar Group
0
100
200
300
2011 2012 2013 2014 2015*
SALES ACTIVITY INDEX
*Estimate | Source: Berkadia, CoStar Group
0
2,000
4,000
6,000
8,000
2012 2013 2014 2015* 2016**
YE 2015 1.6% YOY YE 2015 2.6% YOY YE 2015 2.8% YOY
Ind
ex
Valu
e (
Base
Ye
ar
20
10 =
10
0)
YE 2015 70 BPS YOY
*Estimate; **Forecast | Source: Berkadia, Axiometrics, Moody’s Analytics
*Estimate; **Forecast | Source: Berkadia, Axiometrics, Moody’s Analytics
PERMITS AND DELIVERIES
TAMPA-ST. PETERSBURG
EMPLOYMENT CHANGE

7.0%
8.0%
9.0%
10.0%
$625
$650
$675
$700
2012 2013 2014 2015* 2016**
A rebound in hiring allowed Tucson apartment operators to raise rents and occupancy, while cutting concessions. After builders added over 700 units in 2014, deliveries fell to 650 units in 2015. Developers were focused on the North/Northwest Tucson submarket; however, resilient leasing in the area underpinned a 100-basis-point vacancy improvement to 6.4% by the end of the year. Marketwide vacancy improved 30 basis points to 7.9% in the previous four quarters, while asking rents ascended 2.3% to $676 per month. Effective rents grew 3.4% to $661 per month, cutting average concessions to 2.2% of asking rents. Operational improvements were supported by the 7,800 total jobs created in 2015, more than double the 3,400 hires in the prior year. The professional and business services sector added a metro-leading 2,800 workers in 2015, expansion of 5.6%.
2015 REVIEW
Rents and concessions will continue to improve in 2016 amid persistent hiring. Tucson employers are forecast to add 9,800 workers this year, expansion of 2.6%. Moreover, just 230 rental units are expected to come online. Staffing additions combined with the slight supply increase will tamp down apartment vacancy 50 basis points to 7.4%, the lowest year-end level since 2007. Asking rents are anticipated to rise 2.1% to $690 per month. Operators will cut renter incentives to an average of 1.7% of asking rents due to the projected 2.6% rise in effective rents, reaching $678 per month by December. Operational improvements will maintain investment sales velocity in 2016. Buyer demand will persist for Class C assets, which has pulled down overall sales prices. In this segment, values are gravitating toward $35,000 per unit, with cap rates gravitating to the low-7% range. Alternately, demand persists for Class A multifamily product, but will remain in short supply, pushing buyers to B-quality assets. Middle-tier apartment properties are expected to trade in the $50,000- to $60,000-per-unit range, but prices can as much as double for well-located, top-performing properties.
2016 PREVIEW
44
2015 PERFORMANCE HIGHLIGHTS
2.1% YOY
EMPLOYMENT7,800
2.3% YOY
ASKING RENTS$676
-30 BPS YOY
VACANCY7.9%
-7.5% YOY
CONSTRUCTION650 Units
-40 BPS YOY
UNEMPLOYMENT RATE5.6%
-110 BPS YOY
CONCESSIONS2.2%
MARKET FACTS
POPULATION1,027,900
MEDIANHOUSEHOLD
INCOME$45,800
HOUSEHOLDS425,400
RENTSHARE OFWALLET17.7%
-20,000
-10,000
0
10,000
2007 2008 2009 2010 2011 2012 2013 2014 2015* 2016**
ASKING RENTS AND VACANCY
*Estimate; **Forecast | Source: Berkadia, Moody’s Analytics
$30,000
$40,000
$50,000
$60,000
$70,000
6.0%
6.5%
7.0%
7.5%
8.0%
2011 2012 2013 2014 2015*
CAP RATE | PRICE PER UNIT
*Estimate | Source: Berkadia, CoStar Group
0
100
200
300
2011 2012 2013 2014 2015*
SALES ACTIVITY INDEX
*Estimate | Source: Berkadia, CoStar Group
0
250
500
750
1,000
2012 2013 2014 2015* 2016**
YE 2015 1.6% YOY YE 2015 2.7% YOY YE 2015 2.5% YOY
Ind
ex
Valu
e (
Base
Ye
ar
20
10 =
10
0)
YE 2015 0 BPS YOY
*Estimate; **Forecast | Source: Berkadia, Axiometrics, Moody’s Analytics
*Estimate; **Forecast | Source: Berkadia, Axiometrics, Moody’s Analytics
PERMITS AND DELIVERIES
TUCSON
44 Data and images pertaining to employment, income, permits, population, rents, single-family housing and vacancy are year-end figures. Absorption, construction and apartment sales figures are full-year totals. Numbers for 2015 are estimated values, while 2016 figures are forecast projections. The sales information represents transactions of apartment properties with 20 or more units and sales price of $1 million or more. Apartment market data criteria and methodologies vary by market.
EMPLOYMENT CHANGE

5.5%
6.5%
7.5%
8.5%
$600
$650
$700
$750
2012 2013 2014 2015* 2016**
Companies in the trade, transportation and utilities sector added 2,400 workers to local payrolls in 2015, a year-over-year increase of 2.9%, driven by Macy’s hiring of 1,500 workers at its new distribution center. Headcounts surged in the construction industry, advancing 5.9% with 1,300 new jobs. The growth in these segments was offset by contraction in several sectors, particularly the manufacturing industry, where 3,700 workers were laid off, a reduction of 7.1%. Additional headwinds resulted from cutbacks in the natural resources and mining sector which shrank 10.5% as 800 positions were eliminated. Metrowide employment dipped 0.3% during 2015 as 1,400 workers were dismissed, the first yearly contraction since 2009. The economic slowdown dampened apartment demand, resulting in vacancy edging 30 basis points higher to 6.3%. Operators kept upward pressure on rents, however, as monthly asking rents appreciated 2% to $709.
2015 REVIEW
While in-state buyers are driving a substantial share of multifamily sales, the recent decrease in investment activity from out of state suggests more conservative deal flow to start 2016. Buyers will continue targeting the southern and eastern portions of the metro, where occupancy and rents are elevated. Acquisitions will be concentrated among 1970s- and 1980s-era stock. Class B assets of this vintage are commanding prices of at least $48,000 per unit. Yield-driven buyers, alternately, will find numerous Class C opportunities with values between $25,000 and $45,000 per unit.
Metro-area employment is forecast to rebound in 2016 as employers add 6,200 workers to payrolls, growth of 1.4%. Economic expansion will bolster apartment demand as a 29.7% annual increase in absorption is anticipated. Inventory growth will accelerate to 1,020 units this year. Metrowide completions, however, are projected to slightly outpace leasing activity, resulting in a 10-basis-point increase in vacancy to 6.4%. Landlords will push up asking rents 2.4% to $726 per month while keeping concessions at 0.7% of asking rents.
2016 PREVIEW
45Data and images pertaining to employment, income, permits, population, rents, single-family housing and vacancy are year-end figures. Absorption, construction and apartment sales figures are full-year totals. Numbers for 2015 are estimated values, while 2016 figures are forecast projections. The sales information represents transactions of apartment properties with 20 or more units and sales price of $1 million or more. Apartment market data criteria and methodologies vary by market.
2015 PERFORMANCE HIGHLIGHTS
-0.3% YOY
EMPLOYMENT-1,400
2.0% YOY
ASKING RENTS$709
30 BPS YOY
VACANCY6.3%
6.0% YOY
CONSTRUCTION920 Units
-10 BPS YOY
UNEMPLOYMENT RATE3.9%
0 BPS YOY
CONCESSIONS0.7%
MARKET FACTS
POPULATION979,800
MEDIANHOUSEHOLD
INCOME$51,700
HOUSEHOLDS386,900
RENTSHARE OFWALLET16.5%
-30,000
-15,000
0
15,000
2007 2008 2009 2010 2011 2012 2013 2014 2015* 2016**
ASKING RENTS AND VACANCY
*Estimate; **Forecast | Source: Berkadia, Moody’s Analytics
$20,000
$30,000
$40,000
$50,000
6.5%
7.0%
7.5%
8.0%
2011 2012 2013 2014 2015*
CAP RATE | PRICE PER UNIT
*Estimate | Source: Berkadia, CoStar Group
0
200
400
600
800
2011 2012 2013 2014 2015*
SALES ACTIVITY INDEX
*Estimate | Source: Berkadia, CoStar Group
0
400
800
1,200
1,600
2012 2013 2014 2015* 2016**
YE 2015 0.8% YOY YE 2015 1.7% YOY YE 2015 3.0% YOY
Ind
ex
Valu
e (
Base
Ye
ar
20
10 =
10
0)
YE 2015 -20 BPS YOY
*Estimate; **Forecast | Source: Berkadia, Axiometrics, Moody’s Analytics
*Estimate; **Forecast | Source: Berkadia, Axiometrics, Moody’s Analytics
PERMITS AND DELIVERIES
TULSA
EMPLOYMENT CHANGE

5.5%
6.0%
6.5%
7.0%
$950
$975
$1,000
$1,025
$1,050
2012 2013 2014 2015* 2016**
Job creation and easing completions supported vacancy and rent improvements in the Hampton Roads metro in 2015. Asking rents advanced 0.9% to $1,034 per month, while employment rose by 8,300 positions, following 3,100 new hires in the prior year. White-collar gains lifted the metro: the professional and business services and financial activities sectors hired 5,300 total workers. Despite the 430 positions added by Naval Facilities Engineering Command Mid-Atlantic, the government sector remained a drag on the local economy, shedding 700 positions last year. Nevertheless, the 41.2% year-over-year decline in completions and steady leasing underpinned the 50-basis-point reduction in marketwide apartment vacancy, reaching 6.4% in December. Approximately 1,520 units came online metrowide, with 460 apartments in the Norfolk submarket. Consequently, area vacancy ticked up 30 basis points to 6.4%, matching the overall rate.
2015 REVIEW
Builders are escalating deliveries 46% this year, though persistent hiring will depress vacancy and allow operators to cut concessions further. Approximately 2,230 apartments will reach completion in 2016. Countering the supply-side pressure, Hampton Roads employment will expand by an estimated 9,900 positions, tamping down vacancy 10 basis points to 6.3% by December. With vacancy in check, operators will advance asking rents 1.2% to $1,046 per month, while effective rents ascend 1.4% to $1,030 per month. Consequently, metrowide concessions will fall to 1.5% of asking rents. In the investment arena, demand will persist for Class A assets, though for-sale supply will remain constrained. In this segment, per-unit pricing is averaging $180,000, with cap rates hovering in the mid-5% range. Alternately, the resurgence in Class C sales will continue to drive deal flow in 2016. Well-located, lower-tier assets with value-add potential are expected to trade between $50,000 and $70,000 per unit, with initial yields in the mid- to high-6% range. More aggressive, yield-driven buyers will find opportunities at less than $50,000 per unit with cap rates nearing 8%.
2016 PREVIEW
46
2015 PERFORMANCE HIGHLIGHTS
1.1% YOY
EMPLOYMENT8,300
0.9% YOY
ASKING RENTS$1,034
-50 BPS YOY
VACANCY6.4%
-41.2% YOY
CONSTRUCTION1,520 Units
-20 BPS YOY
UNEMPLOYMENT RATE5.2%
-60 BPS YOY
CONCESSIONS1.7%
MARKET FACTS
POPULATION1,734,300
MEDIANHOUSEHOLD
INCOME$59,900
HOUSEHOLDS660,700
RENTSHARE OFWALLET20.7%
-20,000
-10,000
0
10,000
20,000
2007 2008 2009 2010 2011 2012 2013 2014 2015* 2016**
ASKING RENTS AND VACANCY
*Estimate; **Forecast | Source: Berkadia, Moody’s Analytics
$40,000
$50,000
$60,000
$70,000
$80,000
5.0%
6.0%
7.0%
8.0%
9.0%
2011 2012 2013 2014 2015*
CAP RATE | PRICE PER UNIT
*Estimate | Source: Berkadia, CoStar Group
0
200
400
600
2011 2012 2013 2014 2015*
SALES ACTIVITY INDEX
*Estimate | Source: Berkadia, CoStar Group
0
1,000
2,000
3,000
4,000
2012 2013 2014 2015* 2016**
YE 2015 0.7% YOY YE 2015 1.5% YOY YE 2015 1.9% YOY
Ind
ex
Valu
e (
Base
Ye
ar
20
10 =
10
0)
YE 2015 -20 BPS YOY
*Estimate; **Forecast | Source: Berkadia, Axiometrics, Moody’s Analytics
*Estimate; **Forecast | Source: Berkadia, Axiometrics, Moody’s Analytics
PERMITS AND DELIVERIES
VIRGINIA BEACH
Data and images pertaining to employment, income, permits, population, rents, single-family housing and vacancy are year-end figures. Absorption, construction and apartment sales figures are full-year totals. Numbers for 2015 are estimated values, while 2016 figures are forecast projections. The sales information represents transactions of apartment properties with 20 or more units and sales price of $1 million or more. Apartment market data criteria and methodologies vary by market.
EMPLOYMENT CHANGE
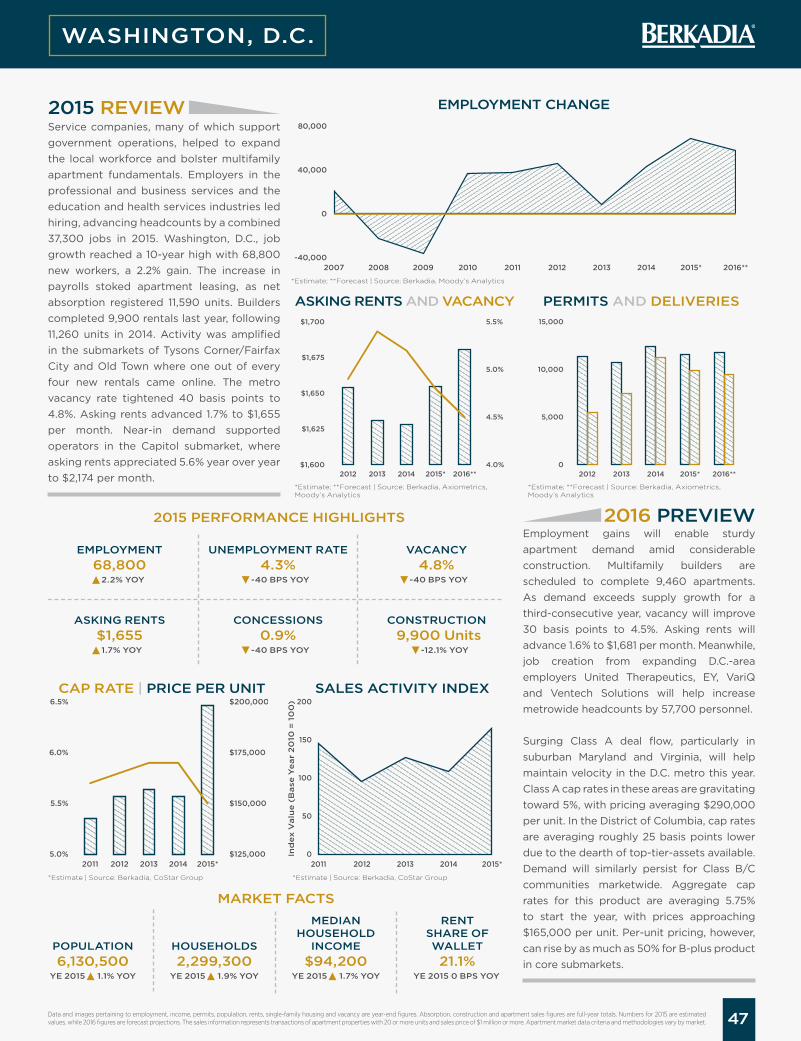
4.0%
4.5%
5.0%
5.5%
$1,600
$1,625
$1,650
$1,675
$1,700
2012 2013 2014 2015* 2016**
Service companies, many of which support government operations, helped to expand the local workforce and bolster multifamily apartment fundamentals. Employers in the professional and business services and the education and health services industries led hiring, advancing headcounts by a combined 37,300 jobs in 2015. Washington, D.C., job growth reached a 10-year high with 68,800 new workers, a 2.2% gain. The increase in payrolls stoked apartment leasing, as net absorption registered 11,590 units. Builders completed 9,900 rentals last year, following 11,260 units in 2014. Activity was amplified in the submarkets of Tysons Corner/Fairfax City and Old Town where one out of every four new rentals came online. The metro vacancy rate tightened 40 basis points to 4.8%. Asking rents advanced 1.7% to $1,655 per month. Near-in demand supported operators in the Capitol submarket, where asking rents appreciated 5.6% year over year to $2,174 per month.
2015 REVIEW
Employment gains will enable sturdy apartment demand amid considerable construction. Multifamily builders are scheduled to complete 9,460 apartments. As demand exceeds supply growth for a third-consecutive year, vacancy will improve 30 basis points to 4.5%. Asking rents will advance 1.6% to $1,681 per month. Meanwhile, job creation from expanding D.C.-area employers United Therapeutics, EY, VariQ and Ventech Solutions will help increase metrowide headcounts by 57,700 personnel.
Surging Class A deal flow, particularly in suburban Maryland and Virginia, will help maintain velocity in the D.C. metro this year. Class A cap rates in these areas are gravitating toward 5%, with pricing averaging $290,000 per unit. In the District of Columbia, cap rates are averaging roughly 25 basis points lower due to the dearth of top-tier-assets available. Demand will similarly persist for Class B/C communities marketwide. Aggregate cap rates for this product are averaging 5.75% to start the year, with prices approaching $165,000 per unit. Per-unit pricing, however, can rise by as much as 50% for B-plus product in core submarkets.
2016 PREVIEW
47Data and images pertaining to employment, income, permits, population, rents, single-family housing and vacancy are year-end figures. Absorption, construction and apartment sales figures are full-year totals. Numbers for 2015 are estimated values, while 2016 figures are forecast projections. The sales information represents transactions of apartment properties with 20 or more units and sales price of $1 million or more. Apartment market data criteria and methodologies vary by market.
2015 PERFORMANCE HIGHLIGHTS
2.2% YOY
EMPLOYMENT68,800
1.7% YOY
ASKING RENTS$1,655
-40 BPS YOY
VACANCY4.8%
-12.1% YOY
CONSTRUCTION9,900 Units
-40 BPS YOY
UNEMPLOYMENT RATE4.3%
-40 BPS YOY
CONCESSIONS0.9%
MARKET FACTS
POPULATION6,130,500
MEDIANHOUSEHOLD
INCOME$94,200
HOUSEHOLDS2,299,300
RENTSHARE OFWALLET21.1%
-40,000
0
40,000
80,000
2007 2008 2009 2010 2011 2012 2013 2014 2015* 2016**
ASKING RENTS AND VACANCY
*Estimate; **Forecast | Source: Berkadia, Moody’s Analytics
*Estimate; **Forecast | Source: Berkadia, Axiometrics, Moody’s Analytics
*Estimate; **Forecast | Source: Berkadia, Axiometrics, Moody’s Analytics
$125,000
$150,000
$175,000
$200,000
5.0%
5.5%
6.0%
6.5%
2011 2012 2013 2014 2015*
CAP RATE | PRICE PER UNIT
*Estimate | Source: Berkadia, CoStar Group
0
50
100
150
200
2011 2012 2013 2014 2015*
SALES ACTIVITY INDEX
*Estimate | Source: Berkadia, CoStar Group
0
5,000
10,000
15,000
2012 2013 2014 2015* 2016**
YE 2015 1.1% YOY YE 2015 1.9% YOY YE 2015 1.7% YOY
Ind
ex
Valu
e (
Base
Ye
ar
20
10 =
10
0)
YE 2015 0 BPS YOY
PERMITS AND DELIVERIES
WASHINGTON, D.C.
EMPLOYMENT CHANGE

DISCLAIMER AND SOURCES
SOURCES:
Berkadia Research; Axiometrics, Inc.; California Construction Review; Douglas Elliman; CoStar Group, Inc.; ESRI; LoopNet; Moody’s Analytics, Inc.; MPF Research; National Association of Realtors; Real Capital Analytics; Real Data, Inc.; Tax Foundation; Tetrad; U.S. Bureau of Economic Analysis; U.S. Bureau of Labor Statistics; U.S. Census Bureau; U.S. Department of Commerce; U.S. Department of Housing & Urban Development; U.S. Department of the Treasury. Cover photo courtesy of Paul Body, inside cover photo courtesy of Casey Braunger and disclaimer page photo courtesy of Brian Swartzwelder.
DISCLAIMER:
The information contained within Berkadia research publications have been obtained from sources believed to be reliable; however, we make no guarantee, warranty or representation regarding the accuracy of the information presented. Stated projections, assumptions, opinions and estimates may not represent actual, current or future performance and are subject to revision. The information provided is intended as a supplement for readers and clients. Readers and clients are responsible for conducting a careful, independent investigation of specific markets, properties and trends in order to determine their specific needs and use of the information.
Unless noted otherwise, data and images pertaining to employment, income, permits, population, rents, single-family housing and vacancy are year-end figures. Absorption, construction and apartment sales figures are full-year totals, unless noted otherwise. Current-quarter and current-year numbers are estimated values, while figures for future years are forecast projections. The apartment sales information represents transactions of apartment properties with a sales price of $1 million or more and 20 or more units, unless otherwise indicated. Apartment market data criteria and methodologies vary by market. The list of Berkadia sources includes discontinued data sources that appeared in previously published reports but are no longer used in current publications.

521 Fifth Avenue20th Floor
New York, NY 10175800.446.2226
www.Berkadia.com
CORPORATE HEADQUARTERS

521 Fifth Avenue20th Floor
New York, NY 10175800.446.2226
www.Berkadia.com
CORPORATE HEADQUARTERS
ALBUQUERQUE, NM
AMBLER, PA
ATLANTA, GA
AUSTIN, TX
BAKERSFIELD, CA
BATON ROUGE, LA
BETHESDA, MD
BIRMINGHAM, AL
BOCA RATON, FL
BOSTON, MA
CAMAS, WA
CAPISTRANO BEACH, CA
CHARLESTON, SC
CHATTANOOGA, TN
CHICAGO, IL
CLEARWATER, FL
COLORADO SPRINGS, CO
DALLAS, TX
DENVER, CO
DETROIT, MI
EL SEGUNDO, CA
FRESNO, CA
HOUSTON, TX
IRVINE, CA
JACKSON, MS
JACKSONVILLE, FL
KANSAS CITY, MO
LAS VEGAS, NV
LEAWOOD, KS
LENOX, MA
LOS ANGELES, CA
MARBLEHEAD, MA
MIAMI, FL
MIDVALE, UT
NEW YORK, NY
NEWPORT NEWS, VA
OKLAHOMA CITY, OK
ONTARIO, CA
ORLANDO, FL
PASADENA, CA
PHILADELPHIA, PA
PHOENIX, AZ
PORTLAND, OR
RALEIGH, NC
RICHMOND, VA
SACRAMENTO, CA
SALT LAKE CITY, UT
SAN ANTONIO, TX
SAN DIEGO, CA
SAN FRANCISCO, CA
SCOTTSDALE, AZ
SEATTLE, WA
SHREWSBURY, NJ
ST. LOUIS, MO
TACOMA, WA
TAMPA, FL
TEMECULA, CA
TEMPE, AZ
THE PLAINS, VA
TROY, MI
TUCSON, AZ
TULSA, OK
WAUKESHA, WI
WOODLAND HILLS, CA
HYDERABAD - INDIA
a Berkshire Hathaway and Leucadia National company