forecast assumptions & pro‐formas exhibit h › budget › 11budget › budget › exhibit...
TRANSCRIPT

Forecast Assumptions & Pro‐Formas
Exhibit H


400
450
500
550
600
650
2011
2012
2013
2014
2015
2016
2017
2018
2019
2020
REV
ENUE
SEX
PEND
ITUR
ES
$ MillionsG
ener
al F
und
Fore
cast
FY2
011
– FY
2020
+$12
.1M
($26
.5M
)
Exhibit H-1

GEN
ERA
L FU
ND
FO
REC
AST
Fund
010
1
Fore
cast
Ass
umpt
ions
2011
2012
2013
2014
2015
2016
2017
2018
2019
2020
REV
ENU
ESP
rope
rty T
axes
- C
ount
ywid
e-9
.7%
-5.0
%3.
0%3.
0%5.
0%5.
0%5.
0%5.
0%5.
0%5.
0%P
rope
rty T
axes
- M
STU
-8.5
%-5
.5%
2.5%
2.5%
4.5%
4.5%
4.5%
4.5%
4.5%
4.5%
Hal
f Cen
t Sal
es T
ax3.
0%3.
0%3.
0%3.
0%3.
0%3.
0%3.
0%3.
0%3.
0%R
even
ue S
harin
g2.
0%2.
0%2.
0%2.
0%2.
0%2.
0%2.
0%2.
0%2.
0%C
omm
unic
atio
ns S
vc T
ax0.
5%0.
5%0.
5%0.
5%0.
5%0.
5%0.
5%0.
5%0.
5%B
uild
ing
Per
mits
Gra
nts
(fed/
stat
e/lo
cal)
2.0 %
2.0%
2.0%
2.0%
2.0%
2.0%
2.0%
2.0%
2.0%
Inte
rest
3.0%
4.0%
4.0%
4.0%
4.0%
4.0%
4.0%
4.0%
4.0%
Tax
Col
lect
or E
xces
s Fe
es40
.5%
40.0
%40
.0%
40.0
%40
.0%
40.0
%40
.0%
40.0
%40
.0%
Exc
ess
Fees
- S
herif
f (%
of b
udge
t)1.
0%1.
0%1.
0%1.
0%1.
0%1.
0%1.
0%1.
0%1.
0%E
xces
s Fe
es -
Oth
er (%
of b
udge
t)1.
0%1.
0%1.
0%1.
0%1.
0%1.
0%1.
0%1.
0%1.
0%C
ost R
ecov
ery
-10.
0%3.
0%3.
0%3.
0%3.
0%3.
0%3.
0%3.
0%3.
0%C
harg
es fo
r Ser
vice
s2.
3%1.
9%1.
9%1.
9%2.
0%2.
0%1.
9%1.
9%2.
0%Tr
ansf
ers
from
Oth
er F
unds
0.0%
0.0%
0.0%
0.0%
0.0%
0.0%
0.0%
0.0%
0.0%
Oth
er re
venu
es2.
0%2.
0%2.
0%2.
0%2.
0%2.
0%2.
0%2.
0%2.
0%
EXPE
ND
ITU
RES
Per
sona
l Ser
vice
s1.
7 %3.
9%3.
9%3.
9%3.
9%3.
9%3.
9%3.
9%3.
9%O
pera
ting
Exp
ense
s2.
3%1.
9%1.
9%1.
9%2.
0%2.
0%1.
9%1.
9%2.
0%B
TS /I
T C
ost A
llloc
atio
n (O
pExp
)3.
0%3.
0%3.
0%3.
0%3.
0%3.
0%3.
0%3.
0%3.
0%C
apita
l Out
lay
2.3%
1.9%
1.9%
1.9%
2.0%
2.0%
1.9%
1.9%
2.0%
Gra
nts
& A
ids
2.3%
1.9%
1.9%
1.9%
2.0%
2.0%
1.9%
1.9%
2.0%
TIF
paym
ents
to c
ities
(G&
A)
0.0%
5.0%
5.0%
7.0%
7.0%
7.0%
7.0%
7.0%
7.0%
She
riff
1.7%
3.9%
4.0%
4.0%
4.0%
4.0%
4.0%
4.0%
4.0%
Tax
Col
lect
or5.
0%5.
0%5.
0%5.
0%5.
0%5.
0%5.
0%5.
0%5.
0%O
ther
Con
stitu
tiona
ls1.
7%3.
9%3.
0%3.
0%3.
0%3.
0%3.
0%3.
0%3.
0%Tr
ansf
ers
to C
IP0.
0%0.
0%0.
0%0.
0%0.
0%0.
0%0.
0%0.
0%0.
0%O
ther
Tra
nsfe
rs0.
0%0.
0%0.
0%0.
0%0.
0%0.
0%0.
0%0.
0%0.
0%D
ebt S
ervi
ce0.
0%0.
0%0.
0%0.
0%0.
0%0.
0%0.
0%0.
0%0.
0%Pr
ojec
ted
Econ
omic
Con
ditio
ns /
Indi
cato
rs:
Con
sum
er P
rice
Inde
x, %
cha
nge
1.6%
2.3%
1.9%
1.9%
1.9%
2.0%
2.0%
1.9%
1.9%
2.0%
FL P
er C
apita
Per
sona
l Inc
ome
Gro
wth
1.5%
3.0%
3.7%
2.7%
2.5%
2.3%
2.3%
2.2%
2.4%
2.3%
Est
imat
ed N
ew C
onst
ruct
ion
% o
f tax
bas
e0.
2%0.
5%1.
0%1.
0%1.
0%1.
0%1.
0%1.
0%1.
0%1.
0%
Exhibit H-2

GEN
ERA
L FU
ND
FO
REC
AST
Fund
010
1
(in $
mill
ions
)A
ctua
lB
udge
tPr
ojec
ted
Estim
ated
Estim
ated
Estim
ated
Estim
ated
Estim
ated
Estim
ated
Estim
ated
Estim
ated
Estim
ated
Estim
ated
2009
2010
2010
2011
2012
2013
2014
2015
2016
2017
2018
2019
2020
BEG
INN
ING
FU
ND
BA
LAN
CE
165.
9
119.
1
138.
0
12
2.7
94.1
76
.2
55.6
29
.5
3.9
(22.
1)
(45.
3)
(66.
2)
(84.
6)
REV
ENU
ESba
ck to
FY1
0 le
vel
back
to F
Y09
leve
lP
rope
rty T
axes
-Cou
ntyw
ide
340.
4
296.
1
299.
2
266.
8
253.
5
261.
1
268.
9
282.
4
296.
5
31
1.3
32
6.9
34
3.2
360.
4
Pro
perty
Tax
es -
MS
TU36
.9
32
.5
32
.9
29
.6
28
.0
28
.7
29
.4
30
.7
32
.1
33.6
35.1
36.7
38
.3
H
alf C
ent S
ales
Tax
34.4
32.4
33.5
33.4
34.4
35.4
36.5
37.6
38.7
39.9
41.1
42.3
43.6
Rev
enue
Sha
ring
13.4
12.8
12.5
12.1
12.3
12.5
12.8
13.1
13.4
13.7
14.0
14.3
14.6
Com
mun
icat
ions
Svc
Tax
11.8
11.5
11.1
11.1
11.2
11.3
11.4
11.5
11.6
11.7
11.8
11.9
12.0
Gra
nts
(fed/
stat
e/lo
cal)
8.7
6.0
18.2
10.5
10.7
10.9
11.1
11.3
11.5
11.7
11.9
12.1
12.3
Inte
rest
5.7
6.3
3.2
7.1
2.8
3.0
2.2
1.2
0.2
-
-
-
-
Tax
Col
lect
or E
xces
s Fe
es12
.1
9.
0
9.
1
8.
9
5.
7
5.
8
6.
0
6.
3
6.
6
6.
9
7.
2
7.
6
8.
0
E
xces
s Fe
es -
She
riff
5.4
2.3
2.3
2.7
2.2
2.3
2.4
2.5
2.6
2.7
2.8
2.9
3.1
Exc
ess
Fees
- O
ther
2.5
0.2
0.4
0.1
0.3
0.3
0.3
0.3
0.3
0.3
0.3
0.3
0.3
Cos
t Rec
over
y28
.9
28
.4
27
.6
20
.9
18
.8
19
.4
20
.0
20
.6
21
.2
21
.8
22
.5
23
.2
23
.9
C
harg
es fo
r Ser
vice
s34
.9
38
.6
38
.0
36
.7
37
.5
38
.3
39
.0
39
.7
40
.5
41
.3
42
.1
42
.9
43
.8
Tran
sfer
s fro
m O
ther
Fun
ds3.
7
3.
0
3.
6
1.
3
1.
3
1.
3
1.
3
1.
3
1.
3
1.
3
1.
3
1.
3
1.
3
O
ther
reve
nues
11.5
13.2
12.8
16.1
16.4
16.8
17.1
17.4
17.8
18.1
18.5
18.9
19.2
Adj
ust P
rope
rty T
axes
to
96%
3.1
2.7
2.7
2.8
3.0
3.1
3.3
3.4
3.6
3.8
Adj
ust M
ajor
Rev
enue
to 9
8%1.
1
1.
8
1.
9
1.
9
2.
0
2.
0
2.
1
2.
1
2.
2
2.
2
A
djus
t Oth
er R
even
ue to
97%
1.6
2.0
2.1
2.1
2.1
2.1
2.2
2.2
2.3
2.4
TOTA
L R
EVEN
UES
552.
9
492.
3
504.
4
46
3.1
441.
7
45
3.8
465.
2
48
3.0
50
1.5
521.
9
54
3.3
565.
7
58
9.1
% v
s pr
ior y
ear
-11%
-11%
-9%
-8%
-5%
3%3%
4%4%
4%4%
4%4%
TOTA
L R
ESO
UR
CES
718.
8
611.
4
642.
4
58
5.8
535.
8
53
0.0
520.
9
51
2.5
50
5.4
499.
8
49
8.1
499.
6
50
4.5
EXPE
ND
ITU
RES
Per
sona
l Ser
vice
s95
.6
80
.5
82
.8
72
.7
73
.9
76
.8
79
.8
82
.9
86
.1
89
.5
93
.0
96
.6
10
0.4
O
pera
ting
Exp
ense
s *
98.1
88.4
100.
9
79.3
81.1
82.6
84.2
85.8
87.5
89.3
91.0
92.7
94.6
BTS
/IT
Cos
t Alll
ocat
ion
(OpE
xp)
20.3
14.2
14.2
14.8
15.2
15.7
16.2
16.7
17.2
17.7
18.2
18.7
19.3
Cap
ital O
utla
y1.
1
0.
9
0.
9
0.
5
0.
5
0.
5
0.
5
0.
5
0.
6
0.
6
0.
6
0.
6
0.
6
G
rant
s &
Aid
s21
.6
15
.8
16
.8
13
.4
13
.7
14
.0
14
.2
14
.5
14
.8
15
.1
15
.4
15
.7
16
.0
TI
F pa
ymen
ts to
citi
es (G
&A
)8.
7
8.
0
7.
5
6.
7
6.
7
7.
0
7.
4
7.
9
8.
5
9.
0
9.
7
10
.4
11
.1
S
herif
f27
2.2
23
8.4
24
7.5
22
0.5
22
4.2
23
2.9
24
2.3
25
2.0
26
2.0
27
2.5
28
3.4
29
4.7
30
6.5
Ta
x C
olle
ctor
19.9
17.5
16.9
16.4
14.1
14.5
14.9
15.7
16.4
17.2
18.1
19.0
19.9
Oth
er C
onst
itutio
nals
28.5
25.3
25.1
24.4
25.8
25.8
26.5
27.3
29.2
29.0
29.9
30.8
32.7
Tran
sfer
s to
CIP
4.8
-
1.
4
-
-
-
-
-
-
-
-
-
-
O
ther
Tra
nsfe
rs1.
4
2.
8
3.
6
2.
4
2.
4
2.
4
2.
4
2.
4
2.
4
2.
4
2.
4
2.
4
2.
4
D
ebt S
ervi
ce0.
1
0.
3
0.
1
0.
3
0.
3
0.
3
0.
3
0.
3
0.
3
0.
3
0.
3
0.
3
0.
3
se
rvic
e le
vel s
tabi
lizat
ion
acct
-FY1
07.
2
7.
2
se
rvic
e le
vel s
tabi
lizat
ion
acct
-FY1
112
.1
-
-
-
-
-
-
-
-
-
no
n-re
curr
ing
expe
nses
FY1
1&FY
1216
.0
21
.2
-
-
-
-
-
-
-
-
-
E
xpen
ditu
re L
apse
1%
**
(2.2
)
(1
.8)
(1.9
)
(1
.9)
(2.0
)
(2
.1)
(2.1
)
(2
.2)
(2.2
)
(2
.3)
Prio
r Yea
r Fun
ds R
eapp
ropr
iatio
nsP
oten
tial I
ssue
s:a)
Hou
sing
Tru
st F
und
(G&
A)
4.2
-
-
-
-
-
-
-
-
-
-
-
-
b) O
PEB
Lia
bilit
y Fu
ndin
g4.
0
2.
0
2.
0
2.
0
2.
0
2.
0
2.
0
2.
0
2.
0
2.
0
2.
0
2.
0
2.
0
c)
BTS
non
-rec
urrin
g pr
ojec
t cos
ts-
-
-
-
-
-
-
-
-
-
d)
CIP
Ope
ratin
g Im
pact
s (c
umul
ativ
e )1.
5
1.
7
2.
6
2.
6
2.
6
2.
6
2.
6
2.
6
2.
6
TO
TAL
EXPE
ND
ITU
RES
580.
5
517.
3
519.
7
49
1.7
459.
6
47
4.4
491.
4
50
8.6
52
7.5
545.
1
56
4.3
584.
2
60
6.0
% v
s pr
ior y
ear
-5%
-11%
-10%
-5%
-7%
3%4%
3%4%
3%4%
4%4%
END
ING
FU
ND
BA
LAN
CE
138.
3
94.1
122.
7
94
.1
76.2
55
.6
29.5
3.
9
(2
2.1)
(4
5.3)
(6
6.2)
(8
4.6)
(1
01.5
)
A
SSU
MIN
G N
O A
CTI
ON
TA
KEN
TO
RES
OLV
E SH
OR
TFA
LLS
End
ing
bala
nce
as %
of R
esou
rces
19%
15%
19%
16%
14%
10%
6%1%
-4%
-9%
-13%
-17%
-20%
TOTA
L R
EQU
IREM
ENTS
718.
8
611.
4
642.
4
58
5.8
535.
8
53
0.0
520.
9
51
2.5
50
5.4
499.
8
49
8.1
499.
6
50
4.5
REV
ENU
E m
inus
EXP
END
ITU
RES
(27.
6)
(25.
0)
(15.
3)
(28.
6)
(17.
9)
(20.
6)
(26.
2)
(25.
6)
(26.
0)
(23.
2)
(20.
9)
(18.
4)
(16.
9)
(NO
T cu
mul
ativ
e)no
te: n
on-r
ecur
ring
expe
nditu
res
16.0
16.0
40
.5
-
-
-
-
-
-
-
-
-
ne
t rec
urrin
g re
v- e
xp(9
.0)
0.
7
11.9
(17.
9)
(2
0.6)
(26.
2)
(2
5.6)
(26.
0)
(2
3.2)
(20.
9)
(1
8.4)
(16.
9)
FOR
ECA
ST
Exhibit H-3

Exhibit H-4

Tour
ist D
evel
opm
ent C
ounc
il Fu
nd F
orec
ast F
Y201
1 - F
Y202
0
10,0
0012
,000
14,0
0016
,000
18,0
0020
,000
22,0
0024
,000
26,0
0028
,000
30,0
0032
,000
34,0
00
2011
2012
2013
2014
2015
2016
2017
2018
2019
2020
Fisc
al Y
ears
Dollars (000's)
RE
VE
NU
ES
EXP
EN
DIT
UR
ES
Exhibit H-5

TOU
RIS
T D
EVEL
OPM
ENT
CO
UN
CIL
FU
ND
FO
REC
AST
Fund
024
0
Fore
cast
Ass
umpt
ions
2011
2012
2013
2014
2015
2016
2017
2018
2019
2020
REV
ENU
ESTo
uris
t Dev
elop
men
t Tax
es1.
5%2.
5%2.
5%3.
0%3.
0%3.
5%3.
5%3.
5%3.
5%3.
5%In
tere
st2.
0%3.
0%4.
0%4.
0%4.
0%4.
0%4.
0%4.
0%4.
0%4.
0%O
ther
reve
nues
(Int
- TC
)2.
0%2.
0%2.
0%2.
0%2.
0%2.
0%2.
0%2.
0%2.
0%2.
0%
EXPE
ND
ITU
RES
Per
sona
l Ser
vice
s1.
7%3.
9%3.
9%3.
9%3.
9%3.
9%3.
9%3.
9%3.
9%3.
9%O
pera
ting
Exp
ense
s1.
6%2.
3%1.
9%1.
9%1.
9%2.
0%2.
0%1.
9%1.
9%2.
0%A
dver
tisin
g E
xpen
se0.
0%0.
0%0.
0%3.
0%3.
0%3.
0%3.
0%3.
0%3.
0%3.
0%C
apita
l Out
lay
1.6%
2.3%
1.9%
1.9%
1.9%
2.0%
2.0%
1.9%
1.9%
2.0%
Proj
ecte
d Ec
onom
ic C
ondi
tions
/ In
dica
tors
:C
onsu
mer
Pric
e In
dex,
% c
hang
e1.
6%2.
3%1.
9%1.
9%1.
9%2.
0%2.
0%1.
9%1.
9%2.
0%FL
Per
Cap
ita P
erso
nal I
ncom
e G
row
th1.
5%3.
0%3.
7%2.
7%2.
5%2.
3%2.
3%2.
2%2.
4%2.
3%E
stim
ated
New
Con
stru
ctio
n %
of t
ax b
ase
0.2%
0.5%
1.0%
1.0%
1.0%
1.0%
1.0%
1.0%
1.0%
1.0%
Exhibit H-6

TOU
RIS
T D
EVEL
OPM
ENT
CO
UN
CIL
FU
ND
FO
REC
AST
Fund
024
0
@95
%@
100%
(in $
thou
sand
s)A
ctua
lB
udge
tPr
ojec
ted
Estim
ated
Estim
ated
Estim
ated
Estim
ated
Estim
ated
Estim
ated
Estim
ated
Estim
ated
Estim
ated
Estim
ated
2009
2010
2010
2011
2012
2013
2014
2015
2016
2017
2018
2019
2020
BEG
INN
ING
FU
ND
BA
LAN
CE
4,53
3.4
2,22
0.6
3,08
6.5
2,17
9.7
1,53
0.8
1,28
2.3
1,26
2.4
1,34
7.2
1,54
4.8
7,62
0.0
14,3
48.2
21
,779
.0
29,9
58.9
REV
ENU
ESTo
uris
t Dev
elop
men
t Tax
es24
,548
.2
22,9
07.7
22
,907
.7
23,2
51.3
23
,832
.6
24,4
28.4
25
,161
.3
25,9
16.1
26
,823
.2
27,7
62.0
28
,733
.6
29,7
39.3
30
,780
.2
Inte
rest
65.3
17.7
17.7
43.6
45.9
51.3
50.5
53.9
61.8
304.
8
573.
9
871.
2
1,19
8.4
Oth
er re
venu
es (I
nt -
TC)
2.7
7.
2
7.2
7.
3
7.5
7.
6
7.8
7.
9
8.1
8.
3
8.4
8.
6
8.8
A
djus
t Rev
enue
to 9
7%0.
5
1.1
1.
1
1.2
1.
2
1.3
1.
5
6.6
12
.3
18
.5
25
.4
R
EVEN
UES
24,6
16.2
22
,932
.6
22,9
33.1
23
,303
.3
23,8
87.1
24
,488
.6
25,2
20.8
25
,979
.2
26,8
94.5
28
,081
.6
29,3
28.3
30
,637
.6
32,0
12.7
%
vs
prio
r yea
r-5
%-7
%-7
%2%
3%3%
3%3%
4%4%
4%4%
4%
TOTA
L R
EVEN
UES
29,1
49.6
25
,153
.2
26,0
19.6
25
,483
.1
25,4
18.0
25
,770
.9
26,4
83.2
27
,326
.5
28,4
39.3
35
,701
.6
43,6
76.5
52
,416
.6
61,9
71.6
EXPE
ND
ITU
RES
Per
sona
l Ser
vice
s2,
860.
8
2,
800.
2
2,
800.
2
2,
847.
8
2,
958.
9
3,
074.
3
3,
194.
2
3,
318.
7
3,
448.
2
3,
582.
6
3,
722.
4
3,
867.
5
4,
018.
4
O
pera
ting
Exp
ense
s 6,
233.
1
5,
120.
4
5,
120.
4
5,
202.
3
5,
322.
0
5,
423.
1
5,
526.
1
5,
631.
1
5,
743.
8
5,
858.
6
5,
969.
9
6,
083.
4
6,
205.
0
Adv
ertis
ing
Expe
nse
7,18
4.4
7,41
6.4
7,41
6.4
7,41
6.4
7,21
6.4
7,21
6.4
7,43
2.9
7,65
5.9
7,88
5.6
8,12
2.1
8,36
5.8
8,61
6.8
8,87
5.3
Ope
ratin
g - o
ne-ti
me*
-
Cap
ital O
utla
y4.
2
4.3
4.
3
4.4
4.
5
4.6
4.
6
4.7
4.
8
4.9
5.
0
5.1
5.
2
Cap
ital -
one
-tim
e*-
Tr
ansf
er -
Tax
Col
lect
or72
7.6
68
7.2
68
7.2
69
7.5
71
5.0
73
2.9
75
4.8
77
7.5
80
4.7
83
2.9
86
2.0
89
2.2
92
3.4
Tr
ansf
er -
Bea
ch R
enou
rishm
ent
2,69
2.3
1,89
7.8
1,89
7.8
1,89
7.8
1,91
6.8
1,93
5.9
1,95
5.3
1,97
4.9
1,99
4.6
2,01
4.6
2,03
4.7
2,05
5.0
2,07
5.6
Tran
sfer
- C
ultu
ral A
ffairs
750.
0
350.
0
350.
0
350.
0
350.
0
350.
0
350.
0
350.
0
350.
0
350.
0
350.
0
350.
0
350.
0
Deb
t Ser
vice
5,61
0.7
5,56
3.6
5,56
3.6
5,53
6.0
5,65
2.2
5,77
1.4
5,91
8.0
6,06
8.9
587.
7
587.
7
587.
7
587.
7
587.
7
Non
-rec
urrin
g ex
pend
iture
s-
-
-
-
-
-
-
-
-
-
EX
PEN
DIT
UR
ES26
,063
.1
23,8
39.9
23
,839
.9
23,9
52.2
24
,135
.7
24,5
08.5
25
,135
.9
25,7
81.7
20
,819
.3
21,3
53.4
21
,897
.5
22,4
57.7
23
,040
.6
% v
s pr
ior y
ear
4%-9
%-9
%0%
1%2%
3%3%
-19%
3%3%
3%3%
END
ING
FU
ND
BA
LAN
CE
3,08
6.5
1,31
3.3
2,17
9.7
1,53
0.8
1,28
2.3
1,26
2.4
1,34
7.2
1,54
4.8
7,62
0.0
14,3
48.2
21
,779
.0
29,9
58.9
38
,931
.0
End
ing
bala
nce
as %
of R
esou
rces
11%
5%8%
6%5%
5%5%
6%27
%40
%50
%57
%63
%
TOTA
L R
EQU
IREM
ENTS
29,1
49.6
25
,153
.2
26,0
19.6
25
,483
.1
25,4
18.0
25
,770
.9
26,4
83.2
27
,326
.5
28,4
39.3
35
,701
.6
43,6
76.5
52
,416
.6
61,9
71.6
REV
ENU
E m
inus
EXP
END
ITU
RES
(1,4
46.9
)
(9
07.3
)
(906
.8)
(6
48.9
)
(248
.6)
(1
9.9)
84.9
197.
5
6,07
5.2
6,72
8.2
7,43
0.8
8,17
9.9
8,97
2.2
(NO
T cu
mul
ativ
e)no
te: n
on-r
ecur
ring
expe
nditu
res
-
-
-
-
-
-
-
-
-
-
-
-
-
ne
t rec
urrin
g re
v- e
xp(1
,446
.9)
(907
.3)
(9
06.8
)
(648
.9)
(2
48.6
)
(19.
9)
84
.9
19
7.5
6,07
5.2
6,
728.
2
7,43
0.8
8,
179.
9
8,97
2.2
FOR
ECA
ST
Exhibit H-7

Exhibit H-8

Penn
y fo
r Pin
ella
s Fu
nd F
orec
ast F
Y201
1-FY
2020
60,0
0065
,000
70,0
0075
,000
80,0
0085
,000
90,0
0095
,000
100,
000
105,
000
2011
2012
2013
2014
2015
2016
2017
2018
2019
2020
Dollars (000's)
RE
VE
NU
ES
EX
PE
ND
ITU
RE
S
Exhibit H-9

PEN
NY
FOR
PIN
ELLA
S IN
FRA
STR
UC
TUR
E TA
X FU
ND
FO
REC
AST
Fund
040
8
Fore
cast
Ass
umpt
ions
2011
2012
2013
2014
2015
2016
2017
2018
2019
2020
REV
ENU
ESIn
frast
ruct
ure
Sal
es T
ax4.
0%4.
0%4.
0%3.
0%3.
0%2.
0%2.
0%2.
0%2.
0%In
tere
st3.
0%4.
0%4.
0%4.
0%4.
0%4.
0%4.
0%4.
0%4.
0%O
ther
reve
nues
2.0%
2.0%
2.0%
2.0%
2.0%
2.0%
2.0%
2.0%
2.0%
EXPE
ND
ITU
RES
n/a
Proj
ecte
d Ec
onom
ic C
ondi
tions
/ In
dica
tors
:C
onsu
mer
Pric
e In
dex,
% c
hang
e2.
3%1.
9%1.
9%1.
9%2.
0%2.
0%1.
9%1.
9%2.
0%FL
Per
Cap
ita P
erso
nal I
ncom
e G
row
th3.
0%3.
7%2.
7%2.
5%2.
3%2.
3%2.
2%2.
4%2.
3%E
stim
ated
New
Con
stru
ctio
n %
of t
ax b
ase
0.5%
1.0%
1.0%
1.0%
1.0%
1.0%
1.0%
1.0%
1.0%
Exhibit H-10

PEN
NY
FOR
PIN
ELLA
S IN
FRA
STR
UC
TUR
E TA
X FU
ND
FO
REC
AST
Fund
040
8
(in $
thou
sand
s)A
ctua
lB
udge
tPr
ojec
ted
Estim
ated
Estim
ated
Estim
ated
Estim
ated
Estim
ated
Estim
ated
Estim
ated
Estim
ated
Estim
ated
Estim
ated
2009
2010
2010
2011
2012
2013
2014
2015
2016
2017
2018
2019
2020
BEG
INN
ING
FU
ND
BA
LAN
CE
12,4
80.1
17
,427
.0
5,36
6.2
2,74
0.7
3,59
3.5
4,53
7.7
5,71
1.3
6,21
2.8
7,29
2.9
8,05
2.4
8,65
2.3
9,12
2.4
10,4
94.1
REV
ENU
ES66
,873
.7
70,8
14.2
70
,320
.0
75,8
01.0
78
,833
.0
81,9
86.4
85
,265
.8
87,8
23.8
90
,458
.5
92,2
67.7
94
,113
.0
95,9
95.3
97
,915
.2
73.8
245.
9
35.3
51.8
107.
8
181.
5
228.
5
248.
5
291.
7
322.
1
346.
1
364.
9
419.
8
-
-
-
-
-
-
-
-
-
-
-
-
-
A
djus
t Oth
er R
even
ue to
98%
3.4
5.
7
7.2
7.
8
9.2
10
.2
10
.9
11
.5
13
.3
TO
TAL
REV
ENU
ES66
,947
.5
71,0
60.1
70
,355
.3
75,8
52.8
78
,944
.2
82,1
73.6
85
,501
.5
88,0
80.1
90
,759
.4
92,5
99.9
94
,470
.0
96,3
71.7
98
,348
.2
-13%
6%5%
8%4%
4%4%
3%3%
2%2%
2%2%
TOTA
L R
ESO
UR
CES
79,4
27.6
88
,487
.1
75,7
21.5
78
,593
.5
82,5
37.7
86
,711
.3
91,2
12.8
94
,292
.9
98,0
52.4
10
0,65
2.3
10
3,12
2.4
10
5,49
4.1
10
8,84
2.3
EXPE
ND
ITU
RES
51,0
00.0
55
,000
.0
50,0
00.0
75
,000
.0
78,0
00.0
81
,000
.0
85,0
00.0
87
,000
.0
90,0
00.0
92
,000
.0
94,0
00.0
95
,000
.0
97,0
00.0
23
,061
.4
23,1
21.8
22
,980
.8
-
-
-
-
-
-
-
-
-
-
-
-
-
-
-
-
-
-
-
-
-
-
-
E
xpen
ditu
re L
apse
1%
**
-
-
-
-
-
-
-
-
-
-
-
FY
10 S
uppl
emen
tal A
ppro
pria
tions
-
P
oten
tial I
ssue
s:-
-
-
-
-
-
-
-
-
-
-
-
-
-
-
-
-
-
-
-
-
-
TO
TAL
EXPE
ND
ITU
RES
74,0
61.4
78
,121
.8
72,9
80.8
75
,000
.0
78,0
00.0
81
,000
.0
85,0
00.0
87
,000
.0
90,0
00.0
92
,000
.0
94,0
00.0
95
,000
.0
97,0
00.0
-1
1%5%
-1%
3%4%
4%5%
2%3%
2%2%
1%2%
END
ING
FU
ND
BA
LAN
CE
5,36
6.2
10,3
65.3
2,
740.
7
3,
593.
5
4,
537.
7
5,
711.
3
6,
212.
8
7,
292.
9
8,
052.
4
8,
652.
3
9,
122.
4
10
,494
.1
11,8
42.3
A
SSU
MIN
G N
O A
CTI
ON
TA
KEN
TO
RES
OLV
E SH
OR
TFA
LLS
End
ing
bala
nce
as %
of R
esou
rces
7%12
%4%
5%5%
7%7%
8%8%
9%9%
10%
11%
TOTA
L R
EQU
IREM
ENTS
79,4
27.6
88
,487
.1
75,7
21.5
78
,593
.5
82,5
37.7
86
,711
.3
91,2
12.8
94
,292
.9
98,0
52.4
10
0,65
2.3
10
3,12
2.4
10
5,49
4.1
10
8,84
2.3
REV
ENU
E m
inus
EXP
END
ITU
RES
(7,1
13.9
)
(7
,061
.7)
(2,6
25.5
)
85
2.8
94
4.2
1,
173.
6
50
1.5
1,
080.
1
75
9.4
59
9.9
47
0.0
1,
371.
7
1,
348.
2
note
: non
-rec
urrin
g ex
pend
iture
s-
-
-
-
-
-
-
-
-
-
-
-
-
net r
ecur
ring
rev-
exp
(7,1
13.9
)
(7
,061
.7)
(2,6
25.5
)
85
2.8
944.
2
1,
173.
6
501.
5
1,
080.
1
759.
4
59
9.9
470.
0
1,
371.
7
1,34
8.2
* O
pera
ting
Exp
ense
s ne
t of F
ull C
ost A
lloca
tion
** E
xpen
ditu
re la
pse
is c
alcu
late
d on
Per
sona
l Ser
vice
s, O
pera
ting
Exp
ense
s, C
apita
l Out
lay,
and
Gra
nts
& A
ids
only
.N
ote:
Ass
umes
ext
ensi
on o
f Pen
ny fo
r Pin
ella
s th
roug
h th
e fu
ll fis
cal y
ear 2
020
FOR
ECA
ST
Exhibit H-11

Exhibit H-12

Exhibit H-13

TRA
NSP
OR
TATI
ON
TR
UST
FU
ND
FO
REC
AST
Fund
020
1
Fore
cast
Ass
umpt
ions
2011
2012
2013
2014
2015
2016
2017
2018
2019
2020
REV
ENU
ESN
inth
Cen
t Gas
Tax
1.0%
0.0%
0.0%
0.0%
0.0%
0.0%
0.0%
0.0%
0.0%
0.0%
Sta
te S
hare
d G
as T
axes
1.0%
0.0%
0.0%
0.0%
0.0%
0.0%
0.0%
0.0%
0.0%
0.0%
Loca
l Opt
ion
Gas
Tax
es1.
0%0.
0%0.
0%0.
0%0.
0%0.
0%0.
0%0.
0%0.
0%0.
0%In
tere
st2.
0%3.
0%4.
0%4.
0%4.
0%4.
0%4.
0%4.
0%4.
0%4.
0%O
ther
reve
nues
2.0%
2.0%
2.0%
2.0%
2.0%
2.0%
2.0%
2.0%
2.0%
2.0%
EXPE
ND
ITU
RES
Per
sona
l Ser
vice
s1.
7%1.
7%3.
9%3.
9%3.
9%3.
9%3.
9%3.
9%3.
9%3.
9%O
pera
ting
Exp
ense
s1.
6%2.
3%1.
9%1.
9%1.
9%2.
0%2.
0%1.
9%1.
9%2.
0%C
apita
l Out
lay
1.6%
2.3%
1.9%
1.9%
1.9%
2.0%
2.0%
1.9%
1.9%
2.0%
Gra
nts
& A
ids
1.6%
2.3%
1.9%
1.9%
1.9%
2.0%
2.0%
1.9%
1.9%
2.0%
Tran
sfer
s0.
0%0.
0%0.
0%0.
0%0.
0%0.
0%0.
0%0.
0%0.
0%0.
0%
Proj
ecte
d Ec
onom
ic C
ondi
tions
/ In
dica
tors
:C
onsu
mer
Pric
e In
dex,
% c
hang
e1.
6%2.
3%1.
9%1.
9%1.
9%2.
0%2.
0%1.
9%1.
9%2.
0%FL
Per
Cap
ita P
erso
nal I
ncom
e G
row
th1.
5%3.
0%3.
7%2.
7%2.
5%2.
3%2.
3%2.
2%2.
4%2.
3%E
stim
ated
New
Con
stru
ctio
n %
of t
ax b
ase
0.2%
0.5%
1.0%
1.0%
1.0%
1.0%
1.0%
1.0%
1.0%
1.0%
Exhibit H-14

TRA
NSP
OR
TATI
ON
TR
UST
FU
ND
FO
REC
AST
Fund
020
1
(in $
thou
sand
s)A
ctua
lB
udge
tPr
ojec
ted
Estim
ated
Estim
ated
Estim
ated
Estim
ated
Estim
ated
Estim
ated
Estim
ated
Estim
ated
Estim
ated
Estim
ated
2009
2010
2010
2011
2012
2013
2014
2015
2016
2017
2018
2019
2020
BEG
INN
ING
FU
ND
BA
LAN
CE
6,85
1.4
3,32
2.6
9,49
5.2
9,49
5.6
10,5
56.4
11
,369
.8
11,5
75.8
11
,014
.6
9,62
7.6
7,34
1.6
4,09
0.2
(184
.8)
(5,5
49.0
)
REV
ENU
ESN
inth
Cen
t Gas
Tax
3,55
0.9
3,85
4.8
3,72
4.9
3,76
2.2
3,76
2.2
3,76
2.2
3,76
2.2
3,76
2.2
3,76
2.2
3,76
2.2
3,76
2.2
3,76
2.2
3,76
2.2
Sta
te S
hare
d G
as T
axes
9,97
0.5
10,1
78.9
10
,433
.5
10,5
34.6
10
,534
.6
10,5
34.6
10
,534
.6
10,5
34.6
10
,534
.6
10,5
34.6
10
,534
.6
10,5
34.6
10
,534
.6
Inte
rest
71.7
95.0
50.0
100.
0
316.
7
454.
8
463.
0
440.
6
385.
1
293.
7
163.
6
-
-
Tran
sfer
s an
d LO
GT
15,0
81.9
11
,000
.0
13,5
55.0
12
,661
.3
12,6
61.3
12
,661
.3
12,6
61.3
12
,661
.3
12,6
61.3
12
,661
.3
12,6
61.3
12
,661
.3
12,6
61.3
O
ther
reve
nues
2,83
9.4
2,13
3.8
1,60
0.4
1,68
2.3
1,71
5.9
1,75
0.3
1,78
5.3
1,82
1.0
1,85
7.4
1,89
4.5
1,93
2.4
1,97
1.1
2,01
0.5
Adj
ust O
ther
Rev
enue
to 9
8%45
6.1
46
4.0
46
9.5
47
0.8
47
1.2
47
0.6
46
8.9
46
6.0
46
2.1
46
3.3
TO
TAL
REV
ENU
ES31
,514
.4
27,2
62.5
29
,363
.8
29,1
96.5
29
,454
.8
29,6
32.6
29
,677
.2
29,6
90.9
29
,671
.2
29,6
15.2
29
,520
.2
29,3
91.3
29
,431
.9
% v
s pr
ior y
ear
9%-1
3%-7
%-1
%1%
1%0%
0%0%
0%0%
0%0%
TOTA
L R
ESO
UR
CES
38,3
65.8
30
,585
.1
38,8
59.0
38
,692
.1
40,0
11.1
41
,002
.4
41,2
53.1
40
,705
.5
39,2
98.8
36
,956
.8
33,6
10.4
29
,206
.5
23,8
82.9
EXPE
ND
ITU
RES
Per
sona
l Ser
vice
s14
,352
.6
13,7
30.4
14
,346
.0
13,5
68.0
13
,798
.7
14,3
36.8
14
,895
.9
15,4
76.9
16
,080
.5
16,7
07.6
17
,359
.2
18,0
36.2
18
,739
.6
Ope
ratin
g E
xpen
ses
*9,
005.
4
10
,613
.4
9,53
0.1
10,5
16.8
10
,758
.7
10,9
63.1
11
,171
.4
11,3
83.7
11
,611
.3
11,8
43.6
12
,068
.6
12,2
97.9
12
,543
.8
Cap
ital O
utla
y24
0.4
15
0.6
12
5.4
14
2.0
14
5.3
14
8.0
15
0.8
15
3.7
15
6.8
15
9.9
16
3.0
16
6.0
16
9.4
G
rant
s &
Aid
s-
-
-
-
-
-
-
-
-
-
-
-
-
Full
Cos
t Allo
catio
n2,
809.
9
2,
361.
9
2,
361.
9
1,
151.
2
1,
185.
7
1,
233.
2
1,
282.
5
1,
333.
8
1,
387.
1
1,
442.
6
1,
500.
3
1,
560.
3
1,
622.
8
Tr
ansf
ers
to o
ther
Fun
ds3,
000.
0
3,
000.
0
3,
000.
0
3,
000.
0
3,
000.
0
3,
000.
0
3,
000.
0
3,
000.
0
3,
000.
0
3,
000.
0
3,
000.
0
3,
000.
0
3,
000.
0
D
ebt S
ervi
ce9.
5
10.3
-
-
-
-
-
-
-
-
-
-
-
N
on-r
ecur
ring
expe
nditu
res
-
-
-
-
-
-
-
-
-
-
-
-
-
E
xpen
ditu
re L
apse
1%
**
(242
.3)
(247
.0)
(254
.5)
(262
.2)
(270
.1)
(278
.5)
(287
.1)
(295
.9)
(305
.0)
(314
.5)
TOTA
L EX
PEN
DIT
UR
ES28
,870
.6
29,8
66.6
29
,363
.4
28,1
35.7
28
,641
.3
29,4
26.6
30
,238
.5
31,0
77.9
31
,957
.2
32,8
66.6
33
,795
.2
34,7
55.5
35
,761
.1
% v
s pr
ior y
ear
1%3%
2%-4
%2%
3%3%
3%3%
3%3%
3%3%
END
ING
FU
ND
BA
LAN
CE
9,49
5.2
718.
5
9,49
5.6
10,5
56.4
11
,369
.8
11,5
75.8
11
,014
.6
9,62
7.6
7,34
1.6
4,09
0.2
(184
.8)
(5,5
49.0
)
(1
1,87
8.2)
A
SSU
MIN
G N
O A
CTI
ON
TA
KEN
TO
RES
OLV
E SH
OR
TFA
LLS
End
ing
bala
nce
as %
of R
esou
rces
25%
2%24
%27
%28
%28
%27
%24
%19
%11
%-1
%-1
9%-5
0%
TOTA
L R
EQU
IREM
ENTS
38,3
65.8
30
,585
.1
38,8
59.0
38
,692
.1
40,0
11.1
41
,002
.4
41,2
53.1
40
,705
.5
39,2
98.8
36
,956
.8
33,6
10.4
29
,206
.5
23,8
82.9
REV
ENU
E m
inus
EXP
END
ITU
RES
2,64
3.8
(2,6
04.1
)
0.
4
1,06
0.8
813.
4
206.
0
(561
.3)
(1,3
87.0
)
(2
,286
.0)
(3,2
51.4
)
(4
,275
.0)
(5,3
64.2
)
(6
,329
.2)
(NO
T cu
mul
ativ
e)no
te: n
on-r
ecur
ring
expe
nditu
res
-
-
-
-
-
-
-
-
-
-
-
-
-
ne
t rec
urrin
g re
v- e
xp2,
643.
8
(2,6
04.1
)
0.
4
1,06
0.8
81
3.4
206.
0
(5
61.3
)
(1,3
87.0
)
(2
,286
.0)
(3,2
51.4
)
(4
,275
.0)
(5,3
64.2
)
(6
,329
.2)
* O
pera
ting
Exp
ense
s ne
t of F
ull C
ost A
lloca
tion
** E
xpen
ditu
re la
pse
is c
alcu
late
d on
Per
sona
l Ser
vice
s, O
pera
ting
Exp
ense
s, C
apita
l Out
lay,
and
Gra
nts
& A
ids
only
.
FOR
ECA
ST
Exhibit H-15

Exhibit H-16

Emer
genc
y M
edic
al S
ervi
ces
Tota
l For
ecas
t FY2
011
- FY2
020
50,0
00
60,0
00
70,0
00
80,0
00
90,0
00
100,
000
110,
000
120,
000
130,
000
2011
2012
2013
2014
2015
2016
2017
2018
2019
2020
Fisc
al Y
ears
Dollars (000's)
TOTA
L R
EV
EN
UE
STO
TAL
EX
PE
ND
ITU
RE
S
Exhibit H-17

EMER
GEN
CY
MED
ICA
L SE
RVI
CES
FU
ND
FO
REC
AST
Fund
020
6
Fore
cast
Ass
umpt
ions
2011
2012
2013
2014
2015
2016
2017
2018
2019
2020
REV
ENU
ESA
d V
alor
em R
even
ue (@
95%
)-5
.6%
-5.0
%3.
0%3.
0%5.
0%5.
0%5.
0%5.
0%5.
0%5.
0%A
mbu
lanc
e S
vc C
ontra
ct F
ees
2.2%
2.0%
2.0%
2.0%
2.0%
2.0%
2.0%
2.0%
2.0%
2.0%
Am
bula
nce
Ann
ual M
embe
rs F
ees
0.0%
0.0%
0.0%
0.0%
0.0%
0.0%
0.0%
0.0%
0.0%
0.0%
Gra
nt R
even
ue (E
MS
Tru
st F
und)
0.0%
2.0%
3.0%
3.0%
3.0%
3.0%
3.0%
3.0%
3.0%
3.0%
Cty
Off
Fees
(TC
& P
A)
2.0%
2.0%
2.0%
2.0%
2.0%
2.0%
2.0%
2.0%
2.0%
2.0%
Inte
rest
2.0%
3.0%
4.0%
4.0%
4.0%
4.0%
4.0%
4.0%
4.0%
4.0%
Oth
er re
venu
es (r
ef o
f prio
r yrs
exp
)0.
0%0.
0%0.
0%0.
0%0.
0%0.
0%0.
0%0.
0%0.
0%0.
0%
EXPE
ND
ITU
RES
Per
sona
l Ser
vice
s1.
7%1.
7%3.
9%3.
9%3.
9%3.
9%3.
9%3.
9%3.
9%3.
9%O
pera
ting
Exp
ense
s1.
6%2.
3%1.
9%1.
9%1.
9%2.
0%2.
0%1.
9%1.
9%2.
0%C
apita
l Out
lay
1.6%
2.3%
1.9%
1.9%
1.9%
2.0%
2.0%
1.9%
1.9%
2.0%
Am
bula
nce
Con
tract
3.0%
3.0%
4.0%
4.0%
4.0%
4.0%
4.0%
4.0%
4.0%
4.0%
EM
S T
rust
Fun
d G
rant
Exp
endi
ture
s0.
0%2.
0%3.
0%3.
0%3.
0%3.
0%3.
0%3.
0%3.
0%3.
0%G
rant
s &
Aid
s (F
irst R
espo
nder
Agm
ts)
4.1%
5.0%
5.0%
5.0%
5.0%
5.0%
5.0%
5.0%
5.0%
5.0%
Trfrs
to P
A &
TC
1.0%
1.0%
1.0%
1.0%
1.0%
1.0%
1.0%
1.0%
1.0%
1.0%
Proj
ecte
d Ec
onom
ic C
ondi
tions
/ In
dica
tors
:C
onsu
mer
Pric
e In
dex,
% c
hang
e1.
6%2.
3%1.
9%1.
9%1.
9%2.
0%2.
0%1.
9%1.
9%2.
0%FL
Per
Cap
ita P
erso
nal I
ncom
e G
row
th1.
5%3.
0%3.
7%2.
7%2.
5%2.
3%2.
3%2.
2%2.
4%2.
3%E
stim
ated
New
Con
stru
ctio
n %
of t
ax b
ase
0.2%
0.5%
1.0%
1.0%
1.0%
1.0%
1.0%
1.0%
1.0%
1.0%
Exhibit H-18

EMER
GEN
CY
MED
ICA
L SE
RVI
CES
FU
ND
FO
REC
AST
Fund
020
6
@95
%@
100%
(in $
thou
sand
s)A
ctua
lB
udge
tPr
ojec
ted
Estim
ated
Estim
ated
Estim
ated
Estim
ated
Estim
ated
Estim
ated
Estim
ated
Estim
ated
Estim
ated
Estim
ated
2009
2010
2010
2011
2012
2013
2014
2015
2016
2017
2018
2019
2020
BEG
INN
ING
FU
ND
BA
LAN
CE
38,1
48.7
34,8
26.9
36
,209
.9
29,2
89.0
19
,710
.2
6,05
0.3
(9,9
34.2
)
(28,
258.
6)
(48,
172.
6)
(69,
768.
7)
(93,
136.
0)
(118
,359
.6)
(145
,536
.7)
REV
ENU
ESA
d V
alor
em R
even
ue38
,924
.8
33
,613
.9
33,4
82.7
31
,608
.1
30,0
27.7
30
,928
.5
31,8
56.4
33
,449
.2
35,1
21.7
36
,877
.7
38,7
21.6
40
,657
.7
42,6
90.6
A
mbu
lanc
e S
vc C
ontra
ct F
ees
41,9
81.7
38,6
78.0
41
,106
.0
42,8
98.1
43
,756
.1
44,6
31.2
45
,523
.8
46,4
34.3
47
,363
.0
48,3
10.2
49
,276
.4
50,2
62.0
51
,267
.2
Am
bula
nce
Ann
ual M
embe
rs F
ees
274.
4
26
9.2
21
5.0
21
5.0
21
5.0
21
5.0
21
5.0
21
5.0
21
5.0
21
5.0
21
5.0
21
5.0
21
5.0
G
rant
Rev
enue
(EM
S T
rust
Fun
d)31
0.7
918.
5
929.
5
231.
4
236.
0
243.
1
250.
4
257.
9
265.
7
273.
6
281.
8
290.
3
Cty
Off
Fees
(TC
& P
A)
328.
7
23
5.6
23
5.6
24
8.0
25
3.0
25
8.0
26
3.2
26
8.4
27
3.8
27
9.3
28
4.9
29
0.6
In
tere
st1,
313.
9
628.
7
698.
1
735.
0
591.
3
242.
0
-
-
-
-
-
-
-
O
ther
reve
nues
(ref
of p
rior y
rs e
xp)
3.6
27
.0
27
.0
27
.0
27
.0
27
.0
27
.0
27
.0
27
.0
27
.0
27
.0
27
.0
27
.0
TOTA
L R
EVEN
UES
83,1
37.8
74,3
70.9
76
,693
.9
75,9
62.6
75
,106
.1
76,5
44.8
78
,135
.8
80,6
51.8
83
,266
.1
85,9
82.9
88
,806
.8
91,7
42.5
94
,199
.8
5%-1
1%-8
%-1
%-1
%2%
2%3%
3%3%
3%3%
3%
TOTA
L R
ESO
UR
CES
121,
286.
5
109,
197.
8
112,
903.
8
105,
251.
6
94,8
16.3
82
,595
.2
68,2
01.5
52
,393
.2
35,0
93.5
16
,214
.2
(4,3
29.2
)
(26,
617.
0)
(51,
336.
9)
EXPE
ND
ITU
RES
Per
sona
l Ser
vice
s2,
860.
4
2,86
1.4
2,84
9.0
2,91
9.2
2,96
8.8
3,08
4.6
3,20
4.9
3,32
9.9
3,45
9.8
3,59
4.7
3,73
4.9
3,88
0.6
4,03
1.9
Ope
ratin
g E
xpen
ses
5,38
7.3
6,
497.
8
6,
577.
3
6,
637.
4
6,
790.
1
6,
919.
1
7,
050.
5
7,
184.
5
7,
328.
2
7,
474.
7
7,
616.
8
7,
761.
5
7,
916.
7
C
apita
l Out
lay
242.
8
0
060
0.0
61
3.8
62
5.5
63
7.3
64
9.5
66
2.4
67
5.7
68
8.5
70
1.6
71
5.6
A
mbu
lanc
e C
ontra
ct34
,451
.5
33
,850
.0
33,8
50.0
35
,700
.0
36,7
71.0
38
,241
.8
39,7
71.5
41
,362
.4
43,0
16.9
44
,737
.5
46,5
27.0
48
,388
.1
50,3
23.7
E
MS
Tru
st F
und
Gra
nt E
xpen
ditu
res
310.
6
91
8.5
92
9.5
23
1.5
23
6.1
24
3.2
25
0.5
25
8.0
26
5.8
27
3.7
28
2.0
29
0.4
29
9.1
G
rant
s &
Aid
s (F
irst R
espo
nder
Agm
ts)
40,7
06.2
38,0
93.9
38
,385
.1
38,4
57.4
40
,380
.3
42,3
99.3
44
,519
.2
46,7
45.2
49
,082
.5
51,5
36.6
54
,113
.4
56,8
19.1
59
,660
.0
Trfrs
to P
A &
TC
1,11
7.8
1,
210.
2
1,
023.
9
99
5.9
1,
005.
9
1,
015.
9
1,
026.
1
1,
036.
3
1,
046.
7
1,
057.
2
1,
067.
7
1,
078.
4
1,
089.
2
*
Am
t Inc
lude
s B
ayfli
te &
Eck
erd
Con
tract
sTO
TAL
EXPE
ND
ITU
RES
85,0
76.6
83,4
31.8
83
,614
.8
85,5
41.4
88
,765
.9
92,5
29.4
96
,460
.1
100,
565.
8
104,
862.
2
109,
350.
2
114,
030.
4
118,
919.
7
124,
036.
3
4%-2
%-2
%2%
4%4%
4%4%
4%4%
4%4%
4%
END
ING
FU
ND
BA
LAN
CE
36,2
09.9
25,7
66.0
29
,289
.0
19,7
10.2
6,
050.
3
(9
,934
.2)
(2
8,25
8.6)
(4
8,17
2.6)
(6
9,76
8.7)
(9
3,13
6.0)
(1
18,3
59.6
)
(1
45,5
36.7
)
(1
75,3
73.2
)
A
SSU
MIN
G N
O A
CTI
ON
TA
KEN
TO
RES
OLV
E SH
OR
TFA
LLS
End
ing
bala
nce
as %
of R
esou
rces
29.9
%30
.9%
35.0
%23
.0%
6.8%
-10.
7%-2
9.3%
-47.
9%-6
6.5%
-85.
2%-1
03.8
%-1
22.4
%-1
41.4
%
TOTA
L R
EQU
IREM
ENTS
121,
286.
5
109,
197.
8
112,
903.
8
105,
251.
6
94,8
16.3
82
,595
.2
68,2
01.5
52
,393
.2
35,0
93.5
16
,214
.2
(4,3
29.2
)
(26,
617.
0)
(51,
336.
9)
REV
ENU
E m
inus
EXP
END
ITU
RES
(1,9
38.8
)
(9
,060
.9)
(6
,920
.9)
(9
,578
.8)
(1
3,65
9.9)
(1
5,98
4.5)
(1
8,32
4.4)
(1
9,91
4.0)
(2
1,59
6.1)
(2
3,36
7.3)
(2
5,22
3.6)
(2
7,17
7.2)
(2
9,83
6.5)
note
: non
-rec
urrin
g ex
pend
iture
s-
-
-
-
-
-
-
-
-
-
-
-
-
ne
t rec
urrin
g re
v- e
xp(1
,938
.8)
(9
,060
.9)
(6,9
20.9
)
(9
,578
.8)
(13,
659.
9)
(1
5,98
4.5)
(18,
324.
4)
(1
9,91
4.0)
(21,
596.
1)
(2
3,36
7.3)
(25,
223.
6)
(2
7,17
7.2)
(29,
836.
5)
Am
bula
nce
Rev
enue
s42
,914
.9
39
,275
.1
41,6
83.6
43
,494
.1
44,2
80.2
44
,980
.7
45,7
52.3
46
,662
.8
47,5
91.5
48
,538
.7
49,5
04.9
50
,490
.5
51,4
95.7
A
mbu
lanc
e E
xpen
ditu
res
38,7
31.1
38,4
06.1
38
,424
.8
40,6
51.1
41
,822
.3
43,4
35.4
45
,111
.9
46,8
54.3
48
,668
.0
50,5
52.9
52
,509
.0
54,5
42.0
56
,658
.2
Cur
rent
Rev
Les
s E
xp4,
183.
8
869.
0
3,25
8.7
2,84
3.0
2,45
7.9
1,54
5.2
640.
4
(191
.5)
(1,0
76.5
)
(2,0
14.2
)
(3,0
04.1
)
(4,0
51.6
)
(5,1
62.5
)
Firs
t Res
pond
er R
even
ues
39,9
12.3
34,1
77.4
34
,080
.9
32,2
37.1
30
,589
.8
31,3
21.1
32
,133
.1
33,7
31.1
35
,409
.0
37,1
70.5
39
,020
.0
40,9
61.8
42
,704
.1
Firs
t Res
pond
er E
xpen
ditu
res
46,0
34.9
44,1
07.2
44
,260
.5
44,6
58.8
46
,707
.5
48,8
50.7
51
,097
.7
53,4
53.5
55
,928
.5
58,5
23.5
61
,239
.4
64,0
87.2
67
,079
.0
Cur
rent
Rev
Les
s E
xp(6
,122
.7)
(9,9
29.9
)
(10,
179.
6)
(12,
421.
7)
(16,
117.
7)
(17,
529.
7)
(18,
964.
6)
(19,
722.
4)
(20,
519.
5)
(21,
353.
0)
(22,
219.
4)
(23,
125.
5)
(24,
374.
9)
FOR
ECA
ST (@
100%
Rev
enue
)
Exhibit H-19

Exhibit H-20

Fire
Dis
tric
t Fun
d Fo
reca
st F
Y201
1 - F
Y202
0
10,0
00
12,0
00
14,0
00
16,0
00
18,0
00
20,0
00
22,0
00
2011
2012
2013
2014
2015
2016
2017
2018
2019
2020
Fisc
al Y
ears
Dollars (000's)
RE
VE
NU
ES
EX
PE
ND
ITU
RE
S
Exhibit H-21

FIR
E D
ISTR
ICTS
FU
ND
FO
REC
AST
Fund
025
0
Fore
cast
Ass
umpt
ions
2011
2012
2013
2014
2015
2016
2017
2018
2019
2020
REV
ENU
ESA
d V
alor
em T
ax R
even
ue (@
95%
)-1
0.5%
-5.0
%3.
0%3.
0%5.
0%5.
0%5.
0%5.
0%5.
0%5.
0%C
ty O
ff Fe
es (T
C &
PA
)2.
0%2.
0%2.
0%2.
0%2.
0%2.
0%2.
0%2.
0%2.
0%2.
0%In
tere
st2.
0%3.
0%4.
0%4.
0%4.
0%4.
0%4.
0%4.
0%4.
0%4.
0%In
tere
st -
Tax
Col
lect
or2.
0%2.
0%2.
0%2.
0%2.
0%2.
0%2.
0%2.
0%2.
0%2.
0%
EXPE
ND
ITU
RES
Per
sona
l Ser
vice
s1.
7%1.
7%3.
9%3.
9%3.
9%3.
9%3.
9%3.
9%3.
9%3.
9%O
pera
ting
Exp
ense
s1.
6%2.
3%1.
9%1.
9%1.
9%2.
0%2.
0%1.
9%1.
9%2.
0%C
apita
l Out
lay
1.6%
2.3%
1.9%
1.9%
1.9%
2.0%
2.0%
1.9%
1.9%
2.0%
Deb
t Ser
vice
0.0%
0.0%
0.0%
0.0%
0.0%
0.0%
0.0%
0.0%
0.0%
0.0%
Gra
nts
& A
ids
(Cty
Pym
ts)
3.5%
3.5%
3.5%
3.5%
3.5%
3.5%
3.5%
3.5%
3.5%
3.5%
Trfrs
to P
A &
TC
2.0%
2.0%
2.0%
2.0%
2.0%
2.0%
2.0%
2.0%
2.0%
2.0%
Proj
ecte
d Ec
onom
ic C
ondi
tions
/ In
dica
tors
:C
onsu
mer
Pric
e In
dex,
% c
hang
e1.
6%2.
3%1.
9%1.
9%1.
9%2.
0%2.
0%1.
9%1.
9%2.
0%FL
Per
Cap
ita P
erso
nal I
ncom
e G
row
th1.
5%3.
0%3.
7%2.
7%2.
5%2.
3%2.
3%2.
2%2.
4%2.
3%E
stim
ated
New
Con
stru
ctio
n %
of t
ax b
ase
0.2%
0.5%
1.0%
1.0%
1.0%
1.0%
1.0%
1.0%
1.0%
1.0%
Exhibit H-22

FIR
E D
ISTR
ICTS
FU
ND
FO
REC
AST
Fund
025
0
@95
%@
100%
(in $
thou
sand
s)A
ctua
lB
udge
tPr
ojec
ted
Estim
ated
Estim
ated
Estim
ated
Estim
ated
Estim
ated
Estim
ated
Estim
ated
Estim
ated
Estim
ated
Estim
ated
2009
2010
2010
2011
2012
2013
2014
2015
2016
2017
2018
2019
2020
BEG
INN
ING
FU
ND
BA
LAN
CE
9,07
2.0
8,54
0.5
9,11
5.9
8,24
2.3
7,99
6.0
6,89
1.1
5,71
0.4
4,36
4.9
3,14
5.0
2,07
3.3
1,17
4.5
476.
2
7.8
REV
ENU
ESA
d V
alor
em R
even
ue15
,367
.8
14,3
43.1
14
,284
.4
15,0
36.5
14
,284
.7
14,7
13.2
15
,154
.6
15,9
12.3
16
,708
.0
17,5
43.4
18
,420
.5
19,3
41.6
20
,308
.6
Cty
Off
Fees
(TC
& P
A)
134.
0
96.1
105.
6
105.
1
107.
2
109.
3
111.
5
113.
7
116.
0
118.
3
120.
7
123.
1
Oth
er R
ev (I
nter
est,
Gai
n/Lo
ss In
v)29
0.8
10
2.7
10
2.7
10
6.6
23
9.9
27
5.6
22
8.4
17
4.6
12
5.8
82
.9
47
.0
19
.0
0.
3
In
tere
st -
Tax
Col
lect
or3.
9
4.
3
1.
4
1.
5
1.
5
1.
6
1.
6
1.
6
1.
7
1.
7
1.
7
1.
8
1.
8
M
isce
llane
ous
Rev
enue
s - O
ne-ti
me
(Aud
it A
djus
tmen
ts)
368.
8
TOTA
L R
EVEN
UES
15,7
96.5
14
,546
.2
14,8
62.9
15
,249
.7
14,6
33.2
15
,099
.7
15,4
96.1
16
,202
.3
16,9
51.4
17
,746
.3
18,5
89.9
19
,485
.4
20,3
10.7
-1
2%-8
%-6
%3%
-4%
3%3%
5%5%
5%5%
5%4%
TOTA
L R
ESO
UR
CES
24,8
68.5
23
,086
.7
23,9
78.8
23
,492
.0
22,6
29.2
21
,990
.8
21,2
06.5
20
,567
.2
20,0
96.4
19
,819
.5
19,7
64.4
19
,961
.7
20,3
18.6
EXPE
ND
ITU
RES
Per
sona
l Ser
vice
s16
9.7
12
7.2
12
9.9
12
8.7
13
0.9
13
6.0
14
1.3
14
6.8
15
2.5
15
8.5
16
4.7
17
1.1
17
7.8
O
pera
ting
Exp
endi
ture
s17
4.6
23
1.5
20
7.1
17
8.2
18
2.3
18
5.8
18
9.3
19
2.9
19
6.7
20
0.7
20
4.5
20
8.4
21
2.5
C
urr C
hgs
& O
blig
(Cty
Fire
Adm
in C
hgs)
346.
1
358.
7
358.
6
306.
8
313.
9
319.
8
325.
9
332.
1
338.
7
345.
5
352.
1
358.
8
365.
9
Cap
ital O
utla
y - O
ne-ti
me
(Tie
rra
Ver
de B
udge
t Am
end.
)-
420.
0
420.
0
-
-
-
-
-
-
-
-
-
-
Deb
t Ser
vice
-
0.
2
0.
2
0.
9
0.
9
0.
9
0.
9
0.
9
0.
9
0.
9
0.
9
0.
9
0.
9
G
rant
s &
Aid
s (C
ty P
aym
ents
)14
,952
.1
15,2
84.0
14
,531
.6
14,5
10.0
15
,017
.9
15,5
43.5
16
,087
.5
16,6
50.6
17
,233
.3
17,8
36.5
18
,460
.8
19,1
06.9
19
,775
.6
Trfrs
to P
A &
TC
455.
2
426.
1
426.
1
398.
2
406.
2
414.
3
422.
6
431.
0
439.
6
448.
4
457.
4
466.
6
475.
9
Tran
sfer
to C
IP -
One
-tim
e (T
ierr
a V
erde
)28
0.0
-
-
-
-
-
-
-
-
-
Pro
-Rat
e C
lear
ing
(Cty
Fire
Adm
in C
hgs)
(345
.1)
(358
.7)
(337
.0)
(306
.8)
(313
.9)
(319
.8)
(325
.9)
(332
.1)
(338
.7)
(345
.5)
(352
.1)
(358
.8)
(365
.9)
TOTA
L EX
PEN
DIT
UR
ES15
,752
.6
16,4
89.0
15
,736
.5
15,4
96.0
15
,738
.1
16,2
80.4
16
,841
.6
17,4
22.2
18
,023
.2
18,6
45.0
19
,288
.2
19,9
53.8
20
,642
.7
-6%
5%0%
-2%
2%3%
3%3%
3%3%
3%3%
3%
END
ING
FU
ND
BA
LAN
CE
9,11
5.9
6,59
7.7
8,24
2.3
7,99
6.0
6,89
1.1
5,71
0.4
4,36
4.9
3,14
5.0
2,07
3.3
1,17
4.5
476.
2
7.8
(324
.2)
ASS
UM
ING
NO
AC
TIO
N T
AK
EN T
OR
ESO
LVE
SHO
RTF
ALL
S
End
ing
bala
nce
as %
of R
esou
rces
36.7
%28
.6%
34.4
%34
.0%
30.5
%26
.0%
20.6
%15
.3%
10.3
%5.
9%2.
4%0.
0%-1
.6%
TOTA
L R
EQU
IREM
ENTS
24,8
68.5
23
,086
.7
23,9
78.8
23
,492
.0
22,6
29.2
21
,990
.8
21,2
06.5
20
,567
.2
20,0
96.4
19
,819
.5
19,7
64.4
19
,961
.7
20,3
18.6
REV
ENU
E m
inus
EXP
END
ITU
RES
43.9
(1,9
42.8
)
(873
.6)
(246
.4)
(1,1
04.9
)
(1,1
80.7
)
(1,3
45.5
)
(1,2
19.9
)
(1,0
71.8
)
(898
.7)
(698
.3)
(468
.4)
(332
.0)
note
: non
-rec
urrin
g ex
pend
iture
s-
-
-
-
-
-
-
-
-
-
-
-
-
net r
ecur
ring
rev-
exp
43.9
(1,9
42.8
)
(8
73.6
)
(246
.4)
(1
,104
.9)
(1,1
80.7
)
(1
,345
.5)
(1,2
19.9
)
(1
,071
.8)
(898
.7)
(6
98.3
)
(468
.4)
(3
32.0
)
FOR
ECA
ST (@
100%
Rev
enue
)
Exhibit H-23

Exhibit H-24

Exhibit H
-25
Airport Fund Forecast FY2011-FY2020
2006 2001 2000 2009 201 o· 2011' 2012· 2013• 2014• 2015• 2015• 2017' 2010• 2019• 2020•
Fiscal Years • Projections
!..,._Total Resources - Total Expenditures I

AIR
POR
T FU
ND
FO
REC
AST
Fund
050
1
Fore
cast
Ass
umpt
ions
2011
2012
2013
2014
2015
2016
2017
2018
2019
2020
REV
ENU
ESA
irfie
ld/F
light
Lin
es-4
.3%
5.5%
-8.2
%2.
0%2.
0%2.
0%2.
0%2.
0%2.
0%2.
0%G
olf C
ours
e-3
.1%
29.9
%-4
.5%
1.6%
4.9%
-0.6
%-3
.6%
0.6%
1.9%
0.2%
Ren
t/Sur
plus
/Ref
unds
-2.1
%2.
0%1.
0%2.
0%2.
0%2.
0%2.
0%2.
0%2.
0%2.
0%C
apita
l Con
tribu
tions
63.5
%-5
8.5%
58.1
%-6
5.5%
53.4
%23
.8%
-12.
7%0.
0%0.
0%0.
0%In
tere
st2.
0%3.
0%4.
0%4.
0%4.
0%4.
0%4.
0%4.
0%4.
0%4.
0%O
ther
reve
nues
2.0%
2.0%
2.0%
2.0%
2.0%
2.0%
2.0%
2.0%
2.0%
2.0%
EXPE
ND
ITU
RES
Per
sona
l Ser
vice
s1.
7%1.
7%3.
9%3.
9%3.
9%3.
9%3.
9%3.
9%3.
9%3.
9%O
pera
ting
Exp
ense
s1.
6%2.
3%1.
9%1.
9%1.
9%2.
0%2.
0%1.
9%1.
9%2.
0%C
apita
l Out
lay
1.6%
2.3%
1.9%
1.9%
1.9%
2.0%
2.0%
1.9%
1.9%
2.0%
Gra
nts
& A
ids
1.6%
2.3%
1.9%
1.9%
1.9%
2.0%
2.0%
1.9%
1.9%
2.0%
Proj
ecte
d Ec
onom
ic C
ondi
tions
/ In
dica
tors
:C
onsu
mer
Pric
e In
dex,
% c
hang
e1.
6%2.
3%1.
9%1.
9%1.
9%2.
0%2.
0%1.
9%1.
9%2.
0%FL
Per
Cap
ita P
erso
nal I
ncom
e G
row
th1.
5%3.
0%3.
7%2.
7%2.
5%2.
3%2.
3%2.
2%2.
4%2.
3%E
stim
ated
New
Con
stru
ctio
n %
of t
ax b
ase
0.2%
0.5%
1.0%
1.0%
1.0%
1.0%
1.0%
1.0%
1.0%
1.0%
Exhibit H-26

AIR
POR
T FU
ND
FO
REC
AST
Fund
050
1
(in $
thou
sand
s)A
ctua
lB
udge
tPr
ojec
ted
Estim
ated
Estim
ated
Estim
ated
Estim
ated
Estim
ated
Estim
ated
Estim
ated
Estim
ated
Estim
ated
Estim
ated
2009
2010
2010
2011
2012
2013
2014
2015
2016
2017
2018
2019
2020
BEG
INN
ING
FU
ND
BA
LAN
CE
10,9
36.5
11
,733
.9
11,6
46.3
11
,863
.0
10
,131
.4
10,8
96.7
11
,717
.2
11,6
93.2
11,7
94.0
11
,878
.5
10
,895
.4
9,
609.
3
8,
013.
6
REV
ENU
ESA
irfie
ld/F
light
Lin
es2,
523.
2
2,
516.
4
2,
612.
0
2,
500.
2
2,63
7.0
2,42
0.5
2,46
8.9
2,51
8.2
2,56
8.6
2,
620.
0
2,
672.
4
2,
725.
8
2,
780.
3
G
olf C
ours
e1,
037.
3
1,
178.
1
96
1.5
93
2.0
1,21
1.0
1,15
6.0
1,17
4.0
1,23
2.0
1,22
5.0
1,
181.
0
1,
188.
0
1,
211.
0
1,
213.
0
Ren
t/Sur
plus
/Ref
unds
5,68
0.2
5,23
9.2
5,75
2.0
5,62
9.1
5,
744.
0
5,
803.
8
5,
919.
9
6,
038.
3
6,
159.
0
6,28
2.2
6,40
7.9
6,53
6.0
6,66
6.7
Gra
nts
132.
4
241.
5
276.
0
222.
5
22
7.0
23
1.5
23
6.1
24
0.8
24
5.7
250.
6
255.
6
260.
7
265.
9
Cap
ital C
ontri
butio
ns9,
279.
5
13
,343
.9
8,46
6.0
13,8
39.5
5,74
5.0
9,08
5.0
3,13
6.0
4,81
2.0
5,95
5.0
5,
198.
0
5,
198.
0
5,
198.
0
5,
198.
0
Inte
rest
273.
2
289.
8
305.
0
289.
8
30
3.9
43
5.9
46
8.7
46
7.7
47
1.8
475.
1
435.
8
384.
4
320.
5
Tr
ansf
ers
from
oth
er fu
nds
-
-
-
-
-
-
-
-
-
-
-
-
-
Oth
er re
venu
es82
.9
1.9
3.0
2.8
54
.0
55
.1
56
.2
57
.3
58
.5
59.6
60.8
62.0
63.3
Adj
ust R
even
ue to
97%
11.3
15.5
16.6
16.6
16.7
16
.9
15
.7
14
.1
12
.1
TO
TAL
REV
ENU
ES19
,008
.7
22,8
10.8
18
,375
.5
23,4
15.9
15,9
33.2
19
,203
.2
13,4
76.3
15
,383
.0
16
,700
.3
16,0
83.4
16,2
34.1
16,3
92.0
16,5
19.9
-1%
20%
-3%
27%
-32%
21%
-30%
14%
9%-4
%1%
1%1%
TOTA
L R
ESO
UR
CES
29,9
45.2
34
,544
.7
30,0
21.8
35
,278
.9
26
,064
.6
30,0
99.9
25
,193
.5
27,0
76.2
28,4
94.3
27
,961
.9
27
,129
.5
26
,001
.3
24
,533
.6
EXPE
ND
ITU
RES
Per
sona
l Svc
s.4,
385.
4
4,
681.
4
4,
532.
8
4,
685.
3
4,76
5.0
4,95
0.8
5,14
3.9
5,34
4.5
5,55
2.9
5,
769.
5
5,
994.
5
6,
228.
3
6,
471.
2
Ope
ratin
g E
xp. L
ess
Full
Cos
t Allo
c.4,
344.
7
4,
652.
7
4,
494.
8
4,
713.
0
4,82
1.4
4,91
3.0
5,00
6.4
5,10
1.5
5,20
3.5
5,
307.
6
5,
408.
4
5,
511.
2
5,
621.
4
Cap
ital O
utla
y11
1.7
30
.6
23.6
65.1
66.6
67.9
69.2
70.5
71.9
73
.3
74
.7
76
.1
77
.6
G
rant
s &
Aid
s-
-
-
-
-
-
-
-
-
-
-
-
-
Fu
ll C
ost A
lloca
tion
939.
3
857.
6
857.
6
579.
1
59
6.5
62
0.3
64
5.1
67
1.0
69
7.8
725.
7
754.
7
784.
9
816.
3
D
ebt S
ervi
ce-
-
-
-
-
-
-
-
-
-
-
-
-
N
on-r
ecur
ring
expe
nditu
res
9,46
4.2
13,1
87.5
8,
250.
0
15
,105
.0
5,
015.
0
7,
930.
0
2,
738.
0
4,
200.
0
5,
198.
0
5,30
2.0
5,40
2.7
5,50
5.3
5,61
5.5
E
xpen
ditu
re L
apse
1%
**
(96.
5)
(99.
3)
(102
.2)
(1
05.2
)
(108
.3)
(111
.5)
(1
14.8
)
(118
.2)
(1
21.7
)
TOTA
L EX
PEN
DIT
UR
ES19
,245
.3
23,4
09.8
18
,158
.8
25,1
47.5
15,1
67.9
18
,382
.7
13,5
00.3
15
,282
.2
16
,615
.8
17,0
66.5
17,5
20.3
17,9
87.7
18,4
80.3
31%
22%
-6%
38%
-40%
21%
-27%
13%
9%3%
3%3%
3%
END
ING
FU
ND
BA
LAN
CE
10,6
99.9
11
,134
.9
11,8
63.0
10
,131
.4
10
,896
.7
11,7
17.2
11
,693
.2
11,7
94.0
11,8
78.5
10
,895
.4
9,
609.
3
8,
013.
6
6,
053.
3
ASS
UM
ING
NO
AC
TIO
N T
AK
EN T
OR
ESO
LVE
SHO
RTF
ALL
S
End
ing
bala
nce
as %
of R
esou
rces
36%
32%
40%
29%
42%
39%
46%
44%
42%
39%
35%
31%
25%
TOTA
L R
EQU
IREM
ENTS
29,9
45.2
34
,544
.7
30,0
21.8
35
,278
.9
26
,064
.6
30,0
99.9
25
,193
.5
27,0
76.2
28,4
94.3
27
,961
.9
27
,129
.5
26
,001
.3
24
,533
.6
REV
ENU
E m
inus
EXP
END
ITU
RES
(236
.6)
(599
.0)
216.
7
(1,7
31.6
)
76
5.3
82
0.5
(2
4.0)
10
0.8
84
.5
(983
.1)
(1
,286
.1)
(1,5
95.6
)
(1
,960
.4)
note
: non
-rec
urrin
g ex
pend
iture
s9,
464.
2
13
,187
.5
8,25
0.0
15,1
05.0
5,01
5.0
7,93
0.0
2,73
8.0
4,20
0.0
5,19
8.0
5,
302.
0
5,
402.
7
5,
505.
3
5,
615.
5
net r
ecur
ring
rev-
exp
9,22
7.6
12,5
88.5
8,
466.
7
13
,373
.4
5,
780.
3
8,
750.
5
2,
714.
0
4,
300.
8
5,
282.
5
4,31
8.9
4,11
6.6
3,90
9.7
3,65
5.1
* O
pera
ting
Exp
ense
s ne
t of F
ull C
ost A
lloca
tion
** E
xpen
ditu
re la
pse
is c
alcu
late
d on
Per
sona
l Ser
vice
s, O
pera
ting
Exp
ense
s, C
apita
l Out
lay,
and
Gra
nts
& A
ids
only
.
FOR
ECA
ST
Exhibit H-27

Exhibit H-28

Wat
er S
yste
m F
unds
For
ecas
t FY2
011
- FY2
020
with
No
rate
incr
ease
s
60,0
00
80,0
00
100,
000
120,
000
2011
2012
2013
2014
2015
2016
2017
2018
2019
2020
Fisc
al Y
ears
Dollars (000's)
Reve
nues
Expe
nditu
res
Exhibit H-29

WA
TER
WIT
HO
UT
RA
TE IN
CR
EASE
Fund
053
1, 0
534,
053
6 &
056
0
Fore
cast
Ass
umpt
ions
2011
2012
2013
2014
2015
2016
2017
2018
2019
2020
REV
ENU
ESW
ater
Sal
es-R
etai
l0.
3%0.
5%0.
75%
0.75
%0.
75%
0.75
%0.
75%
0.75
%0.
75%
0.75
%W
ater
Sal
es-W
hole
sale
-5.7
%-3
1.3%
0.7%
-40.
7%0.
75%
0.75
%0.
75%
0.75
%0.
75%
0.75
%In
tere
st2.
0%3.
0%4.
0%4.
0%4.
0%4.
0%4.
0%4.
0%4.
0%4.
0%O
ther
reve
nues
2.0%
2.0%
2.0%
2.0%
2.0%
2.0%
2.0%
2.0%
2.0%
2.0%
EXPE
ND
ITU
RES
Per
sona
l Ser
vice
s 1.
7%1.
7%3.
9%3.
9%3.
9%3.
9%3.
9%3.
9%3.
9%3.
9%O
pera
ting
Exp
ense
s1.
6%2.
3%1.
9%1.
9%1.
9%2.
0%2.
0%1.
9%1.
9%2.
0%P
urch
ase
of W
ater
8.9%
-7.8
%7.
2%-8
.9%
-0.2
%3.
3%3.
3%3.
3%3.
3%3.
3%P
ower
6.9%
5.0%
5.0%
5.0%
5.0%
5.0%
5.0%
5.0%
5.0%
5.0%
Che
mic
als
7.0%
7.0%
7.0%
7.0%
7.0%
7.0%
7.0%
7.0%
7.0%
7.0%
Proj
ecte
d Ec
onom
ic C
ondi
tions
/ In
dica
tors
:C
onsu
mer
Pric
e In
dex,
% c
hang
e1.
6%2.
3%1.
9%1.
9%1.
9%2.
0%2.
0%1.
9%1.
9%2.
0%FL
Per
Cap
ita P
erso
nal I
ncom
e G
row
th1.
5%3.
0%3.
7%2.
7%2.
5%2.
3%2.
3%2.
2%2.
4%2.
3%E
stim
ated
New
Con
stru
ctio
n %
of t
ax b
ase
0.2%
0.5%
1.0%
1.0%
1.0%
1.0%
1.0%
1.0%
1.0%
1.0%
Exhibit H-30

WA
TER
WIT
HO
UT
RA
TE IN
CR
EASE
Fund
053
1, 0
534,
053
6 &
056
0
(in $
thou
sand
s)A
ctua
lB
udge
tPr
ojec
ted
Bud
get
Estim
ated
Estim
ated
Estim
ated
Estim
ated
Estim
ated
Estim
ated
Estim
ated
Estim
ated
Estim
ated
2009
2010
2010
2011
2012
2013
2014
2015
2016
2017
2018
2019
2020
BEG
INN
ING
FU
ND
BA
LAN
CE
56,6
88.0
47
,828
.0
47,8
28.0
37
,907
.6
22,6
81.9
12
,012
.3
(3,6
51.9
)
(14,
239.
1)
(24,
216.
5)
(36,
782.
3)
(53,
370.
1)
(64,
976.
5)
(77,
406.
4)
REV
ENU
ESW
ater
Sal
es -
Ret
ail
57,0
80.0
60
,317
.0
61,6
99.0
59
,054
.0
62,7
13.0
63
,183
.3
63,6
57.2
64
,134
.7
64,6
15.7
65
,100
.3
65,5
88.5
66
,080
.4
66,5
76.0
Wat
er S
ales
- W
hole
sale
19,6
05.0
18
,614
.0
18,1
15.0
16
,457
.0
10,5
42.0
10
,612
.0
6,60
2.0
6,63
7.0
6,68
7.0
6,73
7.0
6,78
8.0
6,83
9.0
6,89
0.0
In
tere
st
3,85
7.0
297.
0
1,06
6.0
507.
0
520.
0
164.
0
-
-
-
-
-
-
-
Oth
er R
even
ues
1,80
6.0
2,15
6.0
3,54
1.0
2,66
0.0
2,10
0.0
2,51
8.0
2,66
4.0
2,63
9.0
2,48
1.0
2,14
2.0
2,18
4.8
2,22
8.5
2,27
3.1
TO
TAL
REV
ENU
ES82
,348
.0
81,3
84.0
84
,421
.0
78,6
78.0
75
,875
.0
76,4
77.3
72
,923
.2
73,4
10.7
73
,783
.7
73,9
79.3
74
,561
.4
75,1
48.0
75
,739
.2
%
vs
prio
r yea
r-5
%-1
%4%
-7%
-4%
1%-5
%1%
1%0%
1%1%
1%
TOTA
L R
ESO
UR
CES
139,
036.
0
12
9,21
2.0
132,
249.
0
11
6,58
5.6
98,5
56.9
88
,489
.6
69,2
71.3
59
,171
.5
49,5
67.1
37
,197
.0
21,1
91.3
10
,171
.4
(1,6
67.2
)
EXPE
ND
ITU
RES
Per
sona
l Ser
vice
s16
,454
.0
15,8
07.0
15
,336
.0
13,8
67.0
14
,102
.7
14,6
52.7
15
,224
.2
15,8
17.9
16
,434
.8
17,0
75.8
17
,741
.8
18,4
33.7
19
,152
.6
O
PE
B1,
297.
0
1,
752.
0
1,
300.
0
1,
300.
0
1,
322.
1
1,
373.
7
1,
427.
2
1,
482.
9
1,
540.
7
1,
600.
8
1,
663.
3
1,
728.
1
1,
795.
5
Ope
ratin
g E
xpen
ses
8,29
8.0
7,30
9.0
9,42
1.0
7,72
6.0
7,90
3.7
8,05
3.9
8,20
6.9
8,36
2.8
8,53
0.1
8,70
0.7
8,86
6.0
9,03
4.4
9,21
5.1
P
urch
ase
of W
ater
46,2
59.0
48
,981
.0
49,8
25.0
50
,180
.0
46,7
48.0
47
,246
.0
45,1
56.0
44
,043
.0
44,0
84.0
44
,181
.0
44,2
73.0
44
,366
.0
44,4
63.0
Pow
er1,
730.
0
1,
868.
0
1,
783.
0
1,
875.
0
1,
968.
8
2,
067.
2
2,
170.
5
2,
279.
1
2,
393.
0
2,
512.
7
2,
638.
3
2,
770.
2
2,
908.
7
Che
mic
als
951.
0
883.
0
887.
0
949.
0
1,01
5.4
1,08
6.5
1,16
2.6
1,24
3.9
1,33
1.0
1,42
4.2
1,52
3.9
1,63
0.6
1,74
4.7
G
rant
s &
Aid
s35
.0
260.
0
45.0
-
-
-
-
-
-
-
-
-
-
Cos
t Allo
catio
n5,
340.
0
5,
891.
0
5,
891.
0
4,
563.
0
4,
667.
9
4,
756.
6
4,
847.
0
4,
939.
1
5,
037.
9
5,
138.
6
5,
236.
3
5,
335.
8
5,
442.
5
Exp
endi
ture
Lap
se 1
%**
(844
.9)
(804
.6)
(777
.3)
(792
.4)
(781
.9)
(781
.7)
(793
.5)
(806
.3)
(819
.4)
(833
.0)
(847
.2)
-
Cap
ital O
utla
y10
,844
.0
22,4
04.0
11
,144
.0
14,8
42.0
9,
993.
0
14
,268
.0
6,35
2.0
6,25
1.0
8,11
6.0
11,1
87.0
5,
255.
0
5,
325.
0
5,
400.
0
Exp
endi
ture
Lap
se 4
% *
**(4
45.8
)
(5
93.7
)
(3
99.7
)
(5
70.7
)
(2
54.1
)
(2
50.0
)
(3
24.6
)
(4
47.5
)
(2
10.2
)
(2
13.0
)
(2
16.0
)
TOTA
L EX
PEN
DIT
UR
ES91
,208
.0
105,
155.
0
94
,341
.4
93,9
03.7
86
,544
.7
92,1
41.5
83
,510
.4
83,3
88.1
86
,349
.4
90,5
67.0
86
,167
.9
87,5
77.8
89
,059
.0
%
vs
prio
r yea
r(0
.07)
15
%-1
0%0%
-8%
6%-9
%0%
4%5%
-5%
2%2%
TOTA
L EN
DIN
G F
UN
D B
ALA
NC
E47
,828
.0
24,0
57.0
37
,907
.6
22,6
81.9
12
,012
.3
(3,6
51.9
)
(14,
239.
1)
(24,
216.
5)
(36,
782.
3)
(53,
370.
1)
(64,
976.
5)
(77,
406.
4)
(90,
726.
2)
End
ing
bala
nce
as %
of R
esou
rces
34%
19%
29%
19%
12%
-4%
-21%
-41%
-74%
-143
%-3
07%
-761
%54
42%
TOTA
L R
EQU
IREM
ENTS
139,
036.
0
12
9,21
2.0
132,
249.
0
11
6,58
5.6
98,5
56.9
88
,489
.6
69,2
71.3
59
,171
.5
49,5
67.1
37
,197
.0
21,1
91.3
10
,171
.4
(1,6
67.2
)
REV
ENU
E m
inus
EXP
END
ITU
RES
(8,8
60.0
)
(23,
771.
0)
(9,9
20.4
)
(15,
225.
7)
(10,
669.
7)
(15,
664.
2)
(10,
587.
2)
(9,9
77.4
)
(12,
565.
8)
(16,
587.
7)
(11,
606.
5)
(12,
429.
8)
(13,
319.
8)
(N
OT
cum
ulat
ive)
* O
pera
ting
Exp
ense
s ne
t of F
ull C
ost A
lloca
tion
** E
xpen
ditu
re la
pse
is c
alcu
late
d on
Per
sona
l Ser
vice
s, O
pera
ting
Exp
ense
s, a
nd G
rant
s &
Aid
s on
ly.
***
Exp
endi
ture
laps
e is
cal
cula
ted
on C
apita
l Out
lay
only
FOR
ECA
ST
Exhibit H-31

Exhibit H-32

Wat
er S
yste
m F
unds
For
ecas
t FY2
011
- FY2
020
with
Rat
e In
crea
ses
80,0
00
90,0
00
100,
000
110,
000
120,
000
2011
2012
2013
2014
2015
2016
2017
2018
2019
2020
Fisc
al Y
ears
Dollars (000's)
Reve
nues
Expe
nditu
res
Exhibit H-33

WA
TER
WIT
H R
ATE
INC
REA
SEFu
nd 0
531,
053
4, 0
536
& 0
560
Fore
cast
Ass
umpt
ions
2011
2012
2013
2014
2015
2016
2017
2018
2019
2020
REV
ENU
ESW
ater
Sal
es-R
etai
l-0
.6%
11.7
%6.
3%2.
0%3.
00%
3.00
%3.
00%
3.00
%3.
00%
0.75
%W
ater
Sal
es-W
hole
sale
-9.2
%-3
0.1%
6.2%
-37.
2%3.
00%
3.00
%3.
00%
3.00
%3.
00%
0.75
%In
tere
st2.
0%3.
0%4.
0%4.
0%4.
0%4.
0%4.
0%4.
0%4.
0%4.
0%O
ther
reve
nues
2.0%
2.0%
2.0%
2.0%
2.0%
2.0%
2.0%
2.0%
2.0%
2.0%
EXPE
ND
ITU
RES
Per
sona
l Ser
vice
s1.
7%1.
7%3.
9%3.
9%3.
9%3.
9%3.
9%3.
9%3.
9%3.
9%O
pera
ting
Exp
ense
s1.
6%2.
3%1.
9%1.
9%1.
9%2.
0%2.
0%1.
9%1.
9%2.
0%P
urch
ase
of W
ater
8.9%
-7.8
%7.
2%-8
.9%
-0.2
%3.
3%3.
3%3.
3%3.
3%3.
3%P
ower
6.9%
5.0%
5.0%
5.0%
5.0%
5.0%
5.0%
5.0%
5.0%
5.0%
Che
mic
als
7.0%
7.0%
7.0%
7.0%
7.0%
7.0%
7.0%
7.0%
7.0%
7.0%
Proj
ecte
d Ec
onom
ic C
ondi
tions
/ In
dica
tors
:C
onsu
mer
Pric
e In
dex,
% c
hang
e1.
6%2.
3%1.
9%1.
9%1.
9%2.
0%2.
0%1.
9%1.
9%2.
0%FL
Per
Cap
ita P
erso
nal I
ncom
e G
row
th1.
5%3.
0%3.
7%2.
7%2.
5%2.
3%2.
3%2.
2%2.
4%2.
3%E
stim
ated
New
Con
stru
ctio
n %
of t
ax b
ase
0.2%
0.5%
1.0%
1.0%
1.0%
1.0%
1.0%
1.0%
1.0%
1.0%
Exhibit H-34

WA
TER
WIT
H R
ATE
INC
REA
SEFu
nd 0
531,
053
4, 0
536
& 0
560
(in $
thou
sand
s)A
ctua
lB
udge
tPr
ojec
ted
Bud
get
Estim
ated
Estim
ated
Estim
ated
Estim
ated
Estim
ated
Estim
ated
Estim
ated
Estim
ated
Estim
ated
2009
2010
2010
2011
2012
2013
2014
2015
2016
2017
2018
2019
2020
BEG
INN
ING
FU
ND
BA
LAN
CE
56,6
88.0
47
,828
.0
47,8
28.0
37
,907
.6
24,9
37.8
21
,174
.1
17,3
06.4
19
,084
.9
21,6
61.9
21
,792
.4
17,9
14.8
19
,052
.4
19,4
88.5
REV
ENU
ESW
ater
Sal
es -
Ret
ail
57,0
80.0
60
,317
.0
61,6
99.0
61
,310
.0
68,4
78.0
72
,761
.0
74,2
16.0
74
,772
.6
75,3
33.4
75
,898
.4
76,4
67.7
77
,041
.2
77,6
19.0
W
ater
Sal
es -
Who
lesa
le19
,605
.0
18,6
14.0
18
,115
.0
16,4
57.0
11
,511
.0
12,2
25.0
7,
681.
0
7,
738.
6
7,
796.
6
7,
855.
1
7,
914.
0
7,
973.
4
8,
033.
2
In
tere
st
3,85
7.0
297.
0
1,06
6.0
507.
0
692.
0
770.
0
728.
0
815.
0
869.
0
794.
0
739.
0
771.
0
772.
0
Oth
er R
even
ues
1,80
6.0
2,15
6.0
3,54
1.0
2,66
0.0
2,10
0.0
2,51
8.0
2,66
4.0
2,63
9.0
2,48
1.0
2,14
2.0
2,18
4.8
2,22
8.5
2,27
3.1
TOTA
L R
EVEN
UES
82,3
48.0
81
,384
.0
84,4
21.0
80
,934
.0
82,7
81.0
88
,274
.0
85,2
89.0
85
,965
.2
86,4
80.1
86
,689
.5
87,3
05.5
88
,014
.1
88,6
97.3
%
vs
prio
r yea
r-5
%-1
%4%
-4%
2%7%
-3%
1%1%
0%1%
1%1%
TOTA
L R
ESO
UR
CES
139,
036.
0
129,
212.
0
132,
249.
0
118,
841.
6
107,
718.
8
109,
448.
1
102,
595.
4
105,
050.
1
108,
142.
0
108,
482.
0
105,
220.
4
107,
066.
4
108,
185.
7
EXPE
ND
ITU
RES
Per
sona
l Ser
vice
s16
,454
.0
15,8
07.0
15
,336
.0
13,8
67.0
14
,102
.7
14,6
52.7
15
,224
.2
15,8
17.9
16
,434
.8
17,0
75.8
17
,741
.8
18,4
33.7
19
,152
.6
OP
EB
1,29
7.0
1,75
2.0
1,30
0.0
1,30
0.0
1,32
2.1
1,37
3.7
1,42
7.2
1,48
2.9
1,54
0.7
1,60
0.8
1,66
3.3
1,72
8.1
1,79
5.5
Ope
ratin
g E
xpen
ses
8,29
8.0
7,30
9.0
9,42
1.0
7,72
6.0
7,90
3.7
8,05
3.9
8,20
6.9
8,36
2.8
8,53
0.1
8,70
0.7
8,86
6.0
9,03
4.4
9,21
5.1
Pur
chas
e of
Wat
er46
,259
.0
48,9
81.0
49
,825
.0
50,1
80.0
46
,748
.0
47,2
46.0
45
,156
.0
44,0
43.0
44
,084
.0
44,1
81.0
44
,273
.0
44,3
66.0
44
,463
.0
Pow
er1,
730.
0
1,
868.
0
1,
783.
0
1,
875.
0
1,
968.
8
2,
067.
2
2,
170.
5
2,
279.
1
2,
393.
0
2,
512.
7
2,
638.
3
2,
770.
2
2,
908.
7
C
hem
ical
s95
1.0
88
3.0
88
7.0
94
9.1
1,
015.
5
1,
086.
6
1,
162.
7
1,
244.
1
1,
331.
1
1,
424.
3
1,
524.
0
1,
630.
7
1,
744.
9
G
rant
s &
Aid
s35
.0
26
0.0
45
.0
-
-
-
-
-
-
-
-
-
-
C
ost A
lloca
tion
5,34
0.0
5,89
1.0
5,89
1.0
4,56
3.0
4,66
7.9
4,75
6.6
4,84
7.0
4,93
9.1
5,03
7.9
5,13
8.6
5,23
6.3
5,33
5.8
5,44
2.5
Exp
endi
ture
Lap
se 1
%**
(844
.9)
(804
.6)
(777
.3)
(792
.4)
(781
.9)
(781
.7)
(793
.5)
(806
.3)
(819
.4)
(833
.0)
(847
.2)
Cap
ital O
utla
y10
,844
.0
22,4
04.0
11
,144
.0
14,8
42.0
9,
993.
0
14
,268
.0
6,35
2.0
6,25
1.0
8,11
6.0
11,1
87.0
5,
255.
0
5,
325.
0
5,
400.
0
E
xpen
ditu
re L
apse
4%
***
(445
.8)
(593
.7)
(399
.7)
(570
.7)
(254
.1)
(250
.0)
(324
.6)
(447
.5)
(210
.2)
(213
.0)
(216
.0)
TOTA
L EX
PEN
DIT
UR
ES91
,208
.0
105,
155.
0
94,3
41.4
93
,903
.8
86,5
44.8
92
,141
.6
83,5
10.5
83
,388
.2
86,3
49.6
90
,567
.1
86,1
68.0
87
,578
.0
89,0
59.1
%
vs
prio
r yea
r(0
.07)
15
%-1
0%0%
-8%
6%-9
%0%
4%5%
-5%
2%2%
TOTA
L EN
DIN
G F
UN
D B
ALA
NC
E47
,828
.0
24,0
57.0
37
,907
.6
24,9
37.8
21
,174
.1
17,3
06.4
19
,084
.9
21,6
61.9
21
,792
.4
17,9
14.8
19
,052
.4
19,4
88.5
19
,126
.6
End
ing
bala
nce
as %
of R
esou
rces
34%
19%
29%
21%
20%
16%
19%
21%
20%
17%
18%
18%
18%
TOTA
L R
EQU
IREM
ENTS
139,
036.
0
129,
212.
0
132,
249.
0
118,
841.
6
107,
718.
8
109,
448.
1
102,
595.
4
105,
050.
1
108,
142.
0
108,
482.
0
105,
220.
4
107,
066.
4
108,
185.
7
REV
ENU
E m
inus
EXP
END
ITU
RES
(8,8
60.0
)
(23,
771.
0)
(9,9
20.4
)
(12,
969.
8)
(3,7
63.8
)
(3,8
67.6
)
1,77
8.5
2,57
7.0
130.
5
(3,8
77.6
)
1,13
7.5
436.
1
(361
.9)
(NO
T cu
mul
ativ
e)
* O
pera
ting
Exp
ense
s ne
t of C
ost A
lloca
tion
** E
xpen
ditu
re la
pse
is c
alcu
late
d on
Per
sona
l Ser
vice
s, O
pera
ting
Exp
ense
s, a
nd G
rant
s &
Aid
s on
ly.
*** E
xpen
ditu
re la
pse
is c
alcu
late
d on
Cap
ital O
utla
y on
ly
FOR
ECA
ST
Exhibit H-35

Exhibit H-36
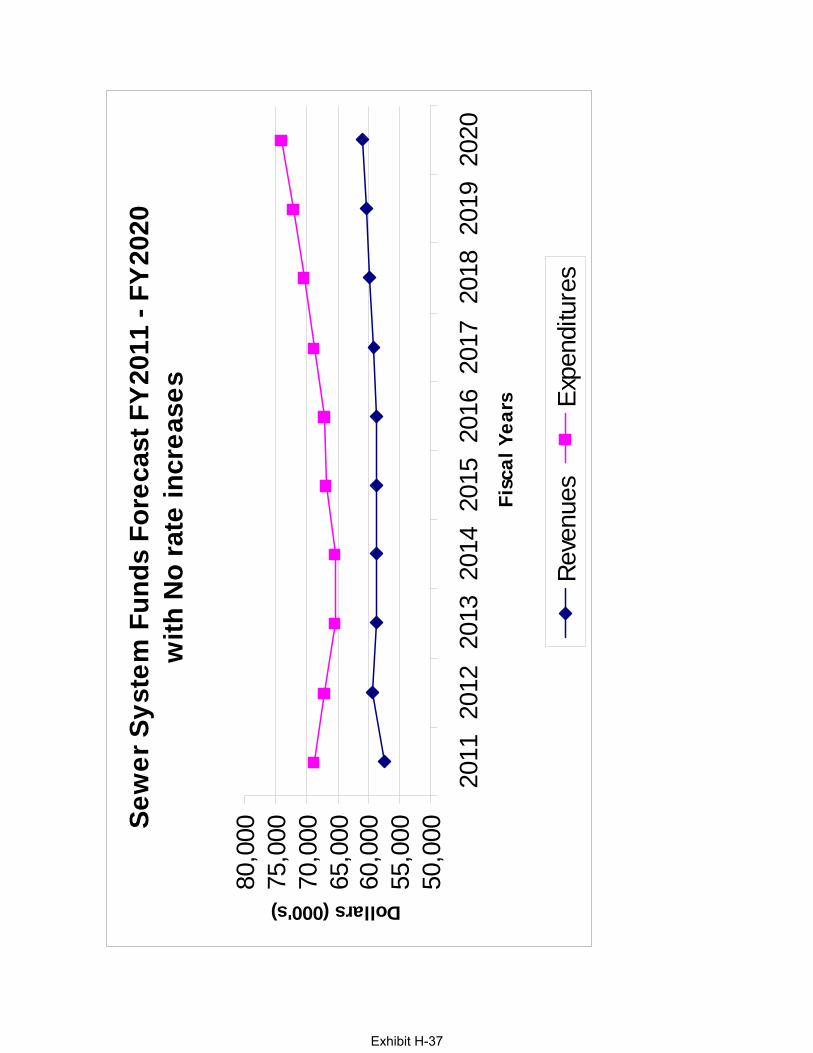
Sew
er S
yste
m F
unds
For
ecas
t FY
2011
- FY
2020
with
No
rate
incr
ease
s
50,0
0055
,000
60,0
0065
,000
70,0
0075
,000
80,0
00
2011
2012
2013
2014
2015
2016
2017
2018
2019
2020
Fisc
al Y
ears
Dollars (000's)
Reve
nues
Expe
nditu
res
Exhibit H-37

SEW
ER W
ITH
OU
T R
ATE
INC
REA
SEFu
nd 0
551,
055
2, 0
553
& 0
560
Fore
cast
Ass
umpt
ions
2011
2012
2013
2014
2015
2016
2017
2018
2019
2020
REV
ENU
ESS
ewer
Cha
rges
- R
etai
l0.
0 %0.
25%
0.25
%0.
25%
0.25
%0.
25%
0.25
%0.
25%
0.25
%0.
25%
Sew
er C
harg
es -
Who
lesa
le0.
25%
0.25
%0.
25%
0.25
%0.
25%
0.25
%0.
25%
0.25
%0.
25%
0.25
%R
ecla
imed
- R
etai
l0.
25%
0.25
%0.
25%
0.25
%0.
25%
0.25
%0.
25%
0.25
%0.
25%
0.25
%R
ecla
imed
- W
hole
sale
2.0%
2.0%
2.0%
2.0%
2.0%
2.0%
2.0%
2.0%
2.0%
2.0%
Inte
rest
2.0%
3.0%
4.0%
4.0%
4.0%
4.0%
4.0%
4.0%
4.0%
4.0%
Oth
er re
venu
es2.
0%2.
0%2.
0%2.
0%2.
0%2.
0%2.
0%2.
0%2.
0%2.
0%
EXPE
ND
ITU
RES
Per
sona
l Ser
vice
s1.
7 %1.
7%3.
9%3.
9%3.
9%3.
9%3.
9%3.
9%3.
9%3.
9%O
pera
ting
Exp
ense
s1.
6%2.
3%1.
9%1.
9%1.
9%2.
0%2.
0%1.
9%1.
9%2.
0%P
ower
7.0%
5.0%
5.0%
5.0%
5.0%
5.0%
5.0%
5.0%
5.0%
5.0%
Che
mic
als
7.0%
7.0%
7.0%
7.0%
7.0%
7.0%
7.0%
7.0%
7.0%
7.0%
Cap
ital O
utla
y1.
6%2.
3%1.
9%1.
9%1.
9%2.
0%2.
0%1.
9%1.
9%2.
0%G
rant
s &
Aid
s1.
6%2.
3%1.
9%1.
9%1.
9%2.
0%2.
0%1.
9%1.
9%2.
0%
Proj
ecte
d Ec
onom
ic C
ondi
tions
/ In
dica
tors
:C
onsu
mer
Pric
e In
dex,
% c
hang
e1.
6%2.
3%1.
9%1.
9%1.
9%2.
0%2.
0%1.
9%1.
9%2.
0%FL
Per
Cap
ita P
erso
nal I
ncom
e G
row
th1.
5%3.
0%3.
7%2.
7%2.
5%2.
3%2.
3%2.
2%2.
4%2.
3%E
stim
ated
New
Con
stru
ctio
n %
of t
ax b
ase
0.2%
0.5%
1.0%
1.0%
1.0%
1.0%
1.0%
1.0%
1.0%
1.0%
Exhibit H-38

SEW
ER W
ITH
OU
T R
ATE
INC
REA
SEFu
nd 0
551,
055
2, 0
553
& 0
560
(in $
thou
sand
s)A
ctua
lB
udge
tPr
ojec
ted
Bud
get
Estim
ated
Estim
ated
Estim
ated
Estim
ated
Estim
ated
Estim
ated
Estim
ated
Estim
ated
Estim
ated
2009
2010
2010
2011
2012
2013
2014
2015
2016
2017
2018
2019
2020
BEG
INN
ING
FU
ND
BA
LAN
CE
39,3
74.0
40
,862
.0
40,8
62.0
43
,729
.4
32,6
43.9
25
,144
.4
18,4
54.0
11
,740
.7
3,49
3.2
(4
,934
.1)
(1
4,39
2.1)
(24,
960.
2)
(3
6,67
0.7)
REV
ENU
ESS
ewer
Cha
rges
- R
etai
l43
,410
.0
43,0
54.0
45
,039
.0
43,3
06.0
45
,264
.0
44,3
98.0
44
,509
.0
44,6
20.0
44
,732
.0
44,8
43.0
44
,955
.0
45,0
68.0
45
,181
.0
Sew
er C
harg
es -
Who
lesa
le6,
898.
0
6,
605.
0
6,
890.
0
6,
651.
0
7,
184.
0
7,
202.
0
7,
220.
0
7,
238.
0
7,
256.
0
7,
274.
0
7,
293.
0
7,
311.
0
7,
329.
0
R
ecla
imed
- R
etai
l2,
332.
0
2,
227.
0
2,
703.
0
2,
574.
0
2,
717.
0
2,
723.
8
2,
730.
6
2,
737.
4
2,
744.
3
2,
751.
1
2,
758.
0
2,
764.
9
2,
771.
8
R
ecla
imed
- W
hole
sale
355.
0
359.
0
291.
0
307.
0
333.
0
339.
0
345.
8
352.
7
359.
7
366.
9
374.
3
381.
8
389.
4
Inte
rest
3,
259.
0
29
4.0
1,
085.
0
86
8.0
86
7.0
87
2.0
60
4.0
30
5.0
-
-
-
-
-
Oth
er R
even
ues
5,52
5.0
7,49
8.0
4,89
7.0
3,81
9.0
3,06
5.0
3,04
9.0
3,19
2.0
3,30
8.0
3,58
2.0
3,97
5.0
4,40
4.0
4,87
7.0
5,40
9.0
TOTA
L R
EVEN
UES
61,7
79.0
60
,037
.0
60,9
05.0
57
,525
.0
59,4
30.0
58
,583
.8
58,6
01.4
58
,561
.1
58,6
74.0
59
,210
.1
59,7
84.3
60
,402
.7
61,0
80.2
%
vs
prio
r yea
r0%
-3%
-1%
-6%
3%-1
%0%
0%0%
1%1%
1%1%
TOTA
L R
ESO
UR
CES
101,
153.
0
100,
899.
0
101,
767.
0
10
1,25
4.4
92,0
73.9
83
,728
.2
77,0
55.4
70
,301
.8
62,1
67.2
54
,276
.0
45,3
92.2
35
,442
.5
24,4
09.5
EXPE
ND
ITU
RES
Per
sona
l Ser
vice
s13
,817
.0
15,2
64.0
14
,656
.0
13,6
61.0
13
,893
.2
14,4
35.1
14
,998
.0
15,5
83.0
16
,190
.7
16,8
22.1
17
,478
.2
18,1
59.9
18
,868
.1
OP
EB
1,24
2.0
1,44
7.0
1,25
0.0
1,25
0.0
1,27
1.3
1,32
0.8
1,37
2.3
1,42
5.9
1,48
1.5
1,53
9.2
1,59
9.3
1,66
1.7
1,72
6.5
Ope
ratin
g E
xpen
ses
9,32
7.0
10,0
45.0
10
,553
.0
10,7
50.0
10
,997
.3
11,2
06.2
11
,419
.1
11,6
36.1
11
,868
.8
12,1
06.2
12
,336
.2
12,5
70.6
12
,822
.0
Pow
er4,
662.
0
5,
661.
0
4,
543.
0
4,
772.
0
5,
010.
6
5,
261.
1
5,
524.
2
5,
800.
4
6,
090.
4
6,
394.
9
6,
714.
7
7,
050.
4
7,
402.
9
C
hem
ical
s2,
804.
0
2,
858.
0
2,
770.
0
2,
953.
0
3,
159.
7
3,
380.
9
3,
617.
6
3,
870.
8
4,
141.
7
4,
431.
7
4,
741.
9
5,
073.
8
5,
429.
0
C
ost A
lloca
tion
3,79
4.0
4,02
1.0
4,02
1.0
3,45
7.0
3,53
6.5
3,60
3.7
3,67
2.2
3,74
1.9
3,81
6.8
3,89
3.1
3,96
7.1
4,04
2.5
4,12
3.3
Exp
endi
ture
Lap
se 1
%**
(377
.9)
(3
68.4
)
(378
.7)
(3
92.1
)
(406
.0)
(4
20.6
)
(435
.9)
(4
51.9
)
(468
.4)
(4
85.6
)
(503
.7)
D
ebt S
ervi
ce15
,709
.0
15,2
36.0
15
,236
.0
15,2
37.0
15
,246
.0
15,2
38.0
15
,237
.0
15,2
39.0
15
,243
.0
15,2
38.0
15
,233
.0
15,2
33.0
15
,239
.0
Cap
ital O
utla
y8,
936.
0
9,
298.
0
5,
611.
0
17
,603
.0
14,7
85.0
11
,688
.0
10,2
92.0
10
,346
.0
9,06
7.0
9,05
7.0
9,11
5.0
9,17
4.0
9,23
7.0
Exp
endi
ture
Lap
se 4
% *
**(2
24.4
)
(704
.1)
(5
91.4
)
(467
.5)
(4
11.7
)
(413
.8)
(3
62.7
)
(362
.3)
(3
64.6
)
(367
.0)
(3
69.5
)
TOTA
L EX
PEN
DIT
UR
ES60
,291
.0
63,8
30.0
58
,037
.6
68,6
10.5
66
,929
.5
65,2
74.2
65
,314
.7
66,8
08.6
67
,101
.3
68,6
68.1
70
,352
.3
72,1
13.2
73
,974
.6
% v
s pr
ior y
ear
(0.2
2)
6%-9
%18
%-2
%-2
%0%
2%0%
2%2%
3%3%
TOTA
L EN
DIN
G F
UN
D B
ALA
NC
E40
,862
.0
37,0
69.0
43
,729
.4
32,6
43.9
25
,144
.4
18,4
54.0
11
,740
.7
3,49
3.2
(4,9
34.1
)
(14,
392.
1)
(2
4,96
0.2)
(36,
670.
7)
(4
9,56
5.1)
End
ing
bala
nce
as %
of R
esou
rces
40%
37%
43%
32%
27%
22%
15%
5%-8
%-2
7%-5
5%-1
03%
-203
%
TOTA
L R
EQU
IREM
ENTS
101,
153.
0
100,
899.
0
101,
767.
0
10
1,25
4.4
92,0
73.9
83
,728
.2
77,0
55.4
70
,301
.8
62,1
67.2
54
,276
.0
45,3
92.2
35
,442
.5
24,4
09.5
D
ebt S
ervi
ce C
over
age
1.5
1.4
1.4
1.3
1.2
1.1
1.0
0.9
0.9
0.8
0.7
REV
ENU
E m
inus
EXP
END
ITU
RES
1,48
8.0
(3,7
93.0
)
2,
867.
4
(1
1,08
5.5)
(7
,499
.5)
(6,6
90.4
)
(6
,713
.3)
(8,2
47.5
)
(8
,427
.3)
(9,4
58.0
)
(1
0,56
8.1)
(1
1,71
0.5)
(1
2,89
4.3)
(N
OT
cum
ulat
ive)
* O
pera
ting
Exp
ense
s ne
t of C
ost A
lloca
tion
** E
xpen
ditu
re la
pse
is c
alcu
late
d on
Per
sona
l Ser
vice
s, O
pera
ting
Exp
ense
s, a
nd G
rant
s &
Aid
s on
ly.
*** E
xpen
ditu
re la
pse
is c
alcu
late
d on
Cap
ital O
utla
y on
l y
FOR
ECA
ST
Exhibit H-39

Exhibit H-40

Sew
er S
yste
m F
orec
ast F
Y11-
FY20
with
rate
incr
ease
55,0
0060
,000
65,0
0070
,000
75,0
0080
,000
2011
2012
2013
2014
2015
2016
2017
2018
2019
2020
Fisc
al Y
ears
Dollars (000's)
Rev
enue
sE
xpen
ditu
res
Exhibit H-41

SEW
ER W
ITH
RA
TE IN
CR
EASE
Fund
055
1, 0
552,
055
3 &
056
0
Fore
cast
Ass
umpt
ions
2011
2012
2013
2014
2015
2016
2017
2018
2019
2020
REV
ENU
ESS
ewer
Cha
rges
- R
etai
l0.
0 %2.
00%
2.00
%2.
00%
2.00
%2.
00%
2.00
%2.
00%
2.00
%2.
00%
Sew
er C
harg
es -
Who
lesa
le0.
25%
2.00
%2.
00%
2.00
%2.
00%
2.00
%2.
00%
2.00
%2.
00%
2.00
%R
ecla
imed
- R
etai
l40
.00%
2.00
%2.
00%
2.00
%2.
00%
2.00
%2.
00%
2.00
%2.
00%
2.00
%R
ecla
imed
- W
hole
sale
5.5%
8.5%
2.0%
2.0%
2.0%
2.0%
2.0%
2.0%
2.0%
2.0%
Inte
rest
2.0%
3.0%
4.0%
4.0%
4.0%
4.0%
4.0%
4.0%
4.0%
4.0%
Oth
er re
venu
es2.
0%2.
0%2.
0%2.
0%2.
0%2.
0%2.
0%2.
0%2.
0%2.
0%
EXPE
ND
ITU
RES
Per
sona
l Ser
vice
s1.
7 %1.
7%3.
9%3.
9%3.
9%3.
9%3.
9%3.
9%3.
9%3.
9%O
pera
ting
Exp
ense
s1.
6%2.
3%1.
9%1.
9%1.
9%2.
0%2.
0%1.
9%1.
9%2.
0%P
ower
& C
hem
ical
s5.
0%5.
0%5.
0%5.
0%5.
0%5.
0%5.
0%5.
0%5.
0%5.
0%C
hem
ical
s7.
0%7.
0%7.
0%7.
0%7.
0%7.
0%7.
0%7.
0%7.
0%7.
0%C
apita
l Out
lay
1.6%
2.3%
1.9%
1.9%
1.9%
2.0%
2.0%
1.9%
1.9%
2.0%
Gra
nts
& A
ids
1.6%
2.3%
1.9%
1.9%
1.9%
2.0%
2.0%
1.9%
1.9%
2.0%
Proj
ecte
d Ec
onom
ic C
ondi
tions
/ In
dica
tors
:C
onsu
mer
Pric
e In
dex,
% c
hang
e1.
6%2.
3%1.
9%1.
9%1.
9%2.
0%2.
0%1.
9%1.
9%2.
0%FL
Per
Cap
ita P
erso
nal I
ncom
e G
row
th1.
5%3.
0%3.
7%2.
7%2.
5%2.
3%2.
3%2.
2%2.
4%2.
3%E
stim
ated
New
Con
stru
ctio
n %
of t
ax b
ase
0.2%
0.5%
1.0%
1.0%
1.0%
1.0%
1.0%
1.0%
1.0%
1.0%
Exhibit H-42

SEW
ER W
ITH
RA
TE IN
CR
EASE
Fund
055
1, 0
552,
055
3 &
056
0
(in $
thou
sand
s)A
ctua
lB
udge
tPr
ojec
ted
Bud
get
Estim
ated
Estim
ated
Estim
ated
Estim
ated
Estim
ated
Estim
ated
Estim
ated
Estim
ated
Estim
ated
2009
2010
2010
2011
2012
2013
2014
2015
2016
2017
2018
2019
2020
BEG
INN
ING
FU
ND
BA
LAN
CE
39,3
74.0
40
,862
.0
40,8
62.0
43
,729
.4
34,0
55.9
28
,549
.5
25,8
53.4
24
,187
.3
22,0
99.1
20
,976
.0
19,6
98.3
18
,195
.1
16,4
42.4
REV
ENU
ESS
ewer
Cha
rges
- R
etai
l43
,410
.0
43,0
54.0
45
,039
.0
43,5
37.0
45
,697
.0
46,4
99.0
47
,314
.0
48,1
42.0
48
,984
.0
49,8
41.0
50
,713
.0
51,6
00.0
52
,503
.0
Sew
er C
harg
es -
Who
lesa
le6,
898.
0
6,
605.
0
6,
890.
0
6,
651.
0
7,
377.
0
7,
531.
0
7,
663.
0
7,
797.
0
7,
933.
0
8,
072.
0
8,
213.
0
8,
357.
0
8,
503.
0
R
ecla
imed
- R
etai
l2,
332.
0
2,
227.
0
2,
703.
0
3,
755.
0
4,
012.
0
4,
072.
0
4,
133.
0
4,
195.
0
4,
258.
0
4,
322.
0
4,
387.
0
4,
452.
0
4,
519.
0
R
ecla
imed
- W
hole
sale
355.
0
359.
0
291.
0
307.
0
333.
0
339.
0
345.
8
352.
7
359.
7
366.
9
374.
3
381.
8
389.
4
Inte
rest
3,
259.
0
29
4.0
1,
085.
0
86
8.0
93
9.1
1,
088.
1
1,
000.
8
92
5.7
86
1.5
81
3.5
75
7.9
69
2.8
61
7.0
O
ther
Rev
enue
s5,
525.
0
7,
498.
0
4,
897.
0
3,
819.
0
3,
065.
0
3,
049.
0
3,
192.
0
3,
308.
0
3,
582.
0
3,
975.
0
4,
404.
0
4,
877.
0
5,
409.
0
TO
TAL
REV
ENU
ES61
,779
.0
60,0
37.0
60
,905
.0
58,9
37.0
61
,423
.1
62,5
78.1
63
,648
.6
64,7
20.4
65
,978
.3
67,3
90.4
68
,849
.2
70,3
60.5
71
,940
.4
% v
s pr
ior y
ear
0%-3
%-1
%-3
%4%
2%2%
2%2%
2%2%
2%2%
TOTA
L R
ESO
UR
CES
101,
153.
0
100,
899.
0
101,
767.
0
10
2,66
6.4
95,4
79.0
91
,127
.6
89,5
02.0
88
,907
.7
88,0
77.3
88
,366
.4
88,5
47.5
88
,555
.6
88,3
82.8
EXPE
ND
ITU
RES
Per
sona
l Ser
vice
s13
,817
.0
15,2
64.0
14
,656
.0
13,6
61.0
13
,893
.2
14,4
35.1
14
,998
.0
15,5
83.0
16
,190
.7
16,8
22.1
17
,478
.2
18,1
59.9
18
,868
.1
OP
EB
1,24
2.0
1,44
7.0
1,25
0.0
1,25
0.0
1,27
1.3
1,32
0.8
1,37
2.3
1,42
5.9
1,48
1.5
1,53
9.2
1,59
9.3
1,66
1.7
1,72
6.5
Ope
ratin
g E
xpen
ses
9,32
7.0
10,0
45.0
10
,553
.0
10,7
50.0
10
,997
.3
11,2
06.2
11
,419
.1
11,6
36.1
11
,868
.8
12,1
06.2
12
,336
.2
12,5
70.6
12
,822
.0
Pow
er4,
662.
0
5,
661.
0
4,
543.
0
4,
772.
0
5,
010.
6
5,
261.
1
5,
524.
2
5,
800.
4
6,
090.
4
6,
394.
9
6,
714.
7
7,
050.
4
7,
402.
9
C
hem
ical
s2,
804.
0
2,
858.
0
2,
770.
0
2,
953.
0
3,
159.
7
3,
380.
9
3,
617.
6
3,
870.
8
4,
141.
7
4,
431.
7
4,
741.
9
5,
073.
8
5,
429.
0
C
ost A
lloca
tion
3,79
4.0
4,02
1.0
4,02
1.0
3,45
7.0
3,53
6.5
3,60
3.7
3,67
2.2
3,74
1.9
3,81
6.8
3,89
3.1
3,96
7.1
4,04
2.5
4,12
3.3
Exp
endi
ture
Lap
se 1
%**
(377
.9)
(3
68.4
)
(378
.7)
(3
92.1
)
(406
.0)
(4
20.6
)
(435
.9)
(4
51.9
)
(468
.4)
(4
85.6
)
(503
.7)
D
ebt S
ervi
ce15
,709
.0
15,2
36.0
15
,236
.0
15,2
37.0
15
,246
.0
15,2
38.0
15
,237
.0
15,2
39.0
15
,243
.0
15,2
38.0
15
,233
.0
15,2
33.0
15
,239
.0
Cap
ital O
utla
y8,
936.
0
9,
298.
0
5,
611.
0
17
,603
.0
14,7
85.0
11
,688
.0
10,2
92.0
10
,346
.0
9,06
7.0
9,05
7.0
9,11
5.0
9,17
4.0
9,23
7.0
Exp
endi
ture
Lap
se 4
% *
**(2
24.4
)
(704
.1)
(5
91.4
)
(467
.5)
(4
11.7
)
(413
.8)
(3
62.7
)
(362
.3)
(3
64.6
)
(367
.0)
(3
69.5
)
TOTA
L EX
PEN
DIT
UR
ES60
,291
.0
63,8
30.0
58
,037
.6
68,6
10.5
66
,929
.5
65,2
74.2
65
,314
.7
66,8
08.6
67
,101
.3
68,6
68.1
70
,352
.3
72,1
13.2
73
,974
.6
% v
s pr
ior y
ear
(0.2
2)
6%-9
%18
%-2
%-2
%0%
2%0%
2%2%
3%3%
TOTA
L EN
DIN
G F
UN
D B
ALA
NC
E40
,862
.0
37,0
69.0
43
,729
.4
34,0
55.9
28
,549
.5
25,8
53.4
24
,187
.3
22,0
99.1
20
,976
.0
19,6
98.3
18
,195
.1
16,4
42.4
14
,408
.3
End
ing
bala
nce
as %
of R
esou
rces
40%
37%
43%
33%
30%
28%
27%
25%
24%
22%
21%
19%
16%
TOTA
L R
EQU
IREM
ENTS
101,
153.
0
100,
899.
0
101,
767.
0
10
2,66
6.4
95,4
79.0
91
,127
.6
89,5
02.0
88
,907
.7
88,0
77.3
88
,366
.4
88,5
47.5
88
,555
.6
88,3
82.8
D
ebt S
ervi
ce C
over
age
1.5
1.5
1.6
1.6
1.5
1.5
1.5
1.5
1.5
1.5
1.4
REV
ENU
E m
inus
EXP
END
ITU
RES
1,48
8.0
(3,7
93.0
)
2,
867.
4
(9
,673
.5)
(5,5
06.4
)
(2
,696
.2)
(1,6
66.1
)
(2
,088
.2)
(1,1
23.1
)
(1
,277
.7)
(1,5
03.2
)
(1
,752
.7)
(2,0
34.1
)
(N
OT
cum
ulat
ive)
* O
pera
ting
Exp
ense
s ne
t of C
ost A
lloca
tion
** E
xpen
ditu
re la
pse
is c
alcu
late
d on
Per
sona
l Ser
vice
s, O
pera
ting
Exp
ense
s, a
nd G
rant
s &
Aid
s on
ly.
*** E
xpen
ditu
re la
pse
is c
alcu
late
d on
Cap
ital O
utla
y on
l y
FOR
ECA
ST
Exhibit H-43

Exhibit H-44

Solid
Was
te F
unds
For
ecas
t FY2
011
- FY2
020
60,0
00
90,0
00
120,
000
150,
000
2011
2012
2013
2014
2015
2016
2017
2018
2019
2020
Fisc
al Y
ears
Dollars (000's)
Reve
nues
Expe
nditu
res
Exhibit H-45

SOLI
D W
AST
E FU
ND
FO
REC
AST
0521
, 052
3 an
d 05
60
Fore
cast
Ass
umpt
ions
2011
2012
2013
2014
2015
2016
2017
2018
2019
2020
REV
ENU
ESTi
ppin
g Fe
es0.
5 %0.
5%0.
5%0.
5%0.
5%0.
5%0.
5%0.
5%0.
5%0.
5%E
lect
ricity
Sal
es0.
5%0.
5%0.
5%0.
5%0.
5%0.
5%0.
5%0.
5%0.
5%0.
5%E
lect
rical
Cap
acity
6.3%
6.3%
6.4%
6.4%
6.4%
6.4%
6.4%
6.4%
6.4%
6.4%
Rec
yclin
g R
even
ue33
.3%
2.0%
2.0%
2.0%
2.0%
2.0%
2.0%
2.0%
2.0%
2.0%
Inte
rest
2.0%
3.0%
4.0%
4.0%
4.0%
4.0%
4.0%
4.0%
4.0%
4.0%
Insu
ranc
e P
roce
eds
0.0%
0.0%
0.0%
0.0%
0.0%
0.0%
0.0%
0.0%
0.0%
0.0%
Oth
er re
venu
es63
.2%
2.0%
2.0%
2.0%
2.0%
2.0%
2.0%
2.0%
2.0%
2.0%
EXPE
ND
ITU
RES
Per
sona
l Ser
vice
s1.
7 %1.
7%3.
9%3.
9%3.
9%3.
9%3.
9%3.
9%3.
9%3.
9%O
PE
B1.
7%3.
9%3.
9%3.
9%3.
9%3.
9%3.
9%3.
9%3.
9%3.
9%O
pera
ting
Exp
ense
s9.
9%2.
3%1.
9%1.
9%1.
9%2.
0%2.
0%1.
9%1.
9%2.
0%W
TE S
ervi
ce F
ee-2
.5%
2.3%
1.9%
1.9%
1.9%
2.0%
2.0%
1.9%
1.9%
2.0%
Land
fill S
ervi
ce F
ee1.
6%2.
3%1.
9%1.
9%1.
9%2.
0%2.
0%1.
9%1.
9%2.
0%C
urbs
ide
Rec
yclin
g-5
7.0%
8.7%
4.9%
13.9
%4.
1%2.
0%2.
0%1.
9%1.
9%2.
0%Li
tter P
rogr
am-6
.2%
-7.6
%1.
4%1.
4%1.
3%2.
0%2.
0%1.
9%1.
9%2.
0%B
each
Rec
yclin
g-6
0.2%
-8.0
%-3
.5%
0.9%
1.4%
2.0%
2.0%
1.9%
1.9%
2.0%
Gra
nts
& A
ids
27.7
%-1
.2%
0.0%
0.0%
0.0%
2.0%
2.0%
1.9%
1.9%
2.0%
Cos
t Allo
catio
n1.
6%2.
3%1.
9%1.
9%1.
9%2.
0%2.
0%1.
9%1.
9%2.
0%
Proj
ecte
d Ec
onom
ic C
ondi
tions
/ In
dica
tors
:C
onsu
mer
Pric
e In
dex,
% c
hang
e1.
6%2.
3%1.
9%1.
9%1.
9%2.
0%2.
0%1.
9%1.
9%2.
0%FL
Per
Cap
ita P
erso
nal I
ncom
e G
row
th1.
5%3.
0%3.
7%2.
7%2.
5%2.
3%2.
3%2.
2%2.
4%2.
3%E
stim
ated
New
Con
stru
ctio
n %
of t
ax b
ase
0.2%
0.5%
1.0%
1.0%
1.0%
1.0%
1.0%
1.0%
1.0%
1.0%
Exhibit H-46

SOLI
D W
AST
E FU
ND
FO
REC
AST
0521
, 052
3 an
d 05
60
(in $
thou
sand
s)A
ctua
lB
udge
tPr
ojec
ted
Bud
get
Estim
ated
Estim
ated
Estim
ated
Estim
ated
Estim
ated
Estim
ated
Estim
ated
Estim
ated
Estim
ated
2009
2010
2010
2011
2012
2013
2014
2015
2016
2017
2018
2019
2020
BEG
INN
ING
FU
ND
BA
LAN
CE
122,
884
127,
169
127,
169
121,
128
109,
244
93,0
4610
3,84
512
2,32
914
2,72
315
5,57
016
0,54
616
5,25
319
1,35
2
REV
ENU
ESTi
ppin
g Fe
es34
,575
34,0
1334
,977
33,3
9535
,328
35,5
0535
,682
35,8
6136
,040
36,2
2036
,401
36,5
8336
,766
Ele
ctric
ity S
ales
8,37
910
,105
10,1
169,
658
10,2
1710
,268
10,3
1910
,371
10,4
2310
,475
10,5
2710
,580
10,6
33E
lect
rical
Cap
acity
24,5
4730
,994
30,4
7632
,961
36,8
9739
,244
41,7
3844
,390
47,2
1250
,219
53,4
1356
,814
60,4
33R
ecyc
ling
Rev
enue
712
00
1,00
01,
020
1,04
01,
061
1,08
21,
104
1,12
61,
149
1,17
2In
tere
st3,
805
1,14
22,
464
2,20
12,
975
3,51
63,
760
4,19
24,
506
4,50
24,
327
4,57
65,
303
Insu
ranc
e P
roce
eds
4,58
50
2,86
90
00
00
00
00
0O
ther
reve
nues
867
409
441
737
791
807
823
839
856
873
891
909
927
TOTA
L R
EVEN
UES
76,7
5877
,375
81,3
4378
,952
87,2
0890
,360
93,3
6396
,715
100,
120
103,
393
106,
685
110,
611
115,
234
% v
s pr
ior y
ear
-3%
1%6%
-3%
10%
4%3%
4%4%
3%3%
4%4%
TOTA
L R
ESO
UR
CES
199,
642
204,
544
208,
512
200,
080
196,
452
183,
406
197,
208
219,
044
242,
843
258,
963
267,
231
275,
863
306,
586
EXPE
ND
ITU
RES
Per
sona
l Ser
vice
s5,
188
5,99
65,
905
5,83
05,
929
6,16
06,
401
6,65
06,
910
7,17
97,
459
7,75
08,
052
OP
EB
410
351
410
450
458
476
494
514
534
555
576
599
622
Ope
ratin
g E
xpen
ses
*9,
082
8,43
88,
421
7,86
07,
329
7,46
87,
610
7,75
57,
910
8,06
88,
221
8,37
88,
545
WTE
Ser
vice
Fee
17,9
6428
,451
24,8
2625
,075
25,6
5226
,139
26,6
3627
,142
27,6
8528
,238
28,7
7529
,322
29,9
08La
ndfil
l Ser
vice
Fee
9,72
410
,834
9,52
510
,995
11,2
4811
,462
11,6
7911
,901
12,1
3912
,382
12,6
1712
,857
13,1
14C
urbs
ide
Rec
yclin
g22
,181
307,
175
12,3
7512
,375
12,3
7512
,375
12,3
7512
,375
12,3
7512
,375
12,3
75Li
tter P
rogr
am84
525
024
422
072
557
257
257
257
257
257
257
2B
each
Rec
yclin
g62
549
937
8240
4040
4040
4040
N. C
ty, H
EC
3 Cos
ts82
51,
162
1,20
41,
310
1,44
51,
593
1,75
11,
937
2,12
6G
rant
s &
Aid
s49
73,
250
500
2,97
53,
800
3,80
03,
800
3,80
03,
800
3,80
03,
800
3,80
03,
800
Cos
t Allo
catio
ns2,
383
2,52
42,
524
2,24
52,
297
2,34
12,
385
2,43
02,
479
2,52
82,
577
2,62
52,
678
Cap
ital O
utla
y27
,225
62,7
2935
,827
28,8
9534
,281
8,17
52,
439
2,60
212
,267
22,0
8124
,245
5,11
05,
725
Exp
endi
ture
Lap
se 1
% *
*-8
83-9
18-1
,045
-804
-756
-771
-882
-994
-1,0
30-8
54-8
76TO
TAL
EXPE
ND
ITU
RES
72,4
7314
6,22
487
,384
90,8
3510
3,40
679
,561
74,8
7976
,320
87,2
7398
,417
101,
978
84,5
1186
,682
% v
s pr
ior y
ear
-11%
102%
-40%
4%14
%-2
3%-6
%2%
14%
13%
4%-1
7%3%
END
ING
FU
ND
BA
LAN
CE
127,
169
58,3
2012
1,12
810
9,24
493
,046
103,
845
122,
329
142,
723
155,
570
160,
546
165,
253
191,
352
219,
904
ASS
UM
ING
NO
AC
TIO
N T
AK
EN T
OR
ESO
LVE
SHO
RTF
ALL
S
End
ing
bala
nce
as %
of R
esou
rces
64%
29%
58%
55%
47%
57%
62%
65%
64%
62%
62%
69%
72%
TOTA
L R
EQU
IREM
ENTS
199,
642
204,
544
208,
512
200,
080
196,
452
183,
406
197,
208
219,
044
242,
843
258,
963
267,
231
275,
863
306,
586
REV
ENU
E m
inus
EXP
END
ITU
RES
4,28
5
(68,
849)
(6,0
41)
(1
1,88
3)
(1
6,19
8)
10
,799
18,4
84
20
,395
12,8
46
4,
976
4,
707
26
,100
28,5
52
(N
OT
cum
ulat
ive)
note
: non
-rec
urrin
g ex
pend
iture
sne
t rec
urrin
g re
v- e
xp4,
285
(68,
849)
(6,0
41)
(11,
883)
(16,
198)
10,7
9918
,484
20,3
9512
,846
4,97
64,
707
26,1
0028
,552
* O
pera
ting
Exp
ense
s ne
t of F
ull C
ost A
lloca
tion
** E
xpen
ditu
re la
pse
is c
alcu
late
d on
Per
sona
l Ser
vice
s, O
pera
ting
Exp
ense
s, C
apita
l Out
lay,
and
Gra
nts
& A
ids
only
.
Act
ual f
igur
es b
ased
on
Util
ities
Fin
anci
al S
tate
men
ts.
For p
ropr
ieta
ry fu
nds,
the
reco
rdin
g of
Oth
er P
ost E
mpl
oym
ent B
enef
its (O
PE
B) a
s ex
pend
iture
s at
the
full-
accr
ual l
evel
is re
quire
d by
GA
SB
.
FOR
ECA
ST
Exhibit H-47

Exhibit H-48