forecasting covariance matrices for asset allocation robert engle and riccardo colacito
Post on 21-Dec-2015
226 views
TRANSCRIPT
FORECASTING COVARIANCE MATRICES FOR ASSET ALLOCATION
ROBERT ENGLE AND RICCARDO COLACITO

2
THE SETTINGThis paper is part of the first
Econometric Institute/Princeton University Press lecture series
It will be presented at Erasmus University in Rotterdam 21,22,23 May The topic is Dynamic Correlations
3
THE CLASSICAL PORTFOLIO PROBLEM
AT THE BEGINNING OF PERIOD T, CHOOSE PORTFOLIO WEIGHTS W TO MINIMIZE VARIANCE OVER T SUBJECT TO A REQUIRED EXPECTED RETURN.
AT THE END OF T, FORECAST THE DISTRIBUTION OF RETURNS FOR THE NEXT PERIOD AND ADJUST PORTFOLIO WEIGHTS
4
IMPLEMENTATION REQUIREMENTS
FORECAST OF EXPECTED RETURNS
FORECAST OF COVARIANCE MATRIX
OPTIMIZER, POSSIBLY WITH MANY CONSTRAINTS
5
MORE ADVANCED QUESTIONSOPTIMIZATION OF A MULTI-STEP CRITERIONMAXIMIZE UTILITY RATHER THAN MINIMIZE VARIANCE
Non-normal returnsNon-MEAN-VARIANCE utilityIntermediate Consumption
INCORPORATE PRIORSCONSTRAIN SOLUTIONPAY TRANSACTION COSTSMUST SOLVE MYOPIC MEAN-VARIANCE PROBLEM FIRST.
6
THE PROBLEMCAN WE EVALUATE THE QUALITY OF COVARIANCE MATRIX FORECASTS WITHOUT KNOWING EXPECTED RETURNS?
I’ll PRESENT A SLIGHTLY NEW APPROACH TO AN OLD PROBLEM
7
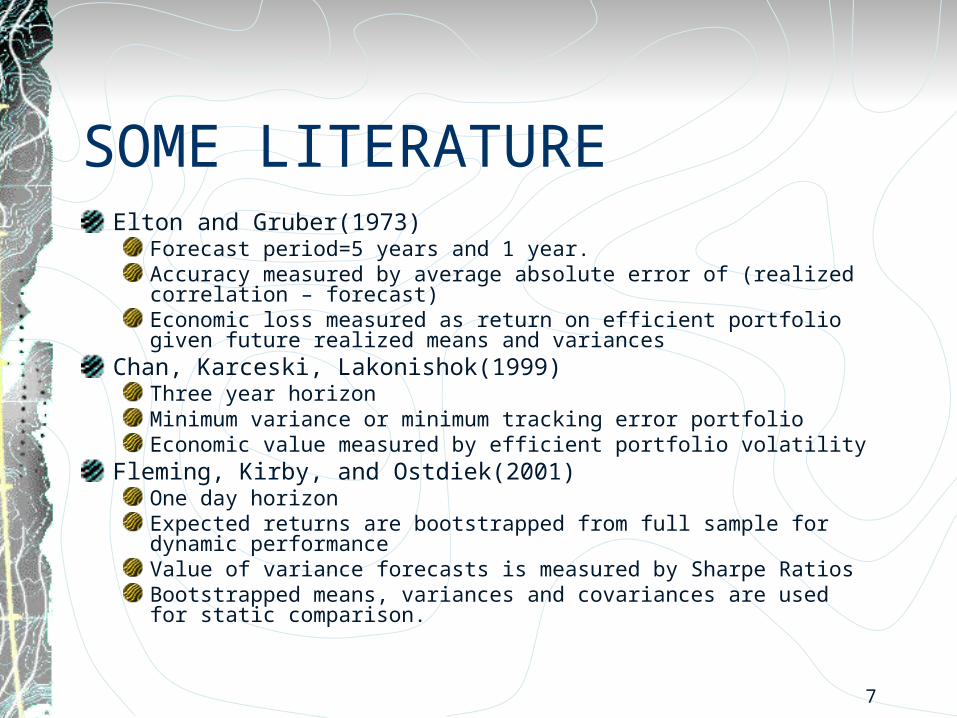
SOME LITERATUREElton and Gruber(1973)
Forecast period=5 years and 1 year. Accuracy measured by average absolute error of (realized correlation – forecast)Economic loss measured as return on efficient portfolio given future realized means and variances
Chan, Karceski, Lakonishok(1999)Three year horizonMinimum variance or minimum tracking error portfolioEconomic value measured by efficient portfolio volatility
Fleming, Kirby, and Ostdiek(2001)One day horizonExpected returns are bootstrapped from full sample for dynamic performanceValue of variance forecasts is measured by Sharpe RatiosBootstrapped means, variances and covariances are used for static comparison.

8
MORE REFERENCESKandel, Shmuel, and Stambaugh, Robert F., 1996, On the Predictability of Stock Returns: An Asset Allocation Perspective, Journal of Finance, 51(2), 385-424.Erb, Claude B., Harvey, Campbell R., and Viskanta, Tadas E., 1994, Forecasting International Equity Correlations, Financial Analysts Journal, 50, 32-45.Cumby, Robert, Stephen Figlewski and Joel Hasbrouck, (1994) "International Asset Allocation with Time Varying Risk: An Analysis and Implementation", Japan and the World Economy, 6(1), 1-25 Ang, Andrew, and Bekaert, Geert, 1999, International Asset Allocation with Time-Varying Correlations, NBER Working Paper 7056.Ang, Andrew, and Chen, Joe, 2001, Asymmetric Correlations of Equity Portfolios, forthcoming, Journal of Financial Economics.Brandt, Michael W., 1999, Estimating Portfolio and Consumption Choice: A Conditional Euler Equations Approach, Journal of Finance, 54(5), 1609-1645.Campbell, Rachel, Koedijk, Kees, and Kofman, Paul, 2000, Increased Correlation in Bear Markets: A Downside Risk Perspective, Working Paper, Faculty of Business Administration, Erasmus University Rotterdam.Aijt-Sahalia, Yacine, and Brandt, Michael W., 2001, Variable Selection for Portfolio Choice, Journal of Finance, 56(4), 1297-1355.Longin, Fran»cois, and Solnik, Bruno, 2001, Extreme Correlation of International Equity Markets, Journal of Finance, 56(2), 649-676.Kraus, Alan, and Litzenberger, Robert H., 1976, Skewness Preference and the Valuation of Risk Assets, Journal of Finance, 31(4), 1085-1100.Markowitz, H., 1952, Portfolio Selection, Journal of Finance, 7, 77-99.
9
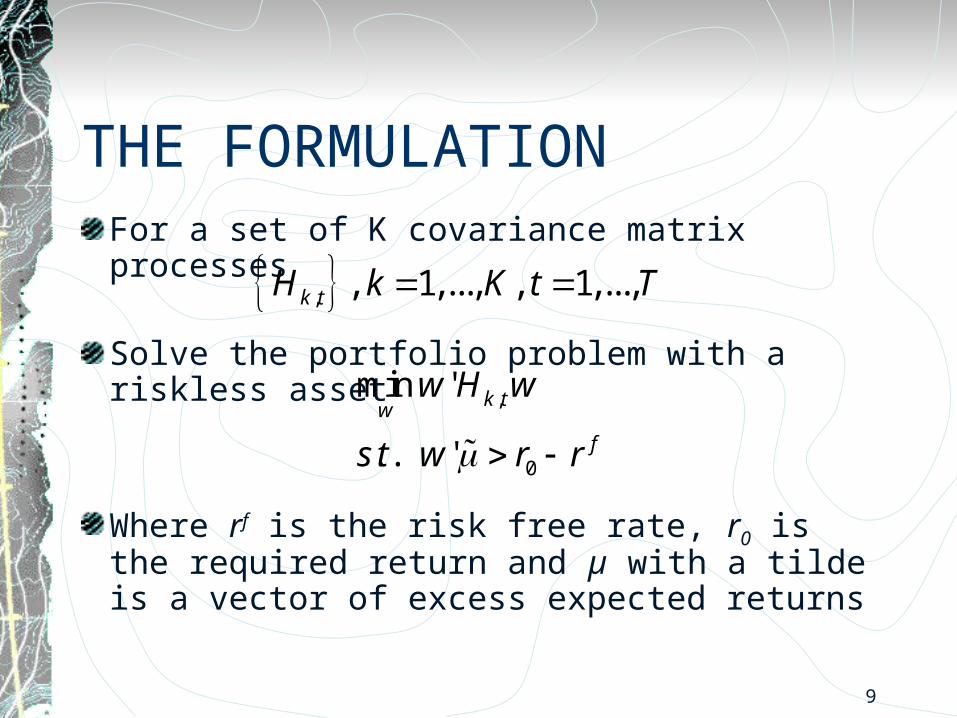
THE FORMULATIONFor a set of K covariance matrix processes
Solve the portfolio problem with a riskless asset
Where rf is the risk free rate, r0 is the required return and µ with a tilde is a vector of excess expected returns
, , 1,..., , 1,...,k tH k K t T
,
0
min '
. . '
k tw
f
w H w
s t w r r

10
THE SOLUTIONThe optimal trajectory of portfolio weights is:
This solution always exists for H positive definite and positive required excess return.Letting
11 1, , , 0' fk t k t k tw H H r r
0
11 1, , ,
/
'
f
k t k t k t
r r
w H H
11
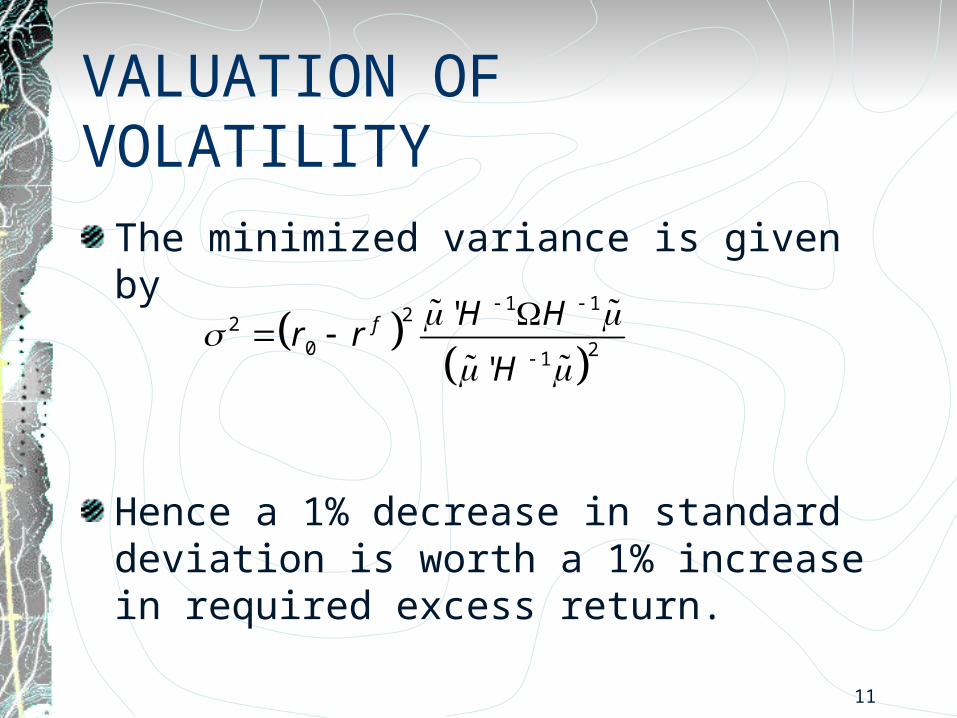
VALUATION OF VOLATILITYThe minimized variance is given by
Hence a 1% decrease in standard deviation is worth a 1% increase in required excess return.
1 122
0 21
'
'
f H Hr r
H
12
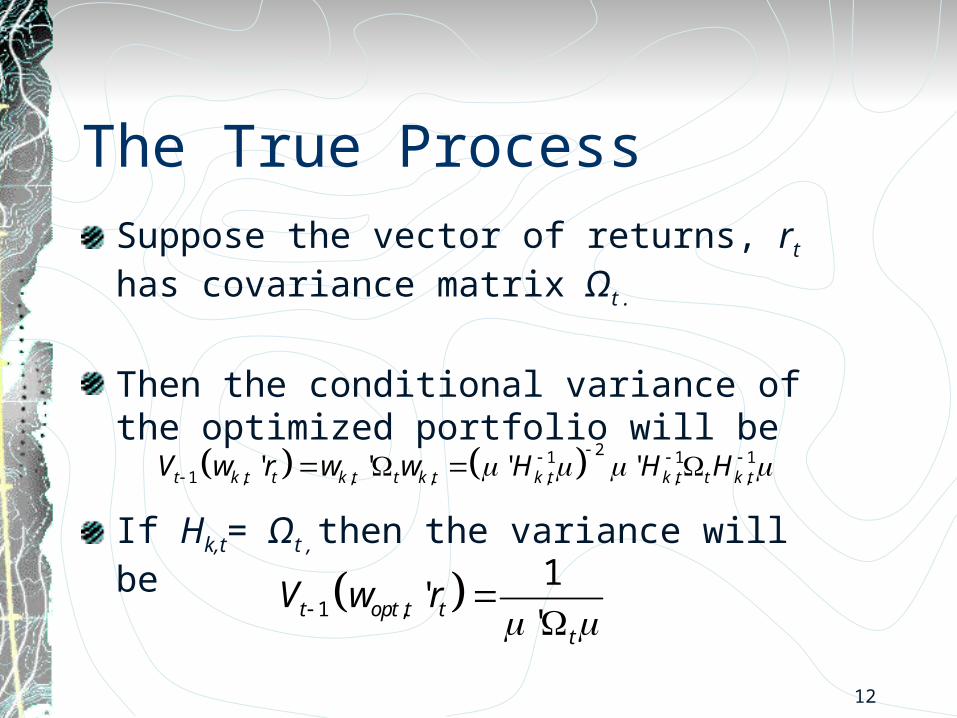
The True ProcessSuppose the vector of returns, rt has covariance matrix Ωt .
Then the conditional variance of the optimized portfolio will be
If Hk,t= Ωt , then the variance will be
21 1 11 , , , , , ,' ' ' '
t k t t k t t k t k t k t t k tV w r w w H H H
1 ,
1'
' t opt t tt
V w r
13
THEOREMThe conditional variance of every optimized portfolio will be greater than or equal to the conditional variance of the portfolio optimized on the true covariance matrix.This will be true for any vector of expected returns and any required excess return.
14
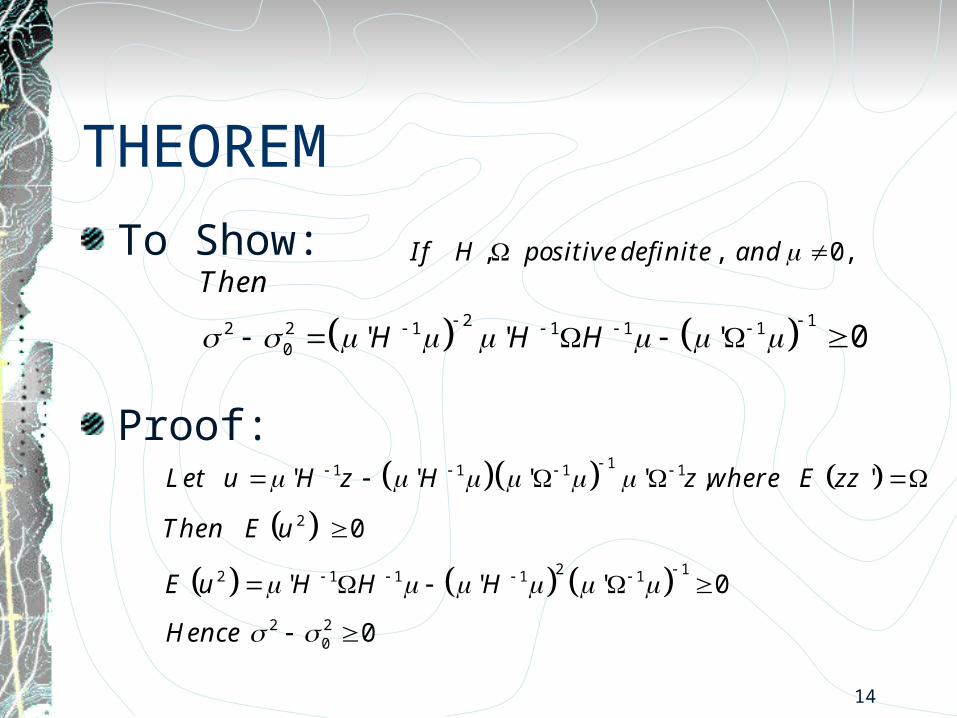
THEOREMTo Show:
Proof:
2 12 2 1 1 1 10 ' ' ' 0
Then
H H H
11 1 1 1
2
2 12 1 1 1 1
2 20
' ' ' ' , '
0
' ' ' 0
0
Let u H z H z where E zz
Then E u
E u H H H
Hence
, , 0,I f H positivedefinite and
15
IMPLICATION For a vector of expected returns, and a conditional covariance matrix, calculate the optimal weights and the subsequent portfolio returnChoose covariance matrices that achieve lowest portfolio variance for all relevant expected returnsOr choose conditional on state variables.Minimum variance portfolio is obtained when µ=
16
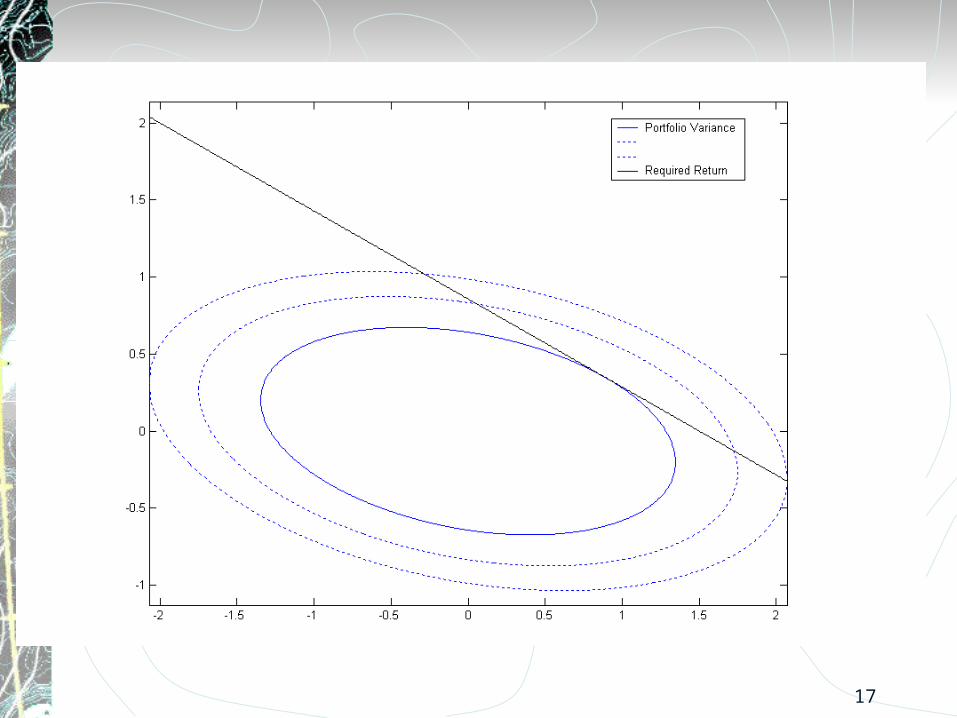
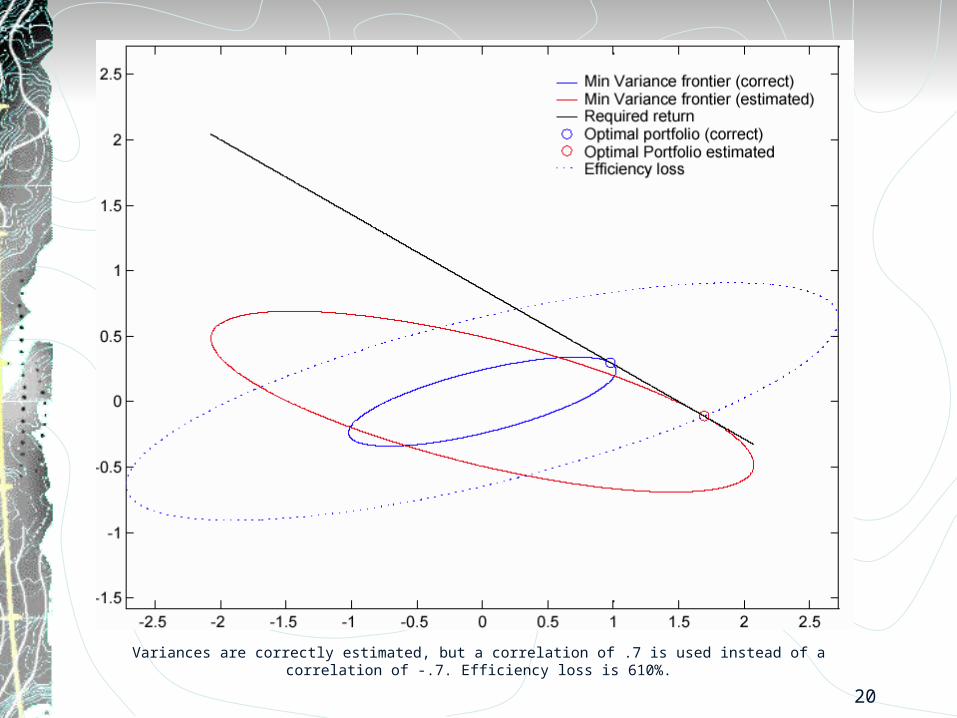
PICTURESPlot portfolio weights in two dimensionsVolatility is an elipseExpected return is a line with slope given by ratio of expected returns.
17
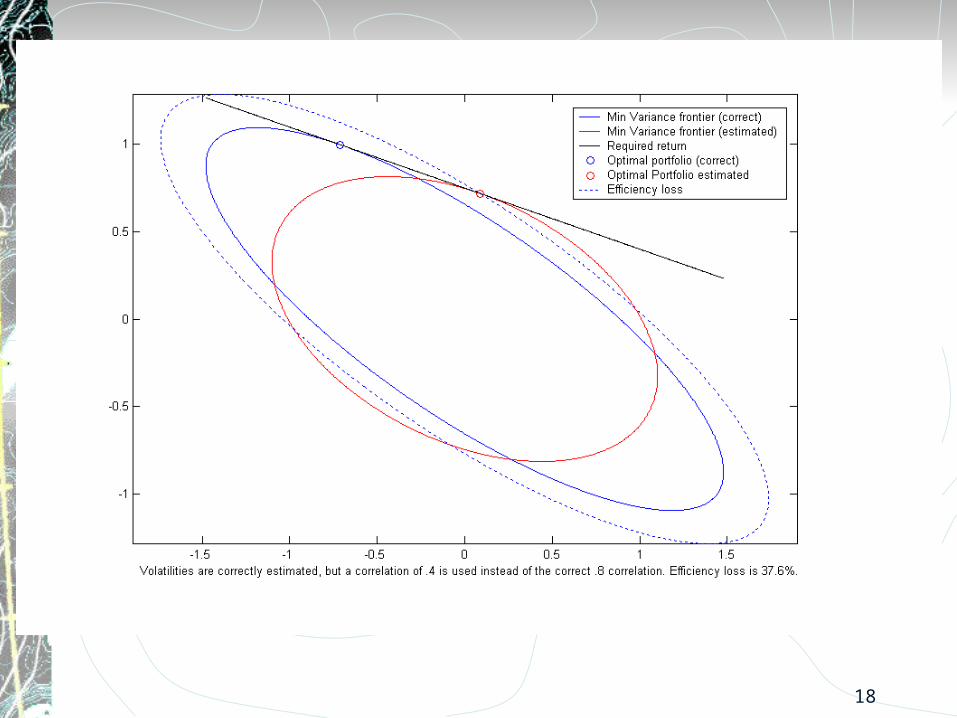
18
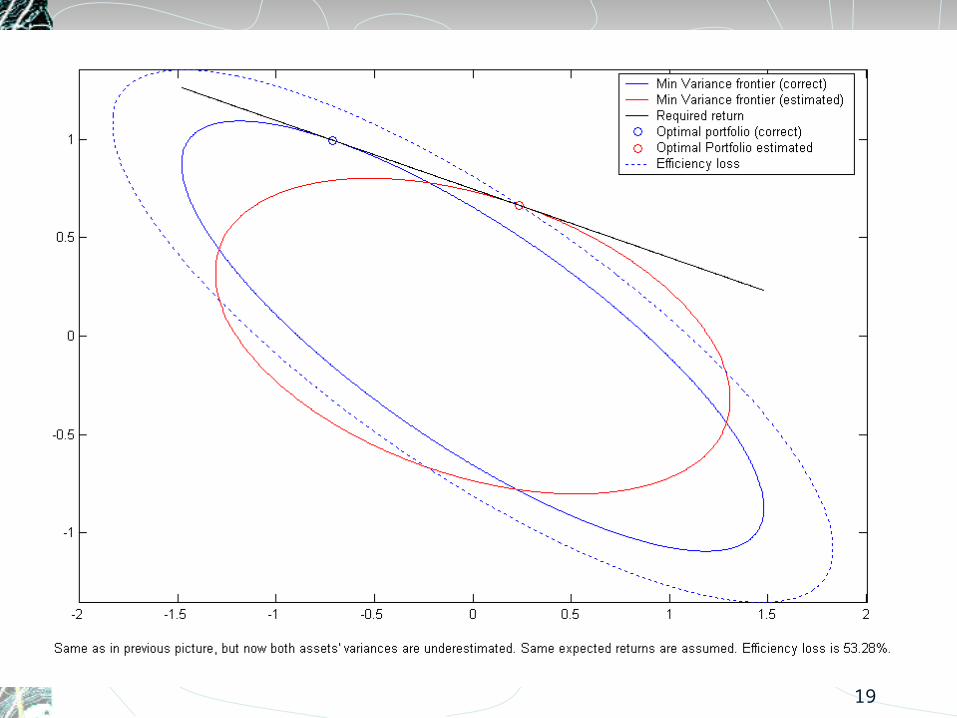
19
20
Variances are correctly estimated, but a correlation of .7 is used instead of a correlation of -.7. Efficiency loss is 610%.
21
22
23
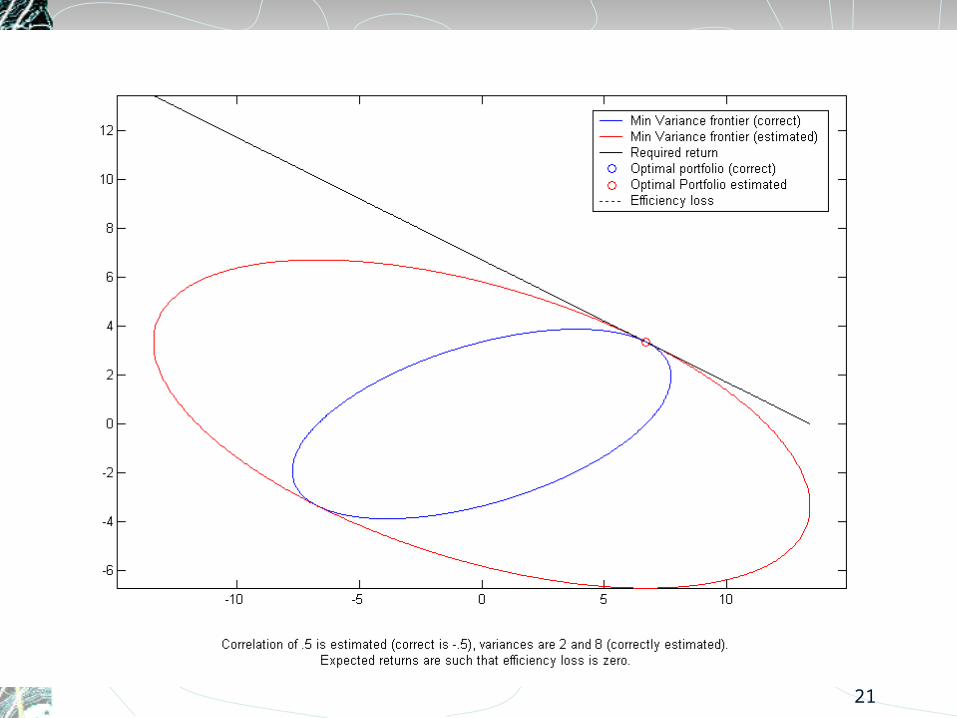
A COSTLESS ERRORThere is always an expected return vector that makes using the wrong covariance matrix costless.
For this return, both ellipses are tangent to the required return line at the same point.
1H
24
TESTINGTesting that one method correctly assesses the risk
Testing that one method is significantly better than another
25
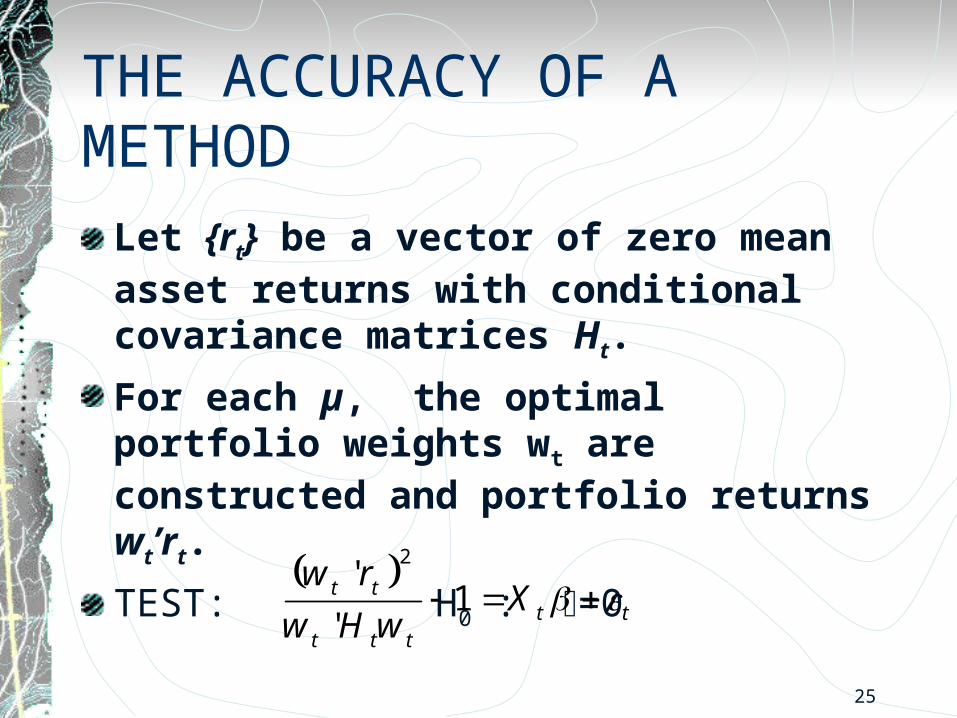
THE ACCURACY OF A METHODLet {rt} be a vector of zero mean asset returns with conditional covariance matrices Ht.
For each µ, the optimal portfolio weights wt are constructed and portfolio returns wt’rt.
TEST: H0 : =0 2'1
't t
t tt t t
w rX
w H w
26
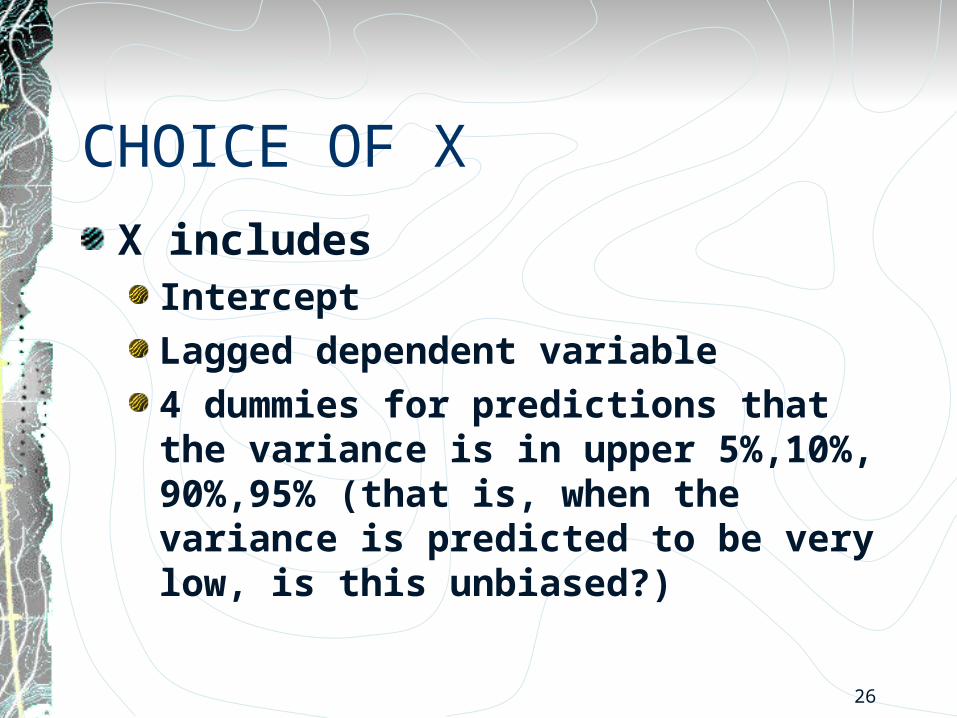
CHOICE OF XX includes
Intercept
Lagged dependent variable
4 dummies for predictions that the variance is in upper 5%,10%, 90%,95% (that is, when the variance is predicted to be very low, is this unbiased?)
27
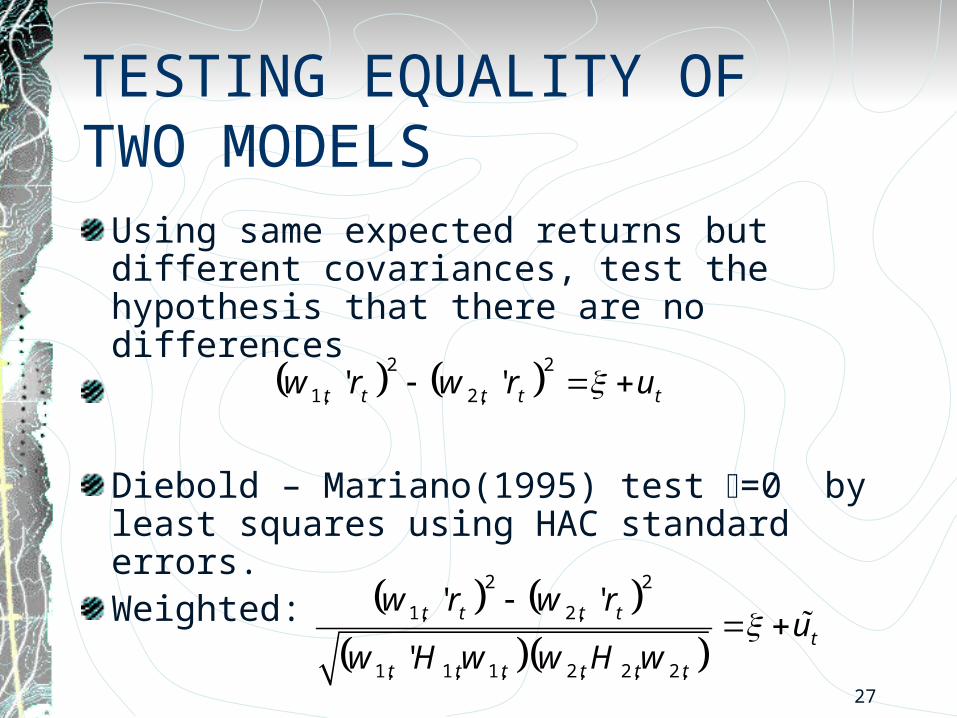
TESTING EQUALITY OF TWO MODELS
Using same expected returns but different covariances, test the hypothesis that there are no differences
Diebold – Mariano(1995) test =0 by least squares using HAC standard errors.Weighted:
2 2
1, 2,' 't t t t tw r w r u
2 2
1, 2,
1, 1, 1, 2, 2, 2,
' '
'
t t t tt
t t t t t t
w r w ru
w H w w H w
28
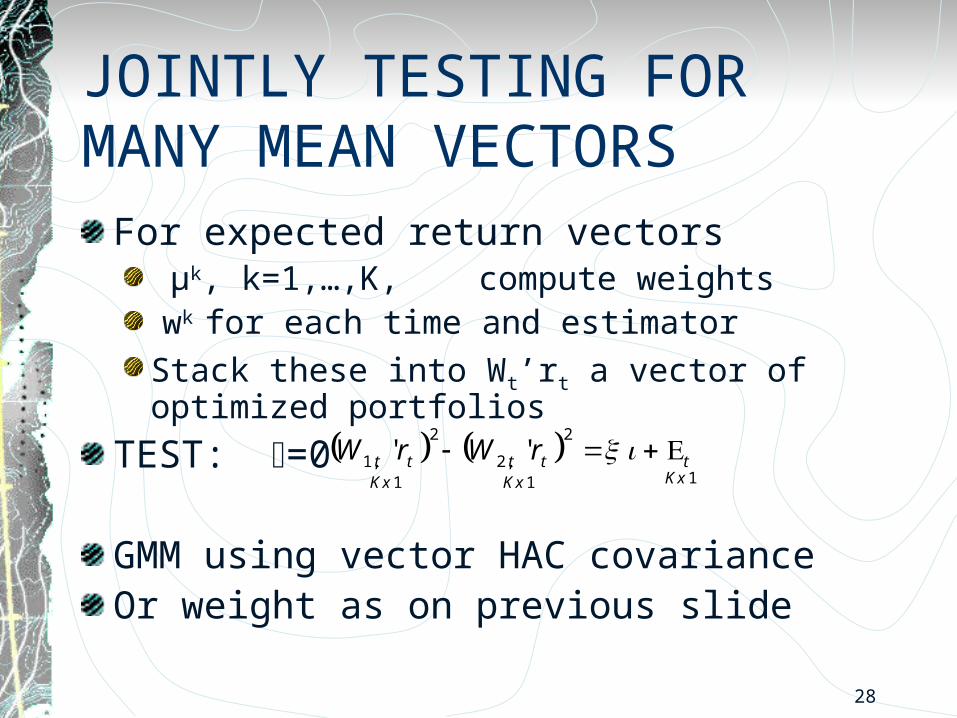
JOINTLY TESTING FOR MANY MEAN VECTORS
For expected return vectors µk, k=1,…,K, compute weights wk for each time and estimatorStack these into Wt’rt a vector of optimized portfolios
TEST: =0
GMM using vector HAC covarianceOr weight as on previous slide
2 2
1, 2,11 1
' 't t t t tKxKx Kx
W r W r

29
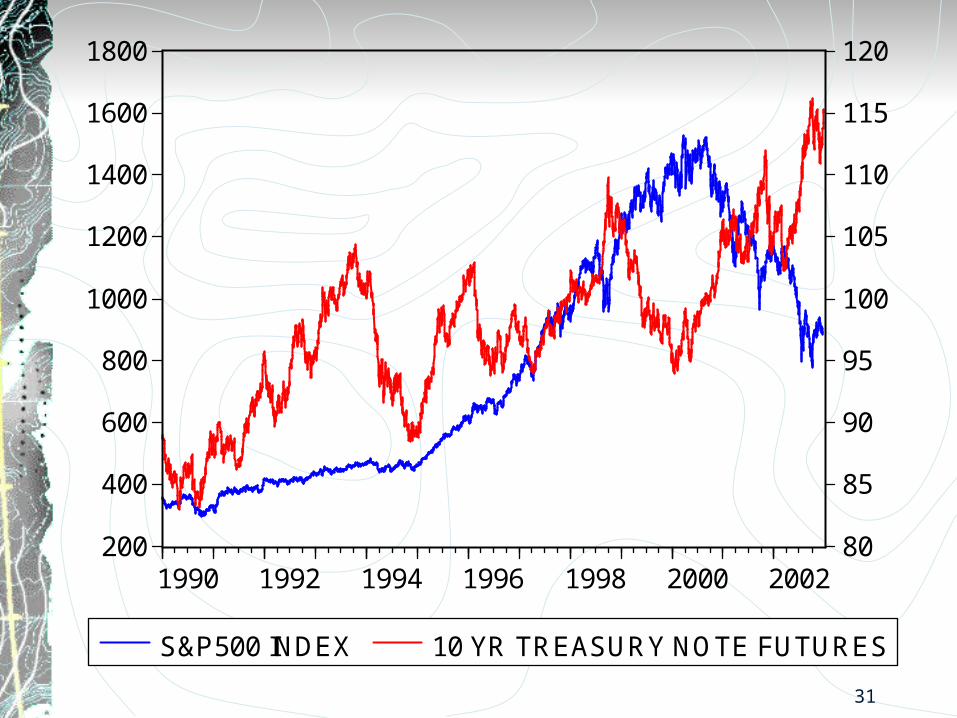
THE DATADaily returns on S&P500
Daily returns on 10-year Treasury Note Futures
Both from DataStream from Jan 1 1990 to Dec 18 2002
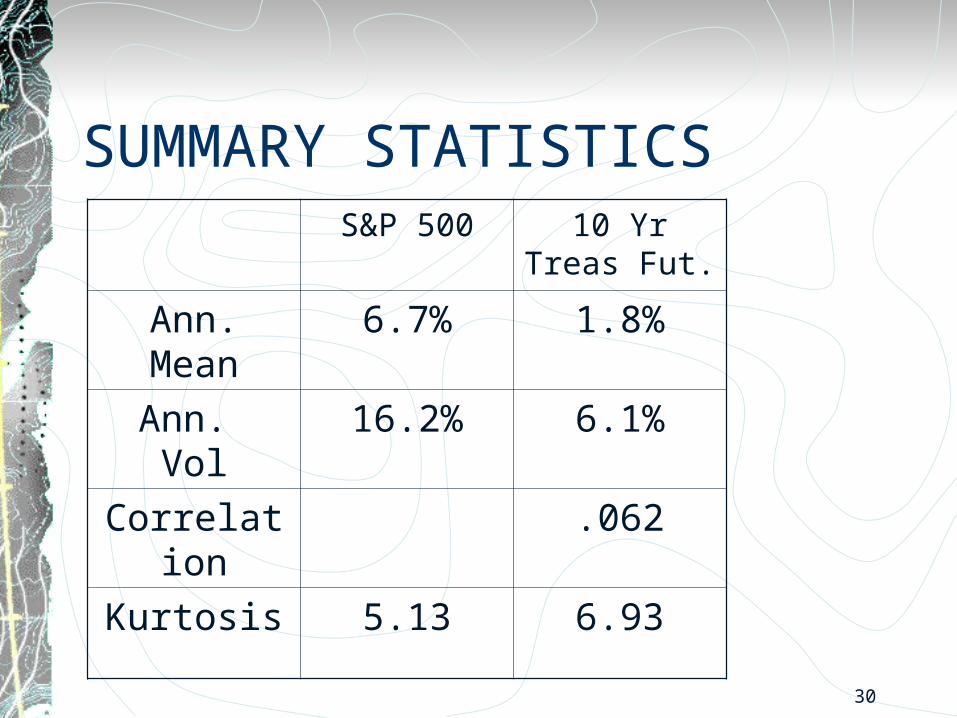
30
SUMMARY STATISTICSS&P 500 10 Yr Treas Fut.
Ann. Mean 6.7% 1.8%
Ann. Vol 16.2% 6.1%
Correlation .062
Kurtosis 5.13 6.93
31
200
400
600
800
1000
1200
1400
1600
1800
80
85
90
95
100
105
110
115
120
1990 1992 1994 1996 1998 2000 2002
S&P500 INDEX 10 YR TREASURY NOTE FUTURES
32
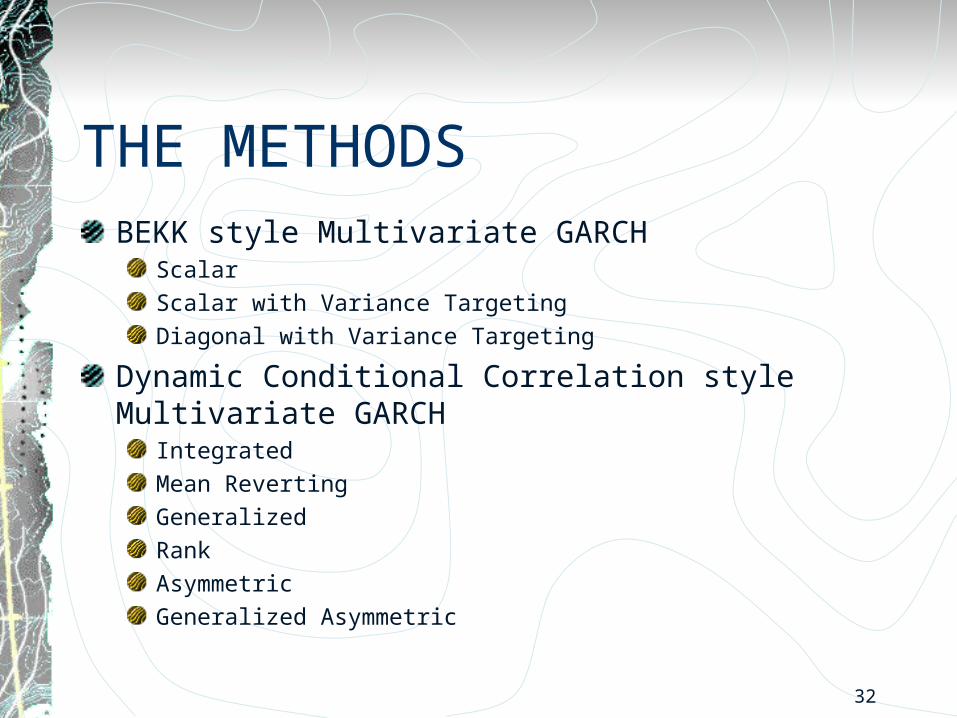
THE METHODSBEKK style Multivariate GARCH
ScalarScalar with Variance TargetingDiagonal with Variance Targeting
Dynamic Conditional Correlation style Multivariate GARCHIntegratedMean RevertingGeneralizedRankAsymmetricGeneralized Asymmetric
33
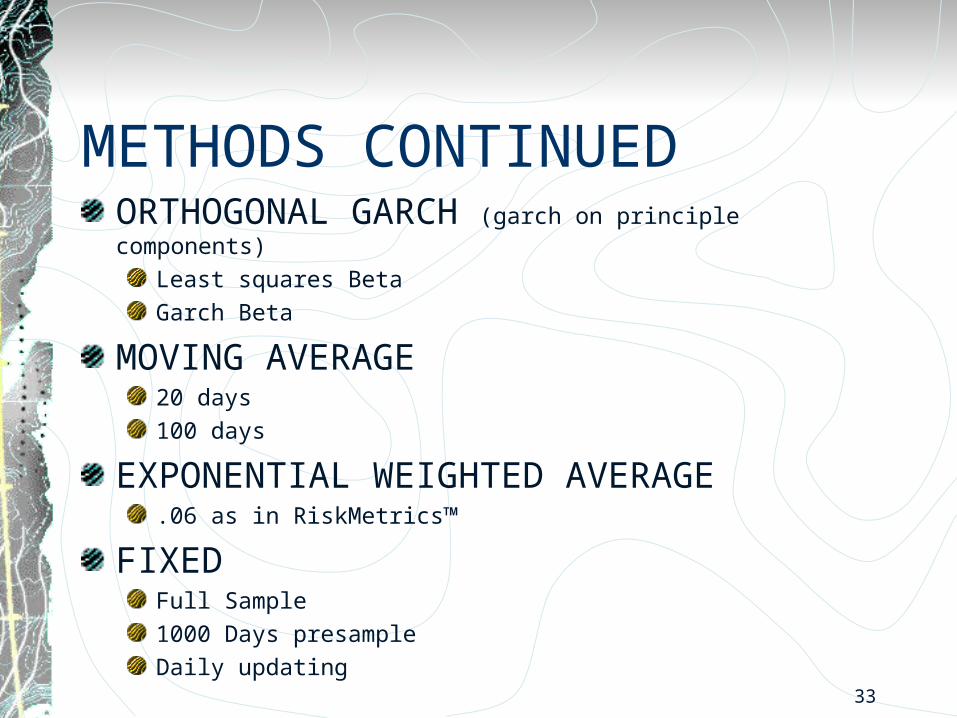
METHODS CONTINUEDORTHOGONAL GARCH (garch on principle components)
Least squares BetaGarch Beta
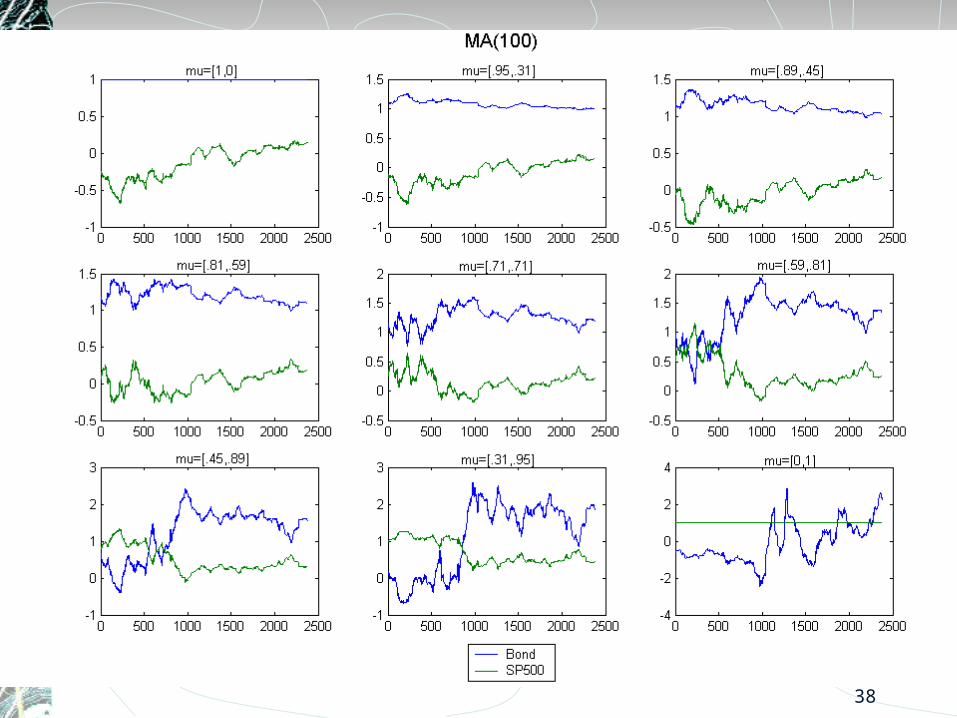
MOVING AVERAGE20 days100 days
EXPONENTIAL WEIGHTED AVERAGE.06 as in RiskMetrics™
FIXEDFull Sample1000 Days presampleDaily updating
34
36
38
39
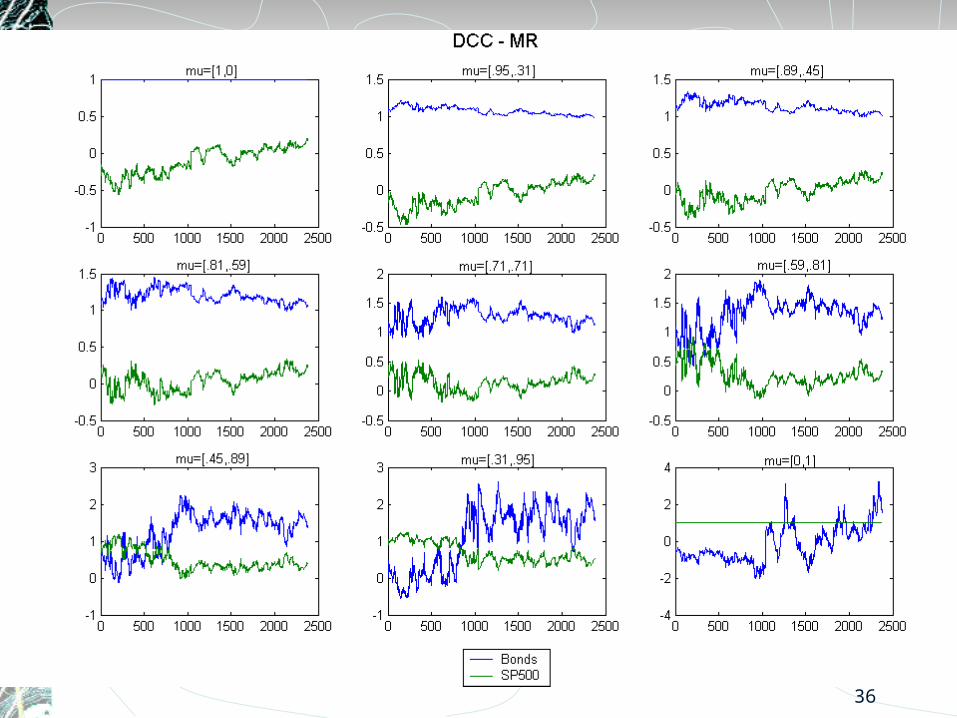
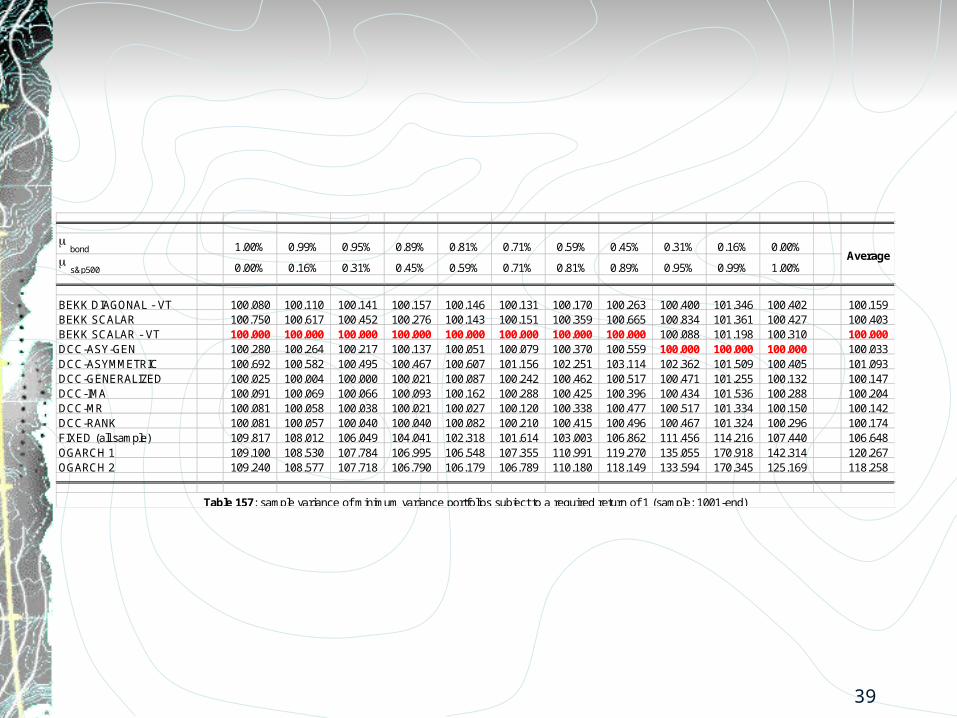
bond 1.00% 0.99% 0.95% 0.89% 0.81% 0.71% 0.59% 0.45% 0.31% 0.16% 0.00%
s&p500 0.00% 0.16% 0.31% 0.45% 0.59% 0.71% 0.81% 0.89% 0.95% 0.99% 1.00%
BEKK DIAGONAL - VT 100.080 100.110 100.141 100.157 100.146 100.131 100.170 100.263 100.400 101.346 100.402 100.159BEKK SCALAR 100.750 100.617 100.452 100.276 100.143 100.151 100.359 100.665 100.834 101.361 100.427 100.403BEKK SCALAR - VT 100.000 100.000 100.000 100.000 100.000 100.000 100.000 100.000 100.088 101.198 100.310 100.000DCC-ASY-GEN 100.280 100.264 100.217 100.137 100.051 100.079 100.370 100.559 100.000 100.000 100.000 100.033DCC-ASYMMETRIC 100.692 100.582 100.495 100.467 100.607 101.156 102.251 103.114 102.362 101.509 100.405 101.093DCC-GENERALIZED 100.025 100.004 100.000 100.021 100.087 100.242 100.462 100.517 100.471 101.255 100.132 100.147DCC-IMA 100.091 100.069 100.066 100.093 100.162 100.288 100.425 100.396 100.434 101.536 100.288 100.204DCC-MR 100.081 100.058 100.038 100.021 100.027 100.120 100.338 100.477 100.517 101.334 100.150 100.142DCC-RANK 100.081 100.057 100.040 100.040 100.082 100.210 100.415 100.496 100.467 101.324 100.296 100.174FIXED (all sample) 109.817 108.012 106.049 104.041 102.318 101.614 103.003 106.862 111.456 114.216 107.440 106.648OGARCH 1 109.100 108.530 107.784 106.995 106.548 107.355 110.991 119.270 135.055 170.918 142.314 120.267OGARCH 2 109.240 108.577 107.718 106.790 106.179 106.789 110.180 118.149 133.594 170.345 125.169 118.258
Average
Table 157: sample variance of minimum variance portfolios subject to a required return of 1 (sample: 1001-end)
40
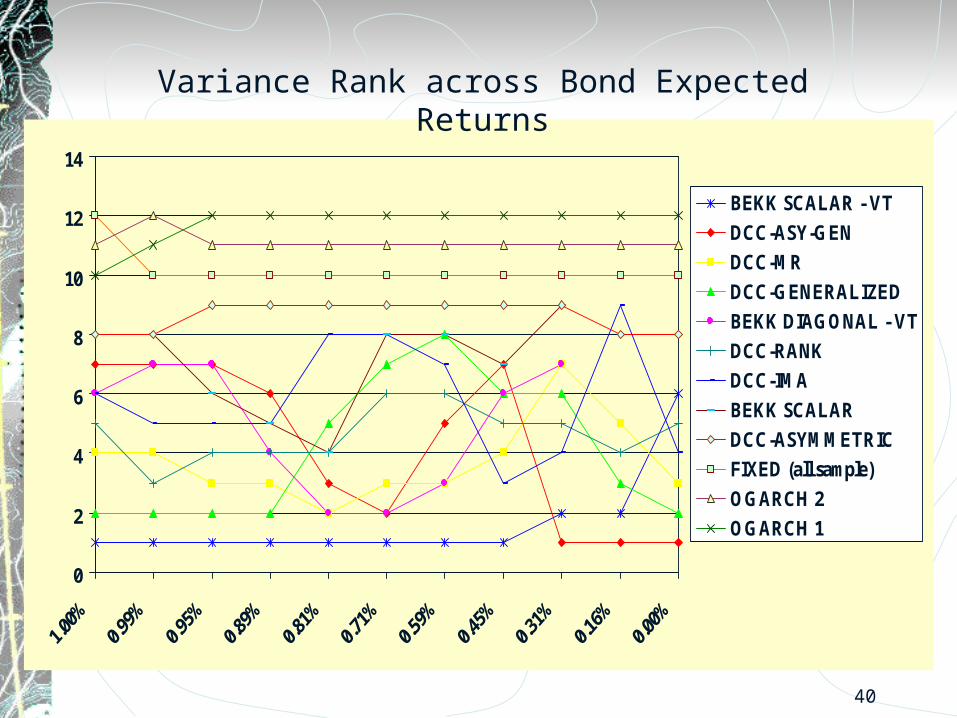
0
2
4
6
8
10
12
14
BEKK SCALAR - VT
DCC-ASY-GEN
DCC-MR
DCC-GENERALIZED
BEKK DIAGONAL - VT
DCC-RANK
DCC-IMA
BEKK SCALAR
DCC-ASYMMETRIC
FIXED (all sample)
OGARCH 2
OGARCH 1
Variance Rank across Bond Expected Returns
41
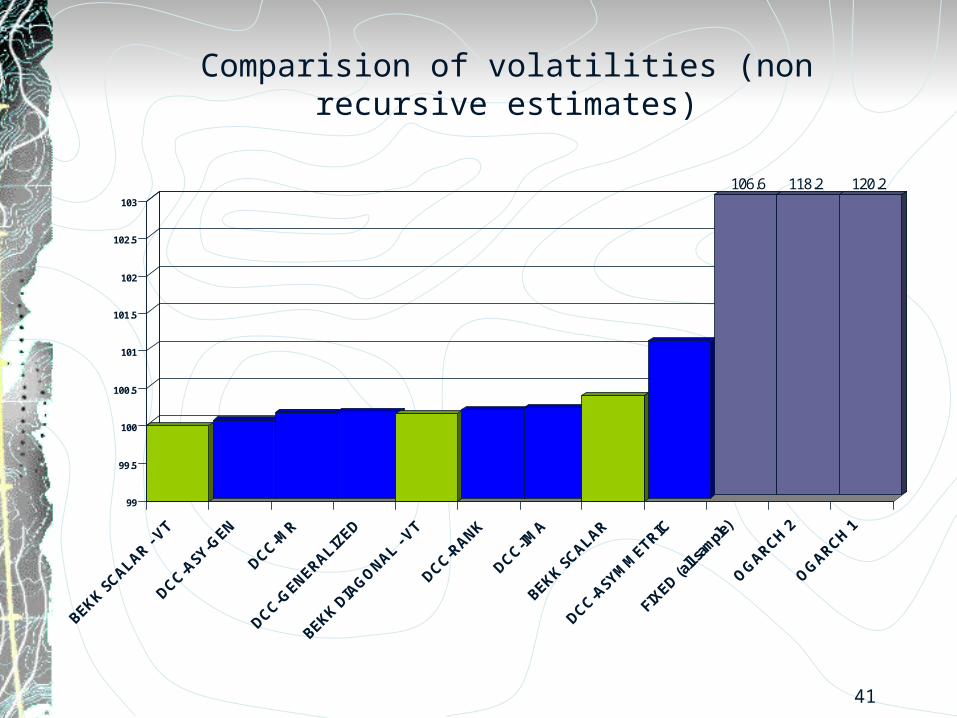
99
99.5
100
100.5
101
101.5
102
102.5
103
BEKK SCALAR -
VT
DCC-ASY-G
EN
DCC-MR
DCC-GENERALIZ
ED
BEKK DIA
GO
NAL - VT
DCC-RANK
DCC-IMA
BEKK SCALAR
DCC-ASYM
METRIC
FIXED (a
ll sam
ple)
OG
ARCH 2
OG
ARCH 1
106.6 120.2118.2
Comparision of volatilities (non recursive estimates)
42
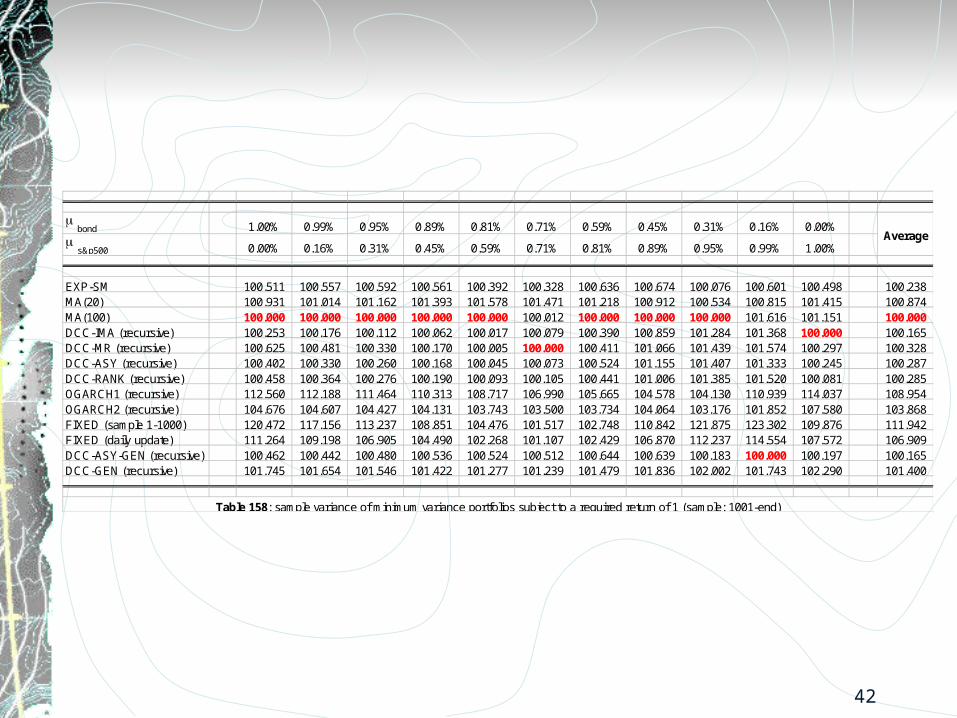
bond 1.00% 0.99% 0.95% 0.89% 0.81% 0.71% 0.59% 0.45% 0.31% 0.16% 0.00%
s&p500 0.00% 0.16% 0.31% 0.45% 0.59% 0.71% 0.81% 0.89% 0.95% 0.99% 1.00%
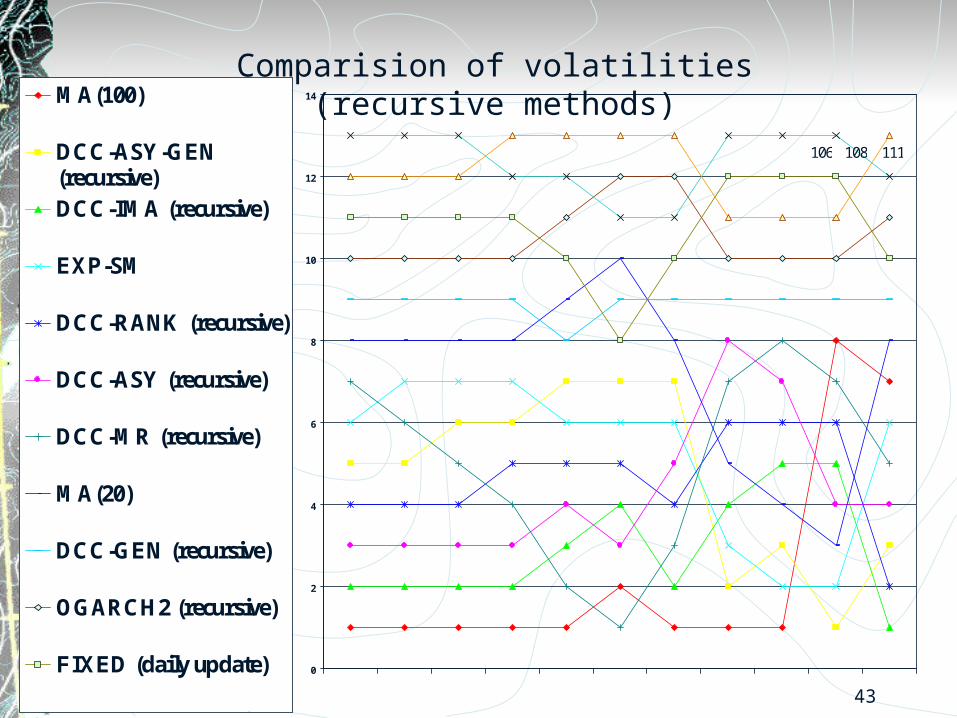
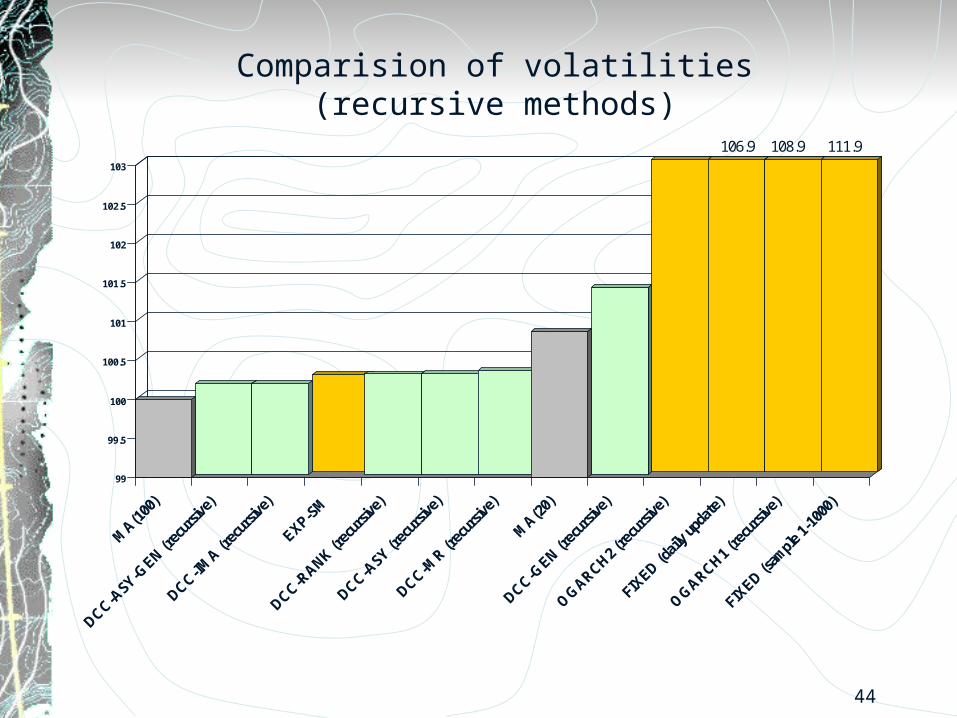
EXP-SM 100.511 100.557 100.592 100.561 100.392 100.328 100.636 100.674 100.076 100.601 100.498 100.238MA(20) 100.931 101.014 101.162 101.393 101.578 101.471 101.218 100.912 100.534 100.815 101.415 100.874MA(100) 100.000 100.000 100.000 100.000 100.000 100.012 100.000 100.000 100.000 101.616 101.151 100.000DCC-IMA (recursive) 100.253 100.176 100.112 100.062 100.017 100.079 100.390 100.859 101.284 101.368 100.000 100.165DCC-MR (recursive) 100.625 100.481 100.330 100.170 100.005 100.000 100.411 101.066 101.439 101.574 100.297 100.328DCC-ASY (recursive) 100.402 100.330 100.260 100.168 100.045 100.073 100.524 101.155 101.407 101.333 100.245 100.287DCC-RANK (recursive) 100.458 100.364 100.276 100.190 100.093 100.105 100.441 101.006 101.385 101.520 100.081 100.285OGARCH1 (recursive) 112.560 112.188 111.464 110.313 108.717 106.990 105.665 104.578 104.130 110.939 114.037 108.954OGARCH2 (recursive) 104.676 104.607 104.427 104.131 103.743 103.500 103.734 104.064 103.176 101.852 107.580 103.868FIXED (sample 1-1000) 120.472 117.156 113.237 108.851 104.476 101.517 102.748 110.842 121.875 123.302 109.876 111.942FIXED (daily update) 111.264 109.198 106.905 104.490 102.268 101.107 102.429 106.870 112.237 114.554 107.572 106.909DCC-ASY-GEN (recursive) 100.462 100.442 100.480 100.536 100.524 100.512 100.644 100.639 100.183 100.000 100.197 100.165DCC-GEN (recursive) 101.745 101.654 101.546 101.422 101.277 101.239 101.479 101.836 102.002 101.743 102.290 101.400
Average
Table 158: sample variance of minimum variance portfolios subject to a required return of 1 (sample: 1001-end)
43
0
2
4
6
8
10
12
14MA(100)
DCC-ASY-GEN(recursive)DCC-IMA (recursive)
EXP-SM
DCC-RANK (recursive)
DCC-ASY (recursive)
DCC-MR (recursive)
MA(20)
DCC-GEN (recursive)
OGARCH2 (recursive)
FIXED (daily update)
OGARCH1 (recursive)
FIXED (sample 1-1000)
106.9
111.9
108.9
Comparision of volatilities (recursive methods)
44
99
99.5
100
100.5
101
101.5
102
102.5
103
MA(1
00)
DCC-ASY-G
EN (rec
ursiv
e)
DCC-IMA (r
ecur
sive)
EXP-SM
DCC-RANK (r
ecur
sive)
DCC-ASY (r
ecur
sive)
DCC-MR (r
ecur
sive)
MA(2
0)
DCC-GEN (r
ecur
sive)
OG
ARCH2 (re
curs
ive)
FIXED (d
aily u
pdat
e)
OG
ARCH1 (re
curs
ive)
FIXED (s
ample
1-10
00)
106.9 111.9108.9
Comparision of volatilities (recursive methods)
45
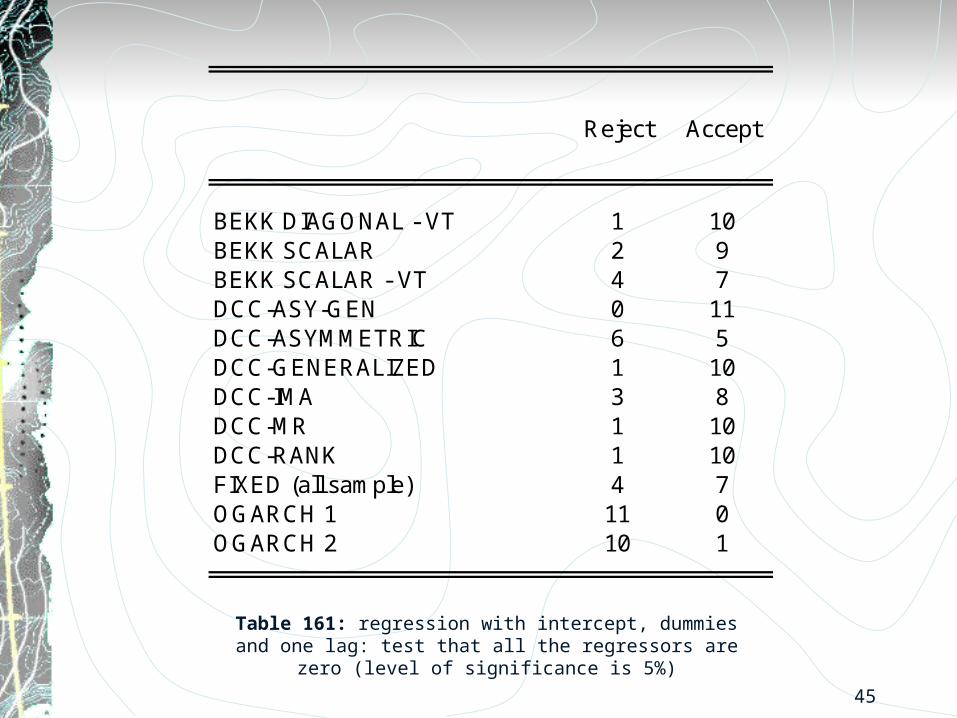
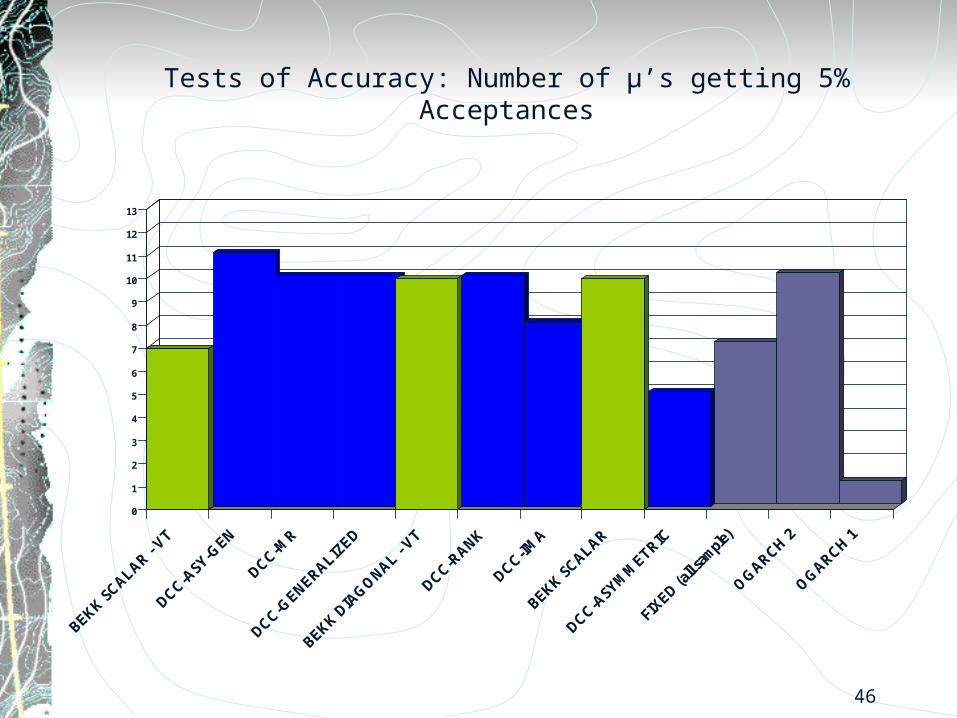
BEKK DIAGONAL - VT 1 10BEKK SCALAR 2 9BEKK SCALAR - VT 4 7DCC-ASY-GEN 0 11DCC-ASYMMETRIC 6 5DCC-GENERALIZED 1 10DCC-IMA 3 8DCC-MR 1 10DCC-RANK 1 10FIXED (all sample) 4 7OGARCH 1 11 0OGARCH 2 10 1
Reject Accept
Table 161: regression with intercept, dummies and one lag: test that all the regressors are zero (level of significance is 5%)
46
0
1
2
3
4
5
6
7
8
9
10
11
12
13
BEKK SCALAR -
VT
DCC-ASY-G
EN
DCC-MR
DCC-GENERALIZ
ED
BEKK DIA
GO
NAL - VT
DCC-RANK
DCC-IMA
BEKK SCALAR
DCC-ASYM
METRIC
FIXED (a
ll sam
ple)
OG
ARCH 2
OG
ARCH 1
Tests of Accuracy: Number of µ’s getting 5% Acceptances
47
`
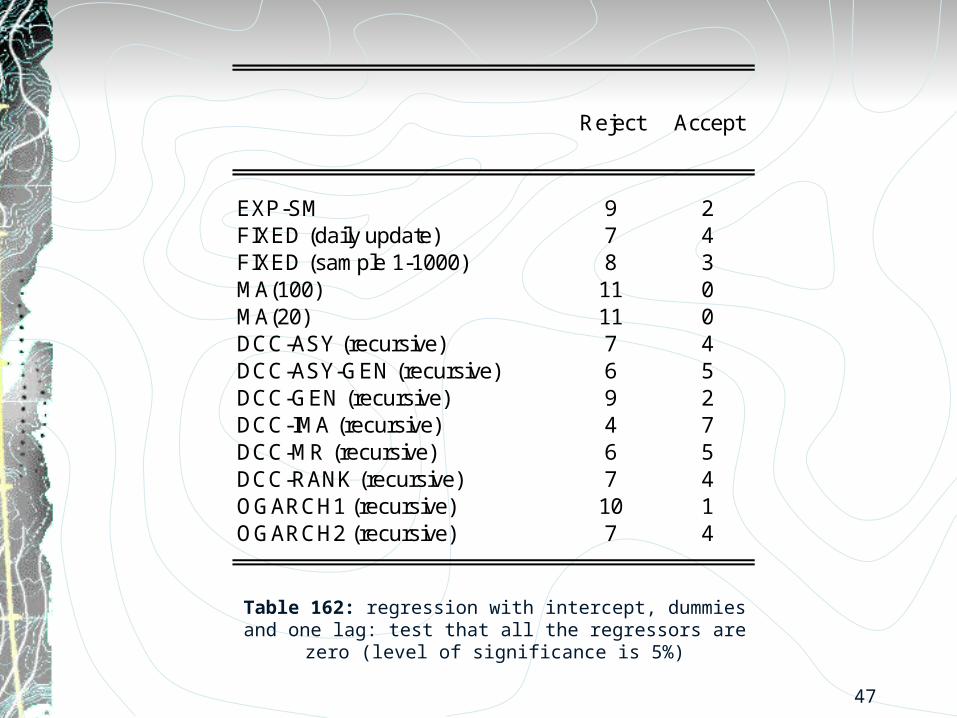
EXP-SM 9 2FIXED (daily update) 7 4FIXED (sample 1-1000) 8 3MA(100) 11 0MA(20) 11 0DCC-ASY (recursive) 7 4DCC-ASY-GEN (recursive) 6 5DCC-GEN (recursive) 9 2DCC-IMA (recursive) 4 7DCC-MR (recursive) 6 5DCC-RANK (recursive) 7 4OGARCH1 (recursive) 10 1OGARCH2 (recursive) 7 4
Reject Accept
Table 162: regression with intercept, dummies and one lag: test that all the regressors are zero (level of significance is 5%)

48
0
1
2
3
4
5
6
7
8
9
10
11
12
13
MA(1
00)
DCC-IMA (r
ecur
sive)
DCC-ASY (r
ecur
sive)
DCC-RANK (r
ecur
sive)
DCC-ASY-G
EN (rec
ursiv
e)
DCC-MR (r
ecur
sive)
EXP-SM
MA(2
0)
DCC-GEN (r
ecur
sive)
OG
ARCH2 (re
curs
ive)
FIXED (d
aily u
pdat
e)
OG
ARCH1 (re
curs
ive)
FIXED (s
ample
1-10
00)
Tests of Accuracy: Number of µ’s getting 5% Acceptances
49
-12
-10
-8
-6
-4
-2
0
2
4
6
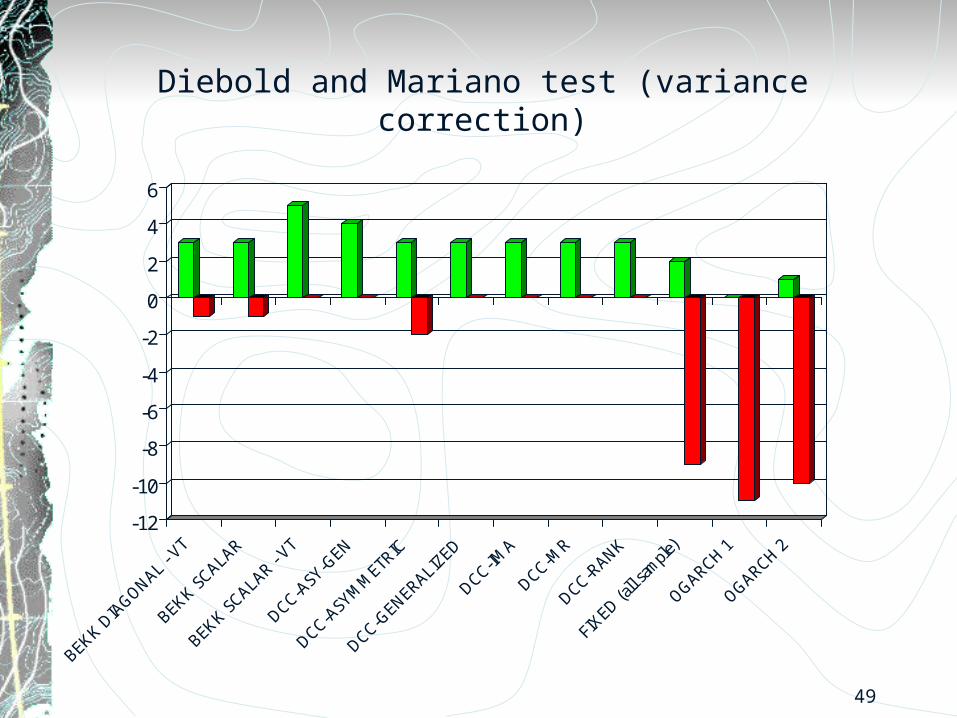
Diebold and Mariano test (variance correction)
50
-12
-10
-8
-6
-4
-2
0
2
4
6
8
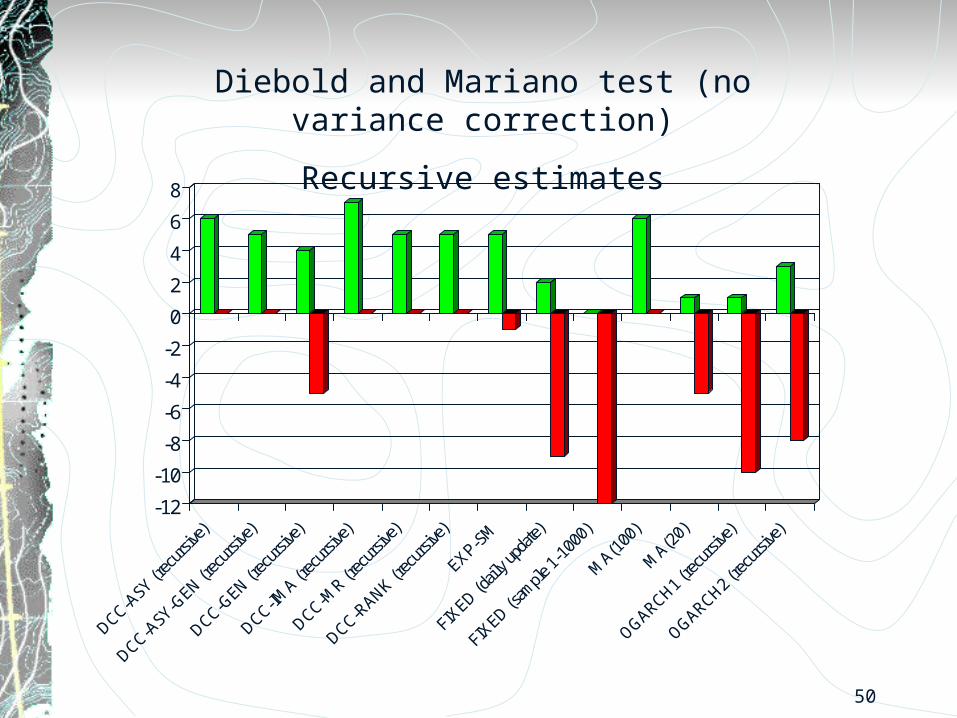
Diebold and Mariano test (no variance correction)
Recursive estimates
51
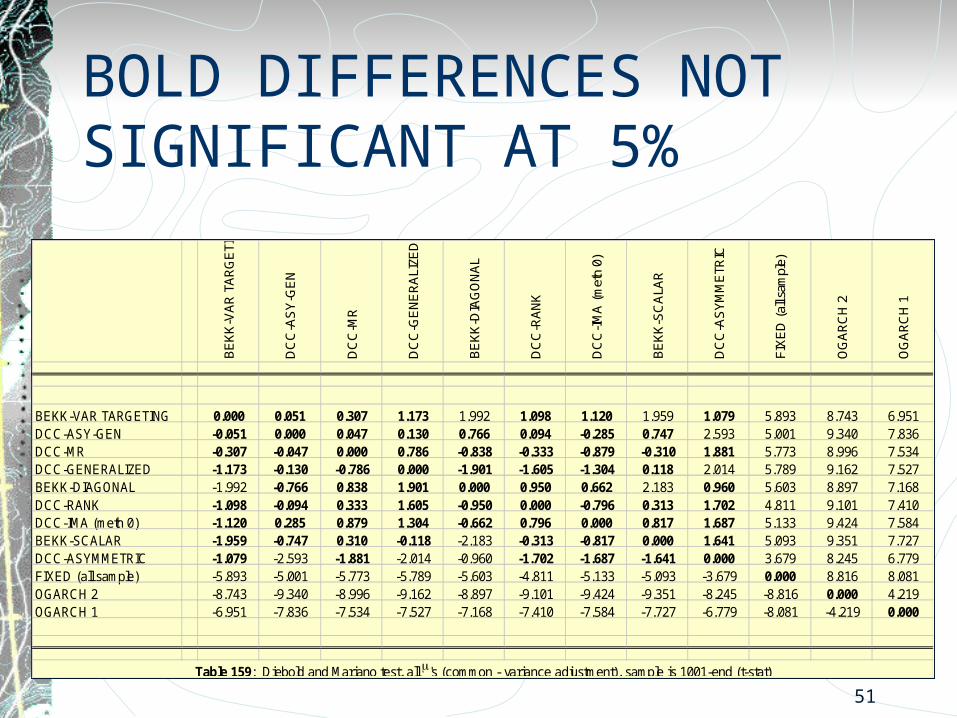
BOLD DIFFERENCES NOT SIGNIFICANT AT 5%
BE
KK
-VA
R T
AR
GE
TIN
G
DC
C-A
SY
-GE
N
DC
C-M
R
DC
C-G
EN
ER
ALI
ZED
BE
KK
-DIA
GO
NA
L
DC
C-R
AN
K
DC
C-I
MA
(m
eth
0)
BE
KK
-SC
ALA
R
DC
C-A
SY
MM
ETR
IC
FIX
ED
(al
l sam
ple)
OG
AR
CH
2
OG
AR
CH
1
BEKK-VAR TARGETING 0.000 0.051 0.307 1.173 1.992 1.098 1.120 1.959 1.079 5.893 8.743 6.951DCC-ASY-GEN -0.051 0.000 0.047 0.130 0.766 0.094 -0.285 0.747 2.593 5.001 9.340 7.836DCC-MR -0.307 -0.047 0.000 0.786 -0.838 -0.333 -0.879 -0.310 1.881 5.773 8.996 7.534DCC-GENERALIZED -1.173 -0.130 -0.786 0.000 -1.901 -1.605 -1.304 0.118 2.014 5.789 9.162 7.527BEKK-DIAGONAL -1.992 -0.766 0.838 1.901 0.000 0.950 0.662 2.183 0.960 5.603 8.897 7.168DCC-RANK -1.098 -0.094 0.333 1.605 -0.950 0.000 -0.796 0.313 1.702 4.811 9.101 7.410DCC-IMA (meth 0) -1.120 0.285 0.879 1.304 -0.662 0.796 0.000 0.817 1.687 5.133 9.424 7.584BEKK-SCALAR -1.959 -0.747 0.310 -0.118 -2.183 -0.313 -0.817 0.000 1.641 5.093 9.351 7.727DCC-ASYMMETRIC -1.079 -2.593 -1.881 -2.014 -0.960 -1.702 -1.687 -1.641 0.000 3.679 8.245 6.779FIXED (all sample) -5.893 -5.001 -5.773 -5.789 -5.603 -4.811 -5.133 -5.093 -3.679 0.000 8.816 8.081OGARCH 2 -8.743 -9.340 -8.996 -9.162 -8.897 -9.101 -9.424 -9.351 -8.245 -8.816 0.000 4.219OGARCH 1 -6.951 -7.836 -7.534 -7.527 -7.168 -7.410 -7.584 -7.727 -6.779 -8.081 -4.219 0.000
Table 159: Diebold and Mariano test, all 's (common - variance adjustment), sample is 1001-end (t-stat)
52
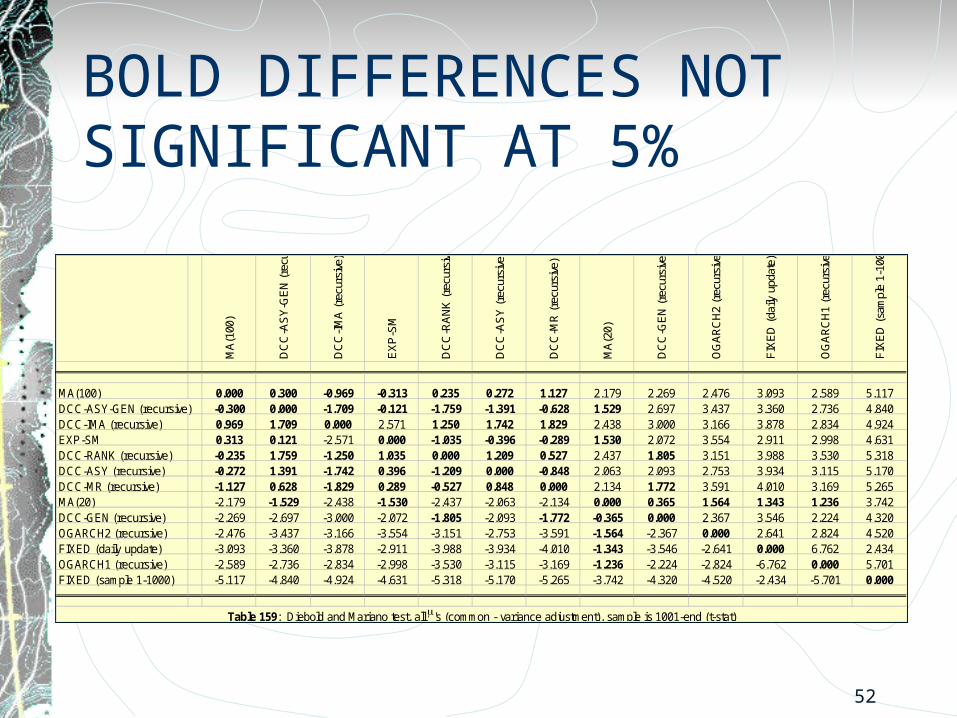
BOLD DIFFERENCES NOT SIGNIFICANT AT 5%
MA
(100
)
DC
C-A
SY
-GE
N (
recu
rsiv
e)
DC
C-I
MA
(re
curs
ive)
EX
P-S
M
DC
C-R
AN
K (
recu
rsiv
e)
DC
C-A
SY
(re
curs
ive)
DC
C-M
R (
recu
rsiv
e)
MA
(20)
DC
C-G
EN
(re
curs
ive)
OG
AR
CH
2 (r
ecur
sive
)
FIX
ED
(da
ily u
pdat
e)
OG
AR
CH
1 (r
ecur
sive
)
FIX
ED
(sa
mpl
e 1-
1000
)
MA(100) 0.000 0.300 -0.969 -0.313 0.235 0.272 1.127 2.179 2.269 2.476 3.093 2.589 5.117DCC-ASY-GEN (recursive) -0.300 0.000 -1.709 -0.121 -1.759 -1.391 -0.628 1.529 2.697 3.437 3.360 2.736 4.840DCC-IMA (recursive) 0.969 1.709 0.000 2.571 1.250 1.742 1.829 2.438 3.000 3.166 3.878 2.834 4.924EXP-SM 0.313 0.121 -2.571 0.000 -1.035 -0.396 -0.289 1.530 2.072 3.554 2.911 2.998 4.631DCC-RANK (recursive) -0.235 1.759 -1.250 1.035 0.000 1.209 0.527 2.437 1.805 3.151 3.988 3.530 5.318DCC-ASY (recursive) -0.272 1.391 -1.742 0.396 -1.209 0.000 -0.848 2.063 2.093 2.753 3.934 3.115 5.170DCC-MR (recursive) -1.127 0.628 -1.829 0.289 -0.527 0.848 0.000 2.134 1.772 3.591 4.010 3.169 5.265MA(20) -2.179 -1.529 -2.438 -1.530 -2.437 -2.063 -2.134 0.000 0.365 1.564 1.343 1.236 3.742DCC-GEN (recursive) -2.269 -2.697 -3.000 -2.072 -1.805 -2.093 -1.772 -0.365 0.000 2.367 3.546 2.224 4.320OGARCH2 (recursive) -2.476 -3.437 -3.166 -3.554 -3.151 -2.753 -3.591 -1.564 -2.367 0.000 2.641 2.824 4.520FIXED (daily update) -3.093 -3.360 -3.878 -2.911 -3.988 -3.934 -4.010 -1.343 -3.546 -2.641 0.000 6.762 2.434OGARCH1 (recursive) -2.589 -2.736 -2.834 -2.998 -3.530 -3.115 -3.169 -1.236 -2.224 -2.824 -6.762 0.000 5.701FIXED (sample 1-1000) -5.117 -4.840 -4.924 -4.631 -5.318 -5.170 -5.265 -3.742 -4.320 -4.520 -2.434 -5.701 0.000
Table 159: Diebold and Mariano test, all 's (common - variance adjustment), sample is 1001-end (t-stat)
53
CONCLUSIONSThe Dynamic Conditional Correlation and Multivariate GARCH estimators are generally the best in this comparison.However there is little difference between the performance of these top estimators either statistically or economicallyAsymmetric correlations are often one of the best estimators but these differences are not significant.There are differences between estimators depending on the expected return vector.These bivariate results may not reflect the performance of bigger systems.