forecasting global coal consumption: an artificial neural network … · 2017-12-21 · 30 enalcaar...
TRANSCRIPT

gospodarka surowcami mineralnymi – mineral resources management
2017 Volume 33 Issue 4 Pages 29–44
DOI 10.1515/gospo-2017-0042
** M.Sc. Eng., *** D.Sc. Eng., Associate Professor of MEERI PAS, Mineral and Energy Economy Research Institute, Polish Academy of Sciences, Krakow, Poland; e-mail: [email protected]; [email protected]** M.Sc. Eng., Independent researcher
Pablo bENalCaZaR*, MałgoRZata KRaWCZYK**, JaCEK KaMIŃSKI***
Forecasting global coal consumption: An artificial neural network approach
Introduction
the industrialization of services, the increasing population size, and the economic deve- lopment in asia have led for the past fifty years to a significant growth in world energy con-sumption. the U.S. Energy Information administration (EIa) projects that between 2012 and 2040, the world energy consumption will increase by 48%. by the year 2040, energy consumption in developing non-oECD countries (China, India, and South africa) is expect-ed to grow drastically by 71%, while in oECD countries consumption will only increase by 18% (EIa 2016). Figure 1 presents the total world energy consumption by energy source (1965–2015) and Figure 2 shows the world energy consumption in 2016.
In the 21st century, energy has become an integral part of our society and of global economic development. although the world has experienced tremendous technological ad-vancements, fossil fuels (including coal, natural gas, and oil) continue to be the world’s primary energy source. It has been estimated that by 2040, coal, natural gas and liquid fuels will account for 78% of total world energy consumption (EIa 2016). Since the beginning of the industrial revolution, coal has played a vital role in the global energy mix, main-ly due to its abundance, affordability, and high reliability. at the current production level,

30 Benalcazar et all 2017 / Gospodarka Surowcami Mineralnymi – Mineral Resources Management 33(4), 29–44
Fig. 1. World energy consumption by energy source, 1965–2015
Rys. 1. Światowe zużycie energii z podziałem na źródła energii w latach 1965–2015
Fig. 2. World energy consumption by energy source, 2016
Rys. 2. Światowe zużycie energii z podziałem na źródła energii, 2016

31Benalcazar et all 2017 / Gospodarka Surowcami Mineralnymi – Mineral Resources Management 33(4), 29–44
the IEa estimates that coal reserves (economically recoverable) would last approximately 127.7 years (with the biggest reserves found in the USa, Russia, China, and India), which is much longer than the estimated 53 years for natural gas or the 51 years for oil (bP 2017; IEa 2016). as a result of its wide availability, ease of storage and transportation, coal has be-come an essential energy source for China, India, the United States, germany, South africa, Poland and developing non-oECD countries; particularly countries located in asia, where coal consumption is expected to rise by approximately 90% in 2040 (EIa 2016). the world coal consumption by region (1965–2015) is shown in Figure 3. Furthermore, the rapidly fluc-tuating oil and natural gas prices and the unstable socio-political market have allowed coal to position itself as a fundamental and indispensable fuel source in the power, iron, steel, and cement industries. Coal fuels over 40% of the world’s electricity generation and nearly 68% of the world’s steel production (National Coal Council 2015).
the intricate relationship between economic growth, demographics and energy con-sumption (particularly in countries with coal intensive industries and heavy reliance on fossil fuels), along with the elevated amounts of greenhouse gases in the atmosphere (mainly
Fig. 3. World coal consumption by region, 1965–2015
Rys. 3. Światowe zużycie węgla według regionów, 1965–2015

32 Benalcazar et all 2017 / Gospodarka Surowcami Mineralnymi – Mineral Resources Management 33(4), 29–44
attributed to the combustion coal, oil and natural gas), have raised serious concerns within the scientific community about the future of coal. Figure 4 shows the world gDP by region (1965–2015). thus, various studies have focused on the development and application of fore-casting methods to predict the economic prospects of coal, future levels of reserves, pro-duction, consumption, and its environmental impact. In the coal sector, long-term forecast models are of prime importance because they offer information on investment strategies, market imbalances, future trade, and allow decision makers to anticipate and assess the potential impact of government policy changes.
among the various forecasting methods in the energy sector, Computational Intelligence (CI) methods have attracted much attention in the past ten years due to their advantages over linear and nonlinear programming models. CI techniques, which include support vector machines (SVM), fuzzy logic, artificial neural networks (aNN), genetic algorithms and particle swarm optimization, have demonstrated in a wide range of scientific fields a supe-rior capability to handle nonlinear relationships between numerical data when compared to statistical methods (Dreyfus 2005; Rutkowski 2008).
Fig. 4. World gDP by region, 1965–2015
Rys. 4. PKb według regionu, 1965–2015

33Benalcazar et all 2017 / Gospodarka Surowcami Mineralnymi – Mineral Resources Management 33(4), 29–44
Neural networks have been widely used in time series prediction and pattern recognition. For instance (Szoplik 2015) used a multilayer perceptron model to forecast the natural gas demand in Szczecin (Poland). (günay 2016) applied a MLP ANN to predict the annual gross electricity demand of turkey for the years 2014–2028. (Ermis et al. 2007) used a feed-for-ward back-propagation neural network to forecast world green energy consumption to the year 2050. (Jebaraj et al. 2011) compared the results of various forecasting methods (i.e., time series regression, double moving average, exponential smoothing, auto regressive integrated moving average (aRIMa), artificial neural networks models) to estimate the annual coal consumption in India for the years 2020–2030 and showed that an aNN model presents the best predictive performance for long-term coal consumption forecasts.
In this context, the aim of this paper is to contribute to the scarce literature on global coal consumption forecasting with the aid of artificial neural network methods. this paper propos-es a Multilayer Perceptron neural network (MlP) for the prediction of global coal consumption for the years 2020–2030. the MlP-based model is trained with historical data sets gathered from financial institutions, global energy authorities, and energy statistic agencies, covering the years 1970 through 2016. With this scope in mind, section 2 presents the characteristics of artificial neural networks and section 3 describes the computational details of the MlP model, including data and feature selection. the paper ends with concluding remarks.
1. Methods
1.1. Artificial Neural Networks
artificial neural networks (aNN) have received a great deal of attention due to their su-perior performance in nonlinear data modeling and their wide range of potential applications in optimization, forecasting and decision making (Hill et al. 1994; Prieto et al. 2016). ANN are mathematical models derived from the representation of the natural structure and biolo- gical function of a neuron (with its three principal components: dendrites, cell body, and axon) (Hagan et al. 1995). although artificial neural networks are a simplification of the complex-ity of biological neurons, they present some similarities to their biological counterparts. ANN are highly interconnected networks, generally consisting of an input layer, one or more hidden layers, and an output layer. Each layer comprises small processing units called artificial neurons connected by synaptic weights (Raza and Khosravi 2015). A multiple-in-put neuron is shown in Figure 5 and its mathematical expression is described in Equation 1.
( )i ia f b w x= + Σ (1)
where a is the neuron output, b is the bias or ‘offset’, wi the weighted inputs, xi the individual inputs, n the summer output, and f the activation function or ‘transfer function’. there is

34 Benalcazar et all 2017 / Gospodarka Surowcami Mineralnymi – Mineral Resources Management 33(4), 29–44
a variety of activation functions (linear and nonlinear functions) in use with artificial neural networks. a commonly used activation function is the hyperbolic tangent transfer function, which is defined as:
( )n n
n ne etahn ne e
−
−−
=+
(2)
where tahn (n) is the activation function with scaled outputs between –1 and 1.
With the continuous development and evolution of artificial neural networks and the outstanding growth in computational power, multiple neural network architectures with numerous topologies have been proposed, including multilayer perceptron (MlP), bridged multilayer perceptron (bMlP), among others (Wilamowski 2009). A multilayer perceptron neural network is shown in Figure 6.
the predictive model presented in this paper is a multilayer perceptron (MlP) neural network, generally referred to a as multilayer feed-forward network. With the aim of finding the model with the best generalization performance, the MlP-based model developed for this study is computed under various configurations of hidden layers and the number of neu-rons. the predictive performance of the neural network is measured by statistical methods often used in forecasting studies, such as the Mean absolute Percentage Error (MaPE):
1
ˆ1 100%ˆ2
N t t
tt
Q QMAPE
Q=
− = ⋅ ∑
(3)
Where N is the number of predictions. ˆtQ and Qt are the actual and predicted coal con-
sumption values at time t, respectively. Moreover, the Root Mean Square Error (RMSE),
Fig. 5. Multiple-input neuron Source: adapted from (Hagan et al. 1995)
Rys. 5. Model sztucznego neuronu

35Benalcazar et all 2017 / Gospodarka Surowcami Mineralnymi – Mineral Resources Management 33(4), 29–44
which can be interpreted as a measure of the deviation between the predicted and observed values, is used as an additional performance indicator. RMSE is defined as follows:
( )2
1
1 ˆN
t tt
RMSE Q QN
=
= −∑ (4)
two additional performance metrics are used, theil’s inequality coefficient (U) and the Coefficient of determination R2. U yields values between 0 (denoting a perfect fit) and 1 (denoting a poor fit).
( )
( ) ( )
2
1
2 21 1
1
1 1
ˆ
ˆ
Nt tt
N Nt tt t
Q QNU
Q QN N
=
= =
−=
+
∑
∑ ∑
(5)
Fig. 6. Multilayer perceptron neural network
Rys. 6. Wielowarstwowa sieć neuronowa perceptronu

36 Benalcazar et all 2017 / Gospodarka Surowcami Mineralnymi – Mineral Resources Management 33(4), 29–44
2. Computational details
2.1. Data
the historical data sets (1970–2016) used in this study were gathered from various infor-mation sources. World population estimates and economic indicators such as gross Domes-tic Product (gDP) (current USD), inter alia, and gDP growth (annual percent) were obtained from the World’s bank World Development Indicators (the World bank 2017). the world’s gDP long-term projections were taken from long-term baseline projections of the organi-zation for Economic Cooperation and Development (oECD) and the World Economic out-look database of the International Monetary Fund (IMF). Primary energy consumption and coal consumption data for the years 1970–2016 were derived from bP’s Statistical Review of World Energy (2017). World coal consumption forecasts for the years 2020–2040 were obtained from bP’s Energy outlook (2035), the International Energy outlook 2016 (U.S. Energy Information administration), and the World Energy outlook 2016 (International Energy agency). Historical coal prices (1970–2016) and price projections were taken from the IMF’s primary commodity price database and the World bank.
2.2. Feature selection and model description
In the process of building and evaluating predictive models, the selection of relevant variables or ‘inputs’ is of paramount importance, particularly for economic and financial processes (Dreyfus 2005). the input data sets must be identified carefully since it has a significant impact on the sensitivity (throughout the training, validation and testing pro-cess) and output of the model. In computational intelligence (CI) literature, it is commonly found that the input selection process is carried out through trial and error. However, in this study, the Boruta algorithm, a feature selection algorithm based on a random forest classification algorithm was used in order to reduce the number of input variables and bet-ter understand the relationship between the relevant input features (Kursa and Rudnicki 2010). the variables subjected to analysis with the boruta algorithm were energy produc-tion (Mtoe), total primary energy supply (Mtoe), tPES/population (toe/capita), tPES/gDP (toe/thousand 2010 USD), Electricity consumption (tWh), Co2 emissions (Mt of Co2), to mention a few. From the algorithm’s execution, four relevant variables with values from 1970 to 2016, corresponding to 46 data points per variable, were selected as inputs for the MlP model (out of a group of 20 variables): Year, world gross domestic product (current USD), world population, australian thermal coal price. Moreover, the data was normal-ized between [–1, 1] and split into two subsets: training and validation subsets. 40 ob-servations were used for the training of the MlP and the remaining points were used for the validation of the model. the historical changes of the abovementioned variables (coal

37Benalcazar et all 2017 / Gospodarka Surowcami Mineralnymi – Mineral Resources Management 33(4), 29–44
consumption, world gross domestic product, world population, Australian thermal coal prices) are shown in Figure 7.
a three-layer MlP with a 4-5-1 architecture (five hidden neurons) was trained with the selected input data and the Bayesian regularization backpropagation algorithm was imple-mented as the training algorithm. this function is frequently used in aNN modeling since it updates the weight and bias values according to levenberg-Marquardt optimization, pre-venting possible overfitting and poor generalization (beale et al. 2017; MacKay 1992). Fur-thermore, various transfer functions were tested (log-Sigmoid, Positive linear, Hyperbolic tangent Sigmoid) and it was found that the Hyperbolic tangent Sigmoid performs better than other transfer functions. the selection of the optimal number of hidden neurons was done using an exhaustive search method and a comparative analysis of their RMSEs. the neural network structure developed for this study is summarized in table 1 and the effect of the number of hidden neurons on the predictive performance of the MlP is presented in Figure 8.
Fig. 7. Data sets: World coal consumption (a), world gross domestic product (b), world population (c), australian thermal coal prices (d)
Rys. 7. Zestaw danych: Światowe zużycie węgla (a), produkt światowy brutto (b), ludność świata (c), ceny węgla australijskiego (d)

38 Benalcazar et all 2017 / Gospodarka Surowcami Mineralnymi – Mineral Resources Management 33(4), 29–44
table 1. MlP structure
tabela 1. Struktura MlP
Parameters Components
Structure
Input layer
�� Year�� gDP (billion USD)�� World population (Millions)�� australian thermal coal price (USD/mt)
Hidden layer Neurons: 5
Output layer Neurons: 1
activation functionHidden layer Hyperbolic tangent Sigmoid
Output layer Linear
training algorithm Bayesian regularization backpropagation
Fig. 8. RMSE vs number of hidden neurons
Rys. 8. Pierwiastek błędu średniokwadratowego vs. ukryte neurony
39Benalcazar et all 2017 / Gospodarka Surowcami Mineralnymi – Mineral Resources Management 33(4), 29–44
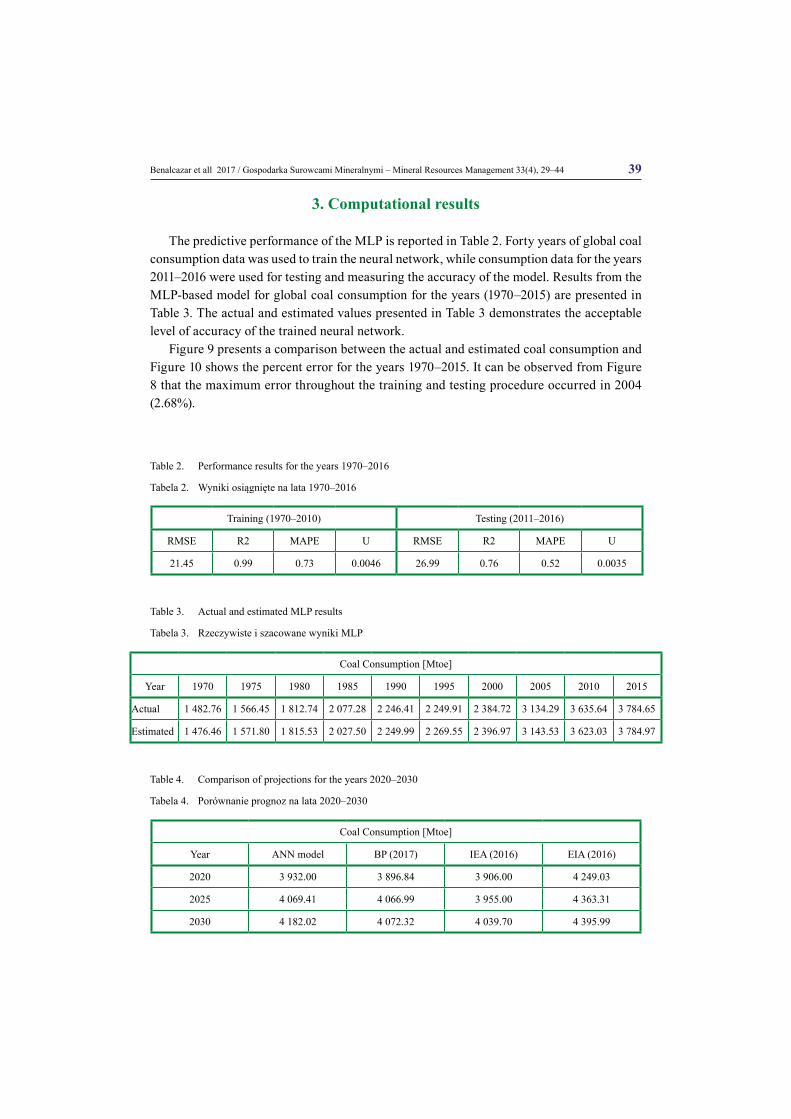
3. Computational results
the predictive performance of the MlP is reported in table 2. Forty years of global coal consumption data was used to train the neural network, while consumption data for the years 2011–2016 were used for testing and measuring the accuracy of the model. Results from the MlP-based model for global coal consumption for the years (1970–2015) are presented in table 3. the actual and estimated values presented in table 3 demonstrates the acceptable level of accuracy of the trained neural network.
Figure 9 presents a comparison between the actual and estimated coal consumption and Figure 10 shows the percent error for the years 1970–2015. It can be observed from Figure 8 that the maximum error throughout the training and testing procedure occurred in 2004 (2.68%).
table 2. Performance results for the years 1970–2016
tabela 2. Wyniki osiągnięte na lata 1970–2016
training (1970–2010) testing (2011–2016)
RMSE R2 MAPE U RMSE R2 MAPE U
21.45 0.99 0.73 0.0046 26.99 0.76 0.52 0.0035
table 3. actual and estimated MlP results
tabela 3. Rzeczywiste i szacowane wyniki MlP
Coal Consumption [Mtoe]
Year 1970 1975 1980 1985 1990 1995 2000 2005 2010 2015
Actual 1 482.76 1 566.45 1 812.74 2 077.28 2 246.41 2 249.91 2 384.72 3 134.29 3 635.64 3 784.65
Estimated 1 476.46 1 571.80 1 815.53 2 027.50 2 249.99 2 269.55 2 396.97 3 143.53 3 623.03 3 784.97
table 4. Comparison of projections for the years 2020–2030
tabela 4. Porównanie prognoz na lata 2020–2030
Coal Consumption [Mtoe]
Year ANN model bP (2017) IEa (2016) EIa (2016)
2020 3 932.00 3 896.84 3 906.00 4 249.03
2025 4 069.41 4 066.99 3 955.00 4 363.31
2030 4 182.02 4 072.32 4 039.70 4 395.99

40 Benalcazar et all 2017 / Gospodarka Surowcami Mineralnymi – Mineral Resources Management 33(4), 29–44
Fig. 10. Error percent (training and testing)
Rys. 10. błąd procentu (szkolenie i testowanie)
Fig. 9. Comparison between actual and estimated coal consumption
Rys. 9. Porównanie rzeczywistego i szacowanego zużycia węgla

41Benalcazar et all 2017 / Gospodarka Surowcami Mineralnymi – Mineral Resources Management 33(4), 29–44
a comparison between coal consumption forecasts published by various agencies (EIa, IEa, bP) and the MlP forecast is presented in table 4. Figure 11 shows the forecasts of coal consumption obtained by the ANN model and other models.
Conclusion and discussion
In this paper, we aim to contribute to the literature on coal consumption forecasting and demonstrate the application of a multilayer perceptron neural network model to estimate global coal consumption for the years 2020 to 2030. the forecast was carried out using historical data sets (1970–2016) gathered from the World’s bank World Development Indi-cators, inter alia, the World Economic outlook database of the International Monetary Fund (IMF).
a two-layer MlP with a 4-5-1 architecture (five hidden neurons) was trained with four relevant variables (year, world gDP, world population, australian thermal coal price). In order to prevent overfitting and poor generalization, the bayesian regularization backpropa-gation algorithm was implemented as the training algorithm. the results of this study show
Fig. 11. Comparison of coal consumption forecasts
Rys. 11. Porównanie prognoz konsumpcji węgla

42 Benalcazar et all 2017 / Gospodarka Surowcami Mineralnymi – Mineral Resources Management 33(4), 29–44
a deceleration in coal consumption for the years 2025 and 2030, from 3 831.33 Mtoe (2017) to 4 069.41 Mtoe (2025) and 4 182.02 Mtoe in 2030. It is worth pointing out that the results obtained in this study are in line with the forecasted consumption values published by the U.S. Energy Information administration and bP. It can be seen from the proposed coal forecasting method that MlP neural networks offer some advantages over other mathemat-ical programming models due to its ease of modeling linear and nonlinear dependencies between variables solely from observed data. For further research, in order to improve the performance of the forecast, it would be desirable to use a hybrid aNN based technique and include additional environmental and sociological variables.
Acknowledgements We would like to thank Anna Karnasiewicz for her assistance in collecting the data presented
in this study. The work was carried out as part of the statutory activity of the Mineral and Energy Economy
Research Institute Polish Academy of Sciences.
RefeReNces
beale et al. 2017 – beale, M.H., Hagan, M.t. and Demuth, H.b. 2017. Neural Network toolbox tM Reference. the MathWorks, Inc., Natick.
bP, 2017. BP Statistical Review of World Energy 2017. London.Dreyfus, g. 2005. Neural networks: methodology and applications, 1st ed. Springer-Verlag berlin Heidelberg, ber-
lin, Heidelberg. doi: 10.1007/3-540-28847-3.EIa, 2016. International Energy outlook 2016, International Energy outlook 2016. U.S. Energy Information admi-
nistration. [online] available at: www.eia.gov/forecasts/ieo/pdf/0484(2016).pdf [accessed: 7.06.2017].Ermis et al. 2007 – Ermis, K., Midilli, a., Dincer, I. and Rosen, M.a. 2007. artificial neural network analysis of
world green energy use. Energy Policy 35, 1731–1743. doi: 10.1016/j.enpol.2006.04.015.günay, M.E. 2016. Forecasting annual gross electricity demand by artificial neural networks using predicted va-
lues of socio-economic indicators and climatic conditions: Case of turkey. Energy Policy 90, 92–101. doi: 10.1016/j.enpol.2015.12.019.
Hagan et al. 1995 – Hagan, M.t., Demuth, H.b. and beale, M.H. 1995. Neural Network Design. bost. Massachusetts PWS 2, 734. doi: 10.1007/1-84628-303-5.
Hill et al. 1994 – Hill, t., Marquez, l., o’Connor, M. and Remus, W. 1994. artificial neural network models for forecasting and decision making. Int. J. Forecast. 10, 5–15. doi:.10.1016/0169–2070(94)90045-0.
IEa, 2016. Coal Information 2016. International Energy agency, Paris.Jebaraj et al. 2011 – Jebaraj, S., Iniyan, S. and goic, R. 2011. Forecasting of Coal Consumption Using an artificial
Neural Network and Comparison with Various Forecasting techniques. Energy Sources, Part a Recover. Util. Environ. Eff. 33, 1305–1316. doi: 10.1080/15567030903397859.
Kursa, M.b. and Rudnicki, W.R. 2010. Feature Selection with the boruta Package. J. Stat. Softw. 36, Issue 11, 1–13, doi: 10.18637/jss.v036.i11.
MacKay, D.J.C., 1992. bayesian Interpolation. Neural Comput. 4, 415–447. doi: 10.1162/neco.1992.4.3.415.National Coal Council, 2015. Coal = Reliable Energy. National Coal Council, Washington, DC.Prieto et al. 2016 – Prieto, a., Prieto, b., ortigosa, E.M., Ros, E., Pelayo, F., ortega, J. and Rojas, I. 2016. Neu-
ral networks: an overview of early research, current frameworks and new challenges. Neurocomputing 214, 242–268. doi: 10.1016/j.neucom.2016.06.014.

43Benalcazar et all 2017 / Gospodarka Surowcami Mineralnymi – Mineral Resources Management 33(4), 29–44
Raza, M.Q. and Khosravi, a. 2015. a review on artificial intelligence based load demand forecasting techniques for smart grid and buildings. Renew. Sustain. Energy Rev. 50, pp. 1352–1372. doi: 10.1016/j.rser.2015.04.065.
Rutkowski, l. 2008. Computational Intelligence, Computational Intelligence. Springer berlin Heidelberg, berlin, Heidelberg. doi: 10.1007/978-3-540-76288-1.
Szoplik, J. 2015. Forecasting of natural gas consumption with artificial neural networks. Energy 85, 208–220. doi: 10.1016/j.energy.2015.03.084.
the World bank, 2017. World Development Indicators 2017 [WWW Document]. URl. [online] available at: http://data.worldbank.org/data-catalog/world-development-indicators [accessed 8.21.2017].
Wilamowski, b.M. 2009. Neural networks architectures and learning algorithms. Ieee Ind. Electron. Mag. 56–63.
PRogNozowANie świAtowego zużyciA węglA z zAstosowANieM PodejściA sztuczNych sieci NeuRoNowych
S ł o w a k l u c z o w e
prognozowanie, zużycie węgla, sztuczne sieci neuronowe
S t r e s z c z e n i e
W XXI wieku energia stała się integralną determinantą społeczeństwa i światowego rozwoju gospodarczego. Pomimo tego, że świat doświadczył zdecydowanych postępów technologicznych, paliwa kopalne (tj. węgiel, gaz ziemny i ropa naftowa) nadal są głównym źródłem energii na świe-cie. Szacuje się, że przy obecnym poziomie produkcji zasoby węgla (ekonomicznie możliwe do pozyskania) powinny wystarczyć na około 130 lat (największe rezerwy węgla znajdują się w Sta-nach Zjednoczonych, Rosji, Chinach i Indiach). Zawiłe relacje między wzrostem gospodarczym, demografią, zużyciem energii (szczególnie w krajach o przemysłach silne uzależnionych od paliw kopalnych) oraz podwyższone ilości gazów cieplarnianych w atmosferze wzbudziły poważne oba-wy w społeczności naukowej na temat przyszłości węgla. W świetle powyższego, dotychczasowe badania skupiały się na opracowywaniu i stosowaniu metod prognozowania rozwoju rynku węgla, przyszłych poziomów rezerw, produkcji, konsumpcji i wpływu na środowisko. biorąc pod uwagę powyższe uwarunkowania, celem niniejszego artykułu jest opracowanie metody prognozowania światowego zapotrzebowania na węgiel z wykorzystaniem metody sztucznej sieci neuronowej. W poniższej pracy zastosowano podejście oparte na sieci neuronowej Perceptron Multilayer (MlP) do prognozowania światowego zużycia węgla w latach 2020–2030. Model MlP bazuje na histo-rycznych zestawach danych zebranych od instytucji finansowych, organów i agencji statystycznych pozyskujących dane na temat energii obejmujących lata od 1970–2016. Wyniki niniejszego badania wskazują na spowolnienie światowego zużycia węgla do poziomu 3932 Mtoe w 2020 r., 4069 Mtoe w 2025 r. oraz 4182 Mtoe w 2030 roku.
44 Benalcazar et all 2017 / Gospodarka Surowcami Mineralnymi – Mineral Resources Management 33(4), 29–44
foRecAstiNg globAl coAl coNsuMPtioN: AN ARtificiAl NeuRAl NetwoRk APPRoAch
K e y w o r d s
forecasting, coal consumption, artificial neural networks
A b s t r a c t
In the 21st century, energy has become an integral part of our society and of global economic development. although the world has experienced tremendous technological advancements, fossil fuels (including coal, natural gas, and oil) continue to be the world’s primary energy source. at the current production level, it has been estimated that coal reserves (economically recoverable) would last approximately 130 years (with the biggest reserves found in the USa, Russia, China, and India). the intricate relationship between economic growth, demographics and energy consumption (parti-cularly in countries with coal intensive industries and heavy reliance on fossil fuels), along with the elevated amounts of greenhouse gases in the atmosphere, have raised serious concerns within the scientific community about the future of coal. thus, various studies have focused on the development and application of forecasting methods to predict the economic prospects of coal, future levels of re-serves, production, consumption, and its environmental impact. With this scope in mind, the goal of this article is to contribute to the scarce literature on global coal consumption forecasting with the aid of an artificial neural network method. this paper proposes a Multilayer Perceptron neural network (MlP) for the prediction of global coal consumption for the years 2020–2030. the MlP-based mo-del is trained with historical data sets gathered from financial institutions, global energy authorities, and energy statistic agencies, covering the years 1970 through 2016. the results of this study show a deceleration in global coal consumption for the years 2020 (3 932 Mtoe), 2025 (4 069 Mtoe) and 2030 (4 182 Mtoe).