forecasting hedge fund index returns by level and ... · the kajiji-4 rbf ann to the credit swiss...
TRANSCRIPT

Forecasting Hedge Fund Index Returns by Level and Classification A
Comparative Analysis of Neural Network Topologies
By
Gordon H Dash Jr
Associate Professor of Finance and Insurance
Nina Kajiji
Assistant Professor of Research Education
07-APR-04 2nd Printing
JEL CATEGORY
C22 ECONOMETRIC METHODS Time Series Models C45 ECONOMETRIC AND STATISTICAL METHODS Neural Networks C53 ECONOMETRIC MODELING Forecasting
Keywords Neural Networks radial basis function financial engineering investments hedge funds return predictability
Prepared for presentation at the annual meeting of the Eastern Finance Association Mystic CT 21-24 APRIL 2004 Please address all
correspondence to Gordon H Dash Jr 777 Smith Street Providence RI 02908 Voice (401) 241-7730 Fax (401) 874 4312 Email
GHDashuriedu
National Center on Public Education amp Social Policy University of Rhode Island 80 Washington Street Providence RI 02903
2004 By Gordon H Dash Jr and Nina Kajiji All rights reserved Explicit permission to quote is required for text quotes beyond two paragraphs In all cases full credit including notice is required
Forecasting Hedge Funds Index Returns -ii- Dash amp Kajiji
Abstract
The skewed and leptokurtic behavior of hedge fund index returns is well documented in the literature To date the nonlinear nature of hedge fund returns has retarded the ability of researchers to produced stylized facts on the efficient modeling of hedge fund index returns across alternative performance and volatility objectives The most recent findings report a dominance of classification models over return-level prediction models This paper provides evidence that a nonparametric artificial neural network (ANN) is able to produce consistent return-level prediction in both direction and magnitude The paper extends earlier findings that show the ANN to be a dominant topology for modeling nonlinear hedge fund returns However unlike earlier research we narrow the analytical examination to a comparative analysis within the radial basis function (RBF) method When applied to the thirteen Credit Swiss First BostonTremont hedge fund indices each of the alternative RBF ANN algorithms model hedge fund returns consistently and accurately The analysis provides new evidence that one of the comparative networks the Kajiji-4 RBF ANN not only dominates in the modeling phase but this network singularly proved capable of near-perfect one-period ahead directional return-level prediction
Forecasting Hedge Funds Index Returns -1- Dash amp Kajiji
Forecasting Hedge Fund Index Returns by Level and Classification A
Comparative Analysis of Neural Network Topologies
I Introduction
Efficient modeling and prediction of financial returns volatility is essential to the
investors who wish to trade direction or maximize trading returns To this end an optimal
trading rule is necessary if the investor is to form an expectation of the future return For
example Barber et al (2001) present new and updated evidence that individual investors are
able to earn abnormal returns with high frequency trading on information gleaned from the
forecasts published by informed security analyst Likewise investment managers share the need
for accurate forecasts for a variety of different but equally important reasons This point is
exemplified for hedge fund managers by a recent study completed by Brown Goetzmann and
Park (2001) They provide analytical evidence that hedge fund managers rely on historical and
predicted peer benchmarks as necessary performance guides Funds that deviate significantly in
either peer- or industry-comparative performance are observed to experience investor withdrawal
activity that can threaten the funds long-run viability Hence the authors argue that the ability
to forecast the direction of a funds future return (classification forecast) as well as its return-
level is imperative for long-run survival in an industry driven by comparative results
Unfortunately alternative asset-return prediction methodologies abound and there does
not appear to be a consensus to yield a set of stylized facts when it comes to the comparative
accuracy of classification methods versus return-level prediction methods Return-level
forecasting employs methodology that is designed to produce a point prediction of a future return
level By contrast classification-based methods focus on the direction of the expected volatility
of future returns In a recent study on the predictability of three international capital market
indices Leung et al (2000) presented findings that challenge the contemporary view which
aspires to support the preference of return-level prediction over classification prediction
methods Leung reported that classification-based prediction dominates return-level methods in
the number of times a predicted observation was consistent with its actual outcome
Additionally a threshold trading rule simulation found greater wealth creation from trading
Forecasting Hedge Funds Index Returns -2- Dash amp Kajiji
activity to be associated with a classification based approach The probabilistic classification
methods examined by Leung included linear discriminant analysis logit- and probit-modeling
along with a probabilistic neural network (PNN) The comparative return-level forecasting
methods included exponential smoothing multivariate transfer function (ARIMA) vector
autoregression with Kalman filter and multilayered feedforward neural network (MLFN) In a
comparison of predictive strength Leung concludes that the artificial neural network architecture
(MLFN) achieved superior within class performance
If as these findings report classification methods do in fact dominate traditional return-
level forecasting strategies this would certainly provide an interesting challenge to some of the
earliest and most influential findings on predicting asset class returns as observed in the US and
international markets (see for example Keim and Stambaugh (1986) Campbell and Shiller
(1989) Fama and French (1989) Ferson and Harvey (1991) Barberis (2000) Harasty and
Roulet (2000) and Lynch (2000)) We note however that the Leung analysis is based upon a
software product (ThinkPro computer package) for which there is no active Internet site nor any
other published academic evaluations The absence of a comparative reference does not permit a
certification of the modeling software nor does it help to position the efficiency of the ThinkPro
computer package against more recognized ANN applications1
The purpose of this study is twofold First it is to reexamine and reconcile the findings
on alternative hedge fund returns prediction provided by Leung on the one hand and Amenc et
al (2002) on the other Second it is to extend the modeling of hedge fund indexes by applying
the Kajiji-4 RBF ANN to the Credit Swiss First BostonTremont (CSFBT) family of hedge fund
index returns The nonparametric Kajiji-4 RBF ANN algorithm has proven to be an efficient and
dominant algorithmic tool when compared against the GARCH framework and a broad range of
alternative ANN topologies For example in a direct comparison to both the generalized
regression and backpropagation ANN algorithmic structures Dash et al (2003) demonstrate the
methods dominance when modeling high frequency volatility Elsewhere Dash and Kajiji
1 See Balci (2001) for an analytical framework for certifying modeling and simulation software applications Also for contemporary issues related to software compactness see Debray et al (2000) Fraser and Wendt (1986) Hanson (1983) Lindvall etal (2003) Dyba (2000) Sheldon and Greiner (1999) and Mayrand etal (2000)
Forecasting Hedge Funds Index Returns -3- Dash amp Kajiji
(2002) provide additional evidence of algorithmic dominance in a comparison of the Kajiji-4
method against well-known RBF ANNs in an application of 1-hour FX volatility
The paper proceeds as follows Section 2 of the paper presents a discussion of the
multivariate statistical method used to uncover and update existing findings regarding the
predictability of hedge fund returns Section 3 of the paper identifies the comparative RBF
topologies that are tested for efficient prediction of the hedge fund returns Results of the
prediction experiment are presented in section 5 The paper concludes with a summary and
conclusion in section 6
Forecasting Hedge Funds Index Returns -4- Dash amp Kajiji
2 The Structure of Hedge Fund Returns
Exposition guidelines lead us to center the analysis on two of the thirteen hedge funds
within the CSFBT group Throughout the paper we refer to the Dedicated Short Bias fund and
the Equity Market Neutral fund as the focus indices They are chosen for this role based on the
level of their relative volatility (coefficient of variation) For the time period of this study the
Dedicated short bias is the most volatile of the indexes and the Equity Market Neutral index is
the least volatile within the group
21 Data
The data for this analysis consists of 108 monthly return observations from January 1994
to December 2002 on the group of hedge fund indexes published by CSFBT The 13 CSFBT
hedge fund indices range from a high volatility style (Dedicated Short Bias) to a much lower
volatility style (Equity Market Neutral) Detailed descriptive characteristics of the fund indexes
are reported in Amenc (2002) Performance characteristics on the CSFBT indexes are provided
by Lhabitant (July 2002) Because one of our objectives here is to model returns by tactical style
for the purpose of obtaining accurate predictions we augment the previously presented statistical
findings on returns symmetry The added information is necessary to fully achieve our objective
which is to compare performance differences among the alternative RBF topologies on a small
monthly returns database
22 Hedge Fund Returns
Figure 1 displays a scatter diagram of the returns for the two focus hedge funds This
display is complemented by the descriptive statistics as presented in table 1 This table is
designed to assist in the assessment or returns symmetry To that end both a skewness and
kurtosis measure are presented Additionally the table presents the results of applying the small
sample Shapiro-Wilk test for normality
Forecasting Hedge Funds Index Returns -5- Dash amp Kajiji
Figure 1 Scatter Diagram of DED Short Bias vs Equity Market Neutral Fund
Scatter D iagramFeb 1994 - N ov 2002
DED Short Bias Equity Market Ntrl
1061041021009896949290888684828078767472706866646260585654525048464442403836343230282624222018161412108642
26
25
24
23
22
21
20
19
18
17
16
15
14
13
12
11
10
9
8
7
6
5
4
3
2
1
0
-1
-2
-3
-4
-5
-6
-7
-8
-9
In a manner that is consistent with prior findings we a test the Gaussian properties of the
index returns (see Fung and Hsieh (1999) and Kat and Lu (2002) for detailed reviews on hedge
fund Gaussanity) The reported p-values extracted from the application of the Shapiro-Wilk test
support the conventional wisdom that hedge fund returns are not characteristic of a normal
distribution Additionally we find strong and significant evidence that the CSFBT returns are
leptokurtic (fat-tailed) Specifically we find only one fund (Equity Market Neutral) with a
kurtosis measure that is close to zero (-0006) Interestingly the skewness measure for this one
index is also very small and positive (we expected a negative value) However this finding
cannot be generalized to seven of the thirteen indexes Within this subgroup of seven indexes
the kurtosis measure is measurably different from zero and in some cases quite high At the
low end in this group is the Emerging Markets index with a kurtosis value of 2999 The Event
Driven index tops this subgroup with a measure of 20153 The returns distributions for this
group all display negative skewness coefficients This leads us to conclude that the distributions
within this subgroup are asymmetrical Asymmetries are further evidenced within the subgroup
by the negative skewness coefficients The implication for the risk-averse investor is not a
promising one That is these findings suggest the potential for extreme negative returns a
finding that negates the application of traditional mean-variance diversification As we look
ahead to the forecasting simulation it will be interesting to focus on the ability of the various
algorithmic methods to treat the observable asymmetries
Forecasting Hedge Funds Index Returns -6- Dash amp Kajiji
Table 1 Descriptive Statistics Mean Standard
Deviation
Variance CV Skewness
Kurtosis WNormal
CSFBT Hedge Fund Index 0879 2569 6599 2924 0110 1238 0889 Convertible Arbitrage 0825 1405 1973 1704 -1602 3877 0826 Dedicated Short Bias 0203 5310 28201 26177 0825 1819 0802 Emerging Markets 0547 5361 28739 9795 -0477 2999 0895 Equity Market Neutral 0882 0922 0849 1045 0126 -0006 0919 Event Driven 0851 1813 3288 2132 -3272 20153 0773 Distressed 0983 2092 4375 2127 -2609 14281 0821 ED Multi Strategy 0783 1919 3684 2452 -2499 14522 0807 Risk Arbitrage 0680 1326 1758 1949 -1345 5775 0874 Fixed Income Arbitrage 0547 1184 1402 2165 -3155 14930 0734 Global Macro 1172 3668 13453 3129 -0018 1459 0907 Long Short 0973 3325 11055 3417 0236 2717 0859 Managed Futures 0571 3463 11993 6062 0042 0743 0913
Forecasting Hedge Funds Index Returns -7- Dash amp Kajiji
23 Hedge Fund Predictors
To parsimoniously capture the covariance structure of the hedge fund returns with
recognizable predictor variables we follow the APT encompassing approach of Han (2002) In
the absence of daily (or greater) observations over a sufficiently long horizon we are not able to
invoke a dynamic factor multivariate stochastic volatility test Our reliance on monthly data also
rules out the ability to invoke the Bollerslev (1986) multivariate GARCH model or the
multivariate stochastic volatility of Chib et al (2001) Therefore we proceed by first
identifying the commonly used predictor variables in forecasting and modeling returns by ANN
methods Next we employ factor analytic methods to reduce the collinear structure of these
subjectively chosen predictor variables
231 Predictor Variables
The selection of predictor variables for ANN models remains an elusive science Since
an objective of this paper is to re-examine earlier prediction efforts we adapt the choice of
predictor variables from Leung et al (2000) and Amenc (2002) The variable(s) used to proxy
each dimension is listed below the dimension identifier in table 2 It is well known that many of
the predictor proxies listed below exhibit collinear structure Unless specifically adapted ANN
algorithms require predictor variables to maintain statistical independence Some ANN methods
like the Kajiji-4 algorithm resolve collinearity Nevertheless where possible statistical
independence is desired As an alternative to exhaustive testing of alternative model
specifications we employ multivariate principal component analysis (PCA) with Varimax
rotation to reduce dimensionality and to uncover the latent uncorrelated factor structure among
the economic proxies
232 Varimax Rotation
The results of applying the Varimax rotational technique to the predictor variables are
presented in table 3 The factor analysis results produced six factors with eigenvalues of at least
10 These factors explain slightly more than 76 percent of the total variation in the predictor
variables
Forecasting Hedge Funds Index Returns -8- Dash amp Kajiji
Table 2 Contemporary Predictor Variables
Economic Dimension Pneumonic(s) Proxy-a Proxy-b Short Term Interest Rates
3TBYld 1D3TBYld Yield on the 3-month T-bill rate for the US First difference of yield on 3-month US T-bill rate
Long Term Interest Rates
1D20TB First difference of the 20 year government bond rate for the US
Consumer Price Index (CPI)
1DCPI First difference US CPI
Industrial Production Level
1DIP First difference of US industrial production index
Dividend Yield SampPdivYld Dividend yield on the SampP stocks Default Spread MBaaMAAA Difference between the yield on Moody s
long term Baa bonds and the yield on Moody s long term AAA bonds
Term Spread 10TB-3TB Difference between the yield on 10-year T-bond and 3-month T-bill
Implicit Volatility VIX Change in the average intra-month values of the VIX
Market Volume NYSE Change in the market value on the NYSE Events MLHBF MLHBFCC Merrill Lynch High Yield Bond Fund Log-differenced returns on the Merrill
Lynch High Yield Bond Fund Oil Price WTXOIL WTXOILlag Average price of west Texas intermediate
crude Lag price of west Texas intermediate crude
US Equity Factor SampPlagCC SampPCC One period lag of the log-differenced returns of the SampP500 Index
Log-differenced returns of the SampP500 Index
World Equity Factor MSCIlagCC Log-differenced returns on the MSCI World Index excluding US
Currency Factor 1DCRB USDTW First difference in the Bridge Commodity Research Bureau Currencies Index
Trade-weighted Exchange Value of USD
Futures Index CRBF 1DCRBF CRB Futures Index First difference CRB Futures Index
Forecasting Hedge Funds Index Returns -9- Dash amp Kajiji
Table 3 Varimax Rotated Factor Loading Factor 1 Factor 2 Factor 3 Factor 4 Factor 5 Factor 6 Factor 7 Factor 8 Row
MLHBF -0946
0949
SampPdivYld 0928
0967
USDTW -0834
0902
CRBF 0805
0800
MBaaMAAA -0466
0744
0821
1D3TBYld -0660
0630
3TBYld -0907
0931
10TB-3TB 0886
0887
WTXOILlag -0915
0927
WTXOIL -0940
0955
1DCRBF 0495
0637
1DCRB 0522
0545
MLHBFCC 0864
0827
SampPCC 0936
0923
VIX -0558
-0595
0800
MSCIlagCC 0951
0944
1DCPI 0804
0822
1D20TB -0773
0663
SampPlagCC 0833
0789
NYSE 0745
0773
1DIP 0837
0755
Eigenvalue 3716
2600
2407
2345
2047
1501
1378
1251
CumVarExp
0177
0301
0415
0527
0625
0696
0762
0821
Forecasting Hedge Fund Index Returns
-10- Dash amp Kajiji
233 Latent Factor Descriptions
The latent factor dimensions are subjectively classified and presented in table 4
Table 4 Latent Factor Classification Factor
Domain Characteristic
F1 Yields on Equity and Risky Bonds with Currency and Futures Effects F2 Default and Term Spread with Inverse 3-Tbill Effect F3 Continuously compounded returns on domestic and world Equity markets with
inverse effects of VIX F4 Oil F5 Continuously compounded returns on high yield bonds with lagged equity
returns and inverse VIX F6 First Differenced 20-year Tbond and 3-Tbill with inverse on differenced
currency effect F7 Effect of CPI and change in domestic market volume F8 Change in industrial production
234 Factor Scores
Based on the extracted factors we compute factor scores of each subject as a means of reducing
the predictor variables down to six latent variables that correspond to the rotated domains We
follow the method of Thomson (1951) If fr is the score of the rth factor corresponding to a
response of x then we estimate fr by a linear combination of the xi
r rf a x We choose ar such that 2
r rE f f is minimized In vector notation
1 kf f f and the solution is estimated by
F x (1)
where is the factor loading matrix the covariance matrix and x the original data matrix
From each set of responses x we obtain the vector of factor scores f
Forecasting Hedge Fund Index Returns
-11- Dash amp Kajiji
3 The Kajiji-4 Benchmark Radial Basis Function
In this section we present the methodology supporting the use of the Kajiji-4 RBF as the
control neural network against which the alternate neural network topologies are tested Within
the radial basis function class of neural networks we explicitly consider the RBF algorithms
produced by StatSoft (2001) and SPSS (2001)2
The optimal weighting values used within the RBF network are generally extracted by
applying a supervised least-squares method to a subset of the data series (the training set) The
supervised learning function is stated as
( )y f x
(2)
where y the output vector is a function of x the input vector with n number of inputs
Alternatively the supervised learning function can be restated as the following linear model
1
( ) ( )m
j jij
f x xw h (3)
where m is the number of basis functions (centers) h is the hidden units w is the weight vectors
and i = 1k output vectors (target variables) The flexibility of f(x) and its ability to model many
different functions is inherited from the freedom to choose different values for the weights Then
applying the least-squares principle is similar to minimizing the sum of squared errors as
represented by
2
1
( )p
i ii
SSE y f x
(4)
Kajiji (2001) presents the RBF mapping function as a modified Tikhonov regularization
equation (1977) Tikhonov regularization adds a weight decay parameter to the error function to
2 Dash and Kajiji (2002) report seriously inconsistent performance characteristics for the Matlab RBF ANN In addition to excessively long computation times vis-agrave-vis alternative RBF implementations the Matlab RBF method was also prone to numerical under- and over-flow conditions that failed the program These reasons forces us to defer including Matlab in this test of numerical efficiency
Forecasting Hedge Fund Index Returns
-12- Dash amp Kajiji
penalize mappings that are not smooth If a weight penalty term is added to the SSE the SSE
can be restated as the following cost function
2 2
1 1
( )p m
i i j ji j
C y f x k w
(5)
where kj are regularization parameters or weight decay parameters Under this specification the
function to minimize is
2 2
1 1
argmin( ( | ))
p m
i i j ji j
y f x k k wk
(6)
Iterative techniques are commonly employed to compute the weight decay parameter k
or a vector of parameters k But since the introduction of weight decay methods by Hoerl and
Kennard (1970) and Hemmerle (1975) it is generally understood that iterative techniques are
computationally burdensome and lack specificity [see Orr (1996 1997)] Further
computational experience has established that iteration often leads to local minima or in the case
where the weight decay approaches infinity inflated residual sums of squares By contrast the
Kajiji RBF algorithm is a Bayesian regularization algorithm that derives a globally optimized
regularization parameter based on a cross-population of recent extensions in optimal ridge
regression parameter estimation by Crouse (1995) The Kajiji algorithm directly attacks the twin
evils that deter efficient ANN modeling the curse of dimensionality (over-parameterization)
and inflated residual sum of squares (inefficient weight decay)
4 The Modeling Process
Let rt = (rit rpt) represent a vector of p returns observed at time t t = 1 n Let Ft =
(F1t Fkt) specify k latent factors with which there are corresponding maximum validity factor
scores denoted by St for k latent factors The following economic model is formulated for each
of the m CSFBT indexes where m = 1 M for the 13 published indexes
HFIm = (S1 Sk) (7)
Forecasting Hedge Fund Index Returns
-13- Dash amp Kajiji
HFIm is the individual hedge fund that is subjected to the model comprised of the Sk factor
scores
41 Measurement Errors in Return Level Prediction
Comparative evaluation relies upon the computed residuals for the training out-of-
sample validation and fitness (entire sample) data subsets Specifically model errors are
computed as
2
1
t
training i ii
MSE y y t
(8)
2
1
v
validation i ii
MSE y y v
(9)
2
1
T
fitness i ii
MSE y y T
(10)
where MSEtraining is local to the training sub-set (Tt) and the MSEvalidation measure captures the
out-of-sample error component (Tt+1Tv) The MSEfitness measure is computed over all (T)
observations For purposes of this paper all algorithmic comparisons rely solely on the direct
evaluation of the computed MSEfitness
42 Measurement Errors - Classification Prediction
Neural network classification topology generally relies upon an output function of
probabilities to assign group membership Leung preferred this approach However for return
classification it is possible to use a direction measure to test the number of times a prediction
neural network predicts the direction of the predicted return movement correctly In this study in
order to minimize the chance of introducing new specification errors by from the use of
alternative neural network architecture we implement measurement errors that take into account
the simultaneous behavior of trend and magnitude within the trend
Forecasting Hedge Fund Index Returns
-14- Dash amp Kajiji
421 Direction Measure
Direction is defined as the number of times the prediction followed the up and down
movement of the underlying index The initial calculations were presented by Harvey et al
(2002) and later modified Castiglione (2001) as shown below
1 1 1 11
11i i i i
i T
HS P G HS P GT
(11)
where
Pi+1 = Indexi+1 Indexi is the percentage return on the index at time step i+1 T
Gi+1 = the forecast percentage return on the index at time step i+1 T
T = the number of days in the validation period
HS = a modified Heavyside function where HS(x)=1 for xgt0 and 0 otherwise
422 Modified Direction Measure
A more robust method of direction was presented by Merton (1981) and named modified
direction
Modified Direction = (( of correct up predictions of times index up) +
( of correct down predictions times index down)) 1 (12)
423 Time Dependent Directional Profit
The two direction measures each provide a summary of how well the predicted time-
series and the actual time-series move together at any given point in time We introduce the Yao
(Access Year 2003) time dependent directional profit measurement error (TDDP) as a means by
which to capture the simultaneous effects of time and profit in the forecast simulation Under
this method incorrectly predicted directional moves are penalized more heavily than are correct
predictions The weights are then adjusted based on the amount of change from one forecast
point to the next In essence a large adjustment to the weights is made given a wrong directional
Forecasting Hedge Fund Index Returns
-15- Dash amp Kajiji
forecast which is accompanied by a large change in the underlying values Conversely a small
adjustment to the weights is signaled by a correct directional forecast for a correspondingly large
change in the underlying The TDDP error measure is defined as
2
1
1( )( )
2
N
TDP TDP p ppE f p t o
N
(13)
where ( ) ( )TDP DPf f p w p and the vectors t and o capture the target-prediction and observed
values over the p prediction periods Changes in the underlying and direction as described above
are determined by 1(| | ( ))DP p p p pf F t t sign t o At prediction point p the directional
profit adjustment factor is determined according to
1
2
3
4
0 | |
0 | |( )
0 | |
0 | |
p p p
p p p
DPp p p
p p p
a if t o and t
a if t o and tf p
a if t o and t
a if t o and t
(14)
where is the standard deviation of the target variable over all N observations (training and
validations observations) Simulation results for the monthly time scale lead us to the following
parameter values 1 05a 2 08a 3 12a and 4 15a We caution however that there is
insufficient evidence to recommend the extrapolation of these settings to other time scales such
as daily or higher frequencies
5 Modeling Results
In this section we present the results of applying the sample data to each one of the three
test algorithms The hardware configuration for this experiment consisted of a 2ghz Pentium-4
CPU with 512 MB of random access memory All program executions were made under the
Microsoft XP Professional operating system Algorithmic differences in solution execution
times were measurable but small Solutions times ranged from about 4 seconds (Kajiji-4) to just
under 10 seconds (SPSS) While this difference is negligible for the relatively small monthly
dataset used in this study it is an issue that may require renewed attention under tests involving
Forecasting Hedge Fund Index Returns
-16- Dash amp Kajiji
large-scale datasets consisting of thousands of high frequency observations Despite the similar
model solving times other similarities and substantial differences arise when comparing the
relative modeling efficiency of the three RBF ANNs Specific modeling results for the Kajiji-4
method are presented next This is followed by the presentation of results for the solutions
generated by SPSS and StatSoft algorithms respectively
51 Kajiji-4
The analysis of algorithmic efficiency begins with a review of the MSE validation
measures are presented in table 5 The validation error is just over 1 percent for the Dedicated
Short Bias index and is even smaller (just under 004 percent) for the Equity Neutral hedge fund
index We note that the Global Macro index fund achieved a comparable low fitness error
measure (004 percent) As we extend the analysis to uncover overall algorithmic efficiency we
observe that the two low MSE models also have correspondingly low skewness and kurtosis
measures This finding suggests that model efficiency improves as the effects of skewness and
kurtosis diminish When the third- and fourth-moment characteristics are considered the
algorithmic results reported for the Equity Market Neutral index appear interestingly efficient
At the other end of the modeling spectrum is the model applied to the Event Driven index This
model produced a fitness MSE (67 percent) that was almost 150 times larger than that reported
for the two low error models This result yields an interesting insight into the algorithmic
performance when applied to monthly hedge fund returns We note that the Event Driven index
has the highest absolute skewness coefficient (-3272) and the highest kurtosis measure (20153)
These results add to our earlier observations about the importance of understanding the role of
distributional symmetry in hedge fund returns In the former case low values for skewness and
kurtosis were associated with low fitness MSE results In this latter case relatively high
skewness and kurtosis measures are associated with deterioration in modeling accuracy as
measured by the fitness MSE The reported modeling efficiency is buttressed by the cross-plot
of the observed and target observations Figures 2 and 3 provide a visual validation that the
error deviation within the validation set is small for the two indices of interest
Forecasting Hedge Fund Index Returns
-17- Dash amp Kajiji
Next we assess the ability of the Kajiji-4 algorithm to correctly predict the directional
change of hedge fund returns Both the direction and modified direction measures report
identical results across all model applications The direction measure solves at 0988 and the
modified direction measure is constant at its maximum value of 10 The modified direction
measurement of 10 does not necessarily imply that the prediction is perfect A more
conservative interpretation of the result allows us to conclude that the target variable correctly
attempts to model the peaks and troughs found in the observed dataset Take together these two
measures provide strong evidence that the Kajiji-4 algorithm when applied to monthly return
data for alternative assets can achieve near perfect results in forecasting directional changes in
the returns data
The strong performance of the directional measures does not address the profit incentive
held by investors The profit-enhanced TDDP measure presents a very clear picture of modeling
efficiency
Forecasting Hedge Fund Index Returns
-18- Dash amp Kajiji
Table 5 Kajiji-4 Model Results
SFB Tremont Hedge Fund
Convertible Arbitrage
Dedicated Short Bias
Emerging Markets
Equity Market Neutral
Event Driven
Distressed ED Multi-Strategy
Risk Arbitrage
Fixed Income Arbitrage
Global Macro
Long Short
Managed Funds
Lambda 1051 1129 1165 1912 46713 0238 0195 0469 0792 0154 9764 1530 1982 Return-level Error Measures Training Error 1271 1107 1019 1248 1189 1136 1079 1186 1040 1165 1295 1212 0853 Validation Error 0143 0531 0757 0227 0400 0191 0219 0207 0508 0132 0111 0309 1095 Fitness Error 0022 0021 0401 0046 0000 0221 0425 0111 0065 0098 0000 0035 0233 Classification Error Measure Direction 0988 0988 0988 0988 0988 0988 0988 0988 0988 0988 0988 0988 0988 M Direction 1000 1000 1000 1000 1000 1000 1000 1000 1000 1000 1000 1000 1000 TDDP 00054 00052 01418 00114 00001 00718 01374 00361 00229 00308 00001 00087 00802
Forecasting Hedge Fund Index Returns
-19- Dash amp Kajiji
Figure 2 Actual and Predicted Using Kajiji-4 RBF on Dedicated Short Bias Fund
DED Short BiasActual and Predicted (Feb 1994 - Feb 2002)
Actual Predicted
9897969594939291908988878685848382818079787776757473727170696867666564636261605958575655545352515049484746454443424140393837363534333231302928272625242322212019181716151413121110987654321
26
25
24
23
22
21
20
19
18
17
16
15
14
13
12
11
10
9
8
7
6
5
4
3
2
1
0
-1
-2
-3
-4
-5
-6
-7
-8
-9
Figure 3 Actual and Predicted Using Kajiji-4 RBF on Equity Market Neutral Fund
Equity Market NatrlActual and Predicted (Feb 1994 - Feb 2002)
Actual Predicted
9897969594939291908988878685848382818079787776757473727170696867666564636261605958575655545352515049484746454443424140393837363534333231302928272625242322212019181716151413121110987654321
3
2
1
0
-1
Forecasting Hedge Fund Index Returns
-20- Dash amp Kajiji
52 SPSS s Neural Connection
The SPSS RBF results presented in table 6 differ markedly from those produced by the
Kajiji-4 algorithm Based on a comparison of within algorithmic MSE results the SPSS RBF
modeling experiment achieves the lowest error value when modeling the Equity Market Neutral
index This is one of the two focus indices But the SPSS reported error measure for this index
is more than 3425 times larger than that produced by the Kajiji-4 simulation For the other
focus index Dedicated Short Bias the SPSS fitness MSE is more than 1975 times higher than
that produced by the Kajiji-4 counterpart This is also the largest MSE reported by the
application of the SPSS procedure Returning to our examination of how RBF algorithms
perform under conditions of distributional asymmetry we note that except for one case (the Fixed
Income Arbitrage index) the SPSS algorithm generates a consistent performance ratio for hedge
fund indices with absolute skewness levels above 300 and kurtosis measures greater than 140
Within the subgroup defined by the Event Driven Distressed and ED Multi-Strategy indices
the reported fitness MSE measures ranged from 3172028 to 3642675 By comparison the
Kajiji-4 algorithm also performed consistently across this same subgroup but the reported MSE
measures were decidedly lower under Kajiji-4 achieving levels that ranged from 0030 to 0037
In summary the SPSS RBF algorithm demonstrated the ability to produce consistent
performance across monthly return indices with high absolute skewness and high kurtosis
measures Unfortunately asymmetry issues aside the performance of the algorithm dissipate as
the level of relative variation (CV) increases A graphical display of the two focus indexes is
provided in figures 4 and 5 respectively
Forecasting Hedge Fund Index Returns
-21- Dash amp Kajiji
Table 6 SPSS Model Results
SFB Tremont Hedge Fund
Convertible Arbitrage
Dedicated Short Bias
Emerging Markets
Equity Market Neutral
Event Driven
Distressed ED Multi-Strategy
Risk Arbitrage
Fixed Income Arbitrage
Global Macro
Long Short
Managed Funds
Return-level Error Measures Training Error 1074746 0998806 1018551 1073490 0948484 098785 0464553 091175 0860569 0522714 070402 101266 0939322 Validation Error 0279682 0827859 0868138 0503276 0544275 075957 0899311 063094 0671334 0788974 022464 033472 1210085 Fitness Error 6999264 2468697 27655226 28473214 1370447 364267 3127028 349122 1698769 0767644 1093985 1094859 12059491 Classification Error Measure Direction 05046 06697 04404 05138 05780 05596 05688 05963 06055 06514 06789 05229 05413 M Direction 03425 03080 01521 02103 03271 02917 05255 03644 02735 04862 04496 03112 -00137 TDDP 16879 08222 78533 53780 02697 08478 06223 10244 04540 01597 17682 34983 35241
Forecasting Hedge Fund Index Returns
-22- Dash amp Kajiji
Figure 4 Actual and Predicted Using SPSS RBF on the Dedicated Short Bias Fund
Dedicated Short BiasActual and Predicted
Actual Predicted
1081061041021009896949290888684828078767472706866646260585654525048464442403836343230282624222018161412108642
9
8
7
6
5
4
3
2
1
0
-1
-2
-3
-4
-5
-6
-7
-8
Figure 5 Actual and Predicted Using SPSS on Equity Market Neutral Fund
Equity Market Neutral FundActual and Predicted
Actual Predicted
1081061041021009896949290888684828078767472706866646260585654525048464442403836343230282624222018161412108642
3
2
1
0
-1
Forecasting Hedge Fund Index Returns
-23- Dash amp Kajiji
53 StatSofts Statistica
On average the results produced upon the application of the StatSoft RBF algorithm to
the modeling problem fall in between those produced by the other two RBF algorithmic
methods Before presenting the details as provided in table 7 we wish to note that the user
interface of the StatSoft algorithm differs considerably from that presented by either the Kajiji-4
or SPSS methods For the StatSoft-based experiment where possible optional parameter
settings were set to levels specified as default levels under the Kajiji-4 method We then
undertook a manual optimization process with the goal of identifying parameter settings that
would produce best (if not optimal) solution results for the sample data Stated differently while
we were able to apply default settings without modification under the Kajiji-4 and SPSS
experiments that was not possible in this case
Like the Kajiji-4 algorithm the StatSoft method reported the lowest fitness MSE for the
Equity Market Neutral index model The MSE reported by the StatSoft method is approximately
14 times larger than that achieved by application of the Kajiji-4 network For the other focus
index Dedicated Short Bias at 23051 the fitness MSE is the highest recorded across all test
models This result is more than 1600 times that achieved for the same index under the Kajiji-4
method Figure 6 and 7 provide a graphical view of the algorithms predictive ability for the
Dedicated Short Bias and Equity Neutral fund returns It is clear from this view that the target
variable achieves reasonable directional performance but falls short in its ability to replicate the
magnitude of the changes We observe that the StatSoft method performs best when modeling
monthly hedge fund returns with relatively low coefficients of variation The algorithms
predictive ability dissipates noticeably as relative variation (CV) increases How if at all this
deterioration is impacted by distributional asymmetry is not immediately clear from the results
generated by this experiment
Forecasting Hedge Fund Index Returns
-24- Dash amp Kajiji
Table 7 Staistica-4 Model Results
SFB Tremont Hedge Fund
Convertible Arbitrage
Dedicated Short Bias
Emerging Markets
Equity Market Neutral
Event Driven
Dis-tressed
ED Multi-Strategy
Risk Arbitrage
Fixed Income Arbitrage
Global Macro
Long Short
Managed Funds
Return-level Error Measures Training Error 03647 05030 01663 01280 09018 04456 03509 04142 06886 06328 01994 02182 02826 Validation Error 04937 05097 01747 01227 05999 05693 04590 04475 06107 06829 02747 01314 04146 Fitness Error 50695 10008 230509 160618 07297 32304 32736 34262 14754 11334 150169 71130 108056 Classification Error Measure Direction 06330 08532 06055 06422 07523 07431 06422 06055 07248 06881 05963 05596 05229 M Direction 01901 05861 03245 05216 00556 05211 04792 02315 02890 00415 00659 04142 02421 TDDP 10963 03143 64969 30278 01067 11203 08245 11080 04369 03822 43435 21328 30088
Forecasting Hedge Fund Index Returns
-25- Dash amp Kajiji
Figure 6 Actual and Predicted Using the StatSoft ANN on Dedicated Short Bias Fund
Dedicated Short Bias Fund Actual and Predicted
Actual Predicted
1081061041021009896949290888684828078767472706866646260585654525048464442403836343230282624222018161412108642
26
25
24
23
22
21
20
19
18
17
16
15
14
13
12
11
10
9
8
7
6
5
4
3
2
1
0
-1
-2
-3
-4
-5
-6
-7
-8
-9
Figure 7 Actual and Predicted Using the StatSoft ANN on Equity Market Neutral Fund
Emerging Markets Neutral FundActual and Predicted
Actual Predicted
1081061041021009896949290888684828078767472706866646260585654525048464442403836343230282624222018161412108642
3
2
1
0
-1
-2
Forecasting Hedge Fund Index Returns
-26- Dash amp Kajiji
54 Efficient Model Selection
A comparative analysis of the three RBF algorithms points to the role of CV and
distributional symmetry (skewness and kurtosis) as factors that can measurably impact modeling
accuracy Table 8 provides a concentrated view of these three statistical properties by algorithm
If we look at how these three factors influence the models with the lowest fitness MSE it
becomes apparent that the SPSS and StatSoft models choose the indices with the thirteenth
ranked CV and kurtosis (also the lowest) These indices are the tenth ranked by the skewness
measure That is these two algorithms perform well when asymmetry issues are smallest On
the other hand the Kajiji-4 algorithm performed at its best when relative dispersion was at or
near its highest Although the Kajiji-4 algorithm was able to model observed variables with
moderate levels of skewness and kurtosis it too performed best when asymmetry are decreasing
As noted above the highest MSE produced by the Kajiji-4 method was significantly
smaller than the highest produced by either of the other two algorithms Hence it is interesting
to observe that under the Kajiji-4 algorithm the highest MSE occurred for an index that had the
highest skewness and kurtosis measures Under SPSS and StatSoft the highest MSE was
associated with an index that had significantly less distributional asymmetry
Table 8 Relative Dispersion Comparison
Kajiji-4 SPSS StatSoft Lowest Validation MSE
Dedicated Short Bias [179] and Global Macro [51310]
Equity Market Neutral [131013]
Equity Market Neutral [131013]
Highest Validation MSE
Event Driven [911]
Dedicated Short Bias [179]
Dedicated Short Bias [179]
Rankings for CV Skewness Kurtosis are in parentheses
Forecasting Hedge Fund Index Returns
-27- Dash amp Kajiji
55 Directional Efficiency
Table 9 provides a comparison of directional forecasting accuracy Results are reported
by algorithmic method in order to show which forecast produced the minimum and maximum for
each directional error measure We note that the results generated by application of the Kajiji-4
method are at the theoretical maximum of 0988 and constant across all tested models Only the
value changes for the Kajiji-4 results under the modified direction measure (all 10) Tables 10
and 11 present an augmented comparative analysis of the results achieved by the application of
the SPSS and StatSoft algorithms These tables rank the performance based on the direction
measure What is most obvious is the lack of a ranking consistency Except for a weak
argument to the benefit of the Managed Funds index there is no overlap in the rankings achieved
across the remaining two algorithms Despite this lack of consistency it does appear that the
StatSoft algorithm maintains an efficiency edge over the SPSS algorithm in directional accuracy
Table 9 Summary of Direction and Modified Direction
Kajiji-4 SPSS StatSoft Min Direction ALL (0988) Dedicated Short Bias
(0440367) Managed Funds (0522936)
Max Direction ALL (0988) Global Macro (0678899)
Convertible Arbitrage (0853211)
Min Modified Direction
ALL (1000000) Managed Funds (-0013723)
Fixed Income Arbitrage (0041528)
Max Modified Direction
ALL (1000000) Distressed (0525463)
Convertible Arbitrage (0586124)
Computed values in parentheses
Forecasting Hedge Fund Index Returns
-28- Dash amp Kajiji
Table 10 Rankings of the SPSS Direction Modified Direction
Direction M Direction Rank Direction
Rank M Direction
Global Macro 0678899
0449631
1 3
Convertible Arbitrage 0669725
0308014
2 6
Fixed Income Arbitrage 0651376
0486157
3 2 Risk Arbitrage 0605505
0273533
4 10 ED Multi-Strategy 059633
0364352
5 4 Equity Market Neutral 0577982
0327091
6 7 Dis-tressed 0568807
0525463
7 1 Event Driven 0559633
0291165
8 9 Managed Funds 0541284
-0013723
9 13 Long Short 0522936
0311213
10 8 Emerging Markets 0513761
0210284
11 11 SFB Tremont Hedge Fund
0504587
034246
12 5 Dedicated Short Bias 0440367
0152098
13 12
Table 11 Rankings of the StatSoft Direction Modified Direction Direction Modified Direction
Rank Direction
Rank M Direction
Convertible Arbitrage 085321
058612
1 1 Equity Market Neutral 075229
005556
2 12 Event Driven 074312
052108
3 3 Risk Arbitrage 072477
028904
4 7 Fixed Income Arbitrage 068807
004153
5 13 Distressed 06422
047917
6 4 Emerging Markets 06422
052163
7 2 CSFB Tremont Hedge Fund
063303
019008
8 10 Dedicated Short Bias 060551
032448
9 6 ED Multi-Strategy 060551
023148
10 9 Global Macro 059633
006593
11 11 Long Short 055963
041419
12 5 Managed Funds 052294
024208
13 8
Forecasting Hedge Fund Index Returns
-29- Dash amp Kajiji
56 Directional Profit Efficiency
The TDDP measure is a correction weight that is designed to compensate for incorrect
directional forecasts by overall magnitude of the movement The weight is applied to future
forecasts generated by the forecasting model The smaller the weight the more accurate the
training phase of the model By definition large weights are indicative of a missed direction an
incorrect magnitude adjustment or some combination of the two Table 12 presents the TDDP
measures for the three RBF ANN under study here
The TDDP also provides a new layer of support for the efficiency of the Kajiji-4
algorithm In profit induced scenarios where it is important to predict the correct turning point of
a time series as well as the magnitude by which the time series is expected to move the Kajiji-4
algorithm requires the least weighted adjustment An improvement ratio is presented in the last
two columns of table 12 This is simply the TDDP of the selected method divided by the TDDP
produced by solution of the Kajiji-4 method Of the seven funds that exhibited asymmetrical
return distributions only one (Emerging Markets) had an improvement ratio over 60 This
observation confirms that the while the Kajiji-4 method is more efficient when predicting returns
associated with asymmetrical and leptokurtic distributions the gains are not as great when the
distributions exhibit fat-tails and skewness
Forecasting Hedge Fund Index Returns
-30- Dash amp Kajiji
Table 12 TDDP Measures with Asymmetrical Identification Kajiji-4 SPSS
StatSoft SPSSKajiji-4
StatSoftKajiji-4
Asymmetrical
Convertible Arbitrage 0005208222
03143
1581 604 A
Equity Market Neutral 0000102697
01067
2697 1067
Event Driven 0071808478
11203
118 156 A
Risk Arbitrage 0022904540
04369
199 191 A Fixed Income Arbitrage 0030801597
03822
52 124 A Distressed 0137406223
08245
45 60 A Emerging Markets 0011453780
30278
4718 2656 A CSFB Tremont Hedge Fund
0005416879
10963
3126 2030
Dedicated Short Bias 0141878533
64969
554 458 ED Multi-Strategy 0036110244
11080
284 307 A Global Macro 0000117682
43435
17682 43425 Long Short 0008734983
21328
4021 2451 Managed Futures 0080235241
30088
439 375
57 Post Model Return Residuals
In this section we apply a PCA with Varimax rotation to the post model residual returns
The appointed task of the PCA analysis is to uncover latent common variation In the absence of
any measurable levels of common variation the PCA analysis will return one significant factor (a
factor with an eigenvalue of at least 10) Specifically we subject E to the PCA procedure
where 1( )kE HFI f S S
The results of this application are presented in table 13 As with the earlier factor
analytic presentation we replace factor loadings below the absolute value of 040 with a period
Additionally only those factors with eigenvalues of 10 or higher are retained for display
purposes Two factors are reported in the table Factor 2 is differentiated from factor 1 by the
asymmetry characteristics of the hedge fund indices For the skewness dimension only the
Emerging Markets index has a negative skewness above -30 Similarly for the kurtosis
dimension (with the same exception for the Emerging Markets index) each index that loads on
factor 2 has a kurtosis measure that exceeds 140 The factor analytic results provide additional
support for the MSE directional analysis that produced observed differences in model efficiency
based on the existence of asymmetry in the observed hedge fund returns
Forecasting Hedge Fund Index Returns
-31- Dash amp Kajiji
Table 13 Varimax Solution of After Model Residuals
Fund Name Factor 1 Factor 2 Row Global Macro 09625 9673 Managed Funds 09509 9438 SFTTremont Hedge Fund 09197 8871 Distressed 08138 6795 Dedicated Short Bias 08037 6797 Equity Market Neutral -07893 6369 LongShort -07252 5355 Risk Arbitrage -06540 4539 Fixed Income Arbitrage -05113 -05972 6181 Emerging Markets 07347 6848 Event Driven -09171 9340 ED Multi-Strategy 08562 7847 Convertible Arbitrage 06195 3870 Eigenvalue 61157 30765 Percent of Variance Explained 4704 7071
6 Summary and Conclusions
The results reported by the comparative algorithmic experiment presented in this paper
add support and clarity to the earlier findings presented by Leung and Amenc et al (2002)
This paper provides clear evidence that RBF ANN algorithmic topology is capable of consistent
and accurate modeling of hedge fund index returns Importantly for the task of modeling
financial volatility we show that it is not just a matter of finding a better algorithm but we show
that it is equally important to focus on the efficiency of the economic model specification as
well To this end the research established a role for developing efficient predictor variables
under the monthly time-scale The reduction of predictor variables to independent factor score
dimensions proved to be capable of producing a reduced set of predictor variables that
effectively mimic a large percentage of the population variance except for that part attributed to
return skewness and kurtosis Effective economic modeling required controlling for these two
dimensions not treated by the application of factor-analytic methods Consequently our findings
both support and contradict the findings of Leung et al (2000) Unlike Leung who reported
Forecasting Hedge Fund Index Returns
-32- Dash amp Kajiji
success for classification modeling only we have been able to produce accurate results for both
the classification and the return level prediction of hedge fund index returns
The research investigation also found the Kajiji-4 RBF ANN to be the dominant method
among the alternative RBF algorithms that were subjected to the modeling and prediction
experiment The Kajij-4 method has proven robust in modeling and prediction of hourly and
daily high-frequency financial time-series involving hundreds to thousands of observations This
research adds to the documented effectiveness of the Kajiji-4 RBF ANN when applied to highly
nonlinear and extremely volatile financial data at nearly any frequency interval When the need
arises to model and predict high- or low-frequency financial volatility the Kajiji-4 RBF ANN is
a worthy contender for algorithmic consideration
Forecasting Hedge Fund Index Returns
-33- Dash amp Kajiji
REFERENCES
_______ 2001 SPSS Version 100 SPSS Inc Chicago IL
_______ 2001 STATISTICA Statsoft Inc Tulsa OK
Amenc N Bied S E amp Martellini L 2002 Evidence of Predictability in Hedge Fund Returns and Multi-Style Multi-Class Tactical Style Allocation Decisions Marshall School of Business Working Paper No 02-5
Balci O 2001 A Methodology for Certification of Modeling and Simulation Applications ACM Transactions on Programming Languages and Systems vol 11 no 4 pp 352-377
Barber B Lehavy R McNichols M amp Trueman B 2001 Can Investors Profit from the Prophets Security Analyst Recommendations and Stock Returns The Journal of Finance vol 56 no 2 pp 531-563
Barberis N 2000 Investing for the Long Run when Returns are Predictable Journal of Finance vol 55 pp 225-264
Bollerslev T 1986 Generalized Autoregressive Conditional Heteroskedasticity Journal of Econometrics vol 31 pp 307-327
Brown S J Goetzmann W N amp Park J 2001 Careers and Survival Competition and Risk in the Hedge Fund and CTA Industry The Journal of Finance vol 56 no 5 pp 1869-1886
Castiglione F amp Bernaschi M 2001 Market Fluctuations Simulation and Forecasting Available [httpwwwzpruni-koelnde~filippoWEB_IACeconophysicseconophysicshtml] (Jan 31 2003)
Chib S Nardari F amp Shephard N 2001 Analysis of High Dimensional Multivariate Stochastic Volatility Models Washington University St Louis Working Paper
Crouse R H Jin C amp Hanumara R C 1995 Unbiased Ridge Estimation with Prior Information and Ridge Trace Communication in Statistics vol 24 no 9 pp 2341-2354
Dash G amp Kajiji N 2002 Modeling FX Volatility A Comparative Analysis of the RBF Neural Network Topology in 9th International Conference on Forecasting Financial Markets London England
Dash G H Hanumara C amp Kajiji N 2003 Neural Network Architectures for Modeling FX Futures Options Volatility in Annual Meetings of the Northeast Decision Sciences Institute Providence Rhode Island
Debray S Evans W Muth R amp de Sutter B 2000 Compiler Techniques for Code
Forecasting Hedge Fund Index Returns
-34- Dash amp Kajiji
Compaction ACM Transactions on Programming Languages and Systems vol 22 no 2 pp 378-415
Dyba T 2000 An Instrument for Measuring the Key Factors of Success in Software Process Improvement Emiprical Software Engineering vol 5 no 4 pp 357-390
Fama E amp French K 1989 Business Conditions and Expected Returns on Stocks and Bonds Journal of Financial Economics vol 25 pp 23-49
Ferson W amp Harvey C 1991 Sources of Predictability in Portfolio Returns Financial Analysts Journal vol May June pp 49-56
Fraser C W amp Wendt A L 1986 Integrating Code Generation and Optimization SIGPLAN Notices vol 21 no 7 pp 242-248
Fung W amp Hsieh D 1999 Is Mean-Variance Analysis Applicable to Hedge Funds Economic Letters vol 62 pp 53-58
Han Y 2002 The Economic Value of Volatility Modeling Assest Allocation with a High Dimensional Dynamic Latent Factor Multivariate Stochastic Volatility Model Washington University StLouis MO Working Paper
Hanson D B 1983 Simple Code Optimization Software-Practice and Experience vol 13 no 8 pp 745-763
Harasty H amp Roulet J 2000 Modeling Stock Market Returns -- An Error Correction Model Journal of Portfolio Management vol Winter pp 33-46
Harvey C R Travers K E amp Costa M J 2002 Forecasting Emerging Market Returns Using Neural Networks Emerging Markets Quarterly vol Summer pp 1-12
Hemmerle W J 1975 An Explicit Solution for Generalized Ridge Regression Technometrics vol 17 no 3 pp 309-314
Hoerl A E amp Kennard R W 1970 Ridge Regression Biased Estimation for Nonorthogonal Problems Technometrics vol 12 no 3 pp 55-67
Kajiji N 2001 Adaptation of Alternative Closed Form Regularization Parameters with Prior Information to the Radial Basis Function Neural Network for High Frequency Financial Time Series Neural Networks statistics and time series University of Rhode Island
Kat amp Lu 2002 An Excursion into the Statistical Properties of the Hedge Fund Returns Alternative Investment Research Center London UK Working Paper
Keim D amp Stambaugh R 1986 Predicting Returns in the Stock and Bond Markets Journal of Financial Economics vol 17 pp 357-424
Forecasting Hedge Fund Index Returns
-35- Dash amp Kajiji
Leung M Daouk H amp Chen A 2000 Forecasting Stock Indices A Comparison of
Classification and Level Estimation Models International Journal of Forecasting vol 16 pp 173-190
Lhabitant F-S amp Learned M July 2002 Hedge Fund Diversification How Much is Enough FAME International Center for Financial Asset Management and Engineering Geneva Switzerland Research Paper No 52
Lindvall M Tesoriero R amp Costa P 2003 An Empirically-Based Process for Software Architecture Evaluation Emiprical Software Engineering vol 8 no 1 pp 83-108
Lynch A 2000 Portfolio Choice and Equity Characteristics Characterizing the Hedging Demands Induced by Return Predictability New York University New York NY Working Paper
Mayrand J Patenaude J-F Merlo E Dagenais M amp Lague B 2000 Software Assessment Using Metrics A Comparison Across Large C++ and Java Systems Annals of Software Engineering vol 9 no 1-4 pp 117-141
Merton R 1981 On Market Timing and Investment Performance An Equilibrium Theory of Value for Market Forecasts Journal of Business vol 54 no 3 pp 363-406
Orr M J L 1996 Introduction to Radial Basis Function Networks Center for Cognitive Science Scotland UK
Orr M J L 1997 MATLAB Routines for Subset Selection and Ridge Regression in Linear Neural Networks Center for Cognitive Science Scotland UK
Sheldon F T amp Greiner S 1999 Composing Analyzing and Validating Software Models to Assess the Performability of Competing Design Candidates Annals of Software Engineering vol 8 no 1-4 pp 289-311
Thomson G H 1951 The Factorial Analysis of Human Ability University of London Press London
Tikhonov A and Arsenin V 1977 Solutions of Ill-Posed Problems Wiley New York
Yao J amp Tan C L Access Year 2003 A Study on Training Criteria for Financial Time Series Forecasting JTYaomasseyacnz Palmerston North New Zealand

Forecasting Hedge Fund Index Returns
-10- Dash amp Kajiji
233 Latent Factor Descriptions
The latent factor dimensions are subjectively classified and presented in table 4
Table 4 Latent Factor Classification Factor
Domain Characteristic
F1 Yields on Equity and Risky Bonds with Currency and Futures Effects F2 Default and Term Spread with Inverse 3-Tbill Effect F3 Continuously compounded returns on domestic and world Equity markets with
inverse effects of VIX F4 Oil F5 Continuously compounded returns on high yield bonds with lagged equity
returns and inverse VIX F6 First Differenced 20-year Tbond and 3-Tbill with inverse on differenced
currency effect F7 Effect of CPI and change in domestic market volume F8 Change in industrial production
234 Factor Scores
Based on the extracted factors we compute factor scores of each subject as a means of reducing
the predictor variables down to six latent variables that correspond to the rotated domains We
follow the method of Thomson (1951) If fr is the score of the rth factor corresponding to a
response of x then we estimate fr by a linear combination of the xi
r rf a x We choose ar such that 2
r rE f f is minimized In vector notation
1 kf f f and the solution is estimated by
F x (1)
where is the factor loading matrix the covariance matrix and x the original data matrix
From each set of responses x we obtain the vector of factor scores f
Forecasting Hedge Fund Index Returns
-11- Dash amp Kajiji
3 The Kajiji-4 Benchmark Radial Basis Function
In this section we present the methodology supporting the use of the Kajiji-4 RBF as the
control neural network against which the alternate neural network topologies are tested Within
the radial basis function class of neural networks we explicitly consider the RBF algorithms
produced by StatSoft (2001) and SPSS (2001)2
The optimal weighting values used within the RBF network are generally extracted by
applying a supervised least-squares method to a subset of the data series (the training set) The
supervised learning function is stated as
( )y f x
(2)
where y the output vector is a function of x the input vector with n number of inputs
Alternatively the supervised learning function can be restated as the following linear model
1
( ) ( )m
j jij
f x xw h (3)
where m is the number of basis functions (centers) h is the hidden units w is the weight vectors
and i = 1k output vectors (target variables) The flexibility of f(x) and its ability to model many
different functions is inherited from the freedom to choose different values for the weights Then
applying the least-squares principle is similar to minimizing the sum of squared errors as
represented by
2
1
( )p
i ii
SSE y f x
(4)
Kajiji (2001) presents the RBF mapping function as a modified Tikhonov regularization
equation (1977) Tikhonov regularization adds a weight decay parameter to the error function to
2 Dash and Kajiji (2002) report seriously inconsistent performance characteristics for the Matlab RBF ANN In addition to excessively long computation times vis-agrave-vis alternative RBF implementations the Matlab RBF method was also prone to numerical under- and over-flow conditions that failed the program These reasons forces us to defer including Matlab in this test of numerical efficiency
Forecasting Hedge Fund Index Returns
-12- Dash amp Kajiji
penalize mappings that are not smooth If a weight penalty term is added to the SSE the SSE
can be restated as the following cost function
2 2
1 1
( )p m
i i j ji j
C y f x k w
(5)
where kj are regularization parameters or weight decay parameters Under this specification the
function to minimize is
2 2
1 1
argmin( ( | ))
p m
i i j ji j
y f x k k wk
(6)
Iterative techniques are commonly employed to compute the weight decay parameter k
or a vector of parameters k But since the introduction of weight decay methods by Hoerl and
Kennard (1970) and Hemmerle (1975) it is generally understood that iterative techniques are
computationally burdensome and lack specificity [see Orr (1996 1997)] Further
computational experience has established that iteration often leads to local minima or in the case
where the weight decay approaches infinity inflated residual sums of squares By contrast the
Kajiji RBF algorithm is a Bayesian regularization algorithm that derives a globally optimized
regularization parameter based on a cross-population of recent extensions in optimal ridge
regression parameter estimation by Crouse (1995) The Kajiji algorithm directly attacks the twin
evils that deter efficient ANN modeling the curse of dimensionality (over-parameterization)
and inflated residual sum of squares (inefficient weight decay)
4 The Modeling Process
Let rt = (rit rpt) represent a vector of p returns observed at time t t = 1 n Let Ft =
(F1t Fkt) specify k latent factors with which there are corresponding maximum validity factor
scores denoted by St for k latent factors The following economic model is formulated for each
of the m CSFBT indexes where m = 1 M for the 13 published indexes
HFIm = (S1 Sk) (7)
Forecasting Hedge Fund Index Returns
-13- Dash amp Kajiji
HFIm is the individual hedge fund that is subjected to the model comprised of the Sk factor
scores
41 Measurement Errors in Return Level Prediction
Comparative evaluation relies upon the computed residuals for the training out-of-
sample validation and fitness (entire sample) data subsets Specifically model errors are
computed as
2
1
t
training i ii
MSE y y t
(8)
2
1
v
validation i ii
MSE y y v
(9)
2
1
T
fitness i ii
MSE y y T
(10)
where MSEtraining is local to the training sub-set (Tt) and the MSEvalidation measure captures the
out-of-sample error component (Tt+1Tv) The MSEfitness measure is computed over all (T)
observations For purposes of this paper all algorithmic comparisons rely solely on the direct
evaluation of the computed MSEfitness
42 Measurement Errors - Classification Prediction
Neural network classification topology generally relies upon an output function of
probabilities to assign group membership Leung preferred this approach However for return
classification it is possible to use a direction measure to test the number of times a prediction
neural network predicts the direction of the predicted return movement correctly In this study in
order to minimize the chance of introducing new specification errors by from the use of
alternative neural network architecture we implement measurement errors that take into account
the simultaneous behavior of trend and magnitude within the trend
Forecasting Hedge Fund Index Returns
-14- Dash amp Kajiji
421 Direction Measure
Direction is defined as the number of times the prediction followed the up and down
movement of the underlying index The initial calculations were presented by Harvey et al
(2002) and later modified Castiglione (2001) as shown below
1 1 1 11
11i i i i
i T
HS P G HS P GT
(11)
where
Pi+1 = Indexi+1 Indexi is the percentage return on the index at time step i+1 T
Gi+1 = the forecast percentage return on the index at time step i+1 T
T = the number of days in the validation period
HS = a modified Heavyside function where HS(x)=1 for xgt0 and 0 otherwise
422 Modified Direction Measure
A more robust method of direction was presented by Merton (1981) and named modified
direction
Modified Direction = (( of correct up predictions of times index up) +
( of correct down predictions times index down)) 1 (12)
423 Time Dependent Directional Profit
The two direction measures each provide a summary of how well the predicted time-
series and the actual time-series move together at any given point in time We introduce the Yao
(Access Year 2003) time dependent directional profit measurement error (TDDP) as a means by
which to capture the simultaneous effects of time and profit in the forecast simulation Under
this method incorrectly predicted directional moves are penalized more heavily than are correct
predictions The weights are then adjusted based on the amount of change from one forecast
point to the next In essence a large adjustment to the weights is made given a wrong directional
Forecasting Hedge Fund Index Returns
-15- Dash amp Kajiji
forecast which is accompanied by a large change in the underlying values Conversely a small
adjustment to the weights is signaled by a correct directional forecast for a correspondingly large
change in the underlying The TDDP error measure is defined as
2
1
1( )( )
2
N
TDP TDP p ppE f p t o
N
(13)
where ( ) ( )TDP DPf f p w p and the vectors t and o capture the target-prediction and observed
values over the p prediction periods Changes in the underlying and direction as described above
are determined by 1(| | ( ))DP p p p pf F t t sign t o At prediction point p the directional
profit adjustment factor is determined according to
1
2
3
4
0 | |
0 | |( )
0 | |
0 | |
p p p
p p p
DPp p p
p p p
a if t o and t
a if t o and tf p
a if t o and t
a if t o and t
(14)
where is the standard deviation of the target variable over all N observations (training and
validations observations) Simulation results for the monthly time scale lead us to the following
parameter values 1 05a 2 08a 3 12a and 4 15a We caution however that there is
insufficient evidence to recommend the extrapolation of these settings to other time scales such
as daily or higher frequencies
5 Modeling Results
In this section we present the results of applying the sample data to each one of the three
test algorithms The hardware configuration for this experiment consisted of a 2ghz Pentium-4
CPU with 512 MB of random access memory All program executions were made under the
Microsoft XP Professional operating system Algorithmic differences in solution execution
times were measurable but small Solutions times ranged from about 4 seconds (Kajiji-4) to just
under 10 seconds (SPSS) While this difference is negligible for the relatively small monthly
dataset used in this study it is an issue that may require renewed attention under tests involving
Forecasting Hedge Fund Index Returns
-16- Dash amp Kajiji
large-scale datasets consisting of thousands of high frequency observations Despite the similar
model solving times other similarities and substantial differences arise when comparing the
relative modeling efficiency of the three RBF ANNs Specific modeling results for the Kajiji-4
method are presented next This is followed by the presentation of results for the solutions
generated by SPSS and StatSoft algorithms respectively
51 Kajiji-4
The analysis of algorithmic efficiency begins with a review of the MSE validation
measures are presented in table 5 The validation error is just over 1 percent for the Dedicated
Short Bias index and is even smaller (just under 004 percent) for the Equity Neutral hedge fund
index We note that the Global Macro index fund achieved a comparable low fitness error
measure (004 percent) As we extend the analysis to uncover overall algorithmic efficiency we
observe that the two low MSE models also have correspondingly low skewness and kurtosis
measures This finding suggests that model efficiency improves as the effects of skewness and
kurtosis diminish When the third- and fourth-moment characteristics are considered the
algorithmic results reported for the Equity Market Neutral index appear interestingly efficient
At the other end of the modeling spectrum is the model applied to the Event Driven index This
model produced a fitness MSE (67 percent) that was almost 150 times larger than that reported
for the two low error models This result yields an interesting insight into the algorithmic
performance when applied to monthly hedge fund returns We note that the Event Driven index
has the highest absolute skewness coefficient (-3272) and the highest kurtosis measure (20153)
These results add to our earlier observations about the importance of understanding the role of
distributional symmetry in hedge fund returns In the former case low values for skewness and
kurtosis were associated with low fitness MSE results In this latter case relatively high
skewness and kurtosis measures are associated with deterioration in modeling accuracy as
measured by the fitness MSE The reported modeling efficiency is buttressed by the cross-plot
of the observed and target observations Figures 2 and 3 provide a visual validation that the
error deviation within the validation set is small for the two indices of interest
Forecasting Hedge Fund Index Returns
-17- Dash amp Kajiji
Next we assess the ability of the Kajiji-4 algorithm to correctly predict the directional
change of hedge fund returns Both the direction and modified direction measures report
identical results across all model applications The direction measure solves at 0988 and the
modified direction measure is constant at its maximum value of 10 The modified direction
measurement of 10 does not necessarily imply that the prediction is perfect A more
conservative interpretation of the result allows us to conclude that the target variable correctly
attempts to model the peaks and troughs found in the observed dataset Take together these two
measures provide strong evidence that the Kajiji-4 algorithm when applied to monthly return
data for alternative assets can achieve near perfect results in forecasting directional changes in
the returns data
The strong performance of the directional measures does not address the profit incentive
held by investors The profit-enhanced TDDP measure presents a very clear picture of modeling
efficiency
Forecasting Hedge Fund Index Returns
-18- Dash amp Kajiji
Table 5 Kajiji-4 Model Results
SFB Tremont Hedge Fund
Convertible Arbitrage
Dedicated Short Bias
Emerging Markets
Equity Market Neutral
Event Driven
Distressed ED Multi-Strategy
Risk Arbitrage
Fixed Income Arbitrage
Global Macro
Long Short
Managed Funds
Lambda 1051 1129 1165 1912 46713 0238 0195 0469 0792 0154 9764 1530 1982 Return-level Error Measures Training Error 1271 1107 1019 1248 1189 1136 1079 1186 1040 1165 1295 1212 0853 Validation Error 0143 0531 0757 0227 0400 0191 0219 0207 0508 0132 0111 0309 1095 Fitness Error 0022 0021 0401 0046 0000 0221 0425 0111 0065 0098 0000 0035 0233 Classification Error Measure Direction 0988 0988 0988 0988 0988 0988 0988 0988 0988 0988 0988 0988 0988 M Direction 1000 1000 1000 1000 1000 1000 1000 1000 1000 1000 1000 1000 1000 TDDP 00054 00052 01418 00114 00001 00718 01374 00361 00229 00308 00001 00087 00802
Forecasting Hedge Fund Index Returns
-19- Dash amp Kajiji
Figure 2 Actual and Predicted Using Kajiji-4 RBF on Dedicated Short Bias Fund
DED Short BiasActual and Predicted (Feb 1994 - Feb 2002)
Actual Predicted
9897969594939291908988878685848382818079787776757473727170696867666564636261605958575655545352515049484746454443424140393837363534333231302928272625242322212019181716151413121110987654321
26
25
24
23
22
21
20
19
18
17
16
15
14
13
12
11
10
9
8
7
6
5
4
3
2
1
0
-1
-2
-3
-4
-5
-6
-7
-8
-9
Figure 3 Actual and Predicted Using Kajiji-4 RBF on Equity Market Neutral Fund
Equity Market NatrlActual and Predicted (Feb 1994 - Feb 2002)
Actual Predicted
9897969594939291908988878685848382818079787776757473727170696867666564636261605958575655545352515049484746454443424140393837363534333231302928272625242322212019181716151413121110987654321
3
2
1
0
-1
Forecasting Hedge Fund Index Returns
-20- Dash amp Kajiji
52 SPSS s Neural Connection
The SPSS RBF results presented in table 6 differ markedly from those produced by the
Kajiji-4 algorithm Based on a comparison of within algorithmic MSE results the SPSS RBF
modeling experiment achieves the lowest error value when modeling the Equity Market Neutral
index This is one of the two focus indices But the SPSS reported error measure for this index
is more than 3425 times larger than that produced by the Kajiji-4 simulation For the other
focus index Dedicated Short Bias the SPSS fitness MSE is more than 1975 times higher than
that produced by the Kajiji-4 counterpart This is also the largest MSE reported by the
application of the SPSS procedure Returning to our examination of how RBF algorithms
perform under conditions of distributional asymmetry we note that except for one case (the Fixed
Income Arbitrage index) the SPSS algorithm generates a consistent performance ratio for hedge
fund indices with absolute skewness levels above 300 and kurtosis measures greater than 140
Within the subgroup defined by the Event Driven Distressed and ED Multi-Strategy indices
the reported fitness MSE measures ranged from 3172028 to 3642675 By comparison the
Kajiji-4 algorithm also performed consistently across this same subgroup but the reported MSE
measures were decidedly lower under Kajiji-4 achieving levels that ranged from 0030 to 0037
In summary the SPSS RBF algorithm demonstrated the ability to produce consistent
performance across monthly return indices with high absolute skewness and high kurtosis
measures Unfortunately asymmetry issues aside the performance of the algorithm dissipate as
the level of relative variation (CV) increases A graphical display of the two focus indexes is
provided in figures 4 and 5 respectively
Forecasting Hedge Fund Index Returns
-21- Dash amp Kajiji
Table 6 SPSS Model Results
SFB Tremont Hedge Fund
Convertible Arbitrage
Dedicated Short Bias
Emerging Markets
Equity Market Neutral
Event Driven
Distressed ED Multi-Strategy
Risk Arbitrage
Fixed Income Arbitrage
Global Macro
Long Short
Managed Funds
Return-level Error Measures Training Error 1074746 0998806 1018551 1073490 0948484 098785 0464553 091175 0860569 0522714 070402 101266 0939322 Validation Error 0279682 0827859 0868138 0503276 0544275 075957 0899311 063094 0671334 0788974 022464 033472 1210085 Fitness Error 6999264 2468697 27655226 28473214 1370447 364267 3127028 349122 1698769 0767644 1093985 1094859 12059491 Classification Error Measure Direction 05046 06697 04404 05138 05780 05596 05688 05963 06055 06514 06789 05229 05413 M Direction 03425 03080 01521 02103 03271 02917 05255 03644 02735 04862 04496 03112 -00137 TDDP 16879 08222 78533 53780 02697 08478 06223 10244 04540 01597 17682 34983 35241
Forecasting Hedge Fund Index Returns
-22- Dash amp Kajiji
Figure 4 Actual and Predicted Using SPSS RBF on the Dedicated Short Bias Fund
Dedicated Short BiasActual and Predicted
Actual Predicted
1081061041021009896949290888684828078767472706866646260585654525048464442403836343230282624222018161412108642
9
8
7
6
5
4
3
2
1
0
-1
-2
-3
-4
-5
-6
-7
-8
Figure 5 Actual and Predicted Using SPSS on Equity Market Neutral Fund
Equity Market Neutral FundActual and Predicted
Actual Predicted
1081061041021009896949290888684828078767472706866646260585654525048464442403836343230282624222018161412108642
3
2
1
0
-1
Forecasting Hedge Fund Index Returns
-23- Dash amp Kajiji
53 StatSofts Statistica
On average the results produced upon the application of the StatSoft RBF algorithm to
the modeling problem fall in between those produced by the other two RBF algorithmic
methods Before presenting the details as provided in table 7 we wish to note that the user
interface of the StatSoft algorithm differs considerably from that presented by either the Kajiji-4
or SPSS methods For the StatSoft-based experiment where possible optional parameter
settings were set to levels specified as default levels under the Kajiji-4 method We then
undertook a manual optimization process with the goal of identifying parameter settings that
would produce best (if not optimal) solution results for the sample data Stated differently while
we were able to apply default settings without modification under the Kajiji-4 and SPSS
experiments that was not possible in this case
Like the Kajiji-4 algorithm the StatSoft method reported the lowest fitness MSE for the
Equity Market Neutral index model The MSE reported by the StatSoft method is approximately
14 times larger than that achieved by application of the Kajiji-4 network For the other focus
index Dedicated Short Bias at 23051 the fitness MSE is the highest recorded across all test
models This result is more than 1600 times that achieved for the same index under the Kajiji-4
method Figure 6 and 7 provide a graphical view of the algorithms predictive ability for the
Dedicated Short Bias and Equity Neutral fund returns It is clear from this view that the target
variable achieves reasonable directional performance but falls short in its ability to replicate the
magnitude of the changes We observe that the StatSoft method performs best when modeling
monthly hedge fund returns with relatively low coefficients of variation The algorithms
predictive ability dissipates noticeably as relative variation (CV) increases How if at all this
deterioration is impacted by distributional asymmetry is not immediately clear from the results
generated by this experiment
Forecasting Hedge Fund Index Returns
-24- Dash amp Kajiji
Table 7 Staistica-4 Model Results
SFB Tremont Hedge Fund
Convertible Arbitrage
Dedicated Short Bias
Emerging Markets
Equity Market Neutral
Event Driven
Dis-tressed
ED Multi-Strategy
Risk Arbitrage
Fixed Income Arbitrage
Global Macro
Long Short
Managed Funds
Return-level Error Measures Training Error 03647 05030 01663 01280 09018 04456 03509 04142 06886 06328 01994 02182 02826 Validation Error 04937 05097 01747 01227 05999 05693 04590 04475 06107 06829 02747 01314 04146 Fitness Error 50695 10008 230509 160618 07297 32304 32736 34262 14754 11334 150169 71130 108056 Classification Error Measure Direction 06330 08532 06055 06422 07523 07431 06422 06055 07248 06881 05963 05596 05229 M Direction 01901 05861 03245 05216 00556 05211 04792 02315 02890 00415 00659 04142 02421 TDDP 10963 03143 64969 30278 01067 11203 08245 11080 04369 03822 43435 21328 30088
Forecasting Hedge Fund Index Returns
-25- Dash amp Kajiji
Figure 6 Actual and Predicted Using the StatSoft ANN on Dedicated Short Bias Fund
Dedicated Short Bias Fund Actual and Predicted
Actual Predicted
1081061041021009896949290888684828078767472706866646260585654525048464442403836343230282624222018161412108642
26
25
24
23
22
21
20
19
18
17
16
15
14
13
12
11
10
9
8
7
6
5
4
3
2
1
0
-1
-2
-3
-4
-5
-6
-7
-8
-9
Figure 7 Actual and Predicted Using the StatSoft ANN on Equity Market Neutral Fund
Emerging Markets Neutral FundActual and Predicted
Actual Predicted
1081061041021009896949290888684828078767472706866646260585654525048464442403836343230282624222018161412108642
3
2
1
0
-1
-2
Forecasting Hedge Fund Index Returns
-26- Dash amp Kajiji
54 Efficient Model Selection
A comparative analysis of the three RBF algorithms points to the role of CV and
distributional symmetry (skewness and kurtosis) as factors that can measurably impact modeling
accuracy Table 8 provides a concentrated view of these three statistical properties by algorithm
If we look at how these three factors influence the models with the lowest fitness MSE it
becomes apparent that the SPSS and StatSoft models choose the indices with the thirteenth
ranked CV and kurtosis (also the lowest) These indices are the tenth ranked by the skewness
measure That is these two algorithms perform well when asymmetry issues are smallest On
the other hand the Kajiji-4 algorithm performed at its best when relative dispersion was at or
near its highest Although the Kajiji-4 algorithm was able to model observed variables with
moderate levels of skewness and kurtosis it too performed best when asymmetry are decreasing
As noted above the highest MSE produced by the Kajiji-4 method was significantly
smaller than the highest produced by either of the other two algorithms Hence it is interesting
to observe that under the Kajiji-4 algorithm the highest MSE occurred for an index that had the
highest skewness and kurtosis measures Under SPSS and StatSoft the highest MSE was
associated with an index that had significantly less distributional asymmetry
Table 8 Relative Dispersion Comparison
Kajiji-4 SPSS StatSoft Lowest Validation MSE
Dedicated Short Bias [179] and Global Macro [51310]
Equity Market Neutral [131013]
Equity Market Neutral [131013]
Highest Validation MSE
Event Driven [911]
Dedicated Short Bias [179]
Dedicated Short Bias [179]
Rankings for CV Skewness Kurtosis are in parentheses
Forecasting Hedge Fund Index Returns
-27- Dash amp Kajiji
55 Directional Efficiency
Table 9 provides a comparison of directional forecasting accuracy Results are reported
by algorithmic method in order to show which forecast produced the minimum and maximum for
each directional error measure We note that the results generated by application of the Kajiji-4
method are at the theoretical maximum of 0988 and constant across all tested models Only the
value changes for the Kajiji-4 results under the modified direction measure (all 10) Tables 10
and 11 present an augmented comparative analysis of the results achieved by the application of
the SPSS and StatSoft algorithms These tables rank the performance based on the direction
measure What is most obvious is the lack of a ranking consistency Except for a weak
argument to the benefit of the Managed Funds index there is no overlap in the rankings achieved
across the remaining two algorithms Despite this lack of consistency it does appear that the
StatSoft algorithm maintains an efficiency edge over the SPSS algorithm in directional accuracy
Table 9 Summary of Direction and Modified Direction
Kajiji-4 SPSS StatSoft Min Direction ALL (0988) Dedicated Short Bias
(0440367) Managed Funds (0522936)
Max Direction ALL (0988) Global Macro (0678899)
Convertible Arbitrage (0853211)
Min Modified Direction
ALL (1000000) Managed Funds (-0013723)
Fixed Income Arbitrage (0041528)
Max Modified Direction
ALL (1000000) Distressed (0525463)
Convertible Arbitrage (0586124)
Computed values in parentheses
Forecasting Hedge Fund Index Returns
-28- Dash amp Kajiji
Table 10 Rankings of the SPSS Direction Modified Direction
Direction M Direction Rank Direction
Rank M Direction
Global Macro 0678899
0449631
1 3
Convertible Arbitrage 0669725
0308014
2 6
Fixed Income Arbitrage 0651376
0486157
3 2 Risk Arbitrage 0605505
0273533
4 10 ED Multi-Strategy 059633
0364352
5 4 Equity Market Neutral 0577982
0327091
6 7 Dis-tressed 0568807
0525463
7 1 Event Driven 0559633
0291165
8 9 Managed Funds 0541284
-0013723
9 13 Long Short 0522936
0311213
10 8 Emerging Markets 0513761
0210284
11 11 SFB Tremont Hedge Fund
0504587
034246
12 5 Dedicated Short Bias 0440367
0152098
13 12
Table 11 Rankings of the StatSoft Direction Modified Direction Direction Modified Direction
Rank Direction
Rank M Direction
Convertible Arbitrage 085321
058612
1 1 Equity Market Neutral 075229
005556
2 12 Event Driven 074312
052108
3 3 Risk Arbitrage 072477
028904
4 7 Fixed Income Arbitrage 068807
004153
5 13 Distressed 06422
047917
6 4 Emerging Markets 06422
052163
7 2 CSFB Tremont Hedge Fund
063303
019008
8 10 Dedicated Short Bias 060551
032448
9 6 ED Multi-Strategy 060551
023148
10 9 Global Macro 059633
006593
11 11 Long Short 055963
041419
12 5 Managed Funds 052294
024208
13 8
Forecasting Hedge Fund Index Returns
-29- Dash amp Kajiji
56 Directional Profit Efficiency
The TDDP measure is a correction weight that is designed to compensate for incorrect
directional forecasts by overall magnitude of the movement The weight is applied to future
forecasts generated by the forecasting model The smaller the weight the more accurate the
training phase of the model By definition large weights are indicative of a missed direction an
incorrect magnitude adjustment or some combination of the two Table 12 presents the TDDP
measures for the three RBF ANN under study here
The TDDP also provides a new layer of support for the efficiency of the Kajiji-4
algorithm In profit induced scenarios where it is important to predict the correct turning point of
a time series as well as the magnitude by which the time series is expected to move the Kajiji-4
algorithm requires the least weighted adjustment An improvement ratio is presented in the last
two columns of table 12 This is simply the TDDP of the selected method divided by the TDDP
produced by solution of the Kajiji-4 method Of the seven funds that exhibited asymmetrical
return distributions only one (Emerging Markets) had an improvement ratio over 60 This
observation confirms that the while the Kajiji-4 method is more efficient when predicting returns
associated with asymmetrical and leptokurtic distributions the gains are not as great when the
distributions exhibit fat-tails and skewness
Forecasting Hedge Fund Index Returns
-30- Dash amp Kajiji
Table 12 TDDP Measures with Asymmetrical Identification Kajiji-4 SPSS
StatSoft SPSSKajiji-4
StatSoftKajiji-4
Asymmetrical
Convertible Arbitrage 0005208222
03143
1581 604 A
Equity Market Neutral 0000102697
01067
2697 1067
Event Driven 0071808478
11203
118 156 A
Risk Arbitrage 0022904540
04369
199 191 A Fixed Income Arbitrage 0030801597
03822
52 124 A Distressed 0137406223
08245
45 60 A Emerging Markets 0011453780
30278
4718 2656 A CSFB Tremont Hedge Fund
0005416879
10963
3126 2030
Dedicated Short Bias 0141878533
64969
554 458 ED Multi-Strategy 0036110244
11080
284 307 A Global Macro 0000117682
43435
17682 43425 Long Short 0008734983
21328
4021 2451 Managed Futures 0080235241
30088
439 375
57 Post Model Return Residuals
In this section we apply a PCA with Varimax rotation to the post model residual returns
The appointed task of the PCA analysis is to uncover latent common variation In the absence of
any measurable levels of common variation the PCA analysis will return one significant factor (a
factor with an eigenvalue of at least 10) Specifically we subject E to the PCA procedure
where 1( )kE HFI f S S
The results of this application are presented in table 13 As with the earlier factor
analytic presentation we replace factor loadings below the absolute value of 040 with a period
Additionally only those factors with eigenvalues of 10 or higher are retained for display
purposes Two factors are reported in the table Factor 2 is differentiated from factor 1 by the
asymmetry characteristics of the hedge fund indices For the skewness dimension only the
Emerging Markets index has a negative skewness above -30 Similarly for the kurtosis
dimension (with the same exception for the Emerging Markets index) each index that loads on
factor 2 has a kurtosis measure that exceeds 140 The factor analytic results provide additional
support for the MSE directional analysis that produced observed differences in model efficiency
based on the existence of asymmetry in the observed hedge fund returns
Forecasting Hedge Fund Index Returns
-31- Dash amp Kajiji
Table 13 Varimax Solution of After Model Residuals
Fund Name Factor 1 Factor 2 Row Global Macro 09625 9673 Managed Funds 09509 9438 SFTTremont Hedge Fund 09197 8871 Distressed 08138 6795 Dedicated Short Bias 08037 6797 Equity Market Neutral -07893 6369 LongShort -07252 5355 Risk Arbitrage -06540 4539 Fixed Income Arbitrage -05113 -05972 6181 Emerging Markets 07347 6848 Event Driven -09171 9340 ED Multi-Strategy 08562 7847 Convertible Arbitrage 06195 3870 Eigenvalue 61157 30765 Percent of Variance Explained 4704 7071
6 Summary and Conclusions
The results reported by the comparative algorithmic experiment presented in this paper
add support and clarity to the earlier findings presented by Leung and Amenc et al (2002)
This paper provides clear evidence that RBF ANN algorithmic topology is capable of consistent
and accurate modeling of hedge fund index returns Importantly for the task of modeling
financial volatility we show that it is not just a matter of finding a better algorithm but we show
that it is equally important to focus on the efficiency of the economic model specification as
well To this end the research established a role for developing efficient predictor variables
under the monthly time-scale The reduction of predictor variables to independent factor score
dimensions proved to be capable of producing a reduced set of predictor variables that
effectively mimic a large percentage of the population variance except for that part attributed to
return skewness and kurtosis Effective economic modeling required controlling for these two
dimensions not treated by the application of factor-analytic methods Consequently our findings
both support and contradict the findings of Leung et al (2000) Unlike Leung who reported
Forecasting Hedge Fund Index Returns
-32- Dash amp Kajiji
success for classification modeling only we have been able to produce accurate results for both
the classification and the return level prediction of hedge fund index returns
The research investigation also found the Kajiji-4 RBF ANN to be the dominant method
among the alternative RBF algorithms that were subjected to the modeling and prediction
experiment The Kajij-4 method has proven robust in modeling and prediction of hourly and
daily high-frequency financial time-series involving hundreds to thousands of observations This
research adds to the documented effectiveness of the Kajiji-4 RBF ANN when applied to highly
nonlinear and extremely volatile financial data at nearly any frequency interval When the need
arises to model and predict high- or low-frequency financial volatility the Kajiji-4 RBF ANN is
a worthy contender for algorithmic consideration
Forecasting Hedge Fund Index Returns
-33- Dash amp Kajiji
REFERENCES
_______ 2001 SPSS Version 100 SPSS Inc Chicago IL
_______ 2001 STATISTICA Statsoft Inc Tulsa OK
Amenc N Bied S E amp Martellini L 2002 Evidence of Predictability in Hedge Fund Returns and Multi-Style Multi-Class Tactical Style Allocation Decisions Marshall School of Business Working Paper No 02-5
Balci O 2001 A Methodology for Certification of Modeling and Simulation Applications ACM Transactions on Programming Languages and Systems vol 11 no 4 pp 352-377
Barber B Lehavy R McNichols M amp Trueman B 2001 Can Investors Profit from the Prophets Security Analyst Recommendations and Stock Returns The Journal of Finance vol 56 no 2 pp 531-563
Barberis N 2000 Investing for the Long Run when Returns are Predictable Journal of Finance vol 55 pp 225-264
Bollerslev T 1986 Generalized Autoregressive Conditional Heteroskedasticity Journal of Econometrics vol 31 pp 307-327
Brown S J Goetzmann W N amp Park J 2001 Careers and Survival Competition and Risk in the Hedge Fund and CTA Industry The Journal of Finance vol 56 no 5 pp 1869-1886
Castiglione F amp Bernaschi M 2001 Market Fluctuations Simulation and Forecasting Available [httpwwwzpruni-koelnde~filippoWEB_IACeconophysicseconophysicshtml] (Jan 31 2003)
Chib S Nardari F amp Shephard N 2001 Analysis of High Dimensional Multivariate Stochastic Volatility Models Washington University St Louis Working Paper
Crouse R H Jin C amp Hanumara R C 1995 Unbiased Ridge Estimation with Prior Information and Ridge Trace Communication in Statistics vol 24 no 9 pp 2341-2354
Dash G amp Kajiji N 2002 Modeling FX Volatility A Comparative Analysis of the RBF Neural Network Topology in 9th International Conference on Forecasting Financial Markets London England
Dash G H Hanumara C amp Kajiji N 2003 Neural Network Architectures for Modeling FX Futures Options Volatility in Annual Meetings of the Northeast Decision Sciences Institute Providence Rhode Island
Debray S Evans W Muth R amp de Sutter B 2000 Compiler Techniques for Code
Forecasting Hedge Fund Index Returns
-34- Dash amp Kajiji
Compaction ACM Transactions on Programming Languages and Systems vol 22 no 2 pp 378-415
Dyba T 2000 An Instrument for Measuring the Key Factors of Success in Software Process Improvement Emiprical Software Engineering vol 5 no 4 pp 357-390
Fama E amp French K 1989 Business Conditions and Expected Returns on Stocks and Bonds Journal of Financial Economics vol 25 pp 23-49
Ferson W amp Harvey C 1991 Sources of Predictability in Portfolio Returns Financial Analysts Journal vol May June pp 49-56
Fraser C W amp Wendt A L 1986 Integrating Code Generation and Optimization SIGPLAN Notices vol 21 no 7 pp 242-248
Fung W amp Hsieh D 1999 Is Mean-Variance Analysis Applicable to Hedge Funds Economic Letters vol 62 pp 53-58
Han Y 2002 The Economic Value of Volatility Modeling Assest Allocation with a High Dimensional Dynamic Latent Factor Multivariate Stochastic Volatility Model Washington University StLouis MO Working Paper
Hanson D B 1983 Simple Code Optimization Software-Practice and Experience vol 13 no 8 pp 745-763
Harasty H amp Roulet J 2000 Modeling Stock Market Returns -- An Error Correction Model Journal of Portfolio Management vol Winter pp 33-46
Harvey C R Travers K E amp Costa M J 2002 Forecasting Emerging Market Returns Using Neural Networks Emerging Markets Quarterly vol Summer pp 1-12
Hemmerle W J 1975 An Explicit Solution for Generalized Ridge Regression Technometrics vol 17 no 3 pp 309-314
Hoerl A E amp Kennard R W 1970 Ridge Regression Biased Estimation for Nonorthogonal Problems Technometrics vol 12 no 3 pp 55-67
Kajiji N 2001 Adaptation of Alternative Closed Form Regularization Parameters with Prior Information to the Radial Basis Function Neural Network for High Frequency Financial Time Series Neural Networks statistics and time series University of Rhode Island
Kat amp Lu 2002 An Excursion into the Statistical Properties of the Hedge Fund Returns Alternative Investment Research Center London UK Working Paper
Keim D amp Stambaugh R 1986 Predicting Returns in the Stock and Bond Markets Journal of Financial Economics vol 17 pp 357-424
Forecasting Hedge Fund Index Returns
-35- Dash amp Kajiji
Leung M Daouk H amp Chen A 2000 Forecasting Stock Indices A Comparison of
Classification and Level Estimation Models International Journal of Forecasting vol 16 pp 173-190
Lhabitant F-S amp Learned M July 2002 Hedge Fund Diversification How Much is Enough FAME International Center for Financial Asset Management and Engineering Geneva Switzerland Research Paper No 52
Lindvall M Tesoriero R amp Costa P 2003 An Empirically-Based Process for Software Architecture Evaluation Emiprical Software Engineering vol 8 no 1 pp 83-108
Lynch A 2000 Portfolio Choice and Equity Characteristics Characterizing the Hedging Demands Induced by Return Predictability New York University New York NY Working Paper
Mayrand J Patenaude J-F Merlo E Dagenais M amp Lague B 2000 Software Assessment Using Metrics A Comparison Across Large C++ and Java Systems Annals of Software Engineering vol 9 no 1-4 pp 117-141
Merton R 1981 On Market Timing and Investment Performance An Equilibrium Theory of Value for Market Forecasts Journal of Business vol 54 no 3 pp 363-406
Orr M J L 1996 Introduction to Radial Basis Function Networks Center for Cognitive Science Scotland UK
Orr M J L 1997 MATLAB Routines for Subset Selection and Ridge Regression in Linear Neural Networks Center for Cognitive Science Scotland UK
Sheldon F T amp Greiner S 1999 Composing Analyzing and Validating Software Models to Assess the Performability of Competing Design Candidates Annals of Software Engineering vol 8 no 1-4 pp 289-311
Thomson G H 1951 The Factorial Analysis of Human Ability University of London Press London
Tikhonov A and Arsenin V 1977 Solutions of Ill-Posed Problems Wiley New York
Yao J amp Tan C L Access Year 2003 A Study on Training Criteria for Financial Time Series Forecasting JTYaomasseyacnz Palmerston North New Zealand
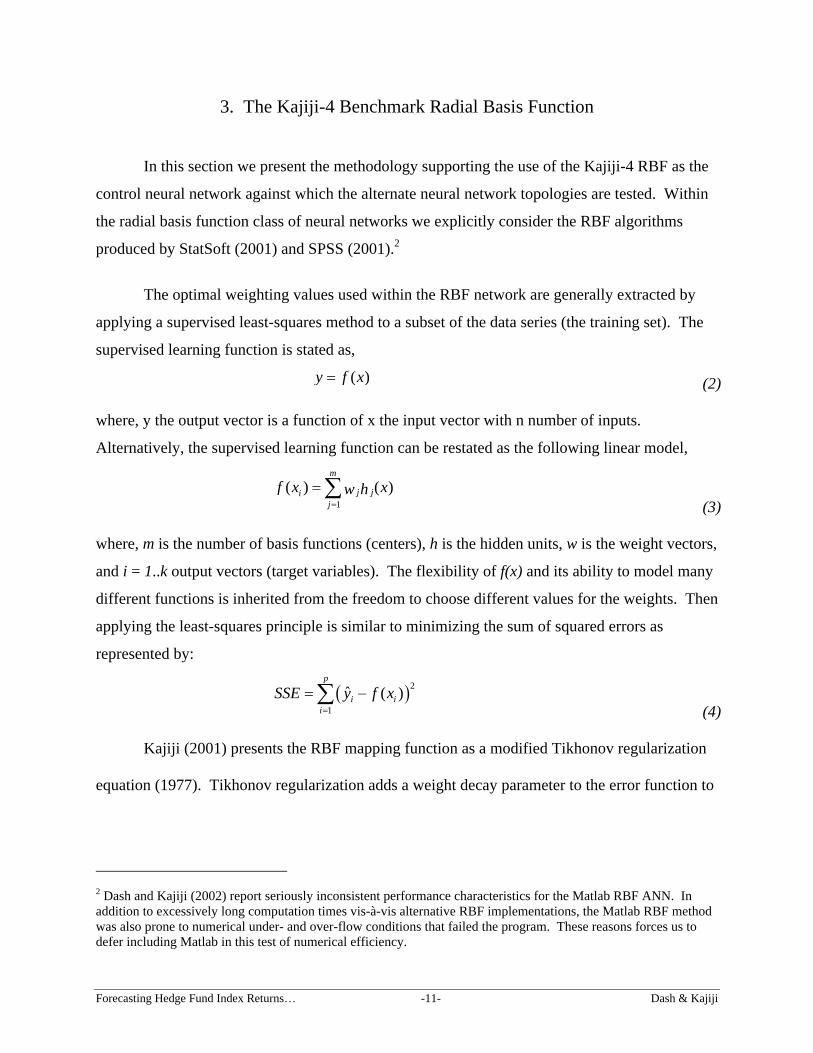
Forecasting Hedge Fund Index Returns
-17- Dash amp Kajiji
Next we assess the ability of the Kajiji-4 algorithm to correctly predict the directional
change of hedge fund returns Both the direction and modified direction measures report
identical results across all model applications The direction measure solves at 0988 and the
modified direction measure is constant at its maximum value of 10 The modified direction
measurement of 10 does not necessarily imply that the prediction is perfect A more
conservative interpretation of the result allows us to conclude that the target variable correctly
attempts to model the peaks and troughs found in the observed dataset Take together these two
measures provide strong evidence that the Kajiji-4 algorithm when applied to monthly return
data for alternative assets can achieve near perfect results in forecasting directional changes in
the returns data
The strong performance of the directional measures does not address the profit incentive
held by investors The profit-enhanced TDDP measure presents a very clear picture of modeling
efficiency
Forecasting Hedge Fund Index Returns
-18- Dash amp Kajiji
Table 5 Kajiji-4 Model Results
SFB Tremont Hedge Fund
Convertible Arbitrage
Dedicated Short Bias
Emerging Markets
Equity Market Neutral
Event Driven
Distressed ED Multi-Strategy
Risk Arbitrage
Fixed Income Arbitrage
Global Macro
Long Short
Managed Funds
Lambda 1051 1129 1165 1912 46713 0238 0195 0469 0792 0154 9764 1530 1982 Return-level Error Measures Training Error 1271 1107 1019 1248 1189 1136 1079 1186 1040 1165 1295 1212 0853 Validation Error 0143 0531 0757 0227 0400 0191 0219 0207 0508 0132 0111 0309 1095 Fitness Error 0022 0021 0401 0046 0000 0221 0425 0111 0065 0098 0000 0035 0233 Classification Error Measure Direction 0988 0988 0988 0988 0988 0988 0988 0988 0988 0988 0988 0988 0988 M Direction 1000 1000 1000 1000 1000 1000 1000 1000 1000 1000 1000 1000 1000 TDDP 00054 00052 01418 00114 00001 00718 01374 00361 00229 00308 00001 00087 00802
Forecasting Hedge Fund Index Returns
-19- Dash amp Kajiji
Figure 2 Actual and Predicted Using Kajiji-4 RBF on Dedicated Short Bias Fund
DED Short BiasActual and Predicted (Feb 1994 - Feb 2002)
Actual Predicted
9897969594939291908988878685848382818079787776757473727170696867666564636261605958575655545352515049484746454443424140393837363534333231302928272625242322212019181716151413121110987654321
26
25
24
23
22
21
20
19
18
17
16
15
14
13
12
11
10
9
8
7
6
5
4
3
2
1
0
-1
-2
-3
-4
-5
-6
-7
-8
-9
Figure 3 Actual and Predicted Using Kajiji-4 RBF on Equity Market Neutral Fund
Equity Market NatrlActual and Predicted (Feb 1994 - Feb 2002)
Actual Predicted
9897969594939291908988878685848382818079787776757473727170696867666564636261605958575655545352515049484746454443424140393837363534333231302928272625242322212019181716151413121110987654321
3
2
1
0
-1
Forecasting Hedge Fund Index Returns
-20- Dash amp Kajiji
52 SPSS s Neural Connection
The SPSS RBF results presented in table 6 differ markedly from those produced by the
Kajiji-4 algorithm Based on a comparison of within algorithmic MSE results the SPSS RBF
modeling experiment achieves the lowest error value when modeling the Equity Market Neutral
index This is one of the two focus indices But the SPSS reported error measure for this index
is more than 3425 times larger than that produced by the Kajiji-4 simulation For the other
focus index Dedicated Short Bias the SPSS fitness MSE is more than 1975 times higher than
that produced by the Kajiji-4 counterpart This is also the largest MSE reported by the
application of the SPSS procedure Returning to our examination of how RBF algorithms
perform under conditions of distributional asymmetry we note that except for one case (the Fixed
Income Arbitrage index) the SPSS algorithm generates a consistent performance ratio for hedge
fund indices with absolute skewness levels above 300 and kurtosis measures greater than 140
Within the subgroup defined by the Event Driven Distressed and ED Multi-Strategy indices
the reported fitness MSE measures ranged from 3172028 to 3642675 By comparison the
Kajiji-4 algorithm also performed consistently across this same subgroup but the reported MSE
measures were decidedly lower under Kajiji-4 achieving levels that ranged from 0030 to 0037
In summary the SPSS RBF algorithm demonstrated the ability to produce consistent
performance across monthly return indices with high absolute skewness and high kurtosis
measures Unfortunately asymmetry issues aside the performance of the algorithm dissipate as
the level of relative variation (CV) increases A graphical display of the two focus indexes is
provided in figures 4 and 5 respectively
Forecasting Hedge Fund Index Returns
-21- Dash amp Kajiji
Table 6 SPSS Model Results
SFB Tremont Hedge Fund
Convertible Arbitrage
Dedicated Short Bias
Emerging Markets
Equity Market Neutral
Event Driven
Distressed ED Multi-Strategy
Risk Arbitrage
Fixed Income Arbitrage
Global Macro
Long Short
Managed Funds
Return-level Error Measures Training Error 1074746 0998806 1018551 1073490 0948484 098785 0464553 091175 0860569 0522714 070402 101266 0939322 Validation Error 0279682 0827859 0868138 0503276 0544275 075957 0899311 063094 0671334 0788974 022464 033472 1210085 Fitness Error 6999264 2468697 27655226 28473214 1370447 364267 3127028 349122 1698769 0767644 1093985 1094859 12059491 Classification Error Measure Direction 05046 06697 04404 05138 05780 05596 05688 05963 06055 06514 06789 05229 05413 M Direction 03425 03080 01521 02103 03271 02917 05255 03644 02735 04862 04496 03112 -00137 TDDP 16879 08222 78533 53780 02697 08478 06223 10244 04540 01597 17682 34983 35241
Forecasting Hedge Fund Index Returns
-22- Dash amp Kajiji
Figure 4 Actual and Predicted Using SPSS RBF on the Dedicated Short Bias Fund
Dedicated Short BiasActual and Predicted
Actual Predicted
1081061041021009896949290888684828078767472706866646260585654525048464442403836343230282624222018161412108642
9
8
7
6
5
4
3
2
1
0
-1
-2
-3
-4
-5
-6
-7
-8
Figure 5 Actual and Predicted Using SPSS on Equity Market Neutral Fund
Equity Market Neutral FundActual and Predicted
Actual Predicted
1081061041021009896949290888684828078767472706866646260585654525048464442403836343230282624222018161412108642
3
2
1
0
-1
Forecasting Hedge Fund Index Returns
-23- Dash amp Kajiji
53 StatSofts Statistica
On average the results produced upon the application of the StatSoft RBF algorithm to
the modeling problem fall in between those produced by the other two RBF algorithmic
methods Before presenting the details as provided in table 7 we wish to note that the user
interface of the StatSoft algorithm differs considerably from that presented by either the Kajiji-4
or SPSS methods For the StatSoft-based experiment where possible optional parameter
settings were set to levels specified as default levels under the Kajiji-4 method We then
undertook a manual optimization process with the goal of identifying parameter settings that
would produce best (if not optimal) solution results for the sample data Stated differently while
we were able to apply default settings without modification under the Kajiji-4 and SPSS
experiments that was not possible in this case
Like the Kajiji-4 algorithm the StatSoft method reported the lowest fitness MSE for the
Equity Market Neutral index model The MSE reported by the StatSoft method is approximately
14 times larger than that achieved by application of the Kajiji-4 network For the other focus
index Dedicated Short Bias at 23051 the fitness MSE is the highest recorded across all test
models This result is more than 1600 times that achieved for the same index under the Kajiji-4
method Figure 6 and 7 provide a graphical view of the algorithms predictive ability for the
Dedicated Short Bias and Equity Neutral fund returns It is clear from this view that the target
variable achieves reasonable directional performance but falls short in its ability to replicate the
magnitude of the changes We observe that the StatSoft method performs best when modeling
monthly hedge fund returns with relatively low coefficients of variation The algorithms
predictive ability dissipates noticeably as relative variation (CV) increases How if at all this
deterioration is impacted by distributional asymmetry is not immediately clear from the results
generated by this experiment
Forecasting Hedge Fund Index Returns
-24- Dash amp Kajiji
Table 7 Staistica-4 Model Results
SFB Tremont Hedge Fund
Convertible Arbitrage
Dedicated Short Bias
Emerging Markets
Equity Market Neutral
Event Driven
Dis-tressed
ED Multi-Strategy
Risk Arbitrage
Fixed Income Arbitrage
Global Macro
Long Short
Managed Funds
Return-level Error Measures Training Error 03647 05030 01663 01280 09018 04456 03509 04142 06886 06328 01994 02182 02826 Validation Error 04937 05097 01747 01227 05999 05693 04590 04475 06107 06829 02747 01314 04146 Fitness Error 50695 10008 230509 160618 07297 32304 32736 34262 14754 11334 150169 71130 108056 Classification Error Measure Direction 06330 08532 06055 06422 07523 07431 06422 06055 07248 06881 05963 05596 05229 M Direction 01901 05861 03245 05216 00556 05211 04792 02315 02890 00415 00659 04142 02421 TDDP 10963 03143 64969 30278 01067 11203 08245 11080 04369 03822 43435 21328 30088
Forecasting Hedge Fund Index Returns
-25- Dash amp Kajiji
Figure 6 Actual and Predicted Using the StatSoft ANN on Dedicated Short Bias Fund
Dedicated Short Bias Fund Actual and Predicted
Actual Predicted
1081061041021009896949290888684828078767472706866646260585654525048464442403836343230282624222018161412108642
26
25
24
23
22
21
20
19
18
17
16
15
14
13
12
11
10
9
8
7
6
5
4
3
2
1
0
-1
-2
-3
-4
-5
-6
-7
-8
-9
Figure 7 Actual and Predicted Using the StatSoft ANN on Equity Market Neutral Fund
Emerging Markets Neutral FundActual and Predicted
Actual Predicted
1081061041021009896949290888684828078767472706866646260585654525048464442403836343230282624222018161412108642
3
2
1
0
-1
-2
Forecasting Hedge Fund Index Returns
-26- Dash amp Kajiji
54 Efficient Model Selection
A comparative analysis of the three RBF algorithms points to the role of CV and
distributional symmetry (skewness and kurtosis) as factors that can measurably impact modeling
accuracy Table 8 provides a concentrated view of these three statistical properties by algorithm
If we look at how these three factors influence the models with the lowest fitness MSE it
becomes apparent that the SPSS and StatSoft models choose the indices with the thirteenth
ranked CV and kurtosis (also the lowest) These indices are the tenth ranked by the skewness
measure That is these two algorithms perform well when asymmetry issues are smallest On
the other hand the Kajiji-4 algorithm performed at its best when relative dispersion was at or
near its highest Although the Kajiji-4 algorithm was able to model observed variables with
moderate levels of skewness and kurtosis it too performed best when asymmetry are decreasing
As noted above the highest MSE produced by the Kajiji-4 method was significantly
smaller than the highest produced by either of the other two algorithms Hence it is interesting
to observe that under the Kajiji-4 algorithm the highest MSE occurred for an index that had the
highest skewness and kurtosis measures Under SPSS and StatSoft the highest MSE was
associated with an index that had significantly less distributional asymmetry
Table 8 Relative Dispersion Comparison
Kajiji-4 SPSS StatSoft Lowest Validation MSE
Dedicated Short Bias [179] and Global Macro [51310]
Equity Market Neutral [131013]
Equity Market Neutral [131013]
Highest Validation MSE
Event Driven [911]
Dedicated Short Bias [179]
Dedicated Short Bias [179]
Rankings for CV Skewness Kurtosis are in parentheses
Forecasting Hedge Fund Index Returns
-27- Dash amp Kajiji
55 Directional Efficiency
Table 9 provides a comparison of directional forecasting accuracy Results are reported
by algorithmic method in order to show which forecast produced the minimum and maximum for
each directional error measure We note that the results generated by application of the Kajiji-4
method are at the theoretical maximum of 0988 and constant across all tested models Only the
value changes for the Kajiji-4 results under the modified direction measure (all 10) Tables 10
and 11 present an augmented comparative analysis of the results achieved by the application of
the SPSS and StatSoft algorithms These tables rank the performance based on the direction
measure What is most obvious is the lack of a ranking consistency Except for a weak
argument to the benefit of the Managed Funds index there is no overlap in the rankings achieved
across the remaining two algorithms Despite this lack of consistency it does appear that the
StatSoft algorithm maintains an efficiency edge over the SPSS algorithm in directional accuracy
Table 9 Summary of Direction and Modified Direction
Kajiji-4 SPSS StatSoft Min Direction ALL (0988) Dedicated Short Bias
(0440367) Managed Funds (0522936)
Max Direction ALL (0988) Global Macro (0678899)
Convertible Arbitrage (0853211)
Min Modified Direction
ALL (1000000) Managed Funds (-0013723)
Fixed Income Arbitrage (0041528)
Max Modified Direction
ALL (1000000) Distressed (0525463)
Convertible Arbitrage (0586124)
Computed values in parentheses
Forecasting Hedge Fund Index Returns
-28- Dash amp Kajiji
Table 10 Rankings of the SPSS Direction Modified Direction
Direction M Direction Rank Direction
Rank M Direction
Global Macro 0678899
0449631
1 3
Convertible Arbitrage 0669725
0308014
2 6
Fixed Income Arbitrage 0651376
0486157
3 2 Risk Arbitrage 0605505
0273533
4 10 ED Multi-Strategy 059633
0364352
5 4 Equity Market Neutral 0577982
0327091
6 7 Dis-tressed 0568807
0525463
7 1 Event Driven 0559633
0291165
8 9 Managed Funds 0541284
-0013723
9 13 Long Short 0522936
0311213
10 8 Emerging Markets 0513761
0210284
11 11 SFB Tremont Hedge Fund
0504587
034246
12 5 Dedicated Short Bias 0440367
0152098
13 12
Table 11 Rankings of the StatSoft Direction Modified Direction Direction Modified Direction
Rank Direction
Rank M Direction
Convertible Arbitrage 085321
058612
1 1 Equity Market Neutral 075229
005556
2 12 Event Driven 074312
052108
3 3 Risk Arbitrage 072477
028904
4 7 Fixed Income Arbitrage 068807
004153
5 13 Distressed 06422
047917
6 4 Emerging Markets 06422
052163
7 2 CSFB Tremont Hedge Fund
063303
019008
8 10 Dedicated Short Bias 060551
032448
9 6 ED Multi-Strategy 060551
023148
10 9 Global Macro 059633
006593
11 11 Long Short 055963
041419
12 5 Managed Funds 052294
024208
13 8
Forecasting Hedge Fund Index Returns
-29- Dash amp Kajiji
56 Directional Profit Efficiency
The TDDP measure is a correction weight that is designed to compensate for incorrect
directional forecasts by overall magnitude of the movement The weight is applied to future
forecasts generated by the forecasting model The smaller the weight the more accurate the
training phase of the model By definition large weights are indicative of a missed direction an
incorrect magnitude adjustment or some combination of the two Table 12 presents the TDDP
measures for the three RBF ANN under study here
The TDDP also provides a new layer of support for the efficiency of the Kajiji-4
algorithm In profit induced scenarios where it is important to predict the correct turning point of
a time series as well as the magnitude by which the time series is expected to move the Kajiji-4
algorithm requires the least weighted adjustment An improvement ratio is presented in the last
two columns of table 12 This is simply the TDDP of the selected method divided by the TDDP
produced by solution of the Kajiji-4 method Of the seven funds that exhibited asymmetrical
return distributions only one (Emerging Markets) had an improvement ratio over 60 This
observation confirms that the while the Kajiji-4 method is more efficient when predicting returns
associated with asymmetrical and leptokurtic distributions the gains are not as great when the
distributions exhibit fat-tails and skewness
Forecasting Hedge Fund Index Returns
-30- Dash amp Kajiji
Table 12 TDDP Measures with Asymmetrical Identification Kajiji-4 SPSS
StatSoft SPSSKajiji-4
StatSoftKajiji-4
Asymmetrical
Convertible Arbitrage 0005208222
03143
1581 604 A
Equity Market Neutral 0000102697
01067
2697 1067
Event Driven 0071808478
11203
118 156 A
Risk Arbitrage 0022904540
04369
199 191 A Fixed Income Arbitrage 0030801597
03822
52 124 A Distressed 0137406223
08245
45 60 A Emerging Markets 0011453780
30278
4718 2656 A CSFB Tremont Hedge Fund
0005416879
10963
3126 2030
Dedicated Short Bias 0141878533
64969
554 458 ED Multi-Strategy 0036110244
11080
284 307 A Global Macro 0000117682
43435
17682 43425 Long Short 0008734983
21328
4021 2451 Managed Futures 0080235241
30088
439 375
57 Post Model Return Residuals
In this section we apply a PCA with Varimax rotation to the post model residual returns
The appointed task of the PCA analysis is to uncover latent common variation In the absence of
any measurable levels of common variation the PCA analysis will return one significant factor (a
factor with an eigenvalue of at least 10) Specifically we subject E to the PCA procedure
where 1( )kE HFI f S S
The results of this application are presented in table 13 As with the earlier factor
analytic presentation we replace factor loadings below the absolute value of 040 with a period
Additionally only those factors with eigenvalues of 10 or higher are retained for display
purposes Two factors are reported in the table Factor 2 is differentiated from factor 1 by the
asymmetry characteristics of the hedge fund indices For the skewness dimension only the
Emerging Markets index has a negative skewness above -30 Similarly for the kurtosis
dimension (with the same exception for the Emerging Markets index) each index that loads on
factor 2 has a kurtosis measure that exceeds 140 The factor analytic results provide additional
support for the MSE directional analysis that produced observed differences in model efficiency
based on the existence of asymmetry in the observed hedge fund returns
Forecasting Hedge Fund Index Returns
-31- Dash amp Kajiji
Table 13 Varimax Solution of After Model Residuals
Fund Name Factor 1 Factor 2 Row Global Macro 09625 9673 Managed Funds 09509 9438 SFTTremont Hedge Fund 09197 8871 Distressed 08138 6795 Dedicated Short Bias 08037 6797 Equity Market Neutral -07893 6369 LongShort -07252 5355 Risk Arbitrage -06540 4539 Fixed Income Arbitrage -05113 -05972 6181 Emerging Markets 07347 6848 Event Driven -09171 9340 ED Multi-Strategy 08562 7847 Convertible Arbitrage 06195 3870 Eigenvalue 61157 30765 Percent of Variance Explained 4704 7071
6 Summary and Conclusions
The results reported by the comparative algorithmic experiment presented in this paper
add support and clarity to the earlier findings presented by Leung and Amenc et al (2002)
This paper provides clear evidence that RBF ANN algorithmic topology is capable of consistent
and accurate modeling of hedge fund index returns Importantly for the task of modeling
financial volatility we show that it is not just a matter of finding a better algorithm but we show
that it is equally important to focus on the efficiency of the economic model specification as
well To this end the research established a role for developing efficient predictor variables
under the monthly time-scale The reduction of predictor variables to independent factor score
dimensions proved to be capable of producing a reduced set of predictor variables that
effectively mimic a large percentage of the population variance except for that part attributed to
return skewness and kurtosis Effective economic modeling required controlling for these two
dimensions not treated by the application of factor-analytic methods Consequently our findings
both support and contradict the findings of Leung et al (2000) Unlike Leung who reported
Forecasting Hedge Fund Index Returns
-32- Dash amp Kajiji
success for classification modeling only we have been able to produce accurate results for both
the classification and the return level prediction of hedge fund index returns
The research investigation also found the Kajiji-4 RBF ANN to be the dominant method
among the alternative RBF algorithms that were subjected to the modeling and prediction
experiment The Kajij-4 method has proven robust in modeling and prediction of hourly and
daily high-frequency financial time-series involving hundreds to thousands of observations This
research adds to the documented effectiveness of the Kajiji-4 RBF ANN when applied to highly
nonlinear and extremely volatile financial data at nearly any frequency interval When the need
arises to model and predict high- or low-frequency financial volatility the Kajiji-4 RBF ANN is
a worthy contender for algorithmic consideration
Forecasting Hedge Fund Index Returns
-33- Dash amp Kajiji
REFERENCES
_______ 2001 SPSS Version 100 SPSS Inc Chicago IL
_______ 2001 STATISTICA Statsoft Inc Tulsa OK
Amenc N Bied S E amp Martellini L 2002 Evidence of Predictability in Hedge Fund Returns and Multi-Style Multi-Class Tactical Style Allocation Decisions Marshall School of Business Working Paper No 02-5
Balci O 2001 A Methodology for Certification of Modeling and Simulation Applications ACM Transactions on Programming Languages and Systems vol 11 no 4 pp 352-377
Barber B Lehavy R McNichols M amp Trueman B 2001 Can Investors Profit from the Prophets Security Analyst Recommendations and Stock Returns The Journal of Finance vol 56 no 2 pp 531-563
Barberis N 2000 Investing for the Long Run when Returns are Predictable Journal of Finance vol 55 pp 225-264
Bollerslev T 1986 Generalized Autoregressive Conditional Heteroskedasticity Journal of Econometrics vol 31 pp 307-327
Brown S J Goetzmann W N amp Park J 2001 Careers and Survival Competition and Risk in the Hedge Fund and CTA Industry The Journal of Finance vol 56 no 5 pp 1869-1886
Castiglione F amp Bernaschi M 2001 Market Fluctuations Simulation and Forecasting Available [httpwwwzpruni-koelnde~filippoWEB_IACeconophysicseconophysicshtml] (Jan 31 2003)
Chib S Nardari F amp Shephard N 2001 Analysis of High Dimensional Multivariate Stochastic Volatility Models Washington University St Louis Working Paper
Crouse R H Jin C amp Hanumara R C 1995 Unbiased Ridge Estimation with Prior Information and Ridge Trace Communication in Statistics vol 24 no 9 pp 2341-2354
Dash G amp Kajiji N 2002 Modeling FX Volatility A Comparative Analysis of the RBF Neural Network Topology in 9th International Conference on Forecasting Financial Markets London England
Dash G H Hanumara C amp Kajiji N 2003 Neural Network Architectures for Modeling FX Futures Options Volatility in Annual Meetings of the Northeast Decision Sciences Institute Providence Rhode Island
Debray S Evans W Muth R amp de Sutter B 2000 Compiler Techniques for Code
Forecasting Hedge Fund Index Returns
-34- Dash amp Kajiji
Compaction ACM Transactions on Programming Languages and Systems vol 22 no 2 pp 378-415
Dyba T 2000 An Instrument for Measuring the Key Factors of Success in Software Process Improvement Emiprical Software Engineering vol 5 no 4 pp 357-390
Fama E amp French K 1989 Business Conditions and Expected Returns on Stocks and Bonds Journal of Financial Economics vol 25 pp 23-49
Ferson W amp Harvey C 1991 Sources of Predictability in Portfolio Returns Financial Analysts Journal vol May June pp 49-56
Fraser C W amp Wendt A L 1986 Integrating Code Generation and Optimization SIGPLAN Notices vol 21 no 7 pp 242-248
Fung W amp Hsieh D 1999 Is Mean-Variance Analysis Applicable to Hedge Funds Economic Letters vol 62 pp 53-58
Han Y 2002 The Economic Value of Volatility Modeling Assest Allocation with a High Dimensional Dynamic Latent Factor Multivariate Stochastic Volatility Model Washington University StLouis MO Working Paper
Hanson D B 1983 Simple Code Optimization Software-Practice and Experience vol 13 no 8 pp 745-763
Harasty H amp Roulet J 2000 Modeling Stock Market Returns -- An Error Correction Model Journal of Portfolio Management vol Winter pp 33-46
Harvey C R Travers K E amp Costa M J 2002 Forecasting Emerging Market Returns Using Neural Networks Emerging Markets Quarterly vol Summer pp 1-12
Hemmerle W J 1975 An Explicit Solution for Generalized Ridge Regression Technometrics vol 17 no 3 pp 309-314
Hoerl A E amp Kennard R W 1970 Ridge Regression Biased Estimation for Nonorthogonal Problems Technometrics vol 12 no 3 pp 55-67
Kajiji N 2001 Adaptation of Alternative Closed Form Regularization Parameters with Prior Information to the Radial Basis Function Neural Network for High Frequency Financial Time Series Neural Networks statistics and time series University of Rhode Island
Kat amp Lu 2002 An Excursion into the Statistical Properties of the Hedge Fund Returns Alternative Investment Research Center London UK Working Paper
Keim D amp Stambaugh R 1986 Predicting Returns in the Stock and Bond Markets Journal of Financial Economics vol 17 pp 357-424
Forecasting Hedge Fund Index Returns
-35- Dash amp Kajiji
Leung M Daouk H amp Chen A 2000 Forecasting Stock Indices A Comparison of
Classification and Level Estimation Models International Journal of Forecasting vol 16 pp 173-190
Lhabitant F-S amp Learned M July 2002 Hedge Fund Diversification How Much is Enough FAME International Center for Financial Asset Management and Engineering Geneva Switzerland Research Paper No 52
Lindvall M Tesoriero R amp Costa P 2003 An Empirically-Based Process for Software Architecture Evaluation Emiprical Software Engineering vol 8 no 1 pp 83-108
Lynch A 2000 Portfolio Choice and Equity Characteristics Characterizing the Hedging Demands Induced by Return Predictability New York University New York NY Working Paper
Mayrand J Patenaude J-F Merlo E Dagenais M amp Lague B 2000 Software Assessment Using Metrics A Comparison Across Large C++ and Java Systems Annals of Software Engineering vol 9 no 1-4 pp 117-141
Merton R 1981 On Market Timing and Investment Performance An Equilibrium Theory of Value for Market Forecasts Journal of Business vol 54 no 3 pp 363-406
Orr M J L 1996 Introduction to Radial Basis Function Networks Center for Cognitive Science Scotland UK
Orr M J L 1997 MATLAB Routines for Subset Selection and Ridge Regression in Linear Neural Networks Center for Cognitive Science Scotland UK
Sheldon F T amp Greiner S 1999 Composing Analyzing and Validating Software Models to Assess the Performability of Competing Design Candidates Annals of Software Engineering vol 8 no 1-4 pp 289-311
Thomson G H 1951 The Factorial Analysis of Human Ability University of London Press London
Tikhonov A and Arsenin V 1977 Solutions of Ill-Posed Problems Wiley New York
Yao J amp Tan C L Access Year 2003 A Study on Training Criteria for Financial Time Series Forecasting JTYaomasseyacnz Palmerston North New Zealand
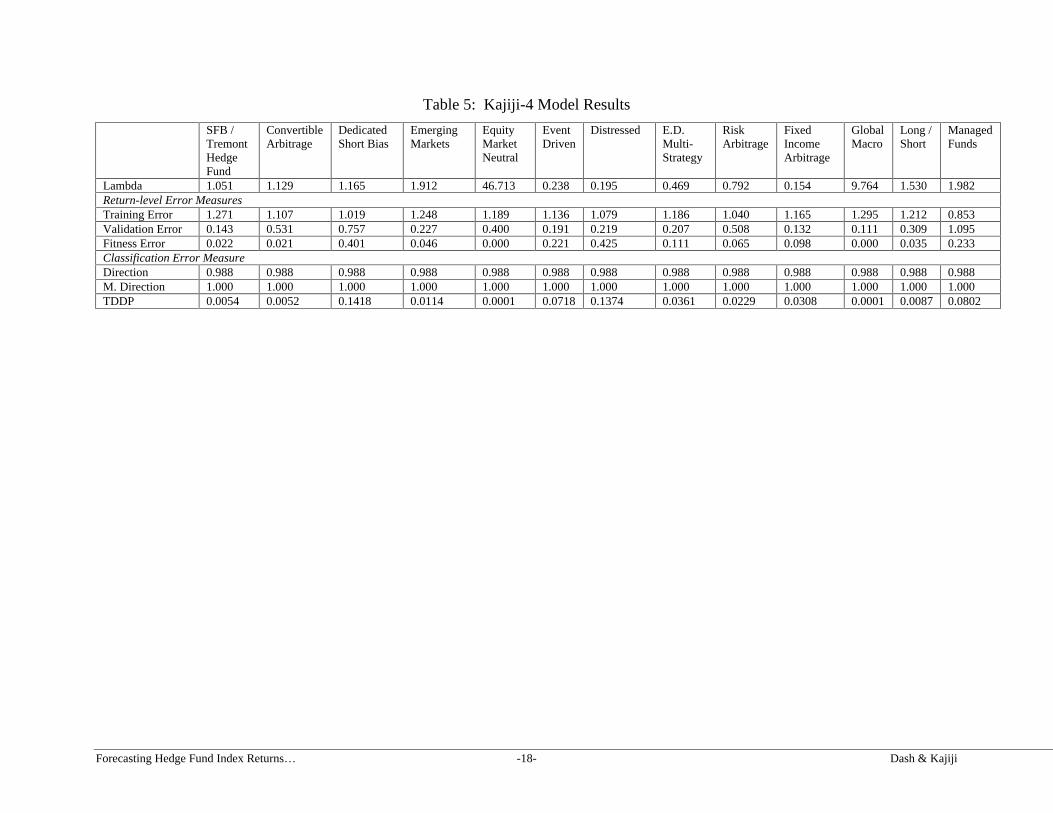
Forecasting Hedge Fund Index Returns
-33- Dash amp Kajiji
REFERENCES
_______ 2001 SPSS Version 100 SPSS Inc Chicago IL
_______ 2001 STATISTICA Statsoft Inc Tulsa OK
Amenc N Bied S E amp Martellini L 2002 Evidence of Predictability in Hedge Fund Returns and Multi-Style Multi-Class Tactical Style Allocation Decisions Marshall School of Business Working Paper No 02-5
Balci O 2001 A Methodology for Certification of Modeling and Simulation Applications ACM Transactions on Programming Languages and Systems vol 11 no 4 pp 352-377
Barber B Lehavy R McNichols M amp Trueman B 2001 Can Investors Profit from the Prophets Security Analyst Recommendations and Stock Returns The Journal of Finance vol 56 no 2 pp 531-563
Barberis N 2000 Investing for the Long Run when Returns are Predictable Journal of Finance vol 55 pp 225-264
Bollerslev T 1986 Generalized Autoregressive Conditional Heteroskedasticity Journal of Econometrics vol 31 pp 307-327
Brown S J Goetzmann W N amp Park J 2001 Careers and Survival Competition and Risk in the Hedge Fund and CTA Industry The Journal of Finance vol 56 no 5 pp 1869-1886
Castiglione F amp Bernaschi M 2001 Market Fluctuations Simulation and Forecasting Available [httpwwwzpruni-koelnde~filippoWEB_IACeconophysicseconophysicshtml] (Jan 31 2003)
Chib S Nardari F amp Shephard N 2001 Analysis of High Dimensional Multivariate Stochastic Volatility Models Washington University St Louis Working Paper
Crouse R H Jin C amp Hanumara R C 1995 Unbiased Ridge Estimation with Prior Information and Ridge Trace Communication in Statistics vol 24 no 9 pp 2341-2354
Dash G amp Kajiji N 2002 Modeling FX Volatility A Comparative Analysis of the RBF Neural Network Topology in 9th International Conference on Forecasting Financial Markets London England
Dash G H Hanumara C amp Kajiji N 2003 Neural Network Architectures for Modeling FX Futures Options Volatility in Annual Meetings of the Northeast Decision Sciences Institute Providence Rhode Island
Debray S Evans W Muth R amp de Sutter B 2000 Compiler Techniques for Code
Forecasting Hedge Fund Index Returns
-34- Dash amp Kajiji
Compaction ACM Transactions on Programming Languages and Systems vol 22 no 2 pp 378-415
Dyba T 2000 An Instrument for Measuring the Key Factors of Success in Software Process Improvement Emiprical Software Engineering vol 5 no 4 pp 357-390
Fama E amp French K 1989 Business Conditions and Expected Returns on Stocks and Bonds Journal of Financial Economics vol 25 pp 23-49
Ferson W amp Harvey C 1991 Sources of Predictability in Portfolio Returns Financial Analysts Journal vol May June pp 49-56
Fraser C W amp Wendt A L 1986 Integrating Code Generation and Optimization SIGPLAN Notices vol 21 no 7 pp 242-248
Fung W amp Hsieh D 1999 Is Mean-Variance Analysis Applicable to Hedge Funds Economic Letters vol 62 pp 53-58
Han Y 2002 The Economic Value of Volatility Modeling Assest Allocation with a High Dimensional Dynamic Latent Factor Multivariate Stochastic Volatility Model Washington University StLouis MO Working Paper
Hanson D B 1983 Simple Code Optimization Software-Practice and Experience vol 13 no 8 pp 745-763
Harasty H amp Roulet J 2000 Modeling Stock Market Returns -- An Error Correction Model Journal of Portfolio Management vol Winter pp 33-46
Harvey C R Travers K E amp Costa M J 2002 Forecasting Emerging Market Returns Using Neural Networks Emerging Markets Quarterly vol Summer pp 1-12
Hemmerle W J 1975 An Explicit Solution for Generalized Ridge Regression Technometrics vol 17 no 3 pp 309-314
Hoerl A E amp Kennard R W 1970 Ridge Regression Biased Estimation for Nonorthogonal Problems Technometrics vol 12 no 3 pp 55-67
Kajiji N 2001 Adaptation of Alternative Closed Form Regularization Parameters with Prior Information to the Radial Basis Function Neural Network for High Frequency Financial Time Series Neural Networks statistics and time series University of Rhode Island
Kat amp Lu 2002 An Excursion into the Statistical Properties of the Hedge Fund Returns Alternative Investment Research Center London UK Working Paper
Keim D amp Stambaugh R 1986 Predicting Returns in the Stock and Bond Markets Journal of Financial Economics vol 17 pp 357-424
Forecasting Hedge Fund Index Returns
-35- Dash amp Kajiji
Leung M Daouk H amp Chen A 2000 Forecasting Stock Indices A Comparison of
Classification and Level Estimation Models International Journal of Forecasting vol 16 pp 173-190
Lhabitant F-S amp Learned M July 2002 Hedge Fund Diversification How Much is Enough FAME International Center for Financial Asset Management and Engineering Geneva Switzerland Research Paper No 52
Lindvall M Tesoriero R amp Costa P 2003 An Empirically-Based Process for Software Architecture Evaluation Emiprical Software Engineering vol 8 no 1 pp 83-108
Lynch A 2000 Portfolio Choice and Equity Characteristics Characterizing the Hedging Demands Induced by Return Predictability New York University New York NY Working Paper
Mayrand J Patenaude J-F Merlo E Dagenais M amp Lague B 2000 Software Assessment Using Metrics A Comparison Across Large C++ and Java Systems Annals of Software Engineering vol 9 no 1-4 pp 117-141
Merton R 1981 On Market Timing and Investment Performance An Equilibrium Theory of Value for Market Forecasts Journal of Business vol 54 no 3 pp 363-406
Orr M J L 1996 Introduction to Radial Basis Function Networks Center for Cognitive Science Scotland UK
Orr M J L 1997 MATLAB Routines for Subset Selection and Ridge Regression in Linear Neural Networks Center for Cognitive Science Scotland UK
Sheldon F T amp Greiner S 1999 Composing Analyzing and Validating Software Models to Assess the Performability of Competing Design Candidates Annals of Software Engineering vol 8 no 1-4 pp 289-311
Thomson G H 1951 The Factorial Analysis of Human Ability University of London Press London
Tikhonov A and Arsenin V 1977 Solutions of Ill-Posed Problems Wiley New York
Yao J amp Tan C L Access Year 2003 A Study on Training Criteria for Financial Time Series Forecasting JTYaomasseyacnz Palmerston North New Zealand
Forecasting Hedge Fund Index Returns
-34- Dash amp Kajiji
Compaction ACM Transactions on Programming Languages and Systems vol 22 no 2 pp 378-415
Dyba T 2000 An Instrument for Measuring the Key Factors of Success in Software Process Improvement Emiprical Software Engineering vol 5 no 4 pp 357-390
Fama E amp French K 1989 Business Conditions and Expected Returns on Stocks and Bonds Journal of Financial Economics vol 25 pp 23-49
Ferson W amp Harvey C 1991 Sources of Predictability in Portfolio Returns Financial Analysts Journal vol May June pp 49-56
Fraser C W amp Wendt A L 1986 Integrating Code Generation and Optimization SIGPLAN Notices vol 21 no 7 pp 242-248
Fung W amp Hsieh D 1999 Is Mean-Variance Analysis Applicable to Hedge Funds Economic Letters vol 62 pp 53-58
Han Y 2002 The Economic Value of Volatility Modeling Assest Allocation with a High Dimensional Dynamic Latent Factor Multivariate Stochastic Volatility Model Washington University StLouis MO Working Paper
Hanson D B 1983 Simple Code Optimization Software-Practice and Experience vol 13 no 8 pp 745-763
Harasty H amp Roulet J 2000 Modeling Stock Market Returns -- An Error Correction Model Journal of Portfolio Management vol Winter pp 33-46
Harvey C R Travers K E amp Costa M J 2002 Forecasting Emerging Market Returns Using Neural Networks Emerging Markets Quarterly vol Summer pp 1-12
Hemmerle W J 1975 An Explicit Solution for Generalized Ridge Regression Technometrics vol 17 no 3 pp 309-314
Hoerl A E amp Kennard R W 1970 Ridge Regression Biased Estimation for Nonorthogonal Problems Technometrics vol 12 no 3 pp 55-67
Kajiji N 2001 Adaptation of Alternative Closed Form Regularization Parameters with Prior Information to the Radial Basis Function Neural Network for High Frequency Financial Time Series Neural Networks statistics and time series University of Rhode Island
Kat amp Lu 2002 An Excursion into the Statistical Properties of the Hedge Fund Returns Alternative Investment Research Center London UK Working Paper
Keim D amp Stambaugh R 1986 Predicting Returns in the Stock and Bond Markets Journal of Financial Economics vol 17 pp 357-424
Forecasting Hedge Fund Index Returns
-35- Dash amp Kajiji
Leung M Daouk H amp Chen A 2000 Forecasting Stock Indices A Comparison of
Classification and Level Estimation Models International Journal of Forecasting vol 16 pp 173-190
Lhabitant F-S amp Learned M July 2002 Hedge Fund Diversification How Much is Enough FAME International Center for Financial Asset Management and Engineering Geneva Switzerland Research Paper No 52
Lindvall M Tesoriero R amp Costa P 2003 An Empirically-Based Process for Software Architecture Evaluation Emiprical Software Engineering vol 8 no 1 pp 83-108
Lynch A 2000 Portfolio Choice and Equity Characteristics Characterizing the Hedging Demands Induced by Return Predictability New York University New York NY Working Paper
Mayrand J Patenaude J-F Merlo E Dagenais M amp Lague B 2000 Software Assessment Using Metrics A Comparison Across Large C++ and Java Systems Annals of Software Engineering vol 9 no 1-4 pp 117-141
Merton R 1981 On Market Timing and Investment Performance An Equilibrium Theory of Value for Market Forecasts Journal of Business vol 54 no 3 pp 363-406
Orr M J L 1996 Introduction to Radial Basis Function Networks Center for Cognitive Science Scotland UK
Orr M J L 1997 MATLAB Routines for Subset Selection and Ridge Regression in Linear Neural Networks Center for Cognitive Science Scotland UK
Sheldon F T amp Greiner S 1999 Composing Analyzing and Validating Software Models to Assess the Performability of Competing Design Candidates Annals of Software Engineering vol 8 no 1-4 pp 289-311
Thomson G H 1951 The Factorial Analysis of Human Ability University of London Press London
Tikhonov A and Arsenin V 1977 Solutions of Ill-Posed Problems Wiley New York
Yao J amp Tan C L Access Year 2003 A Study on Training Criteria for Financial Time Series Forecasting JTYaomasseyacnz Palmerston North New Zealand