forecasting income statements & balance sheets using ... · forecasting income statements &...
TRANSCRIPT

BRIAN POI, DIRECTOR – SPECIALIZED MODELING
Forecasting Income Statements & Balance Sheets Using Industry Data

Brian Poi – Director of Specialized Modeling
Brian develops a variety of credit loss, credit origination and deposit account
models for use in both strategic planning and CCAR/DFAST environments.
Brian provides thought leadership and guidance on the use of advanced
statistical and econometric methods in economic forecasting applications.
He received his PhD and MA in economics from the University of Michigan
after graduating magna cum laude from Indiana University.
Forecasting Income Statements & Balance Sheets Using Industry Data 2

Agenda
Forecasting Income Statements & Balance Sheets Using Industry Data 3
» Current Challenges and Our Solution: Bank Call Report Forecasts
» Forecast Methodology for Income Statements and Balance Sheets
» Examples: Bank Forecasts Under Baseline and Stress Scenarios
Current Challenges
Forecasting Income Statements & Balance Sheets Using Industry Data 4
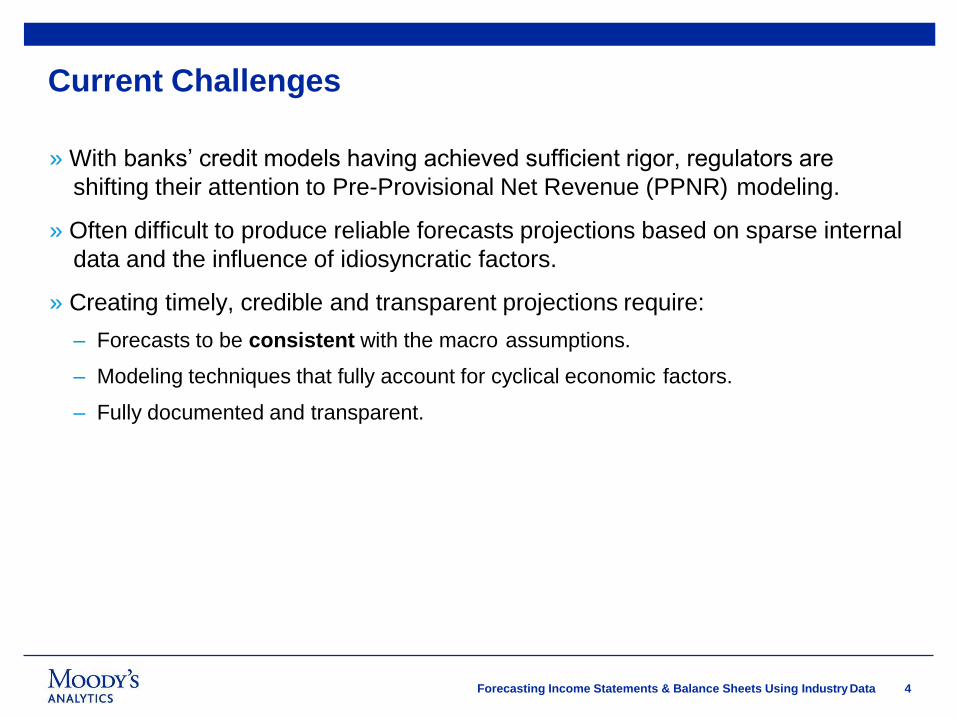
» With banks’ credit models having achieved sufficient rigor, regulators are
shifting their attention to Pre-Provisional Net Revenue (PPNR) modeling.
» Often difficult to produce reliable forecasts projections based on sparse internal
data and the influence of idiosyncratic factors.
» Creating timely, credible and transparent projections require:
– Forecasts to be consistent with the macro assumptions.
– Modeling techniques that fully account for cyclical economic factors.
– Fully documented and transparent.

Robust Solution: Bank Call Report Forecasts
» Industry models more accurately capture the effects of macroeconomic variables.
» Bank-level models more realistically assess bank-specific factors affecting portfolio.
» Overcomes limitations due to sparse/noisy data influenced by bank-specific factors.
– History back to 1992, spanning several expansions and recessions.
– Eliminates internal factors such as management actions and M&Aactivity.
» Ability to forecast performance for individual competitors and peer groups.
Industry & Peer
Level Forecasts
Industry-Level Forecasts
Off-the-Shelf Peer Groups
- CCAR, DFAST (2)
- Region (4)
Bank-Specific
Level Forecasts
Forecasting Income Statements & Balance Sheets Using Industry Data 5
Individual Bank Forecasts
Own bank
Competitors: Individual,
Aggregates
Custom Peer Groups
Econometric forecasts of income statement and balance sheet under trusted
scenarios based on FDIC Call Report data.

Full Range of Economic Scenarios
Moody’s Analytics trusted economic scenarios:
FB Fed Severely Adverse ScenarioFed Baseline Scenario Fed Adverse ScenarioFA FSA
Stronger Near-Term Rebound
Slower Near-Term Recovery
Baseline / Most Likely Below-Trend Long-Term Growth
Oil Price Increase, Dollar Crash
Low Oil Price
BL S5
S1 S6
S2 S8
S3 Moderate Recession CV Constant Severity
S4 Protracted Slump CS Consensus Scenario
Or expanded scenarios based on the Fed’s projections:
Forecasting Income Statements & Balance Sheets Using Industry Data 6

One Solution for Multiple Applications
Forecasting Income Statements & Balance Sheets Using Industry Data 7
Regulatory Stress Testing
» More accurate stress testing of the entire balance sheet and income statement.
» Industry benchmarks for internally-generated models.
Capital Planning
» Can be used to guide capital planning and budgeting.
» Make more informed enterprise risk management decisions.
Strategic Planning
» Evaluate portfolio growth and market share vs. the industry to identify strengths,
risks and opportunities.
» Inform M&A decisions based on a better understanding of value vs. the industry.
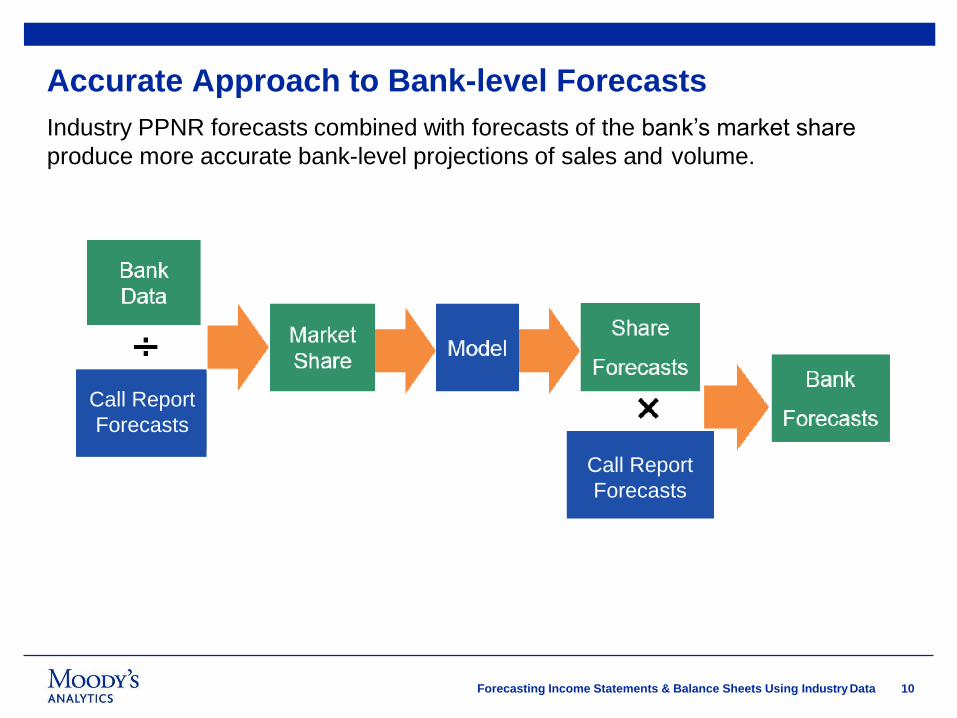
Accurate Approach to Bank-level Forecasts
Industry PPNR forecasts combined with forecasts of the bank’s market share
produce more accurate bank-level projections of sales and volume.
Call Report
Forecasts
Forecasting Income Statements & Balance Sheets Using Industry Data 10
Call Report
Forecasts

» Data sourced from FDIC Statistics on Depository Institutions (call report) database.
» Granular approach emphasizes internal forecast consistency across components.
» Forecasts based on Moody’s Analytics US Macro model for more than 1,800 economic
variables consistent with the latest CCAR scenarios.
» Forecasts updated quarterly.
» Scenarios updated monthly.
Robust Forecasting Methodology
Income Statement Categories
Net interest margin
Interest income
Interest expense
Non-interest income
Non-interest expense
Asset Categories
Total assets
Bank credit - Securities, C&I,
Mortgage, Consumer
Cash
Interbank loans
Tradinggains
Loan & lease losses
Liability Categories
Total liabilities
Deposits
Bank borrowing
Tradinglosses
Net due to related foreignoffices
Forecasting Income Statements & Balance Sheets Using Industry Data 9

Forecast financials based on a subset of your peers.
» Facilitates evaluation and forecasting of a bank’s competitive landscape.
» Custom peer groups can be defined by geography or from a list identified by the bank.
» Peer group forecasts can be used to form individual bank shares and forecasts.
Peer Group Analysis
Call Report
Forecasts
Forecasting Income Statements & Balance Sheets Using Industry Data 10

0
2,000
4,000
6,000
8,000
10,000
12,000
14,000
16,000
18,000
0
1
2
3
4
5
6
7
8
9
94 96 98 00 02 04 06 08 10 12 14 16
Peer Group (L) Industry (R)
11
Central Texas Peer Group and Industry Assets
Sources: FDIC Statistics on Depository Institutions, Moody’sAnalytics
$ bil

0.03
12
0.04
0.05
94 96 98 00 02 04 06 08 10 12 14 16
Peer Group Assets as a Share of Industry
Sources: FDIC Statistics on Depository Institutions, Moody’sAnalytics
Pct.

0
5
10
15
20
25
30
35
94 96 98 00 02 04 06 08 10 12 14 16 18 20
FNB TX Base Severe Extraco Base Severe
13
Net Loan and Lease Share Forecasts
Sources: FDIC Statistics on Depository Institutions, Moody’sAnalytics
Pct. of Peer Group

0
100
200
300
400
500
600
700
800
900
94 96 98 00 02 04 06 08 10 12 14 16 18 20
Actual Base Adverse Sev. Adverse
14
FNB Texas Net Loans and Leases Forecast
Sources: FDIC Statistics on Depository Institutions, Moody’sAnalytics
$ mil

10 12 14 16 18 20
Base Adverse Sev. Adverse
15
Extraco Net Loans and Leases Forecast
1,200
Actual
1,000
800
600
400
200
0
94 96 98 00 02 04 06 08
Sources: FDIC Statistics on Depository Institutions, Moody’sAnalytics
$ mil

Moody’s Analytics Bank Call Report Forecasts
Forecasting Income Statements & Balance Sheets Using Industry Data 18
Econometric forecasts of income statement and balance sheet under trusted
scenarios based on FDIC Call Report data.
» Forecasts at the industry, individual bank, and peer group level.
» Industry models more accurately capture the effects of macroeconomic variables.
» Bank-level models more realistically assess bank-specific factors affecting portfolio.
» Overcomes limitations due to sparse/noisy data influenced by bank-specific factors.
– History back to 1992, spanning several expansions and recessions.
– Eliminates internal factors such as management actions and M&Aactivity.
» Ability to forecast performance for individual competitors and peer groups.

© 2016 Moody’s Corporation, Moody’s Investors Service, Inc., Moody’s Analytics, Inc. and/or their licensors
and affiliates (collectively, “MOODY’S”). All rights reserved.
CREDIT RATINGS ISSUED BY MOODY'S INVESTORS SERVICE, INC. AND ITS RATINGS AFFILIATES
(“MIS”) ARE MOODY’S CURRENT OPINIONS OF THE RELATIVE FUTURE CREDIT RISK OF ENTITIES,
CREDIT COMMITMENTS, OR DEBT OR DEBT-LIKE SECURITIES, AND CREDIT RATINGS AND
RESEARCH PUBLICATIONS PUBLISHED BY MOODY’S (“MOODY’S PUBLICATIONS”) MAY INCLUDE
MOODY’S CURRENT OPINIONS OF THE RELATIVE FUTURE CREDIT RISK OF ENTITIES, CREDIT
COMMITMENTS, OR DEBT OR DEBT-LIKE SECURITIES. MOODY’S DEFINES CREDIT RISK AS THE
RISK THAT AN ENTITY MAY NOT MEET ITS CONTRACTUAL, FINANCIAL OBLIGATIONS AS THEY
COME DUE AND ANY ESTIMATED FINANCIAL LOSS IN THE EVENT OF DEFAULT. CREDIT RATINGS
DO NOT ADDRESS ANY OTHER RISK, INCLUDING BUT NOT LIMITED TO: LIQUIDITY RISK, MARKET
VALUE RISK, OR PRICE VOLATILITY. CREDIT RATINGS AND MOODY’S OPINIONS INCLUDED IN
MOODY’S PUBLICATIONS ARE NOT STATEMENTS OF CURRENT OR HISTORICAL FACT. MOODY’S
PUBLICATIONS MAY ALSO INCLUDE QUANTITATIVE MODEL-BASED ESTIMATES OF CREDIT RISK
AND RELATED OPINIONS OR COMMENTARY PUBLISHED BY MOODY’S ANALYTICS, INC. CREDIT
RATINGS AND MOODY’S PUBLICATIONS DO NOT CONSTITUTE OR PROVIDE INVESTMENT OR
FINANCIAL ADVICE, AND CREDIT RATINGS AND MOODY’S PUBLICATIONS ARE NOT AND DO NOT
PROVIDE RECOMMENDATIONS TO PURCHASE, SELL, OR HOLD PARTICULAR SECURITIES. NEITHER
CREDIT RATINGS NOR MOODY’S PUBLICATIONS COMMENT ON THE SUITABILITY OF AN
INVESTMENT FOR ANY PARTICULAR INVESTOR. MOODY’S ISSUES ITS CREDIT RATINGS AND
PUBLISHES MOODY’S PUBLICATIONS WITH THE EXPECTATION AND UNDERSTANDING THAT EACH
INVESTOR WILL, WITH DUE CARE, MAKE ITS OWN STUDY AND EVALUATION OF EACH SECURITY
THAT IS UNDER CONSIDERATION FOR PURCHASE, HOLDING, OR SALE.
MOODY’S CREDIT RATINGS AND MOODY’S PUBLICATIONS ARE NOT INTENDED FOR USE
BY RETAIL INVESTORS AND IT WOULD BE RECKLESS AND INAPPROPRIATE FOR RETAIL
INVESTORS TO USE MOODY’S CREDIT RATINGS OR MOODY’S PUBLICATIONS WHEN MAKING AN
INVESTMENT DECISION. IF IN DOUBT YOU SHOULD CONTACT YOUR FINANCIAL OR OTHER
PROFESSIONAL ADVISER.
ALL INFORMATION CONTAINED HEREIN IS PROTECTED BY LAW, INCLUDING BUT NOT LIMITED TO,
COPYRIGHT LAW, AND NONE OF SUCH INFORMATION MAY BE COPIED OR OTHERWISE
REPRODUCED, REPACKAGED, FURTHER TRANSMITTED, TRANSFERRED, DISSEMINATED,
REDISTRIBUTED OR RESOLD, OR STORED FOR SUBSEQUENT USE FOR ANY SUCH PURPOSE, IN
WHOLE OR IN PART, IN ANY FORM OR MANNER OR BY ANY MEANS WHATSOEVER, BY ANY
PERSON WITHOUT MOODY’S PRIOR WRITTEN CONSENT.
All information contained herein is obtained by MOODY’S from sources believed by it to be accurate and
reliable. Because of the possibility of human or mechanical error as well as other factors, however, all
information contained herein is provided “AS IS” without warranty of any kind. MOODY'S adopts all necessary
measures so that the information it uses in assigning a credit rating is of sufficient quality and from sources
MOODY'S considers to be reliable including, when appropriate, independent third-party sources. However,
MOODY’S is not an auditor and cannot in every instance independently verify or validate information received
in the rating process or in preparing the Moody’s Publications.
To the extent permitted by law, MOODY’S and its directors, officers, employees, agents, representatives,
licensors and suppliers disclaim liability to any person or entity for any indirect, special, consequential, or
incidental losses or damages whatsoever arising from or in connection with the information contained herein or
the use of or inability to use any such information, even if MOODY’S or any of its directors, officers,
employees, agents, representatives, licensors or suppliers is advised in advance of the possibility of such
losses or damages, including but not limited to: (a) any loss of present or prospective profits or (b) any loss or
damage arising where the relevant financial instrument is not the subject of a particular credit rating assigned by
MOODY’S.
To the extent permitted by law, MOODY’S and its directors, officers, employees, agents, representatives,
licensors and suppliers disclaim liability for any direct or compensatory losses or damages caused to any
person or entity, including but not limited to by any negligence (but excluding fraud, willful misconduct or any
other type of liability that, for the avoidance of doubt, by law cannot be excluded) on the part of, or any
contingency within or beyond the control of, MOODY’S or any of its directors, officers, employees, agents,
representatives, licensors or suppliers, arising from or in connection with the information contained herein or
the use of or inability to use any such information.
NO WARRANTY, EXPRESS OR IMPLIED, AS TO THE ACCURACY, TIMELINESS, COMPLETENESS,
MERCHANTABILITY OR FITNESS FOR ANY PARTICULAR PURPOSE OF ANY SUCH RATING OR
OTHER OPINION OR INFORMATION IS GIVEN OR MADE BY MOODY’S IN ANY FORM OR MANNER
WHATSOEVER.
Moody’s Investors Service, Inc., a wholly-owned credit rating agency subsidiary of Moody’s Corporation
(“MCO”), hereby discloses that most issuers of debt securities (including corporate and municipal bonds,
debentures, notes and commercial paper) and preferred stock rated by Moody’s Investors Service, Inc. have,
prior to assignment of any rating, agreed to pay to Moody’s Investors Service, Inc. for appraisal and rating
services rendered by it fees ranging from $1,500 to approximately $2,500,000. MCO and MIS also maintain
policies and procedures to address the independence of MIS’s ratings and rating processes. Information
regarding certain affiliations that may exist between directors of MCO and rated entities, and between entities
who hold ratings from MIS and have also publicly reported to the SEC an ownership interest in MCO of more
than 5%, is posted annually at www.moodys.com under the heading “Investor Relations — Corporate
Governance — Director and Shareholder Affiliation Policy.”
Additional terms for Australia only: Any publication into Australia of this document is pursuant to the Australian
Financial Services License of MOODY’S affiliate, Moody’s Investors Service Pty Limited ABN 61 003 399
657AFSL 336969 and/or Moody’s Analytics Australia Pty Ltd ABN 94 105 136 972 AFSL 383569 (as
applicable). This document is intended to be provided only to “wholesale clients” within the meaning of section
761G of the Corporations Act 2001. By continuing to access this document from within Australia, you represent to
MOODY’S that you are, or are accessing the document as a representative of, a “wholesale client” and that
neither you nor the entity you represent will directly or indirectly disseminate this document or its contents to
“retail clients” within the meaning of section 761G of the Corporations Act 2001.
MOODY’S credit rating is an opinion as to the creditworthiness of a debt obligation of the issuer, not on the
equity securities of the issuer or any form of security that is available to retail investors. It would be reckless
and inappropriate for retail investors to use MOODY’S credit ratings or publications when making an
investment decision. If in doubt you should contact your financial or other professional adviser.
Additional terms for Japan only: Moody's Japan K.K. (“MJKK”) is a wholly-owned credit rating agency
subsidiary of Moody's Group Japan G.K., which is wholly-owned by Moody’s Overseas Holdings Inc., a
wholly-owned subsidiary of MCO. Moody’s SF Japan K.K. (“MSFJ”) is a wholly-owned credit rating agency
subsidiary of MJKK. MSFJ is not a Nationally Recognized Statistical Rating Organization (“NRSRO”).
Therefore, credit ratings assigned by MSFJ are Non-NRSRO Credit Ratings. Non-NRSRO Credit Ratings
are assigned by an entity that is not a NRSRO and, consequently, the rated obligation will not qualify for
certain types of treatment under U.S. laws. MJKK and MSFJ are credit rating agencies registered with the
Japan Financial Services Agency and their registration numbers are FSA Commissioner (Ratings) No. 2
and 3 respectively.
MJKK or MSFJ (as applicable) hereby disclose that most issuers of debt securities (including corporate and
municipal bonds, debentures, notes and commercial paper) and preferred stock rated by MJKK or MSFJ (as
applicable) have, prior to assignment of any rating, agreed to pay to MJKK or MSFJ (as applicable) for
appraisal and rating services rendered by it fees ranging from JPY200,000 to approximately JPY350,000,000.
MJKK and MSFJ also maintain policies and procedures to address Japanese regulatory requirements.

Forecasting Income Statements & Balance Sheets Using Industry Data 19
Moody's Analytics
+1.610.235.5299
moodysanalytics.com