forecasting stock market using wavelet transforms and...
TRANSCRIPT

Int. J. Fin. Acco. Eco. Stu. Vol. 2 / No.7 / Autumn 2012 & Winter 2013
83
Forecasting Stock Market Using Wavelet Transforms and Neural
Networks: An integrated system based on Fuzzy Genetic algorithm
(Case study of price index of Tehran Stock Exchange)
Ali Asghar Anvary Rostamy Professor, Accounting and Finance Department, Faculty of Management and Economics, Tarbiat Modares University (TMU).
(Corresponding Author)
Noraddin Mousazadeh Abbasi Master in Accounting, Faculty of Management and Economics, Tarbiat Modares University (TMU).
Mohammad Ali Aghaei Assistant Professor, Accounting and Finance Department, Faculty of Management and Economics, Tarbiat Modares University
Mahdi Moradzadeh Fard Assistant Professor, Accounting and Finance Department, Islamic Azad University, Karaj Branch.
Abstract
The jamor purpose of the present research is to predict the total stock market index of Tehran
Stock Exchange, using a combined method of Wavelet transforms, Fuzzy genetics, and neural
network in order to predict the active participations of finance market as well as macro decision
makers. To do so, first the prediction was made by neural network, then a series of price index was
decomposed by wavelet transform and the prediction made by neural network was repeated, finally,
the extracted pattern from the neural network was stated through discernible rules using Fuzzy theory.
The main focus of this paper is based on a theory in which investors and traders achieve a method for
predicting stock market. Concerning the results of previous researches, which confirmed the relative
superiority of non-linear models in price index prediction, an appropriate model has been offered in
this research by combining the non-linear methods such as Wavelet transforms, Fuzzy genetics, and
neural network, The results indicated the superiority of the designed system in predicting price index
of Tehran Stock Exchange.
Keywords: Artificial neural network, Wavelet Transforms, Genetic Algorithm, Fuzzy Theory and
Fuzzy Genetic System.
Receipt: 18 , 10 , 2012 Acceptance: 15 , 1 , 2013

84 / Forecasting Stock Market Using Wavelet Transforms and Neural Networks: …
Vol.2 / No.7 / Autumn 2012 & Winter 2013
1. Introduction and Review of the
Related Literature
Forecasting for stock price trend is a major
requirement of planning. The stock market has
become the main outlet for investment recently
in many countries such as Iran. The futures
indicator, investment foundations, foreign
capitals are diverse choices for investors.
(Chang et al,2009 )
Two common analytical approaches to
stock market analysis are fundamental and
technical analysis. A fundamental analysis
relies on the statistics of the macroeconomics data such as interest rates, money supply,
inflationary rates, and foreign exchange rates,
as well as the basic financial status of a
company. After taking all these factors into
account, the analyst can then make a decision
to sell or buy a stock. A technical analysis is
based on the historical financial time-series
data. However, financial time series exhibit
quite complicated patterns (for example, trends,
abrupt changes, and volatility clustering) and
such series are often nonstationary, whereby a
variable has no clear tendency to move to a fixed value or a linear trend. During the last
decade, stocks and future traders have come to
rely upon various types of intelligent systems
to make trading decisions. Lately, artificial
neural networks (ANNs) have been applied to
this area (Aiken & Bsat, 1999; Chang, Wang,
& Yang, 2004; Chi, Chen, & Cheng, 1999;
Kimoto & Asakawa, 1990; Lee, 2001; Yao &
Poh, 1995; Yoon & Swales, 1991).
Other soft computing methods are also
applied in the prediction of stock price. These approaches are to use quantitative inputs, like
technical indices, and qualitative factors, like
political effects, to automate stock market
forecasting and trend analysis. Kuo, Chen, and
Hwang (2001) used a genetic algorithm base
fuzzy neural network to measure the qualitative
effects on the stock price. They applied their
system to the Taiwan stock market. Aiken and
Bsat (1999) used a FNN trained by a genetic
algorithm (GA) to forecast three-month US
Treasury Bill rates. They concluded that a neural network (NN) can be used to accurately
predict these rates.
Stock market forecasters focus on
developing approaches to successfully
forecast/predict index values or stock prices,
aiming at high profits using well defined
trading strategies. ‘‘The central idea to
successful stock market prediction is achieving
best results using minimum required input data
and the least complex stock market model”
(George & Kimon,2009). Considering this idea an obvious complexity of the problem paves
the way for the importance of intelligent
prediction paradigms (Abraham et al, 2001).
Studying literature shows, Forecasting
techniques has advantages and disadvantages.
One approach to deal with complex real-world
problems is to integrate the use of several AI
technologies in order to combine their different
strengths and overcome a single technology’s
weakness to generate hybrid models that
provides better results than the ones achieved with the use of each isolated technique. Using
hybrid models or combining several models
has become a common practice to improve
forecasting accuracy and the literature on this
topic has expanded dramatically (Khashei et al,
2009).
Since decision making is always carried on
with uncertainty, we are seeking to model
uncertainty in decisions related to value
investigating and to offer a method
compounding Wavelet transforms and Fuzzy theory and Genetic algorithm and neural
networks in order to predict price index of
Tehran Stock Exchange.(TEPIX)
Tang et al (2010) proposed a model for the
prediction of stock prices, using a compound of
wavelet transform, recurrent neural network
and bee colony algorithm. First, they
disintegrated the price time series using har
wavelet then the prediction was done by
recurrent neural network and the obtained
weights of neural network were optimized by
bee colony algorithm. The offered model was examined on data of Dow Jones Industrial
Average (DJIA), FTSE 100 index, London
Stock Exchange (FTSE), Nikkei 225, Tokyo
Stock Exchange (Nikkei) and Taiex index,
Taiwan Stock Exchange. The given model was
compared to compound model of neural
network and bee colony algorithm, Fuzzy time

International Journal of Finance, Accounting and Economics Studies / 85
Vol.2 / No.7 / Autumn 2012 & Winter 2013
series and Fuzzy neural network (ANFIS). The
suggested model had less error than the other
models in the all examined cases.
Hadavandi et al (2010) proposed a model
for the prediction of stock price, using a
compound of neural network and Fuzzy
genetic. They examined the mentioned model
on gathered information for IT and airline
industry of New York Stock Exchange. The suggested model was compared to ARIMA and
genetic algorithm and neural network which
were used in prediction and in all cases it
resulted better than the previous models.
Kuo et al (2001) proposed a genetic
algorithm based fuzzy neural network (GFNN)
to formulate the knowledge base of fuzzy
inference rules which could measure the
qualitative effect on the stock market. Next, the
effect was further integrated with the technical
indexes through the artificial neural network. An example based on the Taiwan stock market
was utilized to assess the proposed intelligent
system. Evaluation results indicated that the
neural network considering both the
quantitative and qualitative factors
excels the neural network considering only
the quantitative factors both in the clarity of
buying–selling points and buying–selling
performance.
Wang (2002) proposed a hybrid model that
uses a data mart to reduce the size of stock data and combined fuzzification techniques with the
grey theory to develop a fuzzy grey prediction
to predict stock price in Taiwan stock market.
He concluded that the proposed
model can effectively help stock dealers
deal with day trading.
Chang and Liu (2008) used a Takagi–
Sugeno–Kang (TSK) type fuzzy rule based
system (FRBS) for stock price prediction. They
used simulated annealing (SA) for training the
best parameters of fuzzy systems. They found
that the forecasted results from TSK fuzzy rule based model were much better than those of
back propagation network (BPN) or multiple
regressions.
Hung (2009) proposed a new application of
fuzzy systems designed for a generalized auto-
regressive conditional heteroskedasticity
(GARCH) model to forecast stock returns. The
optimal parameters of the fuzzy membership
functions and GARCH model were extracted
using a GA to achieve a global optimal solution
with a fast convergence rate for this fuzzy
GARCH model estimation problem. The
proposed model was also compared with the
other methods, such as GARCH, EGARCH
and outperformed them.
Majhi et al (2009) proposed a trigonometric functional link artificial neural network
(FLANN) model for short (one-day) as well as
long term (one month, two months) prediction
of stock price of leading stock market indices:
DJIA and S&P 500. They concluded that
proposed model is an effective approach both
computationally as well as performance wise to
foresee the market levels both in short and
medium terms future.
In 2007 Chung et al used a Fuzzy time
series model for short-term prediction of Taiwan and Hong Kong stock market price.
The obtained experimental results of this
research indicate the fact that the traditional
statistical method and offered model both
makes it clear that stock price patterns are
short-term in these two markets.
Lin et al (2007) used the genetic algorithm
to predict stock market. The significant factor
in a trading rule success is the selection of
degrees for all parameters and their
combinations. However, the range of parameters changes in a large area and the
problem is to find the optimum parameter
combinations. Genetic algorithm is used in this
article to solve the problem.
Chen et al in 2007 used Fuzzy time series
based on Fibonacci sequence to predict stock
price. A time period of five years of data for
TSMC and a time period of 13 years for
TAIEX was taken in this research. The
obtained model is superior to the prevalent
Fuzzy time series model.
A review of existing literature indicates that traditional predicting methods have been
mostly used in Tehran Stock Exchange and
other areas in the world. Concerning the fact
that in making use of the traditional pattern,
one should use static time series and since most
economic time series are non-static, the
traditional patterns are faced with a great

86 / Forecasting Stock Market Using Wavelet Transforms and Neural Networks: …
Vol.2 / No.7 / Autumn 2012 & Winter 2013
prediction troublesome. Moreover, the artificial
intelligence methods do not meet the problems
of the traditional methods because of
concerning static time series. Regarding these
issues, wavelet transforms are utilized to
combine one of the capable artificial
intelligences’ algorithm called genetic
algorithm to neural network and fuzzy concepts
in order to offer a prediction method for price index of Tehran Stock Exchange. (TEPIX)
1.2. Methodology
1.2.1. Wavelet transforms Wavelet theory is applied for data
preprocessing, since the representation of a wavelet can deal with the non-stationarity
involved in the economic and financial time
series (Ramsey, 1999). The key property of
wavelets for economic analysis is
decomposition by time scale. Economic and
financial systems contain variables that operate
on various time scales simultaneously; thus, the
relations between variables may differ across
time scales. One of the benefits of the wavelet
approach is that it is flexible in handling highly
irregular data series (Popoola & Ahmad, 2006).
This study applies the Daubechies wavelet as the main wavelet transform tool. A wavelet
not only decomposes the data interms of times
and frequency, but also significantly reduces
the processing time. Let n denote the time
series size, then the wavelet decomposition
used in this study can be determined in O (n)
time (Abramovich et al, 2002) Wavelets theory
is based on Fourier analysis, which represents
any function as the sum of the sine and cosine
functions. A wavelet (t) is simply a function of time t that obeys a basic rule, known as the
wavelet admissibility condition (Gancay,
2002):
∫। ( )।
df (1)
Where (f) is the Fourier transform and a
function of frequency f, of (t). The wavelet
transform (WT) is a mathematical tool that can be applied to numerous applications, such as
image analysis and signal processing. It was
introduced to solve problems associated with
the Fourier transform as they occur. This
occurrence can take place when dealing with
non-stationary signals, or when dealing with
signals that are localized in time, space, or
frequency. Depending on the normalization
rules, there are two types of wavelets within a
given function/family. Father wavelets describe
the smooth and low-frequency parts of a signal, and mother wavelets describe the detailed and
high-frequency components. In the following
equations, (2a) represents the father wavelet
and (2b) represents the mother wavelet, with
j=1, . . ., J in the J-level wavelet
decomposition: (Ramsey et al, 1998)
= ( )
(2a)
= ( ) (2b)
Where J denotes the maximum scale
sustainable by the number of data points and
the two types of wavelets stated above, namely
father wavelets and mother wavelets, and
satisfies:
∫ ( ) =1and∫ ( ) (3)
Time series data, i.e., function f(t), is an
input represented by wavelet analysis, and can
be built up as a sequence of projections onto
father and mother wavelets indexed by both
{k}, k = {0, 1, 2,. . .} and by {s}= , {j=1,2,3,. . .J}. Analyzing real discretely sampled data
requires creating a lattice for making
calculations. Mathematically, it is convenient
to use a dyadic expansion, as shown in
equation (3). The expansion coefficients are
given by the projections:
∫ ( )
∫ ( ) ( ) (4)
The orthogonal wavelet series approximation to
f (t) is defined by:
F(t) = ∑ ( ) ∑ ( ) ∑ ( ) ∑ ( )
(5)

International Journal of Finance, Accounting and Economics Studies / 87
Vol.2 / No.7 / Autumn 2012 & Winter 2013
Another brief form can also be represented:
F(t) = ( ) ( ) ( ) ( )
( ) ∑ ( )
( ) ∑ ( ) (6)
The WT is used to calculate the coefficient
of the wavelet series approximation in Eq. (5)
for a discrete signal , , … , with finite
extent. The WT maps the vector f = ( , , …
, ) to a vector of n wavelet coefficients w=
( , , … , ), which contains both the
smoothing coefficient and the detail
coefficients , j = 1,2, . . ., J. The symbol
describes the underlying smooth behavior
of the signal at coarse scale , while
describes the coarse scale deviations from the
smooth behavior, and , . . . ,
provides progressively finer scale deviations
from the smooth behavior (Adel et al, 2006).
When n is divisible by , contains
n/2 observations at the finest scale = 2, and
n/4 observations in at the second finest
scale, = 2. Likewise, each of and
contain n/ observations, where
n= ⁄ + ⁄ +…+ ⁄ + ⁄ (7)
Let f (t) denote the original data, ,
represents an approximation signal, and is a
detailed signal. This study defines the multi-
resolution decomposition of a signal by
specifying: is the coarsest scale and =
+ . Generally, = + where { ,
,. . ., } is a sequence of multi-resolution
approximations of the function f(t), with ever increasing levels of refinement. The
corresponding multi-resolution decomposition
of f(t) is given by{ , , ,. . . ,. .. , }.
The sequence of terms , , ,. . ., ,. .
., represents a set of orthogonal signal
components that represent the signal at
resolutions 1to J. Each provides the
orthogonal increment to the representation of
the function f (t) at the scale (or
resolution) .
When the data pattern is very rough, the
wavelet process is repeatedly applied. The aim
of preprocessing is to minimize the Root Mean
Squared Error (RMSE) between the signal
before and after transformation. The noise in
the original data can thus be removed.
Importantly, the adaptive noise in the training
pattern may reduce the risk of overfitting in
training phase (Patterson, 1996). Thus, we adopt WT twice for the preprocessing of
training data in this study.
1.2.2. Genetic Algorithm Inspired by evolution theory and heredity
and genetic principles, genetic algorithm seeks
to find an appropriate solution for problems
(Goldberg, 1989). To do so, first some
accidental response are produced to the given problem and these primary responses are then
evolved, using genetic principles and are
converted to the appropriate response.
In the following part, genetics algorithm steps
will be explained (Haupt, 1980)
1) First generation production: The production
of Npop accidental responses to the problem,
each of which being appropriately codified
in form of a chromosome.
2) Valuation: The criterion function
determines the value of each chromosome with respect to their success in solving the
problem. The best chromosome of each
generation is called the elite chromosome.
3) The chromosomes are ordered descendingly
according to criterion function and only
%X of chromosomes are preserves and the
rest will be thrown away. The possibility of
a chromosome’s conservation depends on
its merit in such a way that those
chromosomes which worth more, one more
possible to survive. To substitute the
thrown away chromosomes, those remained ones are chosen two by two as parents to
generate chromosomes of the child. There
are different methods for parents’ selection.
The Tournament Selection has been used in
this article. First, a small collection of
chromosomes is accidentally selected in
this method and then the two chromosomes
88 / Forecasting Stock Market Using Wavelet Transforms and Neural Networks: …
Vol.2 / No.7 / Autumn 2012 & Winter 2013
with the highest value are selected as
parents.
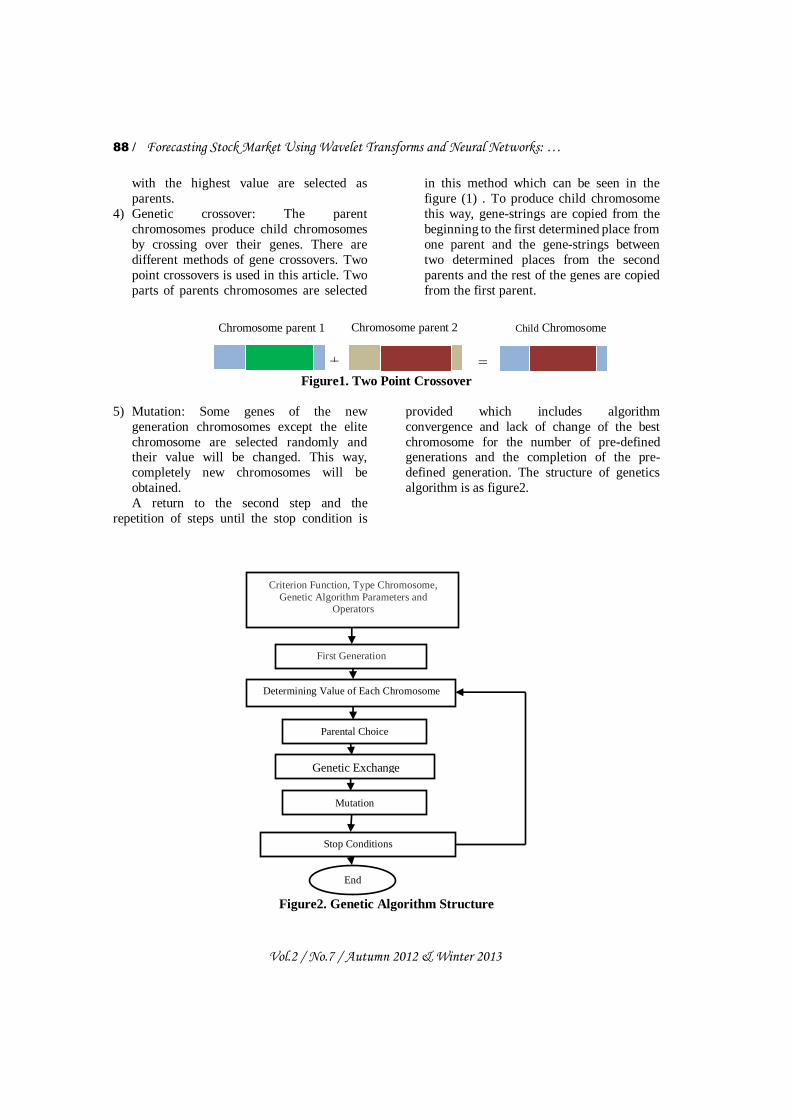
4) Genetic crossover: The parent
chromosomes produce child chromosomes
by crossing over their genes. There are
different methods of gene crossovers. Two
point crossovers is used in this article. Two
parts of parents chromosomes are selected
in this method which can be seen in the
figure (1) . To produce child chromosome
this way, gene-strings are copied from the
beginning to the first determined place from
one parent and the gene-strings between
two determined places from the second
parents and the rest of the genes are copied
from the first parent.
Figure1. Two Point Crossover
5) Mutation: Some genes of the new
generation chromosomes except the elite
chromosome are selected randomly and their value will be changed. This way,
completely new chromosomes will be
obtained.
A return to the second step and the
repetition of steps until the stop condition is
provided which includes algorithm
convergence and lack of change of the best
chromosome for the number of pre-defined generations and the completion of the pre-
defined generation. The structure of genetics
algorithm is as figure2.
Figure2. Genetic Algorithm Structure
Criterion Function, Type Chromosome,
Genetic Algorithm Parameters and Operators
First Generation
Determining Value of Each Chromosome
Parental Choice
Stop Conditions
End
Genetic Exchange
Mutation
=
Chromosome parent 1 Chromosome parent 2
2
Child Chromosome
+

International Journal of Finance, Accounting and Economics Studies / 89
Vol.2 / No.7 / Autumn 2012 & Winter 2013
1.2.2.1. Extracting rule from neural
network: The major and main disadvantage of
artificial neural networks is their disability in explanation and analysis. (Anderson et al,
1996). Neural networks are like continuous
black boxes which make it difficult for neural
network to perceive a solution. (Mantas et al,
2006). Therefore, the information used by
neural network to achieve the solution is not
clear to the users and that may cause trouble in
some cases. (Huang, 2002)
To solve this problem, researchers tended to
create a palpable and understandable technique
for neural network. They believe that they could achieve their goal by extracting the
produced rule of neural network. (Huang,
2002) The purported form of extracting a rule
from the neural network is in the following
way. (figure3)
Figure3. Rule Extraction Structure
We use genetic Fuzzy system in this
research to extract rule from neural network
whose basic concepts are defined in the
following way:
Membership function: Every single input
variable is transformed from the numerical
form to Fuzzy form using fuzzy
membership functions.
Information base: This section includes
necessary information about input and output variables and their governing rules.
This section is itself constituted of
databases and rule bases.
Database: This section provides necessary
definition about membership functions
related to verbal terms and functions.
Rule bases: This section is constructed of
rules in conditional sentence form of “if-
then” which are used to determine the
output.
Inference system: In this section, the
controlling output is determined regarding Fuzzy making input, the information of rule
bases and using fuzzy concluding methods.
Difuzzifier: Difuzzifier displays the output
Fuzzy set of conclusion system at a non-
Fuzzy point. Actually, this section
determines a point which is the best
representative of Fuzzy collection.
The purported form of genetic Fuzzy system is
in the following way (figure4):
Figure4. Genetic Algorithm System
Information Base
output input
Learning Process based on Genetic Algorithm
Rule
Base
Data
Base
Difuzz-
ifier
Inference System
Fuzzif-
ier
Neural
Networ
k
Rule
Extraction
Algorithm Rule
Set

90 / Forecasting Stock Market Using Wavelet Transforms and Neural Networks: …
Vol.2 / No.7 / Autumn 2012 & Winter 2013
1.2.3. Research methodology
This research is carried out based on two
dimensions: it is practical because of its
purposes and it’s analytical-descriptive because
of its nature. A descriptive method combination
including utilizing different related books and
essays have been used to collect materials
related to the research background. As well,
reports of Stock Exchange Corporation and websites have been used to gather data for
research information. Framework of proposed
method has shown in Figure5.
Figure5. Framework of W-FGA-NN
1.3. Results and Discussion
The daily price index of Tehran Stock
Exchange from 2005 to 2011 has been selected
as the statistical population, 1383 data were
accumulated for each variable from related
databases in the aforementioned period. The
above-mentioned data were divided to two
groups of training and experimental regarding the structure of neural network. Each group is
respectively consisted of 1341 and 42 data and
it should be also noted that mainly the
accomplished prediction for the experimental
period was selected as the comparison criterion
for models used in prediction. In this study, 15
economic variables have been extracted by
using (Gan et al, 2006 ; M. Ibrahim et al,2003;
Adam,2008; Gay et al, 2008) the explanation
that illustrates the relationship between
economic variables and stock market with
special focus on Johnson’s co-integration method considering the economic situation of
Iran. Principal Component Analysis (PCA) was
performed for refining data and eliciting 4
variables (S&P 500, oil price, exchange rate)
that explain 89.3% of changing these data.
After that the stock market forecasting has been
defined.
Methods of price index modeling will be
explained in this section:
Preparing data is one of the complicated
steps of neural network applications, since the best condition for neural network is when all
the inputs and outputs are between 0 and 1.
One of the reasons which emphasizes on
inserting inputs in range of 0 and 1 is the fact
that transfer functions (such as sigmoid
function) are unable to differentiate between
large amounts. Therefore, the whole data were
normalized using this formula: Xn=X/Xmax
Then, variables of S&P500 index of New
York Exchange Stock, world gold price, Iran
basket crude oil price and state dollar value were determined as neural network concerning
studies based on the effective elements on price
index. Prediction using MLP is made in such a
way that the best output weight with the least
prediction error is selected by imposing
training and learning on the network. After
normalizing data, they were given to the
network. That is, data were delivered to two
groups in order to examine the consistency of
the output weight focusing on a way that first
acquisiton is done according to obtained data
from predictions in order to examine the accuracy of network prediction. About %97 of
the total data were considered as training data
and the rest were used to examine the network.
The amount of network learning was
continuously examined during the learning
process and finally a network with the least
error was selected. The parameters of final
Fundamental factors and technical index data
( )
Data preprocessing by wavelet transform
Choosing the most influential factor by principal component analysis (PCA)
NN forecasting
Rule extraction by Fuzzy Genetic Algorithm
Performance evaluation
International Journal of Finance, Accounting and Economics Studies / 91
Vol.2 / No.7 / Autumn 2012 & Winter 2013
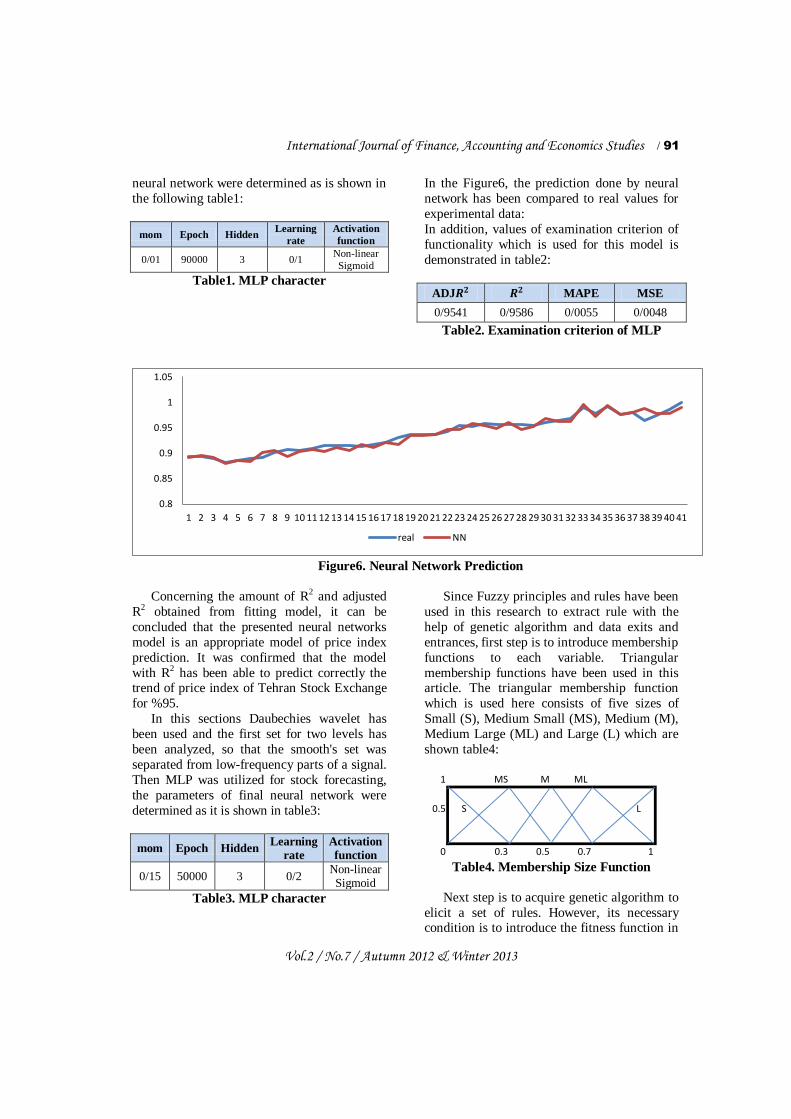
neural network were determined as is shown in
the following table1:
Activation
function
Learning
rate Hidden Epoch mom
Non-linear
Sigmoid 0/1 3 90000 0/01
Table1. MLP character
In the Figure6, the prediction done by neural
network has been compared to real values for
experimental data:
In addition, values of examination criterion of
functionality which is used for this model is
demonstrated in table2:
MSE MAPE ADJ
0/0048 0/0055 0/9586 0/9541
Table2. Examination criterion of MLP
Figure6. Neural Network Prediction
Concerning the amount of R2 and adjusted
R2 obtained from fitting model, it can be
concluded that the presented neural networks
model is an appropriate model of price index
prediction. It was confirmed that the model
with R2 has been able to predict correctly the trend of price index of Tehran Stock Exchange
for %95.
In this sections Daubechies wavelet has
been used and the first set for two levels has
been analyzed, so that the smooth's set was
separated from low-frequency parts of a signal.
Then MLP was utilized for stock forecasting,
the parameters of final neural network were
determined as it is shown in table3:
Activation
function
Learning
rate Hidden Epoch mom
Non-linear Sigmoid
0/2 3 50000 0/15
Table3. MLP character
Since Fuzzy principles and rules have been
used in this research to extract rule with the
help of genetic algorithm and data exits and
entrances, first step is to introduce membership
functions to each variable. Triangular
membership functions have been used in this article. The triangular membership function
which is used here consists of five sizes of
Small (S), Medium Small (MS), Medium (M),
Medium Large (ML) and Large (L) which are
shown table4:
Table4. Membership Size Function
Next step is to acquire genetic algorithm to
elicit a set of rules. However, its necessary condition is to introduce the fitness function in
0.8
0.85
0.9
0.95
1
1.05
1 2 3 4 5 6 7 8 9 1011121314151617181920212223242526272829303132333435363738394041
real NN
MLMMS1
LS0.5
10.70.50.30
92 / Forecasting Stock Market Using Wavelet Transforms and Neural Networks: …
Vol.2 / No.7 / Autumn 2012 & Winter 2013
order to begin learning genetic algorithm and
achieve appropriate rules. Fitness function is
the least space between the estimated output by
genetic algorithm and MLP network output in
this research which is selected as the
appropriate rules.
There are different parameters in genetic
algorithm as well in order to train and learn
genetic algorithm whose sizes are selected through trial and error methods to reach
appropriate rules. After learning with so much
of these parameters, Fuzzy genetic algorithm
was finally selected as the final model with the
following parameters.
Chromoso
me Size
Iterati
on
Swar
m
Size
Cro
ss
pro
b
Mutati
on
prob
Members
hip Size
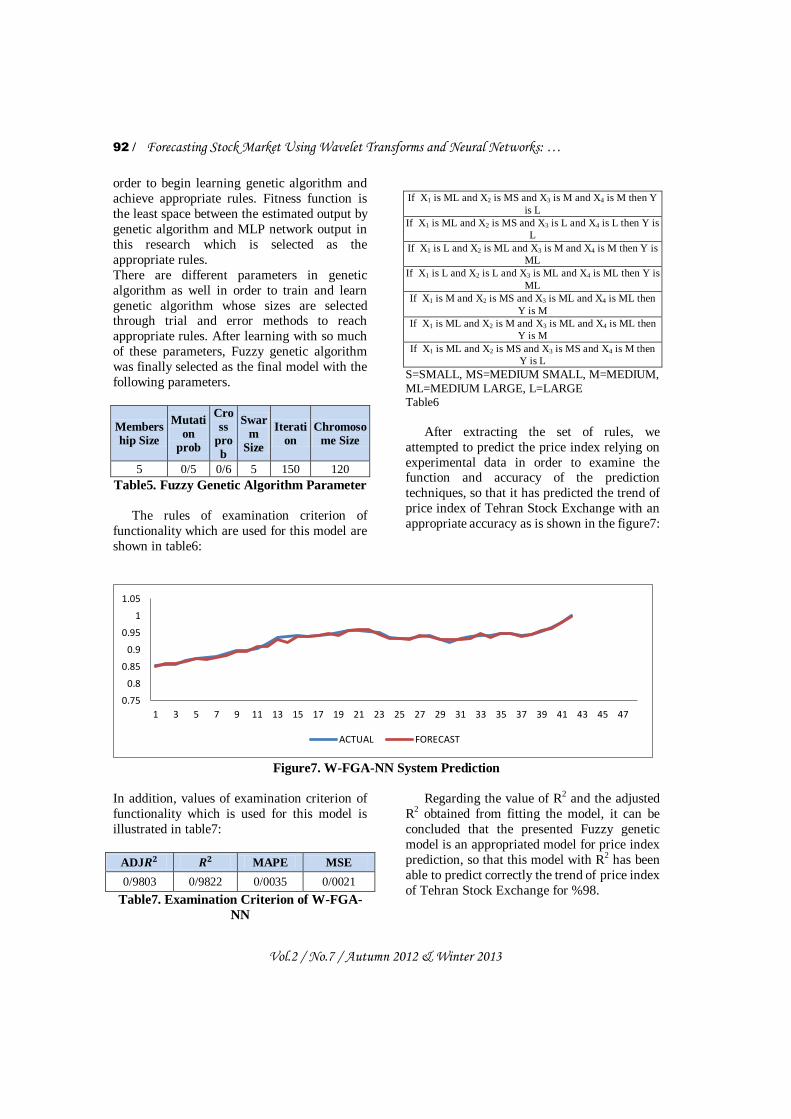
120 150 5 0/6 0/5 5
Table5. Fuzzy Genetic Algorithm Parameter
The rules of examination criterion of
functionality which are used for this model are
shown in table6:
If X1 is ML and X2 is MS and X3 is M and X4 is M then Y
is L
If X1 is ML and X2 is MS and X3 is L and X4 is L then Y is
L
If X1 is L and X2 is ML and X3 is M and X4 is M then Y is
ML
If X1 is L and X2 is L and X3 is ML and X4 is ML then Y is
ML
If X1 is M and X2 is MS and X3 is ML and X4 is ML then
Y is M
If X1 is ML and X2 is M and X3 is ML and X4 is ML then
Y is M
If X1 is ML and X2 is MS and X3 is MS and X4 is M then
Y is L
S=SMALL, MS=MEDIUM SMALL, M=MEDIUM,
ML=MEDIUM LARGE, L=LARGE Table6
After extracting the set of rules, we
attempted to predict the price index relying on
experimental data in order to examine the function and accuracy of the prediction
techniques, so that it has predicted the trend of
price index of Tehran Stock Exchange with an
appropriate accuracy as is shown in the figure7:
Figure7. W-FGA-NN System Prediction
In addition, values of examination criterion of
functionality which is used for this model is
illustrated in table7:
MSE MAPE ADJ
0/0021 0/0035 0/9822 0/9803
Table7. Examination Criterion of W-FGA-
NN
Regarding the value of R2 and the adjusted
R2 obtained from fitting the model, it can be
concluded that the presented Fuzzy genetic
model is an appropriated model for price index
prediction, so that this model with R2 has been
able to predict correctly the trend of price index
of Tehran Stock Exchange for %98.
0.75
0.8
0.85
0.9
0.95
1
1.05
1 3 5 7 9 11 13 15 17 19 21 23 25 27 29 31 33 35 37 39 41 43 45 47
ACTUAL FORECAST

International Journal of Finance, Accounting and Economics Studies / 93
Vol.2 / No.7 / Autumn 2012 & Winter 2013
1.4. Conclusion The general goal of the current research
was to offer an appropriate model for price
index prediction of Tehran Stock Exchange.
Concerning the results of previous researches
which confirm the relative superiority of non-linear models in price index prediction, an
appropriate model has been offered in this
research by combining the non-linear methods
including Wavelet transforms, Neural
networks, and genetics algorithm with Fuzzy
theory in order to predict price index of Tehran
Stock Exchange. The technique we used for
price index prediction has had a better result, as
shown in table8, Regarding the R2 examination
criterion, these techniques also indicated its
relative superiority when compared to neural
network technique, ARIMA and Fuzzy Genetic Algorithm (FGA). The extracted rules can help
the investors in their decision making related to
investment.
MSE MAPE R2 R2 ADJ
MLP 0/0048 0/0055 0/9586 0/9541
ARIMA(3,1,2) 0/0088 0/0075 0/9333 0/9263
FGA 0/0042 0/0050 0/9673 0/9656
W-FGA-NN 0/0021 0/0035 0/9822 0/9803
Table8. Comparison Method
References
Abraham,A., & B. Nath, P.K.
Mahanti.(2001). Hybrid intelligent systems
for stock market analysis, in: V.N.
Alexandrov, J. Dongarra, B.A. Julianno,
R.S. Renner, C.J.K. Tan (Eds.), Computational Science, Springer-Verlag,
Germany, pp. 337–345.
Abramovich,F. & Besbeas,P.&
Sapatinas,T.(2002). Empirical Bayes
approach to block wavelet function
estimation. Computational Statistics and
Data Analysis , 435–451.
Adam, A,M. & Twenboah, G. (2008).
Macroeconomic factors and stock market
movement: Evidence Ghana, Monich
Personal RePEc Archive.
Aiken, M., & Bsat, M. (1999). Forecasting
market trends with neural networks.
Information Systems Management, 16(4),
42–48.
Anderson J.A. ( 1996). Neural models with
cognitive implications. In Basic Processes
in Reading Perception and
Comprehension Models, pp.27-90.
Chen, T,L.,& Cheng, C,H.,& Teoh, H,
Jong. (2007). Fuzzy time-series basedon Fibonacci sequence for stock price
forecasting. Physica A 380, 377–390.
Chang, P, C., & Liu, C, H. (2008). A TSK
type fuzzy rule based system for stock price
prediction, Expert Systems with
Applications 34, 135–144.
Chang, P. C., Chen, H.L., & Jun, L.L., &
Chin, Y.F,, & Celeste, S.P.Ng.(2009) . A
neural network with a case based dynamic
window for stock trading prediction. Expert
Systems with Applications,36,6889-6898.
Chang, P. C., Wang, Y. W., & Yang, W. N. (2004). An investigation of the hybrid
forecasting models for stock price variation
in Taiwan. Journal of the Chinese Institute
of Industrial Engineering, 21(4), 358–368.
Chi, S. C., Chen, H. P., & Cheng, C. H.
(1999). A forecasting approach for stock
index future using Grey theory and neural
networks. In IEEE international joint
conference on neural networks (pp. 3850–
3855).
Gay, R,D.(2008). Effect of macroeconomic variable on stock market returns for four
emerging economies: Brazil, Russia, India
and China, International Business and
Economics Research Journal 7, 8.
Gan, C., & Lee, M., &Yong, H.H.A, &
Zhang, I. (2006). Macroeconomic variables
and stock market interactions: New Zealand
evidence. Investment management and
financial innovations,3.
Gencay,R. & Selcuk,F. &
Whitcher,B.(2002). An Introduction to Wavelets and Other Filtering Methods in
Finance and Economics. Academic Press,
New York .
Goldberg,D. (1989). Genetic Algorithms in
Search, Optimization and Machine
Learning , Addison-Wesley.

94 / Forecasting Stock Market Using Wavelet Transforms and Neural Networks: …
Vol.2 / No.7 / Autumn 2012 & Winter 2013
George,S,A., & Kimon,P,V.(2009)
.Surveying stock market forecasting
techniques – Part II: soft computing
methods, Expert Syst. Appl. 36, 5932–
5941.
Hadavandi,E.,& H, Shavandi , A, Ghanbari.
(2010). Integration of genetic fuzzy systems
and artificial neural networks for stock price forecasting. Knowledge based system
23, 800-808.
Haupt, R,L., & Haupt, S,E. (1980).
Practical Genetic Algorithms. Second
Edition.
Hung, J,C.(2009).A fuzzy GARCH model
applied to stock market scenario using a
genetic algorithm, Expert Syst. Appl. 36,
11710–11717.
Huang, S. (2002). Extract intelligible and
concise fuzzy rules from neural networks.
Fuzzy Sets and Systems, 132, 233-243.
Ibrahim, M.H. & Aziz, H. (2003).
Macroeconomic Variable and the
Malaysian Equity market: A view through
rolling su sample. Journal of Economic
studies,30,22.
Khashei,M., & M. Bijaria, G.A.
Ardali.(2009). Improvement of auto-
regressive integrated moving average
models using fuzzy logic and artificial
neural networks (ANNs). Neurocomputing
72, 956–967.
Kimoto, T., & Asakawa, K. (1990). Stock
market prediction system with modular
neural network. IEEE International Joint
Conference on Neural Network, 1, 1–6.
Kuo, R. J., Chen, C. H., & Hwang, Y. C.
(2001). An intelligent stock trading
decision support system through integration
of genetic algorithm based fuzzy neural
network and artificial neural network.
Fuzzy Sets and Systems, 118, 21–24.
Lee, J. W. (2001). Stock price prediction using reinforcement learning. IEEE
International Joint Conference on Neural
Networks, 1, 690–695.
Lin, L., & Cao, L., &Wang, J.,& Zhang,
Ch. (2007).The Application of Genetic
Algorithms in Stock Market Data Mining
Optimization, Faculty of Information
Technology, University of Technology,
Sydney, NSW, Australia.
Majhi,R.,& Panda,G., & Sahoo, G.(2009).
Development and performance evaluation
of FLANN based model for forecasting of
stock markets, Expert Syst. Appl. 36, 6800–
6808.
Mantas, C. (2006). Extraction of similarity based fuzzy rules from artificial neural
networks. International Journal of
Approximate Reasoning, 43, 202-221.
Patterson, D.W.(1996). Artificial Neural
Networks: Theory and Applications,
Prentice Hall.
Popoola,A. & Ahmad,K. (2006).Testing the
suitability of wavelet preprocessing for
TSK fuzzy models. in: Proceeding of
FUZZ-IEEE: International Conference
Fuzzy System Network , pp.1305–1309.
Ramsey,J,B. (1999). The contribution of wavelets to the analysis of economic and
financial data. Philosophical Transactions
of the Royal Society of London Series A-
Mathematical Physical and Engineering
Sciences ,2593–2606.
Tang, J, H., & H. F, Hsiao,& W. C, Yeh.
(2010). Forecasting Stock Market Using
Wavelet Transform and neural networks:
An Integrated system based on artificial bee
colony alghoritm, Applied soft computing ,
Gmodel.
Wang, Y,F.(2002). Predicting stock price
using fuzzy grey prediction system, Expert
Syst. Appl. 22, 33–39.
Yao, J., & Poh, H. L. (1995). Forecasting
the KLSE index using neural networks.
IEEE International Conference on Neural
Networks, 2, 1012–1017.
Yoon, Y., & Swales, J. (1991). Prediction
stock price performance: A neural network
approach. Proceedings of twenty-fourth
annual Hawaii international conference on system science, 156–162.