forecasting tax revenues in latvia: analysis and...
TRANSCRIPT

Forecasting Tax Revenues in Latvia: Analysis and Models
Velga Ozolina, Astra Auzina-Emsina, Remigijs Pocs
Riga Technical University, Latvia

Data Analysis• CSB data• Ministry of Finance data• State Revenue Service (SRS)
data• Eurostat data

Tax Burden in Latvia in 1995-2012, % of GDP
05
101520253035
%
Data Source: CSB database

Tax Burden in the EU Countries in 2012, % of GDP
0
10
20
30
40
50
60
Denm
ark
Belg
ium
Fran
ceAu
stria
Swed
enIta
lyFi
nlan
dEU
-28
Ger
man
yLu
xem
bour
gN
ethe
rland
sH
unga
rySl
oven
iaU
nite
d …G
reec
eCr
oatia
Cypr
usCz
ech
Repu
blic
Port
ugal
Mal
taSp
ain
Esto
nia
Pola
ndIre
land
Rom
ania
Slov
akia
Latv
iaBu
lgar
iaLi
thua
nia
%
Data Source: Eurostat database
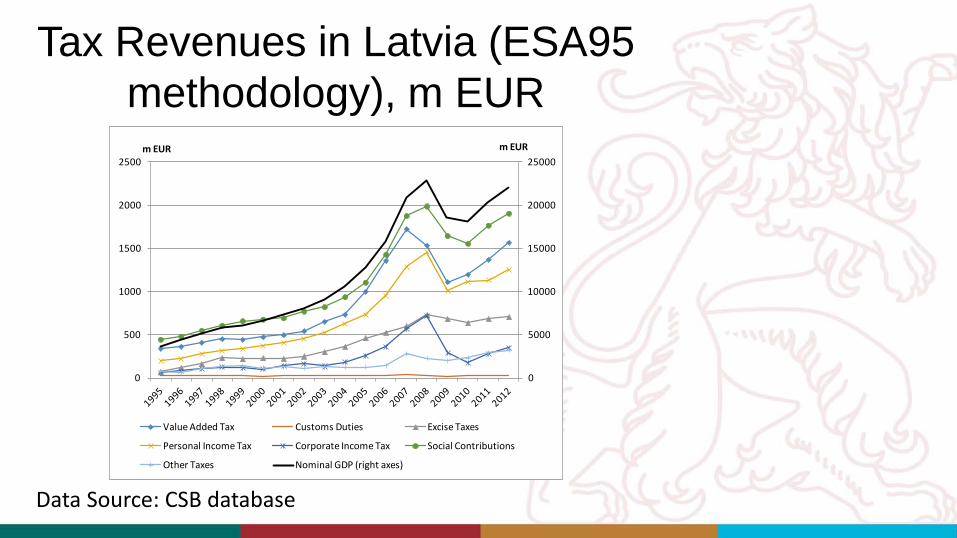
Tax Revenues in Latvia (ESA95 methodology), m EUR
0
5000
10000
15000
20000
25000
0
500
1000
1500
2000
2500m EURm EUR
Value Added Tax Customs Duties Excise Taxes
Personal Income Tax Corporate Income Tax Social Contributions
Other Taxes Nominal GDP (right axes)
Data Source: CSB database
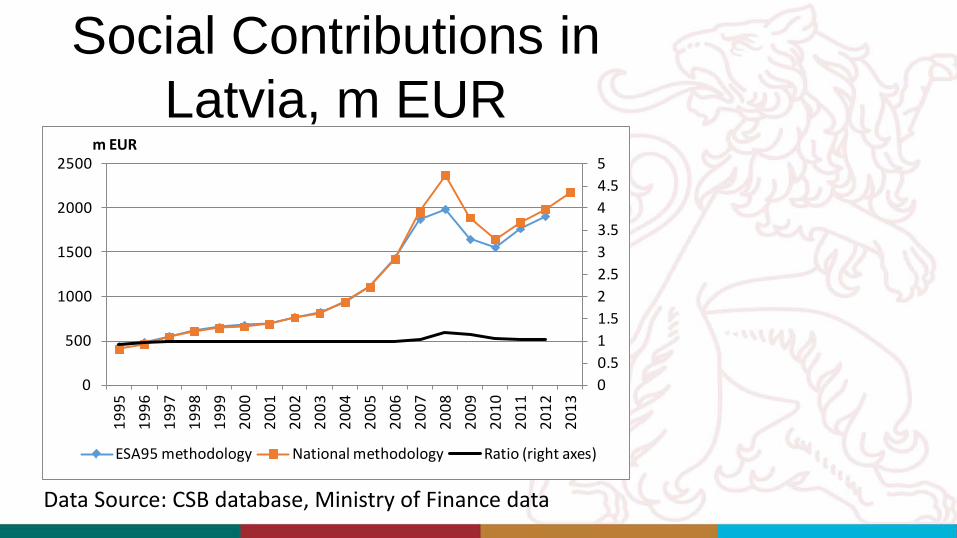
Social Contributions in Latvia, m EUR
00.511.522.533.544.55
0
500
1000
1500
2000
2500
1995
1996
1997
1998
1999
2000
2001
2002
2003
2004
2005
2006
2007
2008
2009
2010
2011
2012
2013
m EUR
ESA95 methodology National methodology Ratio (right axes)
Data Source: CSB database, Ministry of Finance data

Analysis of Legal AspectsThe main laws in the group of
direct taxes are:• On State Social Insurance,• On Personal Income Tax,• On Corporate (Enterprise)
Income Tax,• Micro-enterprise Tax Law.

Analysis of Legal Aspects• Employed persons by professional status, thsd
Overall statistics (CSB) Taxpayers (SRS)
0
200
400
600
800
1000
01020304050607080
2002 2003 2004 2005 2006 2007 2008 2009 2010 2011 2012 2013
thsdthsd
Employers (owners) Self-employed
Family workers Self-employed in the second job
Employees (workers), right axes
0102030405060708090100
0100200300400500600700800900
1000
I III I III I III I III I III I III I III I III I III I III I III
2004 2005 2006 2007 2008 2009 2010 2011 2012 2013 2014
thsdthsd
Employed Self-employed, right axes
Data Source: CSB database, State Revenue Service data

Analysis of Legal AspectsThe main laws in the group of
indirect taxes are:• Value Added Tax Law (before
2013 law On Value Added Tax),
• On Excise Duty.

Seasonality Analysis• Revenues of Direct Taxes, m EUR
-50
0
50
100
150
200
250
1995
1996
1997
1998
1999
2000
2001
2002
2003
2004
2005
2006
2007
2008
2009
2010
2011
2012
2013
2014
m EUR
Social Contributions Personal Income Tax Enterprise Income Tax
Data Source: Ministry of Finance data

Quarterly Seasonal Indexes for Social Contributions
0.85
0.9
0.95
1
1.05
1.1
1.15
1.2
1995
1996
1997
1998
1999
2000
2001
2002
2003
2004
2005
2006
2007
2008
2009
2010
2011
2012
2013
Q1
Q2
Q3
Q4
Data Source: Ministry of Finance data

Quarterly Seasonal Indexes for Personal Income Tax
0.8
0.85
0.9
0.95
1
1.05
1.1
1.15
1.2
1995
1996
1997
1998
1999
2000
2001
2002
2003
2004
2005
2006
2007
2008
2009
2010
2011
2012
2013
Q1
Q2
Q3
Q4

Quarterly Seasonal Indexes for Corporate Income Tax
0.3
0.5
0.7
0.9
1.1
1.3
1.5
1.7
1995
1996
1997
1998
1999
2000
2001
2002
2003
2004
2005
2006
2007
2008
2009
2010
2011
2012
2013
Q1
Q2
Q3
Q4
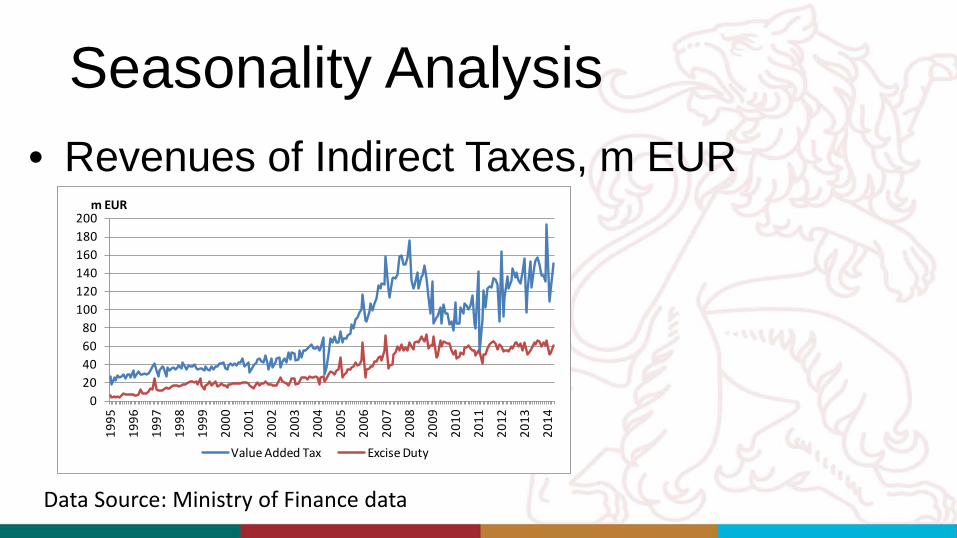
Seasonality Analysis• Revenues of Indirect Taxes, m EUR
020406080
100120140160180200
1995
1996
1997
1998
1999
2000
2001
2002
2003
2004
2005
2006
2007
2008
2009
2010
2011
2012
2013
2014
m EUR
Value Added Tax Excise Duty
Data Source: Ministry of Finance data
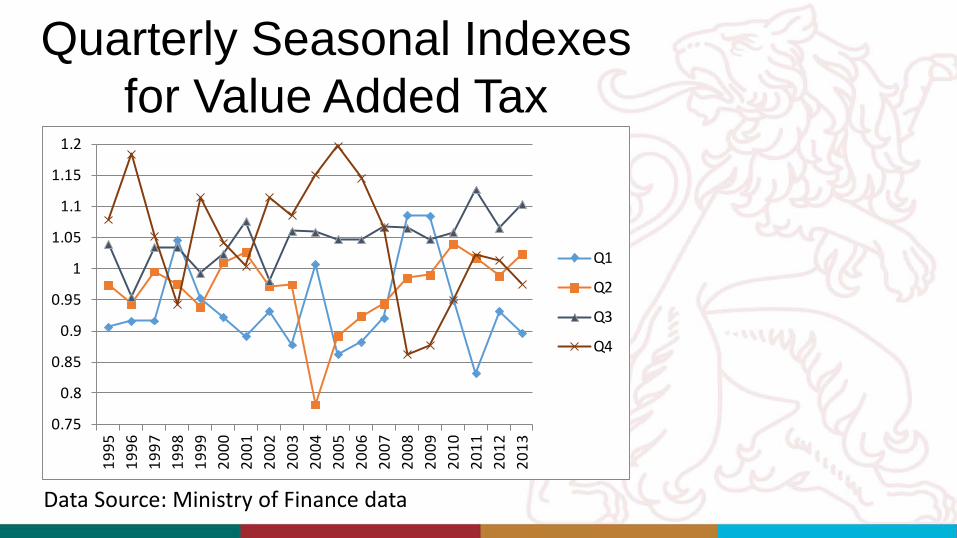
Quarterly Seasonal Indexes for Value Added Tax
0.75
0.8
0.85
0.9
0.95
1
1.05
1.1
1.15
1.2
1995
1996
1997
1998
1999
2000
2001
2002
2003
2004
2005
2006
2007
2008
2009
2010
2011
2012
2013
Q1
Q2
Q3
Q4
Data Source: Ministry of Finance data
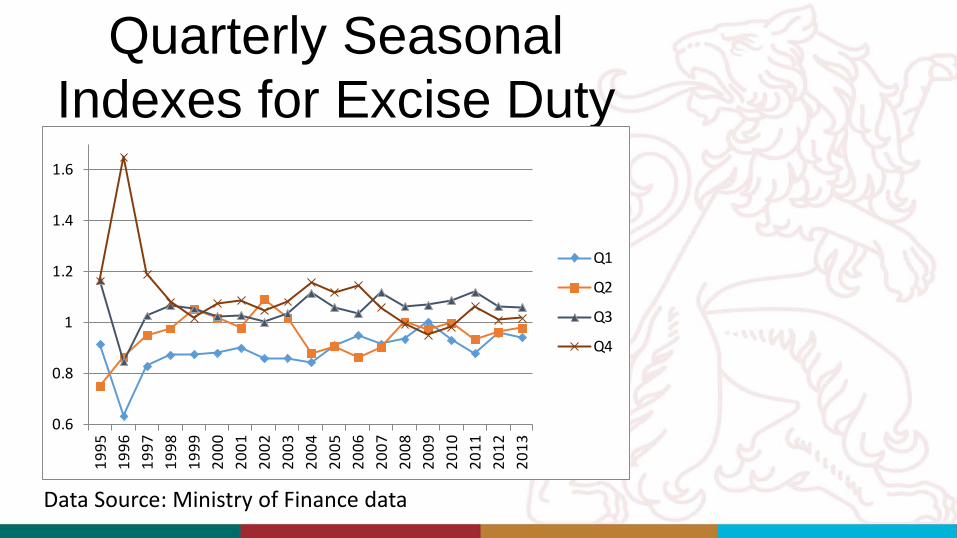
Quarterly Seasonal Indexes for Excise Duty
0.6
0.8
1
1.2
1.4
1.6
1995
1996
1997
1998
1999
2000
2001
2002
2003
2004
2005
2006
2007
2008
2009
2010
2011
2012
2013
Q1
Q2
Q3
Q4
Data Source: Ministry of Finance data

Productivity and Economic Activity Analysis
• Labor productivity and real GDP growth rate(2004-2007) (2008-2010) (2011-2012)
• .

Methodology• Modelling Approaches • Models and Equations
– Monthly– Quarterly– Annual

Monthly Data• Seasonality Indexes• Corporate Income Tax
Revenues

Corporate Income Tax Revenues
• CIT revenues = coefmonthly * CIT revenueslag *(1 + + PCIinfl/100)/12 + coefmay *PROFlag/100
where CIT revenues – corporate income tax revenues,CIT revenueslag – annual corporate income tax revenues with 17-month lag,coefmonthly – corporate income tax advance payments coefficient,PCIinfl – annual growth rate of private consumption price index in the previous year,coefmay – corporate income tax revenues coefficient applied only in May,PROFlag – annual profit in the previous year.
-0.5
0
0.5
1
1.5
2
2.5
-1000
-500
0
500
1000
1500
2000
2500
3000
3500
-1
0
1
2
3
4
5m EUR%
Corporate income tax revenues coefficient, %
Annual profit in the previous year, m EUR

Corporate Income Tax Revenues
SEE = 0.32 RSQ = 0.7593 RHO = 0.45 Obser = 196 from 1997.009
SEE+1 = 0.28 RBSQ = 0.7530 DW = 1.11 DoFree = 190 to 2013.012
MAPE = 9.70
Variable name Reg-Coef Mexval Elas NorRes Mean Beta
0 LTAX_UIN - - - - - - - - - - - - - - - - - 2.89 - - -
1 intercept 5.45808 5.9 1.89 4.15 1.00
2 @log(PCI[12]) -2.37844 18.5 -3.97 2.90 4.82 -0.904
3 @log(IM[12]) 0.48841 2.1 1.03 1.47 6.09 0.467
4 @log(IM[6]) 0.80975 7.9 1.72 1.26 6.15 0.761
5 D_5*@log(IM[6]) 0.09099 11.2 0.02 1.04 0.51 0.241
6 @log(W_NOM[8]/PCI[8]) 0.86536 1.8 0.31 1.00 1.05 0.375

Quarterly Data• Identities• Econometric Equations
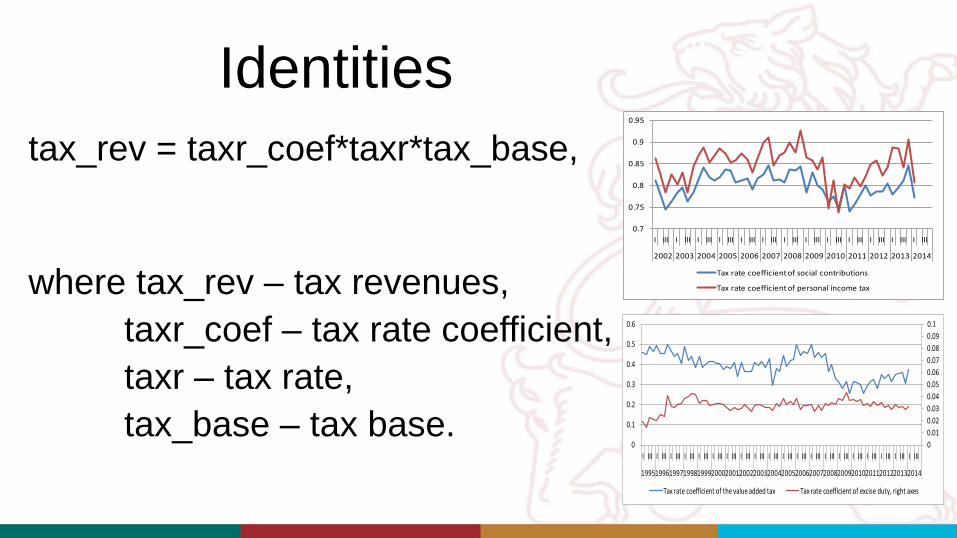
Identitiestax_rev = taxr_coef*taxr*tax_base,
where tax_rev – tax revenues,taxr_coef – tax rate coefficient,taxr – tax rate,tax_base – tax base.
00.010.020.030.040.050.060.070.080.090.1
0
0.1
0.2
0.3
0.4
0.5
0.6
I III I III I III I III I III I III I III I III I III I III I III I III I III I III I III I III I III I III I III I III
19951996199719981999200020012002200320042005200620072008200920102011201220132014
Tax rate coefficient of the value added tax Tax rate coefficient of excise duty, right axes
0.7
0.75
0.8
0.85
0.9
0.95
I III I III I III I III I III I III I III I III I III I III I III I III I III
2002 2003 2004 2005 2006 2007 2008 2009 2010 2011 2012 2013 2014
Tax rate coefficient of social contributions
Tax rate coefficient of personal income tax
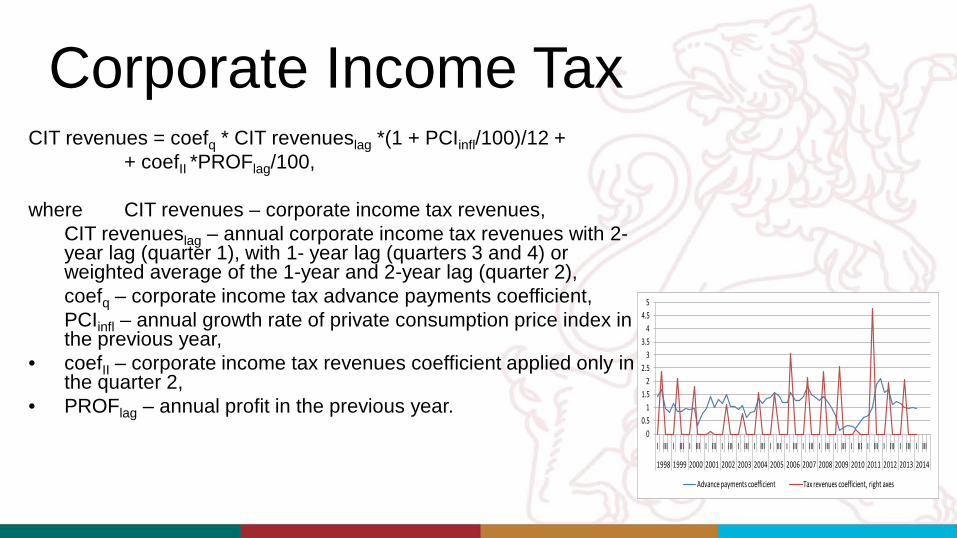
Corporate Income TaxCIT revenues = coefq * CIT revenueslag *(1 + PCIinfl/100)/12 +
+ coefII *PROFlag/100,
where CIT revenues – corporate income tax revenues,CIT revenueslag – annual corporate income tax revenues with 2-year lag (quarter 1), with 1- year lag (quarters 3 and 4) or weighted average of the 1-year and 2-year lag (quarter 2),coefq – corporate income tax advance payments coefficient,PCIinfl – annual growth rate of private consumption price index in the previous year,
• coefII – corporate income tax revenues coefficient applied only in the quarter 2,
• PROFlag – annual profit in the previous year.0
0.51
1.52
2.53
3.54
4.55
I III I III I III I III I III I III I III I III I III I III I III I III I III I III I III I III I III
1998 1999 2000 2001 2002 2003 2004 2005 2006 2007 2008 2009 2010 2011 2012 2013 2014
Advance payments coefficient Tax revenues coefficient, right axes

Social Contributions Revenues
SEE = 12.80 RSQ = 0.9911 RHO = 0.43 Obser = 48 from 2002.100
SEE+1 = 11.82 RBSQ = 0.9907 DW = 1.14 DoFree = 45 to 2013.400
MAPE = 2.39
Variable name Reg-Coef Mexval Elas NorRes Mean Beta
0 TAX_SOC - - - - - - - - - - - - - - - - - 394.63 - - -
1 intercept -15.67795 5.9 -0.04 112.06 1.00
2 TAXR_SOC*((EMPL*W_NOM*3)/100000)
0.82441 929.9 1.03 1.22 492.62 1.007
3 D_EU 13.39648 10.3 0.01 1.00 0.31 0.046

Personal Income Tax Revenues
SEE = 10.34 RSQ = 0.9841 RHO = 0.14 Obser = 48 from 2002.100
SEE+1 = 10.34 RBSQ = 0.9834 DW = 1.72 DoFree = 45 to 2013.400
MAPE = 3.24
Variable name Reg-Coef Mexval Elas NorRes Mean Beta
0 TAX_INC_PERS - - - - - - - - - - - - - - - - - 246.31 - - -
1 intercept -15.42434 9.4 -0.06 62.85 1.00
2 TAXR_IIN*((EMPL*(W_NOM-TAX_NMIN))/1000-TAX_SOC*TAX_SOC_E)
3.39666 687.7 1.08 2.44 78.20 1.022
3 D_10 -46.54480 56.2 -0.02 1.00 0.08 -0.157

Corporate Income Tax Revenues
SEE = 0.26 RSQ = 0.8398 RHO = 0.21 Obser = 72 from 1996.100SEE+1 = 0.25 RBSQ = 0.8303 DW = 1.58 DoFree = 67 to 2013.400MAPE = 5.23Variable name Reg-Coef Mexval Elas NorRes Mean Beta
0 LTAX_INC_CORP - - - - - - - - - - - - - - - - - 3.92 - - -1 intercept -8.75285 40.2 -2.23 6.24 1.002 @log(PI_CONS_PR[4]) -2.03484 27.4 0.19 3.47 -0.36 -0.9163 @log(IM_CP[4]) 0.77342 6.9 1.43 1.45 7.26 0.8174 @log(IM_CP[2]) 0.85733 10.0 1.60 1.13 7.32 0.8765 D_2*@log(INV_CP[1]) 0.03463 6.4 0.01 1.00 1.58 0.150

Value Added Tax Revenues
SEE = 0.10 RSQ = 0.9723 RHO = 0.13 Obser = 76 from 1995.100
SEE+1 = 0.09 RBSQ = 0.9712 DW = 1.74 DoFree = 72 to 2013.400
MAPE = 1.37
Variable name Reg-Coef Mexval Elas NorRes Mean Beta
0 LTAX_VAT - - - - - - - - - - - - - - - - - 5.27 - - -
1 intercept -2.56866 55.4 -0.49 36.14 1.00
2 @log(GDP_CP) 1.03000 201.5 1.54 1.28 7.89 1.094
3 @log(TIME) -0.09040 6.8 -0.06 1.13 3.37 -0.143
4 D_EU 0.09103 6.5 0.00 1.00 0.20 0.063

Excise Duty RevenuesSEE = 0.08 RSQ = 0.9767 RHO = 0.06 Obser = 60 from 1999.100
SEE+1 = 0.08 RBSQ = 0.9759 DW = 1.87 DoFree = 57 to 2013.400
MAPE = 1.25
Variable name Reg-Coef Mexval Elas NorRes Mean Beta
0 LTAX_EXC - - - - - - - - - - - - - - - - - 4.70 - - -
1 intercept -3.29918 170.7 -0.70 42.90 1.00
2 @log(GDP_CP) 0.98389 514.3 1.70 1.39 8.11 0.958
3 D_0910 0.14311 17.7 0.00 1.00 0.13 0.098
Annual Data• Calculations in ESA95• Identities• Transformation Coefficients to
forecast national data

Dynamics of Estimated II Pillar Rates in 2003-2013
-0.05
0
0.05
0.1
0.15
0.2
0.25
0.3
2003 2004 2005 2006 2007 2008 2009 2010 2011 2012 2013
Estimated II pillar rate (based on assets)
Estimated II pillar rate (based on differences in national and ESA95 methodologies)
Estimated II pillar rate (combined)
Max II pillar rate

Tax Rate Coefficients
-0.5
0.0
0.5
1.0
1.5
2.0
2.5
Tax rate coefficient of personal income tax
Tax rate coefficient of corporate income tax
Tax rate coefficient of social contributions
0.00
0.02
0.04
0.06
0.08
0.10
0.0
0.1
0.2
0.3
0.4
0.5
0.6
1995
1996
1997
1998
1999
2000
2001
2002
2003
2004
2005
2006
2007
2008
2009
2010
2011
2012
2013
Tax rate coefficient of the value added tax
Tax rate coefficient of excise duty, right axes

Forecasts• Evaluation of precision• Numbers

Corporate Income Tax (Monthly Data)
2014.001 – 2014.007• MAPE = 14.3%• Modified dummy MAPE = 3.6%

MAPE Values, % (Quarterly Data)
Tax Type 2014 I 2014 I and IISocial Contributions 3.7 2.2Personal Income Tax 6.8 -Corporate Income Tax 0.4 2.5Value Added Tax 15.4 16.5Excise Duty 0.7 2.0

Comparison of Forecasts
Tax Type Identity-based approach Econometric equations
Monthly Quarterly Annual Monthly QuarterlySocial Contributions - 2271.3 2139.6 - 2237.2Personal Income Tax - 1379.3 1415.1 - 1385.0Corporate Income Tax 342.3 359.2 350.0 359.5 354.6Value Added Tax - 1885.1 1738.7 - 1638.5Excise Duty - 757.1 731.2 - 777.9
Conclusions• Using annual data, identity-based approach
should be prefered, however quarterly and monthly data can give similar results and thus the choice is in hands of the model-user
• Identity-based approach allows for a greater flexibility in scenario-building process. Econometric approach involves less assumptions and thus may seem to be more objective
• Forecasts depend very much on the values of exogenous indicators, therefore modelling approaches should be tested regulary to find the most reliable ones

LAIMA• Latvian Interindustry Model
(Aggregated/Annual)• Goddess of destiny

Thank You for Attention
Questions?