forecasting with confidence · are the ones that are getting it right. with the transparency,...
TRANSCRIPT

Forecasting with confidence Insights from leading finance functions
ADVISORY

“Leading organizations widely acknowledge that forecasting is at the heart of the performance management process, and is potentially a significant driver of business value and investor confidence – a view this research confirms.
” Scott Parker
Head of Financial Management KPMG International
Contents
Foreword 01
Executive summary 02
Section I Forecasts are inaccurate. Does it matter? KPMG comment: Reliable forecasting enhances business value
04
Section II Data issues affect the reliability of forecasts KPMG comment: Reliable forecasting produces business insight
12
Section III Forecasting technology: help or hindrance? KPMG comment: Technology alone is not the answer
18
Section IV The practice of forecasting: moving beyond process KPMG comment: Reliable forecasting is a management discipline
24
Section V Conclusion KPMG comment: Forecasting, the next step in the business transformation journey
34
Appendix Survey results 38
With the exception of the KPMG Comment sections, the views and opinions expressed herein are those of the Economist IntelligenceUnit and the entities surveyed and do not necessarily represent the views and opinions of KPMG International or KPMG member firms.The information contained is of a general nature and is not intended to address the circumstances of any particular individual or entity.
Due to rounding, graph totals may not equal 100 percent.

About the research
KPMG International commissioned the Economist Intelligence Unit to write
Forecasting with confidence: Insights from leading finance functions.
The report is based on the following research activities.
• The Economist Intelligence Unit and CFO Research conducted a global survey of
544 senior executives. Thirty-five percent of respondents were based in Europe,
30 percent in the Americas and 29 percent in Asia Pacific. The survey reached a
very senior audience; over 30 percent of respondents were CFOs. Fifty-nine
percent of respondents were from organizations with over US$1 billion dollars in
annual revenues and respondents were drawn from a cross-section of industries.
• The survey results were segmented and analyzed in various ways to shed light
on whether top performing organizations take a different approach to forecasting.
In particular, the report analyses responses from organizations with high levels of
forecast accuracy (within five percent of actual results over the past three years)
compared to those that had a wider margin of error when forecasting over the
past three years.
To supplement the survey, the Economist Intelligence Unit conducted a program
of interviews with senior executives as well as academics and experts in the field.
We are grateful to the following participants for their valuable time and insights:
Professor S.P. Kothari Billard Professor of Management MIT Sloan School
Bjarte Bogsnes Project Manager Statoil
Jean-Sebastien Couillard CFO Toronto-Hydro Corporation
Simon Gibbins Group Financial Controller Shire Pharmaceutical
Tom Lewis Assistant Director, Policy and Technical Chartered Institute of Public Finance and Accountancy (CIPFA)
Dr Christian Mielsch Chief Administrative Officer Metro Cash and Carry
Richard O’Brien Co-founder and Partner Outsights
Steve Roder CFO of Life Operations – Asia Pacific AIG
Paul Rogan Group CFO Challenger Financial Services
Peter van Rossum CFO Unibail Rodamco
Guy Rudolph Director of Business Planning Vodafone
Ewen Stewart Analyst ABN Amro
Jim Sutcliffe CEO Old Mutual
All graphs in this report are sourced from research conducted by the Economist Intelligence Unit 2007.
This report follows on from a previous report written by KPMG in cooperation with the Economist Intelligence Unit, called Being the best: Insights from leading finance functions. Copies of Being the best: Insights from leading finance functions are available from any of the contacts listed on the back of this report or your local KPMG advisor.

Foreword
As CFOs continue to look for ways to enhance the competitiveness and value of their businesses, they are increasingly turning to performance management processes and information to transform the enterprise and identify opportunities for growth. Although forecasting is traditionally considered a “financial exercise,” leading organizations widely acknowledge that it is at the heart of the performance management process and potentially a significant driver of business value and investor confidence – a view this research confirms.
In an effort to understand how CFOs become a critical management capability
are using the discipline of forecasting to enabling the business to drive and improve business decision-making and sustain long-term value. Success support their effort to provide guidance depends largely on the discipline applied to external stakeholders, KPMG to supporting processes; the integrity International commissioned the of financial, operational, and external Economist Intelligence Unit (EIU)
information; and the support of to examine how leading organizations
leadership and organizational culture. enhance the reliability and confidence
of forecasts and, as a result, create The following results provide insight measurable business value. into how the CFOs of leading
organizations use the forecasting Although the majority of respondents process to identify opportunities to regard forecasting as more art than drive business improvement, determine science, the survey shows that those growth strategies, and reinforce external that tackle forecasting as a science stakeholders’ confidence in the business are the ones that are getting it right. with the transparency, visibility, and
The survey also found that when integrity of their financial projections.
conducted rigorously, forecasting can
Forecasting with confidence 1
We encourage you to share this report
with your leadership team. We believe
it can serve as a road map in two ways:
first, as a means of helping businesses
identify opportunities to transform their
performance management capabilities
via the forecasting process; and second,
as a source of insight into improving the
reliability of forecast information used in
communicating with investors and other
external stakeholders.
We hope you find this report useful in
your efforts and we look forward to
discussing it with you.
Scott Parker Head of Financial Management
KPMG International

2 Forecasting with confidence
Executive summary All organizations use forecasts to predict and manage their future performance. But although organizations invest significant time and effort in this important task, only one in five currently produce a forecast that is reliable.
This new research report by the Economist Intelligence Unit is based on a global survey of over 540 senior executives involved in the forecasting process from a cross-section of industries, including 168 CFOs.
The research builds on a previous report by KPMG International in cooperation with the Economist Intelligence Unit. In Being the best: Insights from leading finance functions, senior finance professionals from a range of global organizations cited planning, budgeting and forecasting as (1) the key area in which CFOs were most dissatisfied with their current capabilities and (2) their top priority for improvement in the next three years. With this in mind, KPMG International has commissioned the EIU to provide insights into some of the latest trends and challenges in this field.
The report’s key findings include:
Unreliable forecasts cost organizations money. Over the last three years, only one percent of firms have hit forecast exactly, and just 22 percent have come within five percent either way. On average, forecasts have been out by 13 percent*. Executives in the survey estimate that such errors have directly knocked six percent off their share prices over the same period, a significant part of which resulted from investor reaction.
The impact of poor forecasting has a deeper effect through its impact on strategic and operational choices. Although other factors are undoubtedly at play, firms with forecasts that came within five percent of actual saw
*Calculated as the mean absolute deviation from actual results.
share prices increase by 46 percent over the last three years, compared with 34 percent for others. Clearly, good forecasting pays.
The process needs fixing. Finance executives in the survey point to three main process areas where improvements need to be made to enable more reliable forecasting. The first priority, cited by 42 percent of respondents is the need to use technology to automate the forecasting process. A similar proportion believe scenario planning would be a useful tool to understand future developments that could impact the forecast.
Finally, 40 percent of respondents also believe rolling forecasts would be highly beneficial in improving their performance in this area.
Data used for forecasting are often inaccurate or incomplete. Almost half of surveyed organizations believe the reliability of their financial data is merely adequate or worse; a majority think the same of their non-financial data.
Organizations largely focus on internally generated data at the expense of gathering broader market data: for example, only 40 percent use government economic reports in their forecasting processes. Tellingly, two of the four areas where organizations say they make forecasting errors are consumer demand and economic drivers – both of which could be helped by the use of readily available external data.
Separating the best from the rest
To see how organizations could improve their forecasting, it helps to consider the efforts of those with the best records. In our survey, the most accurate forecasters – those that, over the last three years, had actual results within five percent of forecast – make up 22 percent of the total. They differ from the rest in some important ways.
1 They take forecasting more seriously
The most accurate firms:
• hold managers accountable for agreed forecasts – 87 percent to 76 percent;
• incentivize managers for forecast accuracy – 25 percent to 12 percent;
• use the forecast for ongoing performance management – 53 percent to 46 percent;
• use their forecasts to help with formal earnings guidance – 24 percent to 16 percent.
2 They look to enhance quality beyond the basics The most accurate firms:
• are more interested in further scenario planning and sensitivity analysis – 51 percent to 41 percent;
• have less need to train further finance staff in forecasting – 11 percent see it as a priority as compared with 21 percent.

Forecasting with confidence 3
3 They leverage information more effectively The most accurate firms:
• use external market reports and competitive data more often – 68 percent to 55 percent;
• have forecasts done more often by operational managers who are closer to where business takes place – 40 percent to 34 percent;
• give their internal input data a higher rating for reliability, timeliness, relevance and insightfulness.
4 They work harder at it The most accurate firms:
• update forecasts more frequently – 58 percent do so monthly or more often compared with 44 percent of others;
• are more likely to review the figures formally – 74 percent to 64 percent;
• forecast key balance sheet indicators more – 83 percent to 78 percent;
• make greater use in the forecasting process of software more advanced than spreadsheets, such as ERP systems – 48 percent to 37 percent – off-the-shelf forecasting/planning tools – 47 percent to 34 percent – and bespoke tools – 34 percent to 20 percent.
5 They benefit their shareholders The most accurate firms:
• attribute lower declines in share price directly to forecasting over the last three years – four percent to seven percent;
• saw shares rise faster over the same time period – 46 percent to 34 percent.
Information technology is too often a hindrance rather than a help. Over one-third of respondents considered the technology their organizations currently use for forecasting to be a notable impediment.
Nearly all organizations still use spreadsheets for some parts of the process; more worryingly, however, 40 percent of them rely solely on spreadsheets to produce the forecast. It is possible to produce a reliable forecast using these basic tools, but the survey shows that organizations with the most accurate forecasts are more likely to use more advanced software to do the job. That said, experts interviewed for the report agree that good technology won’t help if the input data is poor or processes are unreliable.
Forecasting should not be the preserve of finance. It is a mistake to think of forecasting as a discipline that should be left to the finance department. Certainly financial professionals have a leading role to play, but it is essential to give the operational managers that drive performance greater ownership and
responsibility for key parts of the forecasting process. The most accurate forecasters in the survey are already more likely to do this. But there remains 39 percent of companies that do not assign any responsibilities to their business managers for this task.
Leaders demand honest forecasting. The survey suggests that companies are much more likely to outperform rather than underperform their predictions. This suggests that managers, consciously or unconsciously, are being too conservative in their estimates.
The possible reasons run from natural human caution to “sandbagging” to protect bonuses. While outperforming the forecast may not sound like a problem, it means that important decisions such as resourcing and investment choices are being made on the basis of inaccurate or incomplete information. To make better strategic decisions, senior executives need to instill a culture where reliable forecasting is encouraged and rewarded.
These findings are strongly reinforced by the interviews and case studies that the Economist Intelligence Unit conducted with senior executives, academics and experts on the topic of forecasting. What emerges clearly is that high-performing companies usually take the forecasting process very seriously. Armed with better quality, forward-looking information, executives at these organizations are able to make better decisions about the future direction of their business.
Written by the Economist Intelligence Unit

5.4% 5.6%
23.7%
9%
20.1%
No effect Impact 11-15%
36.2% Impact less than 5% Impact 16-20%
Impact 6-10% Impact greater than 20%
*Based on the 354 respondents who were able to answer this question.
4 Forecasting with confidence – Section I
Section I Forecasts are inaccurate. Does it matter?
Overall, our survey indicates most
organizations do not do forecasting
well. Just a tiny fraction (one percent)
were exactly on prediction within the
last three years, and the most accurate
in the group – those that have come
within five percent of forecasts – make
up only about one in five.
The mean absolute deviation from
forecast for all surveyed organizations
in the same period is an alarming 13
percent. Little wonder that two-thirds
of respondents agree that forecasting is
more an art than a science – and clearly
one in which business needs to hone
its technique.
Forecasting is, however, just a means
to an end: improved performance.
So how far do these flawed estimates
actually matter?
The numbers suggest that poor forecasts
cost money. The best indicator is market
capitalization. Of those respondents who
felt able to comment on how their share
price had been affected by forecasting
errors, the average thought that errors in
this area had cost them six percent of
share price over the previous three years.
This cost represents a significant amount
of market capital. In addition, the most
accurate forecasters performed
noticeably better than less accurate
forecasters, growing their share prices
by 46 percent instead of 34 percent.
When considering the impact of forecasting errors, approximately how much do you estimate that these have cost your organization over the last three years in terms of share price?*
Written by the Economist Intelligence Unit

Forecasting with confidence – Section I 5
Key findings • Only a minority of firms produce forecasts that are within five
percent of actual results
• Inaccurate forecasts impact the share price
• The most accurate forecasters are able to use these estimates to underpin performance management and strategic decisions

6 Forecasting with confidence – Section I
The share price can suffer when analysts
and investors react to a significant
mismatch between outlook guidance
based on forecasts and actual results.
Organizations understand the importance
of forecasts in this respect.
“If a result deviates from predictions, the share price suffers for three or four quarters.”
Christian Mielsch, chief administrative
officer of Metro Cash & Carry, an
international self-service wholesaler,
calls forecasts “crucial to investor
communication”, especially those with
direct links to capital markets, and Guy
Rudolph, director of business planning
at Vodafone, a mobile telecommunication
firm, describes them as “absolutely
fundamental.”
Jim Sutcliffe, CEO of Old Mutual, a
financial services group, adds that,
if a result deviates from predictions,
“the share price suffers for three or four
quarters.” Peter van Rossum, CFO of
newly-merged Unibail Rodamco, the
largest commercial real estate company
in Europe, believes that “credibility is
very important in a new entity. We need
to build a track record.”
Some executives interviewed for
this report argue that inaccurate
forecasting mainly matters when a firm
underperforms against the estimate.
Roughly twice as many firms surveyed
exceeded expectations rather than fell
short, for which few would expect them
to be punished. Sutcliffe, for example,
also believes that, rather than accuracy,
analysts “want you to beat forecasts by
small amounts that don’t demonstrate
a lack of understanding.” Old Mutual’s
policy is to aim to come in zero to five
percent above forecast (although this
would still put them in the most accurate
group in this survey).
Across the fence, Ewen Stewart,
an analyst at ABN Amro, agrees:
“The market does tend to reward
organizations that are consistently
conservative in forecasting with a higher
rating. It is important to err on the
cautious side.” However, according to S.P.
Kothari, Billard Professor of Management
at the MIT Sloan School, a continuous
record of low forecasts will simply lead
investors to “adjust according to the bias.
They are not going to be that easily
tricked and then surprised.”
More of the accurate forecasting firms use the data in performance management.
Besides the potential impact on share
price of poor forecasting, there are other
benefits relating to improved reliability
in forecasting that need to be taken
into account. Foremost among these,
according to the survey, would be
improved ability to recognize
opportunities (68 percent) and to manage
risk (66 percent). The ability to set
meaningful performance milestones for
business units and to identify process
improvements that could benefit the
bottom line were two other important
advantages of improved forecasting,
according to respondents.

What do you anticipate would be the main benefits of better forecasting within your organization?
% of respondents
0 20 40 60 80 100
Ability to identify and act on opportunities for 67.5% additional growth
Ability to identify and prioritize risks to our 66.4% strategic plan
Ability to set meaningful performance 54% milestones for the business units
Ability to identify improvements to the organization’s processes which would 46.5%
benefit the bottom line
Ability to improve relationships with investors 14.5%
Ability to improve relationships 9.9% with customers
Ability to improve relationships with suppliers 8.6% and business partners
4%
Other, please specify 2.2%
Respondents: 544
Forecasting with confidence – Section I 7
Not surprisingly, noticeably more of the
accurate forecasting firms use the data
in performance management (53 percent
to 46 percent). Van Rossum explains that
accuracy is crucial, adding that “knowing
what is going to happen tomorrow is
much more important than having an
accurate accounting view on what
happened yesterday”. At Vodafone,
Rudoph says, “Forecasting is how
we know where our business is going,
how we know how much to invest in
customers and in capital.”
“The forecast’s key role in management of the company means it must be brutally honest whether we like what we see or not.”
At Shire Pharmaceutical, a specialty
biopharmaceutical firm, group financial
controller Simon Gibbins notes that its
forecasts “underpin our strategic
planning.” Bjarte Bogsnes, a project
manager who oversaw the shift from
traditional budgeting to planning based
on forecasts for Statoil, a Norwegian oil
company (see page 10), comments that
the forecast’s key role in management of
the company means it must “be brutally
honest whether we like what we see
or not.”
Steve Roder, chief administrative officer
of life operations – Asia Pacific at AIG,
takes the implications further: “We use
the forecast to manage our business, for
taking top-level decisions. If the accuracy
is not acceptable it will affect the share
price eventually.”

In which of the following does your organization’s forecast play an important role?
% of respondents
0 20 40 60 80 100
Annual budgeting process 77.9%
Strategic planning 57.2%
Ongoing performance management 45.4%
Cash management 35.7%
Formal earnings guidance 17.6%
Ongoing investor communications 16.5%
Debt financing 12.5%
Setting of incentive levels 10.8%
Tax planning 8.5%
Other, please specify 0.4%
Respondents: 544
8 Forecasting with confidence – Section I
When it comes to decision-making,
under-forecasting is as problematic as
over-forecasting. As Kothari notes, if
actual sales are 20 percent higher than
forecast, “how do you meet demand?”
Less accurate forecasters saw their share prices rise by 34 percent compared to 46 percent for more accurate peers – over a third more.
Planned growth is easier than seat-of-the
pants innovation, which may be why the
most accurate forecasters outperform
the less accurate forecasters in other
areas. For example, the less accurate
forecasters saw their share prices rise
by 34 percent over the last three years.
More accurate peers grew this figure by
46 percent, or more than a third faster.
Not all of this increase is likely to result
from better forecasting, but it suggests
that good forecasting is strongly
correlated with good management.
Indeed, under-forecasting and over-
delivering might temporarily please the
investment community, and may even
increase individual bonuses, but a more
reliable estimate at the beginning is of
far more lasting value to organizations.

Forecasting with confidence – Section I 9
Analysts and forecasts Although our survey indicates they are Stewart does not think the market is The market likes companies that exceed
more often thought of as an internal tool, looking for any particular style of expectations, and it is an old adage that
financial forecasts play a very important forecast. “From a macro perspective, once a company issues a warning, the
role in investor communication. Jim rolling forecasts are quite useful for probability of it warning again is higher.
Sutcliffe, CEO of Old Mutual, calls them comparing like for like across companies, If a business develops a pattern of
“crucial” in this regard, as does Christian but at an individual company level, poor forecasting, analysts can become
Mielsch, CAO at Metro Cash and Carry. investors look more at results.” He adds wary, and start thinking in terms of an
that executives now realize “there is a increased risk of the company being How are forecasts seen by the analysts heavy penalty for failure”, in proving the acquired or the management changed. with whom businesses are trying to accuracy of their guidance. communicate? Ewen Stewart, an analyst Overall, executives are getting the
at ABN Amro, explains that “there is no The market likes companies that message, Stewart believes. “Companies
doubt that corporate guidance is very exceed expectations, and it is an have become more astute in the last
important.” This does not mean, however, old adage that once a company few years, realize their views are
that analysts simply accept figures issues a warning, the probability taken seriously, and have got better at
uncritically. They sometimes do disagree, of it warning again is higher. articulating their strategies. The quality
and at the very least look carefully at the of guidance has probably improved.”
detailed numbers to determine the level A single bad forecast need not be a He gives one note of caution, though.
of risk built into the forecast. Moreover, disaster, but does cause problems. “In the last few years, we’ve seen pretty
in certain sectors – house-building for Stewart says that market and analyst strong growth. Now there is more of a
example – macroeconomic conditions reaction depends on the cause of the question mark. This means that the risk
or other factors beyond a company’s inaccuracy. If a company’s forecast to forecasts is increasing.”
control can overwhelm the most proves wrong, they have to explain. Written by the Economist Intelligence Unit
careful estimates, so analysts overlay If it is something understandable, their views on those of any business. then investors will be lenient, but
even an explicable error has side
effects, Stewart explains.

10 Forecasting with confidence – Section I
Forecasting replaces the annual budgetprocess at Statoil
As the business environment grows
increasingly dynamic and turbulent,
the usefulness of quickly dated annual
forecasts, budgets and targets comes
into question. To address the problem,
Statoil – a firm that includes in its
corporate values “challenge accepted
truth” – did not tinker at the edges.
Rather, it joined the small but growing
number of companies that have
abandoned budgeting altogether for
a combination of forecasts, balanced
scorecards with an increasing number
of relative KPIs, and dynamic resource
allocation. The shift has required Statoil
to revise its forecasting practice
dramatically.
“You have to build the forecasts from the front line, where people have the information.”
Bjarte Bogsnes, the Statoil project
manager who oversaw the changes
there, explains that the traditional
process “is meant to provide one figure
that is a target and a forecast and a
resource allocation figure. This is the
best way to destroy the quality of the
forecast, because other motivations tend
to distort it. It introduces other agendas.”
“Forecasting is something you should do for yourself.”
Now at Statoil, targets are set relative to
the performance of other companies and
the forecast is simply that, a best guess
about the future. What drives action on
the company’s balanced scorecard is the
comparison between the two.
The company has also, barring a number
of common assumptions set centrally,
dispersed forecasting throughout the
organization in a continuous process.
In Bogsnes words: “you have to build
the forecasts from the front line, where
people have the information. We have
one forecasting principle: forecasting is
something you should do for yourself.”
The results have been positive in several
ways. Most important, says Bogsnes,
forecasts have become better and take
much less time. The combined use of
forecasts and targets has also produced
a more forward-looking mindset.
Bogsnes notes that the CEO is very
pleased management can skip lengthy
deviation analysis on old figures “and
immediately go to the more interesting
discussion of what does the future look
like compared to our targets, and what
do we intend to do about this.” Finally,
Bogsnes explains, “We tend to forget
that the main purpose of forecasting is
to get stuff on the radar screen soon
enough to do something about it.”
More frequent, less time-consuming
forecasts, done at the point of use, help
greatly in alerting relevant business units
to looming risks and opportunities.
The combined use of forecasts and targets has also produced a more forward-looking mindset.
Looking ahead Bogsnes says that Statoil
is debating further radical change, notably
a move from calendar-driven to event-
driven forecasting. “Forecasting would be
triggered by something happening. If, for
example, a unit thinks it needs to update
its forecast, it should do so within a
relevant time frame and in time to take
corrective action.” Thus, the “calendar
year would disappear as a straightjacket”,
allowing flexible forecasting to be of
most use in today’s fast-changing
business environment.
Written by the Economist Intelligence Unit

Forecasting with confidence – Section I 11
KPMG comment: Reliable forecasting can enhance business value
Forecasting has wide-ranging importance.
For leading companies, reliable forecasting
is an essential component of their
effort to create and sustain value in the
business and they invest appropriate time
and resources in its execution. Leaders
use forecasting to drive performance,
identify opportunities and risks, and as
the foundation for communicating with
investors. They recognize that without
reliable forecasting at the heart of their
performance management process,
management information would be
mired in detail about the past and
key opportunities and risks are likely
to be missed.
Despite the demonstrable benefits
of reliable forecasting, however, many
organizations continue to struggle with,
and even neglect, this business-critical
process. Too often, rather than treating
forecasting as a core business capability,
managers see it as a responsibility of
the finance function, tied to a timetable
and with little relevance to the
business cycle.
“Without reliable forecasting at the heart of their performance management process, key opportunities and risks are likely to be missed.”
Managers who neglect the forecasting
process cost organizations money in
two important ways. First, they find
their business information unreliable,
and as a result do not use the data to
drive performance and make decisions –
despite having invested considerable
resources to develop the forecasts.
Second, increasingly sophisticated
investors are demanding more
information and forecasts on
organizations’ key economic drivers
and perspective on future performance.
Without a reliable understanding of
the business’ direction, its opportunities,
and the potential risks, CFOs struggle to
provide investors with the transparency
and insight that they demand.
Some organizations try to improve
forecasting by tweaking their budgeting
or other traditional decision support
processes. Those that tackle these
improvements in the context of an
integrated performance management
cycle, however, demonstrably improve
shareholder value and enable the finance
function to become an architect of
business transformation. Reliable
forecasting enables these leading
companies to “sense and respond”
to business conditions and make
appropriate changes in real-time.
They manage risks better and anticipate
and seize opportunities ahead of their
competitors. Whether markets are rising
or falling, these leaders can predict with
greater confidence where the business
is heading, thereby allowing them to
rely on their forecasts to communicate
with investors and analysts. As the
survey demonstrates stakeholders value
accurate and disciplined forecasting.

Section II Data issues affect the reliability of forecasts
One problem many organizations Even more (55 percent) think that the 34 percent listed improved input data
face in achieving reliability is the insight derived from their forecast data quality as a leading way to improve their
quality of the input data. Among is at best adequate, and financial data faith in their forecasts.
respondents, 47 percent consider quality is a notable impediment at 37 There are several explanations for this percent of firms. the reliability of the financial lack of confidence in the data. IT-related
information they use merely Moreover, executives in the survey are issues are discussed below, but the adequate or worse. significantly less confident about the problems go deeper than technology.
reliability, insight and quality of their Organizations are not exploiting all
non-financial data. It is no surprise that available data in the forecasting process.
How would you rate the following attributes of your organization’s forecast data?
% of respondents
0 20 40 60 80 100
Financial data: Relevance 15.5% 45.2% 33.4% 5.2% 0.7%
Financial data: Timeliness 14.4% 38.4% 35.1% 10.1% 2%
Financial data: Reliability 12.5% 40% 39.3% 6.8% 1.3%
Financial data: Insight 8.7% 36.2% 40.6% 13.5% 0.9%
Non-financial data: Relevance 9.7% 33.1% 40.1% 12.5% 4.6%
Non-financial data: Timeliness 7% 28.3% 41% 18.4% 5.3%
Non-financial data: Reliability 3.6% 30.2% 45% 15.9% 5.3%
Non-financial data: Insight 6.9% 27.6% 45% 16% 4.6%
1 Excellent 4
2 5 Poor
3 Acceptable
Respondents: 542
12 Forecasting with confidence – Section II
Written by the Economist Intelligence Unit

Forecasting with confidence – Section II 13
Key findings • Many organizations need to improve the quality, reliability and
insightfulness of the data they use to produce forecasts
• Organizations need to look beyond internal data sources to build a better picture of their future performance
• Scenario planning is emerging as a useful tool to address the uncertainty inherent in forecasting

Which of the following does your organization use in formulating forecasts?
% of respondents
0 20 40 60 80 100
Internal, historic financial data 81.6%
Internal, historic non-financial data and key66% performance indicators
Internally generated scenarios relevant to 58.8% future of the organization
Market reports and competitive data 57.9%
Government and other 40.1% economic forecasts
Risk and probability assessments 34%
Data on non-economic risks that might affect 22.2% supply chains, operations or markets Externally generated scenarios relevant to 18%
future of the organization
Other, please specify 1.8%
Don’t know/Not applicable 0.6%
Respondents: 544
14 Forecasting with confidence – Section II
Although the majority use internally
generated historic information and
scenarios, only 40 percent also consider
government or other economic reports
and just over one-fifth look at data on
non-economic risks that could have
important impacts on markets
or operations.
Whatever data is fed into the process inherently contains a degree of uncertainty.
Not surprisingly, two of the four
areas where organizations see most
forecasting errors are ones where such
external sources might help: consumer
demand (38 percent) and economic
drivers (29 percent). The most accurate
forecasters do look further afield: 68
percent of them use market reports,
for example, against just 55 percent
of their peers. Every organization
interviewed for this study made use
of some outside information: the trick
seems to be finding easily accessible,
relevant data.
The biggest difficulty, however, arises
from a conceptual problem. Whatever
data is fed into the process inherently
contains a degree of uncertainty.
Sometimes this makes accuracy very
difficult. Unibail Rodamco’s Van Rossum
splits possible forecast inputs into
“what we can influence and what we
cannot”. The latter includes, for example,
the potentially volatile market value
of the firm’s property assets, so they
leave that out of financial projections.
Jean-Sebastien Couillard, CFO of Toronto-
Hydro Corporation, a large Ontario
electricity distributor, similarly explains
that the weather can play havoc with
rigorous company projections, and
Rudolph says that some consumer or
competitor behaviours are not always
predictable and are often irrational.
Richard O’Brien, co-founder of Outsights,
a London-based strategic consultancy
which specializes in scenario building,
also has long experience of forecasting,
having served as chief economist of
American Express Bank. He remembers
seeing many single figure forecasts
unable to address “this horrible thing
called risk which is outside your control
and sometimes doesn’t want to play
ball.” Indeed, on occasion he has seen
organizations change economists rather
than address difficult-to-quantify risks.
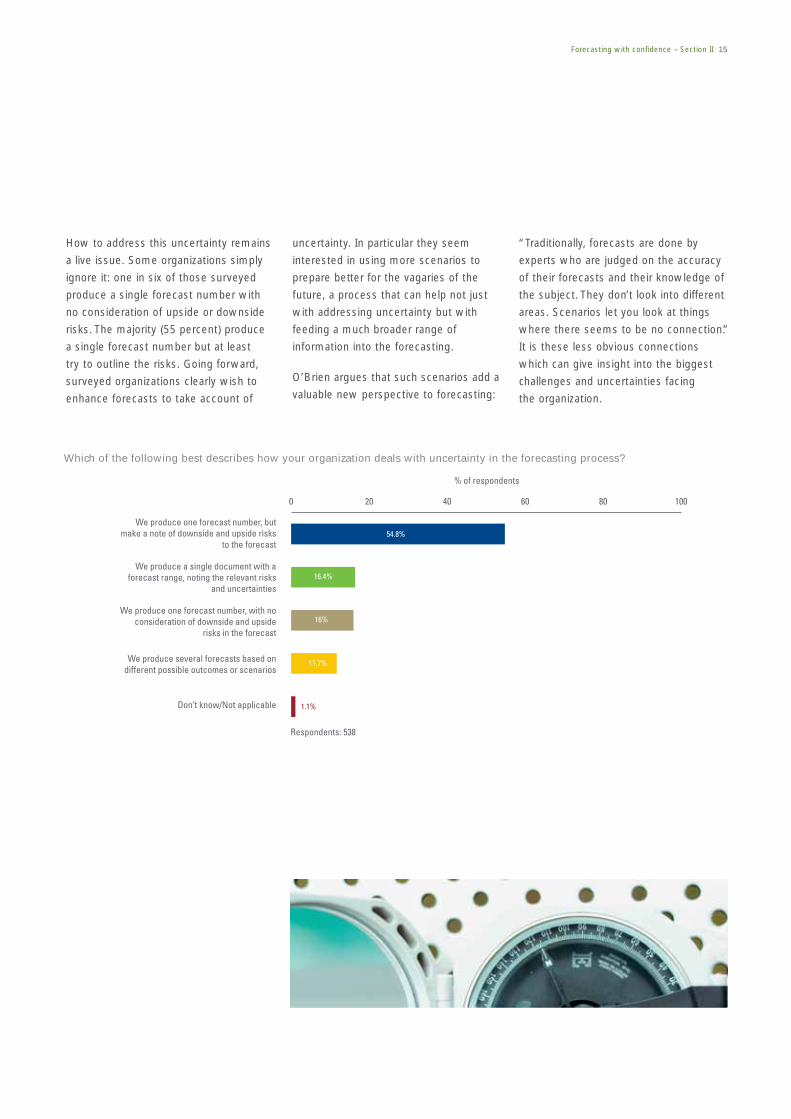
Which of the following best describes how your organization deals with uncertainty in the forecasting process?
% of respondents
0 20 40 60 80 100
We produce one forecast number, but make a note of downside and upside risks 54.8%
to the forecast
We produce a single document with a forecast range, noting the relevant risks 16.4%
and uncertainties
We produce one forecast number, with no consideration of downside and upside 16%
risks in the forecast
We produce several forecasts based on 11.7% different possible outcomes or scenarios
Don’t know/Not applicable 1.1%
Respondents: 538
Forecasting with confidence – Section II 15
How to address this uncertainty remains
a live issue. Some organizations simply
ignore it: one in six of those surveyed
produce a single forecast number with
no consideration of upside or downside
risks. The majority (55 percent) produce
a single forecast number but at least
try to outline the risks. Going forward,
surveyed organizations clearly wish to
enhance forecasts to take account of
uncertainty. In particular they seem
interested in using more scenarios to
prepare better for the vagaries of the
future, a process that can help not just
with addressing uncertainty but with
feeding a much broader range of
information into the forecasting.
O’Brien argues that such scenarios add a
valuable new perspective to forecasting:
“Traditionally, forecasts are done by
experts who are judged on the accuracy
of their forecasts and their knowledge of
the subject. They don’t look into different
areas. Scenarios let you look at things
where there seems to be no connection.”
It is these less obvious connections
which can give insight into the biggest
challenges and uncertainties facing
the organization.

16 Forecasting with confidence – Section II
Forecasting in the public sector
Public sector organizations may not need to worry about shareholder value, but they face their own challenges in using the forecasts to drive performance.
Toronto Hydro Corporation is the largest municipally controlled electricity distributor in Canada, with annual revenues of around US$2.1 billion. Entirely owned by the city of Toronto, it has a monopoly on electricity provision there.
Accordingly, notes CFO Jean-Sebastian Couillard, “we don’t have a sales force, and don’t have to tell sales people off about forecast numbers.” Instead, he explains, what is very different for his organization compared with the private sector is the strict regulation of its prices and activities.
Couillard periodically faces a rigorous, quasi-judicial regulatory review “where you have to defend all your costs” not just to the regulator but to lawyers of other stakeholders who have the right to intervene in the proceedings. This scrutiny forces the corporation to have more discipline. In particular, the tariffs that Toronto Hydro is permitted to charge are based on forecasts of its costs. Says Couillard, “The better I am
at estimating future costs, the better it is for the business.”
“Our ability to forecast is paramount to delivering expected earnings. We’re very cognisant that if we are too aggressive (in estimating costs), we run the risk of not getting the needed rates, and if we are too conservative, the customer pays too much.”
“The budget is not just a planning tool. It also becomes a statement of intent in terms of spending and priorities, to which the organization is held accountable.”
Another issue for the organization has been its recent shift from a not-for-profit body to an organization run on business lines. The adoption of monthly rolling forecasts has required a long-term educational process so that managers now think in terms of rapid responses to risks and opportunities rather than, as previously, focusing on protecting budgets by spending everything before year-end. The current use of forecasts for strategy and performance management shows that, despite differences, the public and private sectors can each benefit from the process.
Across the Atlantic, Britain’s public service accountancy body has also been investigating forecasting’s public sector role. The Chartered Institute of Public Finance and Accountancy (CIPFA) has been conducting a study on improving public financial planning through various means, including rolling forecasts.
Tom Lewis, assistant director, policy and technical, explains that using rolling forecasts to fully replace budgets would be impossible. In much of the public sector, “the budget is not just a planning tool. It also becomes a statement of intent in terms of spending and priorities, to which the organization is held accountable.” Regularly revised forecasts therefore could not replace the yearly cycle by which legal authorization is given for spending and, in some cases, taxes are set.
However, Lewis also believes, as budgets are usually developed well in advance of the year to which they relate, the use of rolling forecasts can be a valuable additional tool for management. They can improve the effectiveness of monitoring by recognizing the context of changing circumstances as these occur.
Written by the Economist Intelligence Unit

Forecasting with confidence – Section II 17
KPMG comment Reliable forecasting can produce business insight
Leading organizations use the forecasting
process to develop insight into the
business, assess future opportunities,
identify risks and refine the business
strategy. They enhance the quality and
reliability of the forecast information in
three important ways:
1 They incorporate the information
across a number of dimensions,
not just internal financials, and focus
on what really drives the business
2 They ensure rigorous governance
processes and control over data to
enhance reliability
3 They use scenario planning and
sensitivity analysis to assess and
deal with uncertainty
Use financial and non-financial
information
Rather than building forecasts solely
around static, detailed, internal data that
are relatively easy to predict, leading
organizations focus on the key dynamic
internal and external business drivers that
concern management – critical issues
such as customer demand, competitor
activity, and economic conditions.
Although perhaps somewhat more
difficult to obtain and predict, these
measures provide greater value and
insight into the business environment
than purely internal details.
Ensure strong governance
and control
Given that forecasting data is derived
from multiple sources, and the potential
for inaccuracy is high, strong governance
and control are needed to ensure data
reliability. Finance functions manage and
monitor the processes, data definitions,
and controls of the month-end close with
considerable rigor, and they should bring
a similar discipline to forecasting. Indeed,
leading organizations have adopted
rigorous governance and control practices
around their forecasting processes.
Proactively deal with uncertainty
Despite measures to enhance data
quality, forecasting is still difficult
and dependent on many factors.
Leaders recognize these challenges
and make use of a wide variety
of methods of varying degrees of
sophistication to deal with the
uncertainty inherent in forecasting.
Tools such as range forecasts, scenario
planning, sensitivity analysis, and
simulations help measure and quantify
risks and opportunities as well as
facilitate the development and, if
necessary, the implementation of
contingency plans ahead of those
organizations that provide static,
one-dimensional views of the future.

Section III Forecasting technology: help or hindrance?
Organizations hope that One fundamental problem is that not all a consistent definition of what the
technology improvements organizations have integrated planning information we are asking for actually is.”
can do much to alleviate systems. This can cause difficulties, Roder believes AIG’s adoption of a
their forecasting problems. especially after mergers or acquisitions common ERP platform will help them
when, in Gibbins’s words, diverse “end up with one version of the truth” When asked what would systems “tend to be bolted on”. rather than disagreements over the data.
increase confidence in their forecasts, the most common The lack of a single, satisfactory Ninety-six percent of organizations reply in our survey was technology platform for forecasting is still rely on spreadsheets for at least automation, cited by 42 part of their forecasting process. emphasized by the fact that some 96
percent. But current technology percent of organizations still rely on
solutions often aren’t working: Rudolph says that Vodafone, which has spreadsheets for at least part of their
for example, 35 percent “polyglot” planning tools across its forecasting process.
considered the technology subsidiaries which it eventually intends
currently deployed a notable to replace, in the meantime has “put a
impediment. lot of effort into making sure we have
0 10 20 30 40 50
Percentage of companies using only spreadsheets to produce forecasts
% of respondents
All respondents 40%
Most accurate 28%
Low to average accuracy 44%
Respondents: 506
18 Forecasting with confidence – Section III
Written by the Economist Intelligence Unit

Forecasting with confidence – Section III 19
Key findings:• Technology is currently one of the major impediments to
forecasting, but is also seen as one of the key tools that could help improve forecasts
• Four out of ten organizations in the survey rely solely on spreadsheets to produce forecasts
• Advanced software can help improve the forecast, providing it is combined with better processes, data and a company-wide commitment to producing reliable forecasts
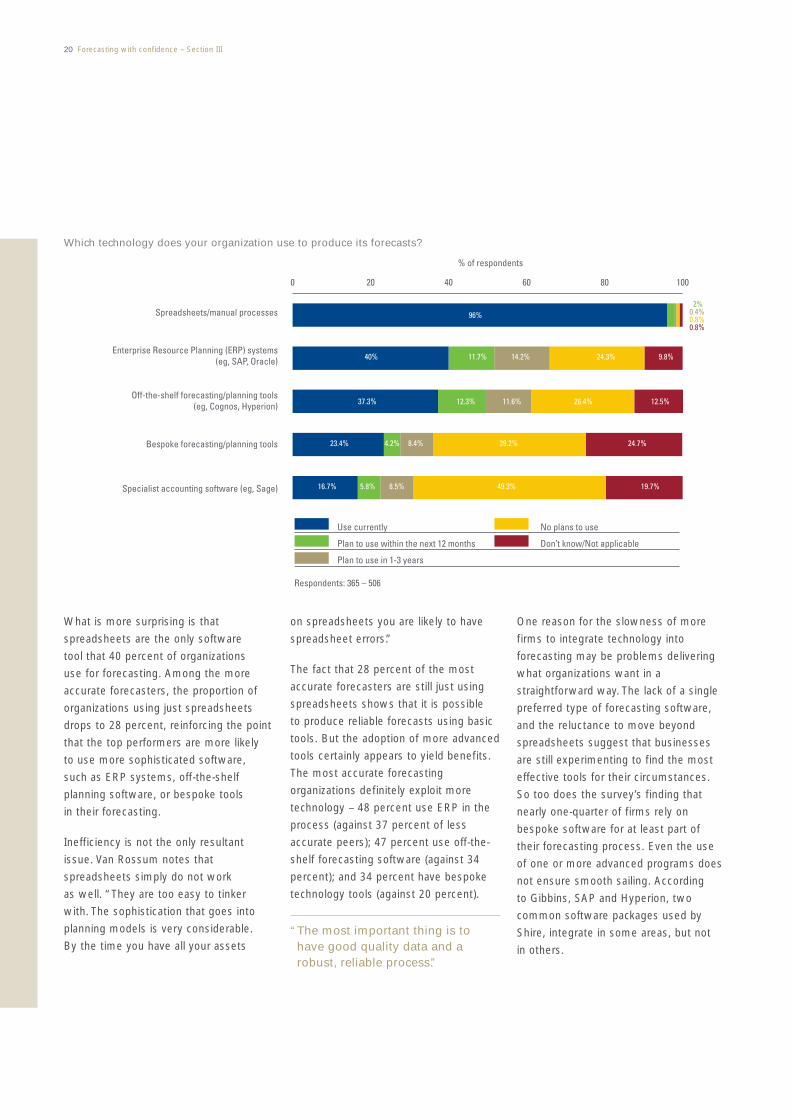
Which technology does your organization use to produce its forecasts?
% of respondents
0 20 40 60 80 100
96% 2%
0.4%Spreadsheets/manual processes 0.8% 0.8%
Enterprise Resource Planning (ERP) systems (eg, SAP, Oracle)
Off-the-shelf forecasting/planning tools (eg, Cognos, Hyperion) 12.3% 11.6%37.3%
24.3%
12.5%
9.8%40% 14.2%11.7%
26.4%
Bespoke forecasting/planning tools
Specialist accounting software (eg, Sage)
Use currently
4.2% 39.2%8.4%23.4% 24.7%
19.7%49.3%8.5%5.8%16.7%
No plans to use
Plan to use within the next 12 months Don’t know/Not applicable
Plan to use in 1-3 years
20 Forecasting with confidence – Section III
What is more surprising is that
spreadsheets are the only software
tool that 40 percent of organizations
use for forecasting. Among the more
accurate forecasters, the proportion of
organizations using just spreadsheets
drops to 28 percent, reinforcing the point
that the top performers are more likely
to use more sophisticated software,
such as ERP systems, off-the-shelf
planning software, or bespoke tools
in their forecasting.
Inefficiency is not the only resultant
issue. Van Rossum notes that
spreadsheets simply do not work
as well. “They are too easy to tinker
with. The sophistication that goes into
planning models is very considerable.
By the time you have all your assets
Respondents: 365 – 506
on spreadsheets you are likely to have
spreadsheet errors.”
The fact that 28 percent of the most
accurate forecasters are still just using
spreadsheets shows that it is possible
to produce reliable forecasts using basic
tools. But the adoption of more advanced
tools certainly appears to yield benefits.
The most accurate forecasting
organizations definitely exploit more
technology – 48 percent use ERP in the
process (against 37 percent of less
accurate peers); 47 percent use off-the
shelf forecasting software (against 34
percent); and 34 percent have bespoke
technology tools (against 20 percent).
“The most important thing is to have good quality data and a robust, reliable process.”
One reason for the slowness of more
firms to integrate technology into
forecasting may be problems delivering
what organizations want in a
straightforward way. The lack of a single
preferred type of forecasting software,
and the reluctance to move beyond
spreadsheets suggest that businesses
are still experimenting to find the most
effective tools for their circumstances.
So too does the survey’s finding that
nearly one-quarter of firms rely on
bespoke software for at least part of
their forecasting process. Even the use
of one or more advanced programs does
not ensure smooth sailing. According
to Gibbins, SAP and Hyperion, two
common software packages used by
Shire, integrate in some areas, but not
in others.
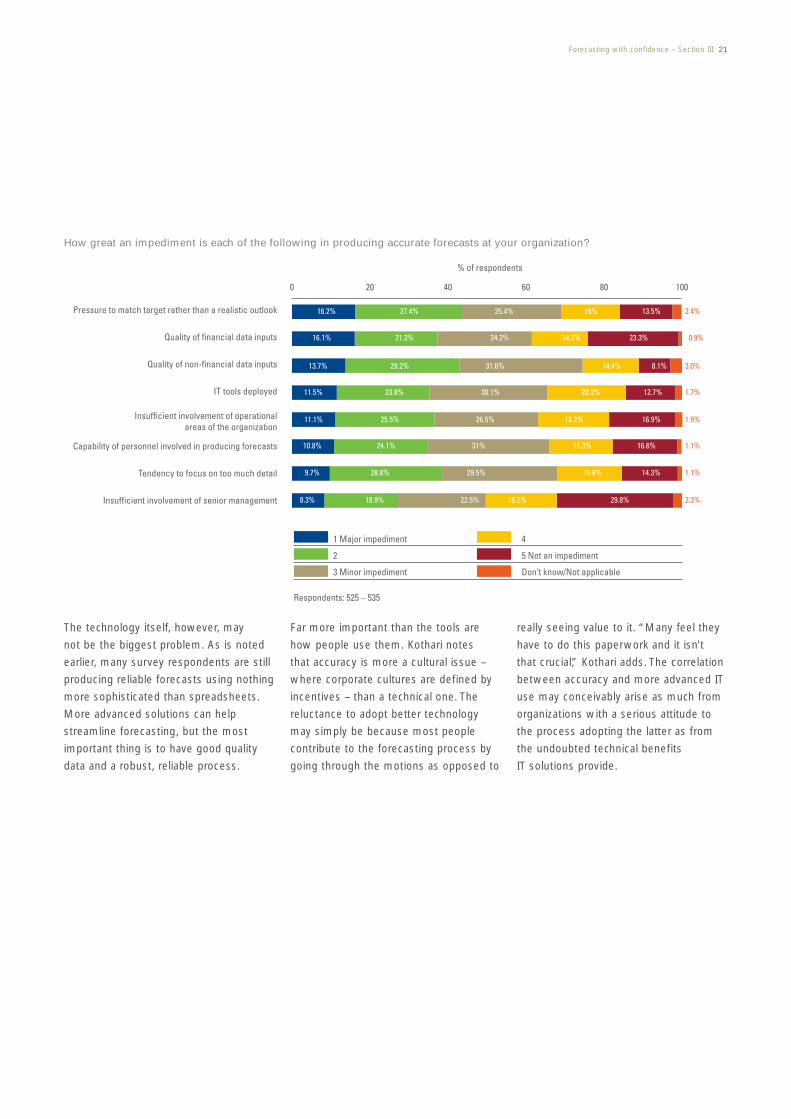
How great an impediment is each of the following in producing accurate forecasts at your organization?
% of respondents
0 20 40 60 80 100
Pressure to match target rather than a realistic outlook 16.2% 27.4% 25.4% 15% 13.5% 2.4%
Quality of financial data inputs 16.1% 21.2% 24.2% 14.3% 23.3% 0.9%
Quality of non-financial data inputs 13.7% 29.2% 31.6% 14.4% 8.1% 3.0%
IT tools deployed 11.5% 23.8% 30.1% 20.2% 12.7% 1.7%
Insufficient involvement of operational 11.1% 25.5% 26.5% 18.2% 16.9% 1.9% areas of the organization
Capability of personnel involved in producing forecasts 10.8% 24.1% 31% 16.3% 16.6% 1.1%
Tendency to focus on too much detail 9.7% 28.8% 29.5% 16.6% 14.3% 1.1%
Insufficient involvement of senior management 8.3% 18.9% 22.5% 18.2% 29.8% 2.3%
1 Major impediment 4
2 5 Not an impediment
3 Minor impediment Don’t know/Not applicable
Forecasting with confidence – Section III 21
The technology itself, however, may
not be the biggest problem. As is noted
earlier, many survey respondents are still
producing reliable forecasts using nothing
more sophisticated than spreadsheets.
More advanced solutions can help
streamline forecasting, but the most
important thing is to have good quality
data and a robust, reliable process.
Respondents: 525 – 535
Far more important than the tools are
how people use them. Kothari notes
that accuracy is more a cultural issue –
where corporate cultures are defined by
incentives – than a technical one. The
reluctance to adopt better technology
may simply be because most people
contribute to the forecasting process by
going through the motions as opposed to
really seeing value to it. “Many feel they
have to do this paperwork and it isn’t
that crucial,” Kothari adds. The correlation
between accuracy and more advanced IT
use may conceivably arise as much from
organizations with a serious attitude to
the process adopting the latter as from
the undoubted technical benefits
IT solutions provide.

22 Forecasting with confidence – Section III
Forecasting with confidence – Section III 23
KPMG comment Technology alone is not the answer
While many respondents cited
technology as a key enabler to improving
their forecasting capabilities, getting the
processes and data right is a critical first
step. Technology can be a significant
investment; to obtain its benefits,
organizations must concentrate on
aligning both their processes and data
with technology to avoid the risks of
automating a broken process that uses
unreliable data.
The first priority in leveraging the
technology investment is to establish an
overall framework for how forecasting fits
within the management of the business.
Organizations need to understand
strategically how forecasting can benefit
them. They need to determine what
they want from it and then ensure the
supporting processes are designed and
built in the context of those expectations.
Spreadsheets are still ubiquitous despite the availability and sophistication of modern planning tools.
The process requirements need to be
properly framed and designed in the
context of specific business objectives
and the manner in which forecasting
will be integrated into the business
performance management framework
and processes.
The second priority is the data –
specifically, the architecture, integrity,
control, and security of the data feeding
into the forecasting process. Leaders
ensure that they create executive
ownership for data and governance,
maintain clear and robust management
and control processes, and ensure
common data structures and standard
definitions. Sourcing data across
multiple systems, defining standard
data structures and definitions, and
establishing centralized governance
processes to manage and control data
on an organization-wide basis are all
critical to ensuring that the maximum
returns are gained from the investment
in forecasting technology.
As for the technology itself, spreadsheets
are still ubiquitous despite the availability
and sophistication of modern planning
tools. The power of spreadsheets means
that they will always have some role for
individual planners. To be effective, they
need to be integrated into an effective
forecasting process – one that is
collaborative and organization-wide,
controlled, and standardized.
Exploiting the capabilities of purpose-built planning tools is therefore critical to enabling an effective and reliable forecasting process.
Furthermore, it is inherently difficult to
effectively integrate spreadsheet models
with transactional systems, external data
sources such as supplier and customer
systems, management information, and
reporting and analysis tools. Exploiting
the capabilities of purpose-built planning
tools is therefore critical to enabling an
effective and reliable forecasting process
that is at the heart of the organization’s
performance improvement cycle.
Faced with a wide array of choices when
investing in technology, organizations
must understand how to leverage their
current technology and augment its
capabilities to create a forecasting
system that is scaleable, flexible, and
integrated with other systems.

% of respondents
0 10 20 30 40 50
42.3% Automation through IT systems/tools
41.9% More scenario planning and sensitivity analysis
39.9% Rolling forecasts
34.6% duction in detail and greater focus on key business drivers
34.4% Improved quality of input data
Respondents: 544
24 Forecasting with confidence – Section IV
Re
Written by the Economist Intelligence Unit
Section IV The practice of forecasting: moving beyond process
The practice of forecasting in organizations has both cultural and practical elements. Before turning to the former, more important area, it is worth noting where our survey points to process areas in which organizations can make adjustments to improve the reliability and utility of their forecasting. In essence, the more you put in, the more you get out.
As can be seen from the accompanying
graph, the three initiatives that
executives in the survey thought would
do most to improve confidence in the
forecast were IT automation, more
scenario planning and sensitivity analysis,
and the use of rolling forecasts. The first
two areas have already been discussed,
but what of the pros and cons of the
rolling forecast?
Frequent forecasting helps alert people to differences from expectations early.
Certainly the organizations with better
forecasts in the survey do them more
frequently: 58 percent of this group
review theirs at least monthly compared
with 44 percent of other firms.
Couillard explains that frequent
forecasting helps alert people to
differences from expectations early and
Rudolph notes that through the practice
“variances are drummed out. People
have to understand and explain why
their forecasts didn’t match with actuals.”
Which of the following has/would give your organization most benefit in improving the confidence of forecasts? (Top five are shown.)

Forecasting with confidence – Section IV 25
Key findings: • Rolling forecasts are becoming increasingly popular as a way
to ensure that organizations keep pace with a rapidly changing business environment
• Leading organizations are more likely to involve their operational managers in the forecasting process
• Senior executives need to demand reliable forecasts that drive decision-making and performance management

% of respondents
0 10 20 30 40 50
Quarterly 34.7%
Monthly 33.2%
Bi-annually 8.9%
Annually
Continuously
6.8%
6.1%
Event / exception driven
Daily
Weekly 4.1%
3.3%
0.4%
Not performed on a regular basis 2.6%
Not performed at all 0%
Respondents: 542
26 Forecasting with confidence – Section IV
Over two-thirds of respondents use rolling forecasts in some form.
In addition to improving accuracy,
Van Rossum notes that regular bottom
up forecasts have a broader benefit
for those that apply these numbers to
strategy and performance management.
“It gives you the opportunity to
proactively take corrective action for
Kothari credits their popularity to the
rapidly changing business environment.
“In general, static forecasts are too
little. Rolling forecasts adapt to new
information. If you are rigid and not
willing to make adjustments, you are
at a competitive disadvantage.”
Shire Pharmaceutical has just started
this practice, but already Gibbins sees
improvements in accuracy.
quickly. The forecast is the process we
really use for the senior management
committee,” he comments.
Another practical issue relates to
who generates the forecast. The more
accurate organizations are more likely
to have operational and line managers
do the work (40 percent to 34 percent).
These managers are much closer to
where business decisions are being what isn’t going in the way you want.
It helps management focus on the
things that are really important.”
Over two-thirds of respondents in
the survey use rolling forecasts in
some form. Forty percent using rolling
forecasts believe that they either
already have or will increase
forecasting confidence.
It is therefore important that the forecasting process has buy-in from executives across the organization.
He considers rolling forecasts one of
the best ways to keep expectations
reasonably in line with those of the
market and, more important, to have
good data to feed into planning. “The
budget becomes out-of-date pretty
made and therefore the data is much
more reliable. It is therefore important
that the forecasting process has buy-in
from executives across the organization.
“This is not a finance-driven game
at all,” says Roder of forecasting at AIG.
“Country managers help with the
process. You can’t underestimate the
importance of that side of it in a life
How frequently are your organization’s forecasts updated?

0 20
Which of the following statements are true within your organization?
40 60
% of respondents
80 100
Forecasting is integrated with planning and budgeting
Forecast data is the responsibility of operational line managers
0.4%
1.1%
94.8% 4.8%
16.5%82.3%
78.7% 19.3% 2.1%We forecast key balance sheet indicators
Managers are held accountable for delivering agreed forecasts
19.1%77.9% 3%
71.2% 26.2% 2.6%Our forecasting includes non-financial measures
We use rolling forecasts as a complement to our budget in forward planning 4.1%
We use rolling forecasts rather than traditional budgets in our forward planning
3%
True
False
Don’t know
68%
59%38%
27.9%
Forecasting with confidence – Section IV 27
insurer.” Van Rossum adds that, beyond
accuracy, working together gives a great
amount of ownership and helps internal
communication.
Although there are some general best
practices that can be adopted for
forecasting, interviews suggest that
a variety of different approaches work
well for different organizations. Mielsch
explains that Metro Cash and Carry,
which has been working very hard on
improving accuracy recently gave up on
rolling forecasts “because nobody looked
at them”. The correct level of resource
allocation is in particular a matter
of circumstance.
“Forecasting always has a tendency to be rather conservative, costs a bit overstated, revenues a bit understated.”
Respondents: 532 – 540
As Kothari points out, regularly updated
rolling forecasts are a good thing, but
you can have too much of a good thing:
“You don’t want to spend too much time
on forecasting and none on execution.”
Van Rossum agrees. Although Unibail
Rodamco uses a rolling approach for
some specific information where it is
essential, such as cash flow, for other
areas “going through a bottom-up
process is a huge amount of work,
so we do it once a year”.
Better technology, scenarios and rolling
forecasts may have a role to play in
improving confidence in the forecast.
But there remains a bigger, cultural
question of how committed organizations
are to reliable forecasting in the first place.
The survey results on forecasts against
actual results over the previous three
years were interesting not only for
their mean absolute deviation – 13
percent discussed earlier – but because
the answers had a surprisingly normal
distribution centred not around zero
percent, or matching forecast, which
might reasonably have been expected,
but around exceeding it by six-ten
percent. This suggests not that
organizations are bad at the practice so
much as that they are on average good
at bringing in forecasts which understate
performance by roughly eight percent,
even though share price data, as noted
earlier, indicates that accurate forecasters
grow faster in value.

Underplaying the forecast
Question asked respondents how their actual results varied from the forecast over the past three years. Taking the total sample average, companies are consistently forecasting around six-ten percent below actual performance.
% of respondents0 5 10 15 20 25 30
Greater than 50% below forecast 0.7%
31-50% below forecast 1.9%
21-30% below forecast 3.2%
16-20% below forecast 3.7%
11-15% below forecast 4.3%
6-10% below forecast 10.7%
0.1-5% below forecast 7.3%
0.1-5% above forecast 13.5%
6-10% above forecast 21.3%
11-15% above forecast 10.9%
16-20% above forecast 7.1%
21-30% above forecast 3.7%
31-50% above forecast 1.9%
Greater than 50% above forecast 0.6%
Respondents: 534
28 Forecasting with confidence – Section IV
What could account for this tendency
to underplay the forecast? Sutcliffe
has noticed that some national units
of Old Mutual “like to impress you
with a macho forecast… others always
want to beat their forecast” so the
initial suggested one “is usually low.”
Under-forecasting, however, is clearly
much more common, to a degree
because caution is part of the nature
of the exercise. Gibbins notes that
“forecasting always has a tendency
to be rather conservative, with
costs a bit overstated and revenues
a bit understated.”
The problem with “sandbagging” and “gaming” is that it interferes with good decision-making.
According to Kothari, company structures
also reward this practice. He points out
that employees are most concerned with
their own performance evaluation, so
to avoid failing to meet forecasts “they
lowball it”. Moreover, senior executives
can be just as guilty as bonus-protecting
employees. Some 44 percent of
respondents thought that pressure
to make forecasts match targets was
a notable impediment to accuracy.
In certain specific circumstances, this
practice can truly be beneficial to the
organization itself, especially with an eye
to investor opinion. A company that had
suffered a severe reaction to a profit
warning, for example, might decide that
it was better to accept an achievable
budget and pay high bonuses than to
stretch it and risk another profit warning.
The bonuses would cost less than hubris.

Forecasting with confidence – Section IV 29
The problem with “sandbagging” and
“gaming”, as various interviewees call
it, is that it interferes with good decision-
making. But overcoming this instinct
needs a concerted effort from senior
management.
The problem is not just about rewarding those who exceed forecasts.
Van Rossum notes that “human behavior
is not that easy to fight.” He says that if
you start rewarding people for such
activities, you will never get the truth.
Competing agendas over the purpose,
and therefore desired accuracy, of
forecasts may account for why so many
more organizations hope for strategic
insight from better forecasts than actually
have them play an important role in
strategy formation.
The focus on forecast accuracy, while
effective in achieving better predictions,
also raises what van Rossum calls “the
biggest challenge of the process”: how
to encourage accuracy without penalizing
those striving to beat expectations.
Kothari points out that the problem is
not just about rewarding those who
exceed forecasts. If an organization
wants to encourage risk taking, it must
understand that some experiments will
inevitably fail and not necessarily pay
people less for taking chances.

Challenger financial services group and rolling forecasts
Our survey shows that rolling forecasts US$40 billion under management or The new process is saving a lot of time.
are increasingly common as a administration, a number that has more Last year’s budget took three months
complement to, or even replacement for, than doubled in the last three years. from start to finish, and this year’s only
the budget process in forward planning. about five to six weeks, a number Amid this growth, the organization has In the Asia-Pacific region, a striking 57 Rogan hopes to reduce further. been, in Rogan’s words, “playing catchpercent have done so, against slightly up” to introduce rolling forecasts to over a quarter of firms in North America “Think through what actually drives supplement its existing long-range and Europe. In fact, only 13 percent value. A lot of the time this has planning. At the moment, the rolling of Asia-Pacific respondents did not nothing to do with standard forecasts look to the end of the current use these forecasts in some form. budgeting items.” financial year, but Challenger is in Paul Rogan, Group CFO at Challenger the process of moving to true rolling Financial Services in Australia, notes Individual functions are also finding the 18-month forecasts in 2007–2008. that “most ASX 100 companies have resultant forecasts a much improved
something of this nature in place”, tool. Those involved in investor relations, Although a relatively recent addition at
although with varying degrees of for example, can now see what Challenger, rolling forecasts are already
sophistication. communication issues will be facing helping to increase discipline in the them in the near future, and accordingly forecasting process. Rogan says people be more proactive and professional. “People often underplay their often underplay their forecast numbers
forecast numbers because they because they want to over-achieve. Most important, the switch to rolling want to over-achieve.” A rolling approach, which involves forecasts is helping the organization to regularly looking at the forecast, and run better overall, to such a degree as Challenger, a mid-cap Australian firm, at upside possibilities and downside to alter what divisional CEOs think of provides a range of products – including risks, encourages those involved to the group’s finance function. fund and asset management, mortgage “put the information on the table.”
lending and annuities – and has over
30 Forecasting with confidence – Section IV

Forecasting with confidence – Section IV 31
“We have moved from an environment where we would report backward only.”
Positive changes in this area began right
away. In order to set up these forecasts,
Rogan says people needed “to think
through what actually drives value. A lot
of the time this has nothing to do with
standard budgeting items.” This process
also led managers focused on different
sections of the organization to develop a
group-wide view. To outsiders, eighteen
months ago the company looked like
four separate businesses, but now
investors and even those inside the
company can see it as a whole.
Discussions in the reporting, forecasting
and budgeting process are now about
strategy and execution rather than
history. “We have moved from an
environment where we would report
backward only,” says Rogan. Now within
ten days – with a target of five days with
the aid of new analytical tools – the
organization can produce an entire pack
of data that gives a picture of the current
health of the business and where it will
be in six to nine months. This aspect is
the crux of the matter for Rogan.
Forecasting remains the “best guess of
a probable outcome”, he says. “The key
thing is not so much the accuracy of
the original forecast. It is how we react
when the forecast needs to change. It is
about taking actions, getting executives
and management thinking about both
upsides and downsides and
responding appropriately.”
Written by the Economist Intelligence Unit

32 Forecasting with confidence – Section IV
A new mindset at Metro Cash and Carry
Metro Cash and Carry (MCC), Germany-
based and operating in 28 countries,
is one of the world’s leading food
self-service wholesalers with a turnover
in 2006 of over US$40 billion. The
company has made a major effort in
recent years to improve its forecasting.
The key to this, according to Dr Christian
Mielsch, MCC’s chief administrative
officer, has been to introduce “a new
mindset” as well as merely improving
forecasting processes.
Disentangling forecasts from other corporate measures has also increased their reliability and usefulness.
Mielsch explains that the business
introduced new principles on forecasting.
The company has always set high
standards for the reporting of financial
data, but “now manipulating in forecasting
is as bad as manipulating actual figures”.
Because of its predictive nature, it is
admittedly “harder to track where you
are manipulating and where
you are making errors in predicting
the future, but there is now a clear
statement” which has altered attitudes.
Disentangling forecasts from other
corporate measures has also increased
their reliability and usefulness. MCC
now separates targets and forecasts.
Previously these were one and the same
thing, which meant that operating units
were reluctant to adjust the forecast.
The split has allowed forecasts to
become “much more oriented toward
action plans,” says Mielsch.
The tie between rewards and forecasts has been completely abolished.
The company sets top down targets
for units based entirely on country
benchmarks in clusters of country
development phases and business life
cycles. The forecasts, which are adjusted
monthly, highlight possible deviations
between targets and likely outcomes,
leading to discussions on how the
company can achieve its aims.
The tie between rewards and forecasts
has been completely abolished.
Managers have schemes entirely
independent of their budgets. In this
system, the “underpromise and
overperform” attitude and political
games with regard to setting up
budgets are gone.
Other changes in the approach have
helped bring improvement. The company
now has a greater emphasis on getting
the numbers right, with a forecasting
accuracy scorecard that measures
deviations on a monthly basis and ranks
reporting units. Balance sheet items also
receive attention, rather than just P&L
items, as previously.
Overall Mielsch says, “We have become
much better, are more sure of achieving
our goals, and are informed earlier
about deviations.” Improved forecasting
accuracy has also helped with strategy
and performance planning: “We know
what we are doing, so we are taking
action much earlier than in the past.”
Written by the Economist Intelligence Unit

Forecasting with confidence – Section IV 33
KPMG comment Reliable forecasting is a management discipline
Reliable forecasting is a discipline.
Those that excel at it may achieve
measurable value and are rewarded
in the marketplace. Leaders differ in
their forecasting practices in several
unique ways:
1 They treat it as a key management
process, involving the right people
2 They instill a culture that facilitates
quality forecasting
3 They align incentives to relative
performance rather than targets
Involve the right people
Leaders embrace forecasting as a core
business process, one that engages
operational decision-makers across the
business. They tap into their managers’
knowledge in real-time so their forecasts
mirror actual front-line events, and
managers remain engaged in the debate
about potential courses of action. In
this way, operational managers own
and are accountable for their forecasts,
and they value the process as a crucial
management responsibility.
Involving the right people in the process
also breaks down organizational silos and
enables managers to understand how
their decisions affect other parts of
the organization. As a result, enhanced
dialogue, openness, and a level of
integration between various parts of
the business emerge that enables
business managers to use the discipline
of forecasting to improve performance.
Instill forecasting into the culture
Leading organizations place a strong
emphasis on the importance and
reliability of the forecast. Within these
organizations, senior managers sponsor
and value the exercise, are visible
and active in the review, provide clear
direction and coaching, and follow up
on the actions arising from the process.
Only a shift in focus at the highest levels
will enable forecasting to evolve from
a rather arbitrary process to an effort
that actually helps leaders make better
decisions and build trust with
external stakeholders.
The first step to changing the culture is
to champion a realistic outlook of future
performance. Senior management should
uphold forecasting as a means of
enabling the business to manage the
gap between targets and anticipated
performance, rather than of resetting
targets. With this perspective, behavior
throughout the organization can
begin to change.
Align incentives to relative
performance
Incentives are often not appropriately
aligned and therefore can become a real
hindrance to sustainable improvement
in forecasting. Traditionally, “making
the budget” has been the key measure
of performance and driver of behavior.
Eliminating this link can eliminate
the “gaming” that may result when
rewards and incentives are tied to
budget performance and managers are
focused on hitting the budget at all costs.
Linking incentives to relative performance
(e.g., market performance, external
and internal peers, or key economic
conditions) rather than meeting a budget
that was set months ago is a significant
enabler to changing behavior.

34 Forecasting with confidence – Section V
Section V Conclusion
Organizations are not forecasting well, and it does matter. Poor forecasting not only shakes investor confidence, it prevents use of an extremely useful tool in strategy setting and performance management. With forecasts diverging from actual by an average of 13 percent, there is a huge window of opportunity for organizations that work on excelling in this area.
Fortunately, application and resources,
not rocket science, will take organizations
much of the way. Improving data
generated internally, seeking out good
external information, taking into account
the implications of uncertainty, leveraging
appropriate information technology, and
getting operational managers involved
in regular forecasting will all improve
reliability.
These measures, however, rather than
isolated process improvements, need
to be part of a broader cultural shift
within organizations. The forecasting
process needs to change from being
seen as an inconvenient waste of time
which at best requires manipulation to
improve pay packages, to a means of
generating data that is important for
the successful management of the
organization. If businesses make sure
that they are giving this message, then
questions of employee buy-in, the correct
level of resources to commit to the
process, and balancing forecast accuracy
with encouraging excellence all become
much more straightforward. As a result,
rather than providing feared drudgery,
the forecast actually can help
organizations increase their value.
Written by the Economist Intelligence Unit

Forecasting with confidence – Section V 35
The forecasting process needs to change from being seen as an inconvenient waste of time to a means of generating data that is important for the successful management of the organization.

36 Forecasting with confidence – Section V
The next step is to link the forecasting process to ongoing planning and management reporting and embed it within the organization.

Forecasting with confidence – Section V 37
KPMG comment Forecasting, the next step in the business transformation journey
KPMG member firms believe that the
key to reliable forecasting is the ability
to draw together culture, process and
internal and external data into a balanced
and cohesive framework enabled by
technology. While getting it right is
difficult, it is critical: reliable forecasting
is at the heart of the business
performance management process
and creates measurable business
value over the long term.
For us, there are three key areas that
need to be addressed and balanced
appropriately if the finance function is
to lead this change. Leaders need to:
1 Apply rigor to the forecasting process
2 Use it as a core management tool
3 Embed forecasting discipline into
the culture and day-to-day activity
of the organization.
Leading CFOs are able to find the right
balance for their organization. As finance
functions continue to innovate and
transform their capabilities, reliable
forecasting presents an opportunity
to drive business value well beyond
the “walls of finance.” Forecasting
is a key next step in the business
transformation journey as finance
organizations focus their attention on
performance management, business
intelligence, decision support and
enterprise risk management.
An approach
The finance function needs to build
consensus and commitment around a
common vision of forecasting as a core,
organization-wide management process
and then translate that vision into a viable
process couched in “the language of the
business” and a pragmatic improvement
plan. The next step is to link the
forecasting process to ongoing planning
and management reporting, and embed
it within the organization.
The challenge is then to determine how
to close identified gaps. The focus should
be on processes, information, people,
governance and systems.
The results
Transforming forecasting can result in:
• Reliable financial and business
projections
• Greater agility – the ability to quickly
sense and respond to changes in the
increasingly dynamic business
environment
• Increased transparency into future
business opportunities
• Improved ability to manage uncertainty
and risk
• Improved basis for dialog with external
stakeholders, enhancing trust and
increasing confidence
• Increased shareholder value
Across KPMG firms, we wish you
well as you create a leading
forecasting discipline.

38 Forecasting with confidence – Appendix
Appendix Survey results
This research was conducted by the Economist Intelligence Unit in 2007. The 544 senior executives who responded to the survey were drawn from a cross-section of industries and included 168 CFOs. Each respondent was confirmed to have involvement in the financial forecasting process in their organization. What follows is a compilation of the survey results as well as detail about the respondents and their organizations.

0 20
1. Which of the following statements are true within your organization?
40 60
% of respondents
80 100
Forecasting is integrated with planning and budgeting
Forecast data is the responsibility of operational line managers
0.4%
1.1%
94.8%
82.3%
4.8%
16.5%
78.7% 19.3% 2.1%We forecast key balance sheet indicators
Managers are held accountable for delivering agreed forecasts 3%
Our forecasting includes non-financial measures 2.6%
We use rolling forecasts as a complement to our budget in forward planning
We use rolling forecasts rather than traditional budgets in our forward planning
3%
4.1%
True
False
Don’t know
77.9%
71.2%
68%
38% 59%
19.1%
26.2%
27.9%
Respondents: 532 – 540
Quarterly 34.7%
Monthly 33.2%
Bi-annually 8.9%
Annually
Continuously
6.8%
6.1%
Event / exception driven
Daily
Weekly 4.1%
3.3%
0.4%
Not performed on a regular basis 2.6%
Not performed at all 0%
Respondents: 542
Forecasting with confidence – Appendix 39
2. How frequently are your organization’s forecasts updated?
% of respondents
0 10 20 30 40 50
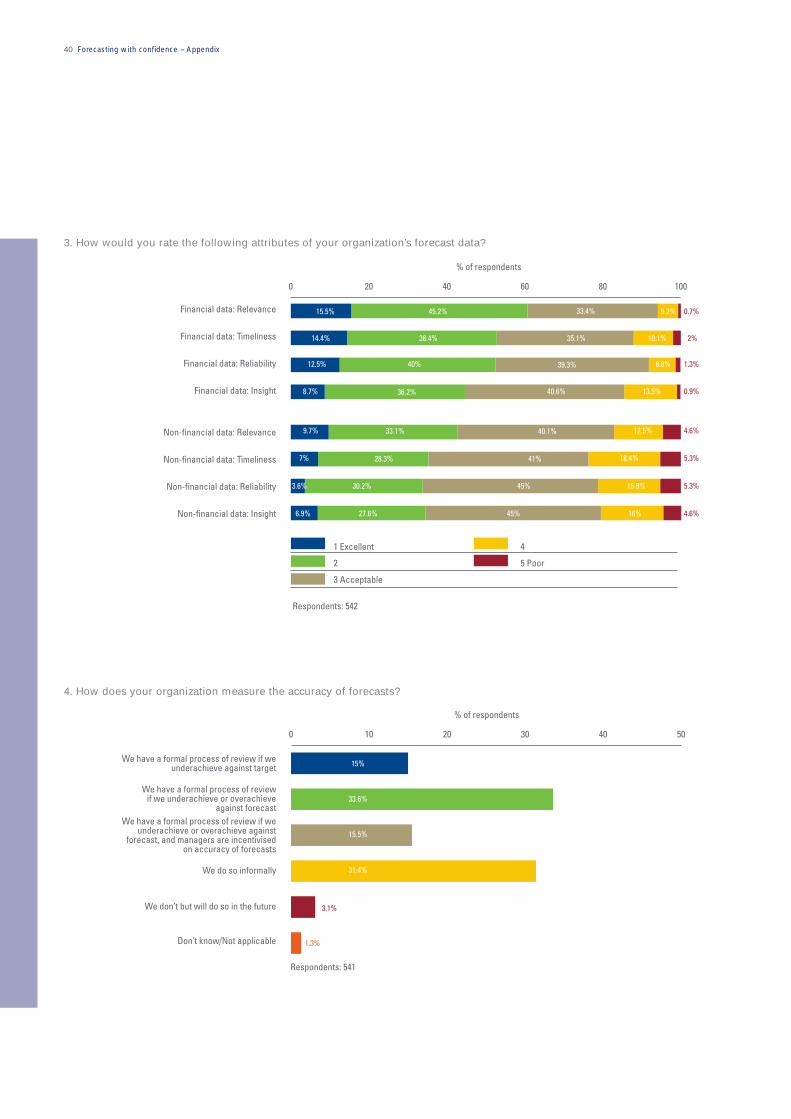
3. How would you rate the following attributes of your organization’s forecast data?
% of respondents
0 20 40 60 80 100
Financial data: Relevance 0.7%
Financial data: Timeliness 2%
Financial data: Reliability 1.3%
Financial data: Insight 0.9%
Non-financial data: Relevance 4.6%
Non-financial data: Timeliness 5.3%
Non-financial data: Reliability 5.3%
Non-financial data: Insight 4.6%
1 Excellent 4
2 5 Poor
3 Acceptable
6.9% 27.6%
28.3%
36.2%
33.1%9.7%
7%
30.2%3.6%
12.5%
15.9%
16%
45%
40.1%
18.4%
45%
41%
15.5% 45.2% 33.4% 5.2%
10.1%
12.5% 39.3%40% 6.8%
40.6%8.7%
35.1%38.4%14.4%
13.5%
Respondents: 542
4. How does your organization measure the accuracy of forecasts?
% of respondents
0 10 20 30 40 50
We have a formal process of review if we underachieve against target
We have a formal process of review if we underachieve or overachieve
against forecast We have a formal process of review if we
underachieve or overachieve againstforecast, and managers are incentivised
on accuracy of forecasts
We do so informally
We don’t but will do so in the future
Don’t know/Not applicable
33.6%
31.4%
15.5%
15%
3.1%
1.3%
Respondents: 541
40 Forecasting with confidence – Appendix

% of respondents 0 5 10 15 20 25 30
Greater than 50% below forecast 0.7%
31-50% below forecast
21-30% below forecast
16-20% below forecast
11-15% below forecast
6-10% below forecast
0.1-5% below forecast
No divergence between forecast and actual 0.9%
0.1-5% above forecast
6-10% above forecast
11-15% above forecast
16-20% above forecast
21-30% above forecast
31-50% above forecast
Greater than 50% above forecast 0.6%
Don’t know/Not applicable
Respondents: 534
7.3%
10.7%
4.3%
3.7%
3.2%
1.9%
1.9%
3.7%
13.5%
7.1%
21.3%
10.9%
8.2%
33.2%
% of respondents
0 10 20 30 40 50
The incentive is primarily based on whether they hit budget
The incentive is primarily based on the manager’s actual performance relative to
their performance in the prior year
The incentive is primarily based on the manager’s own performance relative to
peer performance within the industry
All these factors are taken into account
Other, please specify
Don’t know/Not applicable
46.4%
11.5%
6.1%
4.4%
5.5%
26.1%
Respondents: 541
Forecasting with confidence – Appendix 41
5. Has there been a variance between your forecast performance and your actual performance over the last three years, and if so, what was the approximate variance?
6. How are incentives used in your organization to drive managers’ performance?
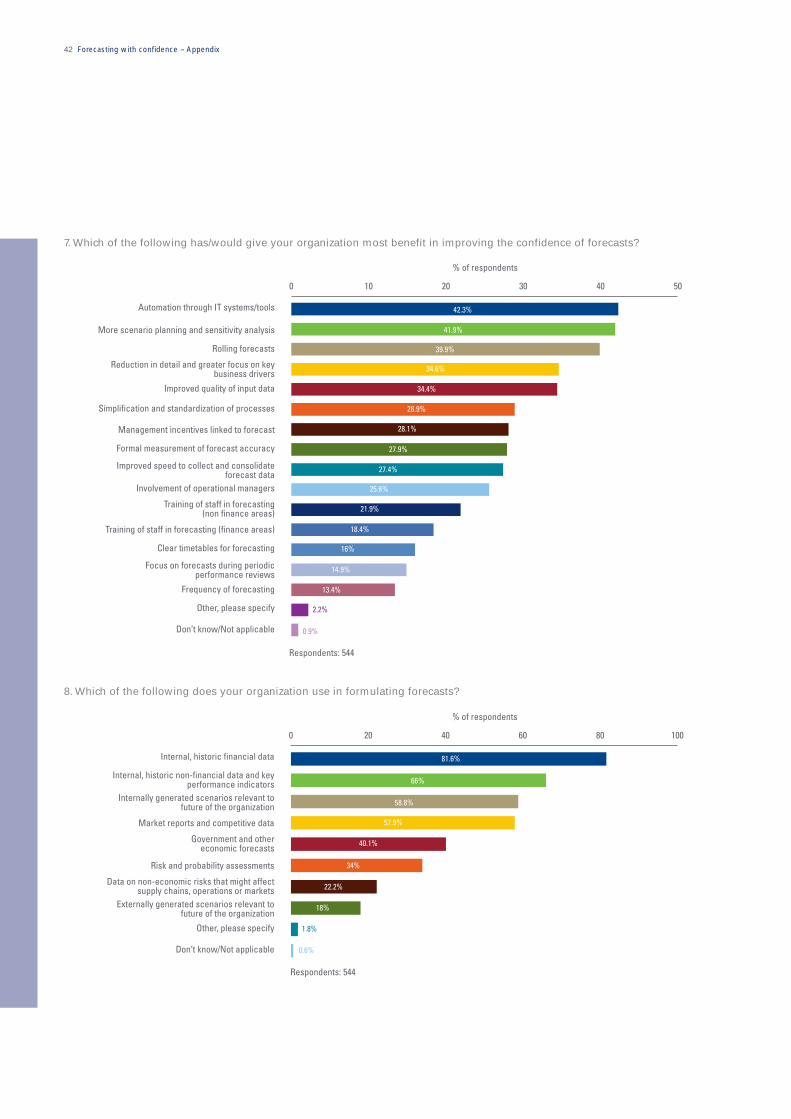
7. Which of the following has/would give your organization most benefit in improving the confidence of forecasts?
% of respondents
0 10 20 30 40 50
Automation through IT systems/tools 42.3%
More scenario planning and sensitivity analysis 41.9%
Rolling forecasts 39.9%
Reduction in detail and greater focus on key 34.6% business drivers
Improved quality of input data 34.4%
Simplification and standardization of processes 28.9%
Management incentives linked to forecast 28.1%
Formal measurement of forecast accuracy 27.9%
Improved speed to collect and consolidate 27.4% forecast data
Involvement of operational managers 25.6%
Training of staff in forecasting 21.9% (non finance areas)
Training of staff in forecasting (finance areas) 18.4%
Clear timetables for forecasting 16%
Focus on forecasts during periodic 14.9% performance reviews
Frequency of forecasting 13.4%
Other, please specify 2.2%
Don’t know/Not applicable 0.9%
Respondents: 544
8. Which of the following does your organization use in formulating forecasts?
% of respondents
0 20 40 60 80 100
Internal, historic financial data 81.6%
Internal, historic non-financial data and key66% performance indicators
Internally generated scenarios relevant to 58.8% future of the organization
Market reports and competitive data 57.9%
Government and other 40.1% economic forecasts
Risk and probability assessments 34%
Data on non-economic risks that might affect 22.2% supply chains, operations or markets Externally generated scenarios relevant to 18%
future of the organization
Other, please specify 1.8%
Don’t know/Not applicable 0.6%
Respondents: 544
42 Forecasting with confidence – Appendix

9. Which of the following best describes who is responsible for preparing forecasts for your organization?
% of respondents
0 10 20 30 40 50
Operational line managers including finance, sales, marketing, supply chain and 34.6%
other cost/profit centre managers 33.2%
Individuals in the finance function for 26.9% which it is one of numerous responsibilities
A largely finance-led team with 23.3% representatives from other functions
A dedicated forecasting team within the 12.4% finance function
Other, please specify 2.4%
Don’t know/Not applicable 0.4%
Respondents: 540
10. Which technology does your organization use to produce its forecasts?
% of respondents
0 20 40 60 80 100
2% Spreadsheets/manual processes 96% 0.4%
0.8% 0.8%
Enterprise Resource Planning (ERP) systems 40% 11.7% 14.2% (eg, SAP, Oracle) 24.3% 9.8%
Off-the-shelf forecasting/planning tools37.3% 12.3% 11.6% (eg, Cognos, Hyperion) 26.4% 12.5%
Bespoke forecasting/planning tools 23.4% 4.2% 8.4% 39.2% 24.7%
Specialist accounting software (eg, Sage) 16.7% 5.8% 8.5% 49.3% 19.7%
Use currently No plans to use
Plan to use within the next 12 months Don’t know/Not applicable
Plan to use in 1-3 years
Respondents: 365 – 506
Forecasting with confidence – Appendix 43
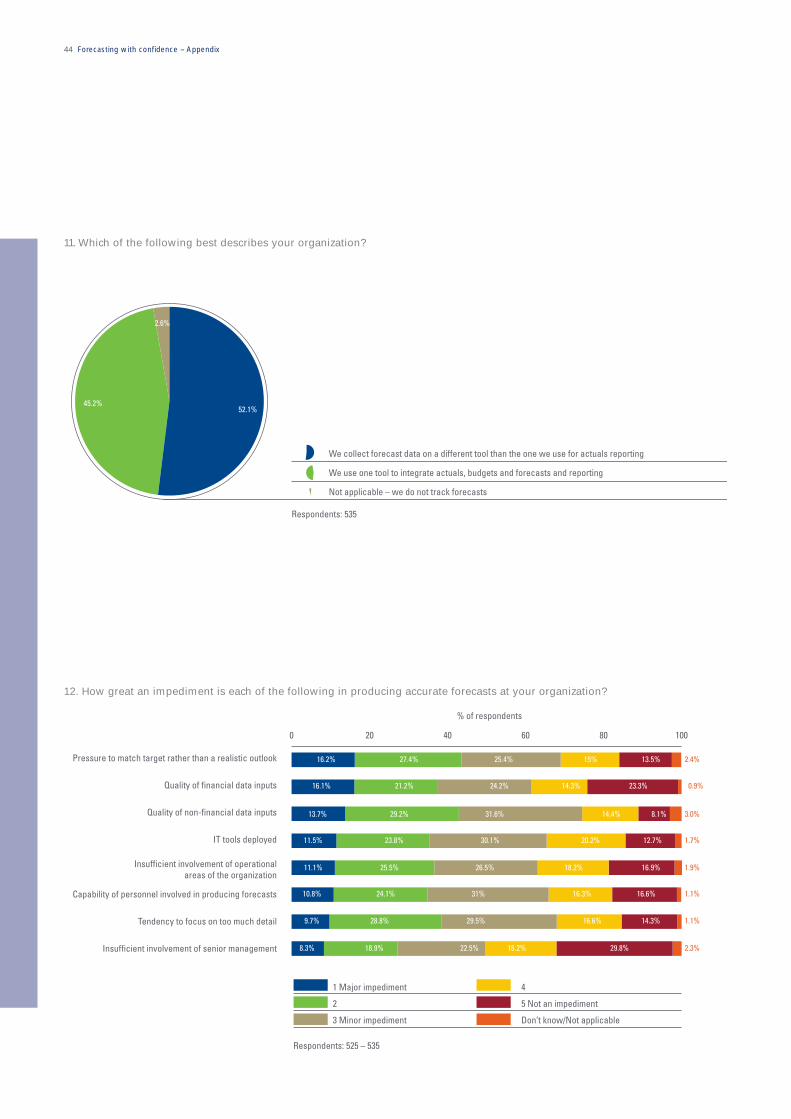
2.6%
45.2% 52.1%
We collect forecast data on a different tool than the one we use for actuals reporting
We use one tool to integrate actuals, budgets and forecasts and reporting
Not applicable – we do not track forecasts
Respondents: 535
12. How great an impediment is each of the following in producing accurate forecasts at your organization?
% of respondents
0 20 40 60 80 100
Pressure to match target rather than a realistic outlook 16.2% 27.4% 25.4% 15% 13.5% 2.4%
Quality of financial data inputs 16.1% 21.2% 24.2% 14.3% 23.3% 0.9%
Quality of non-financial data inputs 13.7% 29.2% 31.6% 14.4% 8.1% 3.0%
IT tools deployed 11.5% 23.8% 30.1% 20.2% 12.7% 1.7%
Insufficient involvement of operational 11.1% 25.5% 26.5% 18.2% 16.9% 1.9% areas of the organization
Capability of personnel involved in producing forecasts 10.8% 24.1% 31% 16.3% 16.6% 1.1%
Tendency to focus on too much detail 9.7% 28.8% 29.5% 16.6% 14.3% 1.1%
Insufficient involvement of senior management 8.3% 18.9% 22.5% 18.2% 29.8% 2.3%
1 Major impediment 4
2 5 Not an impediment
3 Minor impediment Don’t know/Not applicable
Respondents: 525 – 535
44 Forecasting with confidence – Appendix
11. Which of the following best describes your organization?

13. Which of the following best describes how your organization deals with uncertainty in the forecasting process?
% of respondents
0 20 40 60 80 100
We produce one forecast number, but make a note of downside and upside risks 54.8%
to the forecast
We produce a single document with a forecast range, noting the relevant risks 16.4%
and uncertainties
We produce one forecast number, with no consideration of downside and upside 16%
risks in the forecast
We produce several forecasts based on 11.7% different possible outcomes or scenarios
Don’t know/Not applicable 1.1%
Respondents: 538
14. Predictions in which of the following areas tend to lead to the greatest errors in your organization’s overall forecasts?
% of respondents
0 10 20 30 40 50
P&L 39%
Consumer demand 38.4%
Projects/new developments/initiatives 37.7%
Economic drivers (eg, interest rates, 29.4% commodity prices)
Cost drivers (eg, production, productivity) 28.1%
Working capital 23.5%
Cash 22.2%
Exchange rates 20.2%
Taxation rates 2.4%
Other, please specify 4%
Don’t know/Not applicable 0.7%
Respondents: 544
Forecasting with confidence – Appendix 45

15. In which of the following does your organization’s forecast play an important role?
% of respondents
0 20 40 60 80 100
Annual budgeting process 77.9%
Strategic planning 57.2%
Ongoing performance management 45.4%
Cash management 35.7%
Formal earnings guidance 17.6%
Ongoing investor communications 16.5%
Debt financing 12.5%
Setting of incentive levels 10.8%
Tax planning 8.5%
Other, please specify 0.4%
Respondents: 544
16. When considering earnings guidance to investors, which of the following statements do you agree with?
% of respondents
0 20 40 60 80 100
Investors want more and more information 63% 25.4% 2.5% 9.2%
It’s a fine line between providing information and letting our46.3% 36.9% 7.6% 9.2% competitors know how we run our business
Our forward-looking guidance tends to be focused on 38.1% 33.5% 19.2% 9.2% the short term rather than strategic
We should steer clear of issuing guidance 34.6% 37.7% 15.6% 12.1%
We feel more comfortable issuing guidance around non-financial indicators 30.5% 40.7% 15.5% 13.2%
Our internal forecasts are generally better than those issued to investors 29.8% 46.4% 11.6% 12.2%
External analysts do not understand the complexity of our business 26.2% 41.2% 22.1% 10.6%
We insist our management teams compare their forecasts with 23.8% 36.7% 23.8% 15.7% investor expectations explaining differences in assumptions
External analysts’ models do not reflect our business model 19.9% 47.7% 18.3% 14.1%
We have difficulty communicating our business strategy 13.8% 34.9% 41.7% 9.6%
Agree strongly Disagree strongly
Neither agree/disagree Don’t know
Respondents: 518 – 524
46 Forecasting with confidence – Appendix

15.7%
34%
23.9%
3.5%
No effect Impact 16-20%
Impact less than 5% Impact greater than 20% 3.7%
6% 13.2%Impact 6-10% Don’t know/Not applicable
Impact 11-15%
Respondents: 536
18. What do you anticipate would be the main benefits of better forecasting within your organization?
% of respondents
0 20 40 60 80 100
Ability to identify and act on opportunities for 67.5% additional growth
Ability to identify and prioritize risks to our 66.4% strategic plan
Ability to set meaningful performance 54% milestones for the business units
Ability to identify improvements to the organization’s processes which would 46.5%
benefit the bottom line
Ability to improve relationships with investors 14.5%
Ability to improve relationships 9.9% with customers
Ability to improve relationships with suppliers 8.6% and business partners
4%
Other, please specify 2.2%
Respondents: 544
Forecasting with confidence – Appendix 47
17. When considering the impact of forecasting errors, approximately how much do you estimate that these have cost your organization over the last three years in terms of share price?

19. To what extent do you agree or disagree with the following statements?
% of respondents
0 20 40 60 80 100
1.9%
0.6%
Forecasting is more art than science, and even with the 19.2% 47.8% 14%best processes good instincts remain key
16.6%
At my organization, forecasting is just part of the budgeting process, rather than a broader 9.2% 35.1% 14.8% 32.3% 8.1% 0.6%
performance management tool
Reliability of my organization’s forecast is compromised because operational functions 6.4% 20.6% 22.9% 33.6% 15.4% 1.1%
are not sufficiently involved
The people who prepare our forecasts do not have a sufficient understanding of how the various parts 4.5% 16.3% 18.5% 41.6% 18.4% 0.7%
of the organization operate
Agree strongly Disagree
Agree Disagree strongly
Neither agree nor disagree Don’t know
Respondents: 533 – 536
4.3% 5.4%
6.7% 29.5%
25.6%
28.6%
Western Europe Middle East and Africa
Asia-Pacific Eastern Europe
North America Latin America
Respondents: 539
48 Forecasting with confidence – Appendix
20. In which region are you personally based?
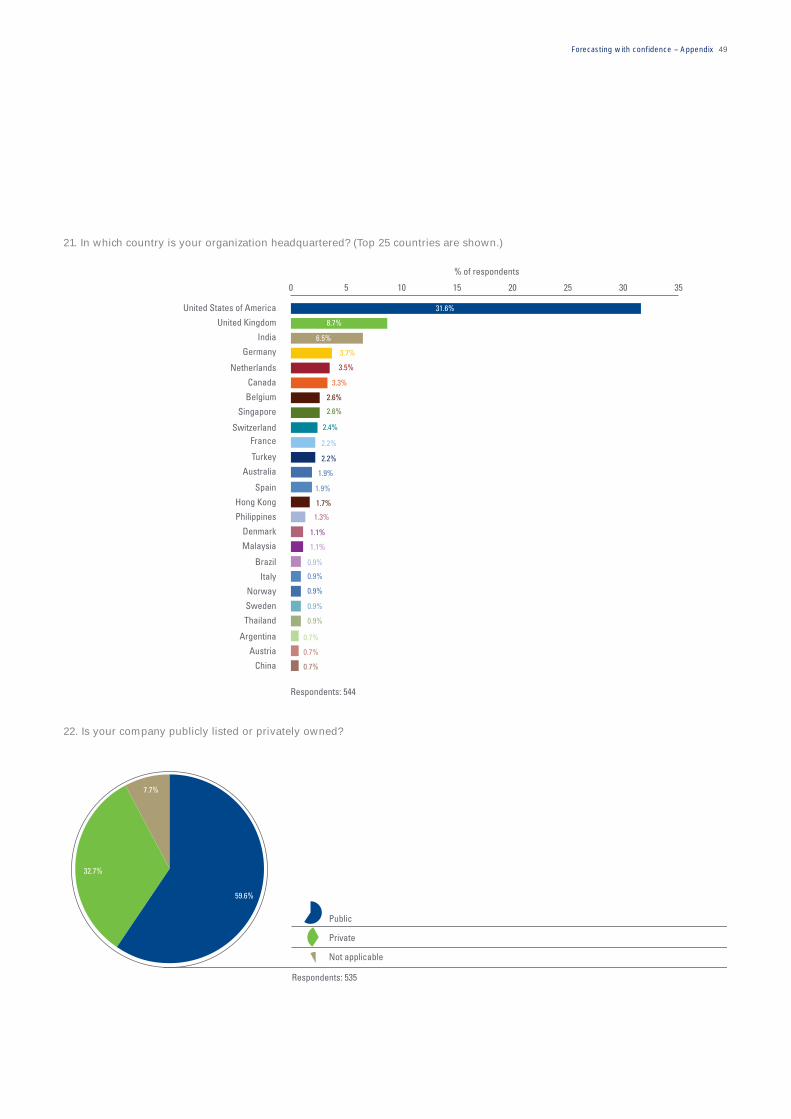
7.7%
32.7%
59.6%
Public
Private
Not applicable
Respondents: 535
Forecasting with confidence – Appendix 49
21. In which country is your organization headquartered? (Top 25 countries are shown.)
% of respondents
0 5 10 15 20 25 30 35
31.6%
8.7%
6.5%
3.7%
3.5%
3.3%
2.6%
2.6%
2.4%
2.2%
2.2%
1.9%
1.9%
1.7%
1.3%
1.1%
1.1%
0.9%
0.9%
0.9%
0.9%
0.9%
0.7%
0.7%
0.7%
Respondents: 544
United States of America
United Kingdom
India
Germany
Netherlands
Canada
Belgium
Singapore
Switzerland France
Turkey
Australia
Spain
Hong Kong
Philippines
Denmark
Malaysia
Brazil
Italy
Norway
Sweden
Thailand
Argentina
Austria
China
22. Is your company publicly listed or privately owned?

50 Forecasting with confidence – Appendix
23. What is your title?
12.9%
1.1% 1.5% 31.9%
1.5% 2.5%
3.8% CFO/ Financial Director
6.1% Finance manager
VP of finance 8.5% Director of finance 10.8%
Controller 9.5%
9.9%CEO / COO or other C-level executive
Group controller
Head of planning
Deputy CFO/ EVP of finance
Treasurer
VP of planning
Other, please specify
Respondents: 527
24. What is your organization’s primary industry?
Banking 13.9% 14.7%
Industrial and automotive products 0.2% 0.4%
2.1% Energy and natural resources
Transport
Electronics
Healthcare 2.1%
9.1% 2.3% Software and business services
3% Consumer products 3.4% 6.3% Food and drink
Communications
Pharmaceuticals
Media 3.6%
Insurance 5.9% 3.8%
Building, construction and real estate 4% 5.7%
4.2% Retail 4.8% 5.7%4.8%
Government/Public sector
Private equity
Funding agencies
Chemicals Other, please specify
Respondents: 525
25. What are your organization’s annual global revenues in US dollars?
13.8% 20.1%
4.6%
8% 8%
9.3% More than $30bn $1bn-5bn 13.4% $20bn-30bn
$10bn-20bn
$500m-1bn
$250m-500m 22.9%
$5bn-10bn Less than $250m
Respondents: 538
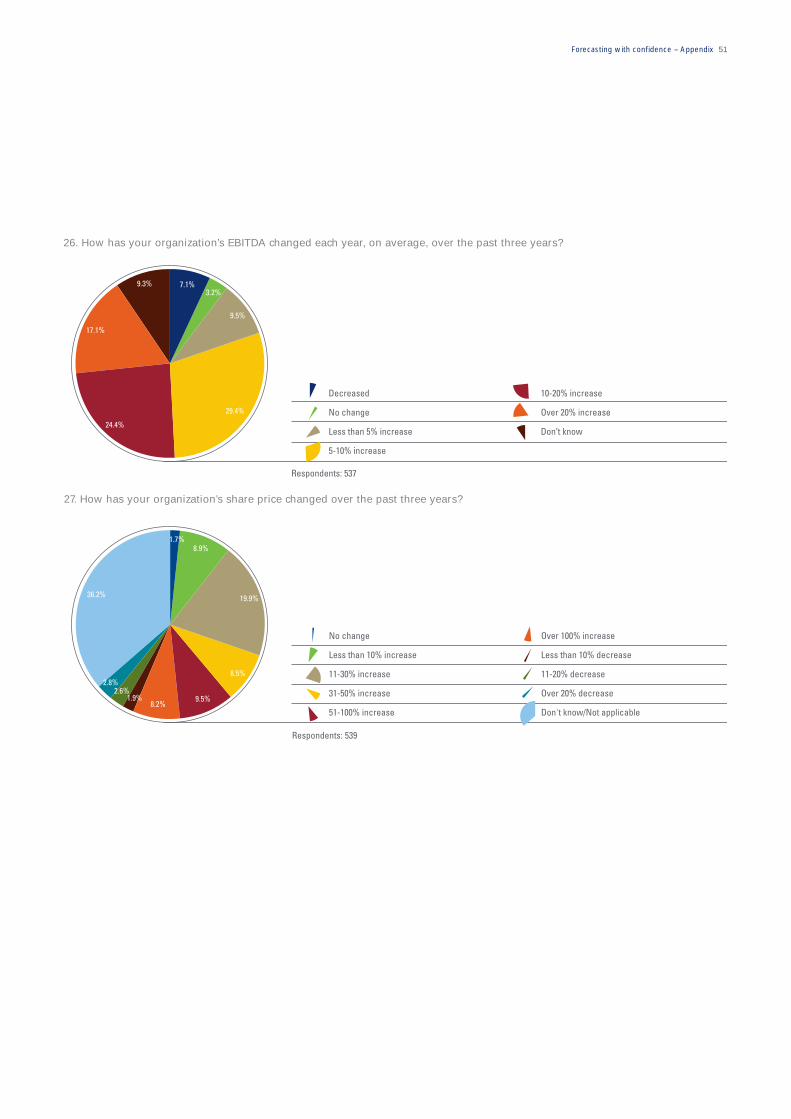
9.3% 7.1% 3.2%
9.5%
17.1%
Decreased
29.4% No change
10-20% increase
Over 20% increase 24.4%
Less than 5% increase
5-10% increase
Don’t know
Respondents: 537
27. How has your organization’s share price changed over the past three years?
1.7% 8.9%
36.2% 19.9%
No change
Less than 10% increase
8.5% 11-30% increase
Over 100% increase
Less than 10% decrease
11-20% decrease 2.8%
2.6% 31-50% increase 1.9% 9.5%8.2%
Over 20% decrease
51-100% increase Don't know/Not applicable
Respondents: 539
Forecasting with confidence – Appendix 51
26. How has your organization’s EBITDA changed each year, on average, over the past three years?

52 Forecasting with confidence
Special thanks go to the key contributors of this publication whose insight, experience, perspectives and passion for this research effort made it possible.
Nick Mountcastle, Paul Searles, Diane Nardin, and Caroline Loui-Ying.

Editorial team
Stephen Lis Scott Parker Gary Reader
Partner Partner Partner Tel: +1 267 256 3260 Tel: +44 20 7311 8895 Tel: +44 20 7311 5298 [email protected] [email protected] [email protected]
We chose the imagery in this research report to describe the dual concepts of a journey and the trust humans place in a compass as a powerful and dependable guide.
Leaders use a compass to find the right path, and they trust it as a tool to facilitate a successful outcome. It enables those who understand its power to make important decisions with confidence. For all these reasons, the compass serves us well in illustrating the potential power of forecasting.

kpmg.com
For further information on financial management issues, please contact
KPMG in Asia Pacific KPMG in Germany
Wah Yeow Tan Jochen R Pampel Partner Partner Tel: +65 6213 2503 Tel: +49 40 32 015 55 50 [email protected] [email protected]
KPMG in Australia KPMG in Hungary
James Allt-Graham Peter Kiss Partner Partner Tel: +61 2 9335 7084 Tel: +36 1887 7384 [email protected] [email protected]
KPMG in Canada KPMG in India
Diane Jeffreys Pradip Kanakia Partner Partner Tel: +1 416 777 8411 Tel: +91 80 417 66100 [email protected] [email protected]
KPMG in China KPMG in Ireland
Aaron Lo Declan Keane Partner Partner Tel: +86 21 2212 3701 Tel: +353 1 410 1335 [email protected] [email protected]
KPMG in France KPMG in Italy
Guillaume des Rotours Franco Perone Partner Partner Tel : +33 1 55 68 75 29 Tel: +39 34 82 70 88 49 [email protected] [email protected]
Or your local KPMG advisor.
The information contained herein is of a general nature and is not intended to address the circumstances of any particular individual or entity. Although we endeavour to provide accurate and timely information, there can be no guarantee that such information is accurate as of the date it is received or that it will continue to be accurate in the future. No one should act upon such information without appropriate professional advice after a thorough examination of the particular situation. The views and opinions expressed herein are those of the interviewees and do not necessarily represent the views and opinions of KPMG International or KPMG member firms.
KPMG in Latin America
William M Foley Area Managing Partner Tel: +1 305 913 2715 [email protected]
KPMG in the Netherlands
Martijn van Wensveen Partner Tel: +31 20 656 4015 [email protected]
KPMG in Singapore
Yen Suan Lim Partner Tel: +65 6411 8333 [email protected]
KPMG in South Africa
Carol Read Director Tel: +27 11 647 6844 [email protected]
KPMG in Spain
Tomás López de la Torre Vázquez Partner Tel: +34 914 563 433 [email protected]
KPMG in Switzerland
Giulio De Lucia Partner Tel: +41 44 249 3060 [email protected]
KPMG in the U.K.
Scott Parker Partner Tel: +44 20 7311 8895 [email protected]
KPMG in the U.S.
Stephen Lis Partner Tel: +1 267 256 3260 [email protected]
© 2007 KPMG International. KPMG International is a Swiss cooperative. Member firms of the KPMG network of independent firms are affiliated with KPMG International. KPMG International provides no client services. No member firm has any authority to obligate or bind KPMG International or any other member firm vis-àvis third parties, nor does KPMG International have any such authority to obligate or bind any member firm. All rights reserved. KPMG and the KPMG logo are registered trademarks of KPMG International, a Swiss cooperative. Designed and produced by KPMG LLP (U.K.)’s Design Services Publication name: Forecasting with confidence Publication number: 308-743 Publication date: September 2007 Printed on recycled material.