foreign aid and foreign direct investment in sub-saharan
TRANSCRIPT

Economic Research Southern Africa (ERSA) is a research programme funded by the National
Treasury of South Africa. The views expressed are those of the author(s) and do not necessarily represent those of the funder, ERSA or the author’s affiliated
institution(s). ERSA shall not be liable to any person for inaccurate information or opinions contained herein.
Foreign aid and Foreign direct investment
in Sub-Saharan Africa: A panel data
analysis
Kafayat Amusa, Nara Monkam and Nicola Viegi
ERSA working paper 612
June 2016

Foreign aid and Foreign direct investment in
Sub-Saharan Africa: A panel data analysis
Kafayat Amusa∗, Nara Monkam†, Nicola Viegi‡
April 21, 2016
Abstract
Funding constraints experienced by Sub-Saharan African (SSA) coun-tries has led to reliance on foreign direct investment (FDI) and foreignaid as alternative sources of finance. Despite the importance of FDI forgrowth, SSA has failed to attract an increasing share of global FDI andat the same time faces volatile aid flows. This study examines the role offoreign aid in enhancing FDI inflows to 31 SSA countries for the period1995 to 2012. Using panel data estimation techniques, the results suggestthat productive infrastructure aid is complementary to FDI inflows andsocio-economic infrastructure aid has no significant impact on FDI inflows.When resource (oil) motive of FDI is considered, the results indicate thatproductive and socio-economic infrastructure aid to oil-producing SSAcountries results in less FDI inflows compared to non-oil producing SSAcountries. Finally, the significance of sectoral aid analysis is highlightedby the finding of a complementary role of energy infrastructure aid to FDIinflows and an insignificant impact of transport infrastructure aid.
Classification-JEL: F35, F 21Keywords: Foreign aid, foreign direct investment, Sub-Saharan Africa
1 Introduction
"Official development assistance (ODA) plays an essential role as a comple-ment to other sources of financing for development, especially in those countrieswith the least capacity to attract private direct investment We recognize that asubstantial increase in ODA and other resources will be required if developingcountries are to achieve the internationally agreed development goals and ob-jectives, including those contained in the Millennium Declaration” (MonterreyConsensus, March 2002).
∗PhD candidate, Department of Economics, University of Pretoria and lecturer, Universityof South Africa (UNISA). Email: [email protected]
†Director Research, African Tax Administration Forum (ATAF).‡Professor, Department of Economics, University of Pretoria
1
Significant resource constraints has meant increased reliance on externalsources of funding such as foreign direct investment (FDI) and foreign aid (ODA)for many Sub-Saharan Africa (SSA) countries. Since 1970, SSA has received over0.43 trillion and 1.071 trillion USD in FDI and ODA respectively. FDI providesresource constrained countries with an important source of funding for develop-ment purposes and is stated to transfer superior technology and managementskills, stimulate investment and growth, generate efficiency spill-overs, enhancejob creation and assist in infrastructure development. Foreign aid, especiallydevelopment assistance has provided funding for socio-economic developmentin the region, with varied success. Despite these importances, SSA consistentlyfails to attract an increased share of global FDI. Asiedu (2002) explains that be-tween 1980 and 1998 while FDI to Europe, Central Asia, East Asia and Pacific,South Asia and Latin America grew by 5,200 percent, 942 percent, 740 percentand 455 percent respectively while FDI to SSA grew by only 59 percent. Atthe same time, global financial and economic instabilities as experienced in therecent 2007/2008 period has negatively impacted on donors ability to continueproviding development aid to SSA to the same degree as before the crisis.
The continued lagging behind in FDI inflows coupled with volatility in aidflows means that SSA faces increasing pressures to access innovative means ofgenerating much needed resources, crucial for the region’s development. FDIis considered to be a more stable financial flow, compared to foreign aid andover the years means of attracting much needed FDI to SSA became a topicalissue in development studies and in the last few years, the linkages between FDIand foreign aid has become significant in the discus. Why would foreign aidbe important for FDI inflows? Generally foreign aid to developing countries isprovided on the basis of improving infrastructure, human capital development,improving governance and fostering macroeconomic stability, all of which ifpresent, are suggested to be incentives for FDI inflows. Theoretically, the linkbetween aid and FDI can be observed in (i) the vanguard effect, in which a donornation also undertakes FDI in the recipient nation(ii) the infrastructure effect,in which aid directed to infrastructure projects and human capital developmentlead to improved domestic conditions and thus attract FDI inflows, (iii) theDutch disease effect in which foreign aid increases the supply of tradable goodswhile decreasing the price of non-tradable goods, hence reducing FDI inflows and(iv) a financing effect in which foreign aid enables the recipient country to financeoutflows (as a result of improved balance of payment) of profit repatriation fromFDI (Anyanwu, 2012).
This study is significant for a few reasons. First, to the extent that the rela-tionship between foreign aid and FDI has been examined only in a few studiesand provides ambiguous results, the examination of this nexus will contributeto the scarce literature. Second, the existing literature focuses on developingcountries in Asia and Latin America[41], thus, this study re-visits the nexus andprovides a focused analysis of the FDI—foreign aid nexus for SSA countries. Thispermits recommendations tailored to these countries to be made. Third, withthe consideration of different aid modalities; productive, socio-economic, energyand transport infrastructure aid, the study adds to the literature on the impor-
2
tance of disaggregated aid in examining the effectiveness of foreign aid. Fourth,the argument is made that FDI to SSA is predominantly resource seeking andtherefore the motive of FDI needs to be considered in the aid-FDI nexus. Thusthe study extends the literature by testing the hypothesis that the impact offoreign aid on FDI will differ between resource (oil) endowed SSA countries andnon-resource (non-oil) endowed SSA countries.
The rest of the study is structured as follows. The nature of foreign directinvestment and foreign aid to Sub Saharan Africa is discussed in section 2. Abrief review of previous studies on the FDI-foreign aid nexus for Africa as awhole and SSA as a region is provided in section 3. Methodology and data isexplained in section 4. Section 5 provides a discussion of the estimation resultsand section 6 concludes the study.
2 Overview of foreign direct investment and for-
eign aid to SSA
2.1 Foreign direct investment to SSA countries
The vast resources on the continent have been the largest driver of FDI inflows tomany African countries. A significant amount of FDI to SSA has been purposedfor resource rich countries. For example, in 2013, FDI to resource-rich SSAcountries accounted for 95 percent of the increase in FDI to Africa in that year.Countries like Nigeria, South Africa, Angola and Mozambique, who combinedaccount for almost three quarters of Africa’s commodities export received almostthree quarters of the inflows to Africa between 2001 and 2007 (UNCTAD WorldInvestment Directory, 2008; African Economic Outlook, 2014).
In recent years, other non-traditional resource countries like Ethiopia, Ghana,Kenya, Uganda and Mauritania have also experienced an increase in FDI duenot only to the increase in exploration FDI in natural resources but also dueto an expanding middle class and changes in consumer behaviour propelled byhigher purchasing power (African Economic Outlook, 2014) especially since the2000s. The share of FDI inflows in the GDP of non-resource rich SSA countrieswas 4.5 percent in 2013, which was twice the level in 2000 (IMF, 2013b).
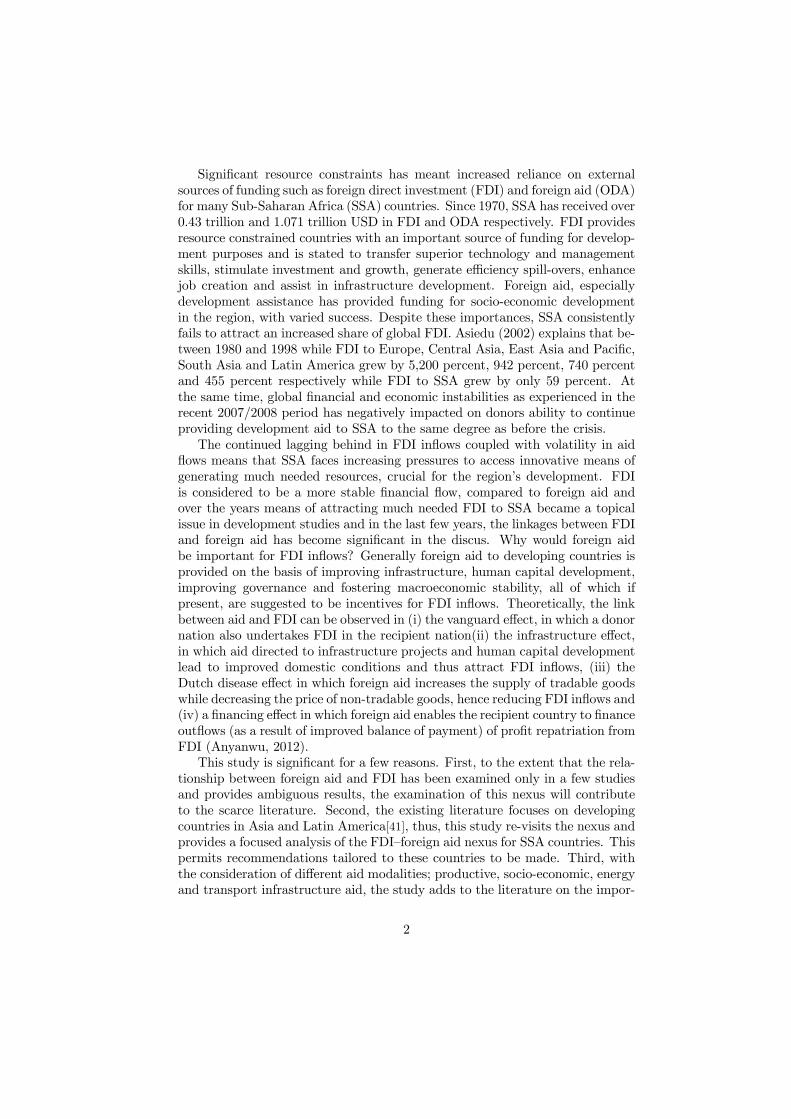
Despite the gains, SSA’s share of global FDI inflow remains lower than otherregions (see figure 1), due in part to four factors, (i) structural obstacles in theAfrica’s manufacturing sector which resulted in a decline in manufacturing flows(ii) high production costs in the value chain process in production of diamondsin Botswana, South Africa and Namibia (iii) high labour costs in the textileand apparel industries in countries like South Africa, causing an inability tomeet competition from cheaper countries like China and (iv) Investors prefer-ence to countries that enhanced labour productivity and skill of workers in themanufacturing sector (UNCTAD World Investment Directory, 2008).
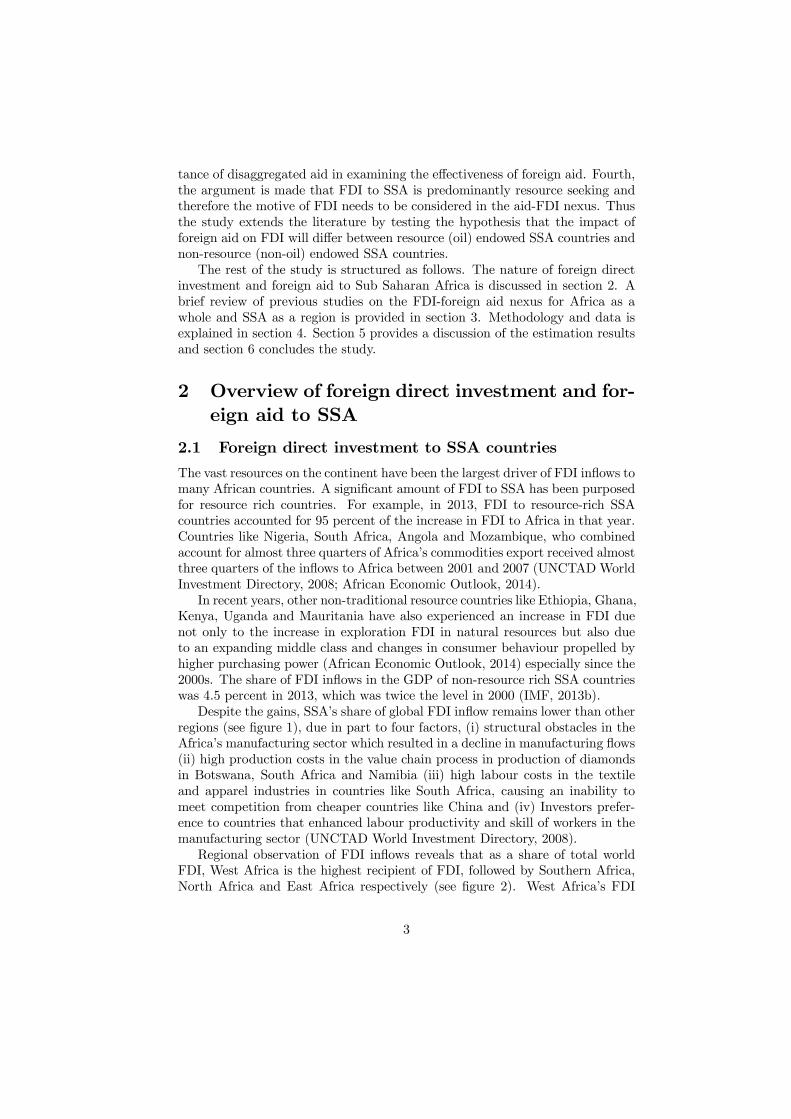
Regional observation of FDI inflows reveals that as a share of total worldFDI, West Africa is the highest recipient of FDI, followed by Southern Africa,North Africa and East Africa respectively (see figure 2). West Africa’s FDI
3

inflow is mainly in the mining and oil sectors with Nigeria accounting for over34 percent of the FDI inflows into the region. Chinese interest in the agricul-ture sectors of some West African countries has also contributed to boostingthe region’s FDI inflows. Between 1981 and 2008, Chinese investment in theregion’s agriculture sector had increased from 0.1 percent to 27.5 percent (Ne-had, 2012). Higher FDI flows are attracted by the region’s growing population,abundance of natural resources and rising economic growth which combine tooffer opportunities for businesses and states. FDI to the region increased from9 billion dollars in 2000 to 62 billion dollars by 2012 (Nehad, 2012). Accordingto Anyanwu (2011) civil conflict as well as governance challenges have been thetwo main factors that have contributed to East Africa’s limited ability to attracthigher FDI inflows.
2.2 Foreign Aid to Africa and SubSaharan Africa
In the last three decades, SSA has accounted for a large proportion of the ODAdisbursed to developing countries, as the region has consistently received morethan 30 percent of the total ODA disbursed. From table 1, on average, of thetotal ODA disbursements to the developing world, SSA accounted for over 28percent between the periods 1980 and 2013. As a proportion of total ODAdisbursed to the African continent, SSA received above of 77 percent between1980 and 2013.
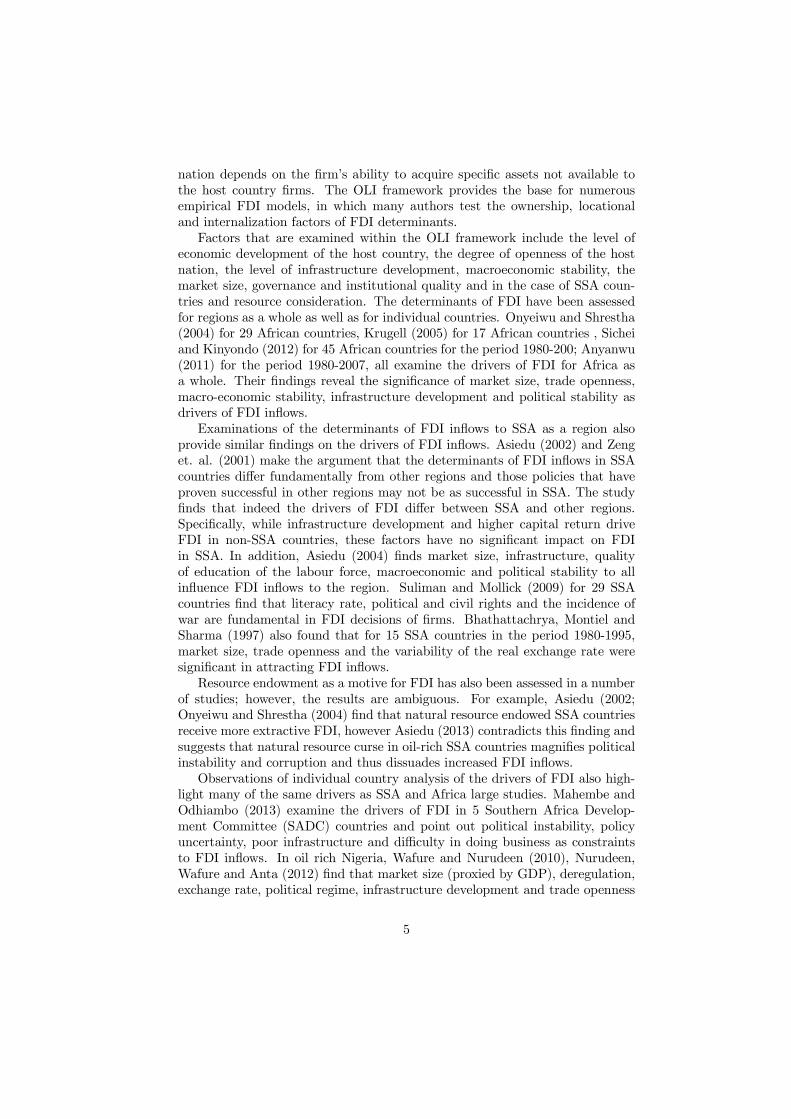
Observation of OECD-DAC total foreign aid disbursement to developingregions between 1995 and 2012 shows that the foreign aid/GNI ratio is highestfor Africa compared to other regions. From figure 3, between 1995 and 2012Africa’s ODA/GNI ratio peaked at 4.5 percent compared to a high of 1 percentin Europe and the America’s and 0.6 percent in Asia.
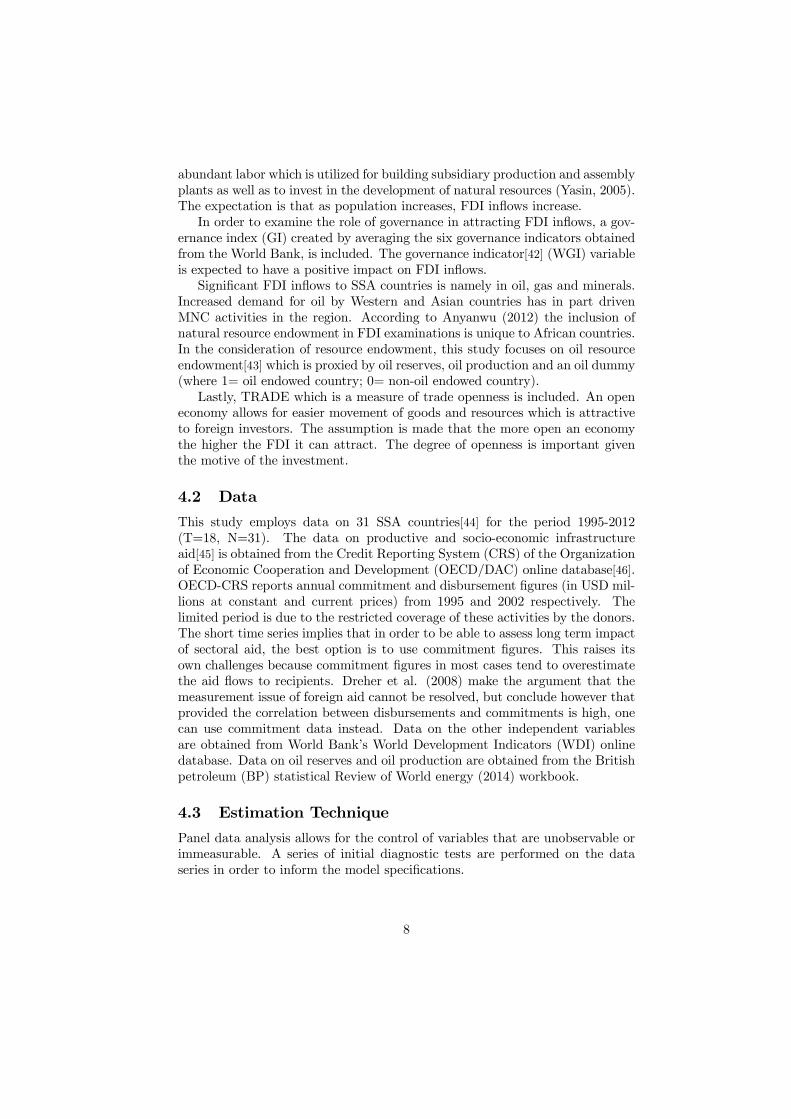
The distribution of foreign aid between 1980 and 2013 indicates that thelargest amount of foreign aid has been disbursed to West Africa (33 billion USDollars) followed by East Africa (29.8 billion US Dollars) and Southern Africa(26.2 billion US Dollars) (see figure 4). In terms of the sectoral distributionof foreign aid disbursements, amongst African countries, the largest sectors interms of disbursement of ODA over the last five years have on average been thesocial, economic and the services sectors respectively (see figure 5).
3 Literature review
3.1 The determinants of foreign direct investment in Africa
and SSA
The eclectic paradigm theory of FDI developed by Dunning (1977, 1979, and1993) combined the internalization and trade theories and is perhaps the mostencompassing explanation of the determinants of FDI as it incorporates thelocational, ownership and internalization (OLI) advantages of MNE’s investingin a foreign country. According to Dunning, a firm’s decision to invest in a host
4
nation depends on the firm’s ability to acquire specific assets not available tothe host country firms. The OLI framework provides the base for numerousempirical FDI models, in which many authors test the ownership, locationaland internalization factors of FDI determinants.
Factors that are examined within the OLI framework include the level ofeconomic development of the host country, the degree of openness of the hostnation, the level of infrastructure development, macroeconomic stability, themarket size, governance and institutional quality and in the case of SSA coun-tries and resource consideration. The determinants of FDI have been assessedfor regions as a whole as well as for individual countries. Onyeiwu and Shrestha(2004) for 29 African countries, Krugell (2005) for 17 African countries , Sicheiand Kinyondo (2012) for 45 African countries for the period 1980-200; Anyanwu(2011) for the period 1980-2007, all examine the drivers of FDI for Africa asa whole. Their findings reveal the significance of market size, trade openness,macro-economic stability, infrastructure development and political stability asdrivers of FDI inflows.
Examinations of the determinants of FDI inflows to SSA as a region alsoprovide similar findings on the drivers of FDI inflows. Asiedu (2002) and Zenget. al. (2001) make the argument that the determinants of FDI inflows in SSAcountries differ fundamentally from other regions and those policies that haveproven successful in other regions may not be as successful in SSA. The studyfinds that indeed the drivers of FDI differ between SSA and other regions.Specifically, while infrastructure development and higher capital return driveFDI in non-SSA countries, these factors have no significant impact on FDIin SSA. In addition, Asiedu (2004) finds market size, infrastructure, qualityof education of the labour force, macroeconomic and political stability to allinfluence FDI inflows to the region. Suliman and Mollick (2009) for 29 SSAcountries find that literacy rate, political and civil rights and the incidence ofwar are fundamental in FDI decisions of firms. Bhathattachrya, Montiel andSharma (1997) also found that for 15 SSA countries in the period 1980-1995,market size, trade openness and the variability of the real exchange rate weresignificant in attracting FDI inflows.
Resource endowment as a motive for FDI has also been assessed in a numberof studies; however, the results are ambiguous. For example, Asiedu (2002;Onyeiwu and Shrestha (2004) find that natural resource endowed SSA countriesreceive more extractive FDI, however Asiedu (2013) contradicts this finding andsuggests that natural resource curse in oil-rich SSA countries magnifies politicalinstability and corruption and thus dissuades increased FDI inflows.
Observations of individual country analysis of the drivers of FDI also high-light many of the same drivers as SSA and Africa large studies. Mahembe andOdhiambo (2013) examine the drivers of FDI in 5 Southern Africa Develop-ment Committee (SADC) countries and point out political instability, policyuncertainty, poor infrastructure and difficulty in doing business as constraintsto FDI inflows. In oil rich Nigeria, Wafure and Nurudeen (2010), Nurudeen,Wafure and Anta (2012) find that market size (proxied by GDP), deregulation,exchange rate, political regime, infrastructure development and trade openness
5

were significant in the determination of firms FDI. For the other major resourcerich economy in the regio; South-Africa, Fedderke and Romm (2006) indicatethe importance of market size, openness and political stability in enhancing FDIinflows, while high corporate tax crowds out FDI inflows to the country.
Single country analysis on the determinants of FDI in non-resource rich SSAcountries also unearths similar drivers as with the regional studies. For example,Nyamwange (2009) and Abala (2014) find that FDI into Kenya is attracted bymarket size, trade openness, macro-economic stability, good infrastructure andpolitical stability. Malefane (2007) shows that for Lesotho, whose economyis highly dependent on its neighbour, South-Africa’s economy, real exchangerate, macro-economic stability, political stability and south-Afric’s market sizedetermined FDI inflows into the country.
3.2 The nexus between FDI and foreign aid
The transmission channels between foreign aid and FDI include the vanguardeffect, buffer effect, and infrastructure and rent seeking effect. According toKimura and Todo (2010) foreign aid promotes FDI inflows from the same aiddonors to the recipient nation because the provision of foreign aid send signals onthe recipient’s business environment to the donor country firms thus making iteasy for donor firms to invest. Additionally, if aid is provided on a governmentallevel, this sends the signal of reduced risk to donor country investors/firms. Thebuffer effect (response of aid to volatile FDI inflows) is investigated by Carroand Larru (2010) and they find that foreign aid acts a buffer against volatileFDI in Brazil, implying that the allocation of foreign aid by donors is drivenin part by considerations of periods of low FDI inflows into the country. Theinfrastructure and rent seeking effect of foreign aid on FDI is isolated by Harmsand Lutz (2006), who suggest that the infrastructure effect is positive throughimproved recipient country infrastructure which all tie in to raising the marginalproductivity of capital and encouraging FDI inflows. The rent seeking effect isnegative due to the actions of private firms in competing for aid rents may resultin a decline in the marginal product of capital of the recipient, causing a declinein FDI inflows.
Bhavan et al. (2011) argue that foreign aid for human capital and infrastruc-ture development enables improvements in not only physical infrastructure butalso enables increased knowledge, allows for improved production methods andoutput and in turn encourages investors in the improved markets. They foundforeign aid for human capital and infrastructure development to be complemen-tary to FDI inflows, while there was no evidence of a crowding out effect offoreign aid for physical capital on FDI inflows. Karakaplan et al. (2005) ex-amined the nexus in a panel of 97 countries between 1960 and 2004 and foundthat foreign aid increases FDI inflows when good governance and a high levelof financial development exist in the recipient nation. In their examination ofthe nexus in 99 developing countries between 1970 and 2001, Selaya and Sune-sen (2012) concluded that foreign aid invested in physical capital accumulationcrowds out FDI and foreign aid invested in complementary inputs (human cap-
6

ital infrastructure aid) complements FDI.The OLI framework for FDI enabled the empirical testing of numerous fac-
tors of the determinants of FDI and has yielded findings of the above factorsand more as determinants of FDI inflows. In the consideration of the determi-nants of FDI however, very few have considered the impact of foreign aid onFDI inflows. This study, thus aims to examine the nexus between foreign aidand FDI within the OLI framework.
4 Methodology
4.1 The Empirical Model
The model is specified in the general form as follows:
fdiit = β0 + β1prod− aidit + β2 sec−aidit + β3 inf lit + β4popit + β5telit
+β6tradeit + β7giit + β8oilit + εit (1)
Where FDIit = net FDI inflows into recipient country as a proportion ofGDPPROD = Total productive infrastructure aidSEC = Total socio-economic infrastructure aidINFLit = Inflation ratePOPit = Total populationTELit = Mobile and fixed line subscribers per 100 peopleTRADEit = The sum of exports and imports as a percentage of GDPGIit = governance indexOILit = oil endowmentThe literature on the determinants of FDI informs the variables included in
the model. FDI inflows is the dependent variable, socio-economic infrastructure(SEC) aid (education and health aid, energy, transport and communication) andproductive sector infrastructure (PROD) aid (agriculture and forestry, industry,mining and construction and tourism) are included as the two proxies of foreignaid.
Macroeconomic stability is one of the criteria’s of foreign investment, thusinflation rate (INFL) is included as proxy. High inflation increases acts as adisinvestment to FDI. The expectation is that the coefficient will be negative.
Telephone per 100 people (TEL) is used as a proxy for the level of infrastruc-ture development. The role of a good infrastructure network is emphasized inthe FDI literature as one of the factors that incentivize investors. A goodtransport network helps reduce transport costs thus lowering production costs.According to Campos and Kinoshita (2003), regardless of the type of FDI, goodinfrastructure is necessary for investors to operate efficaciously. There coefficientof infrastructure is expected to be positive.
Total population is included to proxy the recipient country size. According tothe literature, one of the biggest incentives for FDI in developing countries is theabundant and cheap labor. Non-market seeking FDI especially is attracted by
7
abundant labor which is utilized for building subsidiary production and assemblyplants as well as to invest in the development of natural resources (Yasin, 2005).The expectation is that as population increases, FDI inflows increase.
In order to examine the role of governance in attracting FDI inflows, a gov-ernance index (GI) created by averaging the six governance indicators obtainedfrom the World Bank, is included. The governance indicator[42] (WGI) variableis expected to have a positive impact on FDI inflows.
Significant FDI inflows to SSA countries is namely in oil, gas and minerals.Increased demand for oil by Western and Asian countries has in part drivenMNC activities in the region. According to Anyanwu (2012) the inclusion ofnatural resource endowment in FDI examinations is unique to African countries.In the consideration of resource endowment, this study focuses on oil resourceendowment[43] which is proxied by oil reserves, oil production and an oil dummy(where 1= oil endowed country; 0= non-oil endowed country).
Lastly, TRADE which is a measure of trade openness is included. An openeconomy allows for easier movement of goods and resources which is attractiveto foreign investors. The assumption is made that the more open an economythe higher the FDI it can attract. The degree of openness is important giventhe motive of the investment.
4.2 Data
This study employs data on 31 SSA countries[44] for the period 1995-2012(T=18, N=31). The data on productive and socio-economic infrastructureaid[45] is obtained from the Credit Reporting System (CRS) of the Organizationof Economic Cooperation and Development (OECD/DAC) online database[46].OECD-CRS reports annual commitment and disbursement figures (in USD mil-lions at constant and current prices) from 1995 and 2002 respectively. Thelimited period is due to the restricted coverage of these activities by the donors.The short time series implies that in order to be able to assess long term impactof sectoral aid, the best option is to use commitment figures. This raises itsown challenges because commitment figures in most cases tend to overestimatethe aid flows to recipients. Dreher et al. (2008) make the argument that themeasurement issue of foreign aid cannot be resolved, but conclude however thatprovided the correlation between disbursements and commitments is high, onecan use commitment data instead. Data on the other independent variablesare obtained from World Bank’s World Development Indicators (WDI) onlinedatabase. Data on oil reserves and oil production are obtained from the Britishpetroleum (BP) statistical Review of World energy (2014) workbook.
4.3 Estimation Technique
Panel data analysis allows for the control of variables that are unobservable orimmeasurable. A series of initial diagnostic tests are performed on the dataseries in order to inform the model specifications.
8

The assumption that countries are homogenous results in the omitted vari-able bias and the potential differences between countries introduces the issueof heterogeneity which needs to be addressed in the estimation technique usingthe fixed and random effects models. The fixed effects model assumes that theunobservable factors or country specific factors captured in the error term arecorrelated with the regressors, while the random effects model assumes that theunobservable variables are not correlated with the regressors. The Hausmantest for the validity of fixed or random effects is carried out. The results indi-cate heterogeneity of the panels, given by the test statistics (Pr> χ2=0.000),signifying that the fixed effects model is the more appropriate model.
Macroeconomic variables tend to include elements of persistence and FDI isno exception. Investors generally invest in countries in which they have a his-tory of investments. Thus the lagged FDI is included to capture persistence inFDI flows. In addition there is potential endogeneity of the aid variable whicharises if aid donors provide more aid to countries that receive less foreign in-vestment (Harms and Lutz, 2006). According to Hansen and Tarp (2001) theeffect of endogeneity of aid flows can cause estimates from aid regressions to bebiased. Fixed and random effects models address the heterogeneity of panels,however they ignore the potential for endogeneity. The endogeneity problem isthus addressed with the use of dynamic panel estimation technique suggestedby Arrelano and Bond (1991). The difference GMM estimator suggested byArellano and Bond (1991) uses lagged levels of first differences as instrumentswhich according to Arellano and Bover (1995) are for the most part poor in-struments. The system GMM estimation technique is suggested as a betterestimation technique by Arellano and Bover (1995) and again by Arellano andBond (1998) since it is more efficient in estimating a dynamic panel model, pro-vides consistent estimates and, efficiently deals with the issue of endogeneity.
The system GMM addresses the issue of endogeneity, however, widely ac-knowledged in panel data literature is the substantial cross sectional dependence(CSD) in the errors exhibited in panel models. Cross sectional dependence canarise from increased economic and financial integration of countries. It is im-portant therefore to test for cross sectional dependence in the panel especiallyin short panel data models in which T<N. If the unobserved factors that causethe cross sectional dependence are correlated with the regressors, the Fixedeffect(FE) and Random effect(RE) estimators will be biased and inconsistentand therefore other estimation techniques such as instrumental variables (IV)and GMM can be used. However, in short panel-data models, if there is crosssectional dependence in the disturbances, then estimates from IV and GMMbecome inconsistent. The size and dimensions of the panel determines the testto be used. In cases where T<N, the Breusch- Pagan Lagrange multiplier (LM)test for CSD will produce significant distortions; instead, three suggested tests,Pesaran (2004) CD test, Friedman’s (1937) test and Frees (1995) tests are usedto test for cross sectional dependence (De Hoyos and Sarafidis, 2006).The testfor cross-sectional independence is carried out using the Pesaran CD test1 and
1According to the literature, the Pesaran CD test is the most appropriate test when N>T,
9

the test statistic of 1.175 evidences no cross sectional dependence between thepanels.
5 Econometric Analysis and Discussion of Re-
sults
The analysis begins with a summary of the descriptive statistics of the variablesused in the estimation. The results are displayed in table 2 The correlationmatrix in table 3 shows that FDI is positively and significantly correlated withtrade openness (TRADE) and negatively and significantly correlated with theinfrastructure variable (TEL). The correlation between FDI and productive andsocioeconomic sector aid and inflation is positive but insignificant and the corre-lation between FDI and the governance and population variables is negative butnot significant. There are also significant correlations between the explanatoryvariables. Productive sector aid is positively correlated with socio-economic aidand population and negatively correlated with telephone infrastructure, pop-ulation, governance and trade openness. A significant negative correlation isobserved between socio-economic aid and four of the explanatory variables.
Table 4 provides the results from the estimation of equation three (1) usingthe fixed effect (FE), random effect (RE), the systems-GMM techniques. Thesystems-GMM result in column 5 of table 4 is explained in detail here as itaddresses the issue of endogeneity. Additionally, the model includes the squareaid term in order to capture the non-linearity of foreign aid (Selaya and Sunesen,2012; Bhavan et al. 2011).
The coefficients of the control variables are significant with the exceptionof socio-economic aid and the square aid term. The general finding from theestimation is the importance of trade openness, population, governance, tele-phone infrastructure and inflation as drivers of FDI to the 31 SSA countries.Poor infrastructure development and inflation hinder FDI inflows, while tradeopenness and population size enhance FDI inflows. The positive and significantimpact of lagged FDI on FDI inflows highlights the existence of an agglomer-ation effect of FDI inflows. Barrell and Pain (1997); Agionmirgiannakis et al.(2006) find similar results in the importance of prior FDI experiences in attract-ing increased FDI. Turning to the variables of interest productive sector aid ispositively and significantly related to FDI inflows and socio-economic sector aidhas no significant impact on FDI inflows Similar findings regarding the lattereffect is observed by Bhavan et al. (2011) who find a positive impact of physicalcapital aid on FDI. The results suggest that productive infrastructure aid iscomplementary to FDI inflows. There is no evidence of a crowding out effect offoreign aid on FDI as found in Selaya and Sunesen (2012)[47].
The non-linearity of foreign aid arises according to the Solow growth modelbecause aid as a complementary factor shifts the production function and thusraises the steady state levels of income and domestic savings (Acemoglu, 2008).
thus only the Pesaran statistic is reported here.
10

The sign of the coefficient of the squared aid term is contrary to expectationand is insignificant
5.1 Motive of FDI: Resource Endowment
Most studies have either looked at the impact of oil endowments on aid re-ceived or the impact of oil endowment on FDI. For the most part, the formerstudies report a positive but insignificant impact (Lee, 2012) and the findingson the later are ambiguous (Anyanwu, 2012; Asiedu 2013). To understand theinteraction of foreign aid and FDI when resource motive is factored in, twointeraction variables, interacting the oil endowment variable with both produc-tive infrastructure aid and socio-economic infrastructure aid are created. Theresults are provided in table 5 From table 5, oil producing SSA countries thatreceive both productive and socio-economic infrastructure aid receive less FDIthan non-oil producing SSA countries[48] The result of the effect of aid on FDIin resource endowed versus non-resource endowed countries is interesting due tothe fact that while FDI to the top 10 recipients has been in natural resources,there is no evidence that aid to oil endowed countries boosts FDI inflows. Apotential explanation of the result is that oil discoveries project the idea thatthe nation is richer and thus by extension diminishes the need for increased re-sources such as FDI regardless of the aid inflows. In addition, given the fact thata significant proportion of FDI inflows goes to oil producing SSA countries[49],it is worth noting that the oil producing SSA countries and indeed the countriesin the region are characterized by poor institutional quality and high levels ofcorruption. In fact Asiedu (2013) showed that the average corruption index forthe 8 oil exporting SSA countries between 2000 and 2009 was higher than theaverage for non-oil exporting SSA countries. The implication is that oil export-ing SSA countries appear to suffer from a natural resource curse when it comesto attracting FDI and the level of corruption is deterring enough to investors inthe non-extractive sectors of these economies.
5.2 Disaggregated Economic Aid
A number of authors have argued that the use of total foreign aid figures in aideffectiveness studies does not provide a comprehensive picture of the impact ofthe aid. They suggest that the aid modality must be factored into such exami-nations. The lack of robust findings on the socio-economic aid variable suggeststhere is a need for further detailed examination of the impact of socio-economicaid on FDI inflows. Given that economic infrastructure aid has potentiallythe most direct impact on FDI, the impact of economic infrastructure in theform of transport infrastructure and energy infrastructure aid on FDI inflows isexamined[50]. The regression result for transport and energy aid is presented intables 6 and 7[51]
The regression results from disaggregating economic aid into transport andenergy infrastructure aid indicates the significance of energy aid in increasingFDI inflows to SSA countries, while the impact of transport infrastructure aid
11

is insignificant. Foreign aid targeted at improving SSA’s energy infrastructureis complementary to FDI flows Similar findings overall have been reported byHarms and Lutz (2006), who suggest that the overall infrastructure effect offoreign aid on FDI is positive[52] and the effect is through improved recipientcountry infrastructure in the form of better roads, improved energy infrastruc-ture amongst other factors, which all tie in to raising the marginal productivityof capital and encouraging FDI inflows
6 Summary and Conclusions
This study examined the nexus between foreign aid and foreign direct investment(FDI) in a panel of 31 SSA countries between 1995 and 2012. Using panel dataestimation techniques and disaggregating foreign aid into productive and socio-economic infrastructure aid, the study finds evidence of the enhancing impact ofproductive infrastructure aid on FDI inflows in the 31 countries. Additionally,socio-economic infrastructure aid has no significant impact on FDI inflows. Theresult points to the importance of the consideration of aid modality in foreignaid effectiveness studies. The results from the empirical analysis have importantpolicy implications for SSA countries. To the extent that many SSA countriesstill experience financial or resource constraints, foreign aid can enhance theinflows of FDI. This is important if the benefits of FDI as well as the fact thatit is a less risky and more stable source of much needed funds are considered.Secondly, the finding of the significance of productive sector aid suggests thatforeign aid directed at productive activities such as agriculture, fishing, miningand construction represents an injection of funds into avenues of the economy ofmany SSA countries that are in themselves the growth inducing sectors of theireconomies. Therefore channeling aid into these sectors should enable or fosterthe conditions necessary to attract FDI.
The importance of disaggregating aid along the modality lines is furtherhighlighted by the results obtained from estimating the impact of transportand energy infrastructure aid on FDI inflows. Although total socio-economicinfrastructure aid has no impact on FDI inflows, examination of its componentssheds a different light. Energy infrastructure aid enhances FDI to the regionwhile transport infrastructure aid has no impact on FDI inflows. This suggeststhat the significance of economic aid should to be considered by policy makers,especially energy infrastructure aid given that over two thirds of SSA countriesare affected by power crisis and about 40.8 billion USD per annum is needed inAfrica’s power sector to close the gap between infrastructure needs and availablefinancial resources (Muzenda, 2009). Foreign aid can help reduce the capacityand skills constraints inherent in the energy sector and thus attract increasedFDI.
Lastly, given that significant FDI inflows to SSA countries is to the naturalresource sectors, namely in oil, gas and minerals, therefore the study goes a stepfurther than previous studies on foreign aid and FDI and asks whether the com-plementarity or substitutive impact of aid on FDI differs between countries that
12

are resource (oil) endowed and non-resource endowed (non-oil endowed). Thefindings suggest that oil endowed SSA countries receive less FDI when both pro-ductive and socio-economic infrastructure aid is provided to them. Furthermore,it implies that oil rich SSA countries must look at diversifying their economiesaway from the single dominant extractive industry in order to promote FDIbeyond the extractive sectors and thus enhance the amount of FDI inflows theyreceive.
The debate in the aid literature that aggregate analysis of the impact of aidmay be misleading is magnified by the findings in this and other similar studies(Selaya and Sunesen, 2012; Bhavan et al. 2011) in which on a disaggregatedlevel foreign aid has the potential to enhance growth through its interactionswith other forms of assistance such as FDI. Clearly, the type of aid matters andthe impact of the aid differs based on the recipient. Further, it is importantto note that the over dependence of some SSA countries on foreign aid is nota sustainable means to achieving long term growth, therefore, the beneficiallinks between the foreign aid that is provided and FDI must be explored andexploited by policy makers in SSA countries.
References
[1] Abala, D.O. (2014). Foreign direct investment and economic growth: anempirical analysis of Kenyan data. DBA Africa Management Review. Vol4(1), pp.62-83.
[2] African Economic Outlook (2014). External financialflows and tax revenues for Africa. Available online fromhttp://www.africaneconomicoutlook.org/en/outlook/
[3] Agiomirgianakis, G., Asteriou, D., & Papathoma, K. (2012). The determi-nants of foreign direct investment: a panel study for the OECD countries.Department of Economics, Discussion Paper Series. No.03/06.
[4] Anyanwu, J.C. (2011). Determinants of foreign direct investment inflowsto Africa, 1980-2007. African Development Bank Group, Working paperseries No 136, September 2011.
[5] Anyanwu, J.C. (2012). Why does foreign direct investment go where itgoes? : New evidence from African Countries. Analysis of Economics andFinance, 13(2), 425-562.
[6] Arellano, M., and Bond, B.S. (1991). Some tests of specification for paneldata: Monte Carlo evidence and application to employment equation. Re-view of Economic Studies, Vol 58, pp. 277-297.
[7] Arrelano, M., and Bover, O. (1995). Another look at the instrumental vari-able estimation of error components models. Journal of Econometrics, Vol68, pp. 29-51.
13

[8] Asiedu, E. (2002). On the determinants of foreign direct investment todeveloping countries: is Africa different? World Development, 30(1), 107-119.
[9] Asiedu, E. (2004). Foreign direct investment in Africa: the role of nat-ural resources, market size, government policy, institutions and politicalinstability. Working Paper Series, University of Kansas.
[10] Asiedu, E. (2013). Foreign direct investment, natural resources and insti-tutions. International Growth Centre, Working Paper series.
[11] Barrell, R., and Pain, N. (1997). Foreign direct investment, technologicalchange and economic growth within Europe. The Economic Journal 107,pp.1770-86.
[12] Bhattacharya, A., Montiel, P., and Sharma, P.S. (1997). Private capitalflows to Sub-Saharan Africa: An overview of trends and determinants,external finance for low-income countries. International Monetary Fund,1997. Pp. 207-219.
[13] Bhavan, T., Xu. C., and Zhong, C. (2011). Nexus between FDI and For-eign aid: the case of five South Asian Economies. International Journal ofEconomics and Finance, 3(2), 143-149.
[14] Carro, M, and Larru, J, M. (2010). Flowing together or flowing apart: ananalysis of the relation between FDI and ODA flows to Argentina andBrazil. MPRA Paper No.25064.
[15] Dunning, J.H. (1977). Trade, location of economic activity and the MNE:a search for an eclectic approach. In B. Ohlin, P.O. Hesselborn and P.M.Wijkman (eds), The International Allocation of Economic Activity (pp.395—418). London: Holmes and Meier.
[16] Dunning, J.H. (1979). Explaining changing pattern of international pro-duction: in defence of eclectic theory. Oxford Bulletin of Economics andStatistics, 41, 269—296.
[17] Dunning, J.H. (1993). Multinational enterprises and the global economy:Addison-Wesley.
[18] Fedderke J. W., and Romm A.T. (2006). Growth impact and determinantsof foreign direct investment into South Africa, 1956—2003. Economic Mod-eling, 23, 738—760.
[19] Hansen, H., and Tarp, F. (2001). Aid and growth regressions. Journal ofDevelopment Economics, 64(2), pp. 547-570.
[20] Harms, P. and Lutz, M. (2006). Aid, governance and private foreign invest-ment: some puzzling findings for the 1990’s. The Economic Journal, 116(513), 773-790.
14
[21] De Hoyos, R.E., and Sarafidis, V. (2006). Testing for cross-sectional depen-dence on panel-data models. The Stata Journal, Vol 6(4), pp. 482-496.
[22] Karakaplan, U. M., Neyapati, B., and Sayek, S. (2005). Aid and foreigndirect investment: international evidence. Bilkent University DiscussionPapers No. 05-05, Ankara —Turkey: Bilkent University.
[23] Kimura, H and Todo, Y. (2010). Is foreign aid a vanguard of foreign directinvestment? A Gravity — equation approach. World Development, 38(4),482-497
[24] Krugell, W. (2005). The determinants of foreign direct investment in Africa,in :B.M. Gilroy, T.Gries, W.A. Naude (Eds.), multinational enterprises,foreign direct investment and growth in Africa, Physica-Verlag Heidelberg,New York, pp. 49-71.
[25] Lee, C. (2012). More oil-more aid? An empirical study on oil interestand aid allocation. Unpublished Dissertation. Universidad Autonoma deBarcelona.
[26] Malefane, M.R. (2007). Determinants of foreign direct investment inLesotho: evidence from cointegration and error correction modelling. SouthAfrican Journal of Economics and Management Science, Vol 10(1), pp 99-106.
[27] Mahembe, E., and Odhiambo, N.M. (2013). The dynamics of foreign di-rect investment in SADC countries: experiences from five middle-incomeeconomies. Problems and Perspectives in Management, Vol 11(4), pp 35-45.
[28] Nehad, I. (2012). FDI- a blessing or a curse for West Africa? The case forforeign direct investment. International Relations and Security Network(ISN).
[29] Nyamwange, M. (2009). Foreign direct investment in Kenya. MPRA Work-ing Paper No. 34155.
[30] Onyeiwu, S., and Shrestha, H. (2004). Determinants of foreign direct in-vestment in Africa. Journal of Developing Societies, Vol 20, pp. 89-106.
[31] Organisation for Economic Co-operation and Development- Credit Report-ing System (OECD-CRS) online database.
[32] Selaya, P., and Sunesen, E.R. (2012). Does foreign aid increase foreigndirect investment? World Development, 40(11), pp. 2155-2176.
[33] Sichei, M.M., and Kiyondo, G. (2012). Determinants of foreign direct in-vestment in Africa: A panel data Analysis. Global Journal of Managementand Business Research. Vol 12(18), pp.85-96.
15
[34] Suliman, A.H., and Mollick, V.A. (2009). Human capital development, warand foreign direct investment in Sub-Saharan Africa. Oxford DevelopmentStudies, Vol 37(1), pp 47-61.
[35] United Nations Conference on Trade and development (UNCTAD) WorldInvestment Directory (2008), Volume X Africa.
[36] Wafure, O.G., and Nurudeen, A. (2010). Determinants of foreign directinvestment in Nigeria: an empirical analysis. Global Journal of HumanSocial Science. Vol 10 (1), pp. 26-34.
[37] Wang, C and Balasubramanyan, V.N. (2011). Aid and foreign direct in-vestment in Vietnam. Journal of Economic Integration, 26(4), pp. 721-739.
[38] World development indicators online database (2013, 2014).
[39] Yasin, M. (2005). Official development assistance and foreign direct invest-ment flows to Sub Saharan Africa. African Development Bank, pp. 24-40.
[40] Zeng, L.D., Tong, Q.S., Wang, L and Qian, W. (2001). On the determinantsof foreign direct investment to developing countries: is Africa different?World Development, 30(1), 107-119.
[41] Wang and Balasubramanyan (2011) for Vietnam, Karakaplan, Neyapatiand Sayek (2005) for 97 countries; Kimura and Todo (2010) on JapaneseFDI; Carro and Larru (2010) on Brazil and Argentina; Bhavan (2011) forfive Asian economies; Selaya and Sunesen (2012) on a mix of developingcountries and Garriga and Phillips (2013) for post conflict countries.
[42] Other proxies of governance provided by the freedom house only considertwo aspects of governance (civil liberty and political stability) and thereforemight exclude other factors that affect governance in SSA which is coveredby the WGI. The WGI comprises of 6 broad dimensions of governancenamely corruption, rule of law, regulatory quality, government effectiveness,political stability and voice and accountability. The governance scores rangefrom -2.5 to 2.5 representing weak and good governance respectively.
[43] The focus on oil endowment is informed by the fact that oil endowed coun-tries account for a significant proportion of FDI to the region. In 2014 forexample, over 40 percent of FDI to SSA was to the extractive sectors in oilrich nations.
[44] The countries included in the study are Angola, Benin, Botswana, Burk-ina Faso, Cameroon, chad, DRC, ivory Coast, Ethiopia, Gabon, Ghana,Guinea, Kenya, Lesotho, Madagascar, Malawi, Mali, Mauritius, Mozam-bique, Namibia, Niger, Nigeria, Rwanda, Senegal, Sierra Leone, SouthAfrica, Swaziland, Tanzania, Togo, Uganda and Zambia.
16

[45] Productive sector aid is composed of aid directed to agriculture, forestry,fishing, industry mining, construction, trade, banking and tourism. Socio-economic infrastructure aid consists of aid directed at social infrastructuresuch as education, health, water supply and economic infrastructure suchas energy, transportation and communication.
[46] Commitment figures are reported from 1995 to 2012, while disbursementfigures are reported from 2002 to 2010.
[47] Robustness checks results for the energy and transport regressions are avail-able in appendix 2(a) and 2(b).
[48] Similar estimation results are found when oil reserves and oil dummy isused as proxy for oil resource. The coefficients are negative although in-significant.
[49] According to Asiedu (2012) in 2009 for example, 43 percent of FDI inflowsto SSA countries went to the top 4 oil exporters in the region, while 49percent went to the remaining 43 SSA countries.
[50] Exchange rate is included as proxy for macro-economic stability and percapita GDP is included to proxy market size.
[51] Due to data availability, 23 and 25 countries were included in the energyand transport regression respectively.
[52] The results obtained here though contrary to Harms and Lutz (2006) whofind energy aid to be negatively related to FDI and transport aid to posi-tively impact FDI inflows, still meet with their overall findings of a positiveimpact of infrastructure aid on FDI inflows.
17

Table 1: Percentage of total ODA flows to Developing Nations. 1980-2013
Region Africa and SSA
Years Europe Africa America Asia Oceania Unspecified Africa%
of total
ODA
SSA% of
total ODA
SSA% of
ODA to
Africa
1980-1989 1.80 36.71 8.99 36.90 3.40 12.18 36.71 28.58
77.84
1990-1999 4.36 38.96 10.27 30.60 3.11 12.70 38.96 30.06
77.15
2000-2013 5.29 36.54 7.73 30.57 1.47 18.41 36.54 32.04
87.68
Source: OECD-CRS Online database
Table 2: Descriptive statistics
Variable Mean STD. Dev Min Max
FDI-GDP 3.70 5.15 -8.58 46.49
PROD 77.13 56.40 0.035 647.05
SEC 516.92 539.88 4.26 3637.26
TRADE 74.72 35.13 25.04 209.87
INFL 23.35 187.70 -9.61 4145.10
TEL 2.43 5.03 0 31.50
POP
GI
2.11e+07
-0.535
2.74e+07
0.583
984506
-2.22
1.69e+08
0866
Table 3: Correlation Matrix
FDI PROD_AI
D
SEC_AID INFL TRADE TEL POP GI
FDI 1
PROD 0.002 1
SEC 0.015 0.736*** 1
TRADE 0.315*** -0.365*** -0.394*** 1
INFL 0.009 -0.046 -0.009 0.075* 1
TEL -0.095** -0.235*** -0.303*** 0.487*** -0.009** 1
POP -0.036 0.547*** -0.516*** -0.516*** 0.046 -0.495*** 1
GI -0.035 -0.02 -0.150*** 0.248*** -0.153*** 0.735*** -0.433*** 1
* ** ***indicates significance at 10%, 5%, and 1% level of significance
18

Table 4: Panel estimation regression results
Variable FE RE SYS-GMM(1) SYS-GMM(2)
PROD-Aid 0.515** 0.31 0.30*** 0.29***
SEC-Aid -0.22 0.16 0.002 -0.41
AID-SQUARED - - - 0.35
TRADE 8.96*** 7.72*** 6.25*** 5.49***
INFLATION -0.01* -0.001*** -0.046*** -1.42***
TELEPHONE -2.89*** -1.84*** -1.37*** -1.02***
POPULATION 4.48** 0.24 -1.64*** -1.42***
GOVERNANCE -1.15 1.43* 0.13 -2.14***
FDIt-1 - - 0.57*** 0.55***
F-Test Pr>F=0.000 - - -
Wald Test -
Pr> χ2=(0.000)
Pr> χ2=(0.000) Pr> χ2=(0.000)
Arrellano-Bond
Test
- - Pr> Z=(0.23) Pr> Z=(0.25)
Sargan Test - - Pr> χ2=(1.000) Pr> χ2=(1.000)
Number of
observations
526
526
495
495
The asterix * ** *** indicates 10%, 5% and 1% level of significance
19

Table 5: Interaction of foreign aid and resource endowment
Variable FE SYS-GMM
PROD-Aid 0.80*** 0.73*** 0.38*** 0.31***
SEC-Aid 0.03 0.28 0.19 -0.12
TRADE 8.23*** 7.41*** 6.74*** 6.67***
INFLATION -0.001 -0.002** -0.004*** -0.004***
TELEPHONE -2.81*** -2.60*** -1.12*** -1.36***
POPULATION 4.47* 5.40** -1.77*** -1.58***
GOVERNANCE -1.65 -1.18 -0.09 0.88
PROD-AID*OIL
PRODUCTION
-0.007*** -0.0008*** -
SEC-AID*OIL
PRODUCTION
- -0.001*** - -0.0004***
FDIt-1 - - 0.52*** 0.52***
F-Test Pr>F=0.000 Pr>F=0.000
Wald Test - - Pr> χ2=(0.000) Pr> χ2=(0.000)
Arrellano-Bond
Test
- - Pr> Z=(0.23) Pr> Z=(0.24)
Sargan Test - - Pr> χ2=(1.000) Pr> χ2=(1.000)
Number of
observations
526 526 495 495
The asterix * ** *** indicates 10%, 5% and 1% level of significance
Table 6: Transport aid regressions
Variable FE RE SYS-GMM(1) SYS-GMM(2)
TRANSPORT Aid -0.096 -0.096 -0.022 -0.047
TRADE 12.39*** 8.933*** 11.93*** 10.57***
EXCHANGE RATE 0.039 0.025 -2.17*** -2.66***
TELEPHONE -1.15* -1.205** -2.00* -2.871**
GDPC -8.40*** -1.398** -4.14** -4.304*
GOVERNANCE 2.915* 1.659* 7.68*** 11.36***
FDIt-1 0.391*** 0.443***
Aid2 -0.002
F-Test Pr>F=0.000
Wald Test Pr> χ2=(0.000) Pr> χ2=(0.000) Pr> χ2=(0.000)
Arrellano-Bond Test Pr> Z=(0.26) Pr> Z=(0.34)
Sargan Test Pr> χ2=(1.000) Pr> χ2=(1.000)
Number of
observations
424
424
399
399
The asterix * ** *** indicates 10%, 5% and 1% level of significance
20
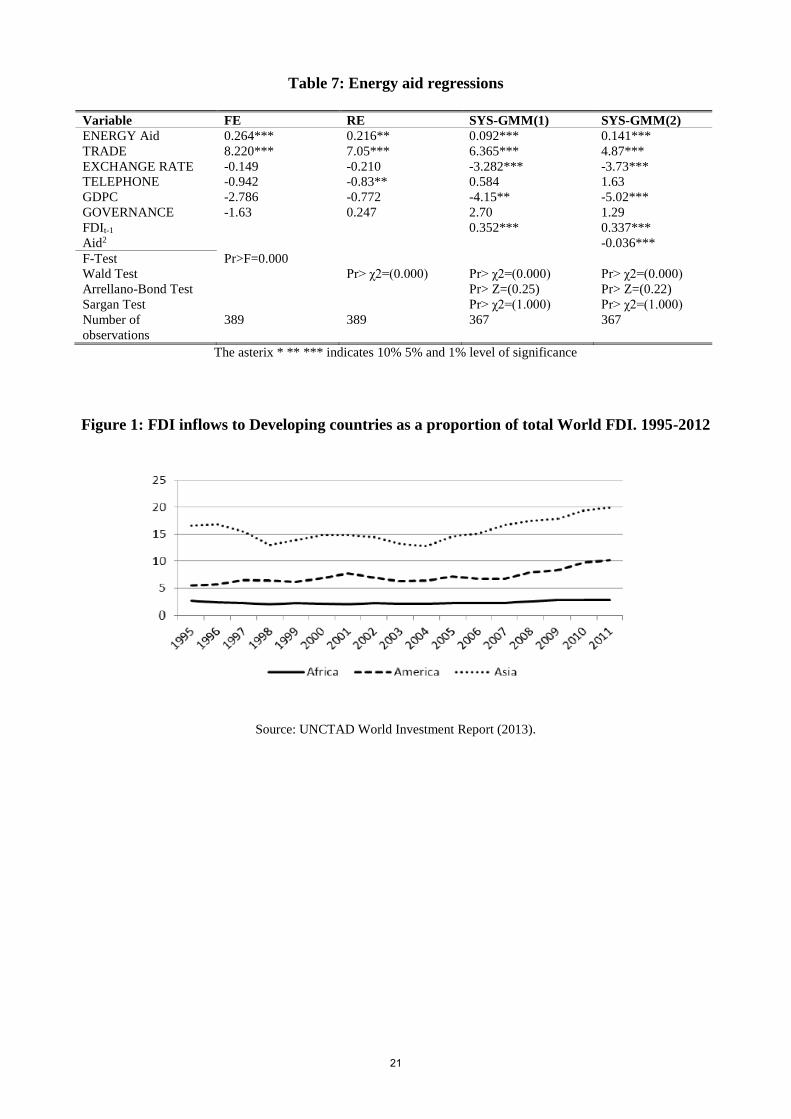
Table 7: Energy aid regressions
Variable FE RE SYS-GMM(1) SYS-GMM(2)
ENERGY Aid 0.264*** 0.216** 0.092*** 0.141***
TRADE 8.220*** 7.05*** 6.365*** 4.87***
EXCHANGE RATE -0.149 -0.210 -3.282*** -3.73***
TELEPHONE -0.942 -0.83** 0.584 1.63
GDPC -2.786 -0.772 -4.15** -5.02***
GOVERNANCE -1.63 0.247 2.70 1.29
FDIt-1 0.352*** 0.337***
Aid2 -0.036***
F-Test Pr>F=0.000
Wald Test Pr> χ2=(0.000) Pr> χ2=(0.000) Pr> χ2=(0.000)
Arrellano-Bond Test Pr> Z=(0.25) Pr> Z=(0.22)
Sargan Test Pr> χ2=(1.000) Pr> χ2=(1.000)
Number of
observations
389 389 367 367
The asterix * ** *** indicates 10% 5% and 1% level of significance
Figure 1: FDI inflows to Developing countries as a proportion of total World FDI. 1995-2012
Source: UNCTAD World Investment Report (2013).
21

Figure 2: Regional comparison of FDI inflows to Africa as a percentage of World FDI. 1995-
2012
Source: UNCTAD World Investment Report (2013).
Figure 3: ODA as a percentage of recipients GNI, 1995-2013
Source: OECD-CRS, Online database.
0
0.5
1
1.5
2
2.5
3
3.5
4
4.5
5
1995 1996 1997 1998 1999 2000 2001 2002 2003 2004 2005 2006 2007 2008 2009 2010 2011 2012 2013
Europe Africa America Asia
22

Figure 4: Geographical distribution of ODA in SSA. Million US dollars, 1980-2013
Source: Author’s calculations from OECD-CRS online database
Figure 5: Sectoral allocation of foreign aid to Africa, (millions of US dollars), 1995-2012
Source: Author’s calculation from OECD-CRS online database
0
5000
10000
15000
20000
25000
30000
35000
40000
45000
50000
1980 1982 1984 1986 1988 1990 1992 1994 1996 1998 2000 2002 2004 2006 2008 2010 2012
Total aid to SSA West Africa Southern Africa East Africa
23