foreign banks: trends, impact and financial stability … banks: trends, impact and financial...
TRANSCRIPT

Foreign banks: Trends, Impact and Financial Stability
Stijn Claessens and Neeltje van Horen*
February 2012
Abstract
Over the past two decades, foreign banks have become more important in domestic financial intermediation, heightening the need to understand the behavior of foreign banks better. Using a new, comprehensive database on bank ownership for 137 countries over the period 1995-2009, identifying also the home country of banks, we document substantial increases in foreign bank presence in many countries. We also show large heterogeneity in terms of home and host countries, bilateral patterns, and performance. In terms of impact, we find a negative relation between private credit and foreign bank presence, but only in countries with relatively distant foreign banks. Furthermore, leading up to the crisis, private credit grew faster when foreign bank presence was large, but not in countries with relatively distant foreign banks. In addition, foreign banks reduced credit more compared to domestic banks during the global crisis in countries where they have a small role in financial intermediation, but not so when they were dominant or funded through local deposits. Our results show that accounting for heterogeneity is crucial to better understand the implications of foreign bank ownership. JEL Classification Codes: F21, F23, G21 Keywords: foreign banks, financial globalization, financial sector development, financial stability, financial crisis.
* Claessens is with the International Monetary Fund, University of Amsterdam, and CEPR, and Van Horen is with De Nederlandsche Bank (DNB). This paper was partly written while Van Horen was visiting the Research Department of the Federal Reserve Bank of Chicago. We would like to thank Thorsten Beck for valuable comments. We are grateful to Tugba Gurcanlar, Matias Gutierrez, Joaquin Mercado, Deimante Morkunaite, Krisztina Orban, Jeanne Verrier and Chen Yeh for their extensive help with collecting the data and providing excellent research assistance. The data collection was started while the authors were at the World Bank and financial support for this project from the World Bank’s Research Support Budget and the United Kingdom's Department for International Development (DECRG trade and services project) is gratefully acknowledged. The views expressed in this paper are those of the authors and do not necessarily represent those of the institutions with which they are or have been affiliated. E-mail addresses: [email protected], [email protected].

2
1. Introduction Although interrupted by the recent financial crisis, the past two decades have seen an
unprecedented degree of globalization, especially in financial services. Not only have cross-
border bank (and other capital) flows increased dramatically, but also many banks, from both
advanced and developing countries, have ventured abroad and established presence in other
countries. Although there are exceptions and regional differences, few countries have been
left out from this trend of increased financial integration.
Given the importance of foreign banks in many countries, understanding the
motivations of foreign banks to enter a particular host country, the mode by which they do so,
and the impact they have on financial sector development and lending stability has become
essential. These questions have become even more prominent as a result of the financial
crisis. Although much research has been conducted, many questions remain unanswered,
however, partly because data availability has been limited.
This paper contributes to the literature on foreign banking in three ways. First,
introducing and using a new and comprehensive database on bank ownership, including the
home country of foreign banks, covering 137 countries from 1995 to 2009, it describes salient
facts on trends in foreign bank ownership. Second, it re-examines the link between foreign
bank presence and private credit. Third, it re-examines the link between foreign bank presence
and financial stability, focusing on the recent financial crisis.
We document a sharp increase in foreign bank ownership from 1995 to 2009 affecting
a large number of countries. However, much heterogeneity exists with respect to the relative
importance of foreign banks in the host country, the home country of the parent bank, the
bilateral patterns, and the business models used by and performance of foreign banks. Our
empirical analyses show that the link between foreign bank participation and private credit
depends importantly on the average distance between parent bank and host country. Only
when this distance is relatively large does a negative correlation between the two exist. In
addition, in the years leading up to the crisis private credit growth was faster in countries with
a larger presence of foreign banks but only when their parents were located in neighboring
countries. When studying the link between foreign bank presence and financial stability, we
find that during the global financial crisis foreign banks reduced credit more compared to
domestic banks in countries where the level of foreign bank participation is relatively low.
However, in countries with high levels of foreign bank participation foreign bank behavior

3
did not differ from that of domestic banks. Furthermore, foreign banks that relied more on
deposit funding remained a more stable source of credit.
Many studies have examined the causes and consequences of foreign bank ownership.
Before the crisis, the general consensus was that the benefits of foreign banks greatly
outweigh costs in many dimensions. Particularly, it was generally thought that foreign banks
add to domestic competition, increase access to financial services, enhance financial and
economic performance of their borrowers, and bring greater financial stability (Clarke, Cull,
Martinez Peria and Sanchez, 2003, Claessens, 2006, Chopra, 2007, and Cull and Martinez
Peria, 2011). Generally, lower costs of financial intermediation (measured by margins,
spreads, overheads) and lower profitability are documented with greater foreign bank
presence (Claessens, Demirguc-Kunt, and Huizinga, 2001 and related studies, e.g., Mian,
2003, Berger, Clarke, Cull, Klapper and Udell, 2005). Also, evidence exists of better quality
financial intermediation, e.g., lower loan-loss provisioning with more foreign entry (Martinez-
Peria and Mody, 2004). Likely a number of factors are behind these effects, such as the
introduction of new, more diverse products, greater use of up-to-date technologies, and know-
how spillovers (e.g., as people learn new skills from foreign banks, they migrate over time to
domestic banks). In addition, foreign banks likely pressured governments to improve
regulation and supervision, increase transparency, and more generally catalyze domestic
reform (Levine 1996, Dobson, 2005, and Mishkin, 2006).
The effects of the entry of foreign banks on development and efficiency appear to
depend though on some conditions. Limited general development and barriers can hinder the
effectiveness of foreign banks (Garcia-Herrero and Martinez Peria, 2005; Demirguc-Kunt,
Laeven and Levine, 2004). Also, the relative size of foreign banks’ presence seems to matter.
With more limited entry (as a share of the total host banking system), fewer spillovers seem to
arise, suggesting some threshold effect (Claessens and Lee, 2003). In terms of individual bank
characteristics, it seems that larger foreign banks are associated with greater effects on access
to financial services for small and medium-sized enterprises, perhaps as they are more
committed to the market, while smaller banks are more niche players (Clarke et al. 2005).
Furthermore, the health of both the home and the local host bank operation seem to matter,
with healthier banks showing better credit growth (Dages, Goldberg and Kinney, 2000; see
also Haber and Musacchio, 2005 and De Haas and Van Lelyveld, 2006).
While the entry of foreign banks is generally thought to have favorable effects on the
development of host banking systems, including through increased credit extension, some
studies find more ambiguous results. Some show that foreign banks “cherry pick” borrowers
4
(Detragiache, Gupta, and Tressel, 2008; Beck and Martinez Peria, 2007). This can undermine
overall access to financial services, since cherry picking worsens the remaining credit pool,
and lower financial development, especially in low-income countries where relationship
lending is important. Indeed, Detragiache, Tressel and Gupta (2008) show the presence of
foreign banks in low-income countries to be associated with less credit being extended.
However, Cull and Martinez Peria (2007) show that this relationship disappears or even
reverses once crisis-induced acquisition of (distressed) banks by foreigners is accounted for.
Besides the impact of foreign banks on the development and efficiency of the
domestic financial sector, many studies examined the impact of foreign banks on financial
stability. Some papers find that global banks support their foreign affiliates during times of
financial stress through internal capital markets (De Haas and Van Lelyveld, 2006 and 2010;
and Barba-Navaretti, Calzolari, Levi and Pozzolo, 2010). At the same time, however, a
number of studies show that (funding) shocks to parent banks can be transmitted to their
foreign subsidiaries with negative consequences for their lending (Peek and Rosengren (1999,
2000); Acharya and Schnabl (2010), Chava and Purnandam (2011); Cetorelli and Goldberg,
2011). Studying the global financial crisis, studies showed that foreign subsidiaries reduced
lending more compared to domestic banks (Popov and Udell 2010; De Haas, Korniyenko,
Loukoianova and Pivovarsk 2011; De Haas and Van Lelyveld 2011). Ongena, Peydro Alcalde
and Van Horen (2011), however, show for Eastern European countries that while foreign
banks reduced lending more compared to locally funded domestic banks, they did not
compared to banks that had financed their lending from international capital markets.
Although providing very interesting and valuable insights, these studies analyze in
general only a limited number of countries and/or a selected number of (large) banks. While
this can allow for a more careful isolation of the mechanisms the authors are after, it can come
at the cost of not being able to generalize the results or to address the influence of
heterogeneity across foreign banks. By introducing and using a new, comprehensive database
covering (close to) the universe of domestic and foreign banks over a lengthy period, this
paper extends the literature on foreign banking in regard to two important questions: One,
how does foreign bank ownership affect private credit? And two, how does foreign bank
ownership affect financial stability? As the database includes the home country of each
foreign bank, we also study the impact of bilateral factors, which up till now received only
limited attention due to data limitations. This is important given the interplay between home
and host countries features in entry decisions (Berger, Buch, DeLong, and DeYoung, 2004;

5
Galindo, Micco and Serra 2003, and Claessens and Van Horen, 2010) and between (cultural
and institutional) distance and performance (Claessens and Van Horen, 2011).
The paper itself is structured as follows. Section 2 describes the database. Section 3
provides an overview of the main trends in foreign banking, and highlights the heterogeneity
and differences in foreign bank ownership. Section 4 examines the impact of foreign bank
ownership on private credit in the host country. Section 5 studies the impact of foreign bank
ownership on lending stability during the global financial crisis. Section 6 concludes.
2. Data This paper uses an original and newly collected database on bank ownership.1 The database
covers the period 1995-2009, and includes 5,377 banks active at least one year in 137
countries, thus covering banks in advanced countries like the United Kingdom and the United
States, emerging markets like Brazil and China, and developing countries like Cambodia and
Zambia.2 The database includes commercial banks, savings banks, cooperative banks, bank
holdings, and holding companies.3
For each year and for each bank in our sample, we determined the exact moment of
entry and exit. If the exact year of establishment could not be determined, but additional
information indicated that the bank was in operation prior to 1995 (e.g., the presence of
financial statements), we coded 1500 as the fictive year of establishment.4 In terms of exit, we
took in general the year a bank became inactive in Bankscope as the year of exit. In all cases,
we cross-checked this using additional sources and made corrections if necessary. In addition,
we carefully accounted for mergers and acquisitions to make sure that only the merged entity
or the acquiring bank remained in the sample after a take-over.5
1 In building the database, many sources were used, including Bankscope, individual banks’ annual reports, corporate governance reports, Central Bank publications and web-sites, information from banking regulation agencies, local stock exchanges, US SEC forms F-20, parent company’s reports, The Economist Intelligence Unit, Factiva, The Banker, etc. 2 Our sample includes all countries with more than 5 active banks reporting to Bankscope in 2008. For the advanced countries in our sample, we restrict our coverage to the 100 largest banks in terms of 2008 assets, so smaller (typically regional) banks are not included in the database for these countries. For all these countries, we cover at least 90 percent of the banking system in terms of assets. 3 Including bank holdings and holding companies can potentially lead to double counting as both the holding company and the bank are often included in Bankscope. In all countries where bank holdings were included, we excluded the holding company if the bank itself was represented 4 For 134 banks (2.5 percent of our sample) we were not able to find the exact year of establishment nor could we determine whether the bank was active prior to 1995. In these cases the year of establishment is left blank. 5 For example, if two banks, bank A and bank B merged in 2000 to create a new entity, bank C, then the two individual banks A and B were each included in the dataset until 2000. Then, from 2000 on, these two banks were considered inactive and the new bank (bank C) was included in the database. Similarly, if bank A was acquired by bank B in 2000, both banks were included in the database until 2000, with bank A then becoming inactive after 2000 and bank B remaining active after 2000.

6
For each bank in every year, we identified its shareholders, the nationality of the
shareholder(s), and recorded any change in ownership. We classified a bank as foreign-owned
using the definition generally applied in the literature, i.e., if 50 percent or more of its shares
are owned by foreigners. For all foreign banks we summed the percentages of shares held by
foreigners by country of residence, with the country with the highest percentage of shares then
considered the home country.6 Ownership, and country of ownership, is based on direct
ownership, i.e., we do not consider indirect ownership. We do, however, take into account
that in some cases the direct owner is an entity purely established for tax purposes. In such
cases we recorded the country of nationality of the ultimate owner as the source country
(these cases typically involve entities registered in Mauritius, Panama and Luxembourg).
When determining ownership, we erred on the side of caution and reported ownership as
missing when the reliability of the information was in question.7
Using this procedure we determined complete ownership structure, including the home
country of the largest foreign shareholder, for 5,059 of the 5,377 banks in the sample (i.e., 94
percent) for all the years each bank was active. For 92 banks only partial ownership and for
226 banks no ownership could be determined. All in all, the data provide an almost complete
picture of bank ownership around the world and changes therein over time.
Compared to other databases on bank ownership used in the literature (most notably
the one constructed by Micco, Panizza and Yañez 2007) our database differs in a number of
respects: First, it includes virtually all banks active in a particular country, which allows not
only for the comparison of domestic and foreign banks but also for comparisons of types of
banks (i.e., small versus large, old versus young, deposit taking versus non-deposit taking).
Second, it includes countries at all levels of development, allowing one to test whether foreign
banks behave differently (from domestic banks) in certain countries. Third, it captures bank
ownership and changes therein over an extensive time period, allowing one to disentangle
short-run versus long-run implications of foreign ownership. Fourth, as it includes the home
country of foreign banks, it allows one to differentiate between foreign banks from different
types of home countries and examine the impact of bilateral factors (like distance, trade
linkages, institutional similarity, etc.) on the behavior of foreign banks.
6 In recent years, identifying home countries and tracing ownership information has become more complicated with more banks raising equity through capital markets. To overcome the problem of determining the nationality of anonymous shareholders, we only consider block shareholdings when determining ownership. 7 For specific examples of how the home country was determined see the Working Paper version of this paper available at: http://www.imf.org/external/pubs/ft/wp/2012/wp1210.pdf.

7
3. Trends and heterogeneity in foreign banking Over the period 1995 to 2009, banking systems in many countries experienced important
transformations.8 While the total number of domestic and foreign banks in our sample stayed
virtually the same (3,894 in 1995 and 3,910 in 2009), these aggregate numbers mask two
counteracting trends (Table 1).9 The number of domestic banks decreased by about 17
percent, due to consolidation driven by technological changes and deregulation in many
advanced and developing markets as well as by some financial crises. At the same time, the
number of foreign banks increased by 72 percent. These differing trends mean that the relative
importance of foreign banks increased substantially, from a share of 20 percent in 1995 to 34
percent in 2009. Figure 1 shows this steady increase in the number of foreign banks present,
from 774 in 1995 to 1334 in 2009, with the foreign share rising as well.
While there was a steady increase, foreign bank entry did fluctuate substantially over
the period (Figure 2). Foreign bank investment activity was especially high in the late nineties
and early 2000s and again in 2006-2007. This reflected in part waves of reforms, including
the opening up of Eastern Europe and other transition economies, and the liberalization of
entry by East Asian countries. It also reflected the sharp increase in financial globalization
before the crisis. Entry peaked in 2007 but slowed down markedly after the start of the crisis.
While 2008 still saw entries at levels similar to 2005, 2009 entries were the lowest of
the period, reflecting bank-specific and home- and host-country factors. Many banks suffered
capital losses and other balance sheet impairments and, due to market forces or government
interventions, were forced to consolidate. Many choose to retreat from cross-border banking
in general. At the same time, host countries affected by the crisis became less interesting as
investment opportunities. Foreign banks did exit markets also earlier, with 2001 standing out
with 48 banks exiting, mostly due to the various crises affecting emerging markets and related
consolidation trends and reforms. While the recent crisis has affected new entry, until 2009
exit remained at levels similar to earlier periods.10
Even though few countries are left out (in 1995 19 countries did not have any foreign
bank present and in 2009 only 11 countries), the share of foreign banks and their role as
8 We exclude from all further analyses 8 offshore host countries (Antigua and Barbuda, Bahrain, Barbados, Cyprus, Mauritius, Panama, Seychelles and Singapore) that are included in the database. 9 Note that for some OECD countries in our sample the database does not include all active banks. Very small (typically regional) banks (outside the top 100 banks in terms of assets in 2008) are not included. 10 Parent banks, apparently, did not (yet) feel the need to close or sell their foreign affiliates. This likely reflects that most affiliates were located in countries at the time only marginally affected by the crisis and/or with substantial long-term growth opportunities (with fixed costs involved in setting up a foreign affiliate large, exits are in general not driven by short-run fluctuations).

8
financial intermediaries differs widely across countries. Figure 3a and 3b show the relative
foreign bank presence across all 129 host countries in terms of numbers and assets in 2007 (to
avoid impact of the financial crisis). It highlights two aspects. First, in terms of numbers,
shares vary from 100% for the top 10 host countries to single digit percentages for the bottom
20 host countries. Similarly, the range of asset shares varies from 100% to single digits. The
drop in asset share though is steeper in the middle range. This reflects that host countries tend
to have either many large foreign banks or few small banks.
The growing importance of foreign ownership has rendered foreign banks important
conduits of financial intermediation. Foreign bank presence is not evenly distributed across
income groups, however. Using again 2007 data, Figures 4a and 4b, depicting the relation
between GDP per capita and shares in numbers and total domestic asset, show the large
variations in foreign bank presence. Especially in emerging markets and developing countries,
foreign banks play important roles in financial intermediation, with average loan, deposit and
profit shares close to 45 percent in emerging markets and close to 50 percent in developing
countries. In contrast, and perhaps not surprisingly, in OECD countries the vast majority of
financial intermediation is done by domestic banks, with foreign bank loan, deposit and profit
shares on average ranging only about 20 percent.
Two more two facts are noteworthy. First, the large dispersion in the average size of
banks across host countries, with little apparent relation to the number of foreign banks
present in the country (Figure 4c). And second, the fact that the share of foreign banks in
numbers is less than the share in terms of assets at low levels of presence in numbers, and the
reverse at higher level of presence in numbers (Figure 4d). This suggests that foreign banks
tend to be small when few in numbers and large when they dominate the market in numbers.
Figure 5a and 5b show the home countries’ foreign bank distribution in terms of share
in numbers and assets of total local home banking systems in 2007.11 It highlights again the
large variation, similar to the host country distribution, with shares varying between 100%
and zero percent. Still, there is more concentration in the distribution of foreign banks across
home countries than across host countries as the shares drop off even faster below the top 20
home countries in terms of numbers, but even more so in terms of assets. This implies that
some home countries “export” relatively many (large) foreign banks. Patterns have also
changed over time. While entry largely reflects investments from established countries, there
11 The figures depict the share (in number or assets) of banks in a home country that have foreign bank presence, where each presence is counted separately, relative to all the banks in that home country which the data cover. For example, a 100% number share means that all banks in that home country have some foreign bank presence.

9
have been investors from new countries. While in 1995, 147 banks came from emerging
markets and 38 from developing countries, in 2009 these numbers increased to 279 and 77
respectively. Foreign ownership thus became less concentrated. In 1995 the five biggest
investors (France, Germany, the Netherlands, the United Kingdom and the United States)
owned 45 percent of all foreign banks, compared to 38 percent in 2009.
Foreign bank ownership is not evenly distributed across home countries. Figures 6a
and 6b depict the relation between home country GDP per capita and the country’s degree of
“exporting” foreign banks, in shares of numbers and total assets. It shows that more
developed countries tend to export more foreign banks and that fewer foreign banks come
from low-income countries. Still, while the vast majority of parent banks are from an OECD
country, at least 30 percent of foreign banks are owned by a bank from an emerging market or
developing country. And there remain large dispersions in the degree of exporting. Two more
facts are noteworthy. First, the dominance of small banks, with little apparent relation to the
number of banks exported from that home country (Figure 6c). And second, that the share of
foreign banks in numbers is almost always higher than the share in assets (Figure 6d),
indicating that foreign bank operations tend to be small relative to the size of domestic banks
in most home countries.
Not only do distributions across home and host country differ, but foreign bank
presence also differs bilaterally. Table 2 shows strong regional patterns in foreign bank
presence, with the diagonal entries showing much larger presence. For example, of the foreign
banks coming from the Americas, 63% are present in the same region and only 37%
elsewhere. Figure 7a and b depict this regional pattern in more detail in the form of heat-maps
for respectively the number share of foreign banks from a particular home country going to a
certain host country, and the assets share of foreign banks in a particular host country coming
from a certain home country. Both Figures show the same, strong regional pattern.12
Finally, foreign banks can differ from domestic banks in their business models, size
and profitability, with some of these differences to vary by level of host country development.
Figures 8a-8d plot a number of balance sheets and performance measures for domestic and
foreign banks against the host countries’ GDP per capita. The figures show much
heterogeneity, but also some differences which vary by level of development.
12 This regional pattern may not surprise since research has shown that foreign banks tend to follow their customers and therefore enter countries with strong trade linkages (e.g., Goldberg and Grosse 1994). In addition, studies have found that banks tend to invest in countries that are (geographical and/or institutional) close (e.g., Buch and De Long (2004); Galindo, Micco and Serra 2003)). Furthermore, Claessens and Van Horen (2010) show not only absolute distance to matters but also the distance of competitor countries.
10
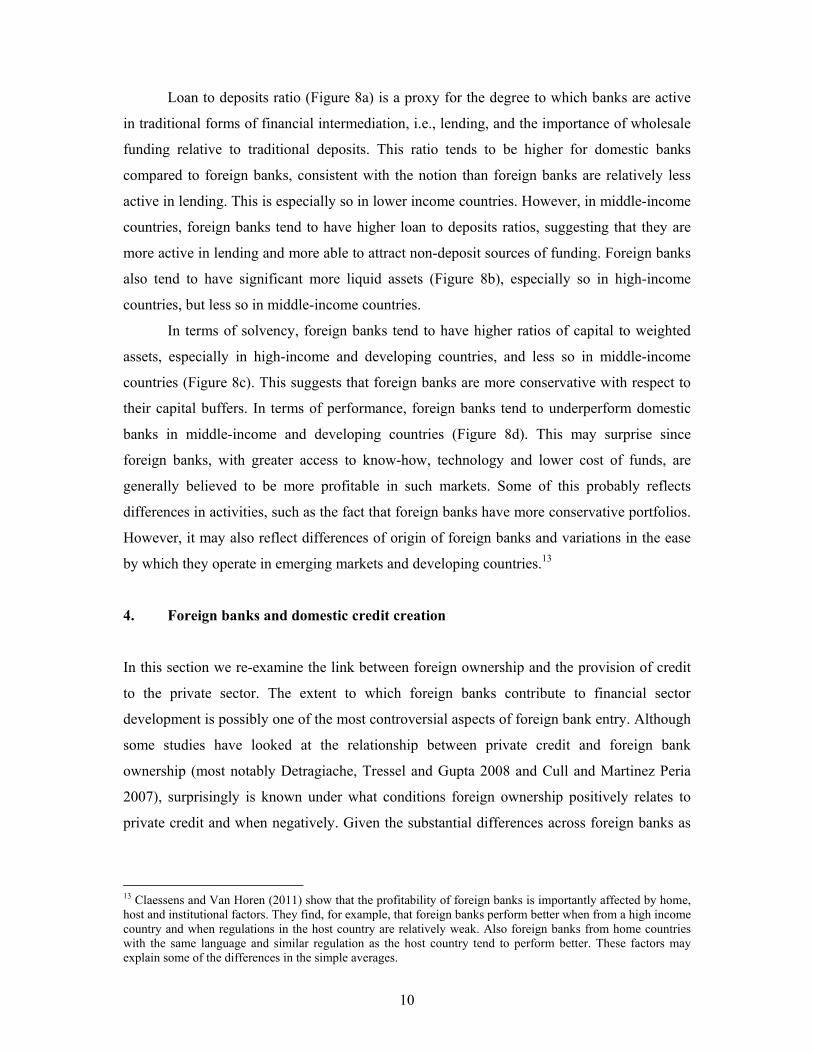
Loan to deposits ratio (Figure 8a) is a proxy for the degree to which banks are active
in traditional forms of financial intermediation, i.e., lending, and the importance of wholesale
funding relative to traditional deposits. This ratio tends to be higher for domestic banks
compared to foreign banks, consistent with the notion than foreign banks are relatively less
active in lending. This is especially so in lower income countries. However, in middle-income
countries, foreign banks tend to have higher loan to deposits ratios, suggesting that they are
more active in lending and more able to attract non-deposit sources of funding. Foreign banks
also tend to have significant more liquid assets (Figure 8b), especially so in high-income
countries, but less so in middle-income countries.
In terms of solvency, foreign banks tend to have higher ratios of capital to weighted
assets, especially in high-income and developing countries, and less so in middle-income
countries (Figure 8c). This suggests that foreign banks are more conservative with respect to
their capital buffers. In terms of performance, foreign banks tend to underperform domestic
banks in middle-income and developing countries (Figure 8d). This may surprise since
foreign banks, with greater access to know-how, technology and lower cost of funds, are
generally believed to be more profitable in such markets. Some of this probably reflects
differences in activities, such as the fact that foreign banks have more conservative portfolios.
However, it may also reflect differences of origin of foreign banks and variations in the ease
by which they operate in emerging markets and developing countries.13
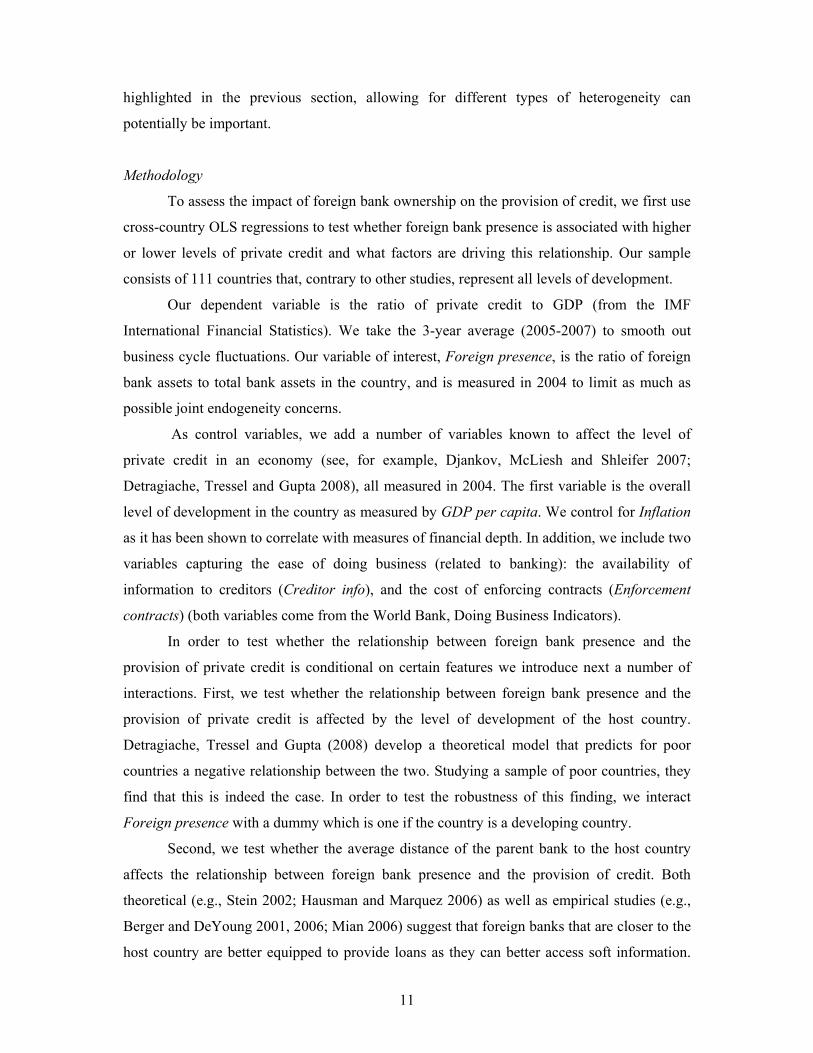
4. Foreign banks and domestic credit creation
In this section we re-examine the link between foreign ownership and the provision of credit
to the private sector. The extent to which foreign banks contribute to financial sector
development is possibly one of the most controversial aspects of foreign bank entry. Although
some studies have looked at the relationship between private credit and foreign bank
ownership (most notably Detragiache, Tressel and Gupta 2008 and Cull and Martinez Peria
2007), surprisingly is known under what conditions foreign ownership positively relates to
private credit and when negatively. Given the substantial differences across foreign banks as
13 Claessens and Van Horen (2011) show that the profitability of foreign banks is importantly affected by home, host and institutional factors. They find, for example, that foreign banks perform better when from a high income country and when regulations in the host country are relatively weak. Also foreign banks from home countries with the same language and similar regulation as the host country tend to perform better. These factors may explain some of the differences in the simple averages.
11
highlighted in the previous section, allowing for different types of heterogeneity can
potentially be important.
Methodology
To assess the impact of foreign bank ownership on the provision of credit, we first use
cross-country OLS regressions to test whether foreign bank presence is associated with higher
or lower levels of private credit and what factors are driving this relationship. Our sample
consists of 111 countries that, contrary to other studies, represent all levels of development.
Our dependent variable is the ratio of private credit to GDP (from the IMF
International Financial Statistics). We take the 3-year average (2005-2007) to smooth out
business cycle fluctuations. Our variable of interest, Foreign presence, is the ratio of foreign
bank assets to total bank assets in the country, and is measured in 2004 to limit as much as
possible joint endogeneity concerns.
As control variables, we add a number of variables known to affect the level of
private credit in an economy (see, for example, Djankov, McLiesh and Shleifer 2007;
Detragiache, Tressel and Gupta 2008), all measured in 2004. The first variable is the overall
level of development in the country as measured by GDP per capita. We control for Inflation
as it has been shown to correlate with measures of financial depth. In addition, we include two
variables capturing the ease of doing business (related to banking): the availability of
information to creditors (Creditor info), and the cost of enforcing contracts (Enforcement
contracts) (both variables come from the World Bank, Doing Business Indicators).
In order to test whether the relationship between foreign bank presence and the
provision of private credit is conditional on certain features we introduce next a number of
interactions. First, we test whether the relationship between foreign bank presence and the
provision of private credit is affected by the level of development of the host country.
Detragiache, Tressel and Gupta (2008) develop a theoretical model that predicts for poor
countries a negative relationship between the two. Studying a sample of poor countries, they
find that this is indeed the case. In order to test the robustness of this finding, we interact
Foreign presence with a dummy which is one if the country is a developing country.
Second, we test whether the average distance of the parent bank to the host country
affects the relationship between foreign bank presence and the provision of credit. Both
theoretical (e.g., Stein 2002; Hausman and Marquez 2006) as well as empirical studies (e.g.,
Berger and DeYoung 2001, 2006; Mian 2006) suggest that foreign banks that are closer to the
host country are better equipped to provide loans as they can better access soft information.

12
Therefore, one would expect the provision of credit to be more likely positively correlated to
foreign bank presence when banks from neighboring countries have entered. In order to test
whether this is indeed the case, we interact Foreign presence with a dummy that indicates
whether foreign banks active in a country are relatively close or distant. The variable Distant
banks is created as follows: First, we calculate for each host country the average distance
between the host country and the home country of all foreign banks active in the host country.
Next we take the median of this variable across host countries. The variable Distant banks is
one if the average distance for the host country is above this median and zero otherwise.
The empirical model we estimate is as follows:
iiiiii ZXFPFPY
where iY is the ratio of private credit to GDP in host country i, iFB is the share of bank assets
held by foreign banks, iX is a matrix of variables that are expected to affect the relationship
between foreign presence and the provision of credit, iZ is a matrix of control variables, i is
the error term and α, β, γ and δ are parameters to be estimated. Our parameters of interest are
β and γ. We estimate our model using OLS regressions with robust standard errors.
The obvious drawback of this type of cross-sectional regression is that the market
share of foreign banks could be endogenous to the host country’s financial development. As
also pointed out by Detragiache, Tressel and Gupta (2008) the bias could, however, run both
ways. On the one hand, foreign banks might be more willing to enter countries where (for
other reasons) financial development is particularly low as they expect these markets to grow
faster. On the other hand, business prospects might be worse in countries with low levels of
development, making foreign banks more reluctant to enter.
One way to address this endogeneity problem is to estimate a panel regression.
However, due to the short sample period (balance sheet information is only reliably available
from 2004 onwards) and the credit boom that took place in many countries before the global
financial crisis, the private credit to GDP ratio is high persistent (which results in failure of
the autocorrelation tests). As an alternative we therefore estimate regressions in which we test
if a large foreign bank presence in 2004 affects credit growth between 2004 and 2007. By first
differencing the data we directly control for unobserved country-specific effects that might
affect the level of private credit. This second set of regressions we estimate is thus as follows:
itiiiiii ZXFPFPYY 000

13
where tY is the log difference of the ratio of private credit to GDP between 2004 and
2007. 0iY is the level of private credit to GDP in 2004, to control for financial development in
the initial year.14 0iFP measures foreign bank presence in 2004. The other variables are defined
as before.15 The model is estimated using OLS with robust standard errors.
Empirical results
Table 3 presents the results of our cross-country regression. We find a negative
correlation between the presence of foreign banks and private credit to GDP (Table 3, column
1). A one standard deviation increase in Foreign presence is associated with a decline in
private credit by some 6 percentage points, economically significant, since the average ratio
of private credit to GDP in our sample is 50 percent. We also find some evidence of a non-
linear relationship (column 2). This, however, is mostly driven by a few outliers: high-income
countries with very large financial sectors compared to the size of their economy that are
either dominated by foreign banks (Hong Kong, Ireland and New Zealand) or with hardly any
foreign banks (Iceland). When we exclude these countries, we find again a negative (linear)
relation that is even stronger (not reported).
Pooling all countries, however, masks significant differences across countries. If we
split our sample between high-income (OECD and non-OECD) countries and emerging
markets and developing countries, we find the relation with foreign bank presence to vary
with economic development. For the group of high-income countries (columns 3-4), we find
no significant relationship between foreign ownership and credit. However, as column 5 and 6
show, for emerging markets and developing countries there is a strong negative relationship
between foreign banks presence and credit. A one standard deviation increase in Foreign
presence is associated with a decline in private credit of 5 percentage points (compared to a
mean private credit to GDP ratio of 30 percent in this group of countries).
In terms of our control variables, we find (as expected) GDP per capita to be generally
associated with more financial development and inflation with less financial development,
except for high-income countries, where both variables are not significant, in part as
differences are limited in these countries. Access to creditor information has a positive impact
on financial sector development, but is imprecisely estimated. In emerging markets and
developing countries, the longer it takes for contracts to be enforced, the less credit is created.
14 As we control for the initial level of financial development, the coefficient on foreign bank presence should not be biased due to omitted country characteristics or shocks that affect private credit contemporaneously. 15 GDP per capita is not significant and is omitted from the model, but including it does not change results.

14
Next, we investigate for the sample of emerging markets and developing countries
whether the effect of foreign bank presence differs by type of host country and type of foreign
bank.16 First, we test whether the impact of foreign bank presence differs between developing
countries and emerging markets. The result in Table 4 column 1 shows that this is indeed the
case. We find that foreign bank presence is only negatively related to private credit to GDP in
developing countries. This confirms the results of Detragiache, Tressel and Gupta (2008).
In the next column we investigate whether distance affects the relationship between
foreign bank presence and private credit. Here results indicate that foreign bank presence is
only negatively related to private credit when foreign banks are relatively distant. This is in
line with theoretical and empirical evidence that suggests that distance increases information
asymmetries between bank and borrower (e.g., Hauswald and Marquez 2006, Mian 2006).
We next run a horserace between the impact of economic development of the host
country and of the relative distance. Our results (column 3) show the negative relationship
between foreign bank presence and private credit to be driven by the type of foreign banks
that enter the country, not so much by the level of development of the host country. Although
one has to be careful to make any inferences about the direction of causality, these results
suggest that in emerging markets and developing countries entry of foreign banks that are
more remote can lead to cream-skimming which negatively affects access to credit.
A number of studies have found evidence that the behavior of foreign banks might be
related to the relative importance of foreign banks in the host country. For example, Claessens
and Lee (2003) find fewer spillovers with more limited entry. And Cull and Martinez Peria
(2007) show that in countries where foreign banks hold more than 10 percent of the assets,
private credit was significantly higher than in other countries before, during and after crises.
Since the relative importance of foreign bank presence varies a lot across the countries in our
sample (see Section 3), it is natural to examine whether some kind of threshold effect exists
with respect to the relative importance of foreign banks in the host country.
Therefore, we split our sample of emerging market and developing countries between
countries where foreign banks control less than half of the assets in the country and countries
in which they hold more than half. The results in the last two columns show the negative
relation between distant foreign banks and private credit to be driven by countries where
foreign banks control less than half the assets. This could suggest that foreign banks are more
16 We ran the same regressions on the “All country” sample and the results were very similar. However, since foreign bank presence only seems to affect financial sector development in emerging markets and developing countries, we only show these results as in our view they more insightful.

15
likely to invest in (large) domestic banks that engage in financial intermediation in countries
they are more familiar with (i.e., those that are geographically close). In contrast, in more
distant countries foreign banks are more likely to enter through a greenfield investment with a
focus to remain a niche player, targeting only specific customers.
Our next set of regressions studies the impact of foreign bank presence on private
credit growth between 2004 and 2007. The results in Table 5 indicate that in the years leading
up to the global financial crisis, private credit growth was higher in countries with more
foreign banks. However, interacting Foreign presence with Developing and Distant banks,
shows that this higher credit growth is driven primarily by countries in which foreign banks
are relatively close to their home country (like Eastern European countries where many
Western European banks invested). For those countries with relatively close foreign banks,
one standard deviation increase in Foreign presence is associated with 12 percentage points
higher credit growth (compared to a mean credit growth for these countries of 28 percent).
We cannot reject the null hypothesis of joint significance of Foreign presence and
Foreign presence*Distant banks, suggesting that in host countries with relative distant foreign
banks, the actual importance of these banks in the domestic financial system did not affect
private credit growth in the boom years. This holds for emerging markets and developing
countries as well as for high-income countries.
5. Foreign banks and financial stability during the global financial crisis
The role of foreign banks in lending stability has received renewed attention amidst the
current financial turmoil. Concerns have been raised that, when faced with capital or funding
shocks, foreign banks withdraw from cross-border banking activities, and reduce credit
extension in host markets. While most studies (in large part due to data limitations) focus on
specific regions (often Central and Eastern Europe), our database allows us to study how the
global financial crisis has affected lending stability of foreign banks in a large number of
countries. This allows us to analyze how different levels of development and differences in
relative market share of foreign banks affect foreign bank behavior. Furthermore, our
database includes virtually all domestic and foreign banks, allowing for a detailed comparison
of the stability of lending for both types of banks. Finally, since we know the home country of
all foreign banks, we can examine whether foreign banks owned by certain home countries
are a more stable source of credit.

16
Methodology
Our empirical strategy builds on Ongena, Peydro Alcalde and Van Horen (2012) who
study changes in credit extension by foreign and locally and internationally funded domestic
banks in Central and Eastern Europe during the global financial crisis. We start in 2005 and
end in 2009. We include 118 countries which have at least one foreign bank active over this
period. We exclude banks that became inactive or entered the market during the sample
period, leaving us with a sample of 3,615 banks, of which 1,198 foreign owned.
Our dependent variable is the growth rate of loans, measured as the log difference in
total lending (sum of net loans and loan loss reserves) of bank b in country j in year t. Since
we want to study whether foreign banks behaved differently from domestic banks, our main
variable of interest is a foreign bank dummy (Foreign), interacted with a crisis dummy
(Crisis). Similar to Ongena, Peydro Alcalde and Van Horen (2011), we distinguish the first
crisis year (2008) from the second crisis year (2009)
We add a number of controls. We control for time-invariant differences between banks
(like different business models, funding structure, strategies, etc.) using bank fixed effects.
We control for differences across countries by including country-year fixed effects. To the
extent that there are no systematic differences with respect to the type of firms in the
portfolios of foreign versus domestic banks or those differences are not correlated with crisis-
induced shocks to credit demand, these fixed effects should control for differential changes in
credit demand across countries. We control for a number of bank-specific characteristics that
we interact with our two crisis dummies to allow for differential impact of the crisis by type
of bank. These characteristics are Size (log assets), Solvency (equity to asset ratio), Liquidity
(liquid to total assets) and Deposits (deposits to liabilities). All bank characteristics are
measured as of end-2007 to limit any endogeneity problems.
Our baseline model is as follows:
ijtbtbtbitbt CrisisXCrisisForeignLL 1
Where btL is the yearly growth in loans by bank b in year t (t goes from 2005 to
2009), Foreign is a dummy that equals one if the bank was foreign owned in 2007 and equals
zero otherwise, and Crisis stands for two dummies that equal one for t equal to 2008 or 2009,
respectively, and equal zero otherwise. bX is a matrix of bank level control variables that
might affect the impact of the crisis on the bank’s decision to continue lending, b are bank
fixed effects and t are year fixed effects that are allowed to vary per country, i is the error
term and α, μ, β and γ are parameters to be estimated. Our parameter of interest is β.

17
To estimate our model we use three procedures. First we estimate the model using
fixed effects OLS excluding the lagged dependent variable. Second, we include the lagged
dependent variable to assure that our results are not biased due to the existence of serial
autocorrelation. Third, to allow for the fact that lagged loan growth might be correlated with
the panel effects (Nickell, 1981) we estimate the model using difference GMM with the lags
of the levels of the explanatory and dependent variables as instruments (Arellano and Bond
1991). In all models, standard errors are clustered at the bank level and observations below
the 1st percentile and above the 99th percentile of loan growth are excluded to reduce the
impact of possibly influential outliers.
Empirical results
Our regression results are presented in Table 6. We first present our three regression
specifications based on our full sample of countries (column 1-3). The results are very similar
and show that in 2009 foreign banks reduced lending more compared to their domestic
counterparts.17 Based on the results in column 1, foreign banks reduced their lending in 2009
by some 6 percentage points more compared (note the mean credit growth in 2009 was 5
percent). We do not find loan growth to differ between domestic and foreign banks in 2008,
probably as the financial crisis only became truly global in 2009 and did not yet affect many
foreign banks’ operations in 2008.
Our control variables show some interesting relations. Banks that generated a relative
large part of their funding from deposits (a relatively stable source of funding during the
crisis) continued to lend relatively more in 2009. This effect is large: a one standard deviation
increase in the deposit to liability ratio means loan growth in 2009 was some 4 percentage
points higher. We also find that larger banks generally reduced their credit more. And more
solvent and liquid banks maintained credit more, with effects larger in 2008 than in 2009.
In the next columns, we split our sample in countries where foreign banks hold less
than 50 percent of domestic assets (column 4-6) and countries in which they hold more than
50 percent (column 7-9). The results indicate a very distinct difference between the two
groups of countries. We find the loan growth of foreign banks in 2009 compared to that of
domestic banks to be 8 percent less in countries where they have a low market share (the
results in column 4). In countries where they dominate, however, foreign banks actually do
17 The AR (2) tests for the Arellano-Bond regressions consistently show that we cannot reject the null hypothesis of no second-order autocorrelation (since the estimator is in first differences, first-order autocorrelation does not imply inconsistent estimates). Furthermore, the Hansen J test results indicate that the instruments used are valid.

18
not show any difference in their loan growth in 2009 compared to domestic banks. This result
clearly shows how important it is to allow for heterogeneity across foreign banks when
examining their (crisis) behavior.
Following the base regression, we allow the impact of foreign ownership on lending
stability to differ with respect to a number of home and host country, and bank characteristics.
The results, presented in Table 7, are based on the fixed effects model without a lagged
dependent variable. The results, however, are similar using the other two procedures.
In the first two regressions we examine whether this difference in credit growth was
specific to particular host countries. First, we examine, using an OECD versus non-OECD
country dummy, whether the general economic development of the host country played a role.
We find (column 1) that in 2008 foreign banks in OECD countries already grew their lending
less compared to domestic banks (note that on average overall credit growth in 2008 was still
11 percent, double that in 2009). Since the crisis started in OECD-countries, this suggests that
in these countries foreign banks responded faster to the onset of the crisis than domestic banks
did. In 2009, however, as the crisis spread, foreign banks reduced lending, compared to their
domestic counterparts, similarly in OECD and non-OECD countries.18 Second, we test
whether the average distance of the foreign banks active in the country (as defined previously)
impacted the lending stability of foreign banks. Even though we found the average distance of
foreign banks to have affected the provision of credit, we do not find a differential impact
between foreign banks that are close or that are distant.
Next, we examine the importance of home country characteristics. First, we allow the
impact of foreign bank ownership on lending stability to differ between foreign banks owned
by a parent located in an OECD country or in a non-OECD country. Somewhat surprising, we
do not find significant differences between the two types of foreign banks (column 3). This
may be because not all OECD countries were as severely affected by the financial crisis. We
therefore interact foreign ownership with a dummy whether the home country experienced a
systemic banking crisis during the period 2007-2009 (as classified by Laeven and Valencia,
2010). Our results (column 4) indicate that foreign banks owned by a parent located in a
country that experienced a crisis reduced their lending more in both 2008 and 2009 compared
to domestic banks; however, the parameter is imprecisely estimated.
18 We also examined the impact of foreign ownership on lending behavior in the four income groups (OECD countries, other high-income countries, emerging markets and developing countries) separately. We found similar magnitude and significance for the foreign ownership times crisis interactions for all regions except other high-income countries, where we found no significant difference.

19
Finally, we examine whether having access to local deposits is more important for
foreign than for domestic banks. In principle, the relation can go two ways. On the one hand,
foreign banks that are large local deposit-takers might be less affected by shocks to their
parents’ balance sheets. On the other hand, as shown by Cetorelli and Goldberg (2011), parent
banks faced with funding shocks might be inclined to transfer funds from those subsidiaries
more active in deposit-taking. Our results (column 5) show that the first effect dominates:
having a strong deposit base is especially important for foreign banks in maintaining lending.
While one standard deviation increase in the deposit to liability ratio increases credit growth
of domestic banks by some 3 percentage points, it is 7 percentage points for foreign banks.
Summarizing our results, we find that on average foreign banks reduced lending more
compared to domestic banks during the global crisis. As such, foreign banks arguably
contributed to financial instability. Important heterogeneity exists, however, some of which
we document. When dominant in a banking system, foreign banks turned out to not react
differently to the crisis than domestic banks. And foreign banks that generated an important
part of their funding from local deposits were much less likely to reduce lending.
6. Conclusions The potential benefits and risks of foreign bank presence have been studied for some time.
Still, little is known about how foreign banks improve the efficiency of domestic financial
systems, increase financial sector development and access to financial services, and enhance
countries’ overall economic growth. Furthermore, the crisis has highlighted again that there
can be risks associated with cross-border banking and foreign bank presence. These
developments have led to an increased demand among policy makers and interest among
academics for more analyses of the benefits and risks of foreign bank presence to help guide
regulatory reforms.
Research and policy questions being asked include: for which types of countries and
under which circumstances do foreign banks add the most to domestic financial sector
development; given that the impact of foreign ownership is less advantageous for countries
with a certain level of development, which institutions are most important to improve when
having greater foreign bank presence; when does the presence of foreign banks help mitigate
the effects of various shocks on host countries’ banking systems and when do they not; do
differences between types of foreign banks – country of origin, size, degree of international
operations, distance between home and host countries etc. – and the relative presence of

20
foreign banks affect their roles in financial sector development and their role as risk absorber
or risks amplifier; and what balance sheets and performance indicators are most important to
monitor for assessing foreign banks’ role in domestic financial intermediation?
These and other issues will be well served by more in-depth research that in turn can
enhance policy recommendations on how to appropriately regulate foreign banks. The
database documented and analyzed in this paper can help with research on these topics. It
shows that in many countries foreign banks have become an important part of the local
banking system, but also that a lot of heterogeneity exists among foreign banks with respect to
a number of different dimensions. At the same time, it makes clear that the impact of foreign
banks on financial development and financial stability importantly depends on host country,
home country and bank characteristics. Furthermore, it shows that bilateral factors like
geographical distance might also influence the impact of foreign banks on domestic credit
creation and financial stability, perhaps because banking depends on the ability to
successfully gather ‘hard’ and ‘soft’ information. As such, the paper highlights that when
conducting research on foreign banks it is important to take this heterogeneity into account.

21
References
Acharya, Viral and Philipp Schnabl, 2010, “Do Global Banks Spread Global Imbalances? The
Case of Asset-Backed Commercial Paper during the Financial Crisis of 2007-2009,” IMF Economic Review, Vol. 58, Pp. 37-73.
Arellano, Manuel and Stephen R. Bond, 1991, “Some Tests of Specification for Panel Data: Monte Carlo Evidence and an Application to Employment Equations,” Review of Economic Studies, vol. 58, pp. 277-297.
Barba-Navaretti, Giorgio, Giacomom Calzolari, Micol Levi and Alberto Pozzolo, 2010, “Multinational Banking in Europe: Financial Stability and Regulatory Implications Lessons from the Financial Crisis,” CEPR Discussion Papers, No. 7823.
Beck, Thorsten and María Soledad Martinez Peria, 2007, “Foreign Bank Acquisitions and Outreach: Evidence from Mexico,” World Bank Policy Research Working Paper, No. 4467.
Berger, Allen N., George Clarke, Robert Cull, Leora Klapper and Gregory Udell, 2005, “Corporate Governance, and Bank Performance: A Joint Analysis of the Static, Selection and Dynamic Effects of Domestic, Foreign and State Ownership,” World Bank Policy Research Working Paper, No. 3632.
Berger, Allen N., Claudia M. Buch, Gayle DeLong, and Robert DeYoung, 2004, “Exporting financial institutions management via foreign direct investment mergers and acquisitions,” Journal of International Money and Finance 23, 333–366.
Berger, Allen N. and Robert DeYoung, 2001, “The Effects of Geographic Expansion on Bank Efficiency,” Journal of Financial Services Research, vol. 19, pp. 163-184.
Berger, Allen N. and Robert DeYoung, 2006, “Technological Progress and the Geographic Expansion of the Banking Industry,” Journal of Money, Credit and Banking, vol. 38, pp. 1483-1513.
Brealey, Richard and Evi Kaplanis, 1996, “The Determination of Foreign Banking Location,” Journal of International Money and Finance, Vol. 15, Pp. 577–597.
Cetorelli, Nicola and Linda Goldberg, 2011, “Global Banks and International Shock Transmission: Evidence from the Crisis,” IMF Economic Review, Vol. 59, Pp. 41-76.
Chava, Sudheer and Amiyatosh Purnanandam, 2011, “The Effect of Banking Crisis on Bank-Dependent Borrowers”, Journal of Financial Economics, Vol. 99, Pp. 116-135.
Chopra, Ajai, 2007, “Opening up to Foreign Banks: Harnessing the Benefits and Avoiding the Pitfalls,” Mimeo, International Monetary Fund.
Claessens, Stijn, 2006, “Competitive Implications of Cross-Border Banking”, in Cross-Border Banking: Regulatory Challenges, Gerard Caprio, Douglas D. Evanoff and George G. Kaufman (Eds.). World Scientific Publishing: New Jersey, Pp. 151-182.
Claessens, Stijn, Asli Demirgüç-Kunt, and Harry Huizinga, 2001, “How Does Foreign Entry Affect the Domestic Banking Market?” Journal of Banking and Finance, Vol. 25, Pp. 891–911.
Claessens, Stijn and Jong-Kun Lee, 2003, “Foreign Banks in Low-Income Countries: Recent Developments and Impacts, in Globalization and National Financial Systems,” in James Hanson, Patrick Honohan and Giovanni Majnoni (Eds.), World Bank: Washington, D.C., Pp. 109-141.
22
Claessens, Stijn and Neeltje van Horen, 2010, “Location Decisions of Foreign Banks and Competitive Advantage,” Mimeo, De Nederlandsche Bank and International Monetary Fund.
Claessens, Stijn and Neeltje van Horen, 2011, “Being a Foreigner among Domestic Banks: Asset or Liability?” forthcoming, Journal of Banking and Finance.
Claessens, Stijn, Neeltje van Horen, Tugba Gurcanlar, and Joaquin Mercado, 2008, “Foreign Bank Presence in Developing Countries 1995-2006: Data and Trends,” Mimeo, World Bank.
Clarke, George, Robert Cull, María Soledad Martínez Peria and Susana Sánchez, 2003, “Foreign Bank Entry: Experience, Implications for Developing Countries, and Agenda for Further Research,” World Bank Research Observer, Vol. 18, Pp. 25–40.
Clarke, George, Robert Cull, Maria Soledad Martinez Peria and Susana M. Sánchez, 2005, “Bank Lending to Small Businesses in Latin America: Does Bank Origin Matter?” Journal of Money, Credit, and Banking, Vol. 37, Pp. 83-118.
Cull, Robert and María Soledad Martinez Peria, 2011, “Foreign Bank Participation in Developing Countries: What do We Know about the Drivers and Consequences of this Phenomenon,” forthcoming in Gerard Caprio (Ed.): Encyclopedia of Financial Globalization, Elsevier: Amsterdam.
Dages, Gerard, Linda Goldberg and Daniel Kinney, 2000, “Foreign and Domestic Bank Participation in Emerging Markets: Lessons from Mexico and Argentina,” Economic Policy Review, Pp. 17-36. Federal Reserve Bank of New York, September.
De Haas, Ralph, Yevgenia Korniyenko, Elena Loukoianova and Alexander Pivovarsk, 2011, “Foreign Banks During the Crisis: Sinners or Saints?” Mimeo, European Bank for Reconstruction and Development.
De Haas, Ralph and Neeltje Van Horen, 2011, “Running for the Exit: International Banks and Crisis Transmission,” DNB Working Paper, No. 279.
De Haas, Ralph and Iman Van Lelyveld, 2006, “Foreign Banks and Credit Stability in Central and Eastern Europe: A Panel Data Analysis”, Journal of Banking and Finance, Vol. 30, Pp. 1927 – 1952.
De Haas, Ralph and Iman Van Lelyveld, 2010, “Internal Capital Markets and Lending by Multinational Bank Subsidiaries,” Journal of Financial Intermediation, Vol. 19, Pp. 689 – 721.
De Haas, Ralph and Iman Van Lelyveld, 2011, “Multinational Banks and the Global Financial Crisis: Weathering the Perfect Storm,” EBRD Working Paper, No. 135.
Demirguc-Kunt, Asli, Luc Laeven, and Ross Levine, 2004, “Regulations, Market Structure, Institutions, and the Cost of Financial Intermediation,” Journal of Money, Credit, and Banking, Vol. 36(3), Pp. 593-622.
Detragiache, Enrica, Poonam Gupta, and Thierry Tressel, 2008, “Foreign Banks in Poor Countries: Theory and Evidence,” Journal of Finance, Vol. 63, Pp. 2123-2160.
Djankov, Simeon, McLiesh, Caralee and Shleifer, Andrei, 2007, “Private credit in 129 Countries,” Journal of Financial Economics, Vol. 84(2), Pp. 299-329.
Dobson, Wendy, 2005, “Trade in Financial Services,” Mimeo, World Bank.

23
Galindo, Arturo, Alejandro Micco, and César Serra, 2003, “Better the Devil That You Know: Evidence on Entry Costs Faced by Foreign Banks,” Inter-American Development Bank Working Paper, No. 477.
Garcia-Herrero, Alicia and Maria Soledad Martínez Pería, 2005, “The Mix of International Banks’ Foreign Claims: Determinants and Implications,” World Bank Policy Research Working Paper, No. 3755.
Grosse, Robert and Lawrence Goldberg, 1991, “Foreign Bank Activity in the United States: An Analysis by Country of Origin,” Journal of Banking and Finance, Vol. 15, Pp. 1092–1112.
Haber, Stephen and Aldo Musacchio, 2005, “Foreign Banks and the Mexican Economy, 1997-2004”, Mimeo, Stanford University.
Hauswald, Robert and Robert Marquez, 2006, “Competition and Strategic Information Acquisition in Credit Markets,” Review of Financial Studies, vol. 19, pp. 967-1000.
Laeven, Luc and Fabian Valencia, 2010, “Resolution of Banking Crises: The Good, the Bad, and the Ugly”, IMF Working Paper, No. 10/146.
Levine, Ross, 1996, “Foreign Banks, Financial Development, and Economic Growth,” in Claude E. Barfield (Ed.): International Financial Markets, AEI Institute Press: Washington DC, Pp. 224-254.
Martínez Pería, Maria Soledad and Ashoka Mody, 2004, “How Foreign Participation and Market Concentration Impact Bank Spreads: Evidence from Latin America,” Journal of Money, Credit and Banking, Vol. 36, Pp. 511 – 537.
Mian, Atif, 2003, “Foreign, Private Domestic, and Government Banks: New Evidence from Emerging Markets,” Mimeo, University of Chicago.
Mian, Atif, 2006, “Distance Constraints: The Limits of Foreign Lending in Poor Countries,” Journal of Finance, vol. 61, pp. 1465–1505.
Micco, Alejandro, Ugo Panizza and Mónica Yañez, 2007, “Bank Ownership and Performance. Does Politics Matter?” Journal of Banking and Finance, Vol. 31, Pp. 219-241.
Mishkin, Frederick, 2006, The Next Great Globalization: How Disadvantaged Nations Can Harness Their Financial Systems to Get Rich, Princeton University Press: Princeton, NJ.
Nickell, Stephen, 1981, “Biases in Dynamic Models with Fixed Effects,” Econometrica, vol. 49, pp. 1417-26.
Ongena, Steven, Jose Luis Peydro Alcalde, and Neeltje van Horen, 2012, “Shocks Abroad, Pain at Home? Bank-Firm Level Evidence on Financial Contagion during the 2007-2009 Crisis,” Mimeo, Tilburg University, Universitat Pompeu Fabra, De Nederlandsche Bank.
Peek, Joe, Eric Rosengren and Faith Kasirye, 1999, “The Poor Performance of Foreign Bank Subsidiaries: Were the Problems Acquired or Created?” Journal of Banking and Finance. Vol. 23, Pp. 579-604.
Peek, Joe, Eric Rosengren and Michael Klein, 2000, “Troubled Banks, Impaired Foreign Direct Investment: The Role of Relative Access to Credit,” Federal Reserve Bank of Boston Working Paper, No. 00-4.

24
Popov, Alexander and George Udell, 2010, “Cross-Border Banking and the International Transmission of Financial Distress during the Crisis of 2007-2008,” European Central Bank Working Paper, No. 1203.
Van Horen, Neeltje, 2006, “Foreign Banking in Developing Countries: Origin Matters,” Emerging Market Review, Vol. 8, Pp. 81-105.

Number Share Number Share Number Share Number ShareAll countries
Domestic 3,120 0.80 2,993 0.74 2,805 0.70 2,576 0.66Foreign 774 0.20 1,058 0.26 1,175 0.30 1,334 0.34
Total 3,894 1 4,051 1 3,980 1 3,910 1Income groupsOECD
Domestic 1,044 0.81 1,070 0.79 1,087 0.78 1,054 0.76Foreign 237 0.19 280 0.21 315 0.22 332 0.24
Total 1,281 1 1,350 1 1,402 1 1,386 1Other high-income
Domestic 73 0.70 67 0.66 61 0.59 63 0.59Foreign 32 0.30 34 0.34 42 0.41 44 0.41
Total 105 1 101 1 103 1 107 1Emerging markets
Domestic 1,456 0.82 1,293 0.73 1,143 0.70 1,001 0.64Foreign 330 0.18 473 0.27 488 0.30 569 0.36
Total 1,786 1 1,766 1 1,631 1 1,570 1Developing countries
Domestic 547 0.76 563 0.68 514 0.61 458 0.54Foreign 175 0.24 271 0.32 330 0.39 389 0.46
Total 722 1 834 1 844 1 847 1RegionEast Asia and Pacific
Domestic 254 0.82 272 0.81 289 0.81 282 0.75Foreign 57 0.18 64 0.19 69 0.19 95 0.25
Total 311 1 336 1 358 1 377 1Eastern Europe and Central Asia
Table 1 Number of Banks by Host Country, Aggregates by Income Level and Region
1995 2000 2005 2009
Eastern Europe and Central AsiaDomestic 664 0.85 602 0.72 500 0.61 418 0.53
Foreign 114 0.15 234 0.28 317 0.39 371 0.47Total 778 1 836 1 817 1 789 1
Latin America and CaribbeanDomestic 596 0.75 479 0.65 395 0.65 367 0.61
Foreign 198 0.25 256 0.35 217 0.35 232 0.39Total 794 1 735 1 612 1 599 1
Middle East and North AfricaDomestic 143 0.82 131 0.77 116 0.71 101 0.64
Foreign 32 0.18 40 0.23 48 0.29 57 0.36Total 175 1 171 1 164 1 158 1
South AsiaDomestic 133 0.93 143 0.91 148 0.91 139 0.86
Foreign 10 0.07 15 0.09 15 0.09 22 0.14Total 143 1 158 1 163 1 161 1
Sub Saharan AfricaDomestic 213 0.69 229 0.63 209 0.58 152 0.46
Foreign 94 0.31 135 0.37 152 0.42 181 0.54Total 307 1 364 1 361 1 333 1
Note: OECD includes all core OECD countries. Other high-income countries includes all countries classified as high-income by the World Bank in2000 but not belonging to the OECD. Emerging markets includes all countries that are included in the Standard and Poor’s Emerging Market andFrontier Markets indexes and that were not high-income countries in 2000. Developing countries includes all other countries. The regions represent theregional classification as used by the World Bank.

Nr. Share Nr. Share Nr. Share Nr. Share Nr. ShareHome regionAMERICA 118 0.63 19 0.10 40 0.21 10 0.05 187 1ASIA 15 0.17 50 0.56 15 0.17 9 0.10 89 1EUR 92 0.22 38 0.09 235 0.55 60 0.14 425 1MEA 2 0.03 4 0.06 15 0.22 46 0.69 67 1
Nr. Share Nr. Share Nr. Share Nr. Share Nr. ShareHome regionAMERICA 127 0.57 25 0.11 56 0.25 13 0.06 221 1ASIA 22 0.17 86 0.65 18 0.14 7 0.05 133 1EUR 121 0.15 60 0.08 522 0.66 84 0.11 787 1MEA 4 0.02 12 0.07 33 0.19 121 0.71 170 1
Number and share of foreign banks from home country present in host
country
2009Host region
AMERICA ASIA EUR MEA Total
Table 2Number and Share of Foreign Banks from Home Regions to Host Regions, 1995 and 2009
Number and share of foreign banks from home country present in host
country
1995Host region
AMERICA ASIA EUR MEA Total
Note: Countries are grouped in four geographical regions irrespective of the income level of the countries. "America" includes Canada, United Statesand all countries in Latin American and the Caribbean, "Asia" includes all countries in Central, East and South Asia and the Pacific countriesincluding Japan, Australia and New Zealand. "Europe" includes all Western and Eastern European countries "MEA" includes all countries in theMiddle East and North and Sub-Saharan Africa.
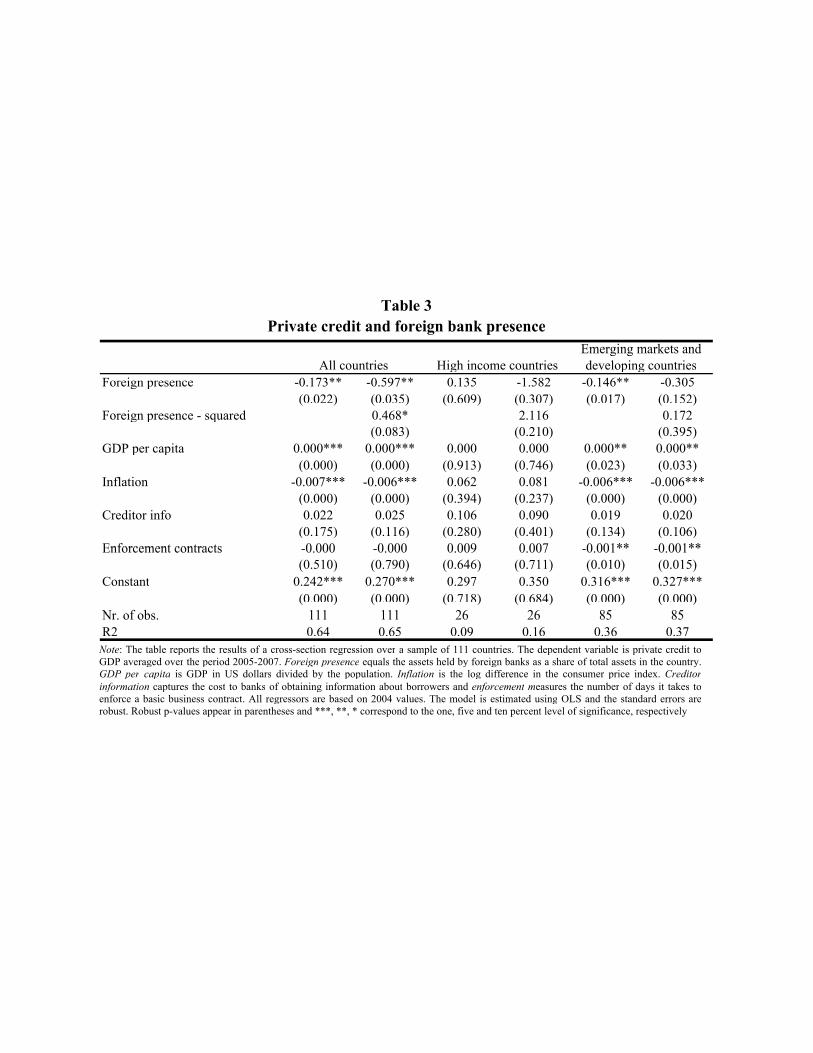
Table 3Table 3Private credit and foreign bank presencePrivate credit and foreign bank presence
Emerging markets andEmerging markets and High income countriesAll countries developing countries
Foreign presence 0 173** 0 597** 0 135 1 582 0 146** 0 305g p g
Foreign presence -0.173** -0.597** 0.135 -1.582 -0.146** -0.305(0.022) (0.035) (0.609) (0.307) (0.017) (0.152)( ) ( ) ( ) ( ) ( ) ( )
Foreign presence squared 0 468* 2 116 0 172Foreign presence - squared 0.468* 2.116 0.172(0.083) (0.210) (0.395)( ) ( ) ( )
GDP per capita 0 000*** 0 000*** 0 000 0 000 0 000** 0 000**GDP per capita 0.000*** 0.000*** 0.000 0.000 0.000** 0.000**(0.000) (0.000) (0.913) (0.746) (0.023) (0.033)( ) ( ) ( ) ( ) ( ) ( )
Inflation 0 007*** 0 006*** 0 062 0 081 0 006*** 0 006***Inflation -0.007*** -0.006*** 0.062 0.081 -0.006*** -0.006***(0.000) (0.000) (0.394) (0.237) (0.000) (0.000)( ) ( ) ( ) ( ) ( ) ( )
Creditor info 0 022 0 025 0 106 0 090 0 019 0 020Creditor info 0.022 0.025 0.106 0.090 0.019 0.020(0.175) (0.116) (0.280) (0.401) (0.134) (0.106)( ) ( ) ( ) ( ) ( ) ( )
Enforcement contracts 0 000 0 000 0 009 0 007 0 001** 0 001**Enforcement contracts -0.000 -0.000 0.009 0.007 -0.001** -0.001**(0.510) (0.790) (0.646) (0.711) (0.010) (0.015)( ) ( ) ( ) ( ) ( ) ( )
Constant 0 242*** 0 270*** 0 297 0 350 0 316*** 0 327***Constant 0.242*** 0.270*** 0.297 0.350 0.316*** 0.327***(0.000) (0.000) (0.718) (0.684) (0.000) (0.000)( ) ( ) ( ) ( ) ( ) ( )
Nr of obs 111 111 26 26 85 85Nr. of obs. 111 111 26 26 85 85R2 0.64 0.65 0.09 0.16 0.36 0.37. . . 9 . . . 7
N t Th t bl t th lt f ti i l f 111 t i Th d d t i bl i i t dit tNote: The table reports the results of a cross-section regression over a sample of 111 countries. The dependent variable is private credit toG d h i d 200 200 l h h ld b f i b k h f l i hGDP averaged over the period 2005-2007. Foreign presence equals the assets held by foreign banks as a share of total assets in the country.GDP per capita is GDP in US dollars divided by the population. Inflation is the log difference in the consumer price index. Creditorinformation captures the cost to banks of obtaining information about borrowers and enforcement measures the number of days it takes tof p g f yenforce a basic business contract. All regressors are based on 2004 values. The model is estimated using OLS and the standard errors areenforce a basic business contract. All regressors are based on 2004 values. The model is estimated using OLS and the standard errors arerobust Robust p-values appear in parentheses and *** ** * correspond to the one five and ten percent level of significance respectivelyrobust. Robust p values appear in parentheses and , , correspond to the one, five and ten percent level of significance, respectively

FP<50% FP>50%Foreign presence -0.047 -0.090 -0.007 -0.143 0.008
(0.636) (0.219) (0.943) (0.672) (0.964)Foreign presence * Developing -0.162* -0.144 0.019 -0.150
(0.095) (0.126) (0.942) (0.150)Foreign presence * Distant banks -0.124* -0.110* -0.249* -0.101
(0.053) (0.069) (0.052) (0.137)GDP per capita 0.000 0.000* 0.000 0.000 0.000
(0.264) (0.058) (0.347) (0.592) (0.224)Inflation -0.006*** -0.006*** -0.006*** -0.007*** -0.004***
(0.000) (0.000) (0.001) (0.004) (0.008)Creditor info 0.017 0.020* 0.018 0.038** -0.003
(0.155) (0.099) (0.115) (0.027) (0.837)Enforcement contracts -0.001** -0.001** -0.001** -0.001* -0.000
(0.014) (0.021) (0.026) (0.099) (0.786)Constant 0 348*** 0 322*** 0 350*** 0 340*** 0 318**
All countries
Table 4Private credit, foreign bank presence and foreign bank heterogeneity; emerging
markets and developing countries
Constant 0.348 0.322 0.350 0.340 0.318(0.000) (0.000) (0.000) (0.000) (0.030)
Nr. of obs. 85 85 85 51 34R2 0.39 0.38 0.40 0.33 0.64
Note: The table reports the results of a cross-section regression over a sample of 85 emerging markets and developing countries. See thenote under Table X for the definitions of the variables. Developing is a dummy which equals one if the country is a developing country(see text for details). Distant banks is a dummy which is one if the average kilometer distance between home and host country of allforeign banks present in the host country is above the median distance. FB<50% includes the group of countries where foreign banks holdless than 50 percent of the assets. FB>50% includes those countries where foreign banks hold more than 50 percen of the assets.Themodel is estimated using OLS and the standard errors are robust. Robust p-values appear in parentheses and ***, **, * correspond to theone, five and ten percent level of significance, respectively

Foreign presence 0.145* 0.340*** 0.070 0.315*** 0.140 0.358***(0.074) (0.000) (0.492) (0.002) (0.141) (0.001)
Foreign presence * Developing -0.030 -0.092(0.816) (0.488)
Foreign presence * Distant banks -0.347*** -0.365*** -0.362***(0.002) (0.000) (0.003)
Initial private credit -0.100 -0.088 -0.020 0.008 -0.395*** -0.475***(0.147) (0.162) (0.759) (0.875) (0.002) (0.001)
Inflation 0.002 0.006 0.089*** 0.090*** 0.000 0.003(0.767) (0.466) (0.001) (0.000) (0.955) (0.673)
Creditor info -0.019 -0.022 -0.039* -0.036* -0.014 -0.018(0.241) (0.174) (0.081) (0.075) (0.417) (0.262)
Enforcement contracts 0.000 0.000 0.009** 0.009*** -0.000 0.000(0 93 ) (0 88) (0 01 ) (0 000) (0 8 ) (0 9 )
All countriesEmerging markets and developing countriesHigh income countries
Table 5Private credit growth and foreign bank presence
(0.937) (0.788) (0.017) (0.000) (0.855) (0.955)Constant 0.275*** 0.252** -0.003 -0.056 0.357*** 0.371***
(0.008) (0.016) (0.987) (0.698) (0.002) (0.002)Nr. of obs. 106 106 24 24 82 82R2 0.13 0.22 0.56 0.75 0.14 0.25
Note: The table reports the results of a cross-section regression over a sample of 107 countries. The dependent variable is the log change of the ratioof private credit to GDP between 2004 and 2007. Intitial private credit equals the ratio of private credit to GDP in 2004. For definition of the othervariables see previous tables. The model is estimated using OLS and the standard errors are robust. Robust p-values appear in parentheses and ***,**, * correspond to the one, five and ten percent level of significance, respectively

Foreign * 2008 0.021 0.020 -0.024 0.015 0.017 -0.014 0.037 0.029 0.067*(0.224) (0.255) (0.212) (0.455) (0.417) (0.553) (0.227) (0.375) (0.057)
Foreign * 2009 -0.061*** -0.061*** -0.068*** -0.080*** -0.079*** -0.060** 0.007 0.006 0.016(0.000) (0.001) (0.004) (0.000) (0.000) (0.049) (0.847) (0.864) (0.686)
Size * 2008 -0.008** -0.008* 0.009** -0.010** -0.009** 0.010** 0.002 -0.001 -0.009(0.039) (0.050) (0.013) (0.026) (0.043) (0.011) (0.868) (0.926) (0.329)
Size * 2009 -0.007* -0.008* 0.015*** -0.007* -0.007* 0.016*** -0.008 -0.008 0.002(0.075) (0.081) (0.001) (0.080) (0.096) (0.001) (0.550) (0.556) (0.860)
Solvency * 2008 0.554*** 0.581*** 0.314** 0.498*** 0.525*** 0.322** 0.855*** 0.883*** 0.251(0.000) (0.000) (0.026) (0.001) (0.001) (0.034) (0.003) (0.003) (0.430)
Solvency * 2009 0.340*** 0.389*** -0.053 0.334*** 0.383*** 0.064 0.393 0.500* -0.533*(0.002) (0.002) (0.808) (0.006) (0.005) (0.799) (0.156) (0.087) (0.093)
Liquidity * 2008 0.195*** 0.169*** 0.094 0.169** 0.154** 0.145* 0.320*** 0.251** 0.032(0.001) (0.005) (0.139) (0.010) (0.026) (0.062) (0.005) (0.036) (0.796)
Liquidity * 2009 0.110** 0.104* -0.187*** 0.068 0.071 -0.187** 0.276** 0.248* -0.040(0.049) (0.087) (0.007) (0.269) (0.290) (0.022) (0.035) (0.085) (0.774)
Deposits * 2008 -0.020 -0.024 0.190*** -0.017 -0.018 0.206*** -0.057 -0.067 0.145(0.588) (0.533) (0.000) (0.668) (0.683) (0.000) (0.503) (0.457) (0.225)
Deposits * 2009 0.157*** 0.153*** 0.272*** 0.159*** 0.158*** 0.305*** 0.125 0.132 0.178(0.000) (0.000) (0.000) (0.000) (0.000) (0.000) (0.210) (0.205) (0.250)
gloans (1 lag) -0.069*** 0.118*** -0.052** 0.104*** -0.135*** 0.148***(0.000) (0.000) (0.016) (0.005) (0.000) (0.008)
Table 6Credit growth during the global financial crisis; foreign versus domestic banks
All countries FP<50% FP>50%
(0.000) (0.000) (0.016) (0.005) (0.000) (0.008)Nr. of obs. 12,413 11,431 11,431 10,078 9,268 9,268 2,335 2,163 2,163R2 0.59 0.60 0.59 0.60 0.58 0.61AR(1) test 0.000 0.000 0.000AR(2) test 0.232 0.462 0.398Hansen J test 0.381 0.154 0.345Estimation method FE FE AB FE FE AB FE FE AB
Note: The table reports the results of a panel regression over the period 2005-2009. The dependent variable is the log difference in total lending of bankb in country j at time t. Foreign is a dummy variable which is one if the bank is foreign owned. FB<50% indicates the group of countries where foreignbanks hold less than 50 percent of the assets. Size is the log of total assets, Solvency is defined as equity to total assets, Liquidity equals liquid to totalassets and Deposits is the ratio of deposits to liabilities. All regressors are based on 2007 values. FB<50% includes the group of countries whereforeign banks hold less than 50 percent of the assets. FB>50% includes those countries where foreign banks hold more than 50 percen of the assets. Allregressions include bank and country-year fixed effects. Estimation methods are Fixed effects (FE) and Arellano-Bond (AB). AR(1) and AR(2) testsshow the p-value of the Arellano-Bond test that average autocovariance of the residuals of order 1 and 2 respectively is 0. Hansen J test shows the p-value of the Hansen test for overidentifying restrictions. Robust p-values appear in parentheses and ***, **, * correspond to the one, five and tenpercent level of significance, respectively

(1) (2) (3) (4) (5) (6)Foreign*2008 0.021 0.039* 0.006 0.018 0.050* 0.007
(0.219) (0.053) (0.794) (0.498) (0.052) (0.882)Foreign*2009 -0.061*** -0.061*** -0.061*** -0.053** -0.043** -0.162***
(0.000) (0.002) (0.006) (0.022) (0.035) (0.000)Interaction with host country characteristicsForeign * 2008 * OECD country -0.066*
(0.081)Foreign * 2009 * OECD country -0.002
(0.959)Foreign * 2008 * Distant banks 0.035
(0.319)Foreign * 2009 * Distant banks 0.001
(0.988)Interaction with home country characteristicsForeign * 2008 * OECD home 0.004
(0.899)Foreign * 2009 * OECD home -0.012
(0.634)Foreign * OECD home 0.004
(0.913)Foreign * 2008 * Crisis home -0.047
(0.111)Foreign * 2009 * Crisis home -0.029
(0.234)Interaction with bank characteristicsForeign bank * 2008 * Deposits 0.024
(0.735)Foreign bank * 2009 * Deposits 0.185***
(0.007)Deposits * 2008 -0.003 -0.008 -0.020 -0.003 -0.006 -0.010
(0.939) (0.819) (0.571) (0.945) (0.865) (0.790)Deposits * 2009 0.156*** 0.155*** 0.157*** 0.155*** 0.154*** 0.095**
(0.000) (0.000) (0.000) (0.000) (0.000) (0.010)Number of observations 12,413 12,413 12,413 12,413 12,413 12,413
R2 0.59 0.59 0.59 0.59 0.59 0.59
Credit growth during the global financial crisis; foreign bank heterogeneityTable 7
Note: The table reports the results of a panel regression over the period 2005-2009. The dependent variable is the log difference in total lending ofbank i in country j at time t. Foreign is a dummy variable which is one if the bank is foreign owned. OECD country is a dummy which is one if thehost country is an OECD country. Distant banks is a dummy which is one if the average kilometer distance between home and host country of allforeign banks present in the host country is above the median distance. OECD home is a dummy which is one if the home country of the foreignbank is an OECD country. Crisis home is a dummy which is one if the home country of the foreign bank experienced a banking crisis in 2007 or2008. Deposits is the ratio of deposits to liabilities. The other bank-level control variables (Size, Solvency and Liquidity) are also included in theregression but are omitted from the tables for reasons of brevity. All regressors are based on 2007 values. All regressions include bank and country-year fixed effects. The model is estimated using OLS and the standard errors are clustered by bank. Robust p-values appear in parentheses and ***,**, * correspond to the one, five and ten per cent level of significance, respectively

Figure 1 Number and Share of Foreign Banks, 1995 – 2009
Figure 2 Number of Entries and Exits of Foreign Banks
0.15
0.20
0.25
0.30
0.35
0.40
0
200
400
600
800
1000
1200
1400
1600
1995 1996 1997 1998 1999 2000 2001 2002 2003 2004 2005 2006 2007 2008 2009
Number of foreign banks Share of foreign banks
Numbers Share
-60
-40
-20
0
20
40
60
80
100
120
140
1995 1996 1997 1998 1999 2000 2001 2002 2003 2004 2005 2006 2007 2008 2009
Numbers
Entry Exit
NA

2
Figure 3 Foreign bank presence by top host country
0 10 20 30 40 50 60 70 80 90 100
121-129
111-120
101-110
91-100
81-90
71-80
61-70
51-60
41-50
31-40
21-30
11-20
Top 10 countries
Share in numbers (%)
0 10 20 30 40 50 60 70 80 90 100
111-118
101-110
91-100
81-90
71-80
61-70
51-60
41-50
31-40
21-30
11-20
Top 10 countries
Share in assets (%)

3
Figure 4 Foreign banks presence by host country
020406080100In percent
020
,000
40,0
0060
,000
80,0
0010
0000
GD
P p
er c
apita
(cur
rent
US
$)
Fig
a. F
orei
gn b
anks
sha
re in
num
bers
020406080100In percent
020
,000
40,0
0060
,000
80,0
0010
0000
GD
P p
er c
apita
(cur
rent
US
$)
Fig
b. F
orei
gn b
anks
sha
re in
ass
ets
05.0e+071.0e+081.5e+08Total Assets, in th. US$ (mean)
020
4060
80N
umbe
r of b
anks
Fig
c. R
elat
ive
impo
rtan
ce o
f for
eign
ban
ks, i
n le
vels
020406080100Share of foreign banks in assets (%)
020
4060
8010
0S
hare
of f
orei
gn b
anks
in n
umbe
rs (%
)
Fig
d. R
elat
ive
impo
rtanc
e of
fore
ign
bank
s, in
sha
re

4
Figure 5 Importance of foreign banks exports by top countries
0 .5 1 1.5 2 2.5 3 3.5
91-94
81-90
71-80
61-70
51-60
41-50
31-40
21-30
11-20
Top 10 countries
Share in numbers (%)
0 2 4 6 8 10 12 14
81-88
71-80
61-70
51-60
41-50
31-40
21-30
11-20
Top 10 countries
Share in assets (%)

5
Figure 6 Importance of exports of foreign banks by source country
01234In percent
050
,000
1000
0015
0000
GD
P p
er c
apita
(cu
rren
t US
$)
Fig
a.
For
eign
ban
ks s
hare
in n
umbe
rs
051015In percent
050
,000
1000
0015
0000
GD
P p
er c
apita
(cu
rren
t US
$)
Fig
b.
For
eign
ban
ks s
hare
in a
sset
s01.0e+072.0e+073.0e+074.0e+075.0e+07
Total Assets, in th. US$ (mean)
050
100
150
Num
ber
of b
anks
Fig
c.
Rel
ativ
e im
port
ance
of
fore
ign
bank
s, in
leve
ls
051015Share of foreign banks in assets (%)
05
1015
Sha
re o
f fo
reig
n ba
nks
in n
umbe
rs (
%)
Fig
d.
Rel
ativ
e im
port
ance
of
fore
ign
bank
s, in
sha
re

6
Figure 7a Share by assets, from source country to host country
1 0 0
1 0 0 0 0 0 0 0 0 0 0
1 0 0 0 0 0 0 0 0 0 0
0 0 0 1 0 0 0 0 0 0 0 0 0 0 0 0 0 0 0 0 0 0 0 0 0 0 0 0 0 0 0 0 0 0 0 0 0 0 0 0 0 0 0 0
1 0 0 0 0 0 0 0 0 0 0 0 0
0 1 0 0 0 0 0 0 0 0 0 0 0 0 0 0
0 0 0 0
1 0 0 0 0 0 0
1 0
0 0 0 0 1 0 0 0 0 0 0 0 0 0 0 0 0 0 0 0 0 0 0 0 0 0 0 0 0 0
0 0 0 1 0 0 0 0 0 0 0 0 0 0 0 0 0 0 0 0 0 0 0 0
1 0 0 0 0 0 0
1 0
0 1 0
0 0 0 0 1 0 0 0 0 0 0 0 0 0 0 0 0 0 0 0 0 0 0
0 0 1 0
1 0
0 0 0 0 0 0 0 0 0 1 0 0 0 0 0 0 0 0 0 0 0 0 0 0 0 0 0 0 0 0
0 0 1 0
0 0 1 0 0 0 0 0 0 0 0
1 0
0 0 0 0 0 1 0 0 0 0 0 0 0 0 0 0 0
0 0 0 0 0 1 0 0 0 0 0
0 0 0 0 0 0 1 0 0 0 0 0 0 0 0 0 0 0
0 0 0 0 0 0 0 0 0 0 0 0 0 0 0 0 0 0 0 0 0 0 0 0 0 0 0 0 0 0 0 0 0 0 0 0 0 0 0 0 0 0 0
1
0 0 0 0 0 0 0 0 0
1 0 0 0
1
0 1 0 0 0 0
0 0 1 0 0
0 1 0
0 0 0 1 0
0 0 0 0 0 0 0 0 0 0
1
1
0 1
0
1
1
0 0 0 0
1
0 1
1
1 0 0 0
1
1
1
1
0 0 0 0 0 0 0 0 0 1
1 0 0 0
1
0 0 0 0 0
1
0 0 1
1
1
0 0 1
1
1
0 0 0 0 0 0 0 0 0 0 0 0 0
1
1
1
0 0 0 0 0
1
1
1
1
0 0 0
0
0 1
0 0 0 0 0 0
0 0 1 0 0
1
1
0 0 0 0 0
0 0 0 0 0
0 0 1
1
1 0
0 0 0 0 0 0 0 0 1 0
1
0 1
1
1
1
1
1
1
0 0
1
0 0 1 0 0 0
0 1
1
0 1 0
0 1
1 0
1
0 0 0 0 0 0 0 0 0 0 0 0
1
0 0 0 0 0 0 0 0 0 1 0
0 0 1
1
1 0 0 0 0
1
0 0 0 0 1 0 0 0
0
1 0
1 0
0
1
1 0
1 0
1
1
1
0 0 1
0 0 0
0 0 0
1
0 1
0
0 0 0 1
0 1
SO
UR
CE
CO
UN
TR
IES
HOST COUNTRIES
Notes : 1: Japan, Australia, New Zealand ; 2: North America ; 3: South Asia
MID
DL
E E
AST
&
NO
RT
H A
FR
ICA
EAST ASIA
& PACIF
IC
3EASTERN
EUROPE & CENTRAL ASIA
LATIN AMERICA & CARIBBEAN
WE
STE
RN
EU
RO
PE
21
1 2WESTERN EUROPE
MIDDLE EAST & NORTH AFRICA
SUB-SAHARAN AFRICA
3E
AST
ASI
A
& P
AC
IFIC
SU
B-S
AH
AR
AN
AF
RIC
AE
AST
ERN
EU
RO
PE
&
CEN
TR
AL
ASIA
LA
TIN
AM
ER
ICA
&
CA
RIB
BE
AN
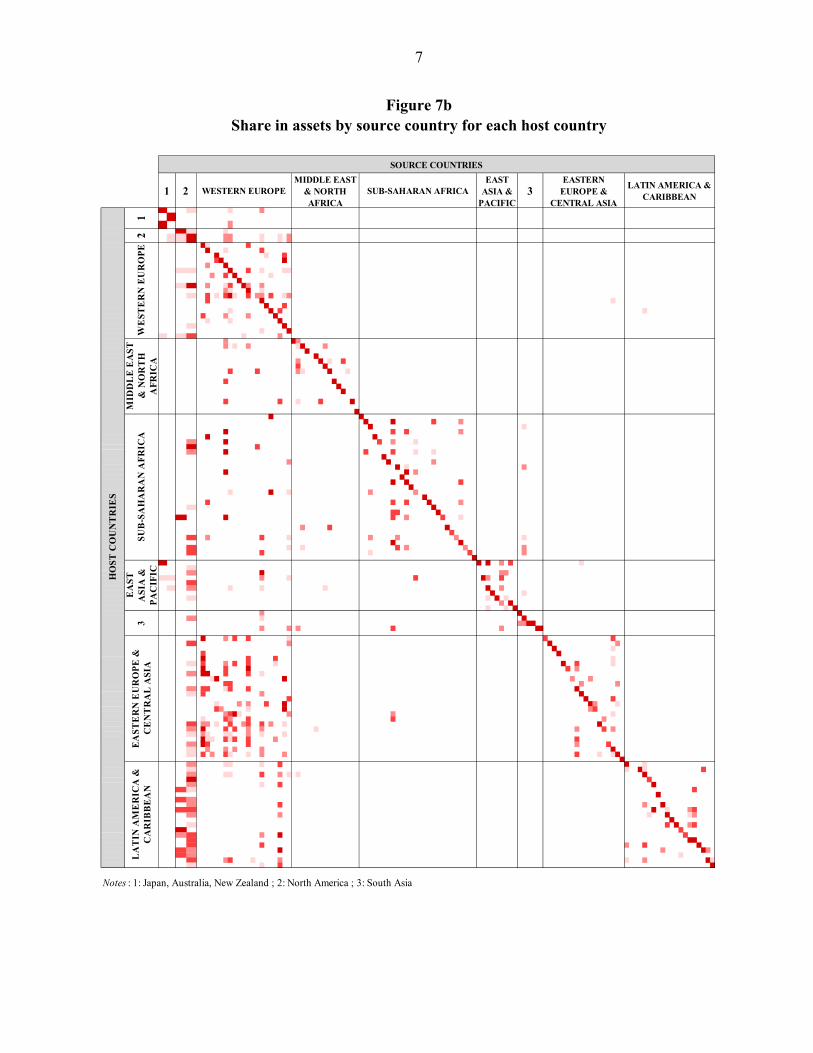
7
Figure 7b Share in assets by source country for each host country
1 0
1 0
1
0 1 0
0 0 1
0
0
0
0
0 0 0
0 0
0 0
0 0
0
0 00 0 0 0
0
0
0
0
0
0
0
0
0
0 0
0
0 0
0
0 0 0
0
0 0
1
0
0
0
0
0
0
0
0
0
0
0
0
0
0
0
0 0 0
1
0
0 0
0 0
0
0 0
0
0
1
0 0 0
0
0
0 0
0 0
0
0
HO
ST
CO
UN
TR
IES
SOURCE COUNTRIES
Notes : 1: Japan, Australia, New Zealand ; 2: North America ; 3: South Asia
LA
TIN
AM
ER
ICA
&
CA
RIB
BE
AN
EA
ST
ERN
EU
RO
PE
&
CEN
TR
AL
AS
IA
MID
DL
E E
AS
T
& N
OR
TH
A
FR
ICA
WE
ST
ERN
EU
RO
PE
21
3E
AS
T
AS
IA &
P
AC
IFIC
SU
B-S
AH
AR
AN
AF
RIC
A
MIDDLE EAST & NORTH AFRICA
1 2 WESTERN EUROPE SUB-SAHARAN AFRICAEAST
ASIA & PACIFIC
3EASTERN
EUROPE & CENTRAL ASIA
LATIN AMERICA & CARIBBEAN

8
Figure 8 Balance sheets and performance measures, by host country level of development
0.511.522.5Balance sheet indicator (mean)
020
,000
40,0
0060
,000
80,0
0010
0000
GD
P p
er c
apita
(cu
rren
t US
$)
fore
ign
dom
estic
Fig
a.
To
tal l
oan
s-to
-dep
osits
ra
tio
0.2.4.6.8Balance sheet indicator (mean)
020
,000
40,0
0060
,000
80,0
0010
0000
GD
P p
er c
apita
(cu
rren
t US
$)
fore
ign
dom
estic
Fig
b.
Liqu
idity
ra
tio
0.2.4.6.81Balance sheet indicator (mean)
020
,000
40,0
0060
,000
80,0
0010
0000
GD
P p
er c
apita
(cu
rren
t US
$)
fore
ign
dom
estic
Fig
c.
Ca
pita
l ra
tio
-.020.02.04.06.08Balance sheet indicator (mean)
020
,000
40,0
0060
,000
80,0
0010
0000
GD
P p
er c
apita
(cu
rren
t US
$)
fore
ign
dom
estic
Fig
d.
RO
A

Country 1995 1996 1997 1998 1999 2000 2001 2002 2003 2004 2005 2006 2007 2008 2009
EAP 20 20 19 19 19 20 20 20 19 19 19 19 24 25 25Cambodia 14 14 14 29 29 43 43 38 33 33 40 38 38 38 38China 13 14 11 10 10 9 9 8 8 7 7 6 15 18 19Indonesia 26 27 28 29 31 33 31 34 32 33 35 36 50 50 52Malaysia 27 25 25 25 25 26 32 29 29 30 30 32 33 33 33Mongolia 0 0 0 0 0 0 14 25 25 25 25 25 25 25 25Philippines 12 13 13 14 16 17 16 14 12 14 14 14 15 15 13Thailand 11 11 6 6 12 12 12 17 17 17 15 15 14 19 19Vietnam 11 10 10 10 10 10 10 9 12 12 12 9 9 9 9
ECA 9 11 14 17 19 22 23 26 27 29 33 37 40 42 42Albania 25 40 50 63 63 75 75 75 70 73 82 77 85 83 83Armenia 17 17 17 23 36 36 38 42 42 46 54 69 69 73 80Azerbaijan 5 10 10 14 14 14 14 10 10 10 10 10 15 16 16Belarus 12 16 15 15 15 24 30 32 36 36 45 45 53 55 55Bosnia-Herzegovina 11 17 20 18 22 28 41 43 44 46 54 52 58 57 57Bulgaria 22 28 31 36 46 44 48 54 54 54 61 70 67 67 67Croatia 4 12 17 22 27 30 33 34 26 28 32 35 43 43 43Estonia 9 8 9 13 33 50 50 50 43 57 71 71 71 71 71Georgia 0 0 0 0 18 25 18 18 25 23 33 55 58 67 67Kazakhstan 21 16 25 35 32 33 32 36 32 32 36 36 39 39 39Kyrgyzstan 50 25 50 43 38 38 38 38 50 63 63 63 57 57 57Latvia 13 17 27 29 32 29 27 32 32 41 45 50 57 62 62Lithuania 0 0 0 9 18 50 56 67 67 67 67 67 70 70 70Macedonia 9 15 15 15 21 36 38 38 44 44 47 50 64 71 71Moldova 8 8 21 27 31 31 31 38 38 38 38 38 44 44 44Romania 19 21 32 39 45 57 57 63 70 70 74 81 85 81 81Russia 7 7 8 9 9 9 9 12 13 14 15 16 17 19 19Serbia & Montenegro 3 3 3 3 6 9 17 18 26 34 43 60 63 60 61Turkey 11 11 12 13 14 15 14 19 20 20 24 38 43 43 43Ukraine 4 4 9 12 14 16 18 19 19 23 28 34 37 43 45Uzbekistan 20 27 25 23 23 21 20 20 20 19 18 18 24 24 24
LAC 28 30 33 35 36 37 37 38 38 38 38 39 41 42 42Antigua & Barbuda 0 0 0 0 0 0 0 17 17 17 17 17 33 33 33Argentina 22 24 29 32 37 37 37 34 36 35 34 34 35 35 35Barbados 60 60 60 60 60 60 60 60 100 100 100 100 100 100 100Bolivia 27 27 29 42 45 45 45 45 45 45 45 40 40 40 40Brazil 23 25 29 33 34 35 35 35 36 36 35 36 36 37 38Chile 48 48 50 48 52 52 48 44 44 39 41 41 48 48 48Colombia 20 23 27 29 28 29 29 29 25 23 24 28 28 28 28Costa Rica 14 14 14 16 19 18 20 20 20 20 21 22 21 18 18Cuba 0 0 0 0 0 0 0 0 0 0 0 0 0 0 0Dominican Rep. 5 5 5 5 5 5 7 9 11 12 12 10 10 10 10Ecuador 18 17 18 18 22 23 18 15 15 15 15 15 15 15 19El Salvador 18 25 46 46 46 54 58 58 67 67 73 82 90 90 90Guatemala 11 11 17 17 20 21 21 21 23 22 23 26 36 41 41Haiti 0 0 0 0 0 0 0 0 0 0 0 0 0 0 0Honduras 19 19 22 22 22 26 30 35 35 41 41 41 58 56 56Jamaica 30 30 30 30 33 33 50 63 63 71 71 71 71 71 71Mexico 32 38 44 44 43 49 48 56 56 54 50 47 46 48 48Nicaragua 17 17 33 33 36 50 57 50 50 50 40 67 67 83 83Panama 64 63 62 60 60 58 58 62 60 60 60 60 61 64 65Paraguay 50 52 50 57 60 58 61 63 62 62 62 62 64 64 62Peru 33 39 42 48 50 59 63 63 60 60 57 60 63 63 63
Appendix Table 1 - Percentage of Foreign Banks among Total Banks, by Country

Country 1995 1996 1997 1998 1999 2000 2001 2002 2003 2004 2005 2006 2007 2008 2009
Trinidad & Tobago 43 43 50 44 44 44 44 44 44 44 56 56 56 67 67Uruguay 77 77 77 74 74 73 76 81 79 77 77 81 81 81 81Venezuela 10 15 16 25 25 25 24 28 22 24 26 26 24 26 22
MENA 20 19 20 22 22 25 25 26 27 27 31 35 38 38 39Algeria 17 17 17 29 25 45 45 53 53 53 57 57 64 64 64Egypt 6 6 9 13 16 16 19 19 19 19 24 44 52 52 52Iran 0 0 0 0 0 0 0 0 0 0 0 0 0 0 0Jordan 11 10 10 10 10 10 10 10 10 20 30 30 30 40 40Lebanon 29 29 30 32 31 33 33 35 35 33 37 38 41 39 39Libya 0 0 0 0 0 0 0 0 0 0 0 0 0 0 0Morocco 36 36 31 38 38 38 38 33 40 44 40 40 40 40 50Oman 0 0 0 0 0 0 0 0 0 0 0 0 0 0 0Tunisia 36 36 33 33 33 38 38 44 44 44 50 50 50 50 50Yemen 0 0 0 0 0 0 0 0 0 0 0 0 0 0 0
OHI 31 31 31 32 34 34 34 39 40 41 41 41 42 42 42Bahrain 57 57 57 50 50 50 43 43 50 60 58 58 57 60 56Cyprus 50 53 53 53 53 53 56 62 60 60 60 60 61 61 61Hong Kong 63 63 63 63 67 67 68 74 76 78 78 78 78 77 79Iceland 0 0 0 0 0 0 0 0 0 0 0 0 0 0 0Israel 13 13 13 13 13 13 13 13 20 8 8 8 8 8 8Kuwait 0 0 0 0 0 0 0 0 0 0 13 11 11 11 11Qatar 0 0 0 0 0 0 0 0 0 0 0 0 0 0 0Saudi Arabia 0 0 0 0 0 0 0 0 0 0 0 0 0 0 0Singapore 38 38 38 43 48 45 45 50 55 55 55 55 57 57 55Slovenia 13 13 13 15 17 22 22 32 32 33 35 35 35 35 35United Arab Emirate 13 13 13 13 13 13 13 13 13 13 13 13 18 21 21
OECD 21 22 22 23 24 24 25 26 27 27 27 27 28 28 28Australia 36 36 41 41 41 46 46 46 46 42 40 40 38 38 38Austria 4 5 5 5 5 7 7 8 8 9 10 10 10 10 10Belgium 35 35 34 35 37 38 42 42 42 41 42 42 42 43 47Canada 41 41 44 44 44 41 41 41 42 42 42 42 42 42 42Czech Republic 39 39 39 44 52 52 54 54 57 57 55 59 64 67 67Denmark 1 1 1 3 3 5 9 9 12 12 10 9 9 8 10Finland 13 13 13 13 13 13 13 13 11 11 11 20 22 22 22France 7 7 7 6 7 8 8 7 7 6 6 6 6 6 6Germany 10 10 11 10 10 11 12 13 13 12 13 13 13 14 14Greece 17 15 8 8 8 15 14 13 18 24 24 35 31 31 31Hungary 67 68 73 75 78 78 81 79 86 85 85 90 93 93 92Ireland 82 83 83 84 80 81 85 89 89 89 89 90 90 90 90Italy 3 3 3 4 5 5 5 5 5 5 5 7 10 10 10Japan 0 0 0 0 0 0 1 1 1 1 1 1 2 1 1Korea (South) 0 0 0 0 6 6 12 13 18 24 24 24 24 24 24Luxembourg 98 98 99 99 99 99 99 99 99 99 99 99 99 99 99Netherlands 47 48 48 52 52 48 50 50 50 50 47 47 42 39 39New Zealand 57 67 67 67 67 67 60 60 60 70 70 70 70 70 70Norway 1 1 1 1 1 1 1 1 1 1 1 1 1 1 1Poland 30 38 42 50 61 62 67 70 69 69 75 73 69 68 69Portugal 17 17 17 17 17 20 23 27 27 31 30 30 30 32 33Slovakia 41 43 42 42 43 58 71 88 94 89 89 88 88 88 87Spain 4 4 5 5 5 5 6 6 6 5 5 7 7 7 7Sweden 2 2 2 2 2 2 2 2 2 2 2 1 1 1 1Switzerland 26 25 24 24 24 24 24 23 24 23 22 24 24 24 24
Appendix Table 1 cont'd - Percentage of Foreign Banks among Total Banks, by Country

Country 1995 1996 1997 1998 1999 2000 2001 2002 2003 2004 2005 2006 2007 2008 2009
United Kingdom 42 45 46 47 48 48 48 49 51 53 54 54 56 57 57United States 15 16 16 15 17 19 21 21 21 23 24 24 27 29 32
SA 7 8 8 9 9 9 9 8 8 8 9 12 13 14 14Bangladesh 0 5 5 5 3 3 3 3 3 3 3 3 3 3 3India 6 7 7 8 8 8 8 9 9 9 10 11 12 12 12Nepal 36 31 31 25 25 25 22 15 15 15 15 15 13 13 13Pakistan 5 5 9 9 14 19 14 13 12 12 16 31 36 40 40Sri Lanka 0 0 0 0 0 0 0 0 0 0 0 0 0 0 0
SSA 32 32 33 34 37 38 39 39 40 41 43 50 51 54 54Angola 50 40 40 40 50 50 50 50 44 44 50 50 50 50 50Benin 60 60 67 67 71 71 71 71 63 63 67 67 67 67 67Botswana 60 60 60 43 43 44 44 44 44 50 50 44 44 50 50Burkina Faso 80 83 83 86 88 88 88 88 88 88 88 89 89 100 100Burundi 20 20 20 17 20 20 20 20 20 20 20 20 25 50 50Cameroon 50 50 43 43 38 56 56 56 56 56 56 60 70 80 89Congo 50 60 60 60 60 60 67 67 67 67 67 71 71 83 86Cote d'Ivoire 57 63 56 56 56 56 70 70 73 73 73 77 75 77 71Ethiopia 0 0 0 0 0 0 0 0 0 0 0 0 0 0 0Ghana 56 55 46 46 54 54 58 54 54 60 65 58 53 53 53Kenya 24 24 24 24 24 27 26 26 28 28 30 30 29 35 35Madagascar 75 75 75 80 100 100 100 100 100 100 100 100 100 100 100Malawi 33 33 33 33 33 29 43 43 43 43 43 43 29 29 29Mali 20 17 17 29 38 38 43 38 38 38 38 44 44 56 56Mauritania 0 0 0 0 17 17 17 14 14 14 14 14 25 38 38Mauritius 60 64 73 73 73 75 69 67 73 73 71 71 67 62 62Mozambique 33 33 80 83 100 100 90 90 90 90 90 90 90 91 91Namibia 60 50 50 50 50 50 50 38 38 38 38 38 38 38 38Niger 75 75 75 75 83 83 83 83 83 83 83 86 86 86 86Nigeria 5 5 5 5 6 9 9 8 9 6 3 11 11 11 11Rwanda 17 17 17 17 17 0 0 0 0 33 50 50 43 57 57Senegal 50 50 50 50 60 60 64 64 64 64 64 85 85 83 83Seychelles 33 33 33 25 25 25 25 25 40 40 40 40 40 40 40South Africa 18 17 16 16 16 14 16 17 17 17 22 22 22 22 22Sudan 11 11 11 11 10 10 10 0 9 15 15 23 31 31 31Swaziland 80 80 80 80 80 80 80 80 80 80 80 80 80 80 80Tanzania 55 54 53 50 56 58 58 55 57 64 68 68 70 70 70Togo 33 50 50 50 50 50 50 50 50 50 40 33 33 33 33Uganda 47 53 56 60 67 67 67 71 71 71 71 79 79 76 82Zambia 56 56 56 56 56 56 63 63 63 71 75 75 88 100 100Zimbabwe 30 27 27 27 33 25 23 21 20 20 21 25 33 33 33
TOTAL 21 22 23 25 26 27 28 29 29 30 31 32 34 35 35
Appendix Table 1 cont'd - Percentage of Foreign Banks among Total Banks, by Country

Country 2004 2005 2006 2007 2008 2009
EAP 3 2 2 4 3 3Cambodia 17 27 33 56 56 54China .. .. .. 2 2 1Indonesia 30 32 26 34 31 32Malaysia 18 17 17 19 18 18Mongolia .. 11 9 8 .. ..Philippines .. 1 2 .. .. ..Thailand 3 3 2 5 7 6Vietnam .. 2 1 1 1 2
ECA 27 23 28 29 30 28Albania .. .. .. 93 94 ..Armenia .. 46 58 65 70 79Azerbaijan 1 1 1 3 2 3Belarus .. 14 12 19 19 18Bosnia-Herzegovina 67 87 90 91 92 93Bulgaria 72 71 77 76 80 79Croatia 88 92 90 90 90 91Estonia 95 99 98 97 99 99Georgia 13 32 66 66 66 64Kazakhstan 27 24 5 13 15 17Kyrgyzstan .. 91 .. .. .. ..Latvia 51 58 64 65 66 66Lithuania 91 92 92 92 93 92Macedonia 54 54 56 63 69 70Moldova 31 30 31 38 45 49Romania 54 55 87 89 89 85Russia .. 7 10 11 13 12Serbia & Montenegro 61 70 85 82 75 75Turkey 18 18 16 14
Appendix Table 2 - Percentage of Foreign Bank Assets among Total Bank Assets, by Country
Turkey .. .. 18 18 16 14Ukraine 28 28 42 46 58 ..Uzbekistan .. .. .. .. .. ..
LAC 35 38 38 35 35 31Antigua & Barbuda .. .. .. .. .. ..Argentina 29 27 26 28 29 28Barbados 100 100 100 100 100 100Bolivia 36 37 18 18 16 15Brazil 19 24 26 26 22 ..Chile .. .. .. .. 37 34Colombia 10 18 14 14 13 9Costa Rica 26 27 29 36 37 31Cuba 0 0 0 0 0 0Dominican Rep. 12 13 12 11 7 10Ecuador 12 11 12 13 13 5El Salvador 69 80 80 97 97 96Guatamala 11 11 12 13 28 29Haiti 0 0 0 0 0 0Honduras 31 32 30 47 46 40Jamaica 84 87 87 88 95 96Mexico 82 83 81 79 76 75Nicaragua 31 22 49 48 68 55Panama 47 46 54 65 .. ..Paraguay 68 63 60 58 62 39Peru 41 49 48 48 50 50

Country 2004 2005 2006 2007 2008 2009
Trinidad & Tobago 13 13 13 14 56 54Uruguay 50 75 87 47 48 ..Venezuela 31 30 29 25 26 ..
MENA 10 13 15 17 17 24Algeria 5 8 8 7 8 14Egypt 10 12 21 25 25 23Iran 0 0 0 0 0 0Jordan 2 14 16 17 22 23Lebanon .. .. .. 33 35 36Libya 0 0 0 0 0 0Morocco .. .. .. 19 18 34Oman 0 0 0 0 0 0Tunisia 20 29 27 27 28 ..Yemen 0 0 0 0 0 0
OHI 45 44 44 42 42 43Bahrain 69 67 65 69 65 55Cyprus 16 20 22 22 23 19Hong Kong 91 91 91 91 92Iceland 0 0 0 0 0 0Israel .. .. .. 9 9 ..Kuwait 0 .. 11 9 7 8Qatar 0 0 0 0 0 0Saudi Arabia 0 0 0 0 0 0Singapore .. 2 10 10 3 2Slovenia 21 25 25 24 26 25United Arab Emirates 3 3 1 1 2 2
OECD 10 12 12 13 12 12Australia .. .. 5 5 3 2
Appendix Table 2 cont'd - Percentage of Foreign Bank Assets among Total Bank Assets, by Cou
Austria 24 21 16 19 22 20Belgium .. 13 14 13 15 50Canada 4 4 4 4 4 5Czech Republic 84 83 84 85 84 86Denmark 7 20 19 18 18 20Finland .. 55 65 65 67 65France .. 5 5 6 6 6Germany 5 24 14 11 12 12Greece 4 4 14 14 14 14Hungary 65 63 61 64 67 64Ireland .. 62 62 61 60 56Italy .. 1 6 7 6 6Japan 0 0 0 0 0 0Korea (South) 24 23 19 18 20 19Luxembourg 100 100 100 95 96 95Netherlands .. 7 9 10 3 2New Zealand .. .. 84 80 78 79Norway .. 33 16 17 16 16Poland 72 76 75 74 72 68Portugal .. 16 15 15 15 15Slovakia 95 94 93 92 92 88Spain .. 2 2 2 2 2Sweden 14 0 0 0 0 0Switzerland 2 4 4 4 5 5

Country 2004 2005 2006 2007 2008 2009
United Kingdom 9 12 12 14 19 15United States 20 20 21 23 19 18
SA 5 5 8 8 7 8Bangladesh 2 2 3 2 2 3India 4 4 4 4 5 5Nepal 22 14 20 16 14 13Pakistan 29 23 48 50 51 53Sri Lanka 0 0 0 0 0 0
SSA 12 25 26 28 26 28Angola 50 48 49 50 52 57Benin .. 45 54 46 49 ..Botswana 77 77 69 72 66 66Burkina Faso 77 79 80 76 100 100Burundi 42 40 36 58 64 ..Cameroon 74 71 74 85 .. ..Congo 45 46 61 67 74 ..Cote d'Ivoire 89 89 .. .. .. ..Ethiopia 0 0 0 0 0 0Ghana .. .. .. 58 60 65Kenya 46 46 43 37 44 44Madagascar 100 100 100 100 100 100Malawi 49 46 46 29 31 30Mali 25 28 30 40 52 ..Mauritania 5 3 0 4 10 ..Mauritius 37 44 58 69 60 52Mozambique .. 99 99 100 100 100Namibia .. 44 35 35 44 40Niger 68 72 74 69 .. ..Ni i 5 4 2 3
Appendix Table 2 cont'd - Percentage of Foreign Bank Assets among Total Bank Assets, by Cou
Nigeria .. .. 5 4 2 3Rwanda 41 62 60 48 56 ..Senegal 56 62 94 92 93 90Seychelles 57 52 57 60 67 27South Africa .. 22 21 23 21 22Sudan .. 1 8 21 23 22Swaziland 82 80 81 83 81 88Tanzania .. 92 93 94 80 78Togo 53 50 48 46 51 ..Uganda 88 89 95 95 86 89Zambia 70 70 72 89 100 100Zimbabwe .. .. .. .. .. ..
TOTAL 11 12 13 14 13 13
Note: Foreign bank asset share is only reported when asset information is available in Bankscope for more than 60 percent of the banks active in thecountry in that year. Since asset information is lacking in Bankscope for the vast majority of banks before 2004, we do not report asset shares for anycountry before that year.