foreign direct investment - world bank
TRANSCRIPT

WPS 26q-6POLICY RESEARCH WORKING PAPER 2646
Foreign Direct Investment Integrationintotheproduction and marketing
and Integration into Global arrangements of multinational
Production and Distribution corporations may offer manybenefits to transition
N etw orks economies that, after a longperiod of isolation, have
liberalized trade andThe Case of Poland investment. The
fragmentation of production
Bartlomiej Kaminski offers a unique opportunity
Beata K. Smarzynska for producers in developingcountries to move from
servicing small local markets
to supplying large firms
abroad and, indirectly, their
customers all over the world.
The World BankDevelopment Research GroupTradeJuly 2001
Pub
lic D
iscl
osur
e A
utho
rized
Pub
lic D
iscl
osur
e A
utho
rized
Pub
lic D
iscl
osur
e A
utho
rized
Pub
lic D
iscl
osur
e A
utho
rized
| POLICY RESEARCH WORKING PAPER 2646
Summary findingsNot until the end of the twentieth century, the "second Using Poland as a case study, Kaminski andglobalization," has the ratio of trade to GDP been Smarzynska study multinational corporations' role incomparable to that during the first globalization, which integrating a host country into the increasinglytook place at the end of the nineteenth century and was international division of labor. They provide evidenceinterrupted by World War I. Technological progress has that inflows of foreign direct investment are increasingincreased the importance of the international division of Poland's participation in global production andlabor and of global production and distribution distribution networks. They conclude that because of thenetworks. Multinational corporations have been a large volume of foreign direct investment inflowsdriving force behind these developments. As a transition expected in Poland in the near future, Poland's exports-economy, Poland provides an interesting case for study, driven by fragmented production-will continue toas its sudden opening to foreign investment after a long expand at even faster rates than observed there recently.period of isolation allows the process of integration intoglobal networks to be studied more clearly.
This paper-a product of Trade, Development Research Group-is part of a larger effort in the group to study the effectsof foreign direct investment on economic activity. Copies of the paper are available free from the World Bank, 1818 H StreetNW, Washington, DC 20433. Please contact Lili Tabada, room MC3-333, telephone 202-473-6896, fax 202-522-1159,email address [email protected]. Policy Research Working Papers are also posted on the Web at http://econ.worldbank.org. The authors may be contacted at [email protected] or [email protected]. July2001. (27 pages)
The Policy Research Working Paper Series disseminates the findings of work in progress to encourage the exchange of ideas ahoutdevelopment issues. An objective of the series is to get the findings out quickly, even if the presentations are less than fully polished. Thepapers carry the names of the auithors and shougld be cited accordingly. The findings, interpretations, and conclusions expressed in thispaper are entirely those of the authors. They do not necessarily represent the view of the World Bank, its Executive Directors, or thecountries they represent.
Produced by the Policy Research Dissemination Center

Foreign Direct Investment and Integration into GlobalProduction and Distribution Networks:
The Case of Polandx"
Bartlomiej Kaminski* and Beata K. Smarzynska*
Table of Contents
I. Introduction .......................................................................... 1I1. Methodological Issues: problems of measuring intra-product trade ................... ........................2III. Shifts in Foreign Direct Investment: from "advertising-intensive" joint ventures to "R&D-intensive" wholly owned projects ........................................................................S5IV. Salient Features of Poland's Trade during Transition ...............................................................8V. Foreign Firms and External Trade ........................................................................ 12VI. Participation in EU-based production and distribution networks ............................................ 16VII. Conclusions ........................................................................ 23References ........................................................................ 24
' Department of Government, University of Maryland, College Park, MD 20742 and DECRG-Trade, WorldBank, 1818 H Street NW, Washington, D.C., 20433, email bkaminskiggvpt.umd.edu.
' World Bank, 1818 H Street, NW, Washington, D.C., 20433, email [email protected].
x/ The authors would like to thank Carlos Cavalcanti and Francis Ng of the World Bank, KrzysztofMarczewski and Elzbieta Kawecka-Wyrzykowska of the International Trade Institute, KrzysztofBialowolski of Delphi Automotive Systems Poland, Stanley Urban of Thomson Polkolor, and MiroslawGryszka of ABB.


l
1. Introduction
Fragmentation of production combined with the creation of distribution networks
spanning across continents characterizes the second globalization that has gained momentum in
recent years.' Information revolution and new technologies have made it possible to divide the
industry's value chain into smaller functions that can be contracted out to independent suppliers.
This fragmentation of production offers a unique opportunity for producers in less developed
countries to move from servicing small local markets to supplying large firms abroad and
indirectly their customers all over the world. This phenomenon is accompanied by an evolution in
the nature of competition with its growing emphasis on customization of products, rapid
innovation, flexibility and fast response to changes in demand. In many cases, managerial and
technological skills required to successfully compete in global markets make it impossible to rely
on the resources of one country. Under these circumstances, integration into the production and
marketing arrangements of the multinational corporations (MNCs) rather than the pursuit of an
autarchic national development strategy has become the most efficient way of taking advantage
of growth opportunities offered by the global economy.
While the economic literature has carefully studied potential benefits brought by inflows
of foreign direct investment (FDI) such as technology transfer and spillovers; little attention has
been paid to other advantages arising from the presence of multinationals. This paper aims to fill
a gap in the existing literature by examining the positive effect of FDI created through the
integration of a host country into the global economy and the system of international division of
labor based on fragmentation of production.
This study focuses on the case of Poland and the potential benefits it can reap from
becoming part of global production and distribution networks. Studying this question in the
context of a transition economy is particularly interesting, since its sudden opening to foreign
investment after a long period of isolation allows us to observe the process of integration into
global networks more clearly. From an economist's perspective, this unique opportunity is the
next best thing to a natural experiment.
' The first globalization took place at the end of the I 9 th century and was ended by World War I and theGreat Depression. It was not until the end of the 2 0 1h century that most countries achieved the ratio oftrade to GDP comparable to that prevailing during the first globalization (see Feenstra 1998).
2 See Borrus and Zysman (1997).
3 See, for instance, Haddad and Harrison (1993), Blomstr6m and Wolff (1994), Aitken and Harrison(1999).

2
The study reviews briefly the developments in Poland's foreign trade and FDI inflows
that took place over the recent years. Poland's foreign trade in goods has recorded uninterrupted
growth since 1989 especially strong on the side of imports. Its geographic orientation shifted
from the former Council for Mutual Economic Assistance (CMEA) countries towards the
European Union. The composition of exports changed significantly with skilled labor intensive
products growing in importance. Poland has also attracted relatively large inflows of FDI,
especially in the second half of the 1990s. Over the last decade, the composition of FDI inflows
has shifted from advertising-intensive joint ventures towards R&D-intensive wholly owned
projects.
Foreign owned firms have already had a significant impact on Poland's international
trade. Our findings indicate that foreign owned firms tend to be more export-oriented than local
-e.panies and that they tend to operate in industries that are more capital and skilled labor
intensive. Foreign owned firms are often active in sectors with large export potential (i.e.. so
called 'sunrise sectors'). The data also suggests that thanks to the activities of MNCs Poland is
becoming part of the rapidly growing global production and distribution networks. The study
concludes that the large volume of FDI inflows will contribute to an expansion of Polish exports
which will be driven by production fragmentation and participation in the global division of
labor.
This paper is structured as follows. In the next section, we present a brief overview of
methodological issues involved in assessing the role of foreign-owned firms in international
trade. Section 3 discusses changes in FDI inflows in terms of their value, ownership and other
characteristics. Section 4 identifies changes in Poland's trade patterns during transition, whereas
Section 5 links these changes to foreign owned firms. Section 6 focuses on production and
distribution networks as revealed in Poland's trade with the EU and presents case studies of three
foreign companies active in Poland. The concluding section closes the paper.
11. Methodological Issues: problems of measuring intra-product trade
The possibility of 'dividing up the value chain' of production allows for
internationalization of the manufacturing process on unprecedented scale with deep implications
for the global division of labor. The result of these developments is-to borrow an apt phrase
from Feenstra (1 998)-integration of trade and disintegration of production in the global
economy. MNCs are instrumental in setting up supply chains cutting across many national
borders. Complex specialization implicit in intra-industry trade extends the division of labor to

3
parts and components of products within larger transborder supply chains and leads to intra-
product trade (Arendt and Kierzkowski 2000).
Production fragmentation occurs across national borders tlhus triggering extra foreign
trade flows. A significant portion of these flows is intra-firm trade, i.e.. transactions taking place
among subsidiaries of MNCs. Fragmentation of productionl may also manifest itself through
outsourcing, which does not involve acquiring property rights over a supplier by a contracting
firm. Without access to firm data, which are usually not disclosed, precise assessment of this
intra-product trade is very difficult.
There have been a few attempts to assess empirically the scope of foreign trade that can
be directly attributed to production fragmentation. Some studies use intra-industry trade (IIT)-as
measured by the well-known Grubel-Lloyd index 4 - to estimate the growth of trade due to
fragmentation (Kierzkowski 2000). While the IIT clearly includes fragmentation-related trade, it
also captures a large portion of trade that may have little to do wvith production sharing or
fragmentation.5 Undoubtedly, fragmentation-driven intra-product trade accounts for some portion
of ITT. The empirically observed positive correlation between multinational activity and IIT
(Markusen and Venables 1998) would clearly point in this direction. But it would be difficult to
estimate the slhare of this trade in IIT. The distinction between lhorizontal and vertical intra-
industry trade-the latter involves exchange of similar goods of different quality, whereas the
former comprises exchange of similar goods that are not differentiated in terms of quality-does
little to solve the problem. Products subject to mutual exchanges often enter different market6niches, although in some cases lower quality products may be imported for processing.
Other authors suggest employing the 'end-use' categories of the US Bureau of Economic
Analysis, which allow to identify products in terms of their use by buyers rather than by their
positions in production process (Feenstra 1998; Irwin 1996). This typology identifies the
following five categories: foods, feeds and beverages; industrial supplies and materials; capital
4 The GL index of intra-industry trade between two partners is usually expressed as: GL = I - Y[ I Xi - Mi/ E (Xi + Mi)], where X represents exports of a country to its partner and NM imports from the partnerof product i. The index suffers from two problems: aggregation and aggregate trade imbalances.
5 Technological factors may lower the minimum efficient scale of production and thus allow the marketsupport more firms and greater variety (Hufbauer, 1970). Furthermore, consumer preferences ratherthan globalization of production shape trade in, for instance, motor vehicles between the EU and theUnited States. This trade allows realization of economies of scale thanks to greater productspecialization in differentiated products.
6 For instance, Aturupane, Djankov, and Hoekman (1997) find that vertical intra-industry trade accountedfor 80-90 percent of total IIT of CEEC with the EU. It would be impossible to estimate whatproportion was further processed in the EU.
4
goods (excluding autos); consumer goods (except autos); and automotive vehicles and parts'
While this typology makes it possible to assess changes in exports and imports in terms of
increased or decreased processing, it does not give any more direct information on trade due to
production fragmentation. The fall in the combined share of foods, feeds and beverages, industrial
supplies and materials merely indicates that processed goods play a growing role in country's
trade. But it remains unclear which portion of this trade can be directly attributable to the shift in
stages of production (or value chains) across borders.
Yeats (1998) has brought to attention a more direct way of estimating this trade. He
pointed out that data required estimating trade in parts have been available in foreign trade
statistics based on SITC (Standard International Trade Classification) Revision 2 for the last two
decades. The most complete coverage is within machinery and transport equipment (SITC 7),
vhich distinguishes among around 60 individual three-, four-, and five-digit product groups
consisting solely of other manufactured equipment. But there is one major problem with this
approach-it dramatically underestimates the share of intra-product trade. In fact, the SITC does
not do a good job in distinguishing between assembled goods and parts. Although, for instance. a
piston engine is not identified as 'a part' in the SITC system, it may be clearly a part of an
automobile. Similarly, the SITC system identifies parts of TV tubes and electronic microcircuits.
B1ut TV tubes, electronic microcircuits, etc. themselves may also be parts assembled in other
products. The line is fuzzy but in some cases its identification is relatively straightforward.
Kaminski and Ng (2001) suggest expanding analysis to parts identified in other sections
of SITC as well as to components and final products in four sectors of manufacturing: office
equipment; telecommunication equipment; motor vehicles and furniture. The latter has been
included to account for very important role that furniture plays in trade of Central European
transition economies. The first two sectors-office equipment and telecommunication
equipment-represent production associated with information revolution. The empirical evidence
suggests that MNCs dominate these two sectors as well as motor vehicles. Suppliers in these
sectors tend to be either subsidiaries of MN4Cs or operate in outsourcing within MNC networks of
manufacturing and distribution. Anecdotal evidence also suggests that furniture producers tend to
be integrated into larger retailers. Kaminski and Ng refer to the production arrangements in these
sectors as production and marketing networks.
7 The industrial supplies and materials include mainly raw materials but also some basic manufacturedgoods such as steel, newsprint, textile yams, etc. The capital goods are used for both investment andas intermediate products (all electrical parts and components except finished consumer goods areregarded as capital goods). The consumer goods are finished household products.

5
In order to establish the link between networks and FDI, we shall use the data on exports
of foreign owned firms by sector since some sectors can be easily related to respective networks.
Furthermore, we shall discuss two case studies that offer additional insights into developments
within automotive and telecommunications networks and one case study going beyond the
network analysis. The latter example provides evidence that participation in global networks of
production and marketing often involves horizontal rather than vertical FDI, whereas the
automotive case suggests that a firm may serve several MNCs rather than a single one.
Ill. Shifts in Foreign Direct Investment: from "advertising-intensive" jointventures to "R&D-intensive" wholly owned projects
Theoretical studies of FDI emphasize the importance of the so called ownership
advantages and suggest that firms undertaking FDI are endowed with greater intangible assets
than domestic firms. Numerous empirical studies have confirmed this by showing thatMNCs are
usually more technology-intensive and advertising-intensive than firms that do not engage in FDI
(see Dunning 1993 and Markusen 1995 for discussions of this point). These findings, however,
have not been confirmed in the context of transition economies. The empirical analysis performed
by Meyer (1998) shows that technology-intensity is not a determinant of a firm's probability to
invest in the region. Furthermore. Smarzynska (1999) finds that foreign firms with low, rather
than high, R&D-intensity were more likely to undertake FDI in transition economies in the early
1990s. At the same time firms undertaking FDI in the region were found to be highly advertising-
intensive. Thus, while Poland was not attracting high technology investors in the early 1990s, it
was definitely benefiting from an inflow of marketing skills.
Indeed, during the initial stages of transition, there were two notable factors attracting
FDI to Poland. First, there was unsatisfied demand for consumer goods and services, a legacy of
central planning which was strongly biased against services and consumer products. The collapse
of the CMEA and downturn of many Polish industries created a great opportunity for new
products coming from the West. FDI aiming at meeting pent-up local demand for consumer
goods was prevalent. In manufacturing, foreign investors have focused primarily on food,
beverage (especially beer and soft drinks), tobacco, cosmetics and publishing industries. Large
investors such as Coca Cola Amatil, Pepsico, United Biscuits, Philip Morris, Unilever and Nestle
have entered the market in response to excess demand. The underdevelopment of the Polish
service sector also represented a huge market opportunity for foreign investors, and a large
number of foreign enterprises have been attracted into the trade, retail and consumer services.

6
The second ptll factor was tariff jumping. Admittedly, it was much less powerful than
the first one and short-lived, as the European Agreement signed with the EU has imposed
significant restraints on changes in tariff rates. In 1992, FDI-intensive industries had average
import tariffs about 66 percent higher than manufacturing as a whole (EBRD 1994). The main
"delinquent" was the automobile industry. Seeking to attract an investment by the General
Motors, Poland raised tariffs on imported new cars from 15 to 35 percent in 1991. Although the
talks with the General Motors eventually broke up, tariff rates remained in place as other
investors (Fiat and Daewoo) stepped in to take advantage of a rapidly expanding and highly
protected market.
Another trend observed in Poland, and also in other transition economies as they
liberalized their respective economic regimes, was a gradual shift from joint ventures to wholly-
^wned investments. Companies with 100 percent foreign ownership accounted for 40 percent of
FDI projects in Poland in 1993, 45 percent in 1995 and 50 percent in 1998.8 As Smarzynska
(2000) shows, wholly-owned projects are likely to be undertaken by foreign investors possessing
cutting edge technologies and superior marketing skills. Foreign investors with these
characteristics, however, tend to shy away from joint ventures. In consequence, as the
composition of FDI inflows shifts from partial to full ownership, Poland is likely to benefit more
fiom inflow of sophisticated technologies and superior marketing skills.
FDI carried out in a distortion-free policy environment yields several benefits to an
economy in transition.' Foreign investment is a powerful vehicle for transfers of technology, best
management practices and for integrating domestic production capacities into global networks of
production and distribution. As recent research shows, firms with foreign equity participation are
more likely to export than firms with purely domestic capital. Similarly, the probability that a
firm commences exporting is two and a half times higher for firms with foreign equitv
participation that for firms without foreign capital (Kraay et al. 2000). Becoming part of a
production and distribution network of an MNC offers a 'cheap way' of marketing products.
Firms, do not incur marketing cost, which are usually quite significant for newcomers (Roberts
and Tybout 1998). The experience of Hungary shows the importance of FDI in industrial
s Source Foreign Trade Research Institute (1998 and 1999) and Main Statistical Office (1999).
9 Poland's policy towards the automotive sector is an example of a distortion creating policy. Very highrates of effective protection provided strong incentives for assembling vehicles at the expense ofproduction of parts and components.

7
realignment and contribution to competitiveness in intemnational marketsl° Furthermore, FDI
allows firms to realize economies of scale and leads to the growth of intra-industry trade. The
advantage of this trade vis-a-vis inter-industry trade is that it is less vulnerable to swings in
domestic business cycle and it does not produce such significant inequalities in regional
development and income distribution."
Despite its internationally praised stabilization-cum-transformation program launched in
1990 and opening to foreign investment, Poland did not attract significant FDI inflows until 1995
following its agreement with the London Club. In 1995, the value of FDI inflows into Poland
surged to US$3.6 billion (net of repatriation), which amounted to around 80 percent of the
aggregate value of FDI inflows over 1990-94 and was double of the value in 1994 (Table 1).
Measured against the GDP, the volume of FDI was equal on average to around three percent over
1995-97 and five percent in 1998-99.I2 These inflows put Poland in 2000 on a par with Hungary
around 1995, since in 1991-94 Hungary received FDI inflows equivalent to five percent of the
GDP.'3
Table 1: Foreign Direct Investment in Poland, 1990-99
1990 1991 1992 1993 1994 1995 1996 1997 1998 1999 TOTAL, TOTAL, TOTAL,1990- 1997- 1990-
FDI inflows (millionof US dollars) 89 291 678 1,715 1,875 3,659 4,498 3,041 6,164 6,180 12,805 15,385 28,190FDI inflows percapita (US dollars) 2 8 18 44 49 95 117 79 160 160 332 399 730Source: Global Development Finance, The World Bank, Washington, D.C., various issues, and Survey ofEurope, United Nations Economic Commission for Europe, New York and Geneva, various issues.
As a relatively short time has elapsed since FDI began flowing oln a larger scale into
Poland, its full impact is yet to be felt. As can be seen from data in Table 1, about 43 percent of
the value of total FDI inflows over 1990-99 came in 1998 and 1999. Poland accounted then for
almost half of total flows to Central and Eastern European countries (CEEC-ld4). Given the size
of the FDI inflows one suspects that their impact on the Polish economy will be quite substantial.
'O For a detailed analysis of FDI impact on Hungary's competitiveness in EU markets, see Kaminski(2000). For an empirical examination of multiple impacts of FDI on transformation of the Hungarianeconomy see Kaminski and Riboud (2000).
"1 For a thorough discussion, see Krugman, (1994, pp. 38-51).
12 Source: IMF International Financial Statistics (Balance of Payment data).
13 Interestingly, the level of penetration of foreign-owned firms in Hungary around 1994-95 is similar tothat in Poland in 1998-99.
14 CEEC-IO include the ten 'EU associates'-Bulgaria, Czech Republic, Estonia, Hungary, Latvia,Lithuania, Poland, Romania, Slovak Republic, and Slovenia.

8
Taking into account lead times involved in construction and restructuring, the full impact
of FDI on the economy is yet to materialize, although it has already been significant. Consider
first foreign firms' rapidly expanding role in industrial restructuring. The share of foreign firms in
total investment outlays increased from 20 percent in 1994 to 33 percent in 1996 and 40 percent
in 1997. In manufacturing, this share is significantly higher and amounted to 56 percent of the
total in 1997.
Considering already high levels of FDI penetration in industry and services, an
interesting question is how FDI has affected Poland's foreign trade. The next three sections seek
to provide an answer to this question by first delineating features of foreign trade in the 1990s and
then assessing the extent to which FDI has been responsible for them.
IV. Salient Features of Poland's Trade during Transition
Four features of Poland's trade stand out. First, foreign trade turnover has expanded
continuously since the implementation of stabilization cum transformation program in 1990.
Second, its composition has undergone enormous change indicating successful effort in industrial
restructuring. Third, the factor content of Poland's exports to the EU has shifted towards skilled
labor intensive and capital intensive products. Fourth, Polish exporters seem to have been
breaking away from "sunset" markets, as they specialize increasingly in products for which iEU
import demand has been growing.
An important feature of development in Poland's foreign trade in the 1990s was a much
faster expansion in imports than in exports. The former grew on average 27 percent annually and
the latter expanded at 10 percent per annum. The value of exports doubled from US$15 billion in
1990 to US$30 billion in 1998, whereas the value of imports grew six times from US$8 billion to
US$48 billion. During the past decade the European Union became the most important trading
partner of Poland. The share of Polish exports directed to the EU increased from 47 percent in
1990 to 68 percent in 1998. The corresponding increase in imports was from 51 to 66 percent.
Since 1991 Poland has had a trade deficit. The ratio of export earnings to import
expenditures has grown each year reaching 60 percent in 1998 down from 80 percent in 1994-95.
Continuous increase in the size of the trade deficit has been a major concern for policy makers.
The trade deficit was exacerbated by the Russian crisis that led to a 68 percent drop in Poland's
exports to Russia during the first nine months of 1999 as well as by the slowdown in Polish
exports to the EU.5 The latter increased only by 2.2 percent in 1999 which wvas less than the 3
15 Authors' calculations based on figures from IMF's Direction of Trade Statistics.

9
percent increase in EU external imports. While Poland maintained its relative position vis-a-vis
otlher Central and Eastern European countries in terms of share in CEEC-]0's EU-oriented
exports, its performance was dwarfed by that of Hungary and the Czech Republic.
The second important feature of Poland's trade during transition was a very significant
shift in its composition towards manufactured goods indicating a rapidly unfolding process of
industrial restructuring (Kaminski 1998). On the export side, the share of food, feeds and
beverages fell from 20 percent in 1989 to 10 percent in 1993 and 7 percent in 1998. The share of
industrial supplies materials also declined from 32 percent to 22 percent and 14 percent over the
same period, while the combined share of capital goods and automotive vehicles and parts
increased from 11 percent in 1989 to 17 percent in 1993 and 27 percent in 1998.
Similar shifts were seen on the import side with the share of foods, feeds and beverages
.allin; from 17 percent in 1989 to 10 percent in 1993 and 6 percent in 1998. While the share of
industrial supplies and materials returned to its 1989 level of 5 percent the same level after an
increase to 8 percent over 1989-93, the shares of capital goods and automotive vehicles and parts
expanded significantly. The former increased from 3 percent in 1989 to 6 and 9 percent in 1993
and 1998 respectively, whereas the latter fell from 28 percent to 25 and increased to 3 1 percent
over the same period. In assessing the scale of these changes, note that the value of imports more
than doubled between 1993 and 1998.
Table 2: Factor intensity of trade with the EU, 1993-98 (in million of US dollars and percent)
1993 1994 199S 1996 1997 1998 Growth in 1998Exports to the EU (million of US dollars)
Natural Resource Based 3,820 4,567 5.336 4.641 4,800 4.862 1.3Unskilled Labor 2,967 3,473 4.496 4,657 4,460 5,115 14.7Capital intensive 1,268 1.607 2.475 2,680 2,914 3.372 15.7Skilled Labor 1.760 2.269 3.479 3,520 3,971 4.847 22.1
Composition of Poland's exports to the EU (in percent) Idex 1998.199 7= 100
Natural Resource Based 38.9 38.3 33.8 29.9 29.7 26.7 90Unskilled Labor 30.2 29.1 28.5 30.0 27.6 28.1 102Capital intensive 12.9 13.5 15.7 17.3 18.0 18.5 103Skilled Labor 17.9 19.0 22.0 22.7 24.6 26.6 108
Export Specialization Index (a)Natural Resource Based 1.36 1.37 1.24 1.10 1.13 1.15Unskilled Labor 2.22 2.24 2.34 2.44 2.22 2.27Capital intensive 0.38 0.39 0.44 0.48 0.49 0.48Skilled Labor 0.75 0.78 0.88 0.92 1.02 1.05
Source: Own calculations from EU foreign trade data as reported to the UN COMTRADE database.Note: (a) Export Specialization Index is calculated as a ratio of shares of Polish exports to the EU to theshares of the EU external imports.
The third notable feature concerns the shift in factor content of Poland's EU-oriented
exports towards skilled labor intensive products (Table 2). Although Poland's exports of

10
unskilled labor intensive goods have been steadily increasing in both absolute and relative terms
and constitute the most important group in Poland's exports, it can be argued that this shift
towards skilled labor intensive products will continue thus closing the gap between Poland's
endowment in human capital and the factor content of its exports. Consider that uniit labor costs
have continued to increase in Poland-by 2.9 percent in 1995, 12.6 percent in 1996, and 1.5
percent in 1997 .6 Consider also that only few Polish producers of unskilled labor intensive
products (e.g., textiles) possess internationally recognized brand names. In consequence, one
should not expect a further expansion of exports in this product group. As an example may serve
the fact that outward processing trade in textile and apparel industry has been moving away from
Poland towards its eastern neighbors where labor costs are lower.
The differential between wages of skilled workers in Poland and in western European
counitries, however, continues to remain high.17 Thus, there exists a scope for increasing the
exports of skilled labor and capital intensive products to the EU. Another look at Table 2
indicates that indeed the absolute value and the relative importance of these two types of products
in Poland's exports increased significantly in the 1990s. The two categories accounted for 45
percent of Poland's exports to the EU.
The last part of Table 2 presents the specialization indices, defined as share of product
category i in Poland exports relative to its share in EU external imports. The figures suggest that
Poland's strong specialization in unskilled labor intensive products and its decreasing
specialization in natural resource based goods, have been augmented by specialization in skilled
labor intensive products which emerged in 1997.
Another prominent feature of Polish exports is a steady movement away from traditional
stagnant markets. This is important because it makes a difference whether a country specializes in
products for which import demand is growing or in products for which the import demand is
either stagnant or contracting. The former, often referred to as sunrise sectors, offer greater space
for expansion, whereas in the latter (sunset sectors) competitive pressures are on the increase.
Similarly, prospects for expanding exports are better in sunrise than in sunset sectors.
To assess to which sectors Polish exporters tend to gravitate, we use the following criteria
to define sunrise markets in the EU: (i) the value of EU external imports in terms of SITC four-
digit product categories is at least US$10 million, (ii) the average growth rate of imports is above
5% over 1996-98, and (iii) EU imports increased every year in this period.
16 See EBRD 1998 (Table 3.7).
17 The average wage in Poland was equal to US$320 per month in 1998 (EBRD 1998, p.66).

11
Polish 'sunrise' exports expanded rather vigorously over 1994 growilg at an average rate
of 21 percent over 1994-98. Their share increased from 20 percent in 1997 to 22 percent in 1998
(Table 3). Among 12 Polish top performers in EU sunrise markets one finds mostly manufactures
with the exception of vegetables used in pharmacy (SITC. 2924) and temporarily preserved fruit
(SITC. 0536). Capital intensive and skilled labor intensive products figure predominantly among
to performers.
Table 3: Presence in EU sunrise markets in 1993-97
A: Poland's Top 12 Performers in EU Sunrise Markets
Average growth rateof EU external Value of Polish Average growth rate Factor
imports exports to the EU of Polish exports to intensit(in percent) (mln US$) the EU (in percent)
Co:mmodity SITC 4-Digit Rev. 1 1996-98 1998 1996-987241 Television Receivers 8.8 511.4 138.8 SL8996 Orthopedic Aids 7.8 5.1 77.4 SL7221 Electric Power Machinery 8.0 230.3 42.8 Ci2924 Veg Used in Pharmacy Etc 14.5 19.7 30.7 NR6210 Materials of Rubber 6.0 32.9 29.8 SL6299 Other Rubber Articles Nes 7.5 26.0 25.6 SL8959 Other Office Supplies 11.3 3.0 23.4 UL6642 Optical Glass Unworked Etc 23.7 1.9 18.0 UL0536 Fruit Temporarily Preserved 6.6 232.4 15.0 NR7198 0th Machines Nonelectric 6.2 59.1 14.7 Ci8412 Textiles Clothing 5.6 28.0 14.1 ULAccessories Nonknit7114 Aircraft Engines Inc Iet 20.1 8.4 7.6 Ci
B: Value, share in EU-destined exports, and rate of growth, 1993-981993 1994 1995 1996 1997 1998
Value of Polish 'sunrise' exports (in million of US dollars) 1,584 1,854 2,552 2,961 3.257 3,975Share in EU-destined exports (in percent) 16.1 15.5 16.1 19.1 20.2 21.8Rate of growth of Polish 'sunrise' exports in % 14.1 17.0 37.6 16.0 10.0 22.0
Source: Own calculations from EU foreign trade data as reported to the UN COMTRADE database.Notes: NR = Natural Resource based: UL= Unskilled Labor intensive; Cl =Capital intensive; SL= Skilled laborintensive.
At the top of the list in terms of value and rate of growth are television receivers (SITC.
7241). One should also note the presence of electric power machinery (SITC. 7221) ranked third
in terms of growth and value of exports. As discussed below, these are the sectors in which
MNCs, such as Thomson and ABB, and international production networks associated with them
play an important role.
In fact, foreign owned firms have been responsible for the identified above four features
of Poland's trade patterns during transition. We shall now turn to a detailed discussion that
provides empirical supports to this observation.

12
V. Foreign Firms and External Trade
Foreign owned firms have shaped the dynamics of Poland's trade on both export and
import side. Aggregate statistics in Table 4 reflect the growing importance of firms with foreign
participation in Poland's international trade. In 1994, such firms accounted for 21 percent of
Poland's total exports. This figure increased to 38 percent in 1996 and 48 percent in 1998. Thus,
these firms are now responsible for almost half of Polish exports. Between 1994 and 1998 the
value of their exports increased more than three-times from US$3.6 billion to US$13.5 billion.
Considering that FDI significantly increased over 1997-99, the share of foreign owned firms in
total exports is likely to expand. On the import side, this share was larger than that of exports in
each year over 1994-98, although it recorded lower growth rates. Foreign owned firms account
now for over half of Polish total imports.
Table 4: Exports and imports of foreign owned and locally owned firms, 1994-98 (in million of USdollars)
1994 1995 1996 1997 1998Foreign owned firms - exports 3.609 7,770 9'267 11,047 13,528Locally owned firms -exports 13.577 15,084 15.120 14.644 14,661Foreign owned firms - imports 7,101 10,758 15.674 21.120 25,122Locally owned firms - imports 14,331 18,260 21.418 21,133 21,878Foreign owned firms - share in total exports 21 34 38 43 48Locally owned firms - share in total imports 33 37 42 50 53Ratio of exports to imports 1994 1995 1996 1997 1998Foreign owned firms 50.8 72.2 59.1 52.3 53.8Locally owned firms 94.7 82.6 70.6 69.3 67.0
.All ffrms 80.2 78.8 65.7 60.8 60.0Source: Foreign Trade Research Institute (various years, Table 3.1) and own calculations.
For this reason, many observers accuse foreign owned firms of having an adverse effect
on the balance of trade because of their allegedly excessive imports. Indeed, exports by foreign
firm were lower than their imports in 1994-98. And so were exports by domestically owned
firms. But domestically owned firms paid for a larger share of their imports through their own
export earnings. However, the ratio of export earnings to imports was consistently falling from 95
percent in 1994 to 67 percent in 1998. While the value of this ratio for foreign firms was lower
and volatile, the difference between the two declined substantially over 1994-98. Nonetheless, the
difference remains high and indeed foreign owned firms made a significantly larger contribution
to the growing gap between exports and imports.
The relevance of this finding is not only limited but also misleading. Consider the
following. First, as was observed earlier, pent-up consumer demand attracted many foreign
investors during the initial stages of transition. These were mainly import substituting

13
investments. The increased imports of inputs were probably offset by lowver imports of final
products. Hence, their impact on trade balance was probably positive. Furthermore, provided that
tariffjumping was not the sole rationale behind these investments, their products are competitive
not only in domestic but also in international markets. Consider that industrial imports originating
in Poland's preferential partners (EU, EFTA and CEFTA) have largely unimpeded (i.e., duty-
free) access to the domestic market. Products produced domestically thus face fierce competition.
Combined with international marketing skills and resources, foreign owned firms could easily
switch to foreign markets, if domestic circumstances warrant it. Thus. whatever their initial
motivations in setting up production might be they may easily operate in other markets.
Second, sudden surge in FDI inflows usually results in spike of capital equipment
imports. Foreign owned firms contributed to the increase of these imports over 1993-98. They
purchased abroad US$3,944 mi,lion worth of capital goods in 1998. which constituted a 20
percent increase from US$3,274 million of capital goods imported in 1997 and a 263 percent
increase from US$1,086 million in 1994.18 Note that from the point of view of the balance-of-
payments situation, this deterioration in the current account position is offset by inflows into the
capital account.
Third, with the entry of foreign firms in retail trade, imports formerly regarded as
domestic have become attributable to foreign firms.
Last but not least, the propensity to import does not depend on ownership but on
availability of locally produced inputs and consumer products. If these are domestically available
at internationally competitive prices, a firm, no matter whether locally or foreign owned, will
refrain from more expensive imports. It takes time to find local cost-effective suppliers and thus
establish backward and forward linkages. The rule of thumb says that it usually takes around 2-3
years to develop local sourcing capacity. While a firm operating in a global network's supply
chains is usually 'condemned' to export as long as the next point downstream is not shifted to
Poland, domestic demand conditions shape export behavior of other foreign firms. Hence, the
crux of the matter is that efficiently run firms will display similar behavior in terms of their
decision to import since if a firm relies on more expensive domestic inputs, its capacity to
compete in international and domestic markets will be hampered.
On the other hand, however, the ability of the firm to export is likely to increase with
foreign ownership even without any changes in technology or organization of a firm. This
happens especially when foreign ownership offers access to marketing and production channels
Is Own calculations based on figures from Foreign Trade Research Institute (various years, Table 3.1).
14
of a parent company (see Section VI). Since establishing presence in foreign markets requires not
only marketing skills but also considerable resources, foreign ownership increases prospects for
exports. In addition, the change of ownership may be a necessary condition for a firm to become
a supplier in a global production and marketing network.
Hence, it should come as n1o surprise that foreign owned firms tend to be more export-
oriented than domestic ones and are therefore bound to make a relatively larger contribution to
reintegration of Poland into the world economy. Without tracing export behavior of the same set
of foreign and locally owned firms over time, it is impossible to make any generalizations. But
even if a foreign owner acquires a domestic firm, which was highly export-oriented, this usually
does not impede its capacity to export. To the contrary, it usually makes it even more competitive
in both domestic and external markets.
The comparison of export orientation of Polish and foreign owned firms provides strong
empirical support for this conclusion. The percentage of income of foreign owned firms derived
from exports fell between 1995-97 (from 15.3% to 13.9% and 13.8%) and increased in 1998
(14.1%). The corresponding figure for all firms operating in Poland declined each year over
1995-98 from 10.4 percent to 9 percent. But the export intensity (measured in terms of the share
of exports in total income) of foreign firms to export intensity of all firms was 1.47 in 1995, fell
to 1.42 in 1996 and then grew rather significantly to 1.48 in 1997 and 1.57 in 1998.19
Another indication of export orientation of foreign owned companies is that they have
already firmly established themselves among the largest firms and the largest exporters in Poland.
A,mong the 500 largest enterprises in Poland there were 144 firms with foreign capital (or 29
percent of the total) accounting for 46 percent of exports of the group in 1999. The average export
revenue earned by a firm with foreign capital was equal to US$224 million, as compared to
US$97 million for a locally owned company. On average, a firm with foreign capital increased its
export earnings by 14 percent between 1998 and 1999, while for domestic firms the
corresponding figure was only 2 percent. Moreover, firms with foreign capital wvere on average
more export oriented shipping abroad 27.5 percent of their output as compared with 17 percent
for locally owned firms.20
A similar picture of the growing presence of foreign firms among the largest exporters
emerges from the examination of Poland's top 100 exporters.71 The number of foreign owned
"' Own calculations based on figures from Main Statistical Office (various years).
20 Own calculations based on "Lista 500 najwiekszych przedsiebiorstw" (Top 500 enterprises), GazetaBankowa, April 2000.
21 Own calculations based on the "List of Poland's Top 100 Exporters in 1999" compiled by BOSS.

15
firms among top 100 grew from 33 in 1997 to 43 in 1998. Again, the export orientation of foreign
firms among top 100 as measured by the share of exports in their total sales (62% in 1998) was
significantly larger than that of locally owned firms (49%).
Foreign owned firms have also contributed to the increased concentration of Polish
exports as measured by the share of largest exporters in Poland's total exports. The share of
Poland's top 100 exporters in total exports increased from 35 percent in 1996 to 39 percent in
1998. The share of foreign owned firms in the total exports of the group was 40 percent in 1998.
However, if exporters of such primary commodities as coal, sulfur and copper are excluded, this
figure jumps up to 57 percent.
Foreign owned firms have largely influenced or even triggered positive change in factor
intensities of Polish exports towards skilled labor intensive and capital intensive products. A
review of Poland's 10 largest capital intensive and 10 largest skilled labor intensive products
exported to the EU also provides links to the activities of foreign firms (see Appendix Table 1).
For instance, FIAT Poland seems to have contributed to the ten-fold increase in the value of
exports of motor vehicles between 1990 and 1998, Phillips to the sales of electric lamps,
Thomson to exports of television sets, just to name a few.
Last but not least, foreign firms have made a large contribution to the integration of the
Polish economy into international markets. Two features stand out-their abilitY to compete in
multiple markets contributing to geographical diversity and their presence in expanding rather
than contracting markets in the EU. Although foreign firms tend to concentrate mostly on EU
markets, they have already displayed flexibility in terms of geographical orientation of their trade.
The share of EU markets in exports of foreign owned firms fell from 78 percent in 1995 to 75
percent in 1996 and 71 percent in 1997 and increased to 75 percent in 1998 (Appendix Table 2).
There are, however, clear signs that foreign owned firms contribute to the increase in
geographical diversification of Polish exports and Poland's integration into the economies of
other EU-candidates. For instance, in 1995 the share of foreign owned firms in CEFTA-oriented
exports was 19 percent as compared with their share of 34 percent in Poland's total exports. In
1998 the corresponding shares were 45 percent and 48 percent. The share of these markets in
exports of foreign owned firms rose from 3 percent in 1995 to 7 percent in 1998. The
corresponding figures for imports were 4 and 6 percent. It appears that integration within various
production and marketing networks explains some portion of this trade. For instance, Daewoo
accounts for some trade in automotive parts between Poland and Romania and Volkswagen for
this trade with the Czech Republic. The paradox is that MNCs may succeed where CMEA failed,
i.e., in integrating these economies.
16
Two other developments that have contributed to the fall in Poland's geographical
concentration of trade are noteworthy. First, the share of Germany in exports of foreign owned
firms declined from 43 percent of their total exports in 1995 to 36 percent in 1997 and increased
to 38 percent in 1998. Second, there are indications that Poland has become a regional hub for
some foreign owned firms. Although the share of Russia fell in the crisis year of 1998, it merely
contracted to its 1995 level (4%). The share of Ukraine doubled in 1996 and remained flat at
about 2 percent.
Poland's export potential and competitiveness are likely to be enhanced by the recent
increase in FDI in service sectors. While services do not increase exports of goods, they indirectly
affect trade by lowering transaction costs and attracting foreign investors in manufacturing. Note
that foreign companies accounted for 62 percent of total investment outlays in wholesale and
retail trade in Poland and for 59 percent in the financial sector in 199722 With the progressive
opening of the banking sector, the importance of FDI in this sector has considerably increased.
The improvement in the quality of services together with the progress in structural
reforms increasing contestability of domestic markets to producers and investors alike has also a
profound impact on the expansion in intra-product trade based on fragmentation of production.
VI. Participation in EU-based production and distribution networks
Trade in industrial parts is the most rapidly growing component of global trade increasing
faster over the last decade than trade in finished manufactures. According to a very conservative
estimate, global trade in parts and components, amountilg to arouLnd US$800 billion annuallk.
accounlts for around 30 percent of world trade in manufactures (Yeats 1998). This
internationalization of production has been taking place within industries such as automobiles.
television and radio receivers, sewing machines, office equipment, electrical machinery, power
and machine tools, typewriters, cameras and watches (USITC 1996).
The collapse of central planning removed systemic barriers to integration ofCEECs firn-ms
into international markets. Until then, CEECs remained outside the reach of the globalization
process based on production fragmentation or sharing. One would expect that with the transition
to competitive markets locally and opening to the world, CEECs stand a good chance of taking
advantage of a 'global disintegration' of production.
Incorporation of local producers into production and marketing networks can extend
significant benefits both to the country involved, such as Poland, and to MNCs. For the latter, this
22 All data from Foreign Trade Research Institute (1999, p. 38).

17
offers a wider menu of choices in their strategies to expand the position in global markets, as they
may become more competitive thanks to lower costs of moving some production fragments to
CEECs. For the former, it yields several advantages: it is usually accompanied by transfer of
technology and managerial know how with potentially significant demonstration effects. It gives
firms located in Poland direct access to larger markets that allow exploiting economies of scale. It
boosts exports without firms incurring marketing costs and provides greater stability in earnings
thanks to a global reach of a "parent" company. The expansion in network-driven trade
contributes to boosting productivity and integrates the national economy into global markets.
Participation in marketing and production networks may entail two different forms of
export behavior related to the position assigned to a firm in division of labor. The first form
consists of the production by a foreign owned firm of finished products that the parent company
distributes in regional or world markets. This is the case of the so-called horizontal FDI. The
second form involves the participation of a foreign owned firm located in Poland in a supply
chain of the parent company. In the theoretical literature, this is usually called vertical FDI.3
Without access to firms' usually confidential data, it is very difficult to assess the scope of trade
associated with the first form, i.e., supplies of finished products to the parent company. As for the
second form, one may suspect that foreign owned firms account for most, if not all, of trade
associated with the networks discussed below.
Signs abound that Polish producers are becoming part of this rapidly emerging global
division of labor based on production fragmentation. Like highly developed countries, Poland has
also experienced a faster growth in trade of parts and components than in trade of manufactures.
Total exports of parts and components grew at an average rate of 33 percent per annum over
1995-98 and their share in total exports of manufactures increased from 7 to 10 percent over this
period. Imports grew even faster at 37 percent per year and their share in total imports increased
from 9 to 12 percent. EU has shaped the dynamics of this trade: its share in Poland's trade
turnover rose from around 55 percent in 1993 to 75 percent in 1998.
To fully capture this trade, we identify parts, components and final products in three
networks usually organized around MNCs-automotive network, telecommunication equipment
jointly analyzed with office equipment and automatic data processing machines (hereafter
23 Strictly speaking, the theoretical literature uses the term horizontal MNCs to describe multi-plant firmsthat replicate roughly the same activities in many locations. Models of horizontal FDI have beendeveloped by Markusen (1984), Horstmann and Markusen (1987, 1992) and Markusen and Venables(1997, 1998). Vertical MNCs, on the other hand, are defined as firms that geographically fragment theproduction process into stages, typically on the basis of factor intensities. The literature on verticalMNCs includes Helpman (1984) and Helpman and Krugman (1985).

18
'information revolution' network) and furniture network.24 Except for the furniture network as a
rule dominated by unskilled labor intensive products, parts and components as well as final
products of the other networks are technology and skilled labor intensive.
Table 5: Trade within production and marketing networks, 1993, 1997 and 1998 (in millionsof US dollars)
Information Revolution | Automotive
1993 1997 1998 1993 1997 1998
Final products exports 11 323 562 536 1.074 1,219Exports of parts and components 78 292 294 74 380 489Imports of parts and components 256 675 784 355 1,794 1,506Final products imports 260 750 954 1.014 1.899 1,836Final exports minus parts and components imports -245 -352 -222 182 -720 -287Memo: share of final products, components and parts in trade with the EUIn manufactured exports (in percent) 1.3 5 5.9 9.2 11.7 11. lIn manufactured imports (in percent) 5 5.8 6.5 13.2 15.1 12.5
Furniture TOTAL
1993 1997 1998 1993 1997 1998
Final products exports 519 1072 1,223 1.066 2.469 3.004Exports of parts and components 77 226 287 229 898 1.070Imports of parts and components 35 94 126 646 2.563 2,416Final products imports 85 155 187 1.359 2.804 2,977Final exports minus parts and components imports 484 978 1,097 421 -94 588Memo: share of final products, components and parts in trade with the EUIn manufactured exports (in percent) j 9 10.5 10.5 19.5 27.1 28.2In manufactured imports (in percent) 1.2 1 1.2 19.3 22 20.2
Source: Kaminski and Ng (2001).
These networks have played a growing role in Poland's trade with the EU. The share of
these networks in Poland's exports of manufactures to the EU rose from 20 percent in 1993 to 27
percent in 1997 and 28 percent in 1998 (Table 5). The corresponding figures for imports were 19
percent in 1993, 22 and 20 percent in 1997 and 1998, respectively. The value of aggregate
exports of final products, components and parts of these networks increased almost three-fold
over 1993-97 and by 21 percent in 1998, while the value of imports grew three-fold and 0.5
percent in the same period.
The furniture network is included in the study because large retailers in the EU shape
both production and trade in this sector. In contrast to car manufacturing, which usually involves
either foreign greenfield investment or equity investment, participation in furniture networks
derives mainly from outsourcing, albeit not exclusively. This network has been traditionally the
largest foreign currency earner in Poland. It brought US$1 billion in 1997 and US$1.2 billion in
24 For a list of product categories falling into each network, see Kaminski and Ng (2000).

19
1998 with exports of parts and components accounting for a larger share of the surplus. Its share
in total network exports of parts and components rose from 42 percent in 1997 to 46 percent in
1998.
The information revolution network embodies hardware of the current information
revolution. The parts and components of the 'information technology' networks have driven
foreign trade of highly developed countries with exports of office machinery displaying the
fastest annual growth of 15.9 percent over 1978-95, followed by telecommunications growing at
11.5 percent over this period (Yeats 1998).
In Poland telecommunications and recording equipment has almost exclusively driven the
trade dynamics of this network especially on the export side. The shares of the other "sub-
network"-office equipment and automatic data processing machines-in trade of the
information revolution network were 1.2 percent in exports of final products in 1998, 6.1 percent
in exports of parts and components, 24.4 percent in imports of components and parts, and 6.6
percent of imports of final products.
The information revolution network has displayed the largest grow th in network-related
Poland's trade with the EU not only over 1993-97 but also in 1998. The value of exports of final
products increased 29-times over 1993-97 and 74 percent in 1998 alone, albeit from a low base,
and the share of all products of this network in networks total exports increased from 7 percent in
1993 to 18 percent in 1997 and to 21 percent in 1998. The value of imports in 1998 increased 22
percent and their share rose from 27 to 32 percent indicating ongoing modernization of the Polish
economy. Furthermore, the contraction in the difference between final exports and imports of
parts and components from US$720 million in 1997 to US$287 million in 1998 suggests a
growing share of domestic suppliers within this network (Table 5).
As for the automotive sector, globalization based on production fragmentation has been
the major driving force behind transformation of auto industry worldwide in the 1990s. It has also
deeply affected the ways in which this sector has changed in Poland, albeit the foreign trade
policy vis-a-vis this sector seems to have distorted its evolution. In contrast to other Central
European countries participating in this network (i.e., Czech Republic, Hungary, Slovakia and
Slovenia), the value of exports of final products in the automotive network has been below the
value of imports of parts and components. Poland relied mostly on assembling motor vehicles as
well as piston engines from imported parts for domestic consumption rather than for shipments
within the network. This was due to high tariffs and other subsidies provided to investors in this
sector during the initial stages of transition.

20
By 1998, however, some negative impacts of initially high tariffs and subsidies began to
retreat. Exports of parts and components grew 29 percent and their share in networks exports
increased from 42 percent in 1997 to 46 percent in 1998. Aggregate exports rose 18 percent
whereas imports contracted by 10 percent. Thus it appears that distortions induced by a high
effective rate of protection of final products have been alleviated by the increase of domestic
production of parts and components.
To assess the scope of MNCs present in Poland in network exports we look at the data on
the weight of sectors in exports generated by foreign firms (Table 6). Note that two sectors-
electrical machinery and appliances and transport equipment-accounting together in 1998 for 40
percent of exports by foreign firms largely fall within networks. As can be seen from data in
Table 6, the share of foreign owned firms in exports of electrical equipment and transport
equipment amounted in 1998 to 65 percent and 70 percent respectively.
Exports of transport equipment as a rule take place within automotive networks organized
around large MNCs. While some firms involved in information revolution network are in the
sector of electrical equipment, machinery and appliances (e.g., television sets and tubes). it would
be difficult to separate them. Total exports of electrical machinery alone rose 31 percent in 1998
and the value of export specialization index exceeded unity. It seems that this impressive
improvement can be attributed to the incorporation of local producers in a global system of
production and marketing. According to a very conservative estimate, their share in EU-oriented
exports of manufactures increased from around 20 percent in 1993 to 30 percent in 1998. The
share of foreign firms of 43 percent is also higll (and growing) in miscellaneous manufactured
articles, which includes among others furniture.
However, like in the case of electrical machinery and transport equipmelnt, it is
impossible to directly attribute export activity to foreign owned firms. Some insights can be
gained from the discussion of specific examples of how the presence of MNCs contributes to
Poland's participation in global production and distribution networks. The first example presents
a case study of Delphi Automotive Systems, which is relevant to the automotive netwvork.
Another example focuses on investment projects undertaken by Thomson and relates directly to
the information revolution network. The last example relates to the case of ABB.
Table 6: Exports of foreign owned firms by sector, 1996-98 (in million of US dollars andpercent)
Exports of foreign Share in total Share in totalowned firms exports of foreign
(in million of US (in percent) owned firmsdollars) (i ecn) (in percent)
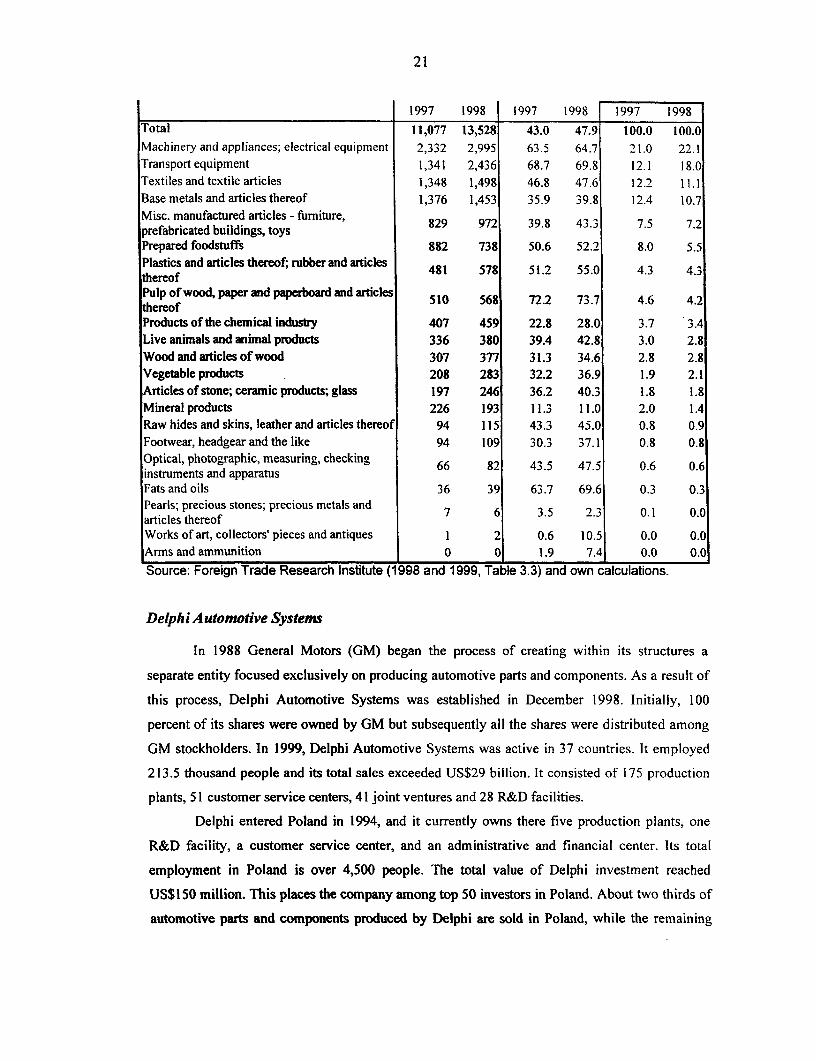
21
1997 1998 1997 1998 1997 1998Total 11,077 13,528 43.0 47.9 100.0 100.0Machinery and appliances; electrical equipment 2,332 2,995 63.5 64.7 21.0 22.1Transport equipment 1,341 2,436 68.7 69.8 12.1 18.0Textiles and textile articles 1,348 1,498 46.8 47.6 12.2 11.1Base metals and articles thereof 1,376 1,453 35.9 39.8 12.4 10.7Misc. manufactured articles - furniture, 829 972 39.8 43.3 7.5 7.2prefabricated buildings, toysPrepared foodstuffs 882 738 50.6 52.2 8.0 5.5Plastics and articles thereof; rubber and articles 481 578 51.2 55.0 4.3 4.3thereofPulp of wood, paper and paperboard and articles 510 568 72.2 73.7 4.6 4.2thereofProducts of the chemical industy 407 459 22.8 28.0 3.7 3.4Live animals and animal products 336 380 39.4 42.8 3.0 2.8Woodandarticlesofwood 307 377 31.3 34.6 2.8 2.8Vegetable products 208 283 32.2 36.9 1.9 2.1Articles of stone; ceramic products; glass 197 246 36.2 40.3 1.8 1.8Mineral products 226 193 11.3 11.0 2.0 1.4Raw hides and skins, leather and articles thereof 94 115 43.3 45.0 0.8 0.9Footwear, headgear and the like 94 109 30.3 37.1 0.8 0.8Optical, photographic, measuring, checking 66 82 43.5 47.5 0.6 0.6instruments and apparatusFats and oils 36 39 63.7 69.6 0.3 0.3Pearls; precious stones; precious metals and 7 6 3.5 2.3 0.1 0.0articles thereofWorks of art, collectors' pieces and antiques 1 2 0.6 10.5 0.0 0.0Arms and ammunition 0 0 1.9 7.4 0.0 0.0Source: Foreign Trade Research Institute (1998 and 1999, Table 3.3) and own calculations.
Delphi Automotive Systems
In 1988 General Motors (GM) began the process of creating within its structures a
separate entity focused exclusively on producing automotive parts and components. As a result of
this process, Delphi Automotive Systems was established in December 1998. Initially, 100
percent of its shares were owned by GM but subsequently all the shares were distributed among
GM stockholders. In 1999, Delphi Automotive Systems was active in 37 countries. It employed
213.5 thousand people and its total sales exceeded US$29 billion. It consisted of 175 production
plants, 51 customer service centers, 41 joint ventures and 28 R&D facilities.
Delphi entered Poland in 1994, and it currently owns there five production plants, one
R&D facility, a customer service center, and an administrative and financial center. Its total
employment in Poland is over 4,500 people. The total value of Delphi investment reached
US$150 million. This places the company among top 50 investors in Poland. About two thirds of
automotive parts and components produced by Delphi are sold in Poland, while the remaining

22
share is exported to Germany, Italy, Turkey, France, UK, Sweden and Russia. Parts and
components produced in Poland are sold to Daewoo, DaimlerChrysler. Isuzu, Rover, GM, Ford,
Volkswagen, Volvo, Fiat, and Renault. The company is planning on increasing its production as
well as the share exported in the near future.
Delphi plants in Poland have earned numerous ISO 9000, 9001 and 14001 quality
certifications. In May 2000, Delphi opened an R&D center in Krakow where it currently employs
51 engineers but plans to expand its staff to 350 in 2005.
Thomson
In 1991, Thomson bought 51% of a Polish TV tube and component manufacturer
Polkolor located in Piaseczno near Warsaw. Later on, Thomson also purchased a Polish TV
producer in Zyrardow. In 2000, Piaseczno produced 4.6 million TV tubes, 3.1 million of which
were exported. Piaseczno tubes may be found in Panasonic, Philips and Matsushita TV sets. In
Poland, the Zyrardow plant and Daewoo also manufacture TV sets with Piaseczno tubes. The
Piaseczno plant received ISO 9000 as well as ISO 14000 certificates. In 1994, it earned Thomson
Corporate Quality Trophy, which is awarded to a factory that achieved the highest quality
standard within the Thomson Corporation.
ABB
ABB was formed in 1988 of two electrical engineering companies: Swedish ASEA and
Swiss Brown Boveri. Today ABB is present in 140 countries where it employs 164 thousand
people and its revenues amount to US$24 billion. Both ASEA and Brown Boveri were present in
Poland in the 1920s and 1930s. However, after World War II they had to limit their activities
there to licensing. One of the success stories during that period was a licensing contract with
Zamech, a company located in Elblag. ABB became a majority shareholder of Zamech shortly
after Poland's political and economic transition had begun. Also in 1990, a Wroclaw company
Domel joined the ABB group. Today, 16 companies located in Poland belong to the ABB family.
In 1999, they employed 4,423 people and their revenues amounted to $383 million.
The ABB group follows the pattern of international division of labor. Namely, each
company within the group produces final goods that are sold all over the world through the ABB
distribution networks. And thus for instance, a Polish member of the group, ABB Elpar is the
worldwide supplier of high voltage switchgear.
About twenty percent of products manufactured by ABB in Poland are exported, mainly
to the EU but also to places located as far as New Zealand and Australia. ABB imports about

23
twenty percent of its inputs. The growing area of activity include exports of services and R&D.
Recently, ABB has opened an R&D center in Krakow.
ABB Elta is the first company in Poland to possess a certificate of integrated quality and
environmental management system complying with ISO 9001 and 14001, for the whole scope of
activities. ABB has required ISO 9000 certificates from its local suppliers and in the future it may
also require environmental management certifications.
VIl. Conclusions
Technological developments in recent decades have led to an increasing importance of
international division of labor and creation of global production and distribution networks.N-INCs
have been a major force driving these developments. Integration into the production and
marketing arrangements of the multinational corporations may offer manv benefits to transition
economies, which after a long period of isolation liberalized their trade and investment regimes.
This paper studies the growing importance of global production networks and the role of
MNCs in integrating a host country into the international division of labor in the context of
Poland. It provides evidence of Poland's increasing participation in global production and
distribution networks that is taking place through FDI inflows. It concludes that thanks to a large
volume of FDI inflows expected in the near future, Poland's exports driven by production
fragmentation will continue to expand at even faster rates than those observed in recent years.

24
References
Aitken, Brian and Ann Harrison. 1999. "Do Domestic Firms Benefit from Direct ForeignInvestment," American Economic Review, 89(3): 605-617.
Arndt, Sven and Henryk Kierzkowski. 2000. 'Introduction' in S. Arndt and H. Kierzkowski, ed.,Fragmentation and International Trade, Oxford University Press, Oxford and New York.
Aturupane, Chonira, Simeon Djankov and Bernard Hoekman. 1997. "Determinants of Intra-Industry Trade between East and Wet Europe," Policy Research Working Paper 1850,The World Bank, Development Research Group, November.
Blomstrom, Magnus and E. Wolff. 1994. "Multinational Corporations and ProductivityConvergence in Mexico" in W. Baumol, R. Nelson and E. Wolff, eds. Convergence ofProductivity. Cross-National Studies and Historical Evidence. Oxford: Oxford UniversityPress.
Borrus, Michael and John Zysman. 1997. "Globalization with Borders: The Rise of Wintelism asthe Future of Industrial Competition," Industry and Innovation, Vol. 4. No. 2, December.
Dunning, John H. 1993. Multinational Enterprises and the Global Economyv (Addison-WesleyPublishing Company, Wokingham, England).
EBRD. 1994 and 1998. Transition Report, European Bank for Reconstruction and Development,London.
Feenstra, Robert. 1998. "Integration of Trade and Disintegration of Production in the GlobalEconomy," Journal of Economic Perspectives. 12(4): 31-50.
Foreign Trade Research Institute. Various years. Foreign Investment in Poland Warsaw.
Haddad, Mona and Ann Harrison. 1993. "Are there positive spillovers from direct foreign.investment? Evidence from Morocco," Journal of Development Economics, 42: 51-74.
Helpman, Elhanan. 1984. "A Simple Theory of Trade with Multinational Corporations,"Journalof Political Economy 92: 451-471.
Helpman, Elhanan and Paul Krugman. 1985. Trade and Market Structure. Cambridge: MITPress.
Horstmann, Ignatius and James Markusen. 1987. "Strategic Investments and the Development ofMultinationals," International Economic Review 28: 109-121.
Horstmann, Ignatius and James Markusen. 1992. "Endogenous Market Structures in InternationalTrade," Journal of International Economics 32: 109-129.
Hufbauer, Gary C., 1970. "The Impact of National Characteristics and Technology on theCommodity Composition of Trade in Manufactured Goods," in Raymond Vernon, ed.,The Technology Effect in International Trade, Columbia University Press, New York(145-231).
Kaminski, Bartlomiej. 1998. "Poland's Transition from the Perspective of Performance in EUMarkets," Communist Economies & Economic Transformation, Vol. 10. No. 2 (217-239).
Kaminski, Bartlomiej. 2000. "Industrial Restructuring as Revealed in Hungary's Pattern ofIntegration into European Markets," Europe-Asia Studies, Vol. 52, No. 3 (457-487).

25
Kaminski, Bartlomiej and Francis Ng. 2001. "Trade and Production Fragmentation: CentralEuropean Economies in EU Networks of Production and Marketing," processed, TheWorld Bank, Washington DC.
Kaminski, Bartlomiej and M. Riboud. 2000. "Foreign Investment, Transition andCompetitiveness: The Evidence from Hungary," World Bank Technical Paper No. 453.ECA-PREM Management Series, The World Bank, Washington D.C.
Kierzkowski, Henryk. 2000. "Joining the Global Economy: Experience and Prospects of theTransition Economies," in S. Arndt and H. Kierzkowski, eds., Fragmentation andInternational Trade, Oxford University Press, Oxford and New York
Kraay, Aart, Soloaga Isidro and James Tybout. 2000. "Product Quality, Productive Efficiency,and International Technology Diffusion: Evidence from Plant-Level Panel Data. TheWorld Bank. Mimeo.
Krugman, Paul. 1994. Rethinking International Trade, The MIT Press, Cambridge, Mass.
Main Statistical Office. 1999. Dzialalnosc gospodarcza spolek z udzialem kapitalu zagranicznegow 1998 roku [Economic activity of foreign investment companies in 1998], Warsaw.
Markusen, James. 1984. "Multinationals, Multi-Plant Economies, and the Gains from Trade,"Journal of International Economics, 16: 205-226.
Markusen, James R. 1995. "The boundaries of multinational enterprises and the theory ofinternational trade," Journal of Economic Perspectives, 9: 169-189.
Markusen, James and Anthony Venables. 1997. "The Role of Multinational Firms in the Wage-Gap Debate," Review of International Economics 5, 435-451.
Markusen, James and Anthony Venables. 1998. "Multinational Firms and the New TradeTheory," Journal of International Economics, 46: 183-203.
Meyer, Klaus E. 1998. Direct Investment in Economies in Transition, Edward EIgar, Cheltenham,UK and Northampton, Mass.
Smarzynska, Beata K. 1999. "Composition of Foreign Direct Investment and Protection ofIntellectual Property Rights in Transition Economies," Centre for Economic PolicyResearch Working Paper No. 2228.
Smarzynska, Beata K. 2000. "Technological Leadership and Foreign Investors' Choice of EntryMode" World Bank Policy Research Working Paper No. 2314.
USITC. 1996. Production Sharing: Use of US. Components and Materials in Foreign AssemblyOperations, 1991-1994, US International Trade Commission Publication 2966,Washington, D.C.
Yeats, Alexander J. 1998. "Just How Big Is Global Production Sharing?" World Bank PolicyResearch Working Paper No. 1871.

26
Appendix Table 1: Top 10 Products in EU-oriented exports of capital intensive products and skilledlabor intensive products, 1990, 1996-98
Factor Intensity Product Group 1990 1996 1997 1998
Capital intensive: (Cl)
7231 Insulated Wire, Cable 117 267 236 358
7221 Electric Power Machinery 43 121 186 230
7293 Transistors, Valves, etc. 5 157 167 194
7222 Switchgear, etc. 21 117 175 176
7292 Electric Lamps, Bulbs 16 126 140 163
7199 Machine Parts, Accessories Nes 30 110 118 142
7291 Batteries, Accumulators 2 34 87 136
7249 Telecomm Equipment Nes 17 94 130 125
7193 Mechanical Handling Equipment 20 92 108 123
5619 FertilizersNes 38 88 102 117
Total Above Top 10 Capital intensive Products 310 1205 1449 1764
% of all Capital intensive products 24.0 45.0 49.7 52.3
Skilled Labor: (SL)
7321 Pass Motor Veh Exc Buses 80 771 694 859
7241 Television Receivers 7 95 297 511
7328 Motor Vehicle Parts Nes 23 162 255 349
7323 Lorries, Trucks 3 186 313 304
6989 Other Base Metal Manufactures 55 190 201 258
6911 Structures, Parts Iron, Steel 63 297 255 255
6734 Iron, Steel Big Sections Etc. 103 104 123 169
6291 Rubber Tires, Tubes 29 130 136 169
7250 Domestic Electric Equipment 45 89 101 125
6415 Paper Etc In Bulk Nes 26 61 90 99
Total Above Top 10 Skilled Labor intensive Products 434 2085 2465 3099
% of all Skilled Labor intensive Products 42.8 59.2 62.1 63.9

27
Appendix Table 2: Direction exports of foreign owned firms and their shares in Poland's totalexports, 1995-98
Value of exports of foreign owned Share of total exports of exports accounted for byfirms foreign owned firms foreg owned firms
(in millions of US dollars) (in percent) foreign owned firms
1995 1997 1998 1995 1997 1998 1995 1997 1998Total 7,876 11,077 13,528 100 100 100 34 43 48EU 6,130 7,912 10,094 78 71 75 38 48 52Other 748 1,038 1,167 9 9 9 28 39 45FSU 613 1,262 1,165 8 11 9 24 28 30CEFTA 232 688 913 3 6 7 19 40 45EFTA 154 177 189 2 2 1 43 45 40Germany 3,380 3,967 5,155 43 36 38 39 47 50Italy 705 1,116 1,249 9 10 9 63 74 75France 272 534 728 3 5 5 33 47 55Netherlands 502 531 683 6 5 5 39 44 51UK 271 460 596 3 4 4 30 48 54Russia 354 691 527 4 6 4 28 32 33Czech Rep 139 335 454 2 3 3 20 37 44Belgium 160 266 363 2 2 3 29 48 52USA 161 292 341 2 3 3 26 44 45Sweden 234 260 331 3 2 2 40 43 49Denmark 202 245 298 3 2 2 29 32 33Austria 183 198 2281 2 2 2 37 41 41Ukraine 117 202 223 1 2 2 16 17 21
Source: Foreign Trade Research Institute (various years), Foreign Investments in Poland,Warsaw, Table 3.2 and own calculations.


Policy Research Working Paper Series
ContactTitle Author Date for paper
WPS2628 Monopoly Power and Distribution in Hanan G. Jacoby June 2001 P. KokilaFragmented Markets: The Case of Rinku Murgai 33716Groundwater Saeed Ur Rehman
WPS2629 Bridging the Digital Divide: How George R. G. Clarke July 2001 P. Sintim-AboagyeEnterprise Ownership and Foreign 37644Competition Affect Internet Accessin Eastern Europe and Central Asia
WPS2630 Parallel Imports of Pharmaceutical Mattias Ganslandt July 2001 L. TabadaProducts in the European Union 36896
WPS2631 Pension Reform in Hungary: Roberta Rocha July 2001 L. GrossA Preliminary Assessment Dimitri Vittas 37030
WPS2632 Human Capital and Growth: The Sebastien Dessus July 2001 K. MazoRecovered Role of Education Systems 39744
WPS2633 Bank Privatization in Argentina: George R. G. Clarke July 2001 P. Sintim-AboagyeA Model of Political Constraints and Robert Cull 37644Differential Outcomes
WPS2634 Chile's Regional Arrangements and Glenn W. Harrison July 2001 L. Tabadathe Free Trade Agreement of the Thomas F. Rutherford 36896Americas: The Importance of Market David G. TarrAccess
WPS2635 Optimal Use of Carbon Sequestration Franck Lecocq July 2001 V. Soukhanovin a Global Climate Change Strategy: Kenneth Chomitz 35721Is There a Wooden Bridge to a CleanEnergy Future?
WPS2636 Processes, Information, and Javier Campos-M6ndez July 2001 G. Chenet-SmithAccounting Gaps in the Regulation Antonio Estache 36370of Argentina's Private Railways Lourdes Trujillo
WPS2637 Technical Efficiency Gains from Antonio Estache July 2001 G. Chenet-SmithPort Reform: The Potential for Marianela Gonzalez 36370Yardstick Competition in Mexico Lourdes Trujillo
WPS2638 On Financing Global and International Todd Sandler July 2001 S. KpundehPublic Goods
WPS2639 Public Policy toward Nongovernmental William Jack July 2001 H. SladovichOrganizations in Developing Countries 37698
WPS2640 Where Has All the Foreign Investment Harry G. Broadman July 2001 S. CraigGone in Russia? Francesca Recanatini 33160

Policy Research Working Paper Series
ContactTitle Author Date for paper
WPS2641 Is Russia Restructuring? New Harry G. Broadman July 2001 S. CraigEvidence on Job Creation and Francesca Recanatini 33160Destruction
WPS2642 Does the Exchange Rate Regime Ilker Doma, July 2001 A. CarcaniAffect Macroeconomic Performance? Kyles Peters 30241Evidence from Transition Economies Yevgeny Yuzefovich
WPS2643 Dollarization and Semi-Dollarization in Paul Beckerman July 2001 P. HoltEcuador 37707
WPS2644 Local Institutions, Poverty, and Christiaan Grootaert July 2001 G. OchiengHousehold Welfare in Bolivia Deepa Narayan 31123
WPS2645 Inequality Convergence Martin Ravallion July 2001 P. Sader33902