foreign exchange risk management by swedish and...
TRANSCRIPT

Pacific-Basin Finance Journal 13 (2005) 343–366
www.elsevier.com/locate/econbase
Foreign exchange risk management by Swedish and
Korean nonfinancial firms: A comparative survey
Bengt Pramborg*
Stockholm University School of Business, SE-106 91 Stockholm, Sweden
Received 3 September 2003; accepted 23 April 2004
Available online 30 December 2004
Abstract
This study compares the hedging practices of Swedish and Korean nonfinancial firms. Our
findings suggest that the aim of hedging differed between firms in the two countries. Korean firms
mostly focused on reducing fluctuations in cash flows, while Swedish firms more commonly
emphasized reducing fluctuations of accounting numbers. The proportion of firms that used
derivatives was significantly lower in the Korean than in the Swedish sample, a finding that may
stem from the relative immaturity of the Korean derivatives markets. The evidence suggests that
Korean firms hedged as much as Swedish firms but substituted foreign debt for derivatives.
Furthermore, Korean firms appeared to be less rigorous than Swedish firms in overseeing risk
management activity. Finally, a large proportion of firms in both countries used a profit-based
approach to evaluating the risk management function.
D 2004 Elsevier B.V. All rights reserved.
JEL classification: F23; F31
Keywords: Hedging; Foreign exchange exposure; Risk management
1. Introduction
This paper uses survey evidence to compare Swedish and Korean firms’ foreign
exchange risk management practices. This is of interest because, as Lel’s (2003) findings
suggest, country-level and internal corporate governance structures and a country’s degree
of financial market development influence the hedging decisions of corporations. Notably,
0927-538X/$
doi:10.1016/j.
* Tel.: +46 8
E-mail add
- see front matter D 2004 Elsevier B.V. All rights reserved.
pacfin.2004.04.003
674 7427; fax: +46 8 674 7440.
ress: [email protected].

B. Pramborg / Pacific-Basin Finance Journal 13 (2005) 343–366344
La Porta et al. (1998) reported that Korea lags Sweden in terms of law enforcement,
antidirector rights, cash-flow rights, and accounting standards. These differences may
cause Korean and Swedish firms to adopt different hedging policies and practices; by
studying these, we may improve our understanding of firms’ risk management practices.
Several methods are available for managing foreign exchange exposure, including the
use of financial derivatives such as forward contracts and currency options, foreign-
denominated debt, and internal methods such as leading and lagging. Prior survey
evidence pertaining to hedging primarily focused on the use of derivatives by firms in
local markets,1 while a few studies, notably those of Berkman et al. (1997), Alkeback and
Hagelin (1999), Bodnar and Gebhardt (1999), Sheedy (2001), and Bodnar et al. (2003),
also compared derivatives use between countries. Recent studies have presented survey
evidence pertaining to other hedging techniques, such as the use of foreign-denominated
debt and internal hedging techniques. Such studies include those of Hakkarainen et al.
(1998), who surveyed Finnish firms; Joseph (2000), who analyzed British firms; Marshall
(2000), who analyzed regional differences between Asia-Pacific and Western multinational
corporations (MNCs); and Allayannis et al. (2003), who investigated the hedging practices
of East Asian firms during the recent East Asian financial crisis.
This paper adds to existing research by analyzing country differences in foreign
exchange risk-management practices between Swedish and Korean firms. The focus is on
descriptive data comparing hedging practices; these data are complemented by direct tests
in order to investigate the potential of firm characteristics to explain differences. Korea and
Sweden are both export-oriented countries, heavily dependent on foreign trade, suggesting
that their markets would be suitable for this type of study. The countries’ markets differ in
other ways, such as their stage of economic and financial development. While Swedish
derivatives markets are well developed, comparable Korean markets have been heavily
regulated until very recently; this may have reduced firms access to, and consequently,
knowledge of derivative instruments.
Use of derivatives and other hedging techniques are investigated, using survey evidence
pertaining to the foreign exchange exposure and hedging practices of 163 firms in the two
countries that replied to a survey distributed in September 2000. In contrast to Marshall
(2000), who investigated only large multinational corporations, we sent our survey to all
nonfinancial firms listed on the major stock exchange in each country. In view of the
findings of Lel (2003) and Bartram et al. (2003), this is an important difference. Lel (2003)
investigated large, international firms listed via ADRs in the US and found that country-
specific factors were relatively more important than firm-specific factors in explaining the
probability of hedging. Bartram et al. (2003) used a larger sample including smaller firms
and found that firm-specific factors were relatively more important than country-specific
factors. The survey procedure used in our research produced a representative sample of
both large and small firms in Korea and Sweden, which may enhance our general
understanding of firms’ hedging practices.
Our findings suggest that while there are similarities between the hedging practices of
firms in the two countries, there are notable differences as well. Firms in both countries
1 See Batten et al. (1993), Nance et al. (1993), Bodnar et al. (1996, 1998), Berkman et al. (1997), and Alkeback
et al. (2004).

B. Pramborg / Pacific-Basin Finance Journal 13 (2005) 343–366 345
were equally likely to decide to hedge foreign exchange exposure, this decision being
dependent of level of exposure and firm size. However, the aim of hedging activities
differed. Korean firms were more likely to focus on minimizing fluctuations of cash flow
rather than accounting earnings, while Swedish firms were more likely to focus on
accounting numbers. This is in line with the findings of Alkeback and Hagelin (1999)
and Alkeback et al. (in press) concerning Swedish firms. Perhaps our most striking
finding is that the proportion of firms that used derivatives was significantly lower in the
Korean than in the Swedish sample. This could not be accounted for by firm
characteristics such as foreign exchange exposure, size, liquidity, or leverage. A possible
explanation for this difference is that derivatives markets in Korea have been heavily
regulated until very recently, which would support the finding of Lel (2003) that the
degree of financial market development influences hedging policies. In line with this,
Korean firms were more likely to use foreign-denominated debt and used it more
extensively than did Swedish firms, suggesting a substitution effect. Furthermore, Korean
firms were less rigorous in monitoring their risk exposure positions than were Swedish
firms. This is in accordance with the findings of Sheedy (2001) and suggests that Asian
firms lag Western firms in this regard. An absolute majority of firms in both countries
used a profit-based approach to evaluate the risk management function. This contradicts
theoretical assumptions and adds to the findings of Bodnar et al. (1998) and Sheedy
(2001).
The paper is organized as follows: Section 2 presents prior research, Section 3 presents
the sample description and variable definitions, Section 4 presents the empirical results,
and Section 5 concludes the report. Throughout the paper, the findings are compared with
evidence from other studies wherever possible.
2. Prior survey evidence
Prior survey evidence pertaining to regional and country differences in hedging
practices has revealed significant differences in terms of hedging practices between US
and New Zealand firms (Berkman et al., 1997), between US and Swedish firms (Alkeback
and Hagelin, 1999), between US and German firms (Bodnar and Gebhardt, 1999),
between large MNCs in the Asia-Pacific region and in the US and the UK (Marshall,
2000), between US firms and firms in Hong Kong and Singapore (Sheedy, 2001), and
between Dutch and US firms (Bodnar et al., 2003).
Berkman et al. (1997) and Alkeback and Hagelin (1999) found similar differences in
the hedging practices of New Zealand and Swedish firms as compared to firms in the US.
The evidence presented in these studies shows a positive relationship between firm size
and derivatives use in all markets, suggesting that there are economies of scale in the use
of derivatives. Furthermore, the use of foreign exchange (FX) derivatives was more
common than the use of interest rate derivatives, commodity derivatives, and equity
derivatives in all three countries, which underlines the relative importance of FX exposure
to firms in most countries. The use of FX derivatives was more common in New Zealand
and Sweden than in the US, possibly because of the relative size and international
dependency of these markets.

B. Pramborg / Pacific-Basin Finance Journal 13 (2005) 343–366346
Bodnar and Gebhardt (1999) provided evidence suggesting that German firms were
more likely than US firms to use derivatives. They were also more comfortable with
derivatives use, indicating significantly less concern about issues related to derivatives
than is the case in US firms. It was suggested that this might stem from the German firms’
consistently stricter policies governing the control and monitoring of derivatives use
within the firm. Alkeback and Hagelin (1999) produced similar results when comparing
their Swedish sample to the US sample of Bodnar et al. (1996).
Marshall (2000) investigated the FX hedging practices of MNCs in the Asia Pacific
region, the US, and the UK and found similarities as well as differences among MNCs
from the different regions. The MNCs were similar in their use of internal hedging
techniques, but there were differences between the Asia Pacific MNCs and those from the
other regions in terms of the emphasis on FX risk management. FX risk management was
found to be significantly more important for the Asia Pacific MNCs than for MNCs from
the US and the UK, and the author suggested that this might be explained by the Asian
financial crisis.
Sheedy (2001) surveyed firms in Hong Kong and Singapore and compared their
derivatives use to that of US firms. She found that a higher proportion of the Asian firms
studied used derivatives than did the US firms, and moreover, that they did so with greater
frequency. The evidence suggested that the Asian firms exercised less rigorous oversight
of derivatives use than did the US firms, indicated partly by a lower proportion of firms
that had a set schedule for evaluating derivatives positions.
3. Sample description and variable definitions
The data for this study were collected through a survey. In September 2000, a
questionnaire was sent to Korean and Swedish nonfinancial firms (excluding utilities).
Three hundred and eighty-seven Korean firms listed on the Korean Stock Exchange and
250 Swedish firms listed on the Swedish Stock Exchange received the questionnaire,
which was sent in either a Korean or Swedish version as appropriate to increase the
response rate. In January 2001, a reminder was sent to firms that did not respond to the
first mailing. A total of 163 responses were received, 60 from Korean firms and 103 from
Swedish firms. This represents a total response rate of 26%: 16% for the Korean and 41%
for the Swedish sample. To check for response bias, responding firms were compared with
those that did not respond to the survey, and the result suggested that the sample is
unbiased (see Appendix A).
The use of a survey was necessary since information on firms’ exposures and hedging
practices is not publicly available. One caveat to bear in mind is that, although the
information provided is unique and may provide important insights, surveys have several
general shortcomings, such as the risk that survey subjects may give inaccurate or
dishonest responses. In addition, because in our case the respondents are from two
different countries with different cultures and languages, there is the additional problem of
how respondents interpret the questions from Korean- and Swedish-language versions of
the questionnaires. Firms operate under business conditions that differ in many respects
between these two countries, and it should be noted that this survey, like other similar

B. Pramborg / Pacific-Basin Finance Journal 13 (2005) 343–366 347
surveys, can only document a limited set of characteristics and differences. It should be
taken into account that other not included variables could add to, or explain, some of the
results.
The questionnaire contained questions regarding (1) the respondent’s exposure to
foreign exchange rates and whether the respondent firm hedges; (2) the respondent’s use of
foreign currency derivatives (types of instruments, frequency of use, concerns); (3) the
respondent’s use of other foreign exchange risk management methods (foreign debt,
internal techniques); and (4) the respondent’s control and reporting procedures (decision-
making process, evaluation).2 Our decision to focus on only one type of exposure—FX
exposure—and the hedging of this exposure has the downside that possible correlations
with the hedging of other exposures are ignored. However, one important benefit is that
the survey is kept shorter, possibly improving response rates and allowing for a deeper
analysis of one exposure.
Summary statistics pertaining to the FX exposure of the sampled Swedish and Korean
firms are shown in Table 1, panel (A). Swedish firms are characterized by higher levels of
FX exposure for revenues, costs, and net assets as compared to Korean firms, although the
percentage of firms with FX exposure is similar for each category. Also, the percentage of
firms that indicated no exposure is similar in both countries. Furthermore, as can be seen in
panel (B), larger proportions of Korean firms hedged, used foreign debt, and used internal
methods, but these differences are not significant at a 10% level. However, the proportion
of Korean firms that used derivatives was significantly lower.
Reported differences, or the lack of such, may result from firm characteristics,
differences between national markets, or a combination of the two factors. This is
investigated further using logit regressions, as was done by Geczy et al. (1997), including
firm characteristics as control variables. The dependent variables are decision variables
representing firms’ decisions regarding hedging policy and choice of instruments. Three
decision variables are used, defined as follows:3
(a) Hedging (H), a dummy variable representing the decision to hedge. This variable is
assigned a value of 1 in the case of a firm that hedged (using currency derivatives,
foreign-denominated debt, internal methods, or a combination of the three) and 0
otherwise. All responding firms that indicated FX exposure are included in the
analysis.
(b) Currency derivatives (CD), a dummy variable representing the decision to use
currency derivatives to hedge. This variable is assigned a value of 1 in the case of a
firm that used derivatives to hedge and 0 otherwise. Only firms that hedged are
included in the analysis. Thus, this decision is defined as incremental to the decision
to hedge.
(c) Foreign debt (FD), a dummy variable representing the decision to use foreign-
denominated debt to hedge. This variable is assigned a value of 1 in the case of a
2 An English version of the questionnaire is available from the author on request.3 A fourth decision variable is possible: a dummy representing the decision to use internal methods. However,
since only nine firms did not use internal methods, inference from this variable is unreliable and this variable is
therefore not included.

Table 1
Exposure and hedging practices
Panel (A) Exposure to foreign exchange rates
Revenues Costs Net assets Zero exposure
Sweden
Mean 43.5 34.3 26.6
Max 100 100 100
3rd quartile 85 50 40
Median 40 30 15
1st quartile 5 10 0
No. of firms exposed 74 78 64 15
Percentage of firms exposed 75 80 68 16
No. of answers 99 98 94
Korea
Mean 28.8 20.9 13.4
Max 90 90 90
3rd quartile 45 30 30
Median 20 10 10
1st quartile 10 10 0
No. of firms exposed 49 47 38 8
Percentage of firms exposed 83 80 66 14
No. of answers 59 59 58
Panel (B) Hedging practices
Hedging Derivatives Foreign debt Internal methods
Sweden
Yes 54 44 37 44
No. of firms 88 54 52 51
Percentage 61 81 71 86
Korea
Yes 38 21 33 37
No. of firms 52 41 39 40
Percentage 73 51 85 93
Total
Yes 92 65 70 81
No. of firms 140 95 91 91
Percentage 66 68 77 89
Test for difference ( p-value)
0.158 0.002 0.131 0.346
The table contains descriptive statistics for firmsT foreign exchange exposure and hedging practices. Panel (A)
presents the foreign exchange exposure of revenues, costs, and net assets for the sampled firms, where the
exposure is calculated as the percentage of the total denominated in foreign currency. The last column presents the
number and percentage of firms that had no exposure. bNo. of firms exposedQ represents the total number of firms
with exposures of more than zero, bPercentage of firms exposedQ is calculated as the percentage of responding
firms with exposures of more than zero, and bNo. of answersQ is the total number of firms that answered each
question. Panel (B) presents descriptive statistics for sample firmsT hedging practices. For the first reporting
column, bYesQ represents the number of firms that answered that they hedged, bNo. of firmsQ represents the totalnumber of firms that responded, while bPercentageQ represents the proportion of responding firms that indicated
that they hedged. The last row presents the p-value from a Pearson Chi-square test for country difference in the
proportion of firms that hedged. Reporting columns 2 to 4 follow the same logic.
B. Pramborg / Pacific-Basin Finance Journal 13 (2005) 343–366348

B. Pramborg / Pacific-Basin Finance Journal 13 (2005) 343–366 349
firm that used foreign-denominated debt to hedge and 0 otherwise. As for the
variable CD, only firms that hedged were included in the analysis.
The explanatory variables for these regressions include a country dummy as well as
proxies for FX exposure, size, growth opportunities, leverage, and liquidity. The reasons
for including these variables and how proxies are defined are as follows (predicted signs
for the model with dependent variable H appear in parentheses):
(i) Country dummy. This dummy measures the difference between the likelihood of
finding a Swedish firm and that of finding a Korean firm that, for example, hedges,
given that all other variables are controlled for. The dummy is set to 1 for Swedish
and to 0 for Korean firms (F0).
(ii) FX exposure. It is expected that direct exposure to FX rates is positively related to
the use of hedging instruments (see, e.g., Nance et al., 1993; Hagelin, 2003). The
proxy for FX exposure is defined as the average of the share of total revenues and
share of total costs that are denominated in foreign currency (+).4
(iii) Size. Empirical evidence suggests that economies of scale may influence the
decision to use derivatives (see, e.g., Hagelin, 2003). This may carry over to this
setting, as, for example, the implementation of a hedging program may be expected
to exhibit economies of scale. The proxy for size is the logarithm of total revenues
(+).5
(iv) Growth opportunities. Theoretical findings suggest that hedging reduces the
incentive to underinvest (see Myers, 1977; Bessembinder, 1991). Because firms
with more valuable growth opportunities are more likely to be affected by the
underinvestment problem, these firms may be more likely to hedge. The proxy for
growth opportunities is the book-to-market ratio. A lower value of this proxy
variable suggests more valuable growth opportunities (�).
(v) Leverage. Hedging can reduce the variance of the value of the firm and thereby the
expected cost of financial distress (see Smith and Stulz, 1985). Leverage can thus be
hypothesized as positively related to hedging. The proxy for leverage is the book
value of debt-to-equity ratio (+).
(vi) Liquidity. Hedging could increase the value of the firm by lowering the expected
costs of financial distress (see Smith and Stulz, 1985). Nance et al. (1993)
hypothesized that the probability of encountering financial distress may be reduced
by maintaining more liquid assets, thereby reducing the need to hedge. The proxy for
liquidity is the current ratio (�).
Data for creating the dependent and explanatory variables (i) and (ii) were taken from
the survey responses. The financial data required to calculate explanatory variables (iii)–
(vi) were collected from stock market guides: for the Korean firms from the Korea
4 An alternative proxy is the difference between revenues and costs denominated in foreign currency. As a
robustness test, this measure was used in all regressions producing similar results.5 Another proxy for corporate size is the logarithm of book value of total assets. This measure was also used,
producing similar results.

B. Pramborg / Pacific-Basin Finance Journal 13 (2005) 343–366350
Company Handbook (Asia-Pacific Infoserv, 2000) and for the Swedish firms from the
Nordbankens Aktieguide (Delphi Economics, 2000). All financial variables were as of the
beginning of year 2000.
In addition to the reported regressions, we also used alternative specifications which
included industry dummies, with industries classified according to Bodnar et al. (1996),
Berkman et al. (1997), and Alkeback and Hagelin (1999). This did not change the
results. Lel (2003) found that internal corporate governance structures influenced the
hedging decision. Thus, it may be expected that the hedging practices of Korean
chaebols (large conglomerates, such as Daewoo, Hyundai, and Samsung, usually
dominated by a founding family) would differ from those of other firms (for studies on
Korean chaebols see, e.g., Campbell and Keys, 2002; Ferris et al., 2001; Lim, 2001).
Three different classification systems for chaebols were included: the classification
system from Korea Listed Companies, 1999 (KLC), (Hyundai Securities), the
classification system from the Korean Fair Trade Law (FTL; as used by Lim, 2001),
and a more detailed classification system devised by Lim (2001). According to the
classification system presented in KLC, 22 of the 60 surveyed Korean firms were
chaebols, while according to the FTL system, only 14 of the 60 firms were chaebols.6
The inclusion of dummy variables for chaebols did not change the results, but the small
sample size means that no inference should be drawn from this inconclusive result. Further
research is needed to determine possible differences in hedging behavior between chaebols
and other firms.
4. Empirical results
This section presents the empirical results. The results of the three logit regressions,
representing the decision variables discussed in Section 3, appear in Table 2. Before
proceeding, a comment on the organization of this section is in order. Subsection 4.1
discusses various aspects of the hedging decision as represented by Model (2a) in Table 2.
Subsection 4.2 presents findings regarding the use of derivatives and discusses Model
(2b). Subsection 4.3 presents findings pertaining to foreign-denominated debt, represented
by Model (2c), and internal hedging methods. Subsection 4.4, the last subsection, treats
control and reporting procedures.
At least two shortcomings of the logit regression models in Table 2 should be noted.
The first is that our classification of firms by means of dummy variables is crude. For
example, the decision whether to hedge or not, represented by Model (2a), may conceal
other relevant information, such as how much is hedged in each currency, whether or not
exposures in various currencies are hedged, and how long the hedge horizon is. The
second shortcoming is that the sample is small, especially for Models (2b) and (2c). Thus,
6 Lim (2001) classified chaebols according to whether they displayed pyramidal or horizontal ownership and
whether the controlling family retained a high or low stake, resulting in four classes of chaebols. Using this
classification, nine firms were classified as a type 4 chaebols (chaebols with pyramidal ownership and low family
stake) and five firms as type 1 (chaebols with horizontal ownership and high family stake). The inclusion of
dummies representing these types of chaebols did not alter the results.
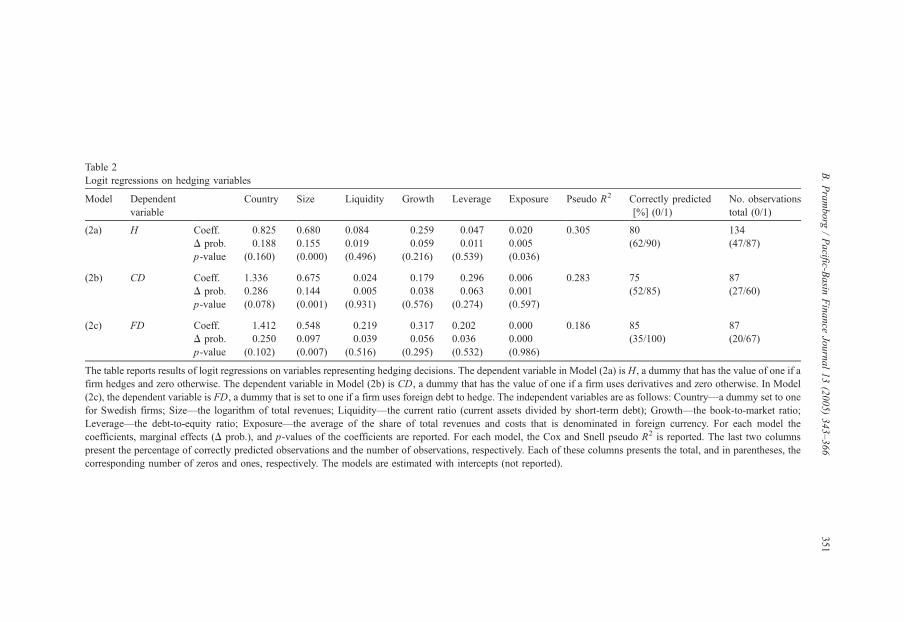
Table 2
Logit regressions on hedging variables
Model Dependent
variable
Country Size Liquidity Growth Leverage Exposure Pseudo R2 Correctly predicted
[%] (0/1)
No. observations
total (0/1)
(2a) H Coeff. �0.825 0.680 0.084 �0.259 �0.047 0.020 0.305 80 134
D prob. �0.188 0.155 0.019 �0.059 �0.011 0.005 (62/90) (47/87)
p-value (0.160) (0.000) (0.496) (0.216) (0.539) (0.036)
(2b) CD Coeff. 1.336 0.675 �0.024 �0.179 �0.296 0.006 0.283 75 87
D prob. 0.286 0.144 �0.005 �0.038 �0.063 0.001 (52/85) (27/60)
p-value (0.078) (0.001) (0.931) (0.576) (0.274) (0.597)
(2c) FD Coeff. �1.412 0.548 �0.219 �0.317 0.202 0.000 0.186 85 87
D prob. �0.250 0.097 �0.039 �0.056 0.036 0.000 (35/100) (20/67)
p-value (0.102) (0.007) (0.516) (0.295) (0.532) (0.986)
The table reports results of logit regressions on variables representing hedging decisions. The dependent variable in Model (2a) is H, a dummy that has the value of one if a
firm hedges and zero otherwise. The dependent variable in Model (2b) is CD, a dummy that has the value of one if a firm uses derivatives and zero otherwise. In Model
(2c), the dependent variable is FD, a dummy that is set to one if a firm uses foreign debt to hedge. The independent variables are as follows: Country—a dummy set to one
for Swedish firms; Size—the logarithm of total revenues; Liquidity—the current ratio (current assets divided by short-term debt); Growth—the book-to-market ratio;
Leverage—the debt-to-equity ratio; Exposure—the average of the share of total revenues and costs that is denominated in foreign currency. For each model the
coefficients, marginal effects (D prob.), and p-values of the coefficients are reported. For each model, the Cox and Snell pseudo R2 is reported. The last two columns
present the percentage of correctly predicted observations and the number of observations, respectively. Each of these columns presents the total, and in parentheses, the
corresponding number of zeros and ones, respectively. The models are estimated with intercepts (not reported).
B.Pramborg
/Pacific-B
asin
Finance
Journal13(2005)343–366
351

B. Pramborg / Pacific-Basin Finance Journal 13 (2005) 343–366352
we should use caution when interpreting the regression results. However, it should be
noted that various relevant information is provided by the surveys and presented in
conjunction with the regression results, enriching the information concerning the
regression results. Furthermore, the regressions are valuable in the sense that they indicate
possible country effects that cannot be explained by the exposure of individual firms or
other firm characteristics (included in the regressions).
4.1. Hedging
Model (2a) in Table 2 contains the dependent variable, H, which is set to 1 if a
firm hedges and to 0 otherwise. The coefficients for size and exposure are both
positive and statistically significant, suggesting that the decision to hedge FX exposure
is strongly influenced by both the size of the firm and its FX exposure. This is in line
with earlier studies that found support for economies of scale in the use of derivatives,
which would translate in this setting into economies of scale in setting up a hedging
program. Though the country dummy is negative, suggesting that Korean firms hedged
more, it is not statistically significant; thus, the null hypothesis of no country effect
cannot be rejected. Overall, the results are supported by the responses from firms that
did not hedge. The nonhedgers were asked to rank the factors influencing their
decision not to hedge (not reported). The responses suggest that insignificant FX
exposure, difficulties in estimating the FX exposure, and the costs of setting up a
hedging program were important determinants of the decision not to hedge for firms in
both countries.
Firms that hedged were asked to rank three prespecified objectives for hedging FX
exposure. The results suggest differences between Korean and Swedish firms, as
displayed in Fig. 1. Korean firms hedged primarily to reduce cash flow volatility, while
Swedish firms primarily hedged to reduce fluctuations in accounting earnings.
Korean firms ranked the latter alternative about as highly as did Swedish firms.
The results can be compared to Berkman et al. (1997) and Bodnar and Gebhardt
(1999), who found similar differences between New Zealand or German firms and US
firms. US firms emphasized cash flows as well as earnings, while firms in New
Zealand and Germany focused relatively more on earnings. Also, Marshall (2000)
found that Asian MNCs, like German and New Zealand firms, largely focused on
earnings.7 Berkman et al. (1997) and Bodnar and Gebhardt (1999) argued that the
differences may be attributed to differences in accounting regulations, where accounting
rules in the non-US countries made a stronger link between accounting earnings and cash
flows. This link is due to the comparatively strong connection between earnings, taxes,
and dividend payments. Swedish accounting regulation is tax related and somewhat
similar to German regulation (see Hung, 2001), while Korean accounting has, since the
Asian crisis in 1997, been heavily influenced by US GAAP, which would support these
7 Korean firms differ substantially from the Asian MNCs in the sample of Marshall (2000), where an absolute
majority considered minimizing earnings fluctuations to be the most important reason for hedging. However, only
three of the 53 Asian MNCs in Marshall’s sample were Korean firms.

2,14
2,40
1,09
2,37
1,771,69
1,0
1,2
1,4
1,6
1,8
2,0
2,2
2,4
2,6
a. Minimize fluctuations inaccounting earnings
b. Minimize fluctuations in realcash flows
c. Protect the appearance of thebalance sheet
Mea
n R
ank
Korea Sweden
Fig. 1. Objectives of hedging. The figure displays the answers to a question where firms were asked to rank what
they were trying to achieve by hedging. The possible ranks available were 3 =most important, 2 = next most
important, 1 = least important, and 0 = not at all important. A total of 88 answers was obtained, of which 36 were
from Korean and 52 were from Swedish firms. The vertical axis displays the mean rank calculated from the
responses from Korean and Swedish firms, respectively.
B. Pramborg / Pacific-Basin Finance Journal 13 (2005) 343–366 353
arguments. However, La Porta et al. (1998) reported that Korean accounting standards lag
Swedish standards considerably. Therefore, an alternative and perhaps more plausible
explanation is that Korean firms focus on cash flows because earnings are manipulated
extensively by, for example, backward accounting practices, and in the case of chaebols,
the transfer of profits within these large conglomerates.8 From Fig. 1, it is also evident that
Swedish firms ranked hedging of the balance sheet as about as important as hedging cash
flows, ranking it considerably higher than did Korean firms. As compared to firms in the
US and Europe (Bodnar et al., 1998, 2003; Bodnar and Gebhardt, 1999), Swedish firms
seem to focus relatively more on balance sheet hedging. This practice is not supported by
theory since it is aimed at accounting numbers and not cash flows. However, if this
hedging is a proxy for economic exposure (see Oxelheim and Wihlborg, 1997; Hagelin
and Pramborg, 2004a) or if firms have loan covenants expressed in accounting ratios (see
Hagelin and Pramborg, 2004b), such hedging may be rational.
4.2. Currency derivatives
4.2.1. The decision to use derivatives
Table 2, Model (2b), presents the results of a logit regression on the decision to use
derivatives. The dependent variable is CD, a dummy that is set to 1 if a firm uses
currency derivatives and to 0 otherwise. This model includes hedgers only, so the
8 The author is grateful to an anonymous referee for pointing this out.

B. Pramborg / Pacific-Basin Finance Journal 13 (2005) 343–366354
implicit assumption is that the choice to use derivatives is subsequent to the decision to
hedge. It is suggested that derivatives use differs significantly between firms in the two
countries, Swedish firms being more likely to use derivatives to hedge FX exposure than
are Korean firms. Furthermore, firm size is positively related to the decision to use
derivatives, confirming earlier findings that there are economies of scale in the use of
derivatives.
This country difference may be due to a number of factors. It may partly be a
consequence of the maturity of the two markets. The Swedish derivatives market was
established relatively early on, when the options exchange began trading in 1986; in
Korea, derivatives trading on exchanges began as recently as 1996 for stock index futures
and 1997 for stock index options. The trading of FX derivatives in Korea began as recently
as 1999, when the Korean Futures Exchange opened for trading in standardized USD
futures and options. The longer history of the Swedish market suggests that Swedish firms
have more experience using these types of instruments. However, Korean firms have long
been able to use, for example, nondelivered forwards in Singapore for their US dollar–won
exposure, so this difference in experience may thus be of less significance. A related, and
perhaps more important, reason for the difference between Korean and Swedish firms is
that in Korea, OTC derivatives have until recently been heavily regulated by the
authorities (due to the potential risk in derivative products, despite their positive economic
role as risk-hedging instruments). This heavy regulation can be expected to have
discouraged Korean firms from using derivatives. It was only in April 1999 that
government regulation changed, freeing up derivatives trading.9 If this interpretation of the
country difference is correct, the relative reluctance of Korean firms to use derivatives may
be a transitory phenomenon.
The above discussion is supported by the responses displayed in Table 3, regarding
reasons for not using derivatives. This question asked firms to rank three of seven
alternatives, assigning them the following values: 3 = most important, 2 = next most
important, and 1 = least important. Panel (A) displays the percentages of firms that
assigned each alternative a btop threeQ ranking. Panel (B) displays the mean rank of each
alternative, where the results include only the responses of those firms that ranked the
alternative among their top three reasons. Thus, the values in panel (B) could range from
1.00 (if all firms that ranked the alternative ranked it as least important) to 3.00 (if all
firms that ranked the alternative ranked it as most important). The only significant
difference between the countries is in their ranking of alternative (c), bDifficulty pricing
and valuing derivatives,Q suggesting that Korean firms have relatively less experience
with derivatives.
The proportion of firms that chose to rank this alternative, (c), as well as the average
rank assigned differs significantly between the two countries. This was the most important
reason for Korean firms (78% ranked this alternative, with a mean rank of 2.21), while for
Swedish firms, this alternative was ranked low (33% ranked this alternative, with the
lowest possible mean rank of 1.00). It should be noted that the number of responses to this
question was relatively low. In general, the results presented in Table 3 are in line with the
9 Source: Bank of Korea, http://www.bok.or.kr.
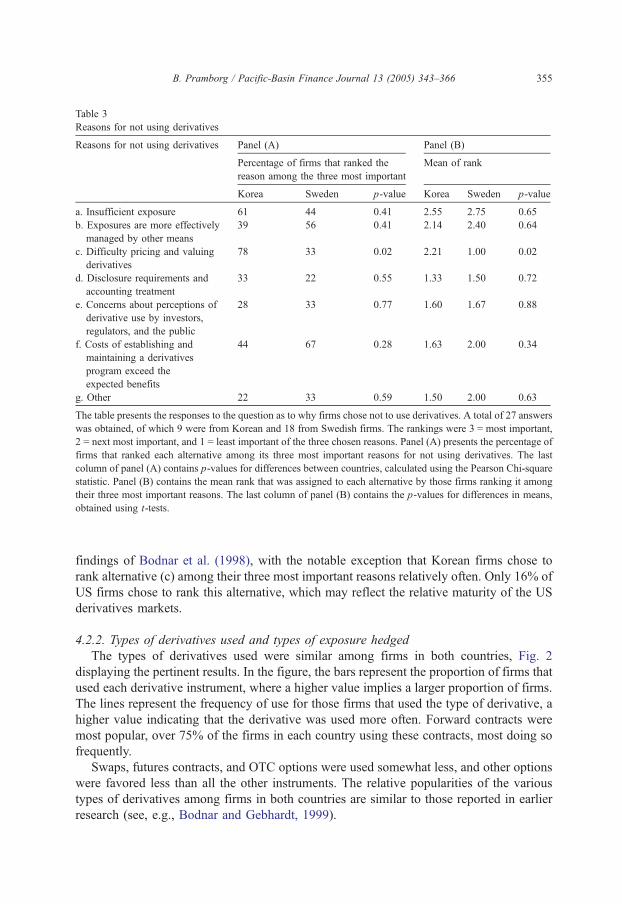
Table 3
Reasons for not using derivatives
Reasons for not using derivatives Panel (A) Panel (B)
Percentage of firms that ranked the
reason among the three most important
Mean of rank
Korea Sweden p-value Korea Sweden p-value
a. Insufficient exposure 61 44 0.41 2.55 2.75 0.65
b. Exposures are more effectively
managed by other means
39 56 0.41 2.14 2.40 0.64
c. Difficulty pricing and valuing
derivatives
78 33 0.02 2.21 1.00 0.02
d. Disclosure requirements and
accounting treatment
33 22 0.55 1.33 1.50 0.72
e. Concerns about perceptions of
derivative use by investors,
regulators, and the public
28 33 0.77 1.60 1.67 0.88
f. Costs of establishing and
maintaining a derivatives
program exceed the
expected benefits
44 67 0.28 1.63 2.00 0.34
g. Other 22 33 0.59 1.50 2.00 0.63
The table presents the responses to the question as to why firms chose not to use derivatives. A total of 27 answers
was obtained, of which 9 were from Korean and 18 from Swedish firms. The rankings were 3 = most important,
2 = next most important, and 1 = least important of the three chosen reasons. Panel (A) presents the percentage of
firms that ranked each alternative among its three most important reasons for not using derivatives. The last
column of panel (A) contains p-values for differences between countries, calculated using the Pearson Chi-square
statistic. Panel (B) contains the mean rank that was assigned to each alternative by those firms ranking it among
their three most important reasons. The last column of panel (B) contains the p-values for differences in means,
obtained using t-tests.
B. Pramborg / Pacific-Basin Finance Journal 13 (2005) 343–366 355
findings of Bodnar et al. (1998), with the notable exception that Korean firms chose to
rank alternative (c) among their three most important reasons relatively often. Only 16% of
US firms chose to rank this alternative, which may reflect the relative maturity of the US
derivatives markets.
4.2.2. Types of derivatives used and types of exposure hedged
The types of derivatives used were similar among firms in both countries, Fig. 2
displaying the pertinent results. In the figure, the bars represent the proportion of firms that
used each derivative instrument, where a higher value implies a larger proportion of firms.
The lines represent the frequency of use for those firms that used the type of derivative, a
higher value indicating that the derivative was used more often. Forward contracts were
most popular, over 75% of the firms in each country using these contracts, most doing so
frequently.
Swaps, futures contracts, and OTC options were used somewhat less, and other options
were favored less than all the other instruments. The relative popularities of the various
types of derivatives among firms in both countries are similar to those reported in earlier
research (see, e.g., Bodnar and Gebhardt, 1999).

0
20
40
60
80
100
a. Forwardcontracts (OTC)
b. Futurescontracts
(Exchange-traded)
c. Swaps d. Options onfutures
e. OTC options f. Exchange-traded options
Per
cent
age
that
use
d in
stru
men
t
0
20
40
60
80
100
Per
cent
age
(of u
sers
) th
at u
sed
freq
uent
ly
Korea (%) Sweden (%) Korea frequently Sweden frequently
Fig. 2. Types of derivatives used. The figure displays the answers to a question where firms were asked to indicate
how often they used various types of currency derivatives. The options available were 3 = frequently, 2 = seldom,
and 1 = never. A total of 88 answers was obtained, of which 36 were from Korean and 52 were from Swedish
firms. The left vertical axis refers to the bars in the figure and displays the percentage of firms that indicated that
they used an instrument at least seldom (rank 2 or 3). The right vertical axis refers to the lines in the figure and
displays the percentage of firms that used the instrument frequently, calculated from firms that responded that they
used the instrument.
B. Pramborg / Pacific-Basin Finance Journal 13 (2005) 343–366356
The types of exposures that were hedged using derivatives are similar among the firms
in the two countries. Table 4 displays the responses to the question about this, adding to
the evidence presented in Fig. 1 regarding the ultimate reasons for hedging (cash flows,
accounting earnings, and translation hedging).
There is no systematic difference in the use of derivatives between firms in the two
countries. Thus, the documented differences in the stated purposes of hedging FX
exposure (Fig. 1) do not necessarily result in practical differences in hedging behavior
between firms in the two countries. Note, for example, that a relatively large proportion of
the sampled firms in both countries used derivatives to hedge the translation of foreign
accounting statements, despite the difference suggested in Fig. 1. Thus, although the
relative emphasis on various objectives of hedging, as suggested in Fig. 1, may differ
between firms in the two countries, in practice, all the objectives may be of some concern,
and thus be hedged. One interesting observation is that Swedish firms were likely to
engage in speculation. About a third of the Swedish respondents indicated that they
speculated, and half of those firms did so frequently. These proportions are similar to those
found by Alkeback and Hagelin (1999).
4.2.3. Concerns about derivatives use
Concerns about the use of derivatives differ substantially in degree, as reported in
Table 5. Korean firms are more concerned across the board and significantly so for
alternatives (a)–(e). This may help explain why the Korean firms sampled are less likely
to use derivatives than are the Swedish firms. Other studies examining concerns with

Table 4
Frequency of derivatives use for various purposes
Frequency of derivatives Panel (A) Panel (B)
use for various purposesPercentage of firms that
used derivatives for the
stated purposes
Percentage of derivatives users
that used derivatives frequently
for the stated purposes
Korea Sweden p-value Korea Sweden p-value
a. Hedge translation of foreign
accounting statements?
62 72 0.41 46 55 0.60
b. Hedge foreign repatriations? 76 69 0.55 50 48 0.91
c. Hedge contractual commitments? 71 86 0.16 27 70 0.00
d. Hedge anticipated transactions
(b12 months)?
95 79 0.09 60 82 0.07
e. Hedge anticipated transactions
(N12 months)?
43 65 0.09 11 21 0.41
f. Arbitrage? 38 35 0.80 13 47 0.10
g. Speculate? 10 33 0.06 0 50 0.18
The table presents the responses to the question as to what purposes firms used derivatives. A total of 64 answers
was obtained, of which 21 were from Korean and 43 from Swedish firms. The rankings were 3 = frequently,
2 = seldom, 1 = never, and 0 = don’t know. Panel (A) contains the percentage of firms that assigned the
alternative a rank of at least 2, thus indicating that they used derivatives at least seldom for this purpose. Panel (B)
contains the percentage of derivatives users that assigned the alternative the rank of 3, thus indicating that they
used derivatives frequently. The last columns of panels (A and B) contain p-values for the differences between
countries, calculated using the Pearson Chi-square statistic.
B. Pramborg / Pacific-Basin Finance Journal 13 (2005) 343–366 357
derivatives use have also found significant differences between firms from different
countries; Bodnar and Gebhardt (1999) reported differences between German and US
firms, with German firms displaying less concern; Alkeback and Hagelin (1999)
presented evidence from a comparison of Swedish and US firms, suggesting that Swedish
firms are less concerned than US firms; and Bodnar et al. (2003) found differences
between Dutch and US firms, with Dutch firms displaying less concern. Differences may
arise from a number of factors, such as firm-level differences in policies towards
controlling and monitoring derivatives-related activities within the firm (Bodnar and
Gebhardt, 1999), or as a consequence of differences in disclosure requirements regarding
derivatives and the relative risk of corporate litigation for insufficient fiduciary care
(Bodnar et al., 2003).
The difference between Korean and Swedish firms could, at least to some
extent, be due to differences in disclosure requirements. Since the Asian crisis of
1997, Korean accounting regulation has primarily been based on US GAAP,
while Swedish accounting is similar to German and Dutch accounting. However,
Korean accounting had until recently been similar to German and Japanese
accounting, and the accounting standards of Korea are substantially lower than
those of Sweden according to La Porta et al. (1998).10 This suggests that Korean
10 After the 1997 financial crisis, IMF and World Bank pressure led to Korean accounting standards being
upgraded in an attempt to harmonize them with best practice, defined as requirements from the IAS and, above
all, US GAAP (see Choi, 1999).

Table 5
Concerns about the use of derivatives
Concerns about the use of derivatives Panel (A) Panel (B)
Percentage of firms that
ranked each item as a
bmoderateQ or bhighQ concern
Mean of rank
Korea Sweden p-value Korea Sweden p-value
a. Credit risk 62 23 0.00 1.86 0.91 0.00
b. Accounting treatment 67 33 0.01 1.86 0.95 0.00
c. Transaction cost (bankersT fees) 81 28 0.00 2.19 1.05 0.00
d. Liquidity risk 81 38 0.00 2.10 1.26 0.00
e. Lack of knowledge about
derivatives within my firm
62 23 0.00 1.71 0.93 0.00
f. Difficulty understanding the
firm’s exposure
38 24 0.24 1.19 0.93 0.26
The table presents the responses to the question about concerns regarding derivatives use. A total of 90 answers
was obtained, of which 39 were from Korean and 51 from Swedish firms. The rankings were 3 = high,
2 = moderate, 1 = low, and 0 = no concern. Panel (A) contains the percentage of firms that assigned each
alternative a rank of at least 2, indicating a moderate or high degree of concern. The last column of panel (A)
contains p-values for the differences between countries, calculated using the Pearson Chi-square statistic. Panel
(B) contains the mean rank assigned to each alternative. The last column of panel (B) contains p-values for
differences in means, calculated using t-tests.
B. Pramborg / Pacific-Basin Finance Journal 13 (2005) 343–366358
firms’ great concerns regarding derivatives, and consequent reluctance to use them, may
rather be a consequence of their relative inexperience with these instruments, as discussed
above.
4.3. Other foreign exchange risk management methods
4.3.1. Foreign-denominated debt
Model (2c) in Table 2 reports the results of a logit regression on the decision to
use foreign-denominated debt to hedge. The dependent variable is FD, a dummy that
is set to 1 if a firm uses foreign debt and to 0 otherwise. Using a 10% level of
significance, the results of this regression suggest that there is a positive relationship
between the size of a firm and the use of foreign debt. Also note that the sign of the
country dummy is opposite to that of the country dummy in Model (2b) with a p-
value of 0.102, thus marginally above statistical significance. Given that Korean firms
are more concerned about the use of derivatives, they may be inclined to use foreign
debt instead of currency derivatives.11
Firms were asked in the questionnaire to report the types of exposure they hedged using
foreign-denominated debt and the frequency of such hedging. Table 6 displays the
responses to this question.
11 The findings of Elliot et al. (2003) support the notion that firms may use foreign debt as a substitute for
derivatives.

Table 6
Frequency of foreign debt use for various purposes
Purposes of foreign debt use Panel (A) Panel (B)
Percentage of firms that
used foreign-denominated
debt for the purpose
Percentage of foreign debt
users that used frequently
for the purpose
Korea Sweden p-value Korea Sweden p-value
a. Hedge translation of foreign
accounting statements?
39 58 0.09 7 57 0.00
b. Hedge foreign repatriations? 54 27 0.01 48 14 0.04
c. Hedge contractual commitments? 44 25 0.06 24 46 0.19
d. Hedge anticipated transactions
(b12 months)?
67 19 0.00 35 20 0.39
e. Hedge anticipated transactions
(N12 months)?
41 8 0.00 13 25 0.53
f. Arbitrage? 26 33 0.47 40 18 0.20
g. Speculate? 3 12 0.12 0 17 0.66
The table presents the responses to the question as to what purposes firms used foreign-denominated debt. A total
of 64 answers was obtained, of which 21 were from Korean and 43 from Swedish firms. The rankings were
3 = frequently, 2 = seldom, 1 = never, and 0 = don’t know. Panel (A) contains the percentage of firms that gave an
alternative a rank of at least 2, indicating that they used foreign debt for the purpose. Panel (B) contains the
percentage of foreign debt users that assigned the alternative a rank of 3, indicating that they used foreign debt
frequently for the purpose. The last columns of panels (A and B) contain p-values for differences between
countries, calculated using the Pearson Chi-square statistic.
B. Pramborg / Pacific-Basin Finance Journal 13 (2005) 343–366 359
It is evident that significant proportions of firms in both countries used foreign-
denominated debt for hedging purposes. This underscores the importance of foreign-
denominated debt as a hedging instrument and suggests that research aimed at explaining
hedging decisions by firms should examine the use of foreign-denominated debt.
Importantly, Korean firms used foreign debt significantly more often to hedge cash flow
transactions than did Swedish firms. This finding suggests that once the decision was
taken to use foreign debt, Korean firms used this instrument extensively. It also supports
the finding in Table 2 that Korean firms were more likely to use foreign-denominated debt
to hedge than were Swedish firms. One caveat, however, is that there may be alternative
motives for extensive use of foreign-denominated debt. Allayannis et al. (2003) found
evidence that firms make trade-offs between the benefits of lower foreign borrowing costs
and a probable increase in financial risk due to exchange rate uncertainty. The higher the
positive interest rate differential between domestic and foreign debt, the more likely firms
are to use foreign-denominated debt. Accordingly, the high level of foreign-denominated
debt use by Korean firms may be a symptom of high overall debt use and their attempt to
attract foreign capital to retire high-interest domestic debt in the aftermath of the Asian
financial crisis. This is one way of arbitraging in the debt market, but one finding
contradicts whether such arbitrage was the primary intention here: in responding to
question (d) in Table 6, Korean firms were somewhat less likely to indicate that they
arbitraged with foreign-denominated debt. Nevertheless, it is possible that Korean firms
chose foreign-denominated debt not only driven by hedging demands and a reluctance to
use derivatives, but also for financing purposes.

0
20
40
60
80
100
a. Leading andlagging
b. Matchinginflows and
outflows (timing ofsettlement)
c. Inter-companynetting of receipts
and payments
d. Domesticcurrency invoicing
e. Adjustmentclause in sales
contracts
f. Transfer pricingagreements
Per
cent
age
that
use
d te
chni
que
0
20
40
60
80
100
Per
cent
age
(of u
sers
) th
at u
sed
freq
uent
ly
Korea (%) Sweden (%) Korea frequently Sweden frequently
Fig. 3. Types of internal hedging techniques used. The figure displays the answers to a question where firms were
asked to indicate how often they used various types of internal hedging. The options available were 3 = frequently,
2 = seldom, 1 = never, and 0 = do not know. A total of 90 answers was obtained, of which 39 were from Korean
and 51 were from Swedish firms. The left vertical axis refers to the bars in the figure and displays the percentage
of firms that indicated that they used a technique at least seldom (rank 2 or 3). The right vertical axis refers to the
lines in the figure and displays the percentage of firms that used the technique frequently, calculated from firms
that responded that they used the technique.
B. Pramborg / Pacific-Basin Finance Journal 13 (2005) 343–366360
In sum, the results indicate that foreign-denominated debt is used for hedging purposes
by a large proportion of firms in both countries, that there is a country difference, and
possibly that foreign debt is used as a substitute for derivatives, especially by Korean firms.
4.3.2. Internal methods
In the literature, most research has focused on derivatives and/or foreign-denominated
debt. Internal methods are often overlooked but are likely to be an important part of firms’
risk management strategies.12 In fact, the use of internal hedging techniques has been
found to be very common among firms (see, e.g., Hakkarainen et al., 1998; Joseph, 2000;
Marshall, 2000). Internal hedging techniques include leading and lagging of revenues and
costs, netting of trade receivables and payables among associated companies, and
domestic currency invoicing.
Firms were asked in our survey how often they used various internal hedging
techniques. An important finding is that most hedgers in the sample used internal methods
(only nine firms indicated that they did not). This finding, together with those of the
12 The findings of Choi and Kim (2003) are consistent with the notion that there is an interaction between
operational and financial strategies.

B. Pramborg / Pacific-Basin Finance Journal 13 (2005) 343–366 361
studies cited in the previous paragraph, suggests that firms across a range of markets make
extensive use of internal hedging methods.
Fig. 3 displays the responses to this question. Note that the methods surveyed in
this study primarily reflect the hedging demands of relatively short-term exposures
(implicitly assuming a static organization structure) and exclude long-term strategic
considerations, such as the shifting of production or plant location. See Marshall
(2000) for survey evidence concerning strategies for hedging longer term economic
exposures.13
The bars in Fig. 3 represent the proportion of firms that used each technique, where a
higher value implies a larger proportion of firms. The lines represent the frequency of use
on the part of those firms that used each technique, where a higher value indicates that the
technique was used more often. The relative popularity of various techniques in the two
countries was broadly similar. Matching inflows and outflows was the most common
technique in both countries, followed by inter-company netting for Swedish firms, and
leading and lagging for Korean firms. As suggested by the lines in Fig. 3, when adopting a
technique, Swedish firms used it more often than did Korean firms, except for leading and
lagging. Our findings regarding the Swedish firms are in line with the findings of
Hakkarainen et al. (1998), Joseph (2000), and Marshall (2000);14 our findings, however,
differ somewhat from theirs in terms of the relatively common use of leading and lagging
we found among Korean firms.
4.4. Control and reporting procedures
In the questionnaire, firms were asked about their control and reporting procedures.
They were specifically asked how often they evaluated their FX risk position, and how
they evaluated their risk management function.15
Fig. 4 shows how often the risk position was evaluated. Swedish firms were more likely
to have a set schedule, with less than 10% of Swedish firms having no set schedule.
Korean firms, on the other hand, were much more likely to evaluate as needed, adhering to
no set schedule. Earlier surveys have asked about the evaluation of derivatives positions
and not, as here, about the total risk position. However, both types of questions may
produce very similar answers, since it is likely that these two valuations are made
simultaneously. If so, the Swedish sample conforms to earlier results pertaining to Sweden,
Germany, and the US (see Alkeback and Hagelin, 1999; Bodnar and Gebhardt, 1999),
while Korean firms in this comparison stand out by the high proportion (41%) of them that
14 Joseph (2000) and Marshall (2000) studied different types of exposure. The utilization rates presented in Fig.
3 are compared to the figures for the hedging of transaction exposure, the dominant form of hedging used by the
firms studied.15 Firms were also asked whether the decision-making process concerning policy, strategy, and execution was
centralized or decentralized. The proportion of Swedish firms using a centralized decision-making process was
significantly higher, regardless as to whether the decision concerned policy, strategy, or the execution of risk
management.
13 For this question, firms could also choose alternative g—bother.Q However, since only 18 of the 90 firms that
answered the question responded to this particular alternative, this alternative is not included.

41,0
17,9 17,920,5
0,0
2,6
9,6
34,6
21,2
26,9
1,9
5,8
0
5
10
15
20
25
30
35
40
45
50
As needed/NoSchedule
Daily Weekly Monthly Quarterly Annually
Per
cent
age
of fi
rms
Korea Sweden
Fig. 4. Frequency of evaluating FX risk position. The figure displays the answers to a question where firms were
asked how frequently they evaluated their foreign exchange risk position. A total of 92 answers was obtained, of
which 39 were from Korean and 52 were from Swedish firms.
B. Pramborg / Pacific-Basin Finance Journal 13 (2005) 343–366362
evaluate as needed or have no evaluation schedule. However, Sheedy (2001) found that
36% of the studied firms from Hong Kong and Singapore did not have a schedule for
evaluating their derivatives positions. It seems that Asian firms are less likely to have
scheduled evaluations of risk positions than do Western firms. Two robustness tests were
performed. First, a logit regression on the decision as to whether or not to have scheduled
evaluations suggests that the country difference is robust and also that the greater the
exposure, the more likely firms were to conduct scheduled evaluations. Second, an ordered
probit regression on the frequency of reporting suggests that larger firms evaluated more
often, firms with greater FX exposure evaluated more often, and that Swedish firms
evaluated their positions more often than did Korean firms. This corroborates Sheedy
(2001) who found that the Asian firms in her sample lagged US firms in their oversight of
derivatives activity.
Fig. 5 presents findings regarding the method used to evaluate the FX risk
management function within firms. These findings suggest that firms in both Korea
and Sweden primarily evaluated the risk management function by absolute profit/loss.
This supports earlier results (see, e.g., Bodnar et al., 1998; Sheedy, 2001) but is
nonetheless somewhat puzzling, since risk management should, theoretically, be aimed
at reducing risk and not at seeking economic rents. Bodnar et al. (1998) reported that
about 40% of their sample used a profit-based approach, and about the same
proportion of firms used risk-adjusted measures. Sheedy (2001) reported similar
numbers for firms in Hong Kong and Singapore, and Bodnar et al. (2003) reported that
57% of Dutch firms used a profit-based approach. For the Korean and Swedish firms

7,3
14,6
56,1
22,0
0,0
21,4
10,7
50,0
5,4
12,5
0
10
20
30
40
50
60
70
a. Reducedvolatility relative to
a benchmark
b. Increased profit(reduced costs)
relative to abenchmark
c. Absoluteprofit/loss
d. Risk-adjustedperformance
(profits or savingsadjusted for
volatility)
e. Other
Per
cent
age
of fi
rms
Korea Sweden
Fig. 5. Evaluation of FX risk management. The figure displays the answers to a question where firms were asked
how they evaluated their FX risk management. A total of 97 answers was obtained, of which 41 were from
Korean and 56 were from Swedish firms.
B. Pramborg / Pacific-Basin Finance Journal 13 (2005) 343–366 363
we surveyed, the proportions of firms using a profit-based approach—alternatives (b)
and (c) in Fig. 5—are even higher at 71% and 61%, respectively.16 One possible effect
of this is that managers could be more inclined to speculate in order to increase profits, or,
alternatively, that firms that speculate are more likely to adopt a profit-based approach to
evaluate the risk management function. Supporting this link is a significant and positive
correlation between speculation with derivatives and the evaluation of the risk function
using a profit-based approach.17
5. Conclusions
This paper surveys Swedish and Korean nonfinancial firms on their foreign exchange
risk exposure and hedging practices. The findings suggest similarities between firms in the
two countries, with notable exceptions.
The aim of hedging activity differed between the countries, Korean firms being
more likely to focus on minimizing fluctuations of cash flows, while Swedish firms
17 Using a logit regression with the decision to speculate with derivatives as a dependent variable suggests that
speculation is positively associated with firm size and with a profit-based approach ( P-value of 0.059). The
country effect suggested in Table 6 is also confirmed, in that Swedish firms were significantly more likely to
engage in speculation.
16 A logit regression, where the dependent variable is a dummy that takes the value of 1 if the firm uses a profit-
based approach and 0 otherwise, suggests that this may not be explained by firm characteristics. The difference
between firms in the two countries is not significant.

B. Pramborg / Pacific-Basin Finance Journal 13 (2005) 343–366364
favored minimizing fluctuations of earnings or protecting the appearance of the
balance sheet. The proportion of firms that used derivatives was significantly lower in
the Korean than in the Swedish sample. This could not be captured by firm
characteristics such as FX exposure, size, liquidity, or leverage. This may be due to
the higher fixed costs incurred by Korean firms initiating derivatives programs. These
higher costs could result from the relative immaturity of Korean derivatives markets
and, perhaps more importantly, from Korean authorities’ heavy regulation of OTC
derivatives use. Korean firms relied to a larger extent on alternative hedging methods,
suggesting that the decision to hedge was not country specific but rather driven by
firm-specific variables, such as the level of FX exposure and firm size. It is further
suggested that Korean firms were less rigorous in monitoring their risk positions than
were Swedish firms. Finally, a large proportion of firms in both countries used a
profit-based approach to evaluate the risk management function, which is counter to
theoretical recommendations and bolsters the findings of Bodnar et al. (1998) and
Sheedy (2001).
Acknowledgements
The paper has benefited substantially from the suggestions of an anonymous
referee, and the author gratefully acknowledges his/her contribution. The author would
also like to thank Hossein Asgharian, Niclas Hagelin, Martin Holmen, Lars Norden,
and Clas Wihlborg for their valuable comments. Comments from participants in the
EAMSA annual meeting in Stockholm, 2003, and from seminar participants at the
Stockholm University School of Business are also acknowledged. The author is
grateful to Mika Sarkkinen, Hyun Park, and Olivia Kang for their help in translating
the Korean-language questionnaire and to the Center for Pacific Asia Studies at
Stockholm University and the Jan Wallander and Tom Hedelius Foundation for
financial support.
Appendix A. Summary statistics and tests for unbiasedness
The table contains descriptive statistics for the sampled firms and significance tests
for the differences in means and medians between responding and nonresponding firms.
The variables are defined as follows: bLeverageQ is measured as the debt-to-equity ratio,
bLiquidityQ is measured as short-term debt divided by current assets (current ratio),
bSizeQ is proxied by total sales, and bProfitabilityQ is proxied by return on equity. The
bExport ratioQ is measured as foreign sales divided by total sales, and bOwnershipconcentrationQ is measured as the proportion of shares owned by the five (three) largest
shareholders for the Swedish (Korean) sample. The significance test for the mean is a t-
test, and for the median is the Wilcoxson/Mann–Whitney test. The data are for financial
years ending in 1999. Values are translated to USD using the exchange rates as of
December 31, 1999.

Leverage Liquidity Size
(USD million)
Profitability Export ratio Ownership
concentration
Panel (A) Korean firms
Responding firms
Mean 1.77 1.41 615 4.1 32.1 31.8
Median 1.18 1.35 161 6.3 19.6 30.8
No. firms 60 60 61 58 60 60
Nonresponding firms
Mean 1.44 1.45 975 4.4 32.3 33.0
Median 1.14 1.23 158 6.8 23.2 30.1
No. firms 326 327 327 302 326 325
Test for difference ( p-value)
mean 0.64 0.77 0.41 0.94 0.97 0.59
median 0.93 0.38 0.73 0.83 0.71 0.99
Panel (B) Swedish firms
Responding firms
Mean 1.94 1.13 1120 �7.12 44.8 44.2
Median 1.29 0.57 98 10.4 45.0 42.0
No. firms 103 103 103 103 67 101
Nonresponding firms
Mean 1.74 0.79 557 �0.94 41.0 48.7
Median 1.26 0.54 93 8.9 37.0 49.0
No. firms 147 147 147 147 97 144
Test for difference ( p-value)
mean 0.60 0.18 0.10 0.35 0.48 0.06
median 0.99 0.48 0.31 0.72 0.53 0.05
B. Pramborg / Pacific-Basin Finance Journal 13 (2005) 343–366 365
References
Alkeb7ck, P., Hagelin, N., 1999. Derivative use by nonfinancial firms in Sweden with an international
comparison. Journal of International Finance and Management Accounting 10, 105–120.
Alkeb7ck, P., Hagelin, N., Pramborg, B., 2004. Derivative usage by non-financial firms in Sweden 1996 and
2003: What has changed? Managerial Finance (in press).
Allayannis, G., Brown, G.W., Klapper, L.F., 2003. Capital structure and financial risk: Evidence from foreign
debt use in East Asia. Journal of Finance 58, 2667–2709.
Bartram, S.M., Brown, G.W., Fehle, R.F., 2003, International evidence on financial derivatives usage. Working
paper, Kenan-Flagler Business School, University of North Carolina at Chapel Hill.
Batten, J., Mellor, R., Wan, V., 1993. Foreign exchange risk management practices and products used by
Australian firms. Journal of International Business Studies 24, 557–573.
Berkman, H., Bradbury, M.E., Magan, S., 1997. An international comparison of derivatives use. Financial
Management 26, 69–73.
Bessembinder, H., 1991. Forward contracts and firm value: investment incentive and contracting effects. Journal
of Financial and Quantitative Analysis 26, 519–532.
Bodnar, G.M., Gebhardt, G., 1999. Derivatives usage in risk management by US and German non-financial firms:
A comparative survey. Journal of International Finance and Management Accounting 10, 153–187.
Bodnar, G.M., Hayt, G.S., Marston, R.C., 1996. 1995 Wharton survey of derivatives usage by U.S. non-financial
firms. Financial Management 25, 113–133.
Bodnar, G.M., Hayt, G.S., Marston, R.C., 1998. 1998 Wharton survey of financial risk management by U.S. non-
financial firms. Financial Management 27, 70–91.

B. Pramborg / Pacific-Basin Finance Journal 13 (2005) 343–366366
Bodnar, G.M., De Jong, A., Marcae, V., 2003. The impact of institutional differences on derivative usage: A
comparative study of US and Dutch firms. European Financial Management 9, 271–297.
Campbell, T.L., Keys, P.Y., 2002. Corporate governance in South Korea: The chaebol experience. Journal of
Corporate Finance 8, 373–391.
Choi, J.H., 1999, Transforming accounting standards, The AMCHAM Journal May/June issue, The American
Chamber of Commerce in Korea.
Choi, J.J., Kim, Y.-C., 2003. The Asian exposure of U.S. firms: Operational and risk management strategies.
Pacific-Basin Finance Journal 11, 121–138.
Elliot, W.B., Huffman, S.P., Makar, S.D., 2003. Foreign-denominated debt and foreign currency derivatives:
Complements or substitutes in hedging foreign currency risk? Journal of Multinational Financial Management
13, 123–139.
Ferris, S.P., Kim, K.A., Kitsabunnarat, P., 2001, The costs and benefits of diversified business groups: The case of
Korean chaebols, Working paper, University of Wisconsin-Milwaukee.
Geczy, C.G., Minton, B.A., Schrand, C., 1997. Why firms use currency derivatives. Journal of Finance 52,
1323–1354.
Hagelin, N., 2003. Why firms hedge with currency derivatives: An examination of transaction and translation
exposure. Applied Financial Economics 13, 55–69.
Hagelin, N., Pramborg, B., 2004a. Hedging foreign exchange exposure: Risk reduction from transaction and
translation hedging. Journal of International Finance and Management Accounting 15, 1–20.
Hagelin, N., Pramborg, B., 2004b. Empirical evidence on the incentives to hedge transaction and translation
exposure. Working paper, Stockholm University.
Hakkarainen, A., Joseph, N., Kasanen, E., Puttonen, V., 1998. The foreign-exchange exposure
management techniques of Finnish industrial firms. Journal of International Finance and Management
Accounting 9, 34–57.
Hung, M., 2001. Accounting standards and value relevance of financial statements: An international analysis.
Journal of Accounting and Economics 30, 401–420.
Joseph, N.L., 2000. The choice of hedging techniques and the characteristics of UK industrial firms. Journal of
Multinational Financial Management 10, 161–184.
La Porta, R., Lopez-de-Silanes, F., Schleifer, A., Vishny, R.W., 1998. Law and finance. Journal of Political
Economy 106, 1113–1155.
Lel, U., 2003. Currency risk management, corporate governance, and financial market development. Working
paper, Kelley School of Business, Indiana University.
Lim, U., 2001, The choice of ownership structure in conglomerates: An empirical study on the case of chaebols in
Korea. Working paper, Yonsei University.
Marshall, A.P., 2000. Foreign exchange risk management in UK, USA and Asia Pacific multinational companies.
Journal of Multinational Financial Management 10, 185–211.
Myers, S., 1977. The determinants of corporate borrowing. Journal of Financial Economics 5, 147–175.
Nance, D.R., Smith Jr., C.W., Smithson, C.W., 1993. On the determinants of corporate hedging. Journal of
Finance 48, 267–284.
Oxelheim, L., Wihlborg, C., 1997. Managing in the Turbulent World Economy: Corporate Performance and Risk
Exposure. John Wiley and Sons, New York.
Sheedy, E., 2001. Corporate use of derivatives in Hong Kong and Singapore: A survey. Working paper,
Macquarie University.
Smith, C.W., Stulz, R.M., 1985. The determinants of firms’ hedging policies. Journal of Financial and
Quantitative Analysis 20, 391–405.