foreign military sales: a historical review of argentina's
TRANSCRIPT
Air Force Institute of TechnologyAFIT Scholar
Theses and Dissertations Student Graduate Works
3-21-2013
Foreign Military Sales: A historical review ofArgentina's purchasesJuan E. Perot
Follow this and additional works at: https://scholar.afit.edu/etd
This Thesis is brought to you for free and open access by the Student Graduate Works at AFIT Scholar. It has been accepted for inclusion in Theses andDissertations by an authorized administrator of AFIT Scholar. For more information, please contact [email protected].
Recommended CitationPerot, Juan E., "Foreign Military Sales: A historical review of Argentina's purchases" (2013). Theses and Dissertations. 956.https://scholar.afit.edu/etd/956
DEPARTMENT OF THE AIR FORCE AIR UNIVERSITY
AIR FORCE INSTITUTE OF TECHNOLOGY Wright-Patterson Air Force Base, Ohio
APPROVED FOR PUBLIC RELEASE; DISTRIBUTION UNLIMITED
FOREIGN MILITARY SALES: A HISTORICAL REVIEW OF ARGENTINA’S
PURCHASES
THESIS
Juan E. Perot, LtCol; AAF
AFIT-ENC-13-M-04
i
The views expressed in this thesis are those of the author and do not reflect the official policy or position of the Argentina Air Force, Ministry of Defense, or the Government of Argentina.
ii
AFIT-ENC-13-M-04
FOREIGN MILITARY SALES: A HISTORICAL REVIEW OF ARGENTINA’S PURCHASES
THESIS
Presented to the Faculty
Department of Mathematics and Statistics
Graduate School of Engineering and Management
Air Force Institute of Technology
Air University
Air Education and Training Command
In Partial Fulfillment of the Requirements for the
Degree of Master of Science in Logistics and Supply Chain Management
Juan E. Perot, MBA
LtCol, AAF
March 2013
APPROVED FOR PUBLIC RELEASE; DISTRIBUTION UNLIMITED
iii
AFIT-ENC-13-M-04
FOREIGN MILITARY SALES: A HISTORICAL REVIEW OF ARGENTINA’S PURCHASES
Juan E. Perot LtCol. AAF
Approved: ____________________________________ ___ Dr. Edward D. White (Chairman) Date ____________________________________ ___ Dr. Alan W. Johnson (Member) Date ____________________________________ ___ LtCol Bradley E. Anderson (Member) Date
iv
AFIT-ENC-13-M-04 Abstract
Since June 1986 the Argentina Air Force maintains at WPAFB Ohio a
procurement office to obtain defense articles under the Foreign Military Sales system.
The aim of this thesis is to provide an historical review (1994-2012) of the procurement
under FMS and bring some visibility about the procedures and get some managing
indicators. The analysis considered three different aspects: the characteristics of the
acquisition processes, the time in the procurement system and the relationships between
independent variables and the acquisition time through a multivariate linear regression
model.
The results of the analyses are as follows: the USAF Services has the shortest
procurement time, 78% of all acquisition processes initiated resulted in a 92% of fill rate;
68% of all acquisitions were considered Standard; and for both Standard and Non
Standard the acquisition median delivery time was around a year. Also, neither the type
of the defense article, type of procurements or the U.S. Service supplier influenced the
pipeline time. Only the country priority showed a slight degree of linear association with
time. The multivariate regression model had an R2 equal to 0.169, showing a weak linear
association between variables.

v
AFIT-ENC-13-M-04
DEDICATION
To my parents To my family
To my Air Force
vi
Acknowledgments
I would like to express my sincere appreciation to my faculty advisor, Dr Tony
White, for his guidance, kindness, and support throughout the course of this thesis effort.
The insight and experience was certainly appreciated and to my readers Dr. Alan W.
Johnson and Dr Jeffrey A. Odgen for his valuable time and corrections. I would also like
to thank the Argentina Foreign Liaison Office personnel who gave me access to the data
and references, and other Liaison Offices like Australia, Brazil, Chile, Spain and AFSAC
experts who spent their valuable time and knowledge in order to explain how to interpret
the available data and the FMS system.
Also especially thanks to my wife for the long nights company and patience
during the develop of this research.
Juan E. Perot
vii
Table of Contents Page Abstract .................................................................................................................. iv Dedication ....................................................................................................................v Acknowledgments........................................................................................................... vi Table of Contents ........................................................................................................... vii List of Figures ............................................................................................................... viii List of Tables ....................................................................................................................x I Introduction ....................................................................................................................1 II. Literature Review .........................................................................................................6
Overview .....................................................................................................................6 The FMS inside of the Security Assistance Programs ................................................8 Other aspects .............................................................................................................18
III. Methodology .............................................................................................................22
Process Characteristics..............................................................................................26 Time in the System ...................................................................................................32 Regressions ...............................................................................................................34
IV. Results.......................................................................................................................38
Process Characteristics Analysis...............................................................................38 Time in the system ....................................................................................................50 Regressions ...............................................................................................................54
V. Discussion and Conclusions.......................................................................................58
Process Characteristics Analysis...............................................................................58 Time in the system ....................................................................................................59 Regressions ...............................................................................................................59 Future studies ............................................................................................................63 Recommendations .....................................................................................................63
Bibliography ...................................................................................................................65 Vita ..................................................................................................................................66
viii
List of Figures
Page Figure 1.1. Particular Supply Chain developed between AAF and FMS .........................2
Figure 2.1. Evolution of the FMS investment FY 2001 – FY 2011 .................................7
Figure 2.2. Authorization Act since 1954 .......................................................................11
Figure 2.3. Logistics Communications – Fig 10-1 MSA 29th Edition ...........................16
Figure 3.1. Document Number and its aspects relations ................................................25
Figure 3.2. Status Codes in the master file .....................................................................28
Figure 4.1. Percentages of acquisition initiated by AAF through U.S. Services ............39
Figure 4.2. Successes, Cancellations and Back Orders purchases ..................................40
Figure 4.3. Percentages of Standard and Non Standard acquisitions .............................43
Figure 4.4. Comparison of the Successes, Cancellations or Rejects and BB
by type of acquisition .....................................................................................................44
Figure 4.5. Comparison of the procedures by type through the years ............................45
Figure 4.6. Quantity orders with cancellations or rejected codes ...................................47
Figure 4.7. Absolute evolution of the cancellation orders through the years .................49
Figure 4.8. Relative cancellation orders through the years to the total orders................49
Figure 4.9. Distribution of the Delta dates by type of acquisition procurement .............50
Figure 4.10. Distribution of the Delta dates by U.S. Services Standard process ............52
Figure 4.11. Distribution of the Delta dates by U.S. Services Non Standard process ....53
Figure 4.12. Multivariate pairwise estimation JMP® V9 ................................................54
Figure 4.13. Correlations values and the statistical significant level ..............................55
Figure 4.14. Leverage plots for each variable as a regressor of the delta date ...............55
ix
Figure 4.15. Summary of multivariate regression model JMP® V9 ..............................56
Figure 4.16. The Federal Supply Classification histogram .............................................57
x
List of Tables
Page Table 2.1. Twelve major Security Assistance programs .................................................10
Table 3.1. Useful Master Table cell names and explanations .........................................24
Table 3.2. Document Number Format and date location in julian format ......................32
Table 3.3. Country priorities. Table 10-2 Page 10-13 “MSA 29th Edition” ..................36
Table 4.1. Quantity of acquisition initiated process by US Services ..............................38
Table 4.2. Successes, Cancellations and Back Orders purchases ...................................39
Table 4.3. Percentages of the orders fill rate ..................................................................40
Table 4.4.Quantity of order corresponding to different FR percentages ........................41
Table 4.5. Orders quantities assigned to each code in the ESTDOCID cell ...................42
Table 4.6. Data code summary .......................................................................................43
Table 4.7. Quantity of orders categorized by type and Successes, Failures or BB ........44
Table 4.8. Orders with Cancellations Rejections Codes and responsibility. "C" represents
customer, AAF, while "S" represents supplier ...............................................................46
Table 4.9. Summary of the percentage responsible for cancellations.............................47
Table 4.10. Orders by cancellation codes through the years ..........................................48
Table 4.11. Summary of the delta dates distribution statistics values ............................51
Table 4.12. Summary of the delta dates distribution statistics values for Standard
process.............................................................................................................................52
Table 4.13. Summary of the delta dates distribution statistics values for Non Standard
process.............................................................................................................................53
FOREIGN MILITARY SALES: A HISTORICAL REVIEW OF ARGENTINA’S PURCHASES
If you cannot measure it, you cannot control it. If you cannot control it, you cannot manage it
(James Harrington 1611-1677 English political theorist)
I. Introduction
The mission of the Argentina Air Force (AAF) is: “Contribute to National Defense
and acting effectively deterring interest in aerospace to guarantee and protect permanently
the vital national interest”. To accomplish this mission, the AAF operates daily several air
and land Weapon Systems (WS). These systems require maintenance actions that allow
them to maintain their availability status. Therefore, maintenance actions require the
acquisition of spare parts to repair components or perform maintenance services such as
overhaul, modernization, and aircraft/components upgrades.
Hence, to procure spare parts or maintenance services the AAF can choose among
several suppliers according to the contractual Argentinean Republic (RA) laws. One of the
ways that the AAF acquires components and services that meet their needs is through the
“Security Cooperation” (SC) of the Department of Defense (DOD) programs.
The definition of Security Cooperation published in Joint Pub 1-02 is "All DOD
interactions with foreign defense establishment to build defense relationships that promote
specific U.S. security interests, develop allied and friendly military capabilities for self -
defense and multinational operations, and provide U.S. forces with peacetime and
contingency access to a host nation". One of these programs is the Foreign Military Sales
(FMS) program, which is administered by the Defense Security Cooperation Agency
(DSCA) through which eligible foreign governments purchase defense articles, services,
and training from the United State Government (USG). In Fiscal Year (FY) 2009 FMS is
estimated to have involved around 80 foreign countries in this program (The Management
of Security Assistance, 2010).
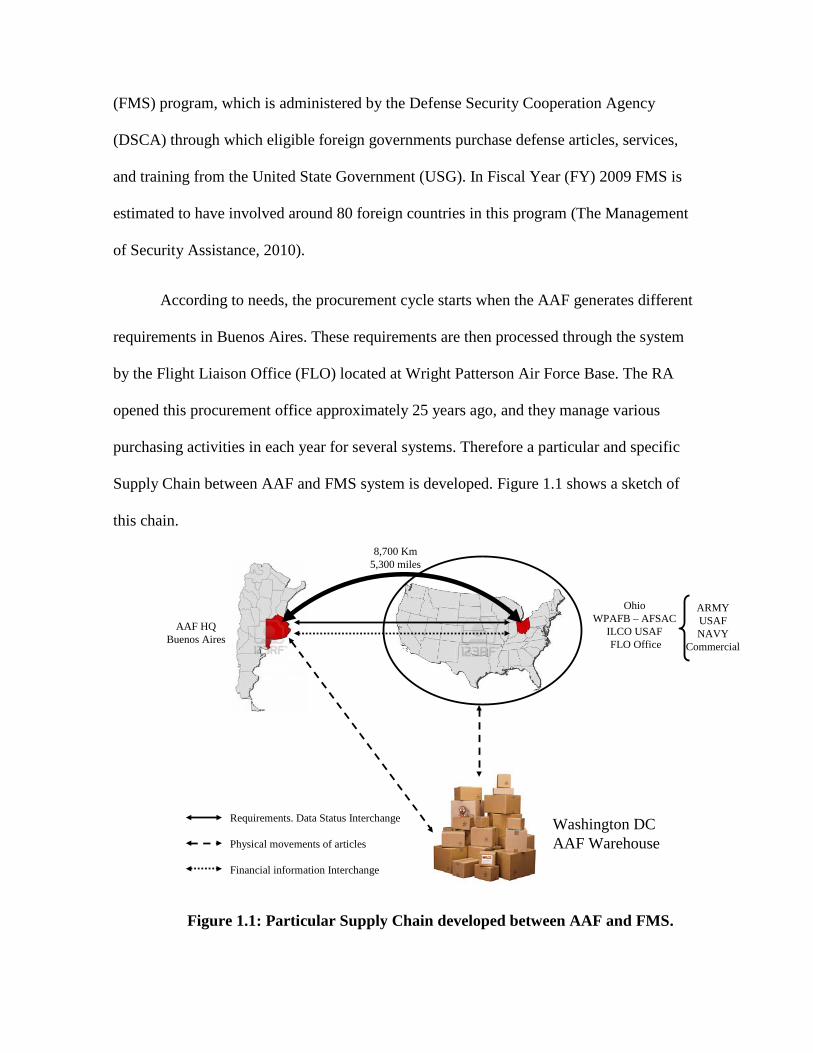
According to needs, the procurement cycle starts when the AAF generates different
requirements in Buenos Aires. These requirements are then processed through the system
by the Flight Liaison Office (FLO) located at Wright Patterson Air Force Base. The RA
opened this procurement office approximately 25 years ago, and they manage various
purchasing activities in each year for several systems. Therefore a particular and specific
Supply Chain between AAF and FMS system is developed. Figure 1.1 shows a sketch of
this chain.
Figure 1.1: Particular Supply Chain developed between AAF and FMS.
Requirements. Data Status Interchange
Physical movements of articles
Financial information Interchange
AAF HQBuenos Aires
OhioWPAFB – AFSAC
ILCO USAFFLO Office
ARMYUSAFNAVY
Commercial
8,700 Km5,300 miles
Washington DCAAF Warehouse
Each transaction produced during the process of the requirements is recorded in the
International Logistics Communications Systems (ILCS), which serve as the primary
logistics communications method for FMS. This system is capable of recording all the
transactions that happen throughout the procurement process like dates, changes of status,
requirements specifications, quantities, etc.
Variability and the lack of visibility in the acquisition process are the main enemies
in any supply chain. Under this procurement system, it has been observed that the
provisioning cycle duration is variable. As a customer we usually know the time when the
requirement is placed but it is difficult to know with more or less certainty when we will
receive the items. This circumstance affects in many ways the AAF’s planning capability to
do operations, maintenance and the next FY budget requirement as well.
The aim of this thesis is to provide an historical review of the procurement under
FMS and bring some visibility about the procedures and get some managing indicators. At
the end, it arrives at a series of conclusions and recommendations that are useful to
optimize the use of the system, while minimizing the uncertainty in the provision of the
military parts. Specifically, this research aims to answer:
1) What are the main factors that historically affect the procurement processes under
the FMS system with respect to the AAF?
2) What are the characteristics of the procurements, such as, supply services, success
procedures, type of acquisition, cancellations reasons, and time in the system?
3) What types of correlations are present that influence the procurement time?
4) What corrective actions can be applied that improve the acquisition process?
The methodology that will be used for the development of this work consists of a
collection of historical information, compiling and sorting this data using the transaction
records, and conducting a statistical analysis. Before performing statistical analysis, it is
necessary to first understand the structure of the database and most of the codes that the
system uses; this is one of the big challenges in this research. After the data is sorted, a
correlation analysis can be conducted to determine the type of relationship between several
variables and procurement time in the system. Finally, having the result of the previous
analysis, the study will draw conclusions and/or necessary recommendations that contribute
to minimize the uncertainty and improve the processes.
Usually the causes of the problems are there, and in sight and in knowledge of
everyone. But, it is not until a scientific measurement is addressed that the head of the
management becomes aware of how small changes generate great solutions to historical
problems. Moreover, there is no previous historical analysis in the AAF regarding this
topic; so it may be a milestone for future reviews. It is possible that the study leaves
different opportunities for future research such as the modeling of the procurement cycle,
establishing some particular metrics for the process, or further investigate the reasons of
cancellations/rejections among others.
The thesis layout is as follow: In Chapter II, the literature review, we shall cover a
brief explanation about how the FMS systems works in this particular supply chain and
some relevant aspects that apply in procurement in an international environment and could
diminish the optimal performance of the cycle. Chapter III will present in extensive detail
the methodology for conducting the research, taking into account the constraints that are
made in the search for information but which in turn provide internal and external
reliability and to draw valid conclusions applicable to other cases. Moreover, Chapter IV
will cover the statistical analysis and assessment of the collected information and determine
how to respond to the research questions. Finally, Chapter V will present the conclusions
and/or recommendations.
II. Literature Review
Overview
The same rules of the globalized world becoming smaller for access to
information also apply to the business in the market of the Defense. To accompany their
political objectives, a country that defends its borders and interests need to own military
equipment ready to use. Operation of these systems produces natural wear and the
necessity to recover their operational status. So, the demand of acquisition for military
maintenance components, services, and appropriate personnel training arise.
Moreover, in the same way that all the countries don’t produce all the products
that they need the possibility of trade appears. It is possible to distinguish the countries
that naturally are producers of military equipment and which allies satisfied their
requirements from the excess of production. One of the bigger Free World’s suppliers is
the United States (U.S.); in 1980 the purchase orders for armaments were $16 billon,
almost 10% of all U.S. exports. In the more recent years from 2005 to 2009, the amount
of FMS signed agreements went from under $10 billion a year to over $30 billion
(DISAM Annual Vol. 1 May 2012 page 162). Figure 2.1 shows this growth.
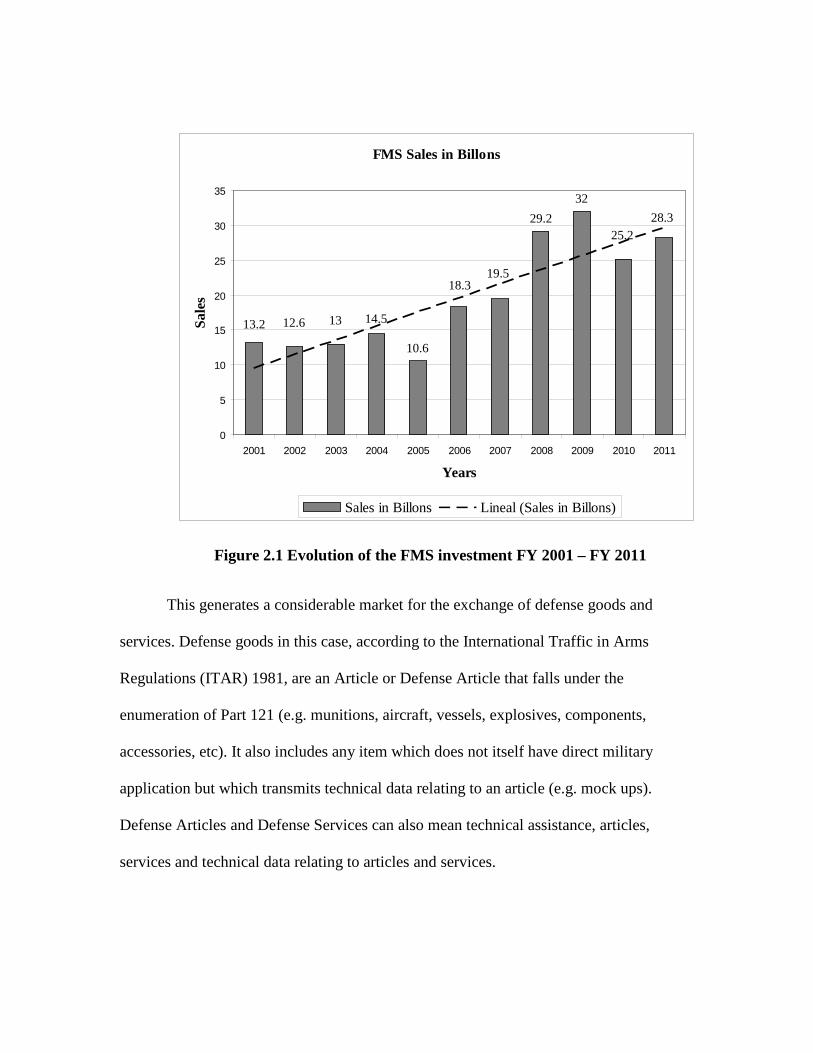
Figure 2.1 Evolution of the FMS investment FY 2001 – FY 2011
This generates a considerable market for the exchange of defense goods and
services. Defense goods in this case, according to the International Traffic in Arms
Regulations (ITAR) 1981, are an Article or Defense Article that falls under the
enumeration of Part 121 (e.g. munitions, aircraft, vessels, explosives, components,
accessories, etc). It also includes any item which does not itself have direct military
application but which transmits technical data relating to an article (e.g. mock ups).
Defense Articles and Defense Services can also mean technical assistance, articles,
services and technical data relating to articles and services.
FMS Sales in Billons
10.6
29.232
13.2 12.6 13 14.5
18.319.5
25.228.3
0
5
10
15
20
25
30
35
2001 2002 2003 2004 2005 2006 2007 2008 2009 2010 2011
Years
Sale
s
Sales in Billons Lineal (Sales in Billons)
The RA has a requirement for defense articles and is a consumer of these types of
products in general to support their defense capabilities against external threats to the
National Territory, support the society in natural disasters or participate in United Nation
(U.N.) missions. Particularly, AAF needs to support and to maintain the military
equipment where most of them are U.S. origin. This also includes the training of
technical personnel. So, annually the AAF initiates the procurement of military goods and
services that contribute to the availability of the materiel in ready to use condition.
The FMS inside of the Security Assistance Programs
There are many aspects to analyze in the FMS system. So in the following pages,
this study highlights what is considered most important and has some relations over the
topic. These explanations serve as a reference to understand how the process works. Most
of those concepts are from the “The Management of the Security Assistance 29th Edition”
(MSA 29th Edition).
Since WWII, Security Assistance (SA) has become a continuing program used to
achieve U.S. foreign policy and national security objectives in the world. U.S. recognizes
that the countries need a valid defense requirement. These requirements for many allied
countries usually are very difficult to fill because of the complexity of the products,
economical costs, or lack of science applied to develop military equipment.
Consequently, U.S. facilitates the common defense by entering into international
arrangement to produce cooperative exchanges like data, research, production,
procurement, training and logistics.
U.S. has the policy to achieve international peace and security through the U.N.
So, armed forces shall not be used except for individual or collective self defense.
According to the “The Management of Security Assistance – DISAM – 29th edition”, the
only reasons to sell articles or services defense are for internal security, legitimate self
defense, preventing proliferation of weapons of mass destruction, participation in U.N.
activities, and supporting economic and social development activities in less developed
countries. There are similar reasons in the “1976 Sec 4 Armament Export Control Act
(AECA)”.
The recent development of Security Cooperation (SC), which includes SA
programs, is broadly defined as: “All DOD interactions with foreign defense
establishments to build defense relationships that promote specific U.S. security interests,
develop allied and friendly military capabilities for self defense and multinational
operations, and provide U.S. forces with peacetime and contingency access to a host
nation” (Joint Pub 1-02 of 9 June 2004).
The SA is managed by the Department of State (DOS) and the Department of
Defense (DOD). It has twelve major programs available to foreign countries in order to
make purchases of their military needs. By law, the Secretary of State is responsible for
the continuous supervision and general direction of the SA programs. Annual SA demand
on the military supply systems have grown to nearly one million requisitions per service.
Table 2.1 lists the names of those twelve majors programs and who is responsible for the
administration.
Seven of these Foreign Assistance and Arms Export Controls are administered by
DOD, specifically by Defense Security Cooperation Agency (DSCA); the others fall
under general control of DOS. Also the FMS and Direct Commercial Sales are fully
funded by direct cash of the purchasing countries. Therefore, these activities do not
require congressional budget authorizations or appropriations.
Table 2.1 Twelve major Security Assistance programs
# Major Programs Names Acronyms Administered by 1 Foreign Military Sales FMS DSCA
2 Foreign Military Construction Services FMCS DSCA
3 Foreign Military Financing Program FMFP DSCA
4 Leases DSCA 5 Military Assistance Program MAP DSCA
6 International Military Education and Training IMET DSCA
7 Drawdown DSCA-DOD
8 Economic Support Fund ESF U.S. Agency for International Development
9 Peacekeeping Operations PKO DOS
10 International Narcotics Control and Law Enforcement
INCLE DOS
11 Nonproliferation, Antiterrorism, Demining, and related Programs
NADR DOS
12 Direct Commercial Sales DCS Directorate of Defense Trade Control (DOS) – ITAR
Other SAP
* Excess Defense Articles * Third Country Transfers EDA
Respect to the current U.S. program, two basic laws are involved, and both may
be amended by annual or biennial security assistance or foreign assistance authorization
acts. Those two laws are:
a) Foreign Assistance Act of 1961 (FAA)
b) Arms Export Control Act (AECA)
Figure 2.2 shows these acts and which applications fall within each.
Figure 2.2 Adaptations from Figure 2-1 MSA 29th Edition. Major Security Assistance -Authorization Act Since 1954
In general the AECA authorizes two ways in which a country or international
organization may purchase U.S. defense articles, services or training:
a) FMS: Government to government contract or LOA Case.
b) DCS: Allowing purchasing directly from US industry with an export
license issued by the DOS.
MUTUAL SECURITYACT 1954
ARMS EXPORTCONTROLACT 1976
FOREIGNMILITARY
SALESACT 1968
FOREIGNASSITANCE
ACT 1961
(EDA,IMET,ESF,PKO)
(FMS)
(FMFP, FMS, Commercial Exports)
Likewise, the DOD has identified areas where U.S. origin technology and other
sensitive information should be rigidly protected. The decision whether classified
military information will be released to a specific country is made case by case in order to
maintain the integrity of the U.S. defense. Also, there is a possibility to lease defense
articles in DOD stock if the President of the U.S. determines there is a compelling foreign
policy and national security reason to provide articles in leasing condition instead of
sales, and that elements are not used during this time for public use. In this case, the
receiving country agrees to pay all costs including depreciation and replacement costs.
The FMS process is an acquisition process where a foreign country or
international organization identifies a need for a military item or service and chooses to
purchase from the U.S. Government (USG). Under FMS, there is a signed government to
government agreement documented on a letter of offer and acceptance (LOA). In 2009,
80 countries and organizations were part of the program. Each LOA is referred to as a
“CASE” and an unique case identifier is assigned for accounting purposes. The LOA
becomes an agreement when the customer signs it and provides the payment specified in
the LOA. Each active LOA is assigned a unique case identifier, which enables both the
USG and the foreign purchaser to refer to it without any possibility of confusion. The
LOA is used to implement one of three types of FMS cases: a Defined Order, a Blanket
Order, or a Cooperative Logistics Supply Support Arrangement. In detail those three
options mean:
a) Defined Order: The defense articles are specified and quantified (significant military equipment).
b) Blanket Order: For a specific category of items or services (spares and repairs parts – publications – support equipment – maintenance – technical assistance - training). That is the most common cases used by AAF.
c) Cooperative Logistics Supply Support Arrangement: It is a Blanket order
but with more responsive follow on spare parts support for U.S. produced military hardware possessed by foreign countries.
Each of the military departments has its own dedicated FMS system to provide
internal control and management of SA transactions. These systems are used to monitor
the supply and financial performance of the implemented cases. The systems and codes
of the military departments are:
a) USARMY (CODE B): Centralized Integrated System for International Logistics (CISIL), and Program, Budget, and Accounting System (PBAS).
b) USNAVY (CODE P): Management Information System for
International Logistics (MISIL).
c) USAIRFORCE (CODE D): Case Management Control System (CMCS), and Security Assistance Management Information System (SAMIS).
Annually, the FMS system reviews each case. This review usually involves face
to face discussions to identify problems as early as possible. Since a major weapon
system sale may last for more than seven years, the FMS system has milestones and
metrics in order to ensure timely response. Also, the articles provided by FMS at
minimum should meet the same serviceability standards prescribed to the U.S. forces;
therefore the majorities of the items are new, unused or will have original appearance and
function as much as possible as a result of rebuild or overhaul.
One particular condition is the term Excess Defense Articles (EDA), which is
applied to U.S. defense articles which are no longer needed by the U.S. armed forces or
will not have an adverse impact on the U.S. technology and industry. It is possible to sell
EDA items under FMS with a price reduction of 50% to 95% of the original acquisition
value for new equipment or a no cost transfer (grant). For EDA the basis is: “as is, where
is”, Therefore, the customer bears any costs for repairs or modifications required to make
the materiel usable, packaging, handling and transportation costs. Not all countries want
to afford these risks, and requirements. Therefore, 55% of EDA offers are usually
declined (MSA 29th Edition 2010, Chapter 10 page 29).
Typically, FMS system sales consist of a weapon system that DOD has already
developed and produced. So, when a customer submits a requirement, the DOD can only
use its current inventory for FMS demands, without negatively impacting U.S. readiness
or proceed to procure the requirement by contracting with industry rather than supply
from stock. As a customer this is beneficial because they receive the same benefits and
protections that are built into the DOD acquisition process. In this case the FMS customer
is not a legal participant in the procurement contract with the industry; the USG is acting
on the FMS’s behalf. Moreover, the DOD maintains the same acquisition infrastructure
established to support its own acquisition and logistics needs.
In the case that the item required will be a standard item, the requirement will be
routed to the DOD inventory control point (ICP) and it will decide if the order should be
supported from the stock on hand, held on back order or placed on a purchase request for
procurement. However if the item is a nonstandard acquisition like systems that ended
operations but a FMS customer still continues operating like F4, F5 or A4 aircrafts, those
components may transition from being standard to nonstandard and the customer usually
has a minimum of two years to place a final order. In general, the Military Department
(MILDEP) has contracted with commercial buying services to procure them.
The LOA standard terms and conditions reflect the preference for competition in
contract awards to fulfill the requirement, but noncompetitive procurements are permitted
only with a respective justification. Competitive contract awards are the default
procurement method for FMS, but a FMS customer could formally request a
noncompetitive procurement like a sole source (specific firm) request. If this happens, the
FMS customer should have sufficient justification to demonstrate this is necessary to
meet the objective needs of the customer. The most common reasons are Urgent
requirement, Non standard item, Procurement history, Customer Source Selection and
Standardization.
When the requisition is a blanket order, the purchaser initiates the procedure,
assigns a unique document number, and passes the requirement to the International
Logistic Control Organizations (ILCO, e.g. AFSAC WPAFB U.S Air Force) for each
agency (Army, Navy or Air Force). The ILCO records the requisition in its database and
passes to the item manager. Each electronic transaction passes through an information
router, the Defense Automatic Addressing System Center (DAASC). DAASC receives,
edits, and routes logistics transactions for the military services at the Defense Logistic
Agency (DLA). DLA has inventory management responsibility for about 93 % of the
active National Stock Numbers (NSN), (MSA 29th Edition 2010, Chapter 10 page 8).
The ILCOs are the central control point that each service has established for SA
supply in order to handle the increasing annual demand of parts and to manage the
requirements. Each ILCO operates a unique SA computer data system (CISIL, MISIL,
SAMIS) that oversees all materiel LOAs and maintains the status of all requisitions in
process and the financial status of each case. The ILCO is not a supply activity; no
decision is made over supply from the stock or from procurement. That is a function of
the ICPs. Figure 2.3 from MSA 29th Edition Fig 10-1, shows this process.
Figure 2.3 Logistics Communications – Fig 10-1 MSA 29th Edition
Successful part acquisition in logistics depends on the availability of fast, accurate
and reliable communications systems. The International Logistics Communications
System (ILCS) was developed (1979) to improve logistics communications to SA
countries and allows a purchaser to exchange logistics information with DOD. Currently,
there are 46 countries connected, (MSA 29th Edition 2010, Chapter 10 page15).
Moreover, the Military Standard Requisitioning and Issue Procedures (MILSTRIP)
prescribe standard form and unique codes and procedures adaptable to high speed
PURCHASER DAASC ILCO
ICP
CONTRACTOR DEPOT
communications and automatic data processing with 80 record positions. One optional
system within the ILCS is the Supply Tracking and Repairable Return (STARR/PC). This
system provides the foreign purchaser logistics and financial information. The
STARR/PC is a standard, unified interface with the U.S. FMS three services logistics
system developed by AFSAC in 1988, which began to be used consistently from 1994 by
FMS customers. This is the system that we used to get the data for the study and to
perform analysis about the requirements transactions and their status.
One of the problems that many FMS customers face is the obsolesce or
Diminishing Manufacturing Sources and Material Shortages (DMSMS) due to the fact
that many of their U.S. origin systems are either in the process of, or already are, phased
out of the DOD inventory. Therefore, some programs have been implemented to mitigate
this issue. The Commercial Buying Services (CBS) involve the purchase of defense
articles and services that cannot be effectively acquired through other means. These
include:
a) Non standard items (not included in the DOD inventory or dissimilar DOD
systems configurations )
b) Commercial off the shelf items
c) Standard articles unobtainable within a reasonable time
d) Others reasons.
There is no ICP assigned responsibility for managing nonstandard items; therefore
manual procedures must be used to satisfy purchaser demands. This condition increases
the costs and time for U.S. and the purchaser. In general there are two special programs
to use:
a) Simplified Nonstandard Acquisition Process (SNAP) – U.S. Army
b) Parts and Repair ordering System (PROS) – U.S Air Force and U.S. Navy.
In a large system such FMS, errors happen. In order to respond to the purchaser,
the DOD recognizes this problem using the Discrepancy Report. A discrepancy is a
deviation from the standard in quality or quantity. The system considers four categories
of discrepancies:
a) Transportation.
b) Product quality.
c) Financial.
d) Supply, including shortage – overages – damage – insufficient remaining
shelf life – incorrect item, and misdirect shipment.
The previous paragraphs have summarized the necessary knowledge and concepts
of the FMS system in order to understand the research. Before concluding, we discuss
some aspects that also are applicable to an international SCH and may affect its
efficiency.
Other aspects
In an international and government SCH where the supplier and the customer are
distant and with different cultures, sometimes the classic logistics concept for a domestic
SCH would not be totally effective. Communications and transports services serve as
support and make the world smaller in context where there is a permanent demand for
improving delivery, lead time, cost, and product performance. The latest information and
communication technologies can easily exchange information between the members, but
even it is more important to improve the relationships with the members of the SCH.
Additionally, RA as a third world country developing their own country logistics also
involves a technological issue as well.
A military supply chain management is the discipline that integrates acquisition,
supply, maintenance, and transportation functions with the physical, financial,
information, and communications networks in a results-oriented approach to satisfy joint
force materiel (www.dtic/mil/doctrine). The acquisition process under FMS system is
slightly different between the military SCH and corporate organizations because the
military’s focus is on mission requirements rather than on quarterly earnings. This
particular difference is one of the main characteristics in the military market.
However, to be successful in that kind of SCH it is necessary to have some critical
factors like a solid organization, appropriate level of integration and standardization,
share good level of information and have the ability to solve legal disputes. Likewise, to
implement these activities will require additional training and culture changes by all
members (suppliers and customers). Continuous personnel training is one of the most
important issues at the moment to interact with the FMS system due to the complexity of
the language that the system uses (codes) and its timeframe as well.
Additionally to achieve efficiency, modernization and improving the complexity
of SCH should be necessary to diminish the barriers between the organizations. Such
barriers include: poor records, lack of prioritization (80%-20% Pareto analysis), readily
available information, lack of trust, fear to share information, outdated IT systems, poor
IT integration, training of personnel, weak logistic systems, different languages, and
unfamiliarity with the systems. One of the most important barriers includes political and
cultural differences. Adding to these inconveniences we have to consider the traditional
slowdowns resulting from crossing international borders, weather conditions and human
errors.
It is possible to lists some aspects that lessen the effectiveness of the SCH
processes:
a) Dissimilarities: Large geographical distance, language, low visibility.
b) Forecasting Complexities: Inaccuracy, communications difficulties.
c) Economical and Political Worries: Risk, variability, currency exchange
rates, political instability, trade barriers, bureaucracy, laws.
d) Infrastructural Insufficiency: Shortages in telecommunications, worker
skills, equipment, technology, new challenges.
However among the attributes that stand out in a domestic Logistics System (World
Competitive Yearbook – Garelli 1999) and have some impact in the SCH management
are:
a) Information System in order to integrate the SCH suppliers,
manufacturers, warehouses.
b) Workers skills, and fully understanding of the system.
c) Political environment regarding budgeting, planning and technical
standards.
Likewise, performances are one of the ways to analyze the efficiency of the SCH.
This is the role of measures and metrics because it affects the strategy, tactics and the
operation as a planning and control tool. In turn metrics have an important role to set
goals, evaluate performance and determine future courses of action (Gunasekaran 2004).
A complete set of performance measures are beyond the scope of this research and could
be a future line of study to improve the analysis of the efficiency in the use of the FMS
system.
This chapter considered many aspects with respect to the efficiency of the SCH
inside the FMS system in an international and government environment. The reader can
see the volume of the Defense business and some issues that affect the visibility and
control of the process mainly because of the intercultural aspects. Next, Chapter III will
show the methodology to analyze the data extracted from the STARR/PC database.
III. Methodology
Chapter I presented the motivation and the research questions that guide the
present study. Chapter II showed a literature review conducted on some concepts
regarding FMS acquisition of military articles and briefly described some factors that can
affect the efficiency of a supply chain with international features, long distance and
governments. Chapter III highlights the study's methodology needed to analyze the
purchases made by the AAF under the FMS system and to draw conclusions that
facilitate the management system at the highest level of decision.
Recall that the AAF began its activities in the Air Force Security Assistance
Center (AFSAC) in Wright Patterson Air Force Base (WPAFB) in June 1986 with the
opening of the purchasing office led by a Flight Liaison Officer. This office has remained
in operation to date and administers the various cases that the AAF demands. Thus, each
transaction that occurs during the execution of a purchase in one case is recorded in
AFSAC by digital files.
The AAF, unlike other countries, uses the Supply Tracking and Repairable Return
system (STARR/PC FMS Data Query and Reports). The STARR/PC produces every day
a series of master files with the information received from the three agency systems,
MISIL, CISIL, and SAMIS, duplicating the current status of a country’s updates
requisitions. Those records are then transmitted via the International Logistics
Communications System (ILCS). So, a new set of records will replace the last set of
master records. Thus, STARR/PC merely updates its data bases with the same status as
found in the DoD systems. Countries that have joined this system are Argentina, Brazil,
Chile, Colombia, Dominican Republic, Egypt, El Salvador, Finland, France, Guatemala,
Honduras, Israel, Korea, Malaysia, Mexico, Morocco, Peru, Philippines, Portugal, Saudi
Arabia, Singapore, Somalia, Spain, Sweden, Switzerland, Taiwan, Thailand, Tunisia and
NATO.
In this way a trained operator using the system menus is capable of tracking
various queries. For example, the status of a specific requirement, to include a specific
NSN, Transportation Control Number (TCN), contracts, cases, shipping discrepancies,
and financial status. These menus are useful to perform specific queries but they are
limited in producing an historical analysis of the different purchases status.
To perform a historical analysis it is necessary to access the data bases that feed
the STARR/PC and recover the master files. The master files, in the Argentina case, have
two files: a master and a master archive named MSMAST and MSMAST-ARC with the
same table format. These files can be converted to a traditional Excel® format, which
allows for easier data manipulation. The master table has forty five columns of data.
Table 3.1 shows the columns that are of interest and usefulness in this study.
Table 3.1 Useful Master Table columns names and explanations
Cell Nº Cell name Explanation 1 DOCNR Document Number 2 USSERV United States Service 3 LAST_8 Last 8 positions in the DOCNR 4 NSN National Stock Number 5 NIIN National Item Identification Number 6 RCASE Case 8 PRTY Country Priority 9 UI Unit of Issue Codes 10 CTY_SERV Country Service 12 FFCODE Freight Forward Code 13 ESTDOCID Establishment Doc ID - Document Identifier Codes 23 NMCS Non Mission Capable Supply
24 CREQSTAT Current Requesition STARR/PC Transaction – Requisition Transaction Status Codes
26 ESD Estimated Shipment Date 27 DTSHIPSTAT Date Shipment Status 28 DATENMCS Date NMCS 29 LSTAUTODOC Last STARR/PC Update to Document 30 LSTAUTSTAT Last STARR/PC update to Status 31 ESTRQNDT Establishment Requirement Date 32 UNTPRICE Unit Price 33 REQTY Requisition Quantity 34 CREQTY Current Requisition Quantity 35 CQTY Cancel Quantity 36 SQTY Shipped Quantity 37 FFREC Freight Forward Received 38 FFSHIP Freight Forward Shipment 39 FFREPREC Freight Forward Reparable Received 40 FFREPSHIP Freight Forward Reparable Shipped 41 CNTRYREC Country Received 42 ARCHDATE Archive Date 43 COMPLETED Completed 44 TRANSDTE Transportation Date 45 PROCDTE Procurement Date
For our study, we present a series of statistical calculations that allow us visibility
to the procurement process since 1994. In the case of Argentina, the master file tables
have a quantity of 28,229 records ranging from 1994 to procurement initiated on August
2012. The analysis is focused on three different aspects that produce some influence in
the DOCNR performance and their relationships. Figure 3.1 shows these relations and
include the following aspects:
a) Process characteristics: including which U.S. Services were the
supplier, a magnitude of successful or failed processes, fill rate,
acquisition type Standard or Non Standard, and level of
cancellations / rejections.
b) Time in the System: an analysis of the lead time of the acquisitions
considering several factors.
c) Regressions: obtaining predictors that reveal influence in the lead
time of the procured articles.
Figure 3.1 Document Number and its aspects relations
Characteristics
Time in theSystem
Predictors
DOCNR
For information on an acquisition it is necessary to process the available data.
However, it is not always possible to use all records for each analysis, because there is
some level of inconsistency, data entry errors or data transfer records. Despite this, there
is enough valid information to draw valid conclusions in each analysis. The approach is
to use as much data as possible for each case.
In general, the driver of the records is cell number 1 (DOCNR), which uniquely
identifies each request that the customer makes, regardless of whether the requirement is
consolidated with more than one type of requirement. This means that each requirement
is assigned a single DOCNR. Moreover, in the situation that the order was cancelled for
some reason and the customer subsequently enters the same requirement again it will be
given a new DOCNR.
The different procedures used to perform an historical analysis are listed below
and explains the method used and/or cells considered. At this point the reader may refer
back to Table 3.1 that explains the meaning of each cell.
Process Characteristics
a) Percentage of processes initiated by U.S. Service: Each service, ARMY,
NAVY or USAF, has a unique code that identifies each other and is
registered in cell number 2 of the master file, “USSERV”. The total
number of procurement processes in the system consist of 28,229 records;
a percentage of acquisitions initiated through each service is obtained.
Those assigned the code “B” were initiated by the ARMY, those with “D”
the USAF and those with “P” the NAVY.
b) Percentage of successful processes versus cancellations or rejections: The
status of the procurement will change along the process. Each change is
reflected by a different code according to the change type. The meanings
of those codes are in Appendix B Document Identifier Codes (DIC) of the
Military Standard Requisitioning and Issue Procedures (MILSTRIP). In
the master file those codes are recorded in cell number 29
“LSTAUTODOC”, which include the last update of the system. So, it is
possible to differentiate those procedures that were successful versus those
that were rejected or cancelled for any reason.
There are three codes that return direct information about successful
acquisitions. Those are the codes: “XDF”, which indicate that the materiel
was received by the customer; “XDI”, which indicate that the materiel was
received by the freight forward; and “XDS”, which indicate an outbound
shipment report. Other codes in the same cell indicate a different action,
for instance the code “AE2 is used to say that a prior action is necessary to
continue the supply procedure. The code “AEE” indicates a status of
supply and is prepared for FMS to provide aid to the customer in the
request. Lastly, the code “AS2 is a shipment status.
So, the first three codes return directly a quantity but the last three codes
are necessary to disaggregated the information from another cells in order

to identify whether the procurement finally is a success or a failure. For
code “AE2”and code “AEE” the cell used is number 30 “LSTAUTSTAT”
which records the requisition Transaction Status Codes (18 DLA Customer
Assistance Handbook 2011 edition – page 127) and assigns a status of
success or failure to the procedure. While for code “AS2”, we use the cell
number 24 “CREQSTAT”, which records again a Transaction Status
Codes for these procedures. Figure 3.2 shows the structure of the different
possibilities to these status codes on the master table.
Figure 3.2 Status Codes in the master file
c) Percentage of Fill rate: Another index that can be obtained at this time is
the percentage of fill rate or percentage that the orders were completed. In
XDFMateriel received by the customer
XDSOutbound shipment report
XDIMateriel received by the FF
Successful Procurements
AE2
AEE
AS2
Second Action is needed
CELL Nº 29 LSTAUTODOCCELL Nº 24 CREQSTAT CELL Nº 30LSTAUTSTAT
this case each order shows a variation in the percentage of the fill rate
between 0% - 100% and sometimes exceeds 100% because AAF receives
more articles than required. To calculate this number use cell number 33
“REQTY”, which records the initial required amount of items, cell number
34 “CREQTY”, the current amount required which may vary from the
original quantity required, and cell number 36 “SQTY”, the quantity
finally shipped. Therefore, both percentages are obtained for each
document: one from the shipped quantity and the initial required quantity
(SQTY / REQTY) and the other between the shipment quantity and the
current required quantity (SQTY / CREQTY).
Then, we proceed to make an average of all percentages across the master
file for both options. This index is an aggregate indicator that returns a
percentage to the manager to help visualize the extent in which orders
filled are. We can also remove the orders that were fully cancelled by the
customer, so the result is a rate closer to reality. In this case use the
difference between “CREQTY”, and the cell number 35 “CQTY”, remove
the orders with no zero value, and proceed to do the average percentage of
the ratio SQTY / CREQTY.
d) Number of procedures considered Standard and Non Standard: One of the
features to consider about the requirements is whether procurement is
Standard or Non Standard type. In cell number 13 “ESTDOCID”, record
the code corresponding to the status of the request. In general, requisitions
bearing document identifier A01 (Standard) are clearly defined by a NSN,
and requisitions bearing document identifier A05 (Non Standard) are used
when the requisition contains a part number and data in the remarks fields.
Examples of exception data include further identification data, exceptions
to normal mode of delivery, and exception to levels of protection. There
are other codes like A02 for overseas requisitions with a part number, A04
which is used for requisitions that contain other than a NSN or part
number, and BMB requisitions for ARMY publications. The codes A01,
A02, A04, A05, and BMB are requisitions codes and were used to
determine which percentage of requirements were processed as Standard
and those as Non Standard. Particularly codes A01, A02, A04, and BMB
are Standard processes, and A05 is a Non Standard process. We created
another category "other" to concentrate the rest of the codes not
considered previously.
e) Number of successful and canceled or rejected acquisitions by type
Standard or Non Standard: In this case and using the type of acquisition
we differentiate the procedures which have successfully completed and
which have been canceled or rejected in magnitude and percentage. The
result is achieved via sorting and counting the procedures using cell
number 13 “ESTDOCID” and the different Document Identifier Codes in
cell number 29 and the different Transaction Status Codes recorded in cell
numbers 24 and 30. So, according to this analysis it is possible to
distinguish three categories: successes, cancellations/reject, and back
orders/delays.
f) Comparison Standard and Non Standard procurement across the years:
Taking only the successful procedures, codes “XDF”, “XDI” or “XDS” in
the LSTAUTODOC column and sorting and counting by year, it is
possible to view the progression of the procurement through the years by
the type of the contract.
g) Cancellations and Rejections Reasons: Taking only the cancellations or
rejections codes from the previous success or failure analysis we can
isolate the reasons and make a count of the different causes and identify
what are the main causes of this situation. After that, it is possible to
distinguish which causes originated from the customer and which ones
come from the supplier. By identifying these reasons, a manager may set a
desirable level of rejection and take the necessary actions to achieve the
accepted level.
h) Cancellations or rejections across the years: A further analysis is to look at
the total number of cancellation/rejection procedures in a corresponding
year. Hence it is possible to check if throughout the years the level of
cancellations/rejections increase or decrease. This might reveal a learning
curve with the system. Also it is possible to check a relative
cancellation/rejection magnitude regarding the volume of procurements
processed in each year and verify if the cancellations/rejections relative to
volume increase or decrease.
Time in the System
One derived indicator to learn is how much time passes from the moment the
operator places an order in the system until the material is shipped to the warehouse in
Washington, DC. This metric represents the system's lead average time and knowing this
value improves planning capability. The master file has inside several dates and is
possible to distinguish the starting and ending point for the process.
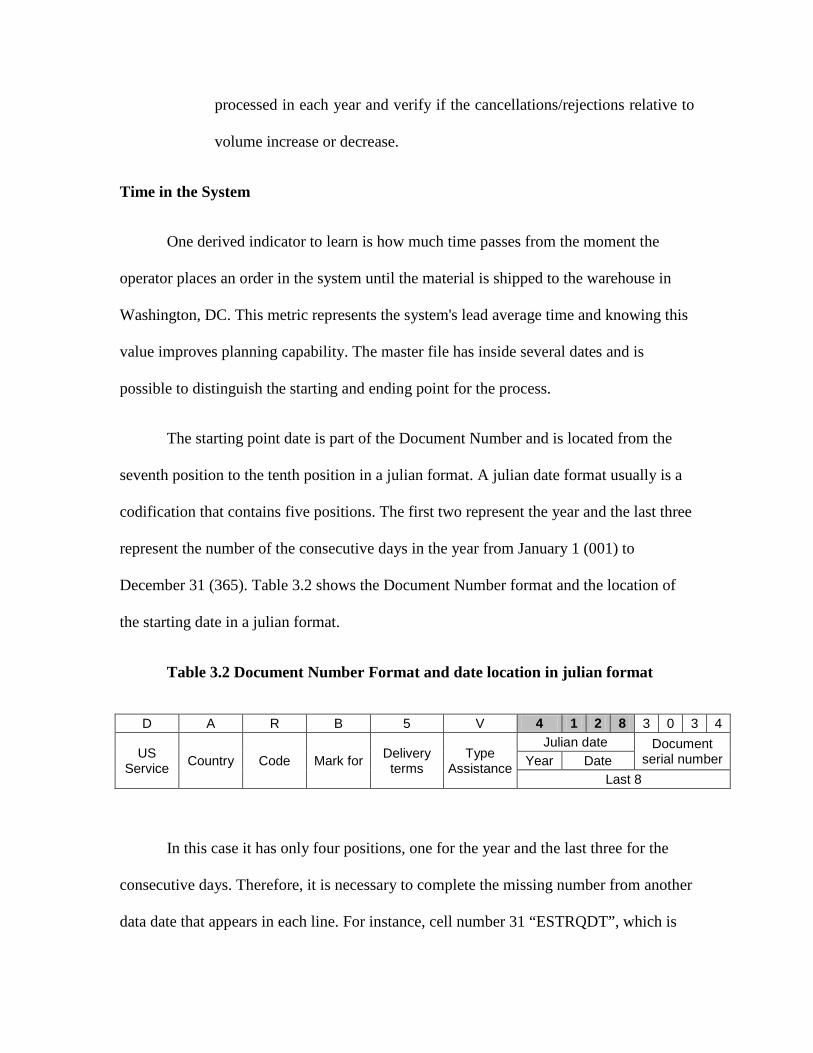
The starting point date is part of the Document Number and is located from the
seventh position to the tenth position in a julian format. A julian date format usually is a
codification that contains five positions. The first two represent the year and the last three
represent the number of the consecutive days in the year from January 1 (001) to
December 31 (365). Table 3.2 shows the Document Number format and the location of
the starting date in a julian format.
Table 3.2 Document Number Format and date location in julian format
In this case it has only four positions, one for the year and the last three for the
consecutive days. Therefore, it is necessary to complete the missing number from another
data date that appears in each line. For instance, cell number 31 “ESTRQDT”, which is
D A R B 5 V 4 1 2 8 3 0 3 4
US Service Country Code Mark for Delivery
terms Type
Assistance
Julian date Document serial number Year Date
Last 8
the date that the system recognizes the order, is fairly similar to the previous starting date.
After extracting these characters, we transform to a Gregorian format in order to obtain
the ending date and get a delta date value. The ending date is in cell number 44
“TRANSDTE”, which is the date that the system registered the shipment to the Argentina
warehouse and it is in a Gregorian format. With these two values available it is possible
to sort in different ways the data and observe which statistic characteristics have each
option. The data analyzed are the successful procurements indicated with XDF, XDS, and
XDI codes in the “LSTAUTODOC” column and possesses complete date values. This
calculation results in 14,172 records.
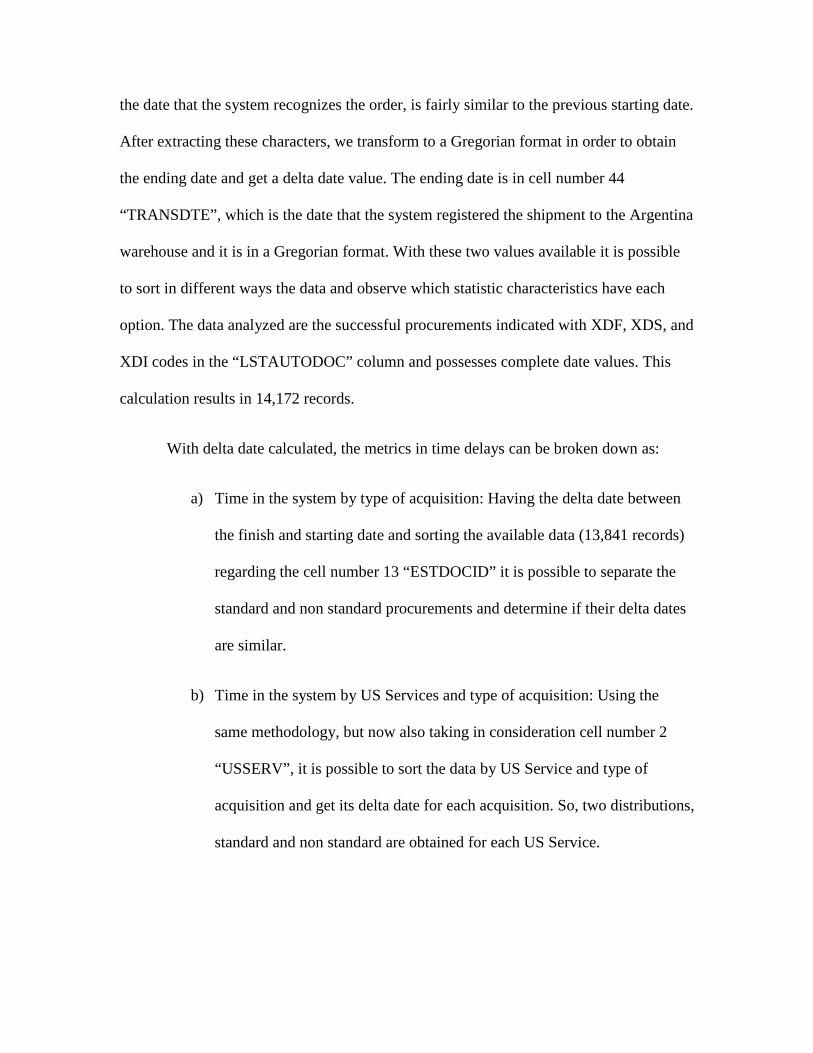
With delta date calculated, the metrics in time delays can be broken down as:
a) Time in the system by type of acquisition: Having the delta date between
the finish and starting date and sorting the available data (13,841 records)
regarding the cell number 13 “ESTDOCID” it is possible to separate the
standard and non standard procurements and determine if their delta dates
are similar.
b) Time in the system by US Services and type of acquisition: Using the
same methodology, but now also taking in consideration cell number 2
“USSERV”, it is possible to sort the data by US Service and type of
acquisition and get its delta date for each acquisition. So, two distributions,
standard and non standard are obtained for each US Service.

While investigating time delay in the system, we learned of an interesting fact.
The FLO has limited decision authority. When a question is received from the system
that the FLO must address before procurement proceeds, the FLO cannot answer it
directly even though the FLO has the professional knowledge to do that. Instead the FLO
must ask the AAF headquarters in Argentina. This situation extends the time in the
system, is time consuming, contributes to a lack of visibility, and could increase
unnecessary error.
Regressions
This part of the study addresses possible correlations between predictor variables
and time in the system represented by delta date values, a difference between cell number
44 “TRANSDTE” and the Document Number ID date. Hence it is possible to evaluate
the influence of some particular variables existing in the data base over time and detect
whether any variable has more impact in the acquisition time than others. Also it is
possible to construct a regression model with those variables to predict what will be the
length of time in the system for a future acquisition and may give the manager an
opportunity to improve planning and procedures. In order to perform this analysis the
study uses pairwise correlation methods and multivariate linear regression. In both cases
we observe how strong the relation is between variables; meaning that a change in one
variable represents some change in the other, where a R2 (coefficient of determination)
close to 1 means a strong correlation between them. We also have to check for each
variable's significance. For each hypothesis test, we set the level of significance at 0.05.

The subset of the data base for this analysis is taken from the acquisitions with a
code XDF, XDS, and XDI in cell number 29 “LSTAUTODOC”. The database consists of
procurements that have a correct Federal Supply Classification according to the H2
Handbook Manual of the Defense Logistic Agency 2003 Edition, must possess a correct
country priority and finally a code indicating standard and non standard acquisition type.
So, after selecting the data we have available a subset with 12,258 records along with
four possible variables.
a) Country Priority: A priority designator is used in the acquisition system
which is based on two factors. The first is the Force Activity Designator
(FAD) that the Joint Chiefs of Staff assigned in their directive CJCSI
4110.01 to each foreign country, the second is the Urgency of need (UND)
category (A: Extremely urgent requirement, B: Less urgent requirement,
C: Routine requirement) which is set by the customer. The cell number 8
“PRTY” records the country priority. This code in conjunction with the
delta date associated with each acquisition allows us to test the correlation
in order to determine whether the country priority has any impact in the
time in the system. Table 3.3 shows the different country priorities
according to the FAD and the UND.
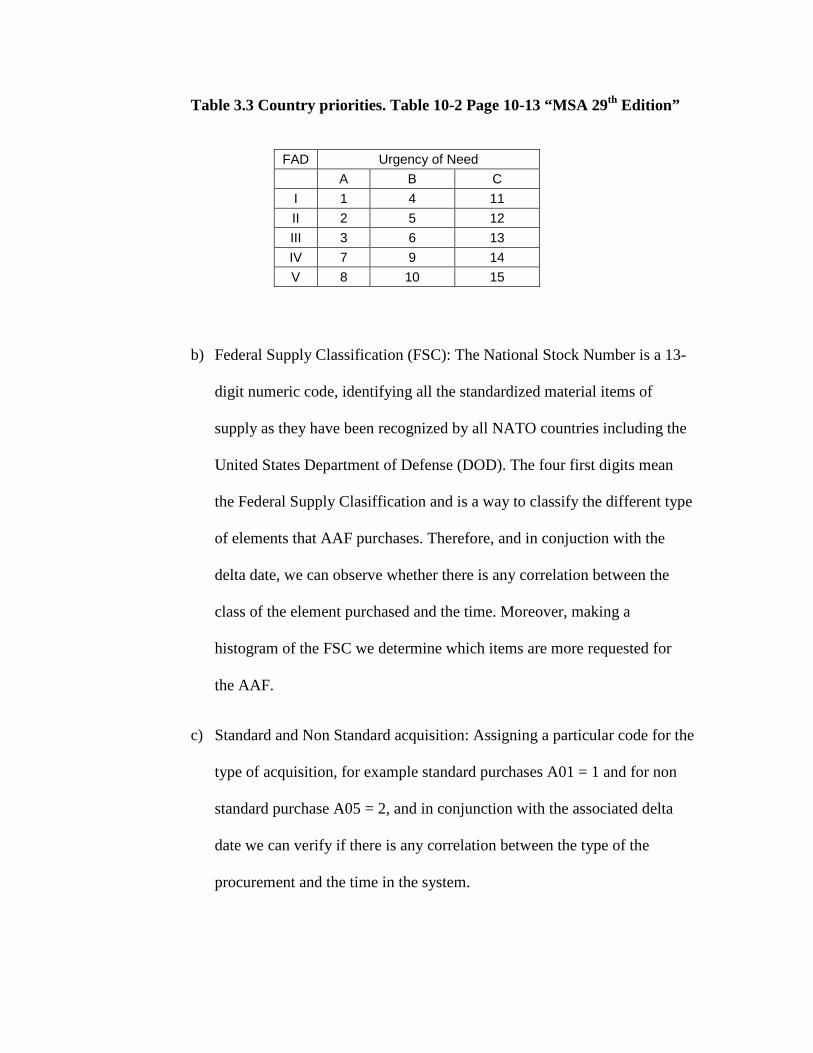
Table 3.3 Country priorities. Table 10-2 Page 10-13 “MSA 29th Edition”
b) Federal Supply Classification (FSC): The National Stock Number is a 13-
digit numeric code, identifying all the standardized material items of
supply as they have been recognized by all NATO countries including the
United States Department of Defense (DOD). The four first digits mean
the Federal Supply Clasiffication and is a way to classify the different type
of elements that AAF purchases. Therefore, and in conjuction with the
delta date, we can observe whether there is any correlation between the
class of the element purchased and the time. Moreover, making a
histogram of the FSC we determine which items are more requested for
the AAF.
c) Standard and Non Standard acquisition: Assigning a particular code for the
type of acquisition, for example standard purchases A01 = 1 and for non
standard purchase A05 = 2, and in conjunction with the associated delta
date we can verify if there is any correlation between the type of the
procurement and the time in the system.
FAD Urgency of Need A B C I 1 4 11 II 2 5 12 III 3 6 13 IV 7 9 14 V 8 10 15
d) U.S. Service: In the same manner assigning a particular code to each U.S.
Service like Army Code B = 1, and Navy Code D = 2, and USAF Code P
= 3 and in conjunction with the delta date it is possible to detect any
correlation between the U.S. Service and the time in the system.
The prior explanations and paragraphs in this chapter explain the methodology the
study uses in order to arrive at our conclusions and answer the research questions. Those
results are presented in the next chapter. In Chapter V, we discuss these conclusions and
findings.
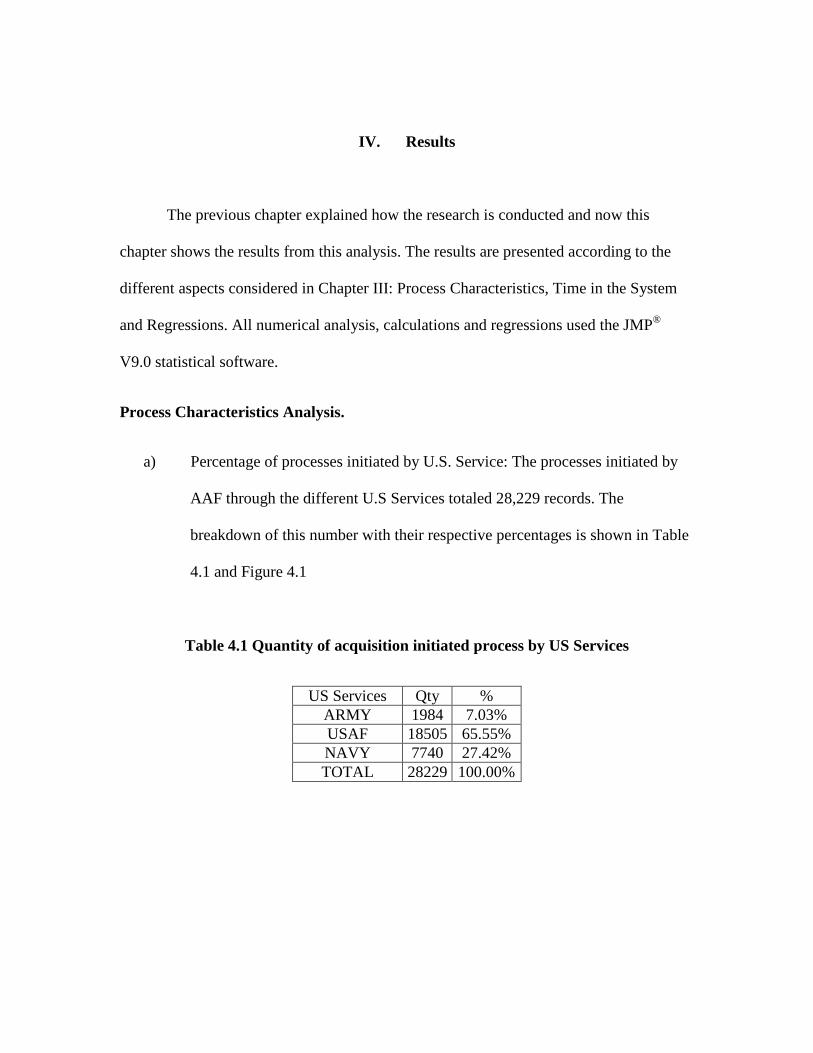
IV. Results
The previous chapter explained how the research is conducted and now this
chapter shows the results from this analysis. The results are presented according to the
different aspects considered in Chapter III: Process Characteristics, Time in the System
and Regressions. All numerical analysis, calculations and regressions used the JMP®
V9.0 statistical software.
Process Characteristics Analysis.
a) Percentage of processes initiated by U.S. Service: The processes initiated by
AAF through the different U.S Services totaled 28,229 records. The
breakdown of this number with their respective percentages is shown in Table
4.1 and Figure 4.1
Table 4.1 Quantity of acquisition initiated process by US Services
US Services Qty % ARMY 1984 7.03% USAF 18505 65.55% NAVY 7740 27.42% TOTAL 28229 100.00%
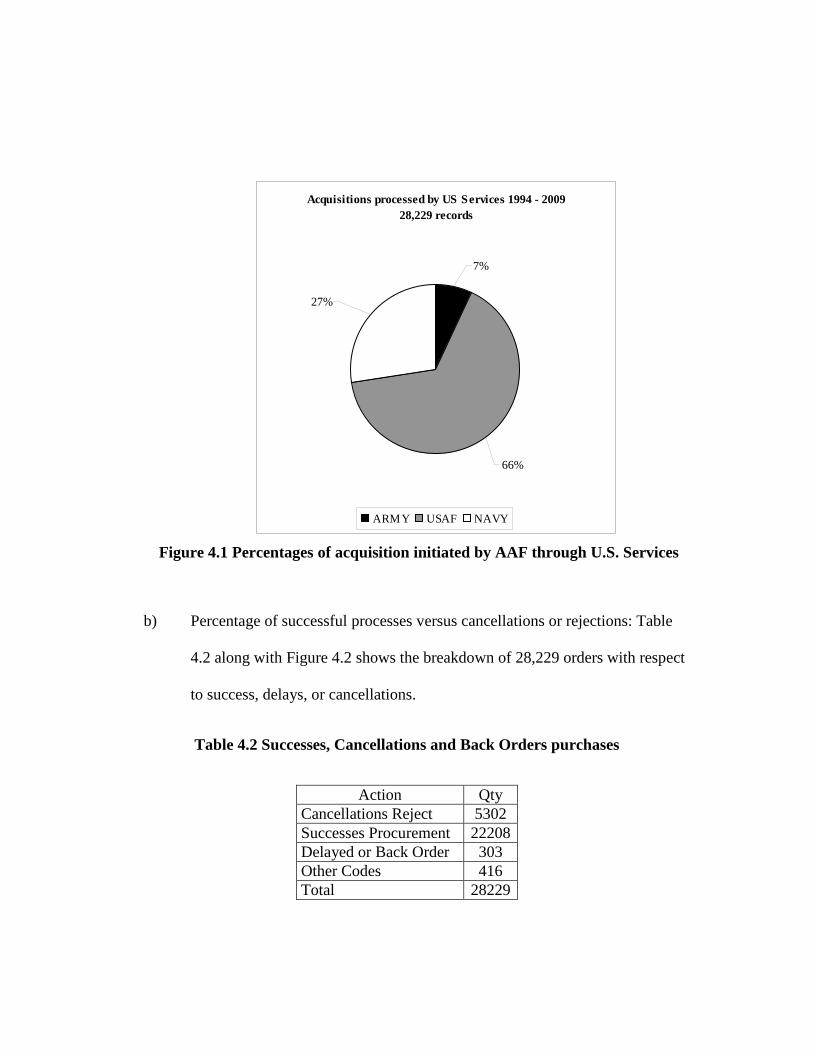
Figure 4.1 Percentages of acquisition initiated by AAF through U.S. Services
b) Percentage of successful processes versus cancellations or rejections: Table
4.2 along with Figure 4.2 shows the breakdown of 28,229 orders with respect
to success, delays, or cancellations.
Table 4.2 Successes, Cancellations and Back Orders purchases
Action Qty Cancellations Reject 5302 Successes Procurement 22208 Delayed or Back Order 303 Other Codes 416 Total 28229
Acquisitions processed by US Services 1994 - 2009 28,229 records
27%
7%
66%
ARMY USAF NAVY
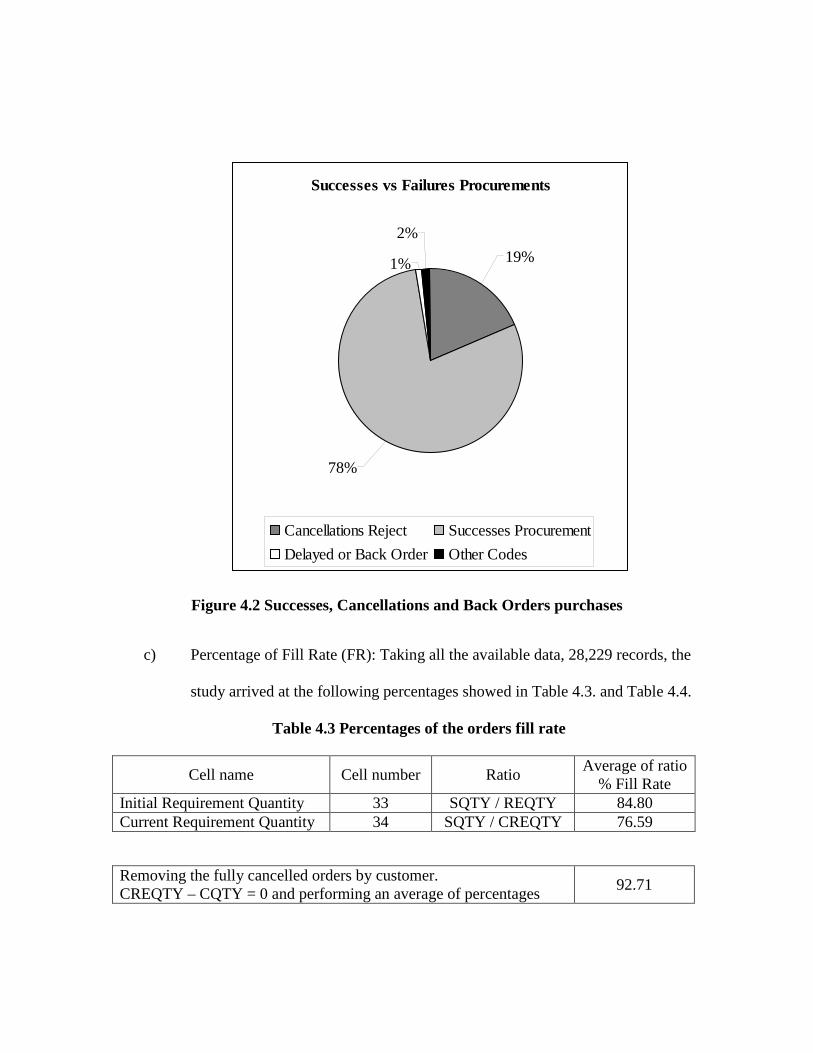
Figure 4.2 Successes, Cancellations and Back Orders purchases
c) Percentage of Fill Rate (FR): Taking all the available data, 28,229 records, the
study arrived at the following percentages showed in Table 4.3. and Table 4.4.
Table 4.3 Percentages of the orders fill rate
Cell name Cell number Ratio Average of ratio % Fill Rate
Initial Requirement Quantity 33 SQTY / REQTY 84.80 Current Requirement Quantity 34 SQTY / CREQTY 76.59
Removing the fully cancelled orders by customer. CREQTY – CQTY = 0 and performing an average of percentages 92.71
Successes vs Failures Procurements
1%
2%19%
78%
Cancellations Reject Successes ProcurementDelayed or Back Order Other Codes
Table 4.4 Quantity of order corresponding to different FR percentages
Requirement Quantity Cell
Current Requirement Quantity Cell
Removing the full cancelled orders
Percentage Quantity Quantity Quantity FR = 0% 6326 6224 124 FR <= 50% 662 526 20 50% < FR < 100% 434 384 14 100% 20492 20910 22834 FR >= 100% 223 8 0 Orders with: * Req. Qty or Current Req Qty = 0 * Full cancelled
92 177 5237
Total 28229 28229 28229
d) Number of procedures considered Standard and Non Standard: 28,229
processes initiated Standard or Non Standard. Of these, only 24,909 are
denominated as a requisition action. Table 4.5 shows the different quantities
assigned to the corresponding code, for all 28,229 processes. Table 4.6 shows
a summary of the quantity orders. Meanwhile, Figure 4.3 shows a graph
representing those percentages.
Table 4.5 Orders quantities assigned to each code in the ESTDOCID cell
Cell name Orders
Quantity Observations ESTDOCID All codes
No Code 2027 Any kind of cancellations Code N8: Processing criteria preclude supply action after BW code
1877 150 A01 17517 Requisition Overseas NSN A02 8 Requisition Overseas Part Number A04 373 Requisition Overseas with other A05 6993 Requisition Overseas with exception A0X 15 N/A information AT1 39 Follow-up Overseas NSN BMB 18 Requisition Army Publication C0N 381 USAF CASES SAMIS C0: Customer Order C0P 9 USAF CASES SAMIS C0R 41 USAF CASES SAMIS MG1 43 N/A Information X01 88 NAVICP MISIL X04 146 NAVICP MISIL X05 83 NAVICP MISIL X0A 9 NAVICP MISIL X0F 3 NAVICP MISIL X0J 7 NAVICP MISIL XDC 13 Materiel Return XG3 69 Rejected Customer Requisition XKJ 1 NAVICP MISIL XL1 305 NAVICP MISIL XL4 1 NAVICP MISIL XL5 38 N/A Information XPI 1 NAVICP MISIL XZQ 1 N/A Information
28229
Table 4.6 Data code summary
Type of procurement Qty Total Percent A01 17517
17916 63.5% A02 8 A04 373 BMB 18 A05 6993 6993 24.8%
Other (Including some cancellations, Follow-up) 3320 3320 11.7%
Total 28229 100.00%
Figure 4.3 Percentages of Standard and Non Standard acquisitions
e) Number of successful, canceled or rejected acquisitions by type Standard or
Non Standard: Table 4.7 shows the different amount of orders corresponding
to each category, Standard and Non Standard, and distinguishing among
Successes, Cancellations or Back Orders (BB) and Delays. Meanwhile Figure
4.4 shows a graph of these values.
Comparison between Standard and Non standard processes
68%
27%
5%
Standard Non Standard Other
Table 4.7 Quantity of orders categorized by type and Successes, Failures or BB
Standard (A01+ A02 + A04)
Non Standard A05 Other Codes
Successes 15353 2175 Cancellations or Rejects 1890 1503 Back Orders or Delays 102 20 Other Codes 552 3296 3338
Subtotal 17897 6994 3338 Total 28229
Figure 4.4 Comparison of the Successes, Cancellations or Rejects and BB by type of acquisition
f) Comparison of Standard and Non Standard procurement across the years:
Figure 4.5 shows a comparison of the procurements categorized by type
Comparison success and failures process by type
102
2175
1503
20
1890
15353
0%
10%
20%
30%
40%
50%
60%
70%
80%
90%
100%
Success Cancelation or Reject Back Order or Delay
Standard (A01+A02+A04) Non Standard A05
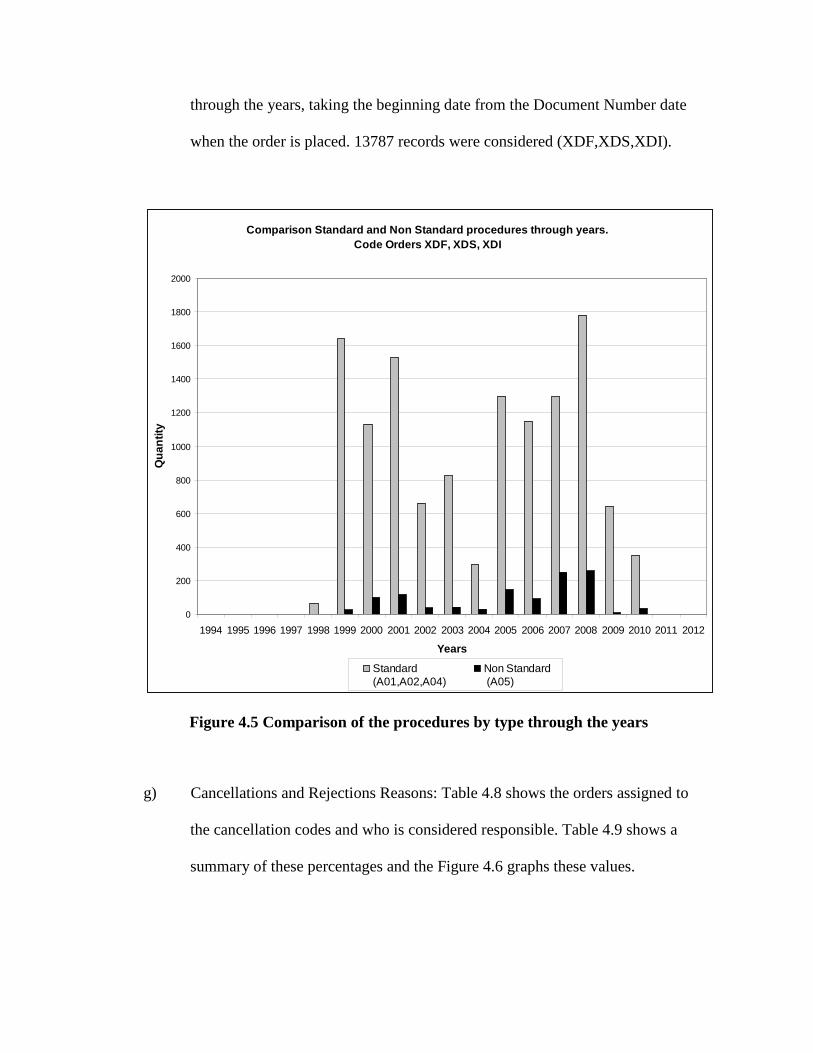
through the years, taking the beginning date from the Document Number date
when the order is placed. 13787 records were considered (XDF,XDS,XDI).
Comparison Standard and Non Standard procedures through years. Code Orders XDF, XDS, XDI
0
200
400
600
800
1000
1200
1400
1600
1800
2000
1994 1995 1996 1997 1998 1999 2000 2001 2002 2003 2004 2005 2006 2007 2008 2009 2010 2011 2012
Years
Qua
ntity
Standard (A01,A02,A04)
Non Standard (A05)
Figure 4.5 Comparison of the procedures by type through the years
g) Cancellations and Rejections Reasons: Table 4.8 shows the orders assigned to
the cancellation codes and who is considered responsible. Table 4.9 shows a
summary of these percentages and the Figure 4.6 graphs these values.
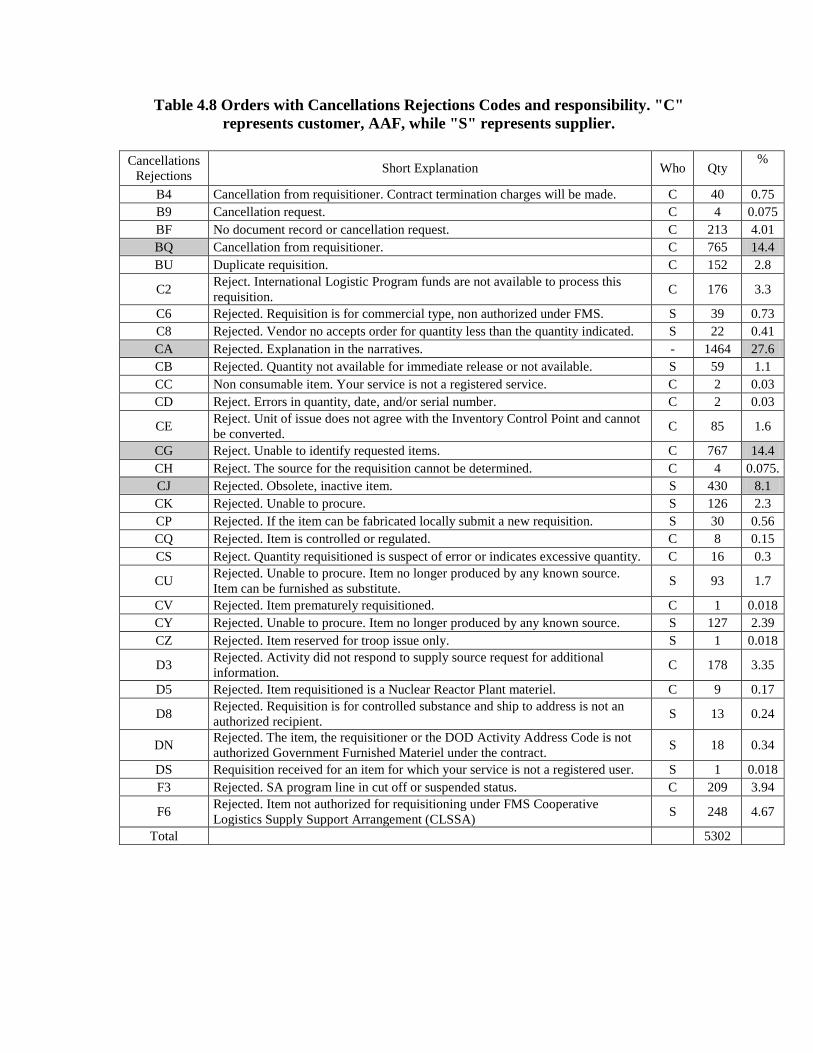
Table 4.8 Orders with Cancellations Rejections Codes and responsibility. "C" represents customer, AAF, while "S" represents supplier.
Cancellations
Rejections Short Explanation Who Qty %
B4 Cancellation from requisitioner. Contract termination charges will be made. C 40 0.75 B9 Cancellation request. C 4 0.075 BF No document record or cancellation request. C 213 4.01 BQ Cancellation from requisitioner. C 765 14.4 BU Duplicate requisition. C 152 2.8
C2 Reject. International Logistic Program funds are not available to process this requisition. C 176 3.3
C6 Rejected. Requisition is for commercial type, non authorized under FMS. S 39 0.73 C8 Rejected. Vendor no accepts order for quantity less than the quantity indicated. S 22 0.41 CA Rejected. Explanation in the narratives. - 1464 27.6 CB Rejected. Quantity not available for immediate release or not available. S 59 1.1 CC Non consumable item. Your service is not a registered service. C 2 0.03 CD Reject. Errors in quantity, date, and/or serial number. C 2 0.03
CE Reject. Unit of issue does not agree with the Inventory Control Point and cannot be converted. C 85 1.6
CG Reject. Unable to identify requested items. C 767 14.4 CH Reject. The source for the requisition cannot be determined. C 4 0.075. CJ Rejected. Obsolete, inactive item. S 430 8.1 CK Rejected. Unable to procure. S 126 2.3 CP Rejected. If the item can be fabricated locally submit a new requisition. S 30 0.56 CQ Rejected. Item is controlled or regulated. C 8 0.15 CS Reject. Quantity requisitioned is suspect of error or indicates excessive quantity. C 16 0.3
CU Rejected. Unable to procure. Item no longer produced by any known source. Item can be furnished as substitute. S 93 1.7
CV Rejected. Item prematurely requisitioned. C 1 0.018 CY Rejected. Unable to procure. Item no longer produced by any known source. S 127 2.39 CZ Rejected. Item reserved for troop issue only. S 1 0.018
D3 Rejected. Activity did not respond to supply source request for additional information. C 178 3.35
D5 Rejected. Item requisitioned is a Nuclear Reactor Plant materiel. C 9 0.17
D8 Rejected. Requisition is for controlled substance and ship to address is not an authorized recipient. S 13 0.24
DN Rejected. The item, the requisitioner or the DOD Activity Address Code is not authorized Government Furnished Materiel under the contract. S 18 0.34
DS Requisition received for an item for which your service is not a registered user. S 1 0.018 F3 Rejected. SA program line in cut off or suspended status. C 209 3.94
F6 Rejected. Item not authorized for requisitioning under FMS Cooperative Logistics Supply Support Arrangement (CLSSA) S 248 4.67
Total 5302
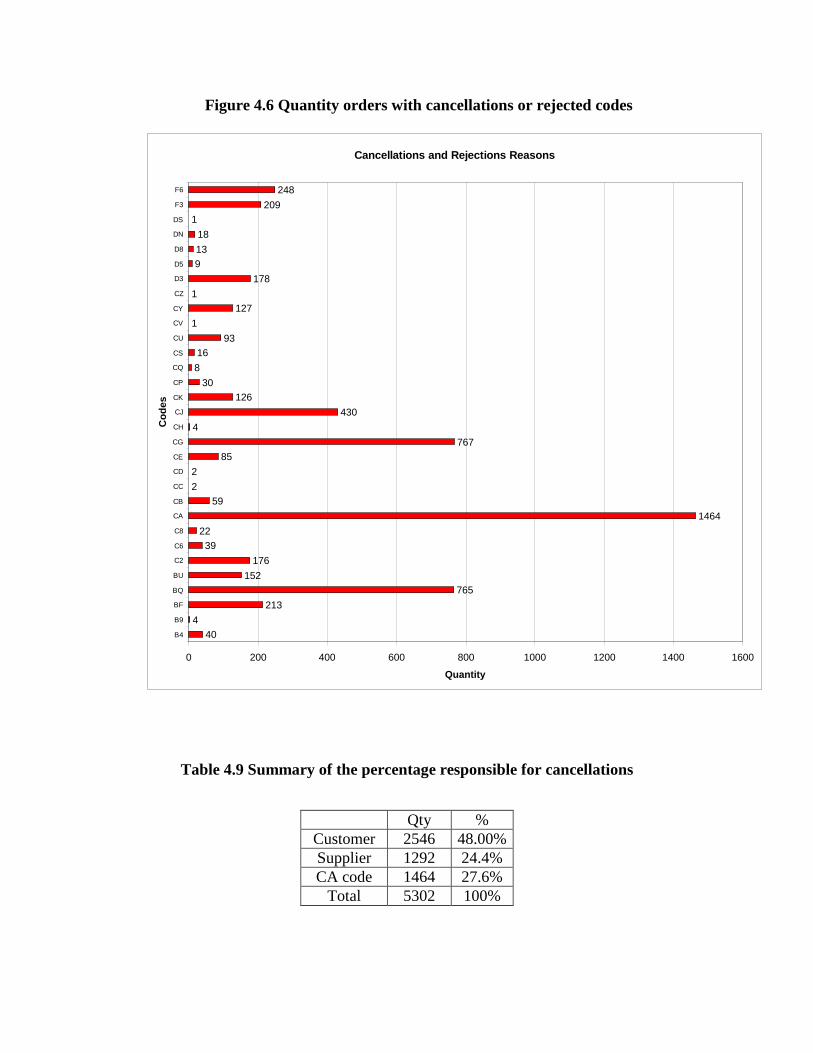
Figure 4.6 Quantity orders with cancellations or rejected codes
Cancellations and Rejections Reasons
404
213765
152176
3922
146459
22
85767
4430
12630
816
931
1271
17891318
1209
248
0 200 400 600 800 1000 1200 1400 1600
B4
B9
BF
BQ
BU
C2
C6
C8
CA
CB
CC
CD
CE
CG
CH
CJ
CK
CP
CQ
CS
CU
CV
CY
CZ
D3
D5
D8
DN
DS
F3
F6
Cod
es
Quantity
Table 4.9 Summary of the percentage responsible for cancellations
Qty % Customer 2546 48.00% Supplier 1292 24.4% CA code 1464 27.6%
Total 5302 100%
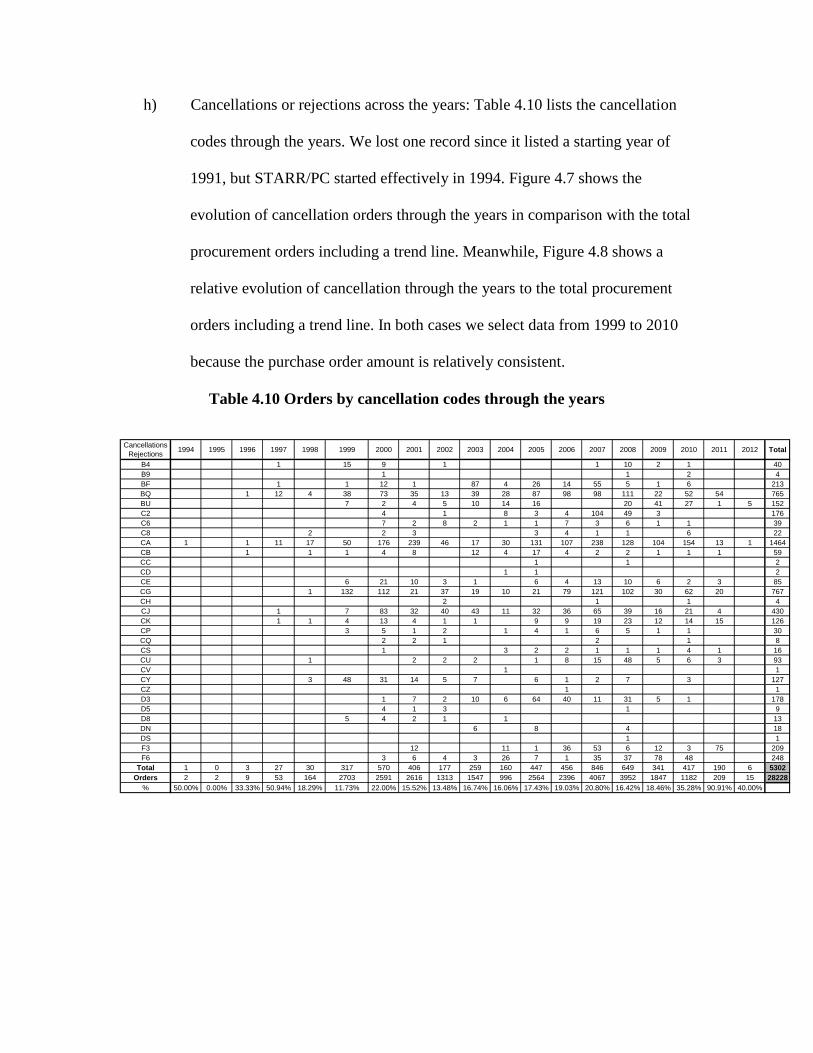
h) Cancellations or rejections across the years: Table 4.10 lists the cancellation
codes through the years. We lost one record since it listed a starting year of
1991, but STARR/PC started effectively in 1994. Figure 4.7 shows the
evolution of cancellation orders through the years in comparison with the total
procurement orders including a trend line. Meanwhile, Figure 4.8 shows a
relative evolution of cancellation through the years to the total procurement
orders including a trend line. In both cases we select data from 1999 to 2010
because the purchase order amount is relatively consistent.
Table 4.10 Orders by cancellation codes through the years
Cancellations Rejections 1994 1995 1996 1997 1998 1999 2000 2001 2002 2003 2004 2005 2006 2007 2008 2009 2010 2011 2012 Total
B4 1 15 9 1 1 10 2 1 40B9 1 1 2 4BF 1 1 12 1 87 4 26 14 55 5 1 6 213BQ 1 12 4 38 73 35 13 39 28 87 98 98 111 22 52 54 765BU 7 2 4 5 10 14 16 20 41 27 1 5 152C2 4 1 8 3 4 104 49 3 176C6 7 2 8 2 1 1 7 3 6 1 1 39C8 2 2 3 3 4 1 1 6 22CA 1 1 11 17 50 176 239 46 17 30 131 107 238 128 104 154 13 1 1464CB 1 1 1 4 8 12 4 17 4 2 2 1 1 1 59CC 1 1 2CD 1 1 2CE 6 21 10 3 1 6 4 13 10 6 2 3 85CG 1 132 112 21 37 19 10 21 79 121 102 30 62 20 767CH 2 1 1 4CJ 1 7 83 32 40 43 11 32 36 65 39 16 21 4 430CK 1 1 4 13 4 1 1 9 9 19 23 12 14 15 126CP 3 5 1 2 1 4 1 6 5 1 1 30CQ 2 2 1 2 1 8CS 1 3 2 2 1 1 1 4 1 16CU 1 2 2 2 1 8 15 48 5 6 3 93CV 1 1CY 3 48 31 14 5 7 6 1 2 7 3 127CZ 1 1D3 1 7 2 10 6 64 40 11 31 5 1 178D5 4 1 3 1 9D8 5 4 2 1 1 13DN 6 8 4 18DS 1 1F3 12 11 1 36 53 6 12 3 75 209F6 3 6 4 3 26 7 1 35 37 78 48 248
Total 1 0 3 27 30 317 570 406 177 259 160 447 456 846 649 341 417 190 6 5302Orders 2 2 9 53 164 2703 2591 2616 1313 1547 996 2564 2396 4067 3952 1847 1182 209 15 28228
% 50.00% 0.00% 33.33% 50.94% 18.29% 11.73% 22.00% 15.52% 13.48% 16.74% 16.06% 17.43% 19.03% 20.80% 16.42% 18.46% 35.28% 90.91% 40.00%
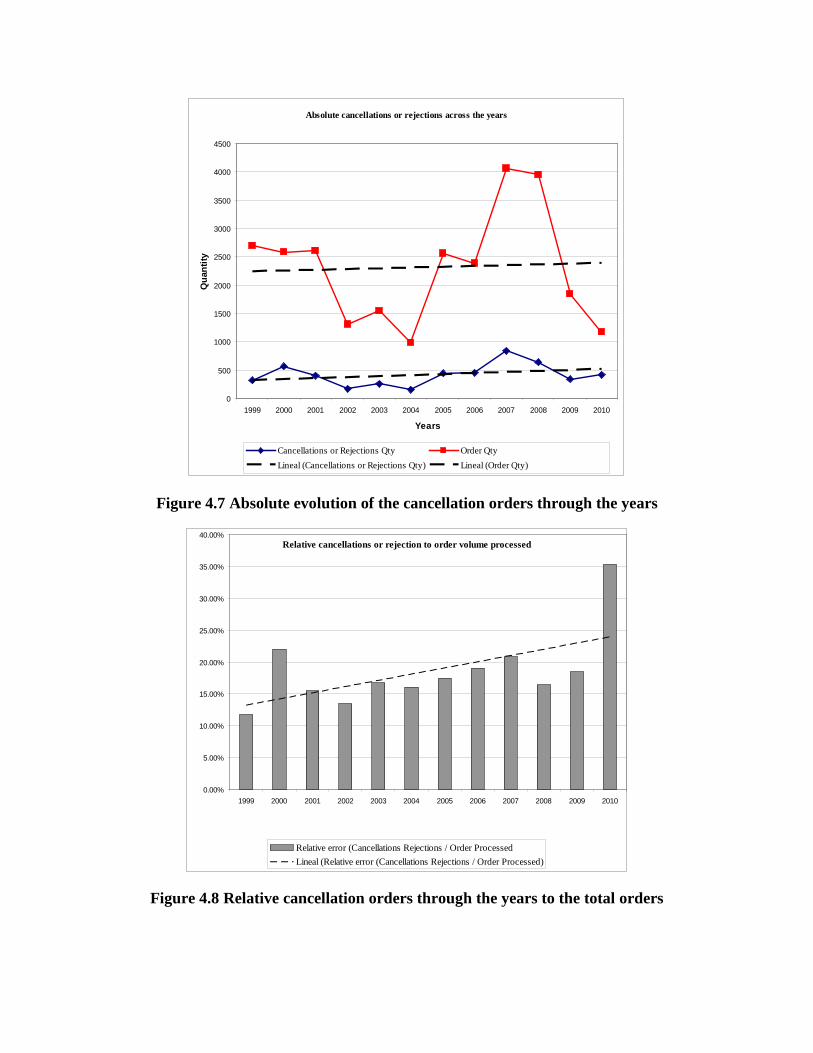
Absolute cancellations or rejections across the years
0
500
1000
1500
2000
2500
3000
3500
4000
4500
1999 2000 2001 2002 2003 2004 2005 2006 2007 2008 2009 2010
Years
Qua
ntity
Cancellations or Rejections Qty Order QtyLineal (Cancellations or Rejections Qty) Lineal (Order Qty)
Figure 4.7 Absolute evolution of the cancellation orders through the years
Relative cancellations or rejection to order volume processed
0.00%
5.00%
10.00%
15.00%
20.00%
25.00%
30.00%
35.00%
40.00%
1999 2000 2001 2002 2003 2004 2005 2006 2007 2008 2009 2010
Relative error (Cancellations Rejections / Order ProcessedLineal (Relative error (Cancellations Rejections / Order Processed)
Figure 4.8 Relative cancellation orders through the years to the total orders
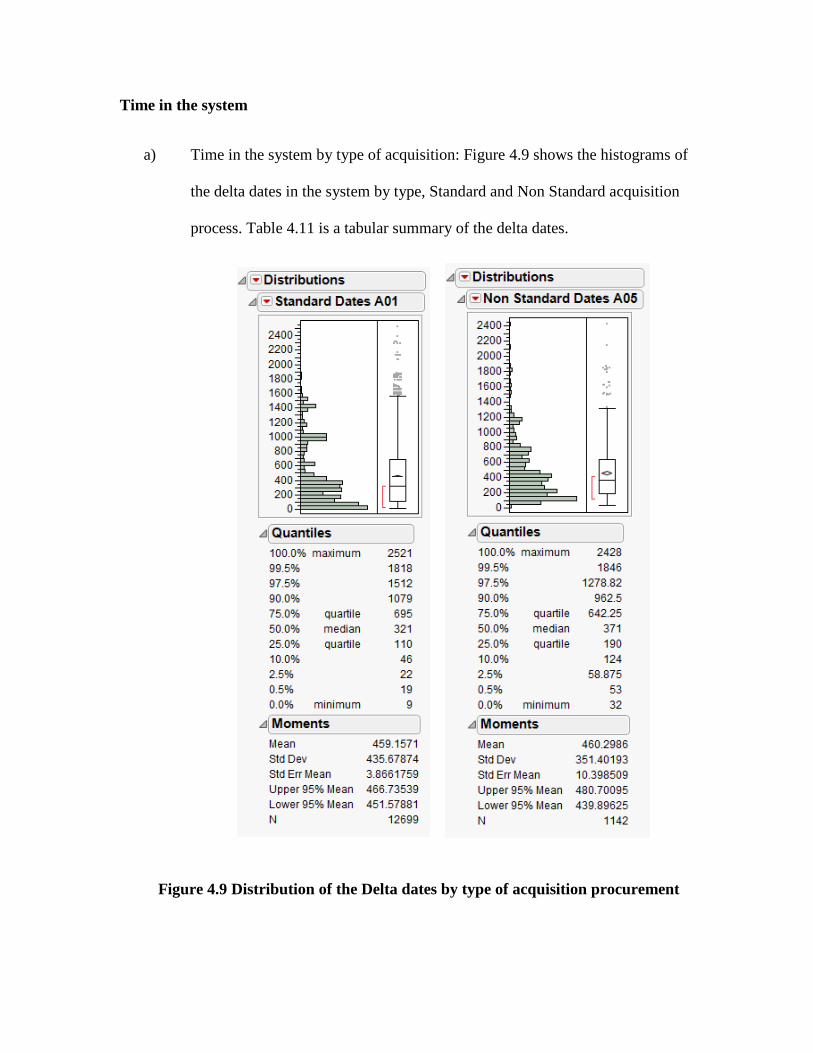
Time in the system
a) Time in the system by type of acquisition: Figure 4.9 shows the histograms of
the delta dates in the system by type, Standard and Non Standard acquisition
process. Table 4.11 is a tabular summary of the delta dates.
Figure 4.9 Distribution of the Delta dates by type of acquisition procurement
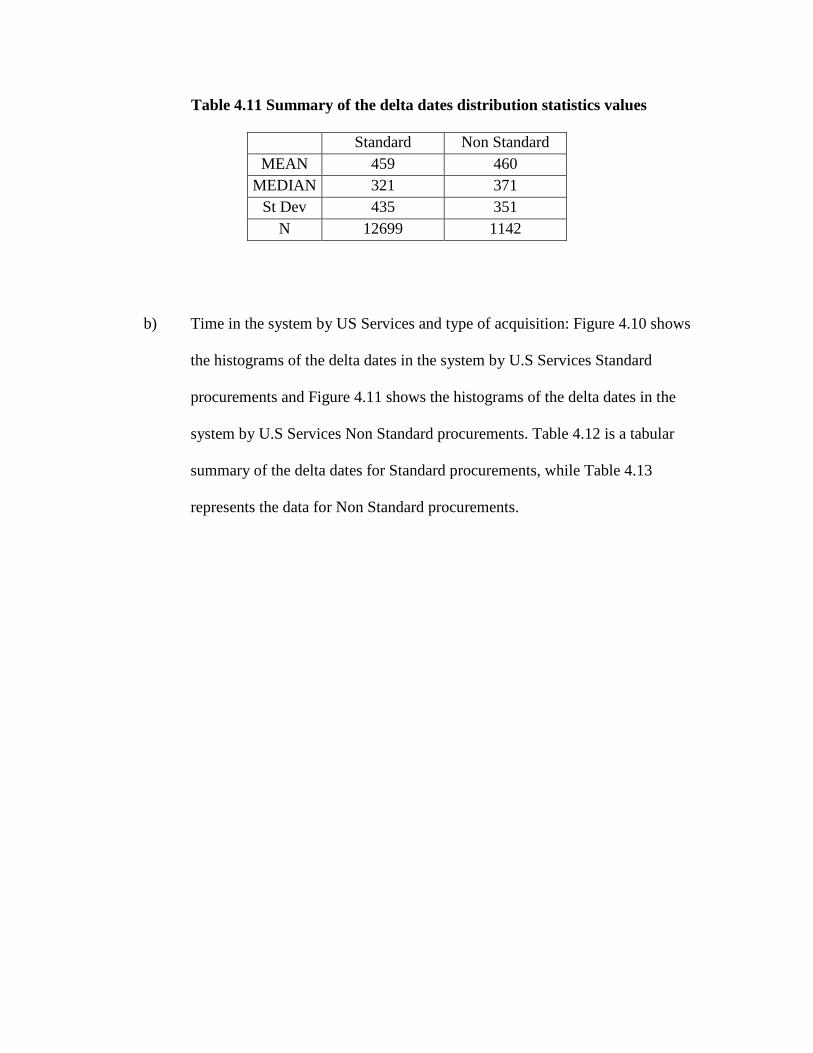
Table 4.11 Summary of the delta dates distribution statistics values
Standard Non Standard MEAN 459 460
MEDIAN 321 371 St Dev 435 351
N 12699 1142
b) Time in the system by US Services and type of acquisition: Figure 4.10 shows
the histograms of the delta dates in the system by U.S Services Standard
procurements and Figure 4.11 shows the histograms of the delta dates in the
system by U.S Services Non Standard procurements. Table 4.12 is a tabular
summary of the delta dates for Standard procurements, while Table 4.13
represents the data for Non Standard procurements.
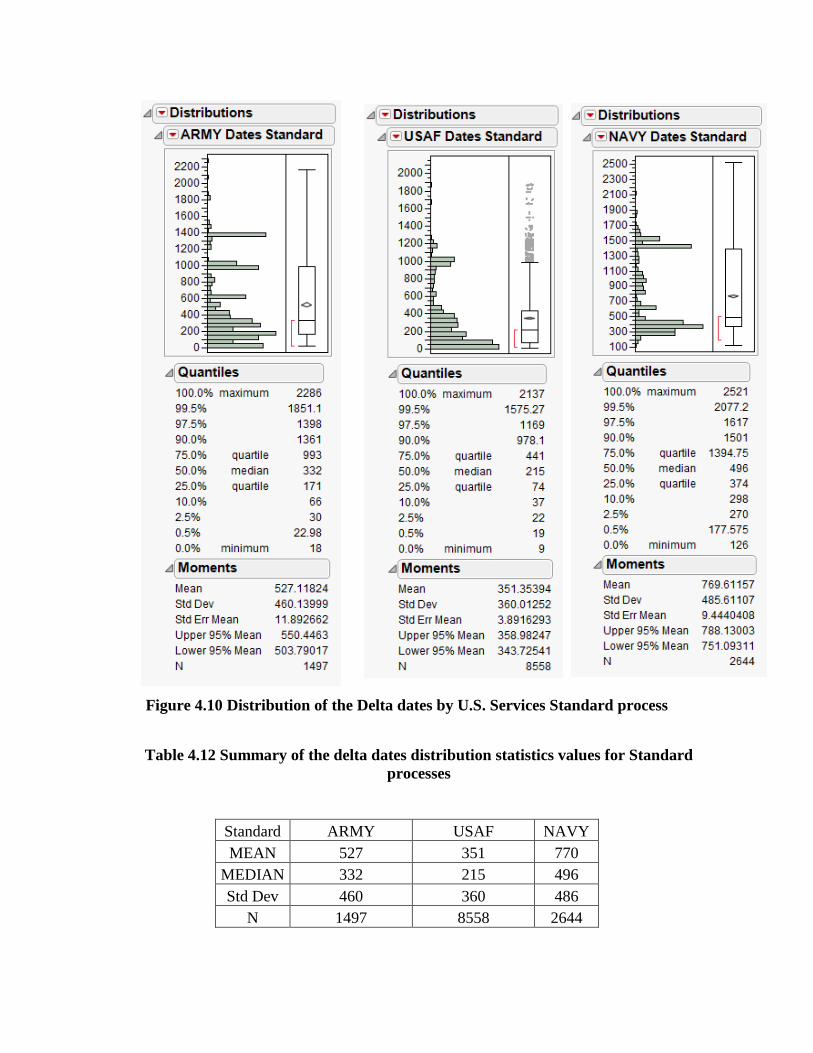
Figure 4.10 Distribution of the Delta dates by U.S. Services Standard process
Table 4.12 Summary of the delta dates distribution statistics values for Standard processes
Standard ARMY USAF NAVY MEAN 527 351 770
MEDIAN 332 215 496 Std Dev 460 360 486
N 1497 8558 2644
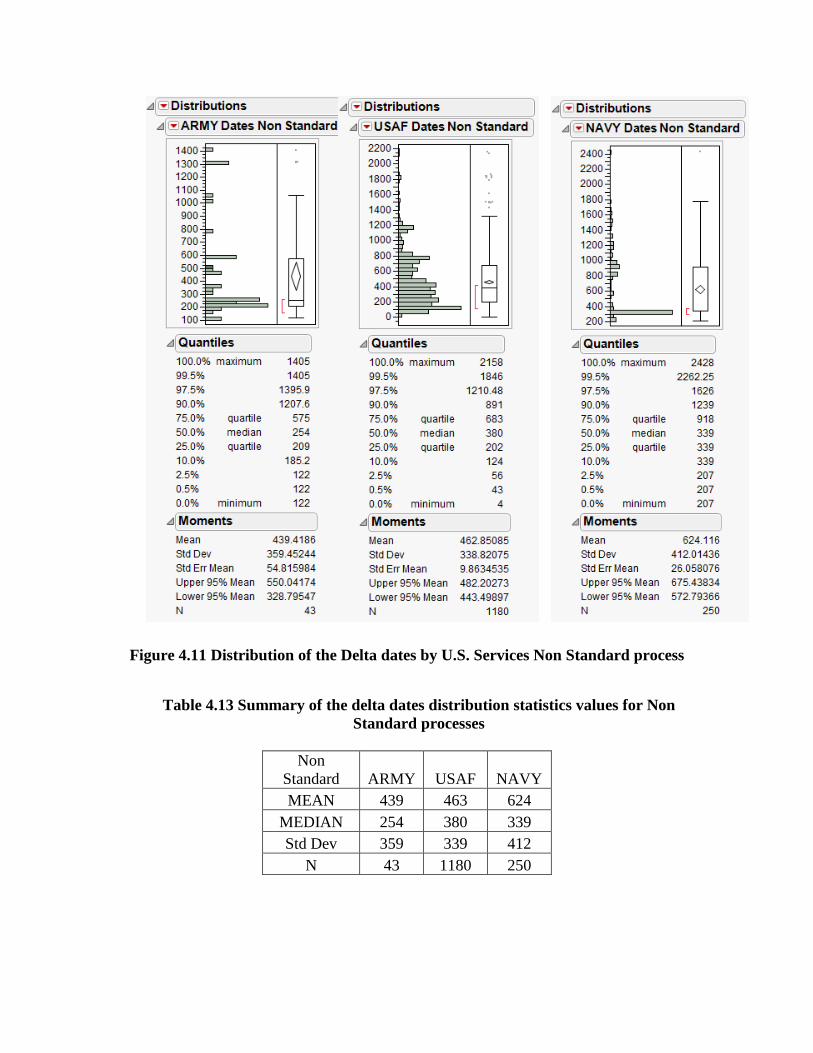
Figure 4.11 Distribution of the Delta dates by U.S. Services Non Standard process
Table 4.13 Summary of the delta dates distribution statistics values for Non Standard processes
Non
Standard ARMY USAF NAVY MEAN 439 463 624
MEDIAN 254 380 339 Std Dev 359 339 412
N 43 1180 250
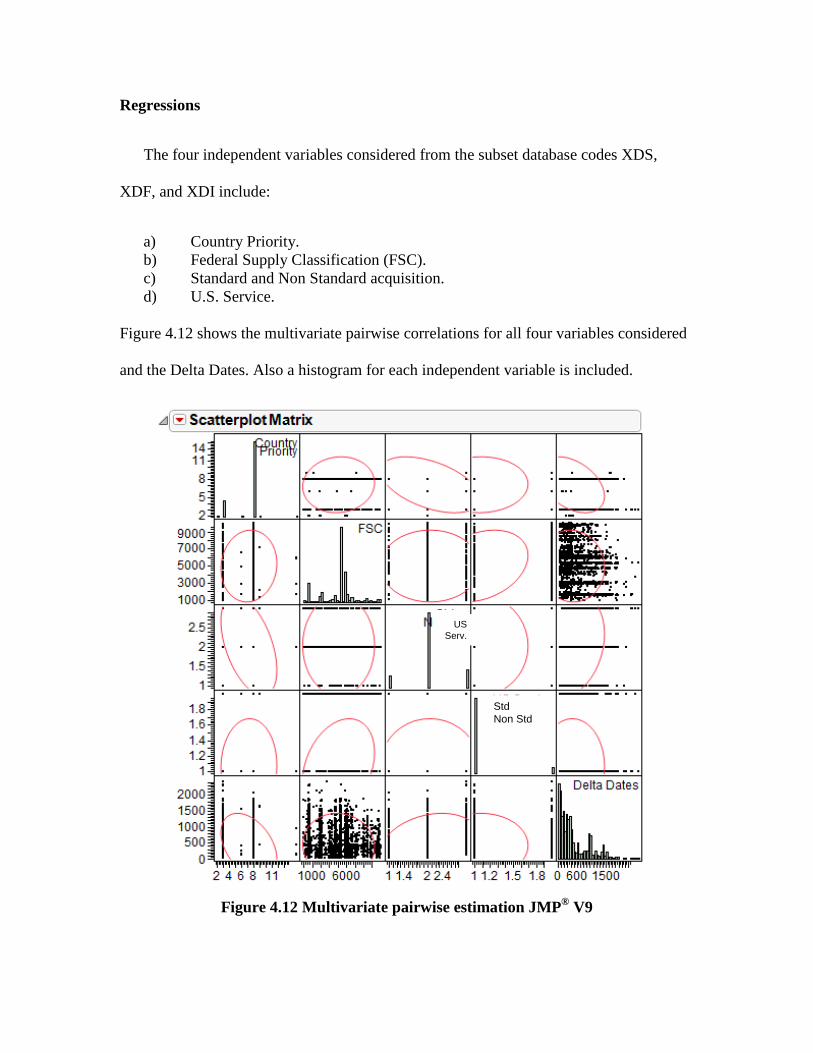
Regressions
The four independent variables considered from the subset database codes XDS,
XDF, and XDI include:
a) Country Priority. b) Federal Supply Classification (FSC). c) Standard and Non Standard acquisition. d) U.S. Service.
Figure 4.12 shows the multivariate pairwise correlations for all four variables considered
and the Delta Dates. Also a histogram for each independent variable is included.
Figure 4.12 Multivariate pairwise estimation JMP® V9
StdNon Std
US Serv.
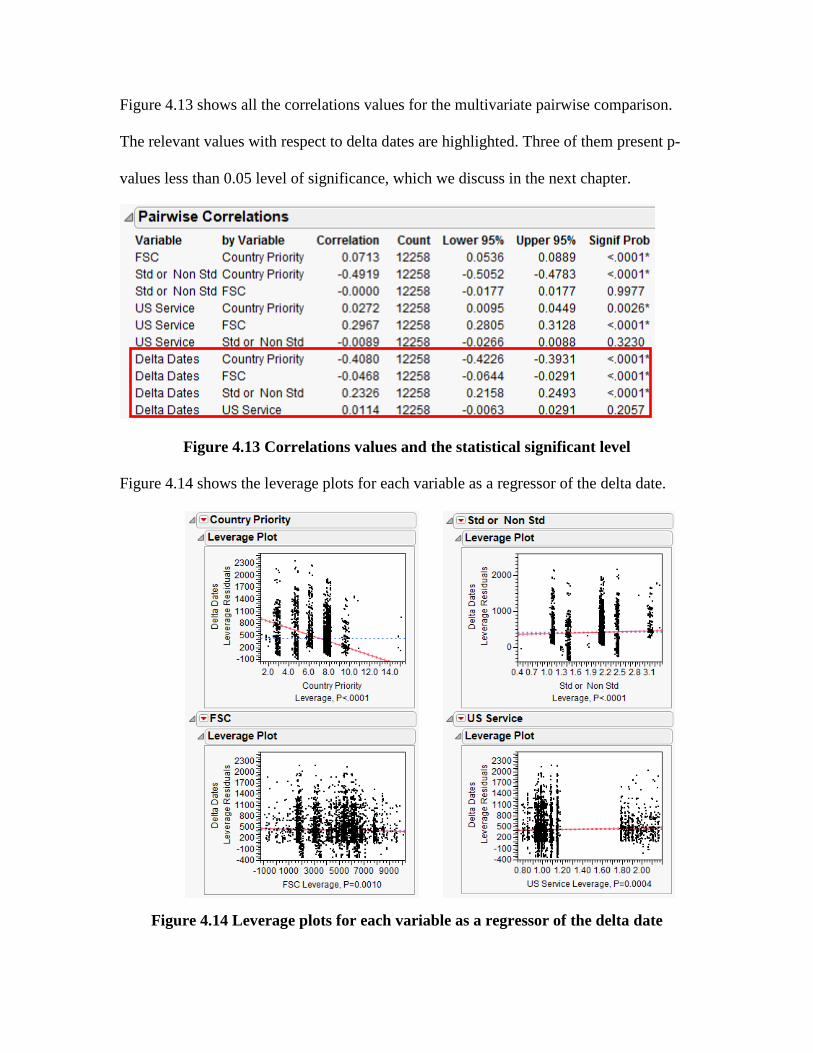
Figure 4.13 shows all the correlations values for the multivariate pairwise comparison.
The relevant values with respect to delta dates are highlighted. Three of them present p-
values less than 0.05 level of significance, which we discuss in the next chapter.
Figure 4.13 Correlations values and the statistical significant level
Figure 4.14 shows the leverage plots for each variable as a regressor of the delta date.
Figure 4.14 Leverage plots for each variable as a regressor of the delta date
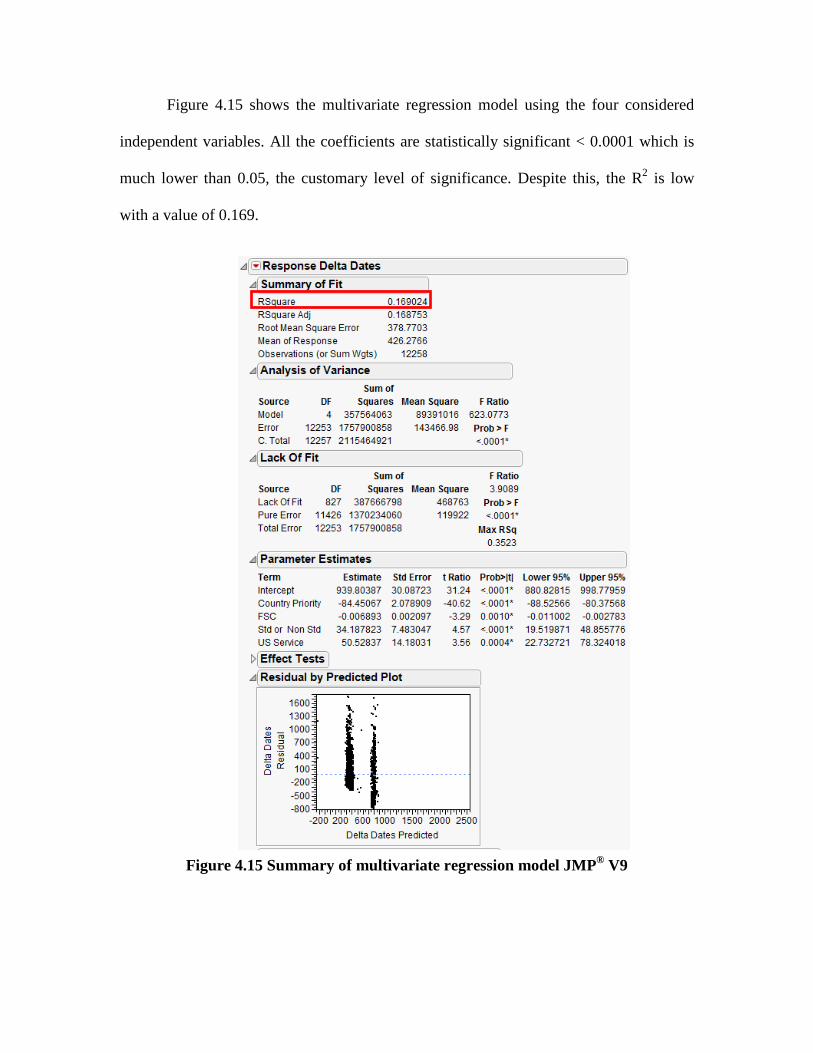
Figure 4.15 shows the multivariate regression model using the four considered
independent variables. All the coefficients are statistically significant < 0.0001 which is
much lower than 0.05, the customary level of significance. Despite this, the R2 is low
with a value of 0.169.
Figure 4.15 Summary of multivariate regression model JMP® V9
Finally, Figure 4.16 is a histogram of the Federal Supply Classification where it is
easy to see which classes are more frequently purchased for the AAF from 1994 to 2012.
Figure 4.16 The Federal Supply Classification histogram
In this chapter, we present the results that the study arrived at by analyzing three
aspects of the procurement system: process characteristics, time in the system, and
correlation analysis. These results follow from the methodology explained in Chapter III.
In Chapter V, we proceed to draw some conclusions and discuss the results we present
here.
V. Discussion and Conclusions
The previous chapter displayed various AAF’s statistics with respect to procuring
defense articles under the FMS system from 1994 to August 2012. In this chapter we
discuss the insights of the results and obtain conclusions and answers to the research
questions which drove this investigation. We discuss the results in order as presented in
the previous chapter. Finally future study opportunities and recommendations will be
presented.
Process Characteristics Analysis
Regarding the characteristics of the procurements, we can say that the AAF has
purchased more articles from the USAF Services; 66% of the acquisitions come from the
U.S. Air Force system. During this time period 1994 – 2009, 78% of the processes were
successfully completed. Also and not considering all the acquisitions that were cancelled
by the customer, the AAF received an orders fill rate of about 92% of the time from the
U.S Services. In particular, 22,834 orders were completed 100%.
Moreover, 68% of the acquisitions were considered as Standard, and more than
85% of these acquisitions were successes. Otherwise 27% were considered Non Standard
with a success rate of 55%. The 5% remainders are procedures with a codification other
than Standard or Non Standard codes. AAF only received 132 back order or delay notices
during this period of time and from this more than 80% resulted in successful purchases.
Regarding the cancellations or rejections it was possible to determine from the
codes reasons what occurred more frequently. The second and third main causes with
codes BQ (14%) and CG (14%) are cancellations from the requisitioner and rejections
because it was impossible to identify the component respectively; also the code CJ (8%)
is relevant corresponding to obsolete or inactive articles. Otherwise, the major component
of rejections have the CA (28% 1,464 orders) code where the specific explanation lies
within each narrative. Of the cancellations, 24% could be attributable to a supplier, 48%
to the customer, and the rest to CA code. Also if we see the evolution of the cancellations
across the years relative to the total purchases initiated during this period, we notice a
slightly increasing tendency.
Time in the system
Regarding the time that the purchase takes from initial order to delivery at the
warehouse, it possible to say that both the Standard and Non Standard procedures have a
skewed distribution. However, their median values don’t differ too much, 321 days and
371 days respectively. Taking in to consideration performance across the Services
(median values), the USAF has a little quicker response for Standard articles than the
others, 57 % faster than the NAVY and 35% than the ARMY. Meanwhile, for Non
standard articles the ARMY is quicker 33% faster than the USAF and 25% than the
NAVY.
Regressions Considering the independent variables that may affect the time in the system like
the country priority, Federal Supply Classification, type of service, and type of
acquisition the regression shows that these regressors do not produce a real impact in the
system time. The correlation coefficient is never larger than 0.4 for any case in a
multivariate pairwise comparison. In particular for a multivariate regression model with
all these variables the total R2 value is 0.169, essentially a non-significant effect.
However, from the histogram about FSC is it possible to arrive at a solid
conclusion. It is very significant which class of component the AAF purchases more
frequently. From the DLA H2 Handbook Manual 2003 they correspond to the 50XX
Group, which includes Hand and Measuring tools, Hardware and Abrasives,
Communication and Detection equipment, and Electrical and Electronic components
among others. It is a clear indication about which kind of component the AAF has more
dependency from a foreign supplier like FMS.
With all the previous results and explanations, the study turns to answering the
research and supplementary questions.
1) What are the main factors that historically affect the procurement processes under
the FMS system with respect to the AAF?
According to the study we can see that the main factors that may affect the AAF’s
procurements are: the level of cancellations/rejections produced by the customer himself,
the inability of FMS to identify the requirement (specifications), and the
obsolescence/inactive articles requirements. This the last one is a consequence of the
older AAF fleet (about 30 years).
Also, despite the training that the FMS participants receive previous to their
deployment and because of the complexity of the FMS system, it may be have to assign
permanent people with “deep knowledge” of the system, which in conjunction with
increased decision authority by the FLO could contribute to the clarity of purchases.
2) What are the characteristics of the procurements, such as, supply services, success
procedures, and type of acquisition, cancellations reasons, and time in the system?
We can list the following characteristics during this period:
a) USAF Services has been the main supplier and with a faster response in
comparison with the other U.S. Services for Standard procurements. The
ARMY seems faster for Non Standard purchases.
b) 78% of the processes were successfully completed.
c) AAF received about 92% orders fill rate from the U.S. Services.
d) 22,834 orders were completed 100%.
e) 68% of acquisitions were considered Standard. More than 85 % of these were
success procurements.
f) 27% of acquisitions were considered Non Standard. 55% were success
procurements.
g) 132 purchases received a back order code action. More than 80% were success
procurements.
h) Status codes CA, BQ, CG, and CJ are the main reasons for
cancellations/rejections.
i) For both type of procurement Standard and Non Standard the median time in
the system is averaging a year.
3) What types of correlations are present that influence the procurement time?
Despite what common sense may indicate, neither the type of the defense article
(FSC) nor the type of procurement Standard or Non Standard or the U.S. Service supplier
have a real influence in the time of the system (pipeline time); only the country priority
present a slight decrease of linear association with Delta Dates.
4) What corrective actions can be applied that improve the acquisition process?
According to the analysis we may address these corrective actions:
a) Reduce as much as possible the AAF’s cancellations/rejections by its own
decision.
b) Assure the availability of the most updated specification data (catalogs) in
order to reduce the cancellations/rejections level because of the inability of
FMS to identify the articles.
c) Sustain and improve the skills of the FMS system operators/managers by
performing continual training.
d) Assure the best level of communication in order to reduce the obsolete
inactive articles requirements.
e) Review and assign the right level of decision authority to the FLO in order to
reduce procurement times with respect to routine actions.
Future studies Being the first historical review of the AAF purchases under the FMS there is
opportunity for future studies, such as discerning the CA cancellations code from the
narratives, which is very tedious and time consuming because of the burdensome
computer system. However doing so, may discover a new reason for these cancellations.
Addressing this reason might further facilitate the management of the acquisition system.
Recommendations Considering that delays or extra-costs are undesirable, we can draw two main
recommendations as result from this research:
a) Since the second and third main factors resulting in cancellations and rejections
involved failure to identify the element (CG) or AAF cancelled the request (BQ),
the AAF should improve the skills of the operators of the system. This could
involve more training or implementing an extra control (data entry errors) over
the requisition procedure until a certain level of quality control can be reached.
Additionally, verify that the personnel are working with the most update
information about specification data (catalogs). In particular for the AAF,
cancelled requests may result in a requisition planning review. For the fourth
main factor, which involves an obsolete or inactive item (CJ), the AAF should
review the communications channels with the FMS system in order to not request
an item in this condition.
b) Review the routine decision authority level for the FLO that will allow, more
local decisions instead of headquarter approval. This would avoid unnecessary
delays and possible cost.
Those are not the only actions that the AAF could take but for sure they will improve
the performance of the system because they have a direct relation with time
consuming and extra monetary issues.
Bibliography
1. American Bar Association National Institute, “Foreign Military Sales and International Contracting with Governments: Problems and Potential”, June 18-19 1982.
2. Reza Zanjirani Farahani, Nasrin Asgari, Hoda Davarzani, and Physica Verlag, “Supply Chain and Logistics in National international and Government environment Concepts and Models”, Contributions to Management Science, 2009.
3. Douglas M Lambert, “Supply Chain Management Processes, Partnership, Performance”, Third Edition, 2008.
4. Sunil Chopra, and Peter Meindl, “Supply Chain Management Strategy, Planning, and Operation”, 2001.
5. Stanley E Fawcett, Lisa M Ellram, and Jeffrey A. Odgen, “Supply Chain Management, From Vision to Implementation”, Pearson Prentice Hall, 2007.
6. The Management of Security Assistance, “The Defense Institute of Security Assistance Management”, 29th Edition, January 2010.
7. Defense Logistics Agency, “18th Edition Customer Assistance Handbook”, 2011.
8. John Smilek, “The new Security Assistance Management – CONUS,SAM-C Course”, Defense Institute of Security Assistance Management, The DISAM A Journal of International Security Cooperation Management, Annual Vol. 1 May 2012.
9. Defense Institute of Security Assistance Management, “Military Standard requisition and issue procedures for Foreign Military Sales”, January 2011.
10. Defense Logistic Agency, “Federal Supply Classification Groups and Classes”, Handbook H2, February 2003.
11. Kutner Michael, Nachtsheim Christopher J., Neter John, and Li William, “Applied Linear Statistical Models”, McGraw Hill, 5th Edition, 2005.
Vita
LtCol. Juan E Perot graduated with honors from Argentina Air Force Academy,
Córdoba, República Argentina in December 1991. He entered undergraduate studies at
the Institute University of Aeronautic, Córdoba, República Argentina where he graduated
with a Mechanical Aeronautic Engineering degree in December 1995. He graduated with
honors from the Air Warfare School, Argentina Air Force as Joint Staff Officer in
December 2007, and he also participated in several professional courses, congress and
conferences. He also entered graduate studies at El Salvador University, Buenos Aires,
República Argentina where he graduated with a Master Business and Administration
degree in December 2010.
His first assignment was at V Air Base, San Luis as Maintenance Officer in
January 1996. In January 2002, he was assigned to the Area de Material Río Cuarto
Depot Maintenance Base, Córdoba, where he served as a Depot Maintenance Officer.
From January 2006 to December 2007 he was assigned as student in the Air Warfare
School, Buenos Aires. In January 2008 as a Major, he was assigned to the Argentina Air
Force Headquarter, Material Command and served as Auxiliary in the Technical Training
Department. In January 2009 he deployed overseas to Cyprus under United Nations
Mandate as Peacekeeper, Second in Command of the UNFLIGHT, and Maintenance
Officer in UNFICYP. In 2010 he was assigned to Material Command as Maintenance
Budget Controller. In September 2011, he entered the Graduate School of Engineering
and Management, Air Force Institute of Technology. Upon graduation, he will be return
to the Material Command Argentina Air Force.
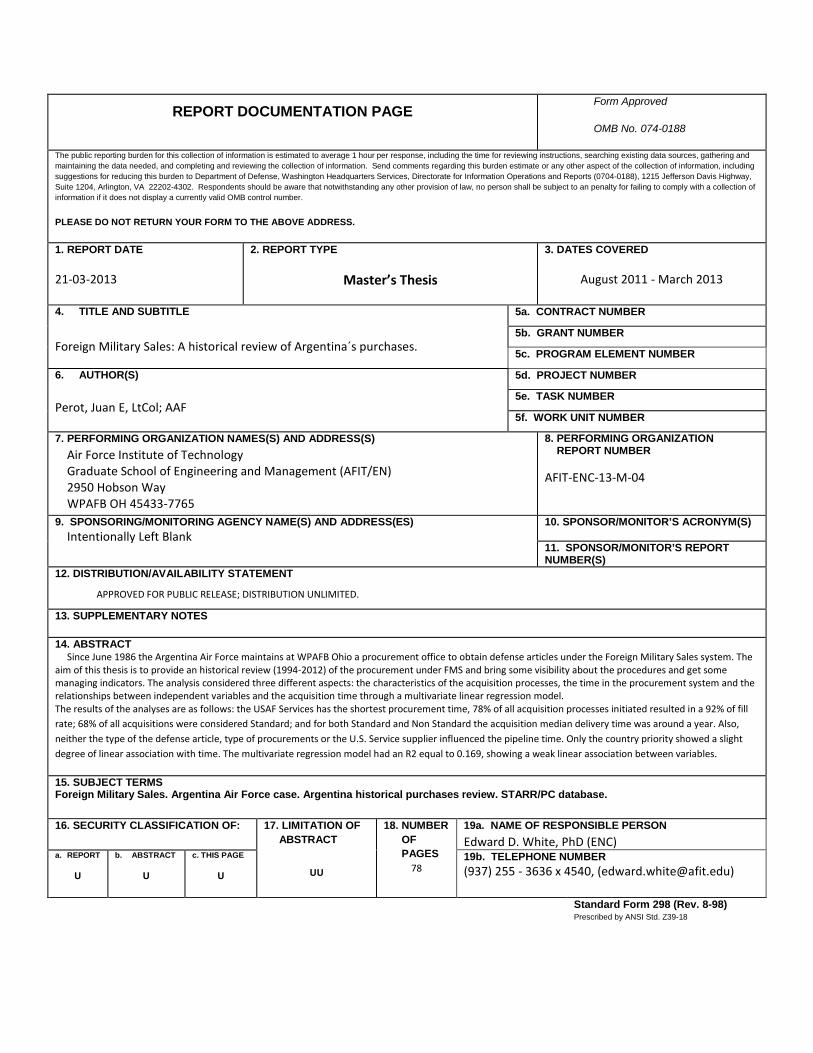
REPORT DOCUMENTATION PAGE Form Approved
OMB No. 074-0188
The public reporting burden for this collection of information is estimated to average 1 hour per response, including the time for reviewing instructions, searching existing data sources, gathering and maintaining the data needed, and completing and reviewing the collection of information. Send comments regarding this burden estimate or any other aspect of the collection of information, including suggestions for reducing this burden to Department of Defense, Washington Headquarters Services, Directorate for Information Operations and Reports (0704-0188), 1215 Jefferson Davis Highway, Suite 1204, Arlington, VA 22202-4302. Respondents should be aware that notwithstanding any other provision of law, no person shall be subject to an penalty for failing to comply with a collection of information if it does not display a currently valid OMB control number.
PLEASE DO NOT RETURN YOUR FORM TO THE ABOVE ADDRESS.
1. REPORT DATE
21-03-2013
2. REPORT TYPE
Master’s Thesis
3. DATES COVERED
August 2011 - March 2013
4. TITLE AND SUBTITLE
Foreign Military Sales: A historical review of Argentina´s purchases.
5a. CONTRACT NUMBER
5b. GRANT NUMBER
5c. PROGRAM ELEMENT NUMBER
6. AUTHOR(S) Perot, Juan E, LtCol; AAF
5d. PROJECT NUMBER 5e. TASK NUMBER
5f. WORK UNIT NUMBER
7. PERFORMING ORGANIZATION NAMES(S) AND ADDRESS(S) Air Force Institute of Technology Graduate School of Engineering and Management (AFIT/EN) 2950 Hobson Way WPAFB OH 45433-7765
8. PERFORMING ORGANIZATION REPORT NUMBER
AFIT-ENC-13-M-04
9. SPONSORING/MONITORING AGENCY NAME(S) AND ADDRESS(ES) Intentionally Left Blank
10. SPONSOR/MONITOR’S ACRONYM(S)
11. SPONSOR/MONITOR’S REPORT NUMBER(S)
12. DISTRIBUTION/AVAILABILITY STATEMENT
APPROVED FOR PUBLIC RELEASE; DISTRIBUTION UNLIMITED.
13. SUPPLEMENTARY NOTES
14. ABSTRACT Since June 1986 the Argentina Air Force maintains at WPAFB Ohio a procurement office to obtain defense articles under the Foreign Military Sales system. The aim of this thesis is to provide an historical review (1994-2012) of the procurement under FMS and bring some visibility about the procedures and get some managing indicators. The analysis considered three different aspects: the characteristics of the acquisition processes, the time in the procurement system and the relationships between independent variables and the acquisition time through a multivariate linear regression model. The results of the analyses are as follows: the USAF Services has the shortest procurement time, 78% of all acquisition processes initiated resulted in a 92% of fill rate; 68% of all acquisitions were considered Standard; and for both Standard and Non Standard the acquisition median delivery time was around a year. Also, neither the type of the defense article, type of procurements or the U.S. Service supplier influenced the pipeline time. Only the country priority showed a slight degree of linear association with time. The multivariate regression model had an R2 equal to 0.169, showing a weak linear association between variables.
15. SUBJECT TERMS Foreign Military Sales. Argentina Air Force case. Argentina historical purchases review. STARR/PC database.
16. SECURITY CLASSIFICATION OF: 17. LIMITATION OF ABSTRACT
UU
18. NUMBER OF PAGES
78
19a. NAME OF RESPONSIBLE PERSON Edward D. White, PhD (ENC)
a. REPORT
U
b. ABSTRACT
U
c. THIS PAGE
U
19b. TELEPHONE NUMBER (937) 255 - 3636 x 4540, ([email protected])
Standard Form 298 (Rev. 8-98) Prescribed by ANSI Std. Z39-18