foreign tax credit - internal revenue service · 184 corporate foreign tax credit, 2001 184 the...
TRANSCRIPT

183
by Scott Luttrell
Corporate Foreign Tax Credit, 2001
Scott Luttrell is an economist with the Special StudiesReturns Analysis Section. This article was preparedunder the direction of Chris Carson, Chief.
I n 2001, U.S. corporations claimed $41.4 billionin foreign tax credits. This represents a de-crease of 14.5 percent or nearly $7.0 billion
from the all-time-high amount established in 2000.Under the foreign tax credit provisions, corporationsclaiming a foreign tax credit reduced their U.S. taxliability by 31.9 percent, from $129.3 to $87.9 billion.Other credits, such as the general business credit andU.S. possessions tax credit, further reduced theirU.S. income tax to $80.1 billion.
Domestic corporations claiming a foreign taxcredit reported “worldwide taxable income” (i.e.,both U.S. and foreign-source income) of $368.1billion. Nearly 44.8 percent or $164.8 billion of thisincome was derived from foreign sources. Mean-while, foreign taxes accounted for 34.4 percent or$44.5 billion of their total worldwide income taxes, adecrease of 2.2 percent from 2000.
Among corporations claiming a foreign tax credit,manufacturers continued to account for a majority ofthe total foreign-source taxable income, current-yearforeign taxes, and foreign tax credit. The $98.3billion of foreign-source taxable income earned bymanufacturers is more than four times the amountreported by the second-largest industry, services.While its percentage of the total foreign tax credit fellslightly in 2001, the foreign tax credit claimed bymanufacturers was more than five times as large asfor any other industry. Services continued as thesecond-leading industrial category, accounting forover $5.2 billion in foreign tax credits.
Europe was the most significant region in termsof foreign-source taxable income and current-yearforeign taxes in 2001. As the source of $77.9 billionin income and $21.6 billion in taxes, European coun-tries accounted for 47.3 percent and 48.6 percent ofthe total for these measures, respectively. TheUnited Kingdom (UK) was the most significantcountry in both categories, with $29.8 billion in for-eign-source taxable income and $7.0 billion in cur-rent-year foreign taxes. Next to the UK, the mostforeign-source income came from Canada with $11.8billion, while Japan was the second-largest recipientof foreign taxes paid with $4.5 billion.
The largest benefits of the foreign tax credit havebecome increasingly concentrated among a relativelysmall number of U.S. corporations. Ten of the 5,478corporations claiming foreign tax credits in 2001accounted for 41.3 percent of all foreign tax credits,while reporting 24.0 percent of worldwide taxableincome and worldwide income taxes. The largest100 foreign tax credits reported made up 83.6 per-cent of the foreign tax credit and 56.7 percent ofworldwide taxable income.
BackgroundThe United States taxes its corporations on the basisof worldwide income, regardless of the source.Because U.S. corporations are frequently taxed byforeign jurisdictions on their incomes earned abroad,foreign-source income may be subject to doubletaxation. Since 1918, the U.S. has allowed a creditagainst U.S. tax for a portion or all of the foreignincome taxes. Alternately, corporations may deductforeign taxes from their foreign-source incomes;however, the majority of taxpayers opt for the foreigntax credit because it offsets U.S. taxes dollar-for-dollar.
The rules governing the foreign tax credit haveundergone several modifications over the years. Intheir original form, the foreign tax credit provisionsallowed taxpayers to credit all foreign taxes paidagainst their U.S. tax liability. This system allowedcorporations to credit foreign taxes against U.S.taxes on domestic-source income in cases whereforeign tax rates exceeded U.S. tax rates. With theRevenue Act of 1921, Congress added an “overalllimitation” to the foreign tax credit provisions thatrestricted corporations to claiming a credit in propor-tion to the U.S. tax rate on foreign-source income.In one form or another, the limitation concept has beena part of the foreign tax credit provisions ever since.
At times, a “per country” limitation has beenincluded with the foreign tax credit regulations. Byrequiring taxpayers to compute a separate limitationfor each country, Congress ensured that taxes paid inhigher-tax foreign jurisdictions could not offset U.S.taxes imposed on income earned in lower-tax foreigncountries. Increasingly, corporations circumventedthe per country limitation by moving low-taxed, in-vestment income to the high-tax countries, whichprompted Congress to enact the next major revisionto the foreign tax credit provisions.

184
Corporate Foreign Tax Credit, 2001
184
The Revenue Act of 1962 introduced a separatelimitation requirement for portfolio interest income.This limitation requirement was intended to removethe incentive for corporations to move low-taxed,investment interest overseas. Segregating the low-taxed, portfolio income from higher-taxed businessincome made it more challenging for U.S. corpora-tions to arrange foreign investment at the expense ofU.S. tax revenue. To this end, Congress continued toadd separate limitation categories to the foreign taxcredit provisions, with the most significant revisionsincluded under the Tax Reform Act of 1986.
In 2001, U.S. corporations computed a separateforeign tax credit limitation for each of the followingstatutory categories of foreign-source income or“baskets” (each of these is described separately inthe Explanation of Selected Terms) section:
Passive income
High withholding tax interest
Financial services income
Shipping income
Dividends from each “noncontrolled”foreign corporation per Internal RevenueCode section 902
Dividends from an Interest-Charge Domes-tic International Sales Corporation (IC-DISC) or former DISC
Certain distributions from a Foreign SalesCorporation (FSC) or former FSC [1]
Taxable income attributable to “foreigntrade income”
Income from U.S.-sanctioned countries perInternal Revenue Code 901(j) [2]
Income resourced by a bilateral income taxtreaty
All other income from outside the UnitedStates (commonly referred to as thegeneral limitation basket or overall basket)
The total foreign tax credit claimed is the sum ofcredits allowed in each separate limitation category.In certain instances, the total foreign tax creditclaimed was reduced for participation in or for coop-
eration with international boycotts unsanctioned bythe U.S. Government [3].
For Tax Year 2001, corporations were permittedto carry over and carry back excess foreign taxes toother years. Corporations with excess foreign taxesthat could not be credited because of the current-year limitation can be carried back 2 years (necessi-tating an amended return) or carried forward 5 years,subject to the current-year foreign tax credit limita-tion. Consequently, the total foreign taxes for eachseparate limitation category in a given year mayinclude current-year foreign taxes plus taxes carriedforward from previous years [4].
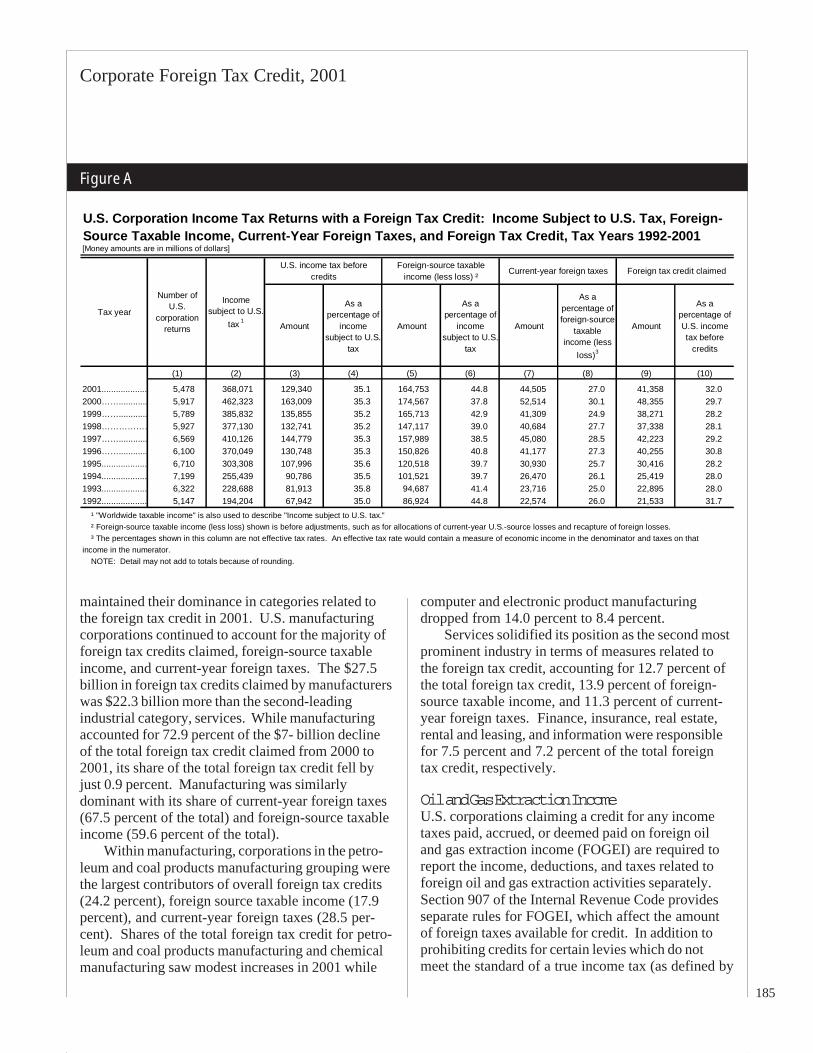
Foreign Tax Credit, Tax Year 2001The foreign tax credit of $41.4 billion for 2001represents a decrease of 14.5 percent from therecord high of $48.4 billion claimed in 2000. Notsurprisingly, this decrease followed substantialdeclines in most of the primary components of theforeign tax credit. Weakness in the economy, bothdomestically and abroad in 2001, is reflected in the20.7-percent drop in worldwide taxable incomeexperienced by corporations claiming a foreign taxcredit. As seen in Figure A, the worldwide taxableincome ($368.1 billion) and worldwide income tax($129.3 billion) reached their lowest levels since1995. Meanwhile, the most significant factor leadingto the decrease in foreign tax credits was the 15.3-percent slide in current-year foreign taxes. Thereduction in foreign taxes significantly outpaced the5.6-percent decrease in foreign-source taxableincome and coincided with reductions of corporatetax rates among many European countries [5].Although the foreign tax credit claimed by corpora-tions fell by nearly $7.0 billion in 2001, the foreign taxcredit claimed as a percentage of the total tax liabilitywas the highest it has been over the 10-year periodfrom 1992 to 2001.
Industry CompositionFigure B provides a summary of foreign income andtaxes by the U.S. corporations’ industrial category,including the number of returns, foreign-sourcetaxable income, current-year foreign taxes, andforeign tax credit claimed. Although their share ofmany financial measures has declined in recentyears, corporations classified in manufacturing
185
Corporate Foreign Tax Credit, 2001
maintained their dominance in categories related tothe foreign tax credit in 2001. U.S. manufacturingcorporations continued to account for the majority offoreign tax credits claimed, foreign-source taxableincome, and current-year foreign taxes. The $27.5billion in foreign tax credits claimed by manufacturerswas $22.3 billion more than the second-leadingindustrial category, services. While manufacturingaccounted for 72.9 percent of the $7- billion declineof the total foreign tax credit claimed from 2000 to2001, its share of the total foreign tax credit fell byjust 0.9 percent. Manufacturing was similarlydominant with its share of current-year foreign taxes(67.5 percent of the total) and foreign-source taxableincome (59.6 percent of the total).
Within manufacturing, corporations in the petro-leum and coal products manufacturing grouping werethe largest contributors of overall foreign tax credits(24.2 percent), foreign source taxable income (17.9percent), and current-year foreign taxes (28.5 per-cent). Shares of the total foreign tax credit for petro-leum and coal products manufacturing and chemicalmanufacturing saw modest increases in 2001 while
computer and electronic product manufacturingdropped from 14.0 percent to 8.4 percent.
Services solidified its position as the second mostprominent industry in terms of measures related tothe foreign tax credit, accounting for 12.7 percent ofthe total foreign tax credit, 13.9 percent of foreign-source taxable income, and 11.3 percent of current-year foreign taxes. Finance, insurance, real estate,rental and leasing, and information were responsiblefor 7.5 percent and 7.2 percent of the total foreigntax credit, respectively.
Oil and Gas Extraction IncomeU.S. corporations claiming a credit for any incometaxes paid, accrued, or deemed paid on foreign oiland gas extraction income (FOGEI) are required toreport the income, deductions, and taxes related toforeign oil and gas extraction activities separately.Section 907 of the Internal Revenue Code providesseparate rules for FOGEI, which affect the amountof foreign taxes available for credit. In addition toprohibiting credits for certain levies which do notmeet the standard of a true income tax (as defined by
U.S. Corporation Income Tax Returns with a Foreign Tax Credit: Income Subject to U.S. Tax, Foreign-Source Taxable Income, Current-Year Foreign Taxes, and Foreign Tax Credit, Tax Years 1992-2001[Money amounts are in millions of dollars]
Amount
As a percentage of
income subject to U.S.
tax
Amount
As a percentage of
income subject to U.S.
tax
Amount
As a percentage of foreign-source
taxable income (less
loss)3
Amount
As a percentage of U.S. income tax before
credits
(1) (2) (3) (4) (5) (6) (7) (8) (9) (10)
2001................... 5,478 368,071 129,340 35.1 164,753 44.8 44,505 27.0 41,358 32.0 2000……............ 5,917 462,323 163,009 35.3 174,567 37.8 52,514 30.1 48,355 29.7 1999……............ 5,789 385,832 135,855 35.2 165,713 42.9 41,309 24.9 38,271 28.2 1998……………… 5,927 377,130 132,741 35.2 147,117 39.0 40,684 27.7 37,338 28.1 1997……............ 6,569 410,126 144,779 35.3 157,989 38.5 45,080 28.5 42,223 29.2 1996……............ 6,100 370,049 130,748 35.3 150,826 40.8 41,177 27.3 40,255 30.8 1995................... 6,710 303,308 107,996 35.6 120,518 39.7 30,930 25.7 30,416 28.2 1994................... 7,199 255,439 90,786 35.5 101,521 39.7 26,470 26.1 25,419 28.0 1993................... 6,322 228,688 81,913 35.8 94,687 41.4 23,716 25.0 22,895 28.0 1992................... 5,147 194,204 67,942 35.0 86,924 44.8 22,574 26.0 21,533 31.7 ¹ "Worldwide taxable income" is also used to describe "Income subject to U.S. tax." ² Foreign-source taxable income (less loss) shown is before adjustments, such as for allocations of current-year U.S.-source losses and recapture of foreign losses. ³ The percentages shown in this column are not effective tax rates. An effective tax rate would contain a measure of economic income in the denominator and taxes on that income in the numerator. NOTE: Detail may not add to totals because of rounding.
Foreign-source taxable income (less loss) ²
Current-year foreign taxes Foreign tax credit claimed
Tax year
Number of U.S.
corporation returns
Income subject to U.S.
tax 1
U.S. income tax before credits
Figure A

186
Corporate Foreign Tax Credit, 2001
186
U.S. tax principles), the rules of Section 907 limit thecrediting of taxes where taxes are paid at a rate inexcess of the statutory U.S. corporate tax rate.Excess FOGEI taxes that are subject to limitation inthe current year may be carried back 2 years orforward 5 years.
Oil and gas extraction income was one of thefew income categories to experience significantgrowth from Tax Year 2000 to 2001. As seen inFigure C, $30.9 billion in FOGEI gross income weregenerated in 2001, an increase of 22.0 percent from2000. Taxes paid on FOGEI totaled $9.1 billion, or12.3 percent higher than in 2000. After limitations of$2.9 billion, the total amount of FOGEI taxes avail-able for credit in 2001 was $6.2 billion.
In 2001, Norway was the leading source ofFOGEI gross income and taxes paid, with $5.8 billionand $2.8 billion, respectively. Norway accounted for18.6 percent of FOGEI gross income and 31.0 per-cent of FOGEI taxes. The UK was responsible for$5.2 billion of FOGEI gross income and $1.6 billion ofthe taxes paid. Nigeria was third in both categories,with $2.5 billion in gross income and $947 million intaxes paid. Together, these three countries combinedto account for 43.8 percent of FOGEI gross incomeand 59.0 percent of FOGEI taxes. As a note ofcaution when using these data, FOGEI is typicallyearned by a foreign subsidiary of the U.S. taxpayerclaiming a foreign tax credit. As a result, FOGEImay be reported for the country of incorporation of
Figure B
U.S. Corporation Income Tax Returns with a Foreign Tax Credit: Foreign-Source Taxable Income, Current-Year Foreign Taxes, and Foreign Tax Credit, by Selected Sector or Group, Tax Year 2001, and Selected Sector or Group Shares of Total Foreign Tax Credit, Tax Years 2000-2001
Number of returns
Foreign-source taxable income
(less loss) ¹
Current-year foreign taxes
Foreign tax credit claimed 2001 2000
(1) (2) (3) (4) (5) (6)
All industries.................................................................................... 5,478 164,753,343 44,505,156 41,358,458 100.0 100.0
Agriculture, forestry, fishing, and hunting........................................ 331 335,865 107,431 89,089 0.2 ( ² )
Mining................................................................................................. 131 2,511,835 911,811 733,744 1.8 1.6
Utilities................................................................................................. 15 1,441,523 323,139 348,432 0.8 0.4
Construction......................................................................................... 235 79,139 19,361 17,389 ( ² ) 0.1
Manufacturing...................................................................................... 911 98,292,466 30,038,255 27,516,993 66.5 67.4 Beverage and tobacco products........................................................ 14 8,231,442 2,488,315 2,459,547 5.9 4.7 Petroleum and coal products manufacturing..................................... 22 29,573,067 12,696,851 9,991,472 24.2 22.7 Chemical manufacturing.................................................................... 139 18,703,028 4,813,945 4,924,110 11.9 10.0
Pharmaceutical and medicine manufacturing............................... 56 9,523,426 2,329,887 2,279,434 5.5 5.0 Computer and electronic product manufacturing............................... 110 15,722,129 3,153,463 3,464,528 8.4 14.0 Transportation equipment manufacturing.......................................... 50 4,262,251 952,157 955,360 2.3 4.0
Wholesale and retail trade.................................................................. 586 4,639,937 1,282,789 1,217,807 2.9 2.6
Transportation and warehousing....................................................... 78 787,855 123,043 122,344 0.3 0.6
Information........................................................................................... 299 13,279,995 2,671,044 2,964,028 7.2 6.4 Publishing, motion picture, and sound recording.............................. 166 8,558,477 1,560,612 1,769,968 4.3 4.8
Finance, insurance, real estate, and rental and leasing................... 958 20,350,486 3,989,308 3,103,849 7.5 9.9 Securities, commodity contracts, etc................................................. 151 8,794,440 1,803,039 1,530,564 3.7 6.6 Insurance and related activities......................................................... 242 9,644,044 1,651,711 1,008,457 2.4 2.3
Services................................................................................................ 1,934 23,034,241 5,038,974 5,244,781 12.7 11.1 Professional, scientific, and technical services................................. 378 2,517,884 429,656 515,115 1.3 0.8 Management of holding companies ................................................. 905 17,338,629 3,971,638 3,862,923 9.3 8.8
¹ Before adjustments. ² Less than 0.05 percent. NOTE: Detail may not add to the total for "All industries" because of rounding.
[Money amounts are in thousands of dollars]
Selected sector or group
2001Percentage of total foreign tax
credit

187
Corporate Foreign Tax Credit, 2001
the foreign company instead of the country where theincome was generated.
The petroleum and coal products manufacturingindustry was responsible for 90.2 percent of theFOGEI gross income and 89.9 percent of FOGEItaxes. The wholesale petroleum trade and oil andgas extraction industries combined to account for5.4 percent of the gross income and 4.8 percent ofthe taxes.
Geographic FocusEuropean countries have traditionally accounted formuch of the foreign-source taxable income andforeign taxes reported by U.S. corporations claiming
a foreign tax credit, and Tax Year 2001 was noexception. Of the $164.8 billion in foreign-sourcetaxable income, nearly half (47.3 percent) wasearned from Europe, and, of the $44.5 billion incurrent-year foreign taxes, nearly half (48.6 percent)was paid to European nations.
Among individual countries, the United Kingdomwas the most significant, accounting for 18.1 percentof foreign-source taxable income and 15.8 percent ofcurrent-year foreign taxes. As shown in Figure D,the $29.8 million in income earned from the UK ismore than the income earned from any other countryor geographic region. The UK was also notable asthe only country among the leaders in foreign-sourcetaxable income and current-year foreign taxes thatexperienced increases in both measures (both inabsolute terms and in its share of the total) during 2001.
Asia was second among geographic regions withrespect to economic measures related to the foreigntax credit in 2001. Over 17.0 percent or $28.2 billionof the foreign-source taxable income came fromAsia, which also received over 20.0 percent or $9.0billion of the current-year foreign taxes. While main-taining its position as the second most prominentregion, Asia’s share of current-year taxes fell by11.1 percentage points from 2000 levels, and its shareof foreign-source taxable income dropped by 7.8percent points. These declines mirror the substantialdownturn in U.S. real exports destined for Asia in2001 [6]. Japan accounted for the second-largestshare of foreign taxes ($4.5 billion), but their share ofthe total dropped from 19.1 percent in 2000 to 10.2percent in 2001. Similarly, Japan’s share of foreign-source taxable income fell from 12.1 percent to7.0 percent.
Behind the UK, Canada was the next largestsource of foreign-source taxable income amongindividual countries. Notably, the $11.8 billion intaxable income from Canada are a 25.3-percentdecrease from 2000 [7]. Taxes paid to Canada in2001 fell 7.7 percent, which places them third behindthe UK and Japan.
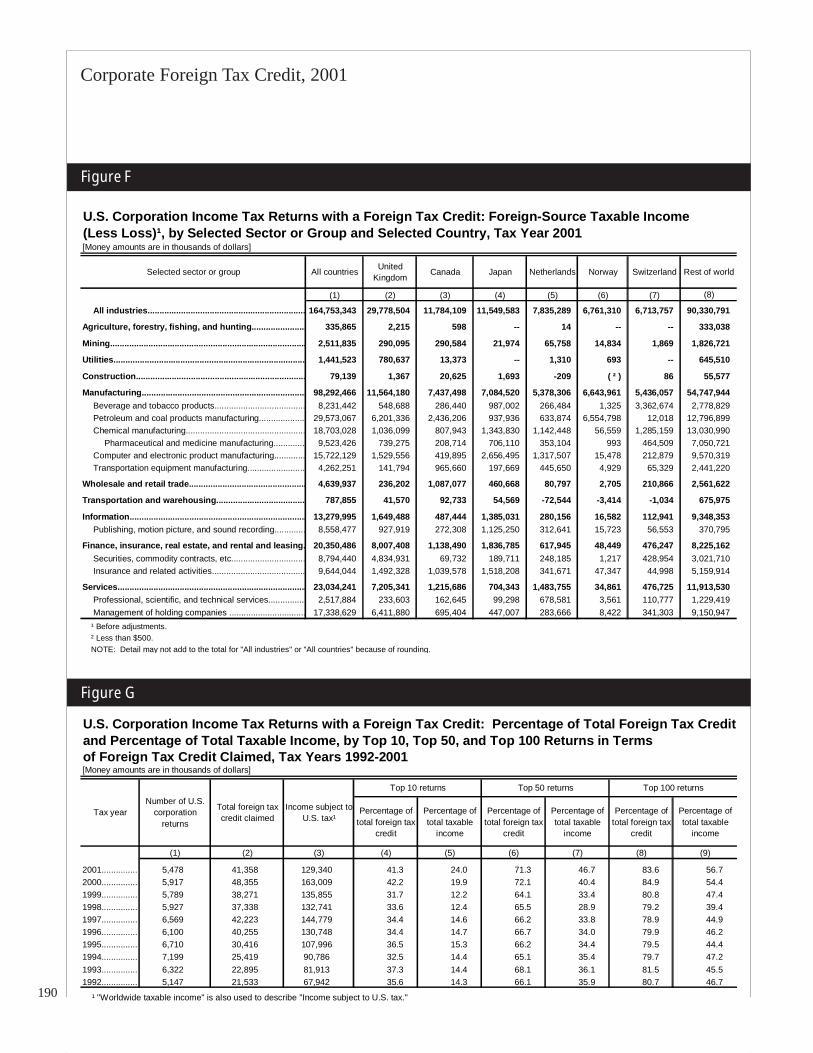
Figure F, which presents foreign-source taxableincome by selected industrial group and by selectedcountry, reveals some significant differences inindustrial composition among the leading countries.As mentioned previously, manufacturing is the domi-nant industrial classification for most financial mea-sures related to the foreign tax credit. Therefore, it is
Figure C
U.S. Corporation Income Tax Returns with a Foreign Tax Credit: Foreign Oil and Gas Extraction Gross Income, by Selected Industry and Country, Tax Year 2001[Money amounts are in millions of dollars]
Gross income Percentage
(less loss) of total
Selected industry:
All industries…………………........................... 30,946 100.0 Petroleum (including integrated) and coal products manufacturing……............... 27,920 90.2 Wholesale petroleum trade………………...... *863 * 2.8 Oil and gas extraction……………….............. 803 2.6 All other industries…………………................ 1,360 4.4
Selected country:
All countries..................................................... 30,946 100.0 Norway………………………………............... *5,762 * 18.6 United Kingdom………………………............. *5,161 * 16.7 Nigeria…………………………….................... *2,529 * 8.5 Indonesia………………………………............ *2,087 * 6.7 Canada……………………………................... *2,068 * 6.7 Bermuda........................................................ *1,353 * 4.4 United Arab Emirates..................................... *1,025 * 3.3 Saudi Arabia…………………......................... *1,008 * 3.3 Malaysia……………………………................. *924 * 3.0 Australia…………………………..................... *755 * 2.4 Thailand……………………………….............. *750 * 2.4 Spain.............................................................. *662 * 2.1 Trinidad.......................................................... *613 * 2.0 Egypt.............................................................. *492 * 1.6 Former Soviet Union…………………………… *483 * 1.6 Argentina........................................................ *468 * 1.5 Netherlands…………………………................ *450 * 1.5 All other countries¹…………………................ 4,356 14.1 * Data should be used with caution because of the small number of sample returns on which they are based. ¹ Includes U.S. Possessions. NOTE: Detail may not add to totals because of rounding.
Selected industry, country

188
Corporate Foreign Tax Credit, 2001
188
not surprising to observe the leading countries interms of foreign-source taxable income with signifi-cant amounts earned by manufacturers. Incomefrom manufacturers accounts for at least half of theincome paid by all of the countries except for theUnited Kingdom. Manufacturing income from theUK accounts for 38.8 percent of the income fromthat country, while manufacturing income accountsfor between 61.3 percent and 98.3 percent for theother countries listed in Figure F.
Next to manufacturing, the services and finance,insurance, real estate, rental and leasing industrialgroups are the next largest in terms of foreign-sourcetaxable income. Foreign-source taxable incomederived from the UK in these two industries totaled$15.2 billion or 35 percent of the total for these indus-tries. By comparison, the next largest contributor tothese industries was Canada, which accounted for$2.4 billion or just 5.8 percent of the total for theseindustries.
Concentration of Foreign Tax CreditsFor 2001, some 5,478 corporations claimed foreigntax credits, combining for a total foreign tax credit of$41.4 billion. While the average foreign tax creditclaimed was approximately $7.5 million per corpora-tion, the majority of the total foreign tax credit wasactually concentrated among a relatively smallnumber of corporations. As shown in Figure G,corporations reporting the 10 largest foreign taxcredits accounted for 41.3 percent of the total foreigntax credit and 24.0 percent of the foreign-sourcetaxable income in 2001. Meanwhile, 50 corporationsaccounted for 71.3 percent of the total foreign taxcredit and 46.7 percent of foreign-source taxableincome. The largest 100 returns in terms of foreigntax credit claimed accounted for 83.6 percent and56.7 percent of the foreign tax credit and foreign-source taxable income, respectively.
From 1992 to 1998, the concentration of foreigntax credits was relatively stable among the three
Figure D
U.S. Corporation Income Tax Returns with a Foreign Tax Credit: Foreign-Source Taxable Income and Current-Year Foreign Taxes, by Selected Geographic Area and Country, Tax Year 2001
(1) (2) (3) (4) (5) (6)
All countries............................................... 164,753,343 100.0 100.0 44,505,156 100.0 100.0 Canada............................................................. 11,784,109 7.2 9.6 4,067,258 9.1 9.9 Latin America.................................................. 18,166,392 11.0 12.4 4,369,874 9.8 10.4
Mexico.......................................................... 6,010,428 3.6 3.4 1,585,132 3.6 3.5 Brazil............................................................ 3,298,513 2.0 1.9 1,012,468 2.3 2.0
Europe............................................................. 77,952,092 47.3 48.8 21,611,291 48.6 51.5 France.......................................................... 3,547,254 2.2 3.0 1,238,867 2.8 3.1 Germany...................................................... 4,838,264 2.9 6.2 1,226,022 2.8 8.8 Ireland.......................................................... 4,550,866 2.8 2.4 247,896 0.6 0.7 Netherlands.................................................. 7,835,289 4.8 5.5 1,700,399 3.8 6.7 Spain............................................................ 3,204,769 1.9 1.1 1,742,683 3.9 1.7 United Kingdom........................................... 29,778,504 18.1 16.1 7,047,798 15.8 13.1 Norway......................................................... 6,761,310 4.1 1.5 3,681,006 8.3 3.5 Switzerland.................................................. 6,713,757 4.1 3.4 1,756,138 3.9 2.8
Africa................................................................ 3,618,463 2.2 2.9 1,715,561 3.9 4.6 Nigeria......................................................... 1,557,194 0.9 1.2 1,003,069 2.3 2.7
Asia.................................................................. 28,164,919 17.1 24.9 9,009,574 20.2 31.3 Japan........................................................... 11,549,583 7.0 12.1 4,549,401 10.2 19.1
Oceania............................................................ 4,523,451 2.7 2.9 1,079,347 2.4 3.2 Australia....................................................... 3,772,661 2.3 2.5 938,719 2.1 2.8
All other ¹......................................................... 20,543,917 12.5 17.9 2,652,251 6.0 7.1 ¹ Includes data from returns with no country stated. ² Before adjustments. NOTE: Detail may not add to totals because of rounding.
Percentage of total in 2000
Percentage of totalCurrent-year foreign
taxesPercentage of total
in 2000
[Money amounts are in thousands of dollars]
Selected geographic area or countryForeign-source taxable income
(less loss) ²Percentage of total

189
Corporate Foreign Tax Credit, 2001
categories displayed in Figure G. During this 7-yearperiod, the top 100 corporations with foreign taxcredits accounted for a high of 81.5 percent of thetotal foreign tax credit in 1993 and a low of 78.9percent in 1997. A similarly small difference of 3percent is seen among the highest (68.1 percent) andlowest (65.1 percent ) measures for the top 50 re-turns in terms of total foreign tax credits. As onemight expect, there was slightly more variation be-tween the highest (37.3 percent) and lowest (32.5percent ) measures in the smaller, top 10 category.
Relative to the first 7 years of the observationperiod, Tax Years 2000 and 2001 reveal a markedincrease in the concentration levels of foreign tax
credits and foreign-source taxable income among thelargest returns. The share of the total foreign taxcredit by the top 10 returns increased from 31.7percent in 1999 to 42.2 percent in 2000, with a slightdecline to 41.3 percent in 2001. Likewise, shares offoreign-source taxable income increased from 12.2percent in 1999 to 19.9 percent in 2000 and 24.0percent in 2001.
SummaryFor 2001, there were 5,478 corporations claiming atotal foreign tax credit of $41.4 billion. Thesecorporations reported $368.1 billion of taxableincome and $129.3 billion in income taxes before
Figure E
11.8
18.2
62.1
15.8
3.6
28.2
4.5
20.6
1.0 2.3 3.7 2.4 1.44.5
0.4 1.53.0 2.1
11.8
3.70.4
4.50.6 1.2
0
10
20
30
40
50
60
70
Canada Latin America EuropeanUnion
Other Europe Africa Asia Oceania All other¹
Foreign-source taxable income (less loss)
Current-year foreign taxes paid or accrued
Current-year tax deemed paid
U.S. Corporation Income Tax Returns with a Foreign Tax Credit: Foreign-Source Taxable Income, Taxes Paid, and Taxes Deemed Paid, by Geographic Area, Tax Year 2001
Geographic area
Billions of dollars
¹ Includes data from returns with no country stated.
190
Corporate Foreign Tax Credit, 2001
190
Figure F
Figure G
U.S. Corporation Income Tax Returns with a Foreign Tax Credit: Foreign-Source Taxable Income (Less Loss)¹, by Selected Sector or Group and Selected Country, Tax Year 2001[Money amounts are in thousands of dollars]
(1) (2) (3) (4) (5) (6) (7) (8)
All industries.................................................................. 164,753,343 29,778,504 11,784,109 11,549,583 7,835,289 6,761,310 6,713,757 90,330,791
Agriculture, forestry, fishing, and hunting....................... 335,865 2,215 598 -- 14 -- -- 333,038
Mining.................................................................................. 2,511,835 290,095 290,584 21,974 65,758 14,834 1,869 1,826,721
Utilities................................................................................ 1,441,523 780,637 13,373 -- 1,310 693 -- 645,510
Construction....................................................................... 79,139 1,367 20,625 1,693 -209 ( ² ) 86 55,577
Manufacturing..................................................................... 98,292,466 11,564,180 7,437,498 7,084,520 5,378,306 6,643,961 5,436,057 54,747,944 Beverage and tobacco products...................................... 8,231,442 548,688 286,440 987,002 266,484 1,325 3,362,674 2,778,829 Petroleum and coal products manufacturing................... 29,573,067 6,201,336 2,436,206 937,936 633,874 6,554,798 12,018 12,796,899 Chemical manufacturing.................................................. 18,703,028 1,036,099 807,943 1,343,830 1,142,448 56,559 1,285,159 13,030,990
Pharmaceutical and medicine manufacturing............. 9,523,426 739,275 208,714 706,110 353,104 993 464,509 7,050,721 Computer and electronic product manufacturing............. 15,722,129 1,529,556 419,895 2,656,495 1,317,507 15,478 212,879 9,570,319 Transportation equipment manufacturing........................ 4,262,251 141,794 965,660 197,669 445,650 4,929 65,329 2,441,220
Wholesale and retail trade................................................. 4,639,937 236,202 1,087,077 460,668 80,797 2,705 210,866 2,561,622
Transportation and warehousing..................................... 787,855 41,570 92,733 54,569 -72,544 -3,414 -1,034 675,975
Information.......................................................................... 13,279,995 1,649,488 487,444 1,385,031 280,156 16,582 112,941 9,348,353 Publishing, motion picture, and sound recording............. 8,558,477 927,919 272,308 1,125,250 312,641 15,723 56,553 370,795
Finance, insurance, real estate, and rental and leasing. 20,350,486 8,007,408 1,138,490 1,836,785 617,945 48,449 476,247 8,225,162 Securities, commodity contracts, etc............................... 8,794,440 4,834,931 69,732 189,711 248,185 1,217 428,954 3,021,710 Insurance and related activities....................................... 9,644,044 1,492,328 1,039,578 1,518,208 341,671 47,347 44,998 5,159,914
Services............................................................................... 23,034,241 7,205,341 1,215,686 704,343 1,483,755 34,861 476,725 11,913,530 Professional, scientific, and technical services............... 2,517,884 233,603 162,645 99,298 678,581 3,561 110,777 1,229,419 Management of holding companies ................................ 17,338,629 6,411,880 695,404 447,007 283,666 8,422 341,303 9,150,947
¹ Before adjustments. ² Less than $500. NOTE: Detail may not add to the total for "All industries" or "All countries" because of rounding.
Japan Netherlands Rest of worldSelected sector or group All countries United Kingdom
Canada Norway Switzerland
U.S. Corporation Income Tax Returns with a Foreign Tax Credit: Percentage of Total Foreign Tax Credit,and Percentage of Total Taxable Income, by Top 10, Top 50, and Top 100 Returns in Termsof Foreign Tax Credit Claimed, Tax Years 1992-2001[Money amounts are in thousands of dollars]
Percentage of total foreign tax
credit
Percentage of total taxable
income
Percentage of total foreign tax
credit
Percentage of total taxable
income
Percentage of total foreign tax
credit
Percentage of total taxable
income
(1) (2) (3) (4) (5) (6) (7) (8) (9)
2001................ 5,478 41,358 129,340 41.3 24.0 71.3 46.7 83.6 56.7 2000................ 5,917 48,355 163,009 42.2 19.9 72.1 40.4 84.9 54.4 1999................ 5,789 38,271 135,855 31.7 12.2 64.1 33.4 80.8 47.4 1998................ 5,927 37,338 132,741 33.6 12.4 65.5 28.9 79.2 39.4 1997................ 6,569 42,223 144,779 34.4 14.6 66.2 33.8 78.9 44.9 1996................ 6,100 40,255 130,748 34.4 14.7 66.7 34.0 79.9 46.2 1995................ 6,710 30,416 107,996 36.5 15.3 66.2 34.4 79.5 44.4 1994................ 7,199 25,419 90,786 32.5 14.4 65.1 35.4 79.7 47.2 1993................ 6,322 22,895 81,913 37.3 14.4 68.1 36.1 81.5 45.5 1992................ 5,147 21,533 67,942 35.6 14.3 66.1 35.9 80.7 46.7
¹ "Worldwide taxable income" is also used to describe "Income subject to U.S. tax."
Top 10 returns Top 50 returns Top 100 returns
Tax yearNumber of U.S.
corporation returns
Total foreign tax credit claimed
Income subject to U.S. tax¹
191
Corporate Foreign Tax Credit, 2001
credits. The foreign tax credit and other creditscombined to reduce the U.S. income tax liability by38.1 percent to $80.1 billion.
The manufacturing sector tallied the largest shareof foreign tax credits, foreign-source taxable income,and current-year foreign taxes. Among manufactur-ing corporations, those in the petroleum and coalproducts grouping reported the most foreign taxcredits with $9.9 billion. U.S. corporations within theservices industry contributed the next largest share offoreign tax credits with $5.2 billion.
Europe was the source for 47.3 percent of for-eign-source taxable income and 48.6 percent ofcurrent-year foreign taxes. The UK was the leadingcountry, by far, with $29.8 billion in foreign-sourcetaxable income and $7.0 billion in current-year for-eign taxes. The UK, Japan, and Canada combine toaccount for nearly a third (32.2 percent) of the tax-able income and 35.2 percent of foreign taxes.
Data Sources and LimitationsThe statistics in this article were derived based oncorporation income tax returns with a foreign taxcredit that were included in the 2001 Statistics ofIncome sample of returns with accounting periodsending between July 2001 and June 2002. Thesereturns were selected after administrative processingbut prior to any amendments or audit examination.The 2001 corporation income tax return sampleincluded approximately 139,000 returns sampled fromover 5.0 million active corporate returns filed for thisperiod. The corporate tax return forms included inthis sample were Forms 1120, 1120-L, 1120-F, 1120-PC, and 1120-REIT.
The foreign tax credit is provided under section901 of the Internal Revenue Code. Corporationsreport the foreign income and taxes related to thecredit on Form 1118, Computation of Foreign TaxCredit--Corporations, filed with their income taxreturns. The statistics in this article are based oninformation reported on Forms 1118 and relatedcorporate returns. Corporations with an “alternativeminimum tax” (AMT) liability are required to com-pute a separate “alternative minimum tax foreign taxcredit.” The AMT foreign tax credit data are notreflected in the statistics in this article, even if thecorporation reported both the “regular” foreign taxcredit and the AMT foreign tax credit. Corporationsreporting only the AMT computation had no regular
tax and, therefore, were not included in the foreigntax credit statistics.
There are small discrepancies between the morecomplete foreign tax credit data presented in thisarticle and those published in Statistics of Income--2001, Corporation Income Tax Returns. Thesedifferences can be attributed to several factors,including but not limited to the following reasons:Some of the returns designated for the Statistics ofIncome sample were received too late to be includedin the regular corporation statistics but were includedin the foreign tax credit statistics presented in thisarticle. Certain corporations submitted preliminarydata on their original returns because they lackedcomplete information on their foreign operations atthe time of filing. On a case-by-case basis, additionalinformation was requested directly from the tax-payer. However, amended returns filed at a laterdate, including those with carrybacks of foreigntaxes to be credited for 2001, were not included inthe statistics.
Foreign income and taxes are understated in thisarticle to the extent that they were not reported onForm 1118. Also, the 2001 foreign tax credit statis-tics in this article do not represent the final amountscredited that year. A complete foreign tax creditamount for 2001 would reflect the results of anyaudits as well as the carryback of any foreign taxcredits from 2002 and 2003. In addition to current-year foreign taxes, foreign taxes available for creditshown in this article include only those carried for-ward to 2001 from previous years. Also, somecorporations did not file Form 1118 because they didnot have a U.S. income tax liability, and were thusunable to credit any foreign taxes paid, accrued, ordeemed paid for 2001. Finally, other corporationscould have deducted their foreign taxes from theirgross incomes instead of claiming a foreign tax credit.
Because the estimates are based on a sample,they are subject to sampling error. Coefficients ofVariation (CV’s) are used to measure the magnitudeof this sampling error. The CV concept is defined inthe section on sampling variability in the “SOI Sam-pling Methodology and Data Limitations” appendix ofthis publication. Figure H presents CV’s for foreigntax credits by selected North American IndustryClassification System (NAICS) divisions, industrialsectors, and sectors. The smaller the CV, the morereliable the estimate is judged to be.

192
Corporate Foreign Tax Credit, 2001
192
The industry classification used in this article isbased on NAICS, created under the auspices of thegovernments of the United States, Mexico, andCanada in response to the North American FreeTrade Agreement (NAFTA). NAICS is uniqueamong industry classifications in that economic unitsthat have similar production processes are classifiedin the same industry. NAICS replaced the StandardIndustrial Classification (1997) of the United States.Prior to 1996, the SIC system was the basis forindustrial groupings in articles by Statistics of Incomeon the foreign tax credit.
Description of Tables 1-3Table 1, columns 2 through 15, presents statistics onassets, receipts, income, and taxes reported on thebasic corporation income tax returns for thosecorporations claiming a foreign tax credit. Columns16 through 51 present statistics from Form 1118,Foreign Tax Credit--Corporations. Schedulereferences indicate the parts of Form 1118 fromwhich the data were obtained. Columns 16 through35 present statistics on foreign income (i.e., income
from sources outside the United States, includingU.S. possessions) and deductions, reported primarilyon Form 1118, Schedule A, Income or Loss BeforeAdjustments.
Although the amounts of oil and gas income anddeductions (columns 23 and 35, respectively) areincluded in the summary columns (i.e., columns 16through 22 and 26 through 34), these amounts arealso reported separately (on Form 1118, Schedule I,Reduction of Oil and Gas Extraction Taxes) be-cause oil and gas extraction income is subject tospecial rules under Internal Revenue Code section907, which effectively requires a separate limitationcalculation for taxes related to oil and gas extractionincome. This may result in a reduction of foreigntaxes available for credit. Reductions in creditable oiland gas extraction income taxes are included withseveral other types of reductions in column 40 ofTable 1 and column 27 of Table 2.
Foreign branch income is also included in thesummary amounts reported in columns 16 through 22of Table 1, and is also reported separately (on Form1118, Schedule F, Gross Income and DefinitelyAllocable Deductions for Foreign Branches) incolumn 24 of Table 1. For Tax Year 2001, Codesection 863(b) income (income partly from within andpartly from without the United States) is included inthe summary amounts reported in columns 16 through22 of Table 1 and is aggregated on Form 1118,Schedule A, Income or (Loss) Before Adjustments,using a special country code.
Total deductions not definitely allocable to spe-cific types of income (column 31 of Table 1) areequal to the sum of columns 32 through 34, relating toresearch and development, interest, and any other“not definitely allocable expenses” (any differencesare due to taxpayer reporting variations). Totalforeign-source gross income (Table 1, column 16)less total foreign deductions (Table 1, column 25) isequal to foreign-source taxable income before adjust-ments (Table 1, column 36).
Adjustments to foreign-source taxable income(reported in column 37 of Table 1) include the alloca-tion of: (1) current-year foreign-source losses, (2)overall foreign losses, and (3) current-year U.S.-source losses as well as the recapture of prior-yearoverall foreign losses and recharacterization of prior-year foreign-source losses. These adjustments(reported on Schedule J, Separate Limitation Loss
Figure H
Coefficients of Variation for Foreign Tax Credit,by Selected Sector or Group, Tax Year 2001
Selected sector or group
Coefficients of variation for
foreign tax credit (percentages)
All industries………………….………………...……................. 0.03 Agriculture, forestry, fishing, and hunting……….................... 0.04 Mining…………………………………..………………................... 1.22 Utilities.…………………………………..………………................. -- Construction…………………………………………….................. 2.94 Manufacturing…………………………………………................... 0.01
Beverage and tobacco products.............................................. 0.01 Petroleum and coal products manufacuring ………................ -- Chemical manufacturing ……………………………................. 0.02
Pharmaceutical and medicine manufacturing..................... 0.02 Computer and electronic product manufacturing..................... 0.03 Transportation equipment manufacturing….…………............. 0.02
Wholesale and retail trade………………………………………... 0.15 Transportation and warehousing ............................................ 0.30 Information ……………………………………………................... 0.13 Finance, insurance, real estate, and rental, and leasing …… 0.12
Securities, commodity contracts, etc....................................... 0.23 Insurance and related activities............................................... --
Services………………………...................................................... 0.12 Professional, scientific, and technical services....................... 0.48 Management of holding companies......................................... 0.14

193
Corporate Foreign Tax Credit, 2001
Allocations and Other Adjustments Necessary ToDetermine Numerators of Limitation Fractions,Year-End Recharacterization Balances, andOverall Foreign Loss Account Balances) affectthe numerator of the limitation fraction used to com-pute the foreign tax credit. The income after adjust-ments (the numerator of the limitation fraction) isreported in column 38 of Table 1. The limitationfraction, foreign-source taxable income divided bytotal taxable income from all sources, is applied to thetotal U.S. tax against which the credit is allowed todetermine any limitation on the foreign tax credit.Taxpayers are required to calculate this limitation foreach income basket.
Statistics on foreign taxes are reported in col-umns 39 through 51 of Table 1. Data on foreignincome taxes paid, accrued, and “deemed paid”(through Controlled Foreign Corporations) from Form1118, Schedule B, Foreign Tax Credit--Corpora-tion, are reported in columns 42 through 51 of Table1. Total foreign taxes paid or accrued (Table 1,column 43) are the sum of columns 44 through 50(any differences are due to taxpayer reporting varia-tions). Table 1, column 41 shows carryovers ofexcess or “unused” taxes from prior years, whichcan be added to the 2001 pool of creditable foreigntaxes. Total foreign taxes paid, accrued, and“deemed paid,” plus carryover, are then adjusted forcertain items (e.g., reductions of foreign taxes relatedto oil and gas extraction income under Internal Rev-enue Code section 907 and reductions of foreigntaxes related to income earned in sanctioned coun-tries under Internal Revenue code section 901(j), aswell as other reductions of creditable taxes) in col-umn 40. Thus, total foreign taxes available for credit(Table 1, column 39) are equal to total foreign taxespaid, accrued, and “deemed paid” (column 42), plusany carryover of prior-year excess or “unused”foreign taxes (column 41), less any reduction inforeign taxes (column 40).
Tables 2 and 3 are similar in column format toTable 1 except that they provide data only from Form1118 without the data from the basic corporationincome tax return (for example, total assets and totalreceipts). Table 2 presents data reported by indus-trial grouping and separate income basket, whileTable 3 presents data by selected geographic regionand country.
Explanation of Selected TermsAdjustments to taxable income.--This includes
several types of adjustments reported on ScheduleJ of Form 1118, Computation of Foreign TaxCredit--Corporations. These include the allocationof current-year foreign losses, overall foreign losses,and current-year U.S.-source losses. Adjustmentsdue to prior-year loss allocations are also made,including the recapture of foreign-source losses andthe recharacterization of foreign-source income. Theoverall result of these adjustments is shown in column37 of Table 1 and column 24 of Table 2.
Carryover of foreign taxes.--Under InternalRevenue Code section 904, “U.S. persons” areallowed a 2-year carryback and 5-year carryforwardof “excess” or “unused” foreign taxes for purposesof computing the “final” foreign tax credit for thoseyears. Such taxes were included in the computationof the current-year foreign tax credit to the extentthat they did not exceed the credit limitation for thecurrent year. The 2001 statistics used for this articleinclude only those foreign taxes that were carriedforward from previous years (1996-2000). Seecolumn 41 of Table 1 and column 28 of Table 2.
Controlled Foreign Corporation.--UnderInternal Revenue Code section 957, a foreign corpo-ration is a ‘Controlled Foreign Corporation” if morethan 50 percent of its outstanding voting stock, ormore than 50 percent of the value of all its outstand-ing stock, is owned (directly, indirectly, or construc-tively) by “U.S. shareholders” on any day during theforeign corporation’s tax year. Internal RevenueCode section 951(b) defines a “U.S. shareholder” asa U.S. person with 10 percent or more of the totalcombined voting stock of the foreign corporation.Ownership attribution rules are provided in InternalRevenue Code section 958. See also Deemed Divi-dends and Subpart F.
Current-year foreign taxes.--Current-yearforeign taxes include foreign income taxes paid,accrued, or “deemed paid” and are shown in column42 of Table 1, column 29 of Table 2, and column 15of Table 3. Current-year foreign taxes do not includeany carryback or carryforward of foreign taxes fromother tax years.
Deemed dividends.--Certain types of incomeearned by Controlled Foreign Corporations (CFC’s)

194
Corporate Foreign Tax Credit, 2001
194
are recognized under Subpart F of the Internal Rev-enue Code as current-year income of the U.S. corpo-ration, even if no income is actually received from theCFC in the current tax year. In such cases, the U.S.corporation is deemed to have received a pro-ratashare of this income and required to report it as a“deemed dividend” on Form 1118, Schedule A. SeeInternal Revenue Code section 951(a) for a moredetailed description of income reported as deemeddividends. See also Controlled Foreign Corpora-tion and Subpart F income.
Dividend gross-up.--Since a dividend representsa distribution from after-tax earnings, the amount ofincome that a domestic corporation recognizes onreceiving a dividend from a foreign corporation is netof all the foreign income taxes paid by that foreigncorporation. U.S. corporations that satisfy ownershipand other requirements are permitted to take an“indirect” foreign tax credit for taxes paid on theprofits from which the dividends were distributed.Under Internal Revenue Code section 78, these taxesare “deemed paid” by the U.S. corporations underInternal Revenue Code sections 902 and 960(a).Consequently, the dividend income is “grossed-up” bythe amount of the taxes deemed paid on the incomefrom which the dividend was paid. This preventsU.S. corporations from crediting the foreign taxesdeemed paid and deducting the same taxes in com-puting foreign-source taxable income.
European Union (E.U.).--The European Union(E.U.) is a union of 15 independent states based onthe former European Community and founded toenhance political, economic, and social cooperation.Formerly known as the European Community (E.C.)or the European Economic Community (E.E.C.), themember states include Austria, Belgium, Denmark,Finland, France, Germany, Greece, Ireland, Italy,Luxembourg, the Netherlands, Portugal, Spain, Swe-den, and the United Kingdom.
Financial services income.--This separatelimitation category or basket applies to certain incomefrom financial services activities. Financial servicesincome includes all income, including “passive income,”(see below) that is generated from banking, insur-ance, financing, or similar activities, and from certaintypes of insurance investments. Financial servicesincome excludes “high withholding tax interest,”dividends from noncontrolled foreign corporations as
defined in Internal Revenue Code section 902, andcertain types of export financing interest.
Foreign oil and gas extraction income(FOGEI).--FOGEI is the gross income from theextraction of oil and gas, as well as from the sale ofassets used in the extraction of oil and gas, or fromrelated services, working capital, dividend and part-nership distributions, and any other oil and gas extrac-tion income. In general, a foreign tax credit is notpermitted for foreign taxes paid, accrued, or deemedpaid in connection with the purchase or sale of oil orgas extracted in a foreign country if the taxpayer hasno economic interest in the oil or gas and if the pur-chase or sales price differs from the fair market value.
Foreign Sales Corporations (FSC).--A ForeignSales Corporation was a company incorporatedabroad and controlled by a U.S. “person.” A portionof the FSC’s “foreign trade income” was exemptfrom U.S. taxation. Although these statistics do notinclude FSC returns, FSC dividends received bycorporations claiming a foreign tax credit are in-cluded. Dividends and interest generated by a FSCcomprise a separate limitation category. In July1999, the World Trade Organization (WTO) declaredFSC provisions to be an illegal export subsidy. Con-gress repealed the FSC provisions and created theExtraterritorial Income Exclusion Act in November2000, which allowed U.S. corporations to continueoperating FSC’s until December 2001. The Euro-pean Union subsequently challenged the legality ofthe Extraterritorial Income Exclusion Act, and, inAugust 2001, the WTO ruled that it was inconsistentwith United States obligations. The Appellate Bodyof the WTO affirmed this ruling on January 14, 2002.
Foreign-source taxable income.--Foreign-source taxable income is equal to gross income (lessloss) less deductions from sources outside the UnitedStates, including U.S. possessions, and is included in“income subject to U.S. tax” in the statistics.
Foreign trade income.--Includes gross receiptsfrom foreign trade earned by a Foreign Sales Corpo-ration (FSC) from: 1) the sale of “export property,”2) the leasing of export property for use outside theUnited States, or 3) services in connection with thesale or leasing of export property. The related sepa-rate limitation category, taxable income attributable toforeign trade income, is unusual in the 2001 statistics.Code Section 923(b), which permits the foreign trade

195
Corporate Foreign Tax Credit, 2001
income basket, has since been repealed, effectiveSeptember 30, 2000.
General limitation income.---This separatelimitation category or basket comprises foreign incomenot included in any other separate limitation category.
High withholding tax interest.--This separatelimitation category or basket includes interest incomesubject to a withholding tax greater than or equal to 5percent. This basket does not include interest re-ceived from the financing of certain export activities.
Income resourced by bilateral tax treaty.--Selected U.S. income tax treaties contain provisionsreclassifying certain income items from being U.S.-source income to foreign-source income. This usu-ally occurs when a tax treaty allows the other coun-try to tax what would otherwise be U.S.-sourceincome. Certain dividends and income from a U.S.-owned foreign corporation can be included in thiscategory. A separate foreign tax credit limitationhas to be computed for each amount resourced by atax treaty.
Interest-Charge Domestic International SalesCorporation (IC-DISC).--IC-DISC’s were smalldomestic corporations formed to export U.S. prod-ucts. An IC-DISC could defer the tax liability on aportion of its income but had to ultimately pay thedeferred tax plus interest. Under the DISC provi-sions, a U.S. manufacturer could set up a DISC(located in the United States) whose income was nottaxed at the DISC level. Instead, the corporateshareholder was taxed directly on a portion of theDISC’s income that was deemed distributed. Theportion of the income not deemed distributed was notsubject to U.S. taxation until it was actually distrib-uted. The foreign trading partners of the UnitedStates that are party to the General Agreement onTariffs and Trade (GATT) maintained that the DISCprovisions constituted an illegal export trade subsidybecause they allowed indefinite deferral of directtaxes on income from exports earned in the UnitedStates. Essentially, this pre-1985 system of taxdeferral for export income was replaced by theexemption system of Foreign Sales Corporations(FSC’s), now also repealed. To elect IC-DISCstatus, at least 95 percent of the corporation’s grossreceipts had to be “qualified export receipts,” and atleast 95 percent of its assets “qualified export as-sets.” Distributions from an IC-DISC are a separatelimitation category.
Noncontrolled section 902 corporation.--Anoncontrolled foreign corporation is defined by Inter-nal Revenue Code section 902 as a foreign corpora-tion in which a U.S. corporation possesses at least 10percent of the voting stock and the U.S. shareholdersown no more than 50 percent of the stock measuredby voting power or value. These foreign corporationsare also referred to as “10/50 companies.” Eachnoncontrolled section 902 foreign corporation istreated individually, with dividends from eachcorporation placed in separate categories or bas-kets to avoid the averaging of high-taxed and low-taxed dividends.
OPEC Countries.--The members of the Organi-zation of Petroleum Exporting Countries (OPEC) for2001 were Algeria, Indonesia, Iran, Iraq, Kuwait,Libya, Nigeria, Qatar, Saudi Arabia, the United ArabEmirates, and Venezuela.
Passive income.--This separate limitation cat-egory or basket includes dividends, interest (with theexception noted below), rents, royalties, annuities, andnet capital gains, as well as commodity transactionsnot connected with the active conduct of a trade orbusiness. High-taxed passive income is excludedfrom this basket and is included, instead, under finan-cial services income. Interest subject to a high with-holding tax is categorized in a separate basket (seeHigh withholding tax interest, above). Further-more, income that by definition is passive, yet issubject to a foreign tax rate exceeding the highestapplicable U.S. rate, is placed in the general limitationbasket instead of the passive income basket.
Section 901(j) income.--Internal Revenue Codesection 901(j) denies credit for taxes paid or accruedto select foreign governments that the United Statesdeems ineligible. These countries include the follow-ing: (1) countries not recognized by the UnitedStates, (2) countries with which the United States hassevered or does not conduct diplomatic relations, or(3) countries identified by the United States as pro-viding support for terrorism. For 2001, countriessubject to these restrictions were Cuba, Iran, Iraq,Libya, North Korea, Sudan, and Syria. Income anddeductions from section 901(j) countries are reportedon Form 1118, even though these taxes are not cred-itable. A separate limitation credit is computed forinformational purposes and is not included in theforeign tax credit of the corporation.
196
Corporate Foreign Tax Credit, 2001
196
Shipping income.--This separate limitationcategory or basket applies to certain income fromshipping-related activities. Shipping income includesthe following: (1) all income from the use (or leasingfor use) of a vessel or aircraft in foreign commerce,(2) income from services directly related to the useof a vessel or aircraft, (3) gains on the sale or ex-change of a vessel or aircraft used in the perfor-mance of such services, and (4) income generatedfrom other space and oceanic activities not includedelsewhere. Income that would be “foreign basecompany shipping income” for purposes of determin-ing the income received from Controlled ForeignCorporations, under Internal Revenue Code section954(f), is also classified as shipping income.
Specifically allocable income.--Internal Rev-enue Code section 863(b) provides special rules fordetermining taxable income from sources outside theUnited States with respect to gross income derivedpartly from within and partly from outside the UnitedStates. The income apportioned to sources outsidethe United States under these special rules is com-monly referred to as “Section 863(b) income.”
Subpart F income.--Provisions of the InternalRevenue Code limit the ability of U.S. taxpayers todefer U.S. taxes by shifting certain types of incometo lower-tax foreign countries. Subpart F identifiescertain types of income, primarily passive investmentincome, earned by certain Controlled Foreign Corpo-rations (CFC’s), and requires the U.S corporation toreport a pro-rata share of this current-year incomefor U.S. tax purposes, regardless of whether or notthe income was actually repatriated to the U.S.corporation in the current tax year. See also Con-trolled Foreign Corporation and Deemed dividends.
Tax deemed paid.--See Dividend gross-up.U.S. person.--A U.S. person is any citizen or
resident of the United States, domestic partnership,corporation, association, company, or any estate ortrust that is not considered “foreign.” See InternalRevenue Code section 7701 for more information onthe definition of a U.S. person.
Notes and References
[1] Since income tax returns for Foreign SalesCorporations were not a part of the sample usedfor the statistics, this income category is notincluded. Distributions from FSC’s or former
FSC’s are reported on the parent corporation’sreturn and are included in these statistics whenprovided by the taxpayer.
[2] A foreign tax credit is not allowed for foreigntaxes paid to countries sanctioned by the U.S.Government. Nevertheless, a foreign tax creditlimitation is computed for each sanctionedcountry. These countries for Tax Year 2001were Cuba, Iran, Iraq, Libya, North Korea,Sudan, and Syria.
[3] According to Internal Revenue Code section999, U.S. persons who participate or cooperatein international boycotts not sanctioned by U.S.law, regulation, or executive order are penalizedunder special boycott provisions. Under theboycott provisions, penalties include a reductionof foreign tax credits, an increase in taxableincome for Controlled Foreign Corporationsunder subpart F, the exclusion of extraterritorialincome, and a reduction in benefits otherwiseallowed regarding Foreign Sales Corporations(FSC’s) and Interest-Charge Domestic Interna-tional Sales Corporation (IC-DISC’s), asapplicable. For more information on interna-tional boycotts, see Redmiles, Melissa, “Interna-tional Boycott Reports, 2001 and 2002,” Statis-tics of Income Bulletin, Spring 2005, Volume24, Number 4.
[4] Taxes carried back to 2001 returns from 2002and 2003 are not reflected in the data, asamended returns and refund claims are notincluded in the statistics.
[5] For more data on national and averagesubnational (State or provincial) income taxrates, see KPMG, “Corporate Tax Rate Sur-vey,” www.us.kpmg.com/microsite/Global_Tax/TaxFacts, January 2002.
[6] Growth of U.S. exports was tempered by aworldwide economic slowdown in economicactivity, as world output growth slowed from 4.7percent in 2000 to 2.3 percent in 2001. Thelargest percentage-point declines in U.S. realexports were generally for those destined forAsia: South Korea (-58.4 percent), Taiwan (-37.3percent), and Japan (-37.1 percent). For moreinformation on this topic, see Kliesen, Kevin L.,

197
Corporate Foreign Tax Credit, 2001
“The 2001 Recession: How was it different andwhat developments may have caused it?,”Federal Reserve Bank of St. Louis Review,September/October 2003.
[7] For geographic region data for Tax Year 2000,see Luttrell, Scott, “Corporate Foreign TaxCredit, 2000,” Statistics of Income Bulletin,Fall 2004, Volume 24, Number 2.
SOURCE: IRS, Statistics of Income Bulletin,Fall 2005, Publication 1136. (Rev. 12-05.)
198
Corporate Foreign Tax Credit, 2001
198
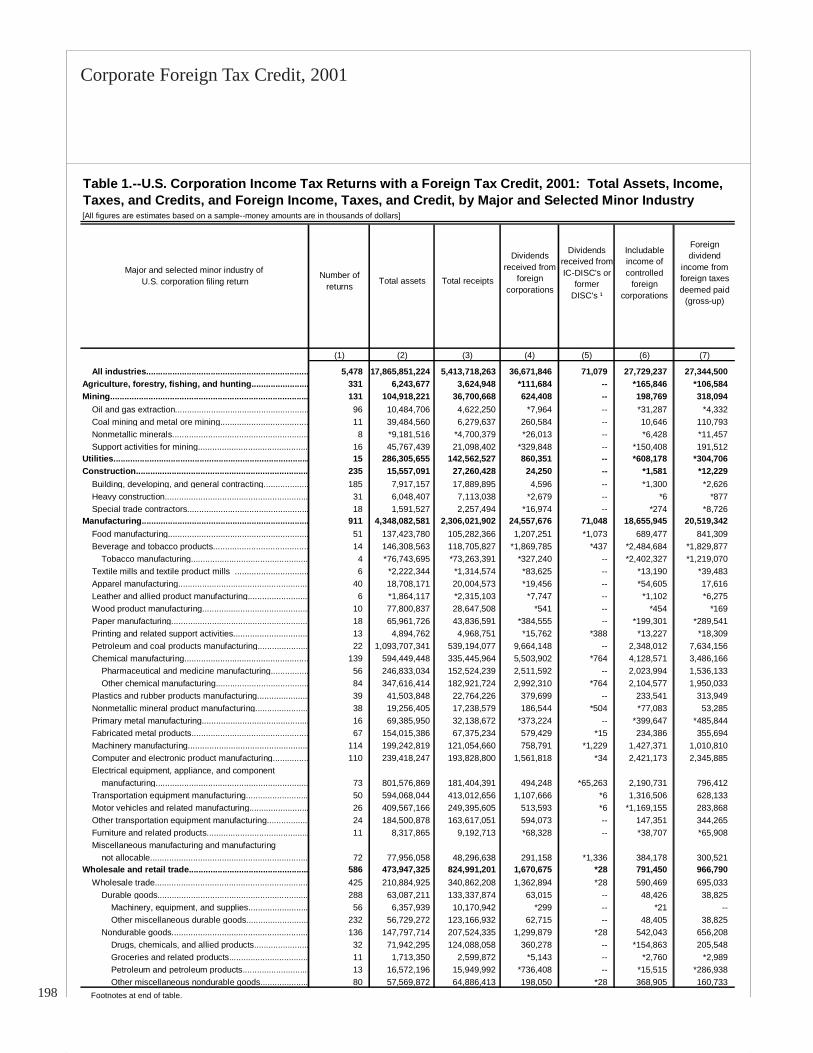
Table 1.--U.S. Corporation Income Tax Returns with a Foreign Tax Credit, 2001: Total Assets, Income, Taxes, and Credits, and Foreign Income, Taxes, and Credit, by Major and Selected Minor Industry[All figures are estimates based on a sample--money amounts are in thousands of dollars]
Major and selected minor industry of U.S. corporation filing return
(1) (2) (3) (4) (5) (6) (7)
All industries.................................................................... 5,478 17,865,851,224 5,413,718,263 36,671,846 71,079 27,729,237 27,344,500 Agriculture, forestry, fishing, and hunting........................ 331 6,243,677 3,624,948 *111,684 -- *165,846 *106,584 Mining................................................................................... 131 104,918,221 36,700,668 624,408 -- 198,769 318,094 Oil and gas extraction........................................................ 96 10,484,706 4,622,250 *7,964 -- *31,287 *4,332 Coal mining and metal ore mining..................................... 11 39,484,560 6,279,637 260,584 -- 10,646 110,793 Nonmetallic minerals......................................................... 8 *9,181,516 *4,700,379 *26,013 -- *6,428 *11,457 Support activities for mining.............................................. 16 45,767,439 21,098,402 *329,848 -- *150,408 191,512 Utilities.................................................................................. 15 286,305,655 142,562,527 860,351 -- *608,178 *304,706 Construction........................................................................ 235 15,557,091 27,260,428 24,250 -- *1,581 *12,229 Building, developing, and general contracting................... 185 7,917,157 17,889,895 4,596 -- *1,300 *2,626 Heavy construction............................................................ 31 6,048,407 7,113,038 *2,679 -- *6 *877 Special trade contractors................................................... 18 1,591,527 2,257,494 *16,974 -- *274 *8,726 Manufacturing...................................................................... 911 4,348,082,581 2,306,021,902 24,557,676 71,048 18,655,945 20,519,342 Food manufacturing........................................................... 51 137,423,780 105,282,366 1,207,251 *1,073 689,477 841,309 Beverage and tobacco products........................................ 14 146,308,563 118,705,827 *1,869,785 *437 *2,484,684 *1,829,877 Tobacco manufacturing................................................. 4 *76,743,695 *73,263,391 *327,240 -- *2,402,327 *1,219,070 Textile mills and textile product mills ............................... 6 *2,222,344 *1,314,574 *83,625 -- *13,190 *39,483 Apparel manufacturing....................................................... 40 18,708,171 20,004,573 *19,456 -- *54,605 17,616 Leather and allied product manufacturing......................... 6 *1,864,117 *2,315,103 *7,747 -- *1,102 *6,275 Wood product manufacturing............................................. 10 77,800,837 28,647,508 *541 -- *454 *169 Paper manufacturing......................................................... 18 65,961,726 43,836,591 *384,555 -- *199,301 *289,541 Printing and related support activities................................ 13 4,894,762 4,968,751 *15,762 *388 *13,227 *18,309 Petroleum and coal products manufacturing..................... 22 1,093,707,341 539,194,077 9,664,148 -- 2,348,012 7,634,156 Chemical manufacturing.................................................... 139 594,449,448 335,445,964 5,503,902 *764 4,128,571 3,486,166 Pharmaceutical and medicine manufacturing................ 56 246,833,034 152,524,239 2,511,592 -- 2,023,994 1,536,133 Other chemical manufacturing....................................... 84 347,616,414 182,921,724 2,992,310 *764 2,104,577 1,950,033 Plastics and rubber products manufacturing...................... 39 41,503,848 22,764,226 379,699 -- 233,541 313,949 Nonmetallic mineral product manufacturing...................... 38 19,256,405 17,238,579 186,544 *504 *77,083 53,285 Primary metal manufacturing............................................. 16 69,385,950 32,138,672 *373,224 -- *399,647 *485,844 Fabricated metal products................................................. 67 154,015,386 67,375,234 579,429 *15 234,386 355,694 Machinery manufacturing................................................... 114 199,242,819 121,054,660 758,791 *1,229 1,427,371 1,010,810 Computer and electronic product manufacturing............... 110 239,418,247 193,828,800 1,561,818 *34 2,421,173 2,345,885 Electrical equipment, appliance, and component manufacturing................................................................ 73 801,576,869 181,404,391 494,248 *65,263 2,190,731 796,412 Transportation equipment manufacturing.......................... 50 594,068,044 413,012,656 1,107,666 *6 1,316,506 628,133 Motor vehicles and related manufacturing......................... 26 409,567,166 249,395,605 513,593 *6 *1,169,155 283,868 Other transportation equipment manufacturing................. 24 184,500,878 163,617,051 594,073 -- 147,351 344,265 Furniture and related products........................................... 11 8,317,865 9,192,713 *68,328 -- *38,707 *65,908 Miscellaneous manufacturing and manufacturing not allocable.................................................................. 72 77,956,058 48,296,638 291,158 *1,336 384,178 300,521 Wholesale and retail trade.................................................. 586 473,947,325 824,991,201 1,670,675 *28 791,450 966,790 Wholesale trade................................................................ 425 210,884,925 340,862,208 1,362,894 *28 590,469 695,033 Durable goods............................................................... 288 63,087,211 133,337,874 63,015 -- 48,426 38,825 Machinery, equipment, and supplies......................... 56 6,357,939 10,170,942 *299 -- *21 -- Other miscellaneous durable goods.......................... 232 56,729,272 123,166,932 62,715 -- 48,405 38,825 Nondurable goods......................................................... 136 147,797,714 207,524,335 1,299,879 *28 542,043 656,208 Drugs, chemicals, and allied products....................... 32 71,942,295 124,088,058 360,278 -- *154,863 205,548 Groceries and related products................................. 11 1,713,350 2,599,872 *5,143 -- *2,760 *2,989 Petroleum and petroleum products............................ 13 16,572,196 15,949,992 *736,408 -- *15,515 *286,938 Other miscellaneous nondurable goods.................... 80 57,569,872 64,886,413 198,050 *28 368,905 160,733 Footnotes at end of table.
Number of returns
Total assets Total receipts
Dividends received from
foreign corporations
Dividends received from IC-DISC's or
former DISC's ¹
Includable income of controlled
foreign corporations
Foreign dividend
income from foreign taxes deemed paid
(gross-up)
199
Corporate Foreign Tax Credit, 2001
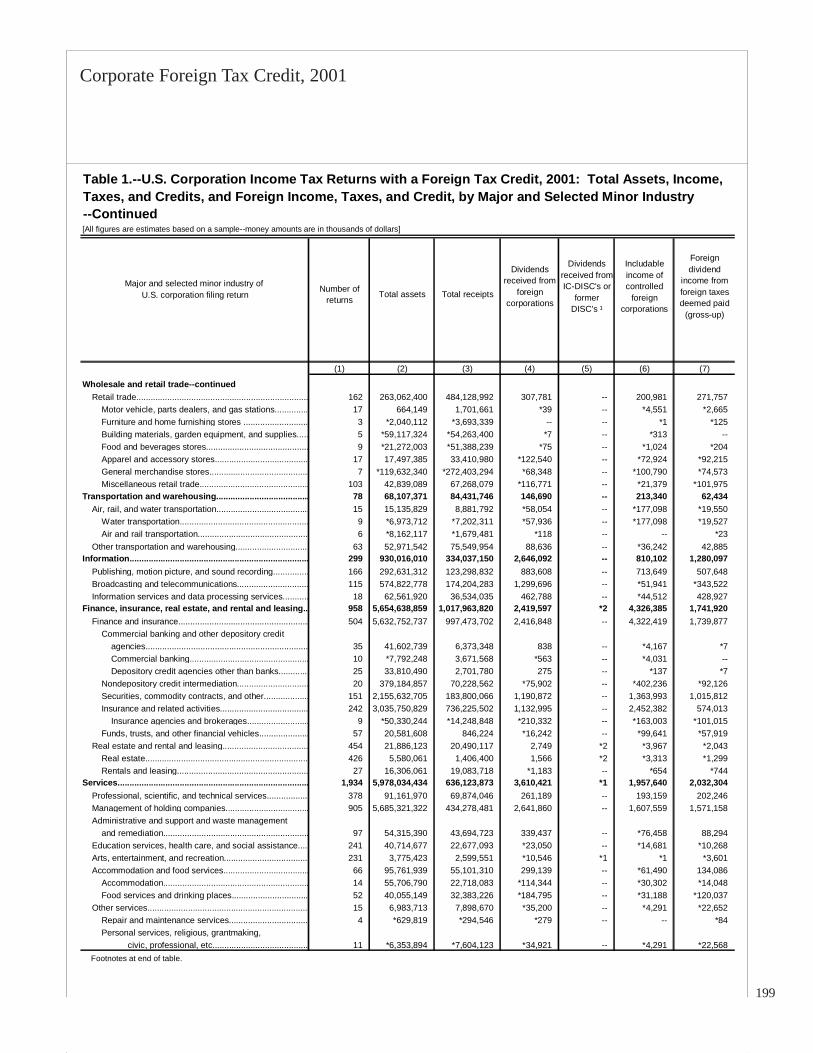
Table 1.--U.S. Corporation Income Tax Returns with a Foreign Tax Credit, 2001: Total Assets, Income, Taxes, and Credits, and Foreign Income, Taxes, and Credit, by Major and Selected Minor Industry--Continued[All figures are estimates based on a sample--money amounts are in thousands of dollars]
Major and selected minor industry of U.S. corporation filing return
(1) (2) (3) (4) (5) (6) (7)
Wholesale and retail trade--continued Retail trade........................................................................ 162 263,062,400 484,128,992 307,781 -- 200,981 271,757 Motor vehicle, parts dealers, and gas stations.............. 17 664,149 1,701,661 *39 -- *4,551 *2,665 Furniture and home furnishing stores ........................... 3 *2,040,112 *3,693,339 -- -- *1 *125 Building materials, garden equipment, and supplies..... 5 *59,117,324 *54,263,400 *7 -- *313 -- Food and beverages stores........................................... 9 *21,272,003 *51,388,239 *75 -- *1,024 *204 Apparel and accessory stores....................................... 17 17,497,385 33,410,980 *122,540 -- *72,924 *92,215 General merchandise stores.......................................... 7 *119,632,340 *272,403,294 *68,348 -- *100,790 *74,573 Miscellaneous retail trade.............................................. 103 42,839,089 67,268,079 *116,771 -- *21,379 *101,975 Transportation and warehousing....................................... 78 68,107,371 84,431,746 146,690 -- 213,340 62,434 Air, rail, and water transportation....................................... 15 15,135,829 8,881,792 *58,054 -- *177,098 *19,550 Water transportation...................................................... 9 *6,973,712 *7,202,311 *57,936 -- *177,098 *19,527 Air and rail transportation.............................................. 6 *8,162,117 *1,679,481 *118 -- -- *23 Other transportation and warehousing............................... 63 52,971,542 75,549,954 88,636 -- *36,242 42,885 Information........................................................................... 299 930,016,010 334,037,150 2,646,092 -- 810,102 1,280,097 Publishing, motion picture, and sound recording............... 166 292,631,312 123,298,832 883,608 -- 713,649 507,648 Broadcasting and telecommunications.............................. 115 574,822,778 174,204,283 1,299,696 -- *51,941 *343,522 Information services and data processing services........... 18 62,561,920 36,534,035 462,788 -- *44,512 428,927 Finance, insurance, real estate, and rental and leasing.. 958 5,654,638,859 1,017,963,820 2,419,597 *2 4,326,385 1,741,920 Finance and insurance....................................................... 504 5,632,752,737 997,473,702 2,416,848 -- 4,322,419 1,739,877 Commercial banking and other depository credit agencies.................................................................... 35 41,602,739 6,373,348 838 -- *4,167 *7 Commercial banking.................................................. 10 *7,792,248 3,671,568 *563 -- *4,031 -- Depository credit agencies other than banks............. 25 33,810,490 2,701,780 275 -- *137 *7 Nondepository credit intermediation.............................. 20 379,184,857 70,228,562 *75,902 -- *402,236 *92,126 Securities, commodity contracts, and other................... 151 2,155,632,705 183,800,066 1,190,872 -- 1,363,993 1,015,812 Insurance and related activities..................................... 242 3,035,750,829 736,225,502 1,132,995 -- 2,452,382 574,013 Insurance agencies and brokerages.......................... 9 *50,330,244 *14,248,848 *210,332 -- *163,003 *101,015 Funds, trusts, and other financial vehicles..................... 57 20,581,608 846,224 *16,242 -- *99,641 *57,919 Real estate and rental and leasing.................................... 454 21,886,123 20,490,117 2,749 *2 *3,967 *2,043 Real estate.................................................................... 426 5,580,061 1,406,400 1,566 *2 *3,313 *1,299 Rentals and leasing....................................................... 27 16,306,061 19,083,718 *1,183 -- *654 *744 Services................................................................................ 1,934 5,978,034,434 636,123,873 3,610,421 *1 1,957,640 2,032,304 Professional, scientific, and technical services................. 378 91,161,970 69,874,046 261,189 -- 193,159 202,246 Management of holding companies................................... 905 5,685,321,322 434,278,481 2,641,860 -- 1,607,559 1,571,158 Administrative and support and waste management and remediation............................................................. 97 54,315,390 43,694,723 339,437 -- *76,458 88,294 Education services, health care, and social assistance.... 241 40,714,677 22,677,093 *23,050 -- *14,681 *10,268 Arts, entertainment, and recreation................................... 231 3,775,423 2,599,551 *10,546 *1 *1 *3,601 Accommodation and food services.................................... 66 95,761,939 55,101,310 299,139 -- *61,490 134,086 Accommodation............................................................. 14 55,706,790 22,718,083 *114,344 -- *30,302 *14,048 Food services and drinking places................................ 52 40,055,149 32,383,226 *184,795 -- *31,188 *120,037 Other services................................................................... 15 6,983,713 7,898,670 *35,200 -- *4,291 *22,652 Repair and maintenance services................................. 4 *629,819 *294,546 *279 -- -- *84 Personal services, religious, grantmaking, civic, professional, etc........................................ 11 *6,353,894 *7,604,123 *34,921 -- *4,291 *22,568 Footnotes at end of table.
Number of returns
Total assets Total receipts
Dividends received from
foreign corporations
Dividends received from IC-DISC's or
former DISC's ¹
Includable income of controlled
foreign corporations
Foreign dividend
income from foreign taxes deemed paid
(gross-up)

200
Corporate Foreign Tax Credit, 2001
200
Table 1.--U.S. Corporation Income Tax Returns with a Foreign Tax Credit, 2001: Total Assets, Income, Taxes, and Credits, and Foreign Income, Taxes, and Credit, by Major and Selected Minor Industry--Continued[All figures are estimates based on a sample--money amounts are in thousands of dollars]
Major and selected minor industry of U.S. corporation filing return
Total
(8) (9) (10) (11) (12) (13)
All industries..................................................................... 379,079,509 368,071,310 129,339,728 129,374,846 41,358,458 255,319 Agriculture, forestry, fishing, and hunting......................... 795,831 618,196 213,254 213,254 89,089 -- Mining.................................................................................... 4,579,632 4,178,371 1,505,948 1,505,753 733,744 -- Oil and gas extraction......................................................... 999,795 971,449 344,307 344,266 213,636 -- Coal mining and metal ore mining...................................... 660,797 635,946 236,049 236,049 186,777 -- Nonmetallic minerals.......................................................... *357,310 *355,551 *124,613 *124,613 *12,628 -- Support activities for mining............................................... 2,561,731 2,215,426 800,979 800,826 320,703 -- Utilities................................................................................... 6,678,821 6,408,330 2,242,916 2,242,915 348,432 -- Construction......................................................................... 1,206,148 1,096,362 383,347 381,866 17,389 -- Building, developing, and general contracting.................... 703,878 620,585 217,001 216,394 4,995 -- Heavy construction............................................................. 364,046 361,592 126,703 126,096 2,695 -- Special trade contractors.................................................... 138,225 114,185 39,643 39,376 9,699 -- Manufacturing....................................................................... 189,903,561 178,044,366 62,452,071 62,515,785 27,516,993 254,775 Food manufacturing............................................................ 6,377,076 5,994,502 2,109,540 2,109,506 880,595 -- Beverage and tobacco products......................................... 18,770,413 18,597,427 6,509,239 6,509,099 2,459,547 *56,816 Tobacco manufacturing.................................................. *11,524,393 *11,370,569 *3,979,699 *3,979,699 *1,481,636 -- Textile mills and textile product mills ................................ *147,525 *133,034 *46,411 *46,660 *40,331 -- Apparel manufacturing....................................................... 1,342,313 1,333,644 471,417 471,417 124,246 -- Leather and allied product manufacturing.......................... *114,851 *108,146 *37,712 *37,712 *6,780 -- Wood product manufacturing............................................. 905,006 887,360 310,280 310,280 46,970 -- Paper manufacturing.......................................................... 4,004,811 3,854,569 1,349,902 1,349,902 407,608 -- Printing and related support activities................................ 605,094 594,275 207,900 207,899 19,515 *1,525 Petroleum and coal products manufacturing...................... 49,940,819 49,469,709 17,326,338 17,325,190 9,991,472 -- Chemical manufacturing..................................................... 45,713,527 42,950,033 14,945,402 14,943,591 4,924,110 *184,829 Pharmaceutical and medicine manufacturing................. 26,703,196 24,958,556 8,636,726 8,631,797 2,279,434 *176,404 Other chemical manufacturing........................................ 19,010,331 17,991,477 6,308,676 6,311,795 2,644,677 *8,425 Plastics and rubber products manufacturing...................... 1,681,977 1,631,850 586,996 586,854 365,233 *78 Nonmetallic mineral product manufacturing....................... 1,086,350 1,013,060 354,787 354,787 61,412 -- Primary metal manufacturing.............................................. 3,751,864 2,380,026 872,295 858,480 613,919 -- Fabricated metal products.................................................. 4,293,832 4,079,575 1,429,897 1,429,671 504,034 -- Machinery manufacturing................................................... 6,832,367 6,108,055 2,145,114 2,144,876 1,216,682 *10,906 Computer and electronic product manufacturing................ 16,421,256 13,659,390 4,971,378 4,970,526 3,464,528 -- Electrical equipment, appliance, and component manufacturing................................................................. 8,181,191 7,581,998 2,572,345 2,660,093 1,014,780 -- Transportation equipment manufacturing........................... 14,127,193 12,580,213 4,421,259 4,415,404 955,360 -- Motor vehicles and related manufacturing.......................... 5,413,656 5,057,187 1,783,884 1,782,282 484,147 -- Other transportation equipment manufacturing.................. 8,713,537 7,523,026 2,637,375 2,633,122 471,212 -- Furniture and related products........................................... 439,202 427,306 150,669 150,669 44,047 -- Miscellaneous manufacturing and manufacturing not allocable................................................................... 5,166,895 4,660,194 1,633,191 1,633,170 375,824 *622 Wholesale and retail trade................................................... 34,308,311 33,519,117 11,760,429 11,760,401 1,217,807 -- Wholesale trade................................................................. 11,513,059 10,791,659 3,805,553 3,805,525 884,950 -- Durable goods................................................................ 3,774,480 3,538,389 1,235,498 1,235,470 80,696 -- Machinery, equipment, and supplies.......................... 252,497 242,147 83,844 83,703 2,868 -- Other miscellaneous durable goods........................... 3,521,983 3,296,242 1,151,654 1,151,767 77,828 -- Nondurable goods.......................................................... 7,738,579 7,253,270 2,570,055 2,570,055 804,253 -- Drugs, chemicals, and allied products........................ 3,940,128 3,749,991 1,327,070 1,327,070 261,141 -- Groceries and related products.................................. 41,096 36,023 12,477 12,477 3,005 -- Petroleum and petroleum products............................ 1,009,587 940,011 340,338 340,338 300,260 -- Other miscellaneous nondurable goods..................... 2,747,769 2,527,245 890,170 890,170 239,848 -- Footnotes at end of table.
Foreign tax credit claimed
Regular and alternative
minimum tax
Income subject to U.S. tax
U.S. possessions tax
credit
U.S. Income tax before credits
Net income (less deficit)

201
Corporate Foreign Tax Credit, 2001
Table 1.--U.S. Corporation Income Tax Returns with a Foreign Tax Credit, 2001: Total Assets, Income, Taxes, and Credits, and Foreign Income, Taxes, and Credit, by Major and Selected Minor Industry--Continued[All figures are estimates based on a sample--money amounts are in thousands of dollars]
Major and selected minor industry of U.S. corporation filing return
Total
(8) (9) (10) (11) (12) (13)
Wholesale and retail trade--continued Retail trade......................................................................... 22,795,252 22,727,458 7,954,876 7,954,876 332,857 -- Motor vehicle, parts dealers, and gas stations............... 60,958 60,564 21,170 21,170 2,636 -- Furniture and home furnishing stores ............................ *163,535 *163,385 *57,023 *57,023 *488 -- Building materials, garden equipment, and supplies...... *3,720,502 *3,714,930 *1,300,137 *1,300,137 *10,485 -- Food and beverages stores............................................ *1,416,495 *1,411,420 *493,803 *493,803 *9,708 -- Apparel and accessory stores........................................ 2,359,630 2,355,634 825,094 825,094 106,736 -- General merchandise stores.......................................... *11,942,161 *11,919,315 *4,171,642 *4,171,642 *95,323 -- Miscellaneous retail trade.............................................. 3,131,971 3,102,210 1,086,007 1,086,007 107,481 -- Transportation and warehousing........................................ 4,677,760 4,597,408 1,610,850 1,610,850 122,344 -- Air, rail, and water transportation....................................... 539,089 501,438 178,083 178,083 46,654 -- Water transportation....................................................... *489,876 *464,007 *163,263 *163,263 *42,403 -- Air and rail transportation............................................... *49,213 *37,431 *14,821 *14,821 *4,251 -- Other transportation and warehousing............................... 4,138,671 4,095,970 1,432,766 1,432,766 75,690 -- Information............................................................................ 34,392,232 32,409,068 11,354,798 11,346,920 2,964,028 -- Publishing, motion picture, and sound recording................ 19,037,113 17,829,386 6,257,618 6,252,939 1,769,968 -- Broadcasting and telecommunications............................... 12,181,326 11,540,310 4,032,817 4,029,617 750,784 -- Information services and data processing services............ 3,173,793 3,039,371 1,064,364 1,064,364 443,277 -- Finance, insurance, real estate, and rental and leasing... 45,925,373 51,511,435 18,281,286 18,278,779 3,103,849 -- Finance and insurance....................................................... 44,989,641 50,668,169 17,988,013 17,987,539 3,093,475 -- Commercial banking and other depository credit agencies..................................................................... 890,689 787,212 274,248 274,248 39,171 -- Commercial banking................................................... 430,676 340,990 119,136 119,136 15,891 -- Depository credit agencies other than banks............. 460,012 446,222 155,112 155,112 23,280 -- Nondepository credit intermediation............................... 6,172,474 5,903,327 2,065,244 2,065,244 315,798 -- Securities, commodity contracts, and other.................... 16,251,683 15,179,972 5,348,541 5,348,541 1,530,564 -- Insurance and related activities...................................... 20,911,398 28,043,522 10,031,372 10,030,900 1,008,457 -- Insurance agencies and brokerages........................... *1,457,980 *1,464,906 *513,596 *513,596 *131,500 -- Funds, trusts, and other financial vehicles..................... 763,397 754,135 268,608 268,606 199,485 -- Real estate and rental and leasing..................................... 935,732 843,266 293,272 291,240 10,374 -- Real estate..................................................................... 251,469 242,530 82,318 81,041 6,251 -- Rentals and leasing........................................................ 684,263 600,736 210,954 210,199 4,122 -- Services................................................................................. 56,611,839 55,688,657 19,534,832 19,518,322 5,244,781 *543 Professional, scientific, and technical services.................. 5,912,734 5,766,705 2,029,245 2,029,245 515,115 -- Management of holding companies.................................... 42,025,612 41,496,159 14,537,685 14,536,765 3,862,923 -- Administrative and support and waste management and remediation.............................................................. 3,157,159 2,999,328 1,064,471 1,052,260 355,177 -- Education services, health care, and social assistance..... 1,151,535 1,132,987 395,932 395,932 16,343 -- Arts, entertainment, and recreation.................................... 302,751 257,820 89,629 89,629 34,607 -- Accommodation and food services.................................... 3,587,473 3,577,051 1,257,435 1,254,055 435,307 *543 Accommodation.............................................................. 661,816 653,528 234,999 231,766 76,271 *543 Food services and drinking places................................. 2,925,657 2,923,523 1,022,436 1,022,290 359,036 -- Other services.................................................................... 474,574 458,607 160,435 160,435 25,307 -- Repair and maintenance services.................................. *16,309 *3,464 *1,166 *1,166 *122 -- Personal services, religious, grantmaking, civic, professional, etc. *458,266 *455,143 *159,270 *159,270 *25,185 -- Footnotes at end of table.
U.S. possessions tax
creditRegular and alternative
minimum tax
U.S. Income tax before credits
Net income (less deficit)
Income subject to U.S. tax
Foreign tax credit claimed

202
Corporate Foreign Tax Credit, 2001
202
Table 1.--U.S. Corporation Income Tax Returns with a Foreign Tax Credit, 2001: Total Assets, Income, Taxes, and Credits, and Foreign Income, Taxes, and Credit, by Major and Selected Minor Industry--Continued[All figures are estimates based on a sample--money amounts are in thousands of dollars]
Foreign income and taxes
Gross income (less loss)
Major and selected minor industry of U.S. corporation filing return
Total Dividends Interest
(14) (15) (16) (17) (18) (19)
All industries.................................................................... 4,421,869 80,134,069 372,905,130 65,166,156 27,329,970 68,435,076 Agriculture, forestry, fishing, and hunting........................ *1,187 118,510 397,447 277,548 *106,584 *589 Mining.................................................................................... 43,308 668,092 6,600,448 804,919 317,782 282,091 Oil and gas extraction........................................................ *3 125,294 1,058,910 *39,250 *4,332 15,669 Coal mining and metal ore mining..................................... 1,455 46,135 2,743,754 303,672 110,793 112,344 Nonmetallic minerals......................................................... *109 *106,480 *68,908 *32,441 *11,457 *5,407 Support activities for mining............................................... *41,741 390,183 2,728,876 461,998 191,200 *148,672 Utilities.................................................................................. *27,400 1,525,908 2,264,812 1,468,185 *304,683 *469,559 Construction......................................................................... 1,174 324,852 142,932 26,034 12,328 15,721 Building, developing, and general contracting................... *150 175,031 38,732 6,067 *2,725 *2,856 Heavy construction............................................................. *87 123,698 27,225 2,714 *877 *504 Special trade contractors................................................... *936 26,122 76,976 17,253 *8,726 *12,360 Manufacturing...................................................................... 1,709,375 30,965,939 171,558,061 43,841,171 20,500,476 9,455,174 Food manufacturing........................................................... 47,953 1,166,689 4,529,565 1,891,893 841,217 148,347 Beverage and tobacco products........................................ *15,192 3,973,257 12,125,912 *4,354,345 *1,829,877 *811,761 Tobacco manufacturing.................................................. *8,369 *2,485,268 *5,905,410 *2,729,443 *1,219,070 *1,213 Textile mills and textile product mills ............................... *1,274 *3,957 *223,587 *96,815 *39,483 *3,916 Apparel manufacturing....................................................... *2,692 344,377 699,470 74,323 *17,610 *13,215 Leather and allied product manufacturing.......................... *821 *29,831 *104,922 *8,849 *6,275 *789 Wood product manufacturing............................................. *433 262,676 529,416 *884 *169 *39,617 Paper manufacturing.......................................................... *48,706 891,285 2,459,698 604,458 *289,541 75,836 Printing and related support activities................................ *2,036 184,807 77,903 *28,966 *18,309 *3,449 Petroleum and coal products manufacturing...................... 425,717 5,715,465 47,036,057 12,045,821 7,632,591 2,532,214 Chemical manufacturing.................................................... 437,305 9,316,048 31,734,552 9,692,658 3,475,966 583,994 Pharmaceutical and medicine manufacturing................ 348,374 5,826,911 15,479,458 4,528,601 1,535,226 179,345 Other chemical manufacturing....................................... 88,931 3,489,136 16,255,094 5,164,058 1,940,740 404,649 Plastics and rubber products manufacturing...................... *1,160 218,486 1,600,215 615,906 313,949 58,259 Nonmetallic mineral product manufacturing....................... *2,154 283,422 422,151 262,278 53,285 20,985 Primary metal manufacturing............................................. *1,237 251,009 2,755,615 *797,516 *484,899 *329,736 Fabricated metal products................................................. 9,215 899,073 3,515,396 802,544 354,751 112,822 Machinery manufacturing................................................... 42,870 866,112 8,424,484 2,476,919 1,010,342 611,396 Computer and electronic product manufacturing............... 71,824 1,430,990 28,766,104 4,168,633 2,345,111 332,895 Electrical equipment, appliance, and component manufacturing................................................................ 152,185 826,746 13,456,440 2,814,042 792,844 2,604,864 Transportation equipment manufacturing........................... 380,168 3,007,178 9,656,693 2,322,904 627,866 1,084,537 Motor vehicles and related manufacturing......................... 282,860 955,488 6,280,171 1,545,164 283,868 820,319 Other transportation equipment manufacturing.................. 97,308 2,051,690 3,376,522 777,740 343,998 264,218 Furniture and related products........................................... *286 106,336 248,605 *107,035 *65,908 *7,960 Miscellaneous manufacturing and manufacturing not allocable................................................................... 66,147 1,188,196 3,191,275 674,382 300,484 78,581 Wholesale and retail trade................................................... 122,830 10,393,271 12,153,171 2,420,508 965,677 441,092 Wholesale trade................................................................. 45,805 2,848,371 9,780,352 1,916,011 694,030 361,689 Durable goods................................................................ 13,066 1,135,637 1,676,022 111,003 38,784 86,837 Machinery, equipment, and supplies.......................... *131 78,880 63,828 327 -- 2,071 Other miscellaneous durable goods.......................... 12,936 1,056,757 1,612,194 110,676 38,784 84,766 Nondurable goods.......................................................... 32,738 1,712,734 8,104,330 1,805,008 655,246 274,852 Drugs, chemicals, and allied products....................... 26,247 1,033,161 1,888,357 494,310 205,550 17,459 Groceries and related products.................................. -- 9,473 58,412 *7,903 *2,990 *1,285 Petroleum and petroleum products............................ -- 39,446 3,059,463 *751,927 *286,938 *31,488 Other miscellaneous nondurable goods..................... 6,491 630,655 3,098,099 550,868 159,769 224,620 Footnotes at end of table.
Foreign dividend income from foreign taxes deemed paid
(gross-up)
General business credit
U.S. income tax after credits ³

203
Corporate Foreign Tax Credit, 2001
Table 1.--U.S. Corporation Income Tax Returns with a Foreign Tax Credit, 2001: Total Assets, Income, Taxes, and Credits, and Foreign Income, Taxes, and Credit, by Major and Selected Minor Industry--Continued[All figures are estimates based on a sample--money amounts are in thousands of dollars]
Foreign income and taxes
Gross income (less loss)
Major and selected minor industry of U.S. corporation filing return
Total Dividends Interest
(14) (15) (16) (17) (18) (19)
Wholesale and retail trade--continued Retail trade........................................................................ 77,025 7,544,900 2,372,819 504,497 271,646 79,403 Motor vehicle, parts dealers, and gas stations............... *27 18,413 11,452 4,602 *2,665 *531 Furniture and home furnishing stores ............................ *403 *56,132 *4,349 *1 *125 *210 Building materials, garden equipment, and supplies..... *184 *1,289,468 *39,536 *321 -- *5,959 Food and beverages stores........................................... *6,599 *477,496 *84,938 *1,103 *204 *1,489 Apparel and accessory stores........................................ *4,977 713,380 592,183 *195,464 *92,110 *11,173 General merchandise stores.......................................... *53,451 *4,022,868 *674,338 *169,138 *74,567 *35,152 Miscellaneous retail trade.............................................. 11,384 967,142 966,022 133,869 *101,975 *24,889 Transportation and warehousing....................................... *14,112 1,452,965 9,007,604 358,468 62,434 125,856 Air, rail, and water transportation....................................... -- 112,147 2,558,370 *235,122 *19,550 *390 Water transportation...................................................... -- *102,419 *2,508,114 *235,004 *19,527 *228 Air and rail transportation............................................... -- *9,728 *50,256 *118 *23 *162 Other transportation and warehousing............................... *14,112 1,340,817 6,449,235 123,346 42,885 125,466 Information........................................................................... 1,336,708 6,878,316 32,116,783 3,631,998 1,280,046 472,140 Publishing, motion picture, and sound recording............... 1,239,989 3,165,209 17,432,368 1,565,490 507,596 119,088 Broadcasting and telecommunications.............................. *64,284 3,124,456 10,846,589 1,550,557 *343,523 *268,656 Information services and data processing services........... *32,435 588,652 3,837,825 515,951 428,927 *84,396 Finance, insurance, real estate, and rental and leasing... 499,680 14,233,103 63,484,260 6,683,120 1,745,090 23,229,022 Finance and insurance....................................................... 499,461 13,953,839 63,339,453 6,676,354 1,743,047 23,210,596 Commercial banking and other depository credit agencies..................................................................... *13,473 217,553 385,053 5,006 *8 *291,344 Commercial banking.................................................. *12,639 86,554 281,647 *4,594 -- *277,030 Depository credit agencies other than banks............. *834 130,999 103,406 413 *8 *14,314 Nondepository credit intermediation.............................. *199,940 1,549,225 8,370,135 478,137 *92,126 2,140,910 Securities, commodity contracts, and other................... *9,091 3,699,923 28,781,791 2,570,479 1,015,812 14,562,532 Insurance and related activities..................................... 267,928 8,427,196 24,941,803 3,506,848 577,183 5,559,160 Insurance agencies and brokerages.......................... *1,164 *353,582 *1,207,047 *373,339 *101,015 *168,823 Funds, trusts, and other financial vehicles..................... *9,030 59,942 860,671 115,883 *57,919 656,650 Real estate and rental and leasing.................................... *219 279,264 144,807 6,766 *2,043 18,426 Real estate..................................................................... *193 75,408 61,937 5,002 *1,299 9,512 Rentals and leasing....................................................... *26 203,856 82,870 *1,764 *744 *8,913 Services................................................................................ 666,096 13,573,113 75,179,611 5,654,204 2,034,869 33,943,832 Professional, scientific, and technical services.................. 71,251 1,434,244 8,533,716 461,630 202,298 214,114 Management of holding companies................................... 524,370 10,111,293 58,834,128 4,341,906 1,570,268 33,157,384 Administrative and support and waste management and remediation............................................................. 17,012 690,207 2,674,642 401,531 88,295 52,290 Education services, health care, and social assistance..... *6,092 373,469 214,042 37,730 *10,268 *848 Arts, entertainment, and recreation.................................... *698 54,211 629,054 *10,548 *3,601 *4,484 Accommodation and food services.................................... 44,437 776,967 4,081,021 361,364 137,487 508,743 Accommodation............................................................. *15,426 142,584 1,176,037 *145,380 *17,451 *243,426 Food services and drinking places................................. 29,010 634,383 2,904,984 *215,983 *120,036 *265,317 Other services.................................................................... *2,236 132,722 213,008 39,495 *22,652 *5,969 Repair and maintenance services.................................. *22 *851 *3,322 *279 *84 *1 Personal services, religious, grantmaking, civic, professional, etc............................................. *2,213 *131,871 *209,686 *39,217 *22,568 *5,968 Footnotes at end of table.
Foreign dividend income from foreign taxes deemed paid
(gross-up)
General business credit
U.S. income tax after credits ³

204
Corporate Foreign Tax Credit, 2001
204
Table 1.--U.S. Corporation Income Tax Returns with a Foreign Tax Credit, 2001: Total Assets, Income, Taxes, and Credits, and Foreign Income, Taxes, and Credit, by Major and Selected Minor Industry--Continued[All figures are estimates based on a sample--money amounts are in thousands of dollars]
Foreign income and taxes--Continued
Gross income (less loss)--Continued Deductions
Major and selected minor industry of U.S. corporation filing return
Total
(20) (21) (22) (23) (24) (25) (26)
All industries..................................................................... 50,837,026 19,042,809 142,094,092 30,945,555 80,847,969 208,151,787 98,242,474 Agriculture, forestry, fishing, and hunting........................ *5,569 *240 *6,916 -- *-3,596 *61,581 *12 Mining.................................................................................... 288,227 1,449,263 3,458,166 815,891 2,137,725 4,088,613 3,378,672 Oil and gas extraction........................................................ *210 *65,981 933,468 803,213 *292,562 408,810 375,825 Coal mining and metal ore mining..................................... 32,535 335,900 1,880,952 12,678 543,613 2,042,250 1,675,528 Nonmetallic minerals......................................................... *1,100 *1,000 *17,504 -- *36,554 *20,583 *9,060 Support activities for mining............................................... 254,382 1,046,382 *626,242 -- *1,264,997 1,616,969 1,318,259 Utilities.................................................................................. *16,196 *53,339 -47,150 -- *-213 823,289 103,620 Construction......................................................................... *13,004 57,153 18,692 -- *35,605 63,794 57,144 Building, developing, and general contracting................... *6,506 *18,921 *1,656 -- -- *16,831 *15,156 Heavy construction............................................................. *3,283 *18,121 *1,725 -- *8,129 *18,362 *15,184 Special trade contractors................................................... *3,215 *20,111 *15,311 -- *27,477 *28,600 *26,804 Manufacturing...................................................................... 26,348,303 2,908,121 68,504,815 27,952,946 17,894,889 73,265,594 37,855,496 Food manufacturing........................................................... 268,557 *28,887 1,350,663 -- *910,476 1,569,639 973,331 Beverage and tobacco products........................................ 1,732,094 *152,089 3,245,746 -- *1,400,854 3,894,470 *1,370,568 Tobacco manufacturing.................................................. *493,443 *2,001 *1,460,240 -- *163,959 *1,489,267 *884,401 Textile mills and textile product mills ............................... *24,042 -- *59,331 -- *1,364 *78,096 *41,881 Apparel manufacturing....................................................... *461,147 *9,864 *123,312 -- *16,829 289,778 *58,176 Leather and allied product manufacturing.......................... *30,723 *36,618 *21,668 -- *39,627 *49,207 *42,113 Wood product manufacturing............................................. *19,173 -- *469,572 -- -- *132,261 *60,915 Paper manufacturing.......................................................... 724,029 *1,055 764,779 -- *88,382 909,868 307,287 Printing and related support activities................................ *13,649 *2,753 *10,778 -- *1,864 *17,470 *10,660 Petroleum and coal products manufacturing...................... 509,274 *4,384 24,311,773 27,920,233 *3,030,895 17,462,990 15,082,350 Chemical manufacturing.................................................... 6,839,124 668,492 10,474,318 -- 4,059,751 13,031,524 4,943,584 Pharmaceutical and medicine manufacturing................ 3,935,176 *567,244 4,733,866 -- 2,564,409 5,956,032 1,852,133 Other chemical manufacturing....................................... 2,903,947 101,248 5,740,452 -- 1,495,342 7,075,492 3,091,451 Plastics and rubber products manufacturing...................... 449,905 *5,648 156,549 -- 72,314 379,539 76,210 Nonmetallic mineral product manufacturing....................... 56,394 *6,423 *22,786 -- *4,497 145,062 41,504 Primary metal manufacturing............................................. *276,156 *44,926 *822,383 -- *337,213 884,814 *261,060 Fabricated metal products................................................. 327,312 20,518 1,897,448 -- 1,071,102 1,907,531 1,339,191 Machinery manufacturing................................................... 1,208,254 233,604 2,883,968 *32,712 717,591 4,466,776 1,741,188 Computer and electronic product manufacturing............... 8,670,452 1,078,671 12,170,342 -- 4,454,351 13,043,975 4,732,082 Electrical equipment, appliance, and component manufacturing................................................................ 1,907,953 61,131 5,275,606 -- 169,886 8,118,300 3,622,879 Transportation equipment manufacturing........................... 2,023,893 531,691 3,065,801 -- 1,162,573 5,394,441 2,524,516 Motor vehicles and related manufacturing......................... 1,421,246 *5,201 2,204,373 -- *878,977 3,793,084 1,548,674 Other transportation equipment manufacturing.................. 602,647 526,491 861,428 -- *283,596 1,601,357 975,843 Furniture and related products........................................... *6,538 *18 *61,146 -- *12,671 *61,415 *37,009 Miscellaneous manufacturing and manufacturing not allocable................................................................... 799,636 21,347 1,316,845 -- 342,648 1,428,438 588,992 Wholesale and retail trade................................................... 1,468,742 2,299,409 4,557,743 *863,337 1,477,186 7,513,234 5,733,329 Wholesale trade................................................................. 755,538 2,099,815 3,953,268 *863,337 1,116,809 6,546,301 5,199,617 Durable goods................................................................ 233,890 126,146 1,079,362 -- 186,012 1,216,656 987,915 Machinery, equipment, and supplies.......................... *20,371 15,937 *25,122 -- *25,000 47,234 34,485 Other miscellaneous durable goods.......................... 213,519 110,209 1,054,240 -- 161,012 1,169,423 953,430 Nondurable goods.......................................................... 521,648 1,973,669 2,873,906 *863,337 930,797 5,329,645 4,211,702 Drugs, chemicals, and allied products....................... 242,350 *21,264 907,424 -- *419,455 957,676 699,999 Groceries and related products.................................. *5,775 *3,766 *36,692 -- *4,156 *42,884 *40,415 Petroleum and petroleum products............................ -- *1,883,824 *105,286 *863,337 *42,426 *2,186,546 *2,004,265 Other miscellaneous nondurable goods..................... 273,523 *64,815 1,824,504 -- 464,761 2,142,539 1,467,024 Footnotes at end of table.
Definitely allocable
deductions
Total
Service income
Other incomeOil and gas extraction income 4
Foreign branch income 4
Rents, royalties, and license fees

205
Corporate Foreign Tax Credit, 2001
Table 1.--U.S. Corporation Income Tax Returns with a Foreign Tax Credit, 2001: Total Assets, Income, Taxes, and Credits, and Foreign Income, Taxes, and Credit, by Major and Selected Minor Industry--Continued[All figures are estimates based on a sample--money amounts are in thousands of dollars]
Foreign income and taxes--Continued
Gross income (less loss)--Continued Deductions
Major and selected minor industry of U.S. corporation filing return
Total
(20) (21) (22) (23) (24) (25) (26)
Wholesale and retail trade--continued Retail trade......................................................................... 713,204 199,594 604,475 -- 360,378 966,933 533,712 Motor vehicle, parts dealers, and gas stations............... *2,515 *192 *947 -- *947 *2,316 *1,381 Furniture and home furnishing stores ............................ *3,992 -- *22 -- -- *757 *732 Building materials, garden equipment, and supplies..... *32,983 *273 -- -- -- *1,573 *102 Food and beverages stores........................................... *81,775 -- *367 -- -- *2,656 *2,585 Apparel and accessory stores........................................ 63,608 *1,616 228,213 -- *173,974 191,717 160,032 General merchandise stores.......................................... *233,876 *1,694 *159,911 -- *3,083 *267,701 *52,061 Miscellaneous retail trade.............................................. 294,455 *195,818 215,016 -- 182,374 500,214 316,819 Transportation and warehousing....................................... 79,042 4,105,128 4,276,676 -- *2,717,420 8,219,749 7,919,276 Air, rail, and water transportation....................................... *2,927 *80,760 *2,219,621 -- *3,570 *2,197,700 *2,108,383 Water transportation...................................................... -- *37,504 *2,215,850 -- -- *2,177,146 *2,089,841 Air and rail transportation............................................... *2,927 *43,256 *3,771 -- *3,570 *20,554 *18,541 Other transportation and warehousing............................... *76,115 4,024,368 2,057,056 -- *2,713,849 6,022,050 5,810,893 Information........................................................................... 14,612,171 2,423,435 9,696,994 -- 4,549,785 18,836,788 10,130,951 Publishing, motion picture, and sound recording............... 10,650,145 127,245 4,462,805 -- 2,672,473 8,873,891 1,637,490 Broadcasting and telecommunications.............................. 3,061,631 930,462 4,691,759 -- *1,328,670 7,724,176 6,910,462 Information services and data processing services........... 900,394 *1,365,727 *542,430 -- *548,642 2,238,720 1,583,000 Finance, insurance, real estate, and rental and leasing... 1,341,221 2,485,113 28,000,694 -- 15,121,072 43,133,774 13,695,148 Finance and insurance....................................................... 1,288,587 2,476,095 27,944,774 -- 15,079,021 43,061,115 13,656,999 Commercial banking and other depository credit agencies..................................................................... *103 -- *88,592 -- *88,557 *222,450 *71,758 Commercial banking.................................................. -- -- *24 -- -- *207,302 *61,292 Depository credit agencies other than banks............. *103 -- *88,568 -- *88,557 *15,148 *10,466 Nondepository credit intermediation.............................. *92,002 *266,315 *5,300,645 -- *5,102,983 7,290,130 4,455,471 Securities, commodity contracts, and other................... *748,406 *1,148,281 8,736,281 -- *483,057 19,987,350 2,760,041 Insurance and related activities..................................... 447,477 1,043,529 13,807,606 -- 9,404,425 15,297,759 6,259,446 Insurance agencies and brokerages.......................... -- *132,078 *431,791 -- *464,240 *664,719 *454,676 Funds, trusts, and other financial vehicles..................... *598 *17,971 *11,650 -- -- 263,427 110,283 Real estate and rental and leasing.................................... 52,634 *9,018 55,920 -- *42,051 72,659 38,150 Real estate..................................................................... *15,829 *2,670 27,624 -- *7,485 32,865 16,298 Rentals and leasing....................................................... 36,805 *6,348 *28,296 -- *34,566 39,794 21,851 Services................................................................................ 6,664,551 3,261,610 23,620,545 *1,313,380 36,918,096 52,145,370 19,368,825 Professional, scientific, and technical services.................. 2,312,169 2,270,451 3,073,054 -- 4,517,845 6,015,832 4,840,326 Management of holding companies................................... 2,712,844 214,146 16,837,579 *1,313,380 30,415,752 41,495,498 11,388,364 Administrative and support and waste management and remediation............................................................. 180,598 476,513 1,475,414 -- 281,336 1,172,977 766,669 Education services, health care, and social assistance..... *44,003 *107,722 *13,472 -- *25,010 138,869 117,833 Arts, entertainment, and recreation.................................... *103,901 *153,791 *352,730 -- *26,118 *478,679 *405,021 Accommodation and food services.................................... 1,297,148 *33,871 1,742,408 -- 1,556,518 2,707,300 1,728,626 Accommodation............................................................. *226,625 *30,339 *512,817 -- *494,925 *886,268 *709,946 Food services and drinking places................................. 1,070,523 *3,533 1,229,591 -- *1,061,593 1,821,031 1,018,679 Other services.................................................................... *13,888 *5,116 *125,888 -- *95,517 *136,215 *121,987 Repair and maintenance services.................................. *497 *31 *2,430 -- *1,908 *2,815 *1,643 Personal services, religious, grantmaking, civic, professional, etc............................................. *13,392 *5,085 *123,458 -- *93,610 *133,400 *120,345 Footnotes at end of table.
Total
Rents, royalties, and license fees
Service income
Other incomeOil and gas extraction income 4
Foreign branch income 4
Definitely allocable
deductions

206
Corporate Foreign Tax Credit, 2001
206
Table 1.--U.S. Corporation Income Tax Returns with a Foreign Tax Credit, 2001: Total Assets, Income, Taxes, and Credits, and Foreign Income, Taxes, and Credit, by Major and Selected Minor Industry--Continued[All figures are estimates based on a sample--money amounts are in thousands of dollars]
Foreign income and taxes--Continued
Deductions--Continued
Major and selected minor industry of Definitely allocable deductions--ContinuedU.S. corporation filing return
Total
(27) (28) (29) (30) (31) (32)
All industries.................................................................... 1,182,200 4,183,330 12,853,301 80,023,642 109,909,312 9,122,373 Agriculture, forestry, fishing, and hunting........................ -- *4 -- *9 *61,569 *348 Mining................................................................................... 83,130 *84,435 567,238 2,643,870 709,940 *26,944 Oil and gas extraction....................................................... *18,551 *585 *46,734 309,955 *32,985 -- Coal mining and metal ore mining..................................... -- 74,970 182,469 1,418,089 366,722 -- Nonmetallic minerals......................................................... -- -- *200 *8,860 *11,523 -- Support activities for mining.............................................. *64,579 *8,880 *337,835 *906,965 298,710 *26,944 Utilities................................................................................. *1,157 -- *14,407 88,056 719,669 *54,014 Construction........................................................................ *7 *465 *47,539 *9,133 6,649 *298 Building, developing, and general contracting.................. -- -- *15,128 *28 *1,675 -- Heavy construction............................................................ *3 *465 *14,249 *467 *3,178 *144 Special trade contractors.................................................. *4 -- *18,161 *8,638 *1,796 *154 Manufacturing...................................................................... 288,224 522,569 1,488,267 35,556,436 35,410,098 6,492,490 Food manufacturing.......................................................... *5,008 *45,189 -- 923,135 596,308 *11,450 Beverage and tobacco products........................................ *46,100 *30,359 -- *1,294,110 *2,523,902 *40,254 Tobacco manufacturing................................................. -- -- -- *884,401 *604,866 *40,055 Textile mills and textile product mills .............................. -- -- -- *41,881 *36,216 *11,349 Apparel manufacturing...................................................... *1,164 *10,781 *5,498 *40,733 *231,602 -- Leather and allied product manufacturing......................... -- (²) *33,257 *8,856 *7,093 *1,814 Wood product manufacturing............................................ -- *11 *32 *60,872 *71,346 *1,185 Paper manufacturing......................................................... *240 *2,345 *547 *304,155 602,581 *127,128 Printing and related support activities............................... -- -- *2,753 *7,906 *6,811 *2,244 Petroleum and coal products manufacturing..................... -- *75,427 *3,699 15,003,223 2,380,641 *129,000 Chemical manufacturing.................................................... -- 194,867 184,327 4,564,390 8,087,940 2,384,318 Pharmaceutical and medicine manufacturing............... -- *193,476 *160,823 1,497,834 4,103,899 1,393,065 Other chemical manufacturing...................................... -- 1,391 *23,504 3,066,555 3,984,041 991,253 Plastics and rubber products manufacturing..................... *6,748 *8,066 -- 61,397 303,329 41,988 Nonmetallic mineral product manufacturing...................... *35 *5,229 *5,242 *30,999 103,557 *8,109 Primary metal manufacturing............................................ *151,222 *3,243 *6,899 *99,697 623,754 *11,423 Fabricated metal products................................................. *13,675 *2,383 *21,356 1,301,778 568,340 50,239 Machinery manufacturing.................................................. *1,921 *7,877 103,346 1,628,044 2,725,588 530,939 Computer and electronic product manufacturing............... -- *34,230 959,214 3,738,637 8,311,893 2,422,536 Electrical equipment, appliance, and component manufacturing................................................................ *833 *12,500 *263 3,609,283 4,495,421 161,007 Transportation equipment manufacturing.......................... *59,216 *42,530 *140,482 2,282,289 2,869,925 444,829 Motor vehicles and related manufacturing........................ -- -- *3,117 1,545,557 2,244,410 *252,664 Other transportation equipment manufacturing................. *59,216 *42,530 *137,365 736,732 625,515 *192,164 Furniture and related products.......................................... -- *3 *71 *36,936 *24,405 *2,900 Miscellaneous manufacturing and manufacturing not allocable.................................................................. *2,065 47,530 *21,281 518,116 839,446 109,777 Wholesale and retail trade.................................................. 19,705 207,239 2,016,902 3,489,483 1,779,905 29,864 Wholesale trade................................................................ 18,188 165,693 2,004,959 3,010,776 1,346,684 29,371 Durable goods............................................................... *4,566 32,742 98,059 852,548 228,741 *2,785 Machinery, equipment, and supplies......................... *3,079 *15,472 *2,787 *13,146 *12,749 -- Other miscellaneous durable goods.......................... *1,487 *17,270 *95,272 839,402 215,992 *2,785 Nondurable goods......................................................... *13,622 132,951 1,906,900 2,158,228 1,117,943 26,586 Drugs, chemicals, and allied products...................... -- *1,442 *14,108 684,450 257,677 *18,134 Groceries and related products................................. *2,607 *1,520 *3,444 *32,844 *2,470 -- Petroleum and petroleum products........................... *8,693 *959 *1,881,218 *113,394 *182,281 -- Other miscellaneous nondurable goods.................... *2,322 129,031 *8,130 1,327,541 675,515 *8,452 Footnotes at end of table.
Deductions not allocable to specific types of income
Research and development
Depreciation, depletion, and amortization
Service expensesOther definitely
allocable deductions
Other expenses

207
Corporate Foreign Tax Credit, 2001
Table 1.--U.S. Corporation Income Tax Returns with a Foreign Tax Credit, 2001: Total Assets, Income, Taxes, and Credits, and Foreign Income, Taxes, and Credit, by Major and Selected Minor Industry--Continued[All figures are estimates based on a sample--money amounts are in thousands of dollars]
Foreign income and taxes--Continued
Deductions--Continued
Major and selected minor industry of Definitely allocable deductions--ContinuedU.S. corporation filing return
Total
(27) (28) (29) (30) (31) (32)
Wholesale and retail trade--continued Retail trade........................................................................ *1,516 41,546 *11,943 478,707 433,221 *493 Motor vehicle, parts dealers, and gas stations.............. -- *1,381 -- -- *935 -- Furniture and home furnishing stores ........................... -- *21 -- *711 *25 -- Building materials, garden equipment, and supplies..... -- *-4 *106 -- *1,471 -- Food and beverages stores.......................................... -- *2,080 -- *504 *71 -- Apparel and accessory stores....................................... *1,082 *34,293 *1,153 123,505 31,685 -- General merchandise stores......................................... *399 *249 *1,694 *49,719 *215,640 -- Miscellaneous retail trade............................................. *35 *3,526 *8,990 304,268 183,394 *493 Transportation and warehousing...................................... *1,422 *16,451 3,885,215 4,016,188 300,474 *22,662 Air, rail, and water transportation...................................... *306 -- *15,674 *2,092,403 *89,317 -- Water transportation..................................................... -- -- *6,718 *2,083,123 *87,304 -- Air and rail transportation.............................................. *306 -- *8,956 *9,279 *2,013 -- Other transportation and warehousing.............................. *1,116 *16,451 3,869,541 1,923,785 211,156 *22,662 Information........................................................................... *170,066 2,249,483 1,896,038 5,815,364 8,705,836 2,216,287 Publishing, motion picture, and sound recording.............. *427 176,535 91,632 1,368,895 7,236,401 2,041,746 Broadcasting and telecommunications............................. *164,357 *1,976,641 *648,726 4,120,738 *813,715 *35,566 Information services and data processing services.......... *5,282 *96,306 *1,155,680 *325,731 655,720 *138,975 Finance, insurance, real estate, and rental and leasing.. 372,819 357,734 538,456 12,426,140 29,438,626 *11,964 Finance and insurance...................................................... 363,629 349,834 534,184 12,409,351 29,404,116 *11,964 Commercial banking and other depository credit agencies.................................................................... *267 *2,332 -- *69,159 *150,691 -- Commercial banking................................................. -- *1,768 -- *59,524 *146,009 -- Depository credit agencies other than banks............ *267 *565 -- *9,635 *4,682 -- Nondepository credit intermediation............................. *12,615 *46,504 *28,827 4,367,524 2,834,659 -- Securities, commodity contracts, and other.................. *310,920 *213,326 *264,660 1,971,134 17,227,309 -- Insurance and related activities..................................... *39,827 87,639 240,686 5,891,295 9,038,313 *11,964 Insurance agencies and brokerages......................... -- *372 *96,171 *358,133 *210,043 *6,925 Funds, trusts, and other financial vehicles.................... -- *32 *11 *110,239 *153,144 -- Real estate and rental and leasing.................................... 9,189 *7,900 *4,272 16,788 34,509 -- Real estate.................................................................... *1,212 *3,551 *1,412 *10,124 *16,567 -- Rentals and leasing....................................................... *7,977 *4,350 *2,860 *6,665 *17,942 -- Services................................................................................ 245,671 744,951 2,399,239 15,978,963 32,776,546 267,500 Professional, scientific, and technical services................. 5,281 550,844 1,671,813 2,612,388 1,175,507 216,564 Management of holding companies.................................. *237,758 107,946 *333,077 10,709,583 30,107,134 *68 Administrative and support and waste management and remediation............................................................ *94 *19,937 281,466 465,171 406,308 *44,855 Education services, health care, and social assistance.... -- *3,846 *28,716 *85,270 *21,036 *187 Arts, entertainment, and recreation................................... -- *28,606 *75,644 *300,771 *73,658 *4,897 Accommodation and food services................................... *520 *12,811 *3,956 1,711,339 978,674 *6 Accommodation............................................................ -- -- *1 *709,946 *176,322 -- Food services and drinking places................................ *520 *12,811 *3,955 *1,001,393 *802,352 *6 Other services................................................................... *2,018 *20,961 *4,567 *94,441 *14,227 *923 Repair and maintenance services................................. -- -- -- *1,643 *1,172 -- Personal services, religious, grantmaking, civic, professional, etc............................................ *2,018 *20,961 *4,567 *92,799 *13,056 *923 Footnotes at end of table.
Research and development
Depreciation, depletion, and amortization
Other expenses Service expensesOther definitely
allocable deductions
Deductions not allocable to specific types of income

208
Corporate Foreign Tax Credit, 2001
208
Table 1.--U.S. Corporation Income Tax Returns with a Foreign Tax Credit, 2001: Total Assets, IncomeTaxes, and Credits, and Foreign Income, Taxes, and Credit, by Major and Selected Minor Industry--Continued[All figures are estimates based on a sample--money amounts are in thousands of dollars]
Foreign income and taxes--Continued
Deductions--Continued
Major and selected minor industry of U.S. corporation filing return
Interest Other
(33) (34) (35) (36) (37) (38)
All industries..................................................................... 52,679,130 47,638,165 9,994,224 164,753,343 15,388,618 149,364,725 Agriculture, forestry, fishing, and hunting........................ *47,600 *13,488 -- 335,865 -- 335,865 Mining.................................................................................... 317,804 356,105 252,910 2,511,835 160,012 2,351,823 Oil and gas extraction........................................................ *17,475 *11,572 237,106 650,100 *19,512 630,587 Coal mining and metal ore mining..................................... 170,078 191,495 15,804 701,504 126,733 574,771 Nonmetallic minerals......................................................... *11,423 *100 -- *48,325 -- *48,325 Support activities for mining............................................... 118,828 152,938 -- 1,111,907 *13,767 1,098,140 Utilities.................................................................................. 644,750 *20,904 -- 1,441,523 *128,684 1,312,839 Construction......................................................................... *2,540 *2,671 -- 79,139 *1,287 77,852 Building, developing, and general contracting................... *784 -- -- 21,901 -- 21,901 Heavy construction............................................................. *1,329 *1,456 -- 8,862 *228 8,634 Special trade contractors................................................... *427 *1,216 -- 48,376 *1,059 47,316 Manufacturing...................................................................... 14,395,411 14,379,356 9,615,597 98,292,466 6,869,888 91,422,579 Food manufacturing........................................................... 382,795 185,101 -- 2,959,926 385,277 2,574,649 Beverage and tobacco products........................................ *1,158,333 *1,316,284 -- 8,231,442 *178,172 8,053,270 Tobacco manufacturing.................................................. *533,068 *31,744 -- *4,416,143 (²) *4,416,143 Textile mills and textile product mills ............................... *20,121 *4,690 -- *145,491 *24,635 *120,855 Apparel manufacturing....................................................... *130,799 *97,600 -- 409,692 *1,229 408,463 Leather and allied product manufacturing.......................... *2,221 *3,058 -- *55,715 *13,469 *42,246 Wood product manufacturing............................................. *60,768 *9,394 -- 397,154 *17,943 379,212 Paper manufacturing.......................................................... *142,057 *332,042 -- 1,549,830 *17,268 1,532,562 Printing and related support activities................................ *2,638 *1,929 -- 60,433 *3,133 57,300 Petroleum and coal products manufacturing...................... 1,378,725 865,850 9,611,976 29,573,067 *6,855 29,566,211 Chemical manufacturing.................................................... 2,695,679 2,981,827 -- 18,703,028 1,144,974 17,558,053 Pharmaceutical and medicine manufacturing................ 1,101,362 1,602,572 -- 9,523,426 *389,560 9,133,866 Other chemical manufacturing....................................... 1,594,317 1,379,255 -- 9,179,602 755,414 8,424,188 Plastics and rubber products manufacturing...................... 172,377 83,381 -- 1,220,676 *137,579 1,083,097 Nonmetallic mineral product manufacturing....................... *79,267 *12,586 -- 277,090 *34,151 242,938 Primary metal manufacturing............................................. *438,954 *173,189 -- 1,870,802 *83,200 1,787,602 Fabricated metal products................................................. 311,995 198,906 -- 1,607,865 72,364 1,535,501 Machinery manufacturing................................................... 1,011,126 1,166,606 *3,622 3,957,708 188,591 3,769,117 Computer and electronic product manufacturing............... 673,981 5,201,032 -- 15,722,129 4,315,607 11,406,522 Electrical equipment, appliance, and component manufacturing................................................................ 3,382,512 939,068 -- 5,338,140 85,332 5,252,808 Transportation equipment manufacturing........................... 2,062,600 349,993 -- 4,262,251 *52,767 4,209,485 Motor vehicles and related manufacturing......................... 1,716,925 *265,589 -- 2,487,087 *34,550 2,452,537 Other transportation equipment manufacturing.................. 345,675 *84,404 -- 1,775,164 *18,217 1,756,948 Furniture and related products........................................... *19,931 *1,575 -- 187,190 *59,503 127,687 Miscellaneous manufacturing and manufacturing not allocable................................................................... 268,531 455,246 -- 1,762,837 47,838 1,714,999 Wholesale and retail trade................................................... 725,807 904,715 *125,717 4,639,937 306,594 4,333,343 Wholesale trade................................................................. 527,865 692,651 *125,717 3,234,051 206,042 3,028,009 Durable goods................................................................ 45,030 150,015 -- 459,366 21,376 437,989 Machinery, equipment, and supplies.......................... *141 *43 -- 16,594 *1,024 15,570 Other miscellaneous durable goods.......................... 44,888 149,973 -- 442,772 20,352 422,419 Nondurable goods.......................................................... 482,835 542,635 *125,717 2,774,685 184,665 2,590,020 Drugs, chemicals, and allied products....................... *35,759 *148,541 -- 930,681 *111,261 819,419 Groceries and related products.................................. *190 *2 -- 15,527 *5,316 10,211 Petroleum and petroleum products............................ *134,449 *47,832 *125,717 872,917 *4,701 868,216 Other miscellaneous nondurable goods..................... 312,438 346,260 -- 955,560 63,387 892,173 Footnotes at end of table.
Taxable income (less loss)
before adjustments
Adjustments to taxable income
Deductions from oil and gas extraction income 5
Taxable income (less loss) after
adjustments
Deductions not allocable to specific types of income--
Continued

209
Corporate Foreign Tax Credit, 2001
Table 1.--U.S. Corporation Income Tax Returns with a Foreign Tax Credit, 2001: Total Assets, IncomeTaxes, and Credits, and Foreign Income, Taxes, and Credit, by Major and Selected Minor Industry--Continued[All figures are estimates based on a sample--money amounts are in thousands of dollars]
Foreign income and taxes--Continued
Deductions--Continued
Major and selected minor industry of U.S. corporation filing return
Interest Other
(33) (34) (35) (36) (37) (38)
Wholesale and retail trade--continued Retail trade......................................................................... 197,942 212,065 -- 1,405,886 100,552 1,305,334 Motor vehicle, parts dealers, and gas stations............... *935 -- -- 9,137 *800 8,337 Furniture and home furnishing stores ............................ *15 *2 -- *3,592 -- *3,592 Building materials, garden equipment, and supplies..... *1,442 *29 -- *37,963 -- *37,963 Food and beverages stores........................................... -- -- -- *82,282 *49,791 *32,491 Apparel and accessory stores........................................ *11,116 *2,321 -- 400,467 *24,030 376,436 General merchandise stores.......................................... *136,920 *78,720 -- *406,637 -- *406,637 Miscellaneous retail trade.............................................. *47,514 *130,992 -- 465,809 *25,930 439,878 Transportation and warehousing....................................... 190,160 *84,703 -- 787,855 37,152 750,703 Air, rail, and water transportation....................................... *39,177 *49,921 -- 360,670 *24,737 335,933 Water transportation...................................................... *37,383 *49,921 -- *330,968 *10,067 *320,901 Air and rail transportation............................................... *1,795 -- -- *29,702 *14,670 *15,032 Other transportation and warehousing............................... 150,983 *34,782 -- 427,185 *12,415 414,770 Information........................................................................... 819,888 5,619,694 -- 13,279,995 263,658 13,016,337 Publishing, motion picture, and sound recording............... 143,043 5,003,617 -- 8,558,477 156,844 8,401,633 Broadcasting and telecommunications.............................. *546,073 *230,103 -- 3,122,413 *20,474 3,101,939 Information services and data processing services........... 130,771 *385,974 -- 1,599,105 *86,340 1,512,765 Finance, insurance, real estate, and rental and leasing... 15,324,583 14,065,478 -- 20,350,486 6,069,796 14,280,690 Finance and insurance....................................................... 15,307,556 14,051,806 -- 20,278,338 6,057,307 14,221,030 Commercial banking and other depository credit agencies..................................................................... *137,218 *13,473 -- 162,603 -- 162,603 Commercial banking.................................................. *132,537 *13,473 -- 74,345 -- 74,345 Depository credit agencies other than banks............. *4,682 -- -- 88,258 -- 88,258 Nondepository credit intermediation.............................. *1,123,769 *1,709,316 -- 1,080,005 *120 1,079,885 Securities, commodity contracts, and other................... 12,132,573 5,085,328 -- 8,794,440 *3,341,505 5,452,936 Insurance and related activities..................................... 1,798,794 7,206,526 -- 9,644,044 2,707,682 6,936,362 Insurance agencies and brokerages.......................... *192,836 *10,283 -- *542,329 *87,734 *454,595 Funds, trusts, and other financial vehicles..................... *115,201 *37,163 -- 597,245 *8,000 589,245 Real estate and rental and leasing.................................... *17,027 *13,672 -- 72,149 *12,489 59,660 Real estate..................................................................... *3,793 *12,755 -- 29,072 *3,191 25,881 Rentals and leasing....................................................... *13,234 *916 -- 43,076 *9,297 33,779 Services................................................................................ 20,210,586 12,191,049 -- 23,034,241 1,551,547 21,482,694 Professional, scientific, and technical services.................. 259,910 668,146 -- 2,517,884 324,056 2,193,828 Management of holding companies................................... 19,235,127 10,836,764 -- 17,338,629 1,012,905 16,325,724 Administrative and support and waste management and remediation............................................................. 164,212 193,455 -- 1,501,665 *147,833 1,353,832 Education services, health care, and social assistance..... *14,993 *4,240 -- 75,173 *12,630 62,544 Arts, entertainment, and recreation.................................... *17,858 *22,243 -- 150,375 *2,252 148,123 Accommodation and food services.................................... *509,343 *463,590 -- 1,373,721 *51,691 1,322,030 Accommodation............................................................. *141,132 *32,617 -- 289,769 *38,525 251,244 Food services and drinking places................................. *368,211 *430,973 -- 1,083,952 *13,166 1,070,786 Other services.................................................................... *9,144 *2,612 -- 76,794 *181 76,613 Repair and maintenance services.................................. *4 *907 -- *508 -- *508 Personal services, religious, grantmaking, civic, professional, etc............................................. *9,140 *1,705 -- *76,285 *181 *76,105 Footnotes at end of table.
Adjustments to taxable income
Taxable income (less loss) after
adjustments
Taxable income (less loss)
before adjustments
Deductions not allocable to specific types of income--
Continued Deductions from oil and gas extraction income 5

210
Corporate Foreign Tax Credit, 2001
210
Table 1.--U.S. Corporation Income Tax Returns with a Foreign Tax Credit, 2001: Total Assets, Income, Taxes, and Credits, and Foreign Income, Taxes, and Credit, by Major and Selected Minor Industry--Continued[All figures are estimates based on a sample--money amounts are in thousands of dollars]
Foreign income and taxes--Continued
Foreign taxes available for credit
Major and selected minor industry of Paid or accruedU.S. corporation filing return
Taxes withheldTotal Carryover
Total
(39) (40) (41) (42) (43) (44)
All industries.................................................................... 54,510,213 2,895,223 12,900,280 44,505,156 17,161,245 1,426,868 Agriculture, forestry, fishing, and hunting....................... 107,576 -- *144 107,431 847 127 Mining................................................................................... 1,504,438 178,942 771,569 911,811 593,716 12,705 Oil and gas extraction....................................................... 295,356 *131,746 198,459 228,643 224,311 *32 Coal mining and metal ore mining.................................... 745,184 42,010 456,744 330450 219,657 10,308 Nonmetallic minerals........................................................ *73,013 *5,184 *61,998 *16,199 *4,742 *384 Support activities for mining.............................................. 390,884 *2 *54,368 336,519 145,006 *1,981 Utilities................................................................................. 557,069 -- *233,930 323,139 18,433 *5,798 Construction........................................................................ 22,733 -- 3,373 19,361 7,032 831 Building, developing, and general contracting.................. 6,592 -- *1,384 5,208 2,483 264 Heavy construction............................................................ 3,502 -- *167 3,334 2,458 62 Special trade contractors.................................................. 12,640 -- *1,822 10,818 2,092 *505 Manufacturing..................................................................... 35,851,490 2,569,819 8,383,054 30,038,255 9,523,835 1,101,403 Food manufacturing.......................................................... 1,174,062 -- 192,826 981,236 140,019 42,492 Beverage and tobacco products....................................... 2,504,570 *408 *16,663 2,488,315 658,438 *352,087 Tobacco manufacturing................................................. *1,505,471 -- *544 *1,504,927 *285,857 *266,211 Textile mills and textile product mills .............................. *44,066 -- *1,327 *42,739 *3,256 *2,719 Apparel manufacturing...................................................... 191,249 -- *153,698 37,552 19,942 *1,904 Leather and allied product manufacturing......................... *12,824 -- *2,302 *10,521 *4,247 *84 Wood product manufacturing............................................ 53,516 -- *1,426 52,090 51,921 *36 Paper manufacturing......................................................... 534,531 -- *124,187 410,344 120,804 *6,256 Printing and related support activities............................... 21,221 -- *1,229 19,991 1,682 *811 Petroleum and coal products manufacturing..................... 15,257,333 *2,567,369 5,127,852 12,696,851 5,064,260 94,705 Chemical manufacturing................................................... 6,039,089 -- 1,225,144 4,813,945 1,336,493 262,752 Pharmaceutical and medicine manufacturing............... 2,503,153 -- 173,266 2,329,887 794,662 157,834 Other chemical manufacturing...................................... 3,535,936 -- 1,051,878 2,484,058 541,832 104,918 Plastics and rubber products manufacturing..................... 402,074 *15 43,410 358,679 44,730 16,753 Nonmetallic mineral product manufacturing...................... 124,967 -- *61,981 62,985 9,700 4,349 Primary metal manufacturing............................................ 681,104 *1,918 *88,142 594,879 109,980 *14,518 Fabricated metal products................................................ 755,459 -- 221,998 533,461 178,710 19,105 Machinery manufacturing.................................................. 1,591,683 *95 290,410 1,301,369 290,924 47,578 Computer and electronic product manufacturing.............. 3,700,694 -- 547,230 3,153,463 808,352 119,139 Electrical equipment, appliance, and component manufacturing............................................................... 1,093,208 *14 56,890 1,036,332 231,134 15,906 Transportation equipment manufacturing.......................... 1,098,079 -- 145,922 952,157 324,291 69,093 Motor vehicles and related manufacturing........................ 556,342 -- *70,022 486,320 202,452 32,586 Other transportation equipment manufacturing................. 541,737 -- *75,901 465,837 121,838 36,507 Furniture and related products.......................................... 75,888 -- *6,411 69,477 3,569 *2,480 Miscellaneous manufacturing and manufacturing not allocable.................................................................. 495,874 -- 74,007 421,868 121,384 28,636 Wholesale and retail trade.................................................. 1,685,383 *129,538 532,133 1,282,789 317,507 39,144 Wholesale trade................................................................ 1,294,403 *129,538 515,964 907,977 214,341 26,061 Durable goods............................................................... 111,542 *300 23,050 88,793 50,009 2,278 Machinery, equipment, and supplies......................... 5,294 -- *1,799 3,495 3,495 25 Other miscellaneous durable goods......................... 106,248 *300 21,251 85,298 46,514 2,253 Nondurable goods......................................................... 1,182,861 *129,238 492,914 819,184 164,333 23,783 Drugs, chemicals, and allied products...................... 428,310 -- 161,449 266,861 61,311 *12,990 Groceries and related products................................. 5,049 -- *58 4,991 *2,001 -- Petroleum and petroleum products........................... 448,175 *129,121 *277,661 299,636 12,698 *1,176 Other miscellaneous nondurable goods.................... 301,326 *117 53,747 247,696 88,322 9,617 Footnotes at end of table.
Dividends
Reduction for certain foreign
taxes
Total paid, accrued, and deemed paid

211
Corporate Foreign Tax Credit, 2001
Table 1.--U.S. Corporation Income Tax Returns with a Foreign Tax Credit, 2001: Total Assets, Income, Taxes, and Credits, and Foreign Income, Taxes, and Credit, by Major and Selected Minor Industry--Continued[All figures are estimates based on a sample--money amounts are in thousands of dollars]
Foreign income and taxes--Continued
Foreign taxes available for credit
Major and selected minor industry of Paid or accruedU.S. corporation filing return
Taxes withheldTotal Carryover
Total
(39) (40) (41) (42) (43) (44)
Wholesale and retail trade--continued Retail trade........................................................................ 390,980 -- 16,169 374,812 103,165 13,083 Motor vehicle, parts dealers, and gas stations.............. 5,389 -- *1,799 3,591 926 305 Furniture and home furnishing stores ........................... *488 -- -- *488 *363 -- Building materials, garden equipment, and supplies.... *10,485 -- *440 *10,045 *10,045 *4,556 Food and beverages stores.......................................... *9,708 -- *52 *9,657 *9,453 *12 Apparel and accessory stores....................................... 122,749 -- *1,105 121,644 29,534 *1,463 General merchandise stores......................................... *99,877 -- *1,167 *98,710 *24,143 *1,163 Miscellaneous retail trade............................................. 142,285 -- *11,607 130,678 28,703 *5,584 Transportation and warehousing...................................... 151,850 -- 28,807 123,043 60,609 4,694 Air, rail, and water transportation...................................... 52,525 -- *13,761 38,763 19,214 *329 Water transportation..................................................... *46,018 -- *11,855 *34,163 *14,636 *329 Air and rail transportation.............................................. *6,507 -- *1,906 *4,601 *4,578 -- Other transportation and warehousing.............................. 99,325 -- 15,045 84,280 41,395 4,366 Information.......................................................................... 3,550,463 *540 879,959 2,671,044 1,391,000 53,408 Publishing, motion picture, and sound recording.............. 2,015,448 *540 455,376 1,560,612 1,053,017 30,281 Broadcasting and telecommunications............................. 973,027 -- *354,421 618,606 275,084 *13,285 Information services and data processing services.......... 561,988 -- *70,162 491,826 62,899 *9,842 Finance, insurance, real estate, and rental and leasing.. 4,969,775 *323 980,790 3,989,308 2,244,226 78,339 Finance and insurance...................................................... 4,945,846 *323 968,157 3,978,012 2,234,973 77,974 Commercial banking and other depository credit agencies.................................................................... 39,342 -- *1,193 38,149 38,141 179 Commercial banking................................................. 16,062 -- *1,193 14,868 14,868 *136 Depository credit agencies other than banks............ 23,281 -- ( ² ) 23,281 23,273 43 Nondepository credit intermediation............................. 366,071 -- *76,868 289,203 197,085 *12,010 Securities, commodity contracts, and other.................. 2,638,960 -- 835,920 1,803,039 787,227 7,049 Insurance and related activities.................................... 1,699,231 *323 47,843 1,651,711 1,074,529 53,077 Insurance agencies and brokerages......................... *159,127 -- *16,351 *142,776 *41,761 *6,994 Funds, trusts, and other financial vehicles.................... 202,242 -- *6,333 195,910 137,991 5,658 Real estate and rental and leasing................................... 23,929 -- 12,633 11,296 9,253 365 Real estate.................................................................... 19,513 -- 12,489 7,023 5,724 322 Rentals and leasing...................................................... 4,416 -- *144 4,273 3,529 *43 Services............................................................................... 6,109,436 *16,060 1,086,522 5,038,974 3,004,039 130,418 Professional, scientific, and technical services................. 682,111 -- 252,454 429,656 227,358 12,158 Management of holding companies.................................. 4,351,337 *16,060 395,759 3,971,638 2,401,303 92,915 Administrative and support and waste management and remediation............................................................ 388,528 -- 204,519 184,010 95,715 6,339 Education services, health care, and social assistance.... 26,228 -- *9,733 16,496 6,228 *289 Arts, entertainment, and recreation................................... 35,983 -- *1,141 34,842 31,241 *375 Accommodation and food services................................... 589,560 -- 215,176 374,384 236,897 16,769 Accommodation............................................................ 135,849 -- *92,451 43,398 25,947 *654 Food services and drinking places................................ 453,712 -- 122,726 330,986 210,949 *16,115 Other services................................................................... 35,689 -- *7,740 27,949 5,297 *1,573 Repair and maintenance services................................. *179 -- *17 *162 *78 ( ² ) Personal services, religious, grantmaking, civic, professional, etc............................................ *35,510 -- *7,723 *27,787 *5,219 *1,572 Footnotes at end of table.
Dividends
Total paid, accrued, and deemed paid
Reduction for certain foreign
taxes

212
Corporate Foreign Tax Credit, 2001
212
Table 1.--U.S. Corporation Income Tax Returns with a Foreign Tax Credit, 2001: Total Assets, Income, Taxes, and Credits, and Foreign Income, Taxes, and Credit, by Major and Selected Minor Industry--Continued[All figures are estimates based on a sample--money amounts are in thousands of dollars]
Foreign income and taxes--Continued
Foreign taxes available for credit--Continued
Major and selected minor industry of Paid or accrued--ContinuedU.S. corporation filing return
Taxes withheld--Continued Other taxes paid or accrued on--
(45) (46) (47) (48) (49) (50) (51)
All industries..................................................................... 710,381 2,327,460 5,474,925 50,127 288,060 6,883,424 27,343,911 Agriculture, forestry, fishing, and hunting........................ *15 *519 -- -- -- *185 *106,584 Mining.................................................................................... 8,782 6,768 183,266 *10,271 *10,240 361,685 318,094 Oil and gas extraction........................................................ *703 *290 *20,019 -- *914 202,353 *4,332 Coal mining and metal ore mining..................................... 6,810 1,328 57,466 10,266 1,833 131,646 110,793 Nonmetallic minerals......................................................... *528 -- *64 -- -- *3,766 *11,457 Support activities for mining............................................... *742 *5,149 *105,717 *5 *7,493 *23,919 191,512 Utilities.................................................................................. *3,579 *935 *460 -- *2,045 *5,616 *304,706 Construction......................................................................... *314 *1,700 *741 -- 2,963 483 12,328 Building, developing, and general contracting................... *252 *330 -- -- *1,463 *173 *2,725 Heavy construction............................................................. *25 *1,275 *94 -- *709 *292 *877 Special trade contractors................................................... *37 *94 *647 -- *791 *18 *8,726 Manufacturing...................................................................... 157,563 1,364,609 2,009,795 28,396 50,692 4,811,376 20,514,420 Food manufacturing........................................................... 4,829 28,658 *53,977 -- *1,700 8,363 841,217 Beverage and tobacco products........................................ *2,466 83,421 *197,955 -- *1,611 *20,898 *1,829,877 Tobacco manufacturing.................................................. -- *15,004 *1,781 -- *1,275 *1,586 *1,219,070 Textile mills and textile product mills ............................... *41 *270 *226 -- -- -- *39,483 Apparel manufacturing....................................................... *451 *13,787 *2,756 -- *216 *827 *17,610 Leather and allied product manufacturing.......................... *85 *2,766 *344 -- *513 *454 *6,275 Wood product manufacturing............................................. *879 *244 -- -- -- *50,762 *169 Paper manufacturing.......................................................... *296 *46,054 *51,251 -- *28 *16,920 *289,541 Printing and related support activities................................ *297 *574 *1 -- -- -- *18,309 Petroleum and coal products manufacturing...................... 38,525 *39,397 *797,378 -- *931 *4,093,325 7,632,591 Chemical manufacturing.................................................... 30,543 414,750 431,077 *416 18,285 178,670 3,477,452 Pharmaceutical and medicine manufacturing................ 6,820 248,154 274,650 *383 *6,440 100,380 1,535,225 Other chemical manufacturing....................................... 23,723 166,595 156,426 *33 *11,846 78,290 1,942,227 Plastics and rubber products manufacturing...................... 1,091 19,260 *3,052 -- -- *4,575 313,949 Nonmetallic mineral product manufacturing....................... *754 3,778 *647 -- *133 *39 53,285 Primary metal manufacturing............................................. *2,913 *19,599 *52,764 -- *4,953 *15,234 *484,899 Fabricated metal products................................................. 1,883 10,172 69,672 *807 *91 76,979 354,751 Machinery manufacturing................................................... 17,624 49,732 98,150 *2,484 4,742 70,614 1,010,445 Computer and electronic product manufacturing............... 3,722 473,629 167,466 *215 10,345 33,836 2,345,111 Electrical equipment, appliance, and component manufacturing................................................................ 22,720 17,517 8,948 *3,796 *1,094 161,153 805,198 Transportation equipment manufacturing........................... 22,474 98,114 43,334 *20,665 *4,250 66,361 627,866 Motor vehicles and related manufacturing......................... 16,914 70,623 *35,423 -- *361 *46,545 283,868 Other transportation equipment manufacturing.................. *5,560 27,491 7,911 *20,665 *3,889 *19,816 343,998 Furniture and related products........................................... *648 *259 *179 -- *3 -- *65,908 Miscellaneous manufacturing and manufacturing not allocable................................................................... 5,323 42,628 30,619 *14 *1,795 12,368 300,484 Wholesale and retail trade................................................... 15,404 111,326 104,028 *5,936 4,178 37,490 965,282 Wholesale trade................................................................. 12,314 63,519 75,785 *5,487 3,729 27,446 693,636 Durable goods................................................................ 5,515 21,615 17,229 *33 1,382 1,958 38,784 Machinery, equipment, and supplies.......................... 215 *1,969 *627 *33 *307 *319 -- Other miscellaneous durable goods.......................... 5,299 19,645 *16,602 -- 1,075 1,639 38,784 Nondurable goods.......................................................... 6,800 41,904 58,556 *5,455 2,347 25,488 654,852 Drugs, chemicals, and allied products....................... *1,159 19,366 *24,648 *1,206 *805 *1,138 205,550 Groceries and related products.................................. *188 *578 *53 -- *241 *943 *2,990 Petroleum and petroleum products............................ *2,486 -- *7,554 -- *932 *550 *286,938 Other miscellaneous nondurable goods..................... 2,967 21,961 26,302 *4,249 *369 22,857 159,375 Footnotes at end of table.
Taxes deemed paid
InterestRents,
royalties, and license fees
Branch income
Specifically allocable income (section 863(b))
Service income
Other income

213
Corporate Foreign Tax Credit, 2001
Table 1.--U.S. Corporation Income Tax Returns with a Foreign Tax Credit, 2001: Total Assets, Income, Taxes, and Credits, and Foreign Income, Taxes, and Credit, by Major and Selected Minor Industry--Continued[All figures are estimates based on a sample--money amounts are in thousands of dollars]
Foreign income and taxes--Continued
Foreign taxes available for credit--Continued
Major and selected minor industry of Paid or accrued--ContinuedU.S. corporation filing return
Taxes withheld--Continued Other taxes paid or accrued on--
(45) (46) (47) (48) (49) (50) (51)
Wholesale and retail trade--continued Retail trade......................................................................... 3,090 47,807 28,243 *448 *449 10,044 271,646 Motor vehicle, parts dealers, and gas stations............... *53 *232 *307 -- *28 *1 *2,665 Furniture and home furnishing stores ............................ *21 *341 -- -- -- -- *125 Building materials, garden equipment, and supplies..... *236 *5,210 -- -- *42 -- -- Food and beverages stores........................................... *603 *8,838 -- -- -- (²) *204 Apparel and accessory stores........................................ *161 3,441 *24,198 -- *11 *260 *92,110 General merchandise stores.......................................... *257 *20,877 *1,034 *448 *137 *226 *74,567 Miscellaneous retail trade.............................................. *1,759 8,867 *2,705 -- *231 *9,557 *101,975 Transportation and warehousing....................................... 3,439 5,137 *25,829 -- 17,770 *3,740 62,434 Air, rail, and water transportation....................................... *19 *144 *951 -- *14,758 *3,013 *19,550 Water transportation...................................................... *3 -- -- -- *11,291 *3,013 *19,527 Air and rail transportation............................................... *16 *144 *951 -- *3,467 -- *23 Other transportation and warehousing............................... 3,420 *4,993 *24,878 -- *3,011 *727 42,885 Information........................................................................... 20,082 605,375 478,556 *2,675 29,347 201,556 1,280,044 Publishing, motion picture, and sound recording............... 4,127 456,528 416,225 *2,675 *5,808 137,372 507,596 Broadcasting and telecommunications.............................. *10,767 125,345 *55,628 -- *6,194 *63,864 *343,522 Information services and data processing services........... *5,189 23,502 *6,703 -- *17,345 *319 428,927 Finance, insurance, real estate, and rental and leasing... 150,065 39,863 888,060 *566 52,134 1,035,200 1,745,082 Finance and insurance....................................................... 148,142 37,584 887,196 *491 51,464 1,032,121 1,743,039 Commercial banking and other depository credit agencies..................................................................... *14,808 *26 *23,127 -- -- *1 *8 Commercial banking.................................................. *14,732 -- -- -- -- *1 -- Depository credit agencies other than banks............. *76 *26 *23,127 -- -- *1 *8 Nondepository credit intermediation.............................. *6,533 *33,121 *135,881 -- *1,849 *7,692 *92,118 Securities, commodity contracts, and other................... 4,598 *1,925 *46,525 -- *4,806 722,324 1,015,812 Insurance and related activities..................................... 30,220 *2,303 681,663 *491 5,906 300,868 577,183 Insurance agencies and brokerages.......................... *388 -- *29,604 -- *604 *4,171 *101,015 Funds, trusts, and other financial vehicles..................... 91,983 *209 -- -- *38,903 *1,236 *57,919 Real estate and rental and leasing.................................... 1,922 2,279 *864 *75 *670 3,078 *2,043 Real estate..................................................................... 847 *535 *864 -- *81 3,075 *1,299 Rentals and leasing....................................................... *1,075 1,744 -- *75 *589 *3 *744 Services................................................................................ 351,137 191,228 1,784,189 *2,282 118,691 426,094 2,034,935 Professional, scientific, and technical services.................. 2,307 42,154 105,264 *2,282 35,795 27,399 202,298 Management of holding companies................................... 329,777 32,868 1,558,726 -- *15,379 371,638 1,570,335 Administrative and support and waste management and remediation............................................................. 1,568 8,470 16,345 -- *54,423 *8,569 88,295 Education services, health care, and social assistance..... *60 *4,110 *1,081 -- *420 *269 *10,268 Arts, entertainment, and recreation.................................... *227 *5,066 *33 -- *11,012 *14,527 *3,601 Accommodation and food services.................................... 16,617 96,959 *101,221 -- *1,659 *3,672 137,487 Accommodation............................................................. *774 *5,017 *15,197 -- *1,514 *2,791 *17,451 Food services and drinking places................................. *15,843 91,942 *86,024 -- *145 *881 *120,036 Other services.................................................................... *581 *1,601 *1,519 -- *3 *20 *22,652 Repair and maintenance services.................................. -- *55 -- -- *3 *20 *84 Personal services, religious, grantmaking, civic, professional, etc............................................. *581 *1,546 *1,519 -- -- -- *22,568 Footnotes at end of table.
Taxes deemed paid
InterestRents,
royalties, and license fees
Branch income
Specifically allocable income (section 863(b))
Service income
Other income

214
Corporate Foreign Tax Credit, 2001
214
Footnotes to Table 1 * Data should be used with caution because of the small number of sample returns on which they were based. ¹ Interest-Charge Domestic International Sales Corporation (IC-DISC) and Domestic International Sales Corporation (DISC). ² Less than $500. ³ In addition to the credits shown in columns 12-14, this is after reduction by other credits, such as the jobs credit and the investment credit, which are not shown separately in this table. Included in gross income (less loss), columns 16-22. See notes below. Included in deductions, columns 25-34. See notes below. NOTES: Detail may not add to totals because of rounding. Columns 2 through 15 present statistics on assets, receipts, income, and taxes reported on Form 1120 (Corporation Income Tax Return) series for corporations claiming a foreign tax credit. Columns 16 through 51 present statistics from Form 1118, Foreign Tax Credit--Corporations. Schedule references indicate the schedule of Form 1118 from which the data were obtained. Columns 16 through 35 present statistics on foreign income (i.e., income from sources outside the United States) and deductions reported primarily on Schedule A, Form 1118. Although the amounts of oil and gas income and deductions (columns 23 and 35, respectively) are contained in the summary columns (i.e., columns 16 through 22 and 25 through 34), these amounts are also reported separately (on Schedule I) because oil and gas income is subject to special rules under Internal Revenue Code section 907, which may result in a reduction of foreign taxes available for credit. Foreign branch income and code section 863(b) income (income partly within and partly without the United States) are also included in the summary amounts reported in columns 16 through 22. Foreign branch income is also reported separately on Schedule F, shown in column 24. Total deductions not allocable to specific types of income (column 31) are equal to the sum of columns 32 through 34 (any differences are due to taxpayer-reporting practices). Total foreign-source gross income less loss (column 16) less total foreign deductions (column 25) is equal to foreign-source taxable income before adjustments (column 36).
Adjustments to foreign-source taxable income (reported in column 37) include allocations of current-year U.S.-source losses and recapture of foreign losses,as well as other adjustments. These adjustments (reported on Schedule J) affect the numerator of the limitation fraction used to compute the foreign tax credit. The foreign-source taxable income after adjustments (the numerator of the limitation fraction) is reported in column 38. The limitation fraction, which representsthe ratio of foreign-source taxable income after adjustments to total (U.S. and foreign) taxable income after adjustments, is applied to the total U.S. tax againstwhich the credit is allowed to determine any limitation on the foreign tax credit.
Statistics on foreign taxes are reported in columns 39 through 51. Data on foreign taxes paid, accrued, and deemed paid (through related foreign corporations or their subsidiaries) from Schedule B, Form 1118, are reported in columns 42 through 51. Total foreign taxes paid or accrued (column 43) are the sum of columns45 through 51 (any differences are due to taxpayer-reporting practices). Total foreign taxes paid, accrued, and deemed paid (column 42) are equal to the sum of total taxes paid or accrued (column 43) and taxes deemed paid (column 51). Total foreign taxes paid, accrued, and deemed paid are then adjusted for certain items (e.g., reductions of foreign taxes under Code section 907 related to oil and gas income), which are reported in column 40, as well as carryovers of foreign taxes not credited in prior years, which are reported in column 41. Thus, total foreign taxes available for credit (column 39) are equal to total foreign taxes paid, accrued, and deemed paid (column 42) less certain foreign taxes (column 40), plus any carryover of prior-year foreign taxes (column 41).
4
5

215
Corporate Foreign Tax Credit, 2001
Table 2.--U.S. Corporation Income Tax Returns with a Foreign Tax Credit, 2001: Foreign Income, Deductions, and Taxes, by Industrial Sector and by Type of Foreign Income for Which Separate Credit Was Computed[All figures are estimates based on a sample--money amounts are in thousands of dollars]
Industrial sector and type of foreign income Number of Foreign dividend
for which separate credit was computed returns Total Dividends income from foreign Interest
taxes deemed paid (gross-up)
(1) (2) (3) (4) (5)
ALL INDUSTRIES All income types....................................................................................... 5,478 372,905,130 65,166,156 27,329,970 68,435,076 Passive income........................................................................................ 2,325 8,745,026 4,482,550 387,763 3,177,052 High withholding tax interest.................................................................... 232 1,663,746 57,265 22,964 1,583,517 Financial services income........................................................................ 299 120,915,327 9,927,206 2,560,025 57,324,078 Shipping income...................................................................................... 38 7,817,744 507,964 63,119 104,050 Dividends from each noncontrolled section 902 corporation................... 425 4,089,815 2,915,856 1,057,371 78,619 Dividends from an IC-DISC or former DISC ¹.......................................... ** ** ** ** ** Miscellaneous separately calculated limitation........................................ ** ** ** ** ** Distributions from a FSC or former FSC ²................................................ 39 1,385,050 1,385,050 -- -- General limitation income........................................................................ 3,131 227,638,855 45,846,007 23,231,314 6,166,768 Section 901(j) income.............................................................................. 18 185,706 *9,894 *23 *851 Income resourced by treaty...................................................................... 16 456,869 34,314 *7,391 *141
AGRICULTURE, FORESTRY, FISHING, AND HUNTING All income types....................................................................................... 331 397,447 277,548 *106,584 *589 Passive income........................................................................................ 116 79,225 *78,567 *5 *32 High withholding tax interest.................................................................... ** ** ** ** ** Financial services income........................................................................ ** ** ** ** ** Shipping income...................................................................................... ** ** ** ** ** Dividends from each noncontrolled section 902 corporation................... ** ** ** ** ** Dividends from an IC-DISC or former DISC ¹.......................................... -- -- -- -- -- Miscellaneous separately calculated limitation........................................ -- -- -- -- -- Distributions from a FSC or former FSC ²................................................ -- -- -- -- -- General limitation income........................................................................ 215 *308,217 *197,342 *106,579 *424 Section 901(j) income.............................................................................. -- -- -- -- -- Income resourced by treaty...................................................................... -- -- -- -- --
MINING All income types....................................................................................... 131 6,600,448 804,919 317,782 282,091 Passive income........................................................................................ 38 163,350 90,088 *12,402 17,150 High withholding tax interest.................................................................... 7 *35,582 *140 *385 *35,057 Financial services income........................................................................ ** ** ** ** ** Shipping income...................................................................................... ** ** ** ** ** Dividends from each noncontrolled section 902 corporation................... 8 *115,706 *83,508 *32,477 -- Dividends from an IC-DISC or former DISC ¹.......................................... -- -- -- -- -- Miscellaneous separately calculated limitation........................................ -- -- -- -- -- Distributions from a FSC or former FSC ²................................................ -- -- -- -- -- General limitation income........................................................................ 119 6,282,153 627,042 272,518 229,884 Section 901(j) income.............................................................................. ** ** ** ** ** Income resourced by treaty...................................................................... -- -- -- -- --
UTILITIES All income types....................................................................................... 15 2,264,812 1,468,185 *304,683 *469,559 Passive income........................................................................................ 14 233,630 241,338 *9,413 *43,700 High withholding tax interest.................................................................... ** ** ** ** ** Financial services income........................................................................ 4 *4,636 *1,546 -- *3,090 Shipping income...................................................................................... -- -- -- -- -- Dividends from each noncontrolled section 902 corporation................... 6 *132,638 *69,726 *35,951 *26,938 Dividends from a IC-DISC or former DISC ¹............................................ -- -- -- -- -- Miscellaneous separately calculated limitation........................................ -- -- -- -- -- Distributions from a FSC or former FSC ²................................................ -- -- -- -- -- General limitation income........................................................................ 11 1,880,882 *1,143,898 *259,271 *394,531 Section 901(j) income.............................................................................. -- -- -- -- -- Income resourced by treaty...................................................................... ** ** ** ** ** Footnotes at end of table.
Foreign income and taxes
Gross income (less loss)

216
Corporate Foreign Tax Credit, 2001
216
Table 2.--U.S. Corporation Income Tax Returns with a Foreign Tax Credit, 2001: Foreign Income, Deductions, and Taxes, by Industrial Sector and by Type of Foreign Income for Which Separate Credit Was Computed--Continued[All figures are estimates based on a sample--money amounts are in thousands of dollars]
Industrial sector and type of foreign income Number of Foreign dividend
for which separate credit was computed returns Total Dividends income from foreign Interest
taxes deemed paid
(gross-up)(1) (2) (3) (4) (5)
CONSTRUCTION All income types....................................................................................... 235 142,932 26,034 12,328 15,721 Passive income........................................................................................ 113 15,648 398 *5 *15,040 High withholding tax interest.................................................................... ** ** ** ** ** Financial services income........................................................................ ** ** ** ** ** Shipping income...................................................................................... -- -- -- -- -- Dividends from each noncontrolled section 902 corporation................... 4 *9,106 *7,541 *1,565 -- Dividends from an IC-DISC or former DISC ¹.......................................... -- -- -- -- -- Miscellaneous separately calculated limitation........................................ -- -- -- -- -- Distributions from a FSC or former FSC ²................................................ -- -- -- -- -- General limitation income........................................................................ 123 117,910 18,093 *10,758 *414 Section 901(j) income.............................................................................. -- -- -- -- -- Income resourced by treaty...................................................................... -- -- -- -- --
MANUFACTURING All income types....................................................................................... 911 171,558,061 43,841,171 20,500,476 9,455,174 Passive income........................................................................................ 394 5,632,025 2,610,083 234,327 2,387,287 High withholding tax interest.................................................................... 49 287,218 *49,061 *21,338 216,819 Financial services income........................................................................ 52 6,179,296 1,494,328 65,756 2,588,504 Shipping income...................................................................................... 17 2,174,619 *246,854 *39,288 *28,490 Dividends from each noncontrolled section 902 corporation................... 141 1,645,170 1,063,869 511,905 35,915 Dividends from an IC-DISC or former DISC ¹.......................................... ** ** ** ** ** Miscellaneous separately calculated limitation........................................ ** ** ** ** ** Distributions from a FSC or former FSC ²................................................ 29 1,029,137 1,029,137 -- -- General limitation income........................................................................ 717 154,151,747 37,319,352 19,620,501 4,197,180 Section 901(j) income.............................................................................. 12 8,110 *5,994 *23 *837 Income resourced by treaty...................................................................... 11 444,946 *22,446 *7,338 *141
WHOLESALE AND RETAIL TRADE All income types....................................................................................... 586 12,153,171 2,420,508 965,677 441,092 Passive income........................................................................................ 173 479,053 235,122 41,216 93,105 High withholding tax interest.................................................................... 41 39,164 *1,585 ( ) 37,578 Financial services income........................................................................ 6 *250,045 *56,049 *32,603 *132,303 Shipping income...................................................................................... ** ** ** ** ** Dividends from each noncontrolled section 902 corporation................... 32 86,593 59,217 26,421 *58 Dividends from an IC-DISC or former DISC ¹.......................................... -- -- -- -- -- Miscellaneous separately calculated limitation........................................ ** ** ** ** ** Distributions from a FSC or former FSC ²................................................ -- -- -- -- -- General limitation income........................................................................ 432 11,280,673 2,054,512 863,016 178,045 Section 901(j) income.............................................................................. ** ** ** ** ** Income resourced by treaty...................................................................... ** ** ** ** **
TRANSPORTATION AND WAREHOUSING All income types....................................................................................... 78 9,007,604 358,468 62,434 125,856 Passive income........................................................................................ 40 32,902 19,054 *2,271 *5,167 High withholding tax interest.................................................................... 9 *17,124 ( ) -- *17,124 Financial services income........................................................................ ** ** ** ** ** Shipping income...................................................................................... 10 4,652,221 *194,376 *21,411 *63,617 Dividends from each noncontrolled section 902 corporation................... ** ** ** ** ** Dividends from an IC-DISC or former DISC ¹.......................................... -- -- -- -- -- Miscellaneous separately calculated limitation........................................ -- -- -- -- -- Distributions from a FSC or former FSC ²................................................ -- -- -- -- -- General limitation income........................................................................ 36 4,258,841 144,864 38,604 *38,214 Section 901(j) income.............................................................................. -- -- -- -- -- Income resourced by treaty...................................................................... -- -- -- -- -- Footnotes at end of table.
Foreign income and taxes
Gross income (less loss)
4
4

217
Corporate Foreign Tax Credit, 2001
Table 2.--U.S. Corporation Income Tax Returns with a Foreign Tax Credit, 2001: Foreign Income, Deductions, and Taxes, by Industrial Sector and by Type of Foreign Income for Which Separate Credit Was Computed--Continued[All figures are estimates based on a sample--money amounts are in thousands of dollars]
Industrial sector and type of foreign income Number of Foreign dividend
for which separate credit was computed returns Total Dividends income from foreign Interest
taxes deemed paid
(gross-up)(1) (2) (3) (4) (5)
INFORMATION All income types........................................................................................ 299 32,116,783 3,631,998 1,280,046 472,140 Passive income......................................................................................... 137 824,894 505,397 48,737 196,502 High withholding tax interest..................................................................... 6 *2,201 -- -- *2,201 Financial services income......................................................................... 4 *66,056 -- -- *135 Shipping income........................................................................................ 3 *325,755 *22,573 *4 *10,419 Dividends from each noncontrolled section 902 corporation..................... 14 1,497,297 1,192,549 302,763 *10 Dividends from an IC-DISC or former DISC ¹............................................ -- -- -- -- -- Miscellaneous separately calculated limitation.......................................... -- -- -- -- -- Distributions from a FSC or former FSC ²................................................. 5 *216,420 *216,420 -- -- General limitation income.......................................................................... 188 29,137,239 1,694,880 928,542 262,859 Section 901(j) income................................................................................ ** ** ** ** ** Income resourced by treaty....................................................................... ** ** ** ** **
FINANCE, INSURANCE, REAL ESTATE, AND RENTAL AND LEASING
All income types........................................................................................ 958 63,484,260 6,683,120 1,745,090 23,229,022 Passive income......................................................................................... 509 909,052 499,871 9,400 359,789 High withholding tax interest..................................................................... 65 217,349 *5,069 *312 211,969 Financial services income......................................................................... 144 59,774,464 5,854,778 1,659,622 22,568,936 Shipping income........................................................................................ ** ** ** ** ** Dividends from each noncontrolled section 902 corporation..................... 88 75,886 63,206 12,396 *438 Dividends from an IC-DISC or former DISC ¹............................................ ** ** ** ** ** Miscellaneous separately calculated limitation.......................................... -- -- -- -- -- Distributions from a FSC or former FSC ²................................................. -- -- -- -- -- General limitation income.......................................................................... 235 1,884,531 230,566 63,361 86,371 Section 901(j) income................................................................................ -- -- -- -- -- Income resourced by treaty....................................................................... -- -- -- -- --
SERVICES All income types........................................................................................ 1,934 75,179,611 5,654,204 2,034,869 33,943,832 Passive income......................................................................................... 792 375,246 202,632 29,987 59,281 High withholding tax interest..................................................................... 51 1,063,406 *1,410 *929 1,061,067 Financial services income......................................................................... 84 54,593,273 2,519,140 802,044 32,029,376 Shipping income........................................................................................ ** ** ** ** ** Dividends from each noncontrolled section 902 corporation..................... 128 525,068 376,069 133,745 *15,261 Dividends from an IC-DISC or former DISC ¹............................................ ** ** ** ** ** Miscellaneous separately calculated limitation.......................................... -- -- -- -- -- Distributions from a FSC or former FSC ²................................................. 5 *139,493 *139,493 -- -- General limitation income.......................................................................... 1,055 18,336,664 2,415,458 1,068,164 778,847 Section 901(j) income................................................................................ ** ** ** ** ** Income resourced by treaty....................................................................... ** ** ** ** ** Footnotes at end of table.
Gross income (less loss)
Foreign income and taxes

218
Corporate Foreign Tax Credit, 2001
218
Table 2.--U.S. Corporation Income Tax Returns with a Foreign Tax Credit, 2001: Foreign Income, Deductions, and Taxes, by Industrial Sector and by Type of Foreign Income for Which Separate Credit Was Computed--Continued[All figures are estimates based on a sample--money amounts are in thousands of dollars]
Industrial sector and type of foreign income Rents,
for which separate credit was computed royalties, Service Other Oil and Foreign
and income income gas extraction branch
license fees income ³ income ³(6) (7) (8) (9) (10)
ALL INDUSTRIESAll income types.................................................................................................. 50,837,026 19,042,809 142,094,092 30,945,555 80,847,969 Passive income................................................................................................... 279,080 *2,797 415,783 -- 162,316 High withholding tax interest............................................................................... -- -- ( ) -- *2,703 Financial services income................................................................................... 4,027,523 2,222,950 44,853,545 -- 45,540,925 Shipping income................................................................................................. 1,389,656 *105,128 5,647,827 -- *1,214,951 Dividends from each noncontrolled section 902 corporation.............................. *1,595 *547 35,828 -- *625 Dividends from an IC-DISC or former DISC ¹..................................................... ** ** ** ** ** Miscellaneous separately calculated limitation................................................... ** ** ** ** ** Distributions from a FSC or former FSC ²........................................................... -- -- -- -- -- General limitation income................................................................................... 45,136,505 16,707,906 90,550,354 30,945,555 33,922,422 Section 901(j) income......................................................................................... *2,667 -- 172,271 -- -- Income resourced by treaty................................................................................. -- *2,285 *412,738 -- *4,027
AGRICULTURE, FORESTRY, FISHING, AND HUNTING All income types.................................................................................................. *5,569 *240 *6,916 -- *-3,596 Passive income................................................................................................... *306 -- *315 -- -- High withholding tax interest............................................................................... ** ** ** ** ** Financial services income................................................................................... ** ** ** ** ** Shipping income................................................................................................. ** ** ** ** ** Dividends from each noncontrolled section 902 corporation.............................. ** ** ** ** ** Dividends from an IC-DISC or former DISC ¹..................................................... -- -- -- -- -- Miscellaneous separately calculated limitation................................................... -- -- -- -- -- Distributions from a FSC or former FSC ²........................................................... -- -- -- -- -- General limitation income................................................................................... *5,263 *240 *-1,630 -- *-3,596 Section 901(j) income......................................................................................... -- -- -- -- -- Income resourced by treaty................................................................................. -- -- -- -- --
MINING All income types.................................................................................................. 288,227 1,449,263 3,458,166 815,891 2,137,725 Passive income................................................................................................... *1,929 -- *41,780 -- *3,145 High withholding tax interest............................................................................... -- -- -- -- -- Financial services income................................................................................... ** ** ** ** ** Shipping income................................................................................................. ** ** ** ** ** Dividends from each noncontrolled section 902 corporation.............................. -- -- *-279 -- *124 Dividends from an IC-DISC or former DISC ¹..................................................... -- -- -- -- -- Miscellaneous separately calculated limitation................................................... -- -- -- -- -- Distributions from a FSC or former FSC ²........................................................... -- -- -- -- -- General limitation income................................................................................... 286,298 1,449,263 3,417,149 815,891 2,134,456 Section 901(j) income......................................................................................... ** ** ** ** ** Income resourced by treaty................................................................................. -- -- -- -- --
UTILITIES All income types.................................................................................................. *16,196 *53,339 -47,150 -- *-213 Passive income................................................................................................... -- -- *-60,821 -- -- High withholding tax interest............................................................................... ** ** ** ** ** Financial services income................................................................................... -- -- -- -- -- Shipping income................................................................................................. -- -- -- -- -- Dividends from each noncontrolled section 902 corporation.............................. -- -- *24 -- -- Dividends from an IC-DISC or former DISC ¹..................................................... -- -- -- -- -- Miscellaneous separately calculated limitation................................................... -- -- -- -- -- Distributions from a FSC or former FSC ²........................................................... -- -- -- -- -- General limitation income................................................................................... *16,196 *53,339 *13,646 -- *-213 Section 901(j) income......................................................................................... -- -- -- -- -- Income resourced by treaty................................................................................. ** ** ** ** ** Footnotes at end of table.
Foreign income and taxes--Continued
Gross income (less loss)--Continued
444

219
Corporate Foreign Tax Credit, 2001
Table 2.--U.S. Corporation Income Tax Returns with a Foreign Tax Credit, 2001: Foreign Income, Deductions, and Taxes, by Industrial Sector and by Type of Foreign Income for Which Separate Credit Was Computed--Continued[All figures are estimates based on a sample--money amounts are in thousands of dollars]
Industrial sector and type of foreign income Rents,
for which separate credit was computed royalties, Service Other Oil and Foreign and income income gas extraction branch
license fees income ³ income ³(6) (7) (8) (9) (10)
CONSTRUCTIONAll income types.................................................................................................. *13,004 57,153 18,692 -- *35,605 Passive income................................................................................................... *23 -- *181 -- -- High withholding tax interest............................................................................... ** ** ** ** ** Financial services income................................................................................... ** ** ** ** ** Shipping income................................................................................................. -- -- -- -- -- Dividends from each noncontrolled section 902 corporation.............................. -- -- -- -- -- Dividends from an IC-DISC or former DISC ¹..................................................... -- -- -- -- -- Miscellaneous separately calculated limitation................................................... -- -- -- -- -- Distributions from a FSC or former FSC ²........................................................... -- -- -- -- -- General limitation income................................................................................... *12,981 57,153 18,511 -- *35,605 Section 901(j) income......................................................................................... -- -- -- -- -- Income resourced by treaty................................................................................. -- -- -- -- --
MANUFACTURING All income types.................................................................................................. 26,348,303 2,908,121 68,504,815 27,952,946 17,894,889 Passive income................................................................................................... 116,918 *13 283,397 -- 126,954 High withholding tax interest............................................................................... -- -- -- -- *56 Financial services income................................................................................... *995,810 *1,483 1,033,415 -- *131,343 Shipping income................................................................................................. *560,814 *1 *1,299,172 -- *9,438 Dividends from each noncontrolled section 902 corporation.............................. *1,594 *547 31,340 -- -- Dividends from an IC-DISC or former DISC ¹..................................................... ** ** ** ** ** Miscellaneous separately calculated limitation................................................... ** ** ** ** ** Distributions from a FSC or former FSC ²........................................................... -- -- -- -- -- General limitation income................................................................................... 24,670,501 2,903,795 65,440,418 27,952,946 17,623,071 Section 901(j) income......................................................................................... *2,667 -- *-1,411 -- -- Income resourced by treaty................................................................................. -- *2,283 *412,738 -- *4,027
WHOLESALE AND RETAIL TRADE All income types.................................................................................................. 1,468,742 2,299,409 4,557,743 *863,337 1,477,186 Passive income................................................................................................... 55,372 -- 54,239 -- *12,754 High withholding tax interest............................................................................... -- -- -- -- *888 Financial services income................................................................................... -- -- *29,090 -- *4,625 Shipping income................................................................................................. ** ** ** ** ** Dividends from each noncontrolled section 902 corporation.............................. *1 -- *895 -- *86 Dividends from an IC-DISC or former DISC ¹..................................................... -- -- -- -- -- Miscellaneous separately calculated limitation................................................... ** ** ** ** ** Distributions from a FSC or former FSC ²........................................................... -- -- -- -- -- General limitation income................................................................................... 1,413,369 2,298,213 4,473,519 *863,337 1,458,833 Section 901(j) income......................................................................................... ** ** ** ** ** Income resourced by treaty................................................................................. ** ** ** ** **
TRANSPORTATION AND WAREHOUSING All income types.................................................................................................. 79,042 4,105,128 4,276,676 -- *2,717,420 Passive income................................................................................................... -- *1,253 *5,157 -- *5,036 High withholding tax interest............................................................................... -- -- -- -- -- Financial services income................................................................................... ** ** ** ** ** Shipping income................................................................................................. *59,995 *104,699 *4,208,123 -- *1,205,513 Dividends from each noncontrolled section 902 corporation.............................. ** ** ** ** ** Dividends from an IC-DISC or former DISC ¹..................................................... -- -- -- -- -- Miscellaneous separately calculated limitation................................................... -- -- -- -- -- Distributions from a FSC or former FSC ²........................................................... -- -- -- -- -- General limitation income................................................................................... *19,047 3,954,716 63,397 -- *1,506,871 Section 901(j) income......................................................................................... -- -- -- -- -- Income resourced by treaty................................................................................. -- -- -- -- -- Footnotes at end of table.
Foreign income and taxes--ContinuedGross income (less loss)--Continued

220
Corporate Foreign Tax Credit, 2001
220
Table 2.--U.S. Corporation Income Tax Returns with a Foreign Tax Credit, 2001: Foreign Income, Deductions, and Taxes, by Industrial Sector and by Type of Foreign Income for Which Separate Credit Was Computed--Continued[All figures are estimates based on a sample--money amounts are in thousands of dollars]
Industrial sector and type of foreign income Rents,
for which separate credit was computed royalties, Service Other Oil and Foreign
and income income gas extraction branch
license fees income ³ income ³(6) (7) (8) (9) (10)
INFORMATIONAll income types................................................................................................... 14,612,171 2,423,435 9,696,994 -- 4,549,785 Passive income.................................................................................................... 43,742 *1,531 28,985 -- *1,750 High withholding tax interest................................................................................ -- -- -- -- -- Financial services income.................................................................................... *63,929 *1 *1,990 -- -- Shipping income................................................................................................... *177,055 -- *115,704 -- -- Dividends from each noncontrolled section 902 corporation................................ -- -- *1,975 -- -- Dividends from an IC-DISC or former DISC ¹....................................................... -- -- -- -- -- Miscellaneous separately calculated limitation..................................................... -- -- -- -- -- Distributions from a FSC or former FSC ²............................................................ -- -- -- -- -- General limitation income..................................................................................... 14,327,445 2,421,902 9,501,611 -- 4,548,035 Section 901(j) income.......................................................................................... ** ** ** ** ** Income resourced by treaty.................................................................................. ** ** ** ** **
FINANCE, INSURANCE, REAL ESTATE, AND RENTAL AND LEASING
All income types................................................................................................... 1,341,221 2,485,113 28,000,694 -- 15,121,072 Passive income.................................................................................................... *5,467 -- 34,526 -- *3,926 High withholding tax interest................................................................................ -- -- ( ) -- -- Financial services income.................................................................................... 616,589 2,047,012 27,027,527 -- 14,997,666 Shipping income................................................................................................... ** ** ** ** ** Dividends from each noncontrolled section 902 corporation................................ -- -- *-153 -- *415 Dividends from an IC-DISC or former DISC ¹....................................................... ** ** ** ** ** Miscellaneous separately calculated limitation..................................................... -- -- -- -- -- Distributions from a FSC or former FSC ²............................................................ -- -- -- -- -- General limitation income..................................................................................... 127,373 438,102 938,759 -- 119,065 Section 901(j) income.......................................................................................... -- -- -- -- -- Income resourced by treaty.................................................................................. -- -- -- -- --
SERVICES All income types................................................................................................... 6,664,551 3,261,610 23,620,545 *1,313,380 36,918,096 Passive income.................................................................................................... 55,322 -- 28,024 -- *8,751 High withholding tax interest................................................................................ -- -- -- -- *1,759 Financial services income.................................................................................... 2,351,196 *129,994 16,761,523 -- 30,407,290 Shipping income................................................................................................... ** ** ** ** ** Dividends from each noncontrolled section 902 corporation................................ -- -- *-6 -- -- Dividends from an IC-DISC or former DISC ¹....................................................... ** ** ** ** ** Miscellaneous separately calculated limitation..................................................... -- -- -- -- -- Distributions from a FSC or former FSC ²............................................................ -- -- -- -- -- General limitation income..................................................................................... 4,258,033 3,131,185 6,684,976 *1,313,380 6,500,296 Section 901(j) income.......................................................................................... ** ** ** ** ** Income resourced by treaty.................................................................................. ** ** ** ** ** Footnotes at end of table.
Foreign income and taxes--Continued
Gross income (less loss)--Continued
44

221
Corporate Foreign Tax Credit, 2001
Table 2.--U.S. Corporation Income Tax Returns with a Foreign Tax Credit, 2001: Foreign Income, Deductions, and Taxes, by Industrial Sector and by Type of Foreign Income for Which Separate Credit Was Computed--Continued[All figures are estimates based on a sample--money amounts are in thousands of dollars]
Industrial sector and type of foreign income
for which separate credit was computed Depreciation,
Total Total depletion, and Other Service
amortization expenses expenses(11) (12) (13) (14) (15) (16)
ALL INDUSTRIES All income types....................................................................................... 208,151,787 98,242,474 1,182,200 4,183,330 12,853,301 80,023,642 Passive income........................................................................................ 2,343,539 475,135 *12,389 70,769 *3,163 388,814 High withholding tax interest.................................................................... 747,673 114,983 *409 *2,341 *708 111,524 Financial services income........................................................................ 86,549,706 26,163,983 310,365 219,332 518,835 25,115,451 Shipping income...................................................................................... 6,917,755 6,425,661 *354,048 *197,066 *73,991 5,800,555 Dividends from each noncontrolled section 902 corporation................... 747,932 57,236 *3 *1,524 *555 55,155 Dividends from an IC-DISC or former DISC ¹.......................................... ** ** ** ** ** ** Miscellaneous separately calculated limitation........................................ ** ** ** ** ** ** Distributions from a FSC or former FSC ²................................................ 1,288,280 1,286,653 -- -- -- 1,286,653 General limitation income........................................................................ 109,468,017 63,667,428 504,987 3,692,298 12,256,049 47,214,095 Section 901(j) income.............................................................................. 27,837 *18,702 -- -- -- *18,702 Income resourced by treaty...................................................................... 56,475 *31,452 -- -- -- *31,452
AGRICULTURE, FORESTRY, FISHING, AND HUNTING All income types....................................................................................... *61,581 *12 -- *4 -- *9 Passive income........................................................................................ *7,569 *11 -- *4 -- *8 High withholding tax interest.................................................................... ** ** ** ** ** ** Financial services income........................................................................ ** ** ** ** ** ** Shipping income...................................................................................... ** ** ** ** ** ** Dividends from each noncontrolled section 902 corporation................... ** ** ** ** ** ** Dividends from an IC-DISC or former DISC ¹.......................................... -- -- -- -- -- -- Miscellaneous separately calculated limitation........................................ -- -- -- -- -- -- Distributions from a FSC or former FSC ²................................................ -- -- -- -- -- -- General limitation income........................................................................ *52,074 *1 -- -- -- *1 Section 901(j) income.............................................................................. -- -- -- -- -- -- Income resourced by treaty...................................................................... -- -- -- -- -- --
MINING All income types....................................................................................... 4,088,613 3,378,672 83,130 *84,435 567,238 2,643,870 Passive income........................................................................................ 25,748 11,781 *481 -- *683 *10,617 High withholding tax interest.................................................................... *9,605 *3,638 -- -- *708 *2,929 Financial services income........................................................................ ** ** ** ** ** ** Shipping income...................................................................................... ** ** ** ** ** ** Dividends from each noncontrolled section 902 corporation................... *9,525 *7,677 -- -- -- *7,677 Dividends from an IC-DISC or former DISC ¹.......................................... -- -- -- -- -- -- Miscellaneous separately calculated limitation........................................ -- -- -- -- -- -- Distributions from a FSC or former FSC ²................................................ -- -- -- -- -- -- General limitation income........................................................................ 4,041,952 3,354,175 82,649 *84,435 565,846 2,621,245 Section 901(j) income.............................................................................. ** ** ** ** ** ** Income resourced by treaty...................................................................... -- -- -- -- -- --
UTILITIES All income types....................................................................................... 823,289 103,620 *1,157 -- *14,407 88,056 Passive income........................................................................................ *61,706 *4,294 -- -- -- *4,294 High withholding tax interest.................................................................... ** ** ** ** ** ** Financial services income........................................................................ *3,396 *140 -- -- -- *140 Shipping income...................................................................................... -- -- -- -- -- -- Dividends from each noncontrolled section 902 corporation................... *68,764 *572 -- -- -- *572 Dividends from an IC-DISC or former DISC ¹.......................................... -- -- -- -- -- -- Miscellaneous separately calculated limitation........................................ -- -- -- -- -- -- Distributions from a FSC or former FSC ²................................................ -- -- -- -- -- -- General limitation income........................................................................ 688,798 *98,518 *1,157 -- *14,407 *82,954 Section 901(j) income.............................................................................. -- -- -- -- -- -- Income resourced by treaty...................................................................... ** ** ** ** ** ** Footnotes at end of table.
Other definitely allocable
deductions
Deductions allocable to specific types of income
Foreign income and taxes--Continued
Deductions

222
Corporate Foreign Tax Credit, 2001
222
Table 2.--U.S. Corporation Income Tax Returns with a Foreign Tax Credit, 2001: Foreign Income, Deductions, and Taxes, by Industrial Sector and by Type of Foreign Income for Which Separate Credit Was Computed--Continued[All figures are estimates based on a sample--money amounts are in thousands of dollars]
Industrial sector and type of foreign income
for which separate credit was computed Depreciation, Total Total depletion, and Other Service
amortization expenses expenses(11) (12) (13) (14) (15) (16)
CONSTRUCTION All income types....................................................................................... 63,794 57,144 *7 *465 *47,539 *9,133 Passive income........................................................................................ *932 *28 -- -- -- *28 High withholding tax interest.................................................................... ** ** ** ** ** ** Financial services income........................................................................ ** ** ** ** ** ** Shipping income...................................................................................... -- -- -- -- -- -- Dividends from each noncontrolled section 902 corporation................... *31 -- -- -- -- -- Dividends from an IC-DISC or former DISC ¹.......................................... -- -- -- -- -- -- Miscellaneous separately calculated limitation........................................ -- -- -- -- -- -- Distributions from a FSC or former FSC ²................................................ -- -- -- -- -- -- General limitation income........................................................................ 62,831 57,117 *7 *465 *47,539 *9,105 Section 901(j) income.............................................................................. -- -- -- -- -- -- Income resourced by treaty...................................................................... -- -- -- -- -- --
MANUFACTURING All income types....................................................................................... 73,265,594 37,855,496 288,224 522,569 1,488,267 35,556,436 Passive income........................................................................................ 1,784,976 320,755 *8,278 3,181 *32 309,265 High withholding tax interest.................................................................... 86,628 *30,439 -- -- -- *30,439 Financial services income........................................................................ 4,632,062 2,273,014 *37,769 *196 *536 2,234,513 Shipping income...................................................................................... 1,974,544 1,815,157 *8,214 *26 *1 1,806,916 Dividends from each noncontrolled section 902 corporation................... 335,021 35,751 -- *1,260 *555 33,936 Dividends from an IC-DISC or former DISC ¹.......................................... ** ** ** ** ** ** Miscellaneous separately calculated limitation........................................ ** ** ** ** ** ** Distributions from a FSC or former FSC ²................................................ 1,029,137 1,029,137 -- -- -- 1,029,137 General limitation income........................................................................ 63,355,335 32,317,610 233,962 517,906 1,487,144 30,078,598 Section 901(j) income.............................................................................. *8,825 *1,015 -- -- -- *1,015 Income resourced by treaty...................................................................... 54,631 *31,376 -- -- -- *31,376
WHOLESALE AND RETAIL TRADE All income types....................................................................................... 7,513,234 5,733,329 19,705 207,239 2,016,902 3,489,483 Passive income........................................................................................ 94,289 19,999 *1,387 *3,081 *40 15,490 High withholding tax interest.................................................................... 17,425 *44 -- -- -- *44 Financial services income........................................................................ *94,341 *9,077 -- -- -- *9,077 Shipping income...................................................................................... ** ** ** ** ** ** Dividends from each noncontrolled section 902 corporation................... 18,095 *2,822 *3 *22 -- *2,797 Dividends from an IC-DISC or former DISC ¹.......................................... -- -- -- -- -- -- Miscellaneous separately calculated limitation........................................ ** ** ** ** ** ** Distributions from a FSC or former FSC ²................................................ -- -- -- -- -- -- General limitation income........................................................................ 7,284,894 5,700,349 18,315 204,135 2,016,862 3,461,037 Section 901(j) income.............................................................................. ** ** ** ** ** ** Income resourced by treaty...................................................................... ** ** ** ** ** **
TRANSPORTATION AND WAREHOUSING All income types....................................................................................... 8,219,749 7,919,276 *1,422 *16,451 3,885,215 4,016,188 Passive income........................................................................................ *8,480 *4,701 -- ( ) *361 *4,340 High withholding tax interest.................................................................... *8,204 ( ) -- ( ) -- -- Financial services income........................................................................ ** ** ** ** ** ** Shipping income...................................................................................... *4,186,900 *4,032,011 -- -- *73,991 *3,958,020 Dividends from each noncontrolled section 902 corporation................... ** ** ** ** ** ** Dividends from an IC-DISC or former DISC ¹.......................................... -- -- -- -- -- -- Miscellaneous separately calculated limitation........................................ -- -- -- -- -- -- Distributions from a FSC or former FSC ²................................................ -- -- -- -- -- -- General limitation income........................................................................ 3,965,162 3,833,741 *1,422 *16,450 3,762,031 53,837 Section 901(j) income.............................................................................. -- -- -- -- -- -- Income resourced by treaty...................................................................... -- -- -- -- -- -- Footnotes at end of table.
Other definitely allocable
deductions
Foreign income and taxes--ContinuedDeductions
Deductions allocable to specific types of income
4 4
4

223
Corporate Foreign Tax Credit, 2001
Table 2.--U.S. Corporation Income Tax Returns with a Foreign Tax Credit, 2001: Foreign Income, Deductions, and Taxes, by Industrial Sector and by Type of Foreign Income for Which Separate Credit Was Computed--Continued[All figures are estimates based on a sample--money amounts are in thousands of dollars]
Industrial sector and type of foreign income
for which separate credit was computed Depreciation,
Total Total depletion, and Other Service
amortization expenses expenses(11) (12) (13) (14) (15) (16)
INFORMATION All income types........................................................................................ 18,836,788 10,130,951 *170,066 2,249,483 1,896,038 5,815,364 Passive income......................................................................................... 159,035 73,001 -- *54,158 *1,522 *17,321 High withholding tax interest..................................................................... *641 -- -- -- -- -- Financial services income......................................................................... *121,597 *121,433 -- -- -- *121,433 Shipping income........................................................................................ *105,366 *63,742 *34,913 *19,400 -- *9,429 Dividends from each noncontrolled section 902 corporation..................... 167,041 *344 -- -- -- *344 Dividends from an IC-DISC or former DISC ¹............................................ -- -- -- -- -- -- Miscellaneous separately calculated limitation.......................................... -- -- -- -- -- -- Distributions from a FSC or former FSC ²................................................. *216,420 *216,420 -- -- -- *216,420 General limitation income.......................................................................... 18,066,165 9,655,990 *135,153 2,175,925 1,894,516 5,450,396 Section 901(j) income............................................................................... ** ** ** ** ** ** Income resourced by treaty....................................................................... ** ** ** ** ** **
FINANCE, INSURANCE, REAL ESTATE, AND RENTAL AND LEASING
All income types........................................................................................ 43,133,774 13,695,148 372,819 357,734 538,456 12,426,140 Passive income......................................................................................... 168,342 18,145 -- 3,935 *506 13,704 High withholding tax interest..................................................................... 192,166 25,532 *409 *2,298 -- 22,824 Financial services income......................................................................... 41,030,765 12,698,424 *43,372 *114,907 393,325 12,146,821 Shipping income........................................................................................ ** ** ** ** ** ** Dividends from each noncontrolled section 902 corporation..................... 22,916 *2,818 -- *32 -- *2,786 Dividends from an IC-DISC or former DISC ¹............................................ ** ** ** ** ** ** Miscellaneous separately calculated limitation.......................................... -- -- -- -- -- -- Distributions from a FSC or former FSC ²................................................. -- -- -- -- -- -- General limitation income.......................................................................... 1,098,687 461,669 18,117 58,922 144,625 240,005 Section 901(j) income............................................................................... -- -- -- -- -- -- Income resourced by treaty....................................................................... -- -- -- -- -- --
SERVICES All income types........................................................................................ 52,145,370 19,368,825 245,671 744,951 2,399,239 15,978,963 Passive income......................................................................................... 32,461 22,419 *2,243 *6,411 *19 13,747 High withholding tax interest..................................................................... 432,434 55,288 -- *43 -- 55,246 Financial services income......................................................................... 40,616,473 11,013,073 *229,223 *104,230 *76,142 10,603,478 Shipping income........................................................................................ ** ** ** ** ** ** Dividends from each noncontrolled section 902 corporation..................... 126,034 7,251 -- *209 -- 7,042 Dividends from an IC-DISC or former DISC ¹............................................ ** ** ** ** ** ** Miscellaneous separately calculated limitation.......................................... -- -- -- -- -- -- Distributions from a FSC or former FSC ²................................................. *42,723 *41,096 -- -- -- *41,096 General limitation income.......................................................................... 10,852,119 8,188,259 14,205 634,059 2,323,078 5,216,916 Section 901(j) income............................................................................... ** ** ** ** ** ** Income resourced by treaty....................................................................... ** ** ** ** ** ** Footnotes at end of table.
Foreign income and taxes--Continued
Deductions
Deductions allocable to specific types of income
Other definitely allocable
deductions

224
Corporate Foreign Tax Credit, 2001
224
Table 2.--U.S. Corporation Income Tax Returns with a Foreign Tax Credit, 2001: Foreign Income, Deductions, and Taxes, by Industrial Sector and by Type of Foreign Income for Which Separate Credit Was Computed--Continued[All figures are estimates based on a sample--money amounts are in thousands of dollars]
Industrial sector and type of foreign income Deductions
for which separate credit was computed from oil and
Total Research and Interest Other gas extraction
development income 5
(17) (18) (19) (20) (21)
ALL INDUSTRIESAll income types.................................................................................................. 109,909,312 9,122,373 52,679,130 47,638,165 9,994,224 Passive income................................................................................................... 1,868,404 110,194 1,363,577 378,442 -- High withholding tax interest............................................................................... 632,690 *277 576,113 52,959 -- Financial services income................................................................................... 60,385,722 16,160 36,046,268 24,298,917 -- Shipping income................................................................................................. 492,094 *13,722 399,547 78,825 -- Dividends from each noncontrolled section 902 corporation.............................. 690,695 17,184 578,448 91,528 -- Dividends from an IC-DISC or former DISC ¹..................................................... ** ** ** ** ** Miscellaneous separately calculated limitation................................................... ** ** ** ** ** Distributions from a FSC or former FSC ²........................................................... *1,627 -- -- *1,627 -- General limitation income................................................................................... 45,800,588 8,962,737 13,691,571 22,727,413 9,994,224 Section 901(j) income......................................................................................... 9,136 *155 *8,394 *587 -- Income resourced by treaty................................................................................. 25,022 *1,944 *15,213 *7,866 --
AGRICULTURE, FORESTRY, FISHING, AND HUNTING All income types.................................................................................................. *61,569 *348 *47,600 *13,488 -- Passive income................................................................................................... *7,558 -- *5,302 *2,248 -- High withholding tax interest............................................................................... ** ** ** ** ** Financial services income................................................................................... ** ** ** ** ** Shipping income................................................................................................. ** ** ** ** ** Dividends from each noncontrolled section 902 corporation.............................. ** ** ** ** ** Dividends from an IC-DISC or former DISC ¹..................................................... -- -- -- -- -- Miscellaneous separately calculated limitation................................................... -- -- -- -- -- Distributions from a FSC or former FSC ²........................................................... -- -- -- -- -- General limitation income................................................................................... *52,073 *348 *40,596 *11,003 -- Section 901(j) income......................................................................................... -- -- -- -- -- Income resourced by treaty................................................................................. -- -- -- -- --
MINING All income types.................................................................................................. 709,940 *26,944 317,804 356,105 252,910 Passive income................................................................................................... 13,967 *281 *5,489 *8,166 -- High withholding tax interest............................................................................... *5,967 *52 *5,754 *161 -- Financial services income................................................................................... ** ** ** ** ** Shipping income................................................................................................. ** ** ** ** ** Dividends from each noncontrolled section 902 corporation.............................. *1,848 -- *241 *1,605 -- Dividends from an IC-DISC or former DISC ¹..................................................... -- -- -- -- -- Miscellaneous separately calculated limitation................................................... -- -- -- -- -- Distributions from a FSC or former FSC ²........................................................... -- -- -- -- -- General limitation income................................................................................... 687,777 *26,611 305,921 346,190 252,910 Section 901(j) income......................................................................................... ** ** ** ** ** Income resourced by treaty................................................................................. -- -- -- -- --
UTILITIES All income types.................................................................................................. 719,669 *54,014 644,750 *20,904 -- Passive income................................................................................................... *57,412 *61 *54,537 *2,813 -- High withholding tax interest............................................................................... ** ** ** ** ** Financial services income................................................................................... *3,257 -- *2,767 *490 -- Shipping income................................................................................................. -- -- -- -- -- Dividends from each noncontrolled section 902 corporation.............................. *68,192 *1 *67,581 *611 -- Dividends from an IC-DISC or former DISC ¹..................................................... -- -- -- -- -- Miscellaneous separately calculated limitation................................................... -- -- -- -- -- Distributions from a FSC or former FSC ²........................................................... -- -- -- -- -- General limitation income................................................................................... 590,280 *53,950 519,340 *16,990 -- Section 901(j) income......................................................................................... -- -- -- -- -- Income resourced by treaty................................................................................. ** ** ** ** ** Footnotes at end of table.
Deductions not allocable to specific types of income
Foreign income and taxes--Continued
Deductions--Continued

225
Corporate Foreign Tax Credit, 2001
Table 2.--U.S. Corporation Income Tax Returns with a Foreign Tax Credit, 2001: Foreign Income, Deductions, and Taxes, by Industrial Sector and by Type of Foreign Income for Which Separate Credit Was Computed--Continued[All figures are estimates based on a sample--money amounts are in thousands of dollars]
Industrial sector and type of foreign income Deductions
for which separate credit was computed from oil and
Total Research and Interest Other gas extraction development income 5
(17) (18) (19) (20) (21)
CONSTRUCTIONAll income types.................................................................................................. 6,649 *298 *2,540 *2,671 -- Passive income................................................................................................... *904 -- -- -- -- High withholding tax interest............................................................................... ** ** ** ** ** Financial services income................................................................................... ** ** ** ** ** Shipping income................................................................................................. -- -- -- -- -- Dividends from each noncontrolled section 902 corporation.............................. *31 *2 *29 -- -- Dividends from an IC-DISC or former DISC ¹..................................................... -- -- -- -- -- Miscellaneous separately calculated limitation................................................... -- -- -- -- -- Distributions from a FSC or former FSC ²........................................................... -- -- -- -- -- General limitation income................................................................................... *5,714 *296 *2,511 *2,671 -- Section 901(j) income......................................................................................... -- -- -- -- -- Income resourced by treaty................................................................................. -- -- -- -- --
MANUFACTURING All income types.................................................................................................. 35,410,098 6,492,490 14,395,411 14,379,356 9,615,597 Passive income................................................................................................... 1,464,221 109,009 1,084,223 267,493 -- High withholding tax interest............................................................................... 56,189 *223 52,483 2,615 -- Financial services income................................................................................... 2,359,048 5,051 2,334,988 16,048 -- Shipping income................................................................................................. 159,386 *1,807 149,671 *7,909 -- Dividends from each noncontrolled section 902 corporation.............................. 299,271 16,990 239,987 40,339 -- Dividends from an IC-DISC or former DISC ¹..................................................... ** ** ** ** ** Miscellaneous separately calculated limitation................................................... ** ** ** ** ** Distributions from a FSC or former FSC ²........................................................... -- -- -- -- -- General limitation income................................................................................... 31,037,725 6,357,462 10,513,166 14,036,729 9,615,597 Section 901(j) income......................................................................................... *7,811 *5 *7,433 *374 -- Income resourced by treaty................................................................................. 23,255 *1,944 *13,462 *7,850 --
WHOLESALE AND RETAIL TRADE All income types.................................................................................................. 1,779,905 29,864 725,807 904,715 *125,717 Passive income................................................................................................... 74,290 *35 47,455 19,805 -- High withholding tax interest............................................................................... 17,380 -- *8,570 *7,814 -- Financial services income................................................................................... *85,264 -- *47,991 *37,273 -- Shipping income................................................................................................. ** ** ** ** ** Dividends from each noncontrolled section 902 corporation.............................. 15,273 *1 12,372 *2,798 -- Dividends from an IC-DISC or former DISC ¹..................................................... -- -- -- -- -- Miscellaneous separately calculated limitation................................................... ** ** ** ** ** Distributions from a FSC or former FSC ²........................................................... -- -- -- -- -- General limitation income................................................................................... 1,584,545 29,829 606,407 837,025 *125,717 Section 901(j) income......................................................................................... ** ** ** ** ** Income resourced by treaty................................................................................. ** ** ** ** **
TRANSPORTATION AND WAREHOUSING All income types.................................................................................................. 300,474 *22,662 190,160 *84,703 -- Passive income................................................................................................... *3,779 -- *3,314 *465 -- High withholding tax interest............................................................................... *8,204 -- *7,267 -- -- Financial services income................................................................................... ** ** ** ** ** Shipping income................................................................................................. *154,889 *4,581 *87,545 *62,763 -- Dividends from each noncontrolled section 902 corporation.............................. ** ** ** ** ** Dividends from an IC-DISC or former DISC ¹..................................................... -- -- -- -- -- Miscellaneous separately calculated limitation................................................... -- -- -- -- -- Distributions from a FSC or former FSC ²........................................................... -- -- -- -- -- General limitation income................................................................................... 131,421 *18,082 89,857 *21,471 -- Section 901(j) income......................................................................................... -- -- -- -- -- Income resourced by treaty................................................................................. -- -- -- -- -- Footnotes at end of table.
Deductions--Continued
Deductions not allocable to specific types of income
Foreign income and taxes--Continued

226
Corporate Foreign Tax Credit, 2001
226
Table 2.--U.S. Corporation Income Tax Returns with a Foreign Tax Credit, 2001: Foreign Income, Deductions, and Taxes, by Industrial Sector and by Type of Foreign Income for Which Separate Credit Was Computed--Continued[All figures are estimates based on a sample--money amounts are in thousands of dollars]
Industrial sector and type of foreign income Deductions
for which separate credit was computed from oil and
Total Research and Interest Other gas extraction
development income 5
(17) (18) (19) (20) (21)
INFORMATIONAll income types................................................................................................... 8,705,836 2,216,287 819,888 5,619,694 -- Passive income.................................................................................................... 86,034 *686 48,315 34,600 -- High withholding tax interest................................................................................ *641 -- *556 *83 -- Financial services income.................................................................................... *164 *32 *5 *127 -- Shipping income................................................................................................... *41,624 *7,334 *26,902 *7,387 -- Dividends from each noncontrolled section 902 corporation................................ 166,697 *191 132,706 *33,669 -- Dividends from an IC-DISC or former DISC ¹....................................................... -- -- -- -- -- Miscellaneous separately calculated limitation..................................................... -- -- -- -- -- Distributions from a FSC or former FSC ²............................................................ -- -- -- -- -- General limitation income..................................................................................... 8,410,175 2,207,894 611,347 5,543,534 -- Section 901(j) income........................................................................................... ** ** ** ** ** Income resourced by treaty.................................................................................. ** ** ** ** **
FINANCE, INSURANCE, REAL ESTATE, AND RENTAL AND LEASING
All income types................................................................................................... 29,438,626 *11,964 15,324,583 14,065,478 -- Passive income.................................................................................................... 150,197 -- *109,522 39,879 -- High withholding tax interest................................................................................ 166,634 -- 145,783 20,777 -- Financial services income.................................................................................... 28,332,341 *11,077 14,855,675 13,451,300 -- Shipping income................................................................................................... ** ** ** ** ** Dividends from each noncontrolled section 902 corporation................................ 20,098 -- *16,349 *3,113 -- Dividends from an IC-DISC or former DISC ¹....................................................... ** ** ** ** ** Miscellaneous separately calculated limitation..................................................... -- -- -- -- -- Distributions from a FSC or former FSC ²............................................................ -- -- -- -- -- General limitation income..................................................................................... 637,018 *887 64,917 550,408 -- Section 901(j) income........................................................................................... -- -- -- -- -- Income resourced by treaty.................................................................................. -- -- -- -- --
SERVICES All income types................................................................................................... 32,776,546 267,500 20,210,586 12,191,049 -- Passive income.................................................................................................... 10,042 *122 5,419 2,973 -- High withholding tax interest................................................................................ 377,146 -- 355,175 21,508 -- Financial services income.................................................................................... 29,603,400 -- 18,802,676 10,793,597 -- Shipping income................................................................................................... ** ** ** ** ** Dividends from each noncontrolled section 902 corporation................................ 118,782 ( ) 108,684 9,388 -- Dividends from an IC-DISC or former DISC ¹....................................................... ** ** ** ** ** Miscellaneous separately calculated limitation..................................................... -- -- -- -- -- Distributions from a FSC or former FSC ²............................................................ *1,627 -- -- *1,627 -- General limitation income..................................................................................... 2,663,860 267,378 937,509 1,361,392 -- Section 901(j) income........................................................................................... ** ** ** ** ** Income resourced by treaty.................................................................................. ** ** ** ** ** Footnotes at end of table.
Deductions--Continued
Deductions not allocable to specific types of income
Foreign income and taxes--Continued
4

227
Corporate Foreign Tax Credit, 2001
Table 2.--U.S. Corporation Income Tax Returns with a Foreign Tax Credit, 2001: Foreign Income, Deductions, and Taxes, by Industrial Sector and by Type of Foreign Income for Which Separate Credit Was Computed--Continued[All figures are estimates based on a sample--money amounts are in thousands of dollars]
Taxable Taxable
Industrial sector and type of foreign income income Adjustments income
for which separate credit was computed (less loss) to taxable (less loss) Total Reduction for
before income after certain foreign
adjustments adjustments taxes(22) (23) (24) (25) (26)
ALL INDUSTRIESAll income types................................................................................................ 164,753,343 15,388,618 149,364,725 54,510,213 2,895,223 Passive income................................................................................................. 6,401,487 424,373 5,977,114 673,032 *15 High withholding tax interest............................................................................. 916,073 -56,139 972,212 269,501 -- Financial services income................................................................................. 34,365,621 6,929,904 27,435,717 8,140,797 -- Shipping income................................................................................................ 899,989 104,345 795,644 129,601 -- Dividends from each noncontrolled section 902 corporation............................. 3,341,883 -43,667 3,385,550 1,856,541 -- Dividends from an IC-DISC or former DISC ¹................................................... ** ** ** ** ** Miscellaneous separately calculated limitation................................................. ** ** ** ** ** Distributions from a FSC or former FSC ²......................................................... *96,770 *-364 *97,134 ( ) -- General limitation income................................................................................. 118,170,838 8,058,450 110,112,388 43,376,076 2,895,185 Section 901(j) income....................................................................................... 157,868 -8,934 166,802 *13,255 *23 Income resourced by treaty............................................................................... 400,394 *-4,156 404,550 51,090 --
AGRICULTURE, FORESTRY, FISHING, AND HUNTING All income types................................................................................................ 335,865 -- 335,865 107,576 -- Passive income................................................................................................. 71,656 -- 71,656 56 -- High withholding tax interest............................................................................. ** ** ** ** ** Financial services income................................................................................. ** ** ** ** ** Shipping income................................................................................................ ** ** ** ** ** Dividends from each noncontrolled section 902 corporation............................. ** ** ** ** ** Dividends from an IC-DISC or former DISC ¹................................................... -- -- -- -- -- Miscellaneous separately calculated limitation................................................. -- -- -- -- -- Distributions from a FSC or former FSC ²......................................................... -- -- -- -- -- General limitation income................................................................................. *256,143 -- *256,143 *107,505 -- Section 901(j) income....................................................................................... -- -- -- -- -- Income resourced by treaty............................................................................... -- -- -- -- --
MINING All income types................................................................................................ 2,511,835 160,012 2,351,823 1,504,438 178,942 Passive income................................................................................................. 137,602 *8,692 128,911 13,461 -- High withholding tax interest............................................................................. *25,977 *1,421 *24,555 *9,311 -- Financial services income................................................................................. ** ** ** ** ** Shipping income................................................................................................ ** ** ** ** ** Dividends from each noncontrolled section 902 corporation............................. *106,181 *34,997 *71,183 *33,419 -- Dividends from an IC-DISC or former DISC ¹................................................... -- -- -- -- -- Miscellaneous separately calculated limitation................................................. -- -- -- -- -- Distributions from a FSC or former FSC ²......................................................... -- -- -- -- -- General limitation income................................................................................. 2,240,201 121,118 2,119,082 1,448,248 178,942 Section 901(j) income....................................................................................... ** ** ** ** ** Income resourced by treaty............................................................................... -- -- -- -- --
UTILITIES All income types................................................................................................ 1,441,523 *128,684 1,312,839 557,069 -- Passive income................................................................................................. 171,924 *48,673 123,251 17,239 -- High withholding tax interest............................................................................. ** ** ** ** ** Financial services income................................................................................. *1,239 *-712 *1,951 *673 -- Shipping income................................................................................................ -- -- -- -- -- Dividends from each noncontrolled section 902 corporation............................. *63,874 *-26,171 *90,044 *51,056 -- Dividends from an IC-DISC or former DISC ¹................................................... -- -- -- -- -- Miscellaneous separately calculated limitation................................................. -- -- -- -- -- Distributions from a FSC or former FSC ²......................................................... -- -- -- -- -- General limitation income................................................................................. 1,192,084 *110,068 1,082,016 487,884 -- Section 901(j) income....................................................................................... -- -- -- -- -- Income resourced by treaty............................................................................... ** ** ** ** ** Footnotes at end of table.
Foreign taxes available for credit
Foreign income and taxes--Continued
4

228
Corporate Foreign Tax Credit, 2001
228
Table 2.--U.S. Corporation Income Tax Returns with a Foreign Tax Credit, 2001: Foreign Income, Deductions, and Taxes, by Industrial Sector and by Type of Foreign Income for Which Separate Credit Was Computed--Continued[All figures are estimates based on a sample--money amounts are in thousands of dollars]
Foreign income and taxes--Continued
Taxable Taxable
Industrial sector and type of foreign income income Adjustments income
for which separate credit was computed (less loss) to taxable (less loss) Total Reduction for
before income after certain foreign
adjustments adjustments taxes(22) (23) (24) (25) (26)
CONSTRUCTION All income types................................................................................................ 79,139 *1,287 77,852 22,733 -- Passive income................................................................................................. 14,716 *274 14,442 446 -- High withholding tax interest............................................................................. ** ** ** ** ** Financial services income................................................................................. ** ** ** ** ** Shipping income................................................................................................ -- -- -- -- -- Dividends from each noncontrolled section 902 corporation............................. *9,074 -- *9,074 *1,577 -- Dividends from an IC-DISC or former DISC ¹................................................... -- -- -- -- -- Miscellaneous separately calculated limitation................................................. -- -- -- -- -- Distributions from a FSC or former FSC ²......................................................... -- -- -- -- -- General limitation income................................................................................. 55,079 *1,013 54,066 20,637 -- Section 901(j) income....................................................................................... -- -- -- -- -- Income resourced by treaty............................................................................... -- -- -- -- --
MANUFACTURING All income types................................................................................................ 98,292,466 6,869,888 91,422,579 35,851,490 2,569,819 Passive income................................................................................................. 3,847,049 324,131 3,522,918 358,232 *15 High withholding tax interest............................................................................. 200,590 9,248 191,342 54,744 -- Financial services income................................................................................. 1,547,233 -104,903 1,652,136 181,961 -- Shipping income................................................................................................ 200,075 -13,331 213,406 *59,294 -- Dividends from each noncontrolled section 902 corporation............................. 1,310,148 -63,239 1,373,387 1,026,523 -- Dividends from an IC-DISC or former DISC ¹................................................... ** ** ** ** ** Miscellaneous separately calculated limitation................................................. ** ** ** ** ** Distributions from a FSC or former FSC ²......................................................... -- -- -- ( ) -- General limitation income................................................................................. 90,796,413 6,741,328 84,055,084 34,121,617 2,569,781 Section 901(j) income....................................................................................... -715 *-8,851 *8,136 ( ) *23 Income resourced by treaty............................................................................... 390,315 *701 389,614 49,040 --
WHOLESALE AND RETAIL TRADE All income types................................................................................................ 4,639,937 306,594 4,333,343 1,685,383 *129,538 Passive income................................................................................................. 384,764 48,188 336,576 58,766 -- High withholding tax interest............................................................................. 21,739 *-3,388 25,127 5,297 -- Financial services income................................................................................. *155,704 *4,640 *151,064 *39,317 -- Shipping income................................................................................................ ** ** ** ** ** Dividends from each noncontrolled section 902 corporation............................. 68,498 -2,147 70,645 56,658 -- Dividends from an IC-DISC or former DISC ¹................................................... -- -- -- -- -- Miscellaneous separately calculated limitation................................................. ** ** ** ** ** Distributions from a FSC or former FSC ²......................................................... -- -- -- -- -- General limitation income................................................................................. 3,995,778 260,774 3,735,005 1,519,376 *129,538 Section 901(j) income....................................................................................... ** ** ** ** ** Income resourced by treaty............................................................................... ** ** ** ** **
TRANSPORTATION AND WAREHOUSING All income types................................................................................................ 787,855 37,152 750,703 151,850 -- Passive income................................................................................................. 24,422 *1,226 23,196 3,382 -- High withholding tax interest............................................................................. *8,920 *12 *8,908 *2,575 -- Financial services income................................................................................. ** ** ** ** ** Shipping income................................................................................................ 465,322 *2,904 462,418 63,507 -- Dividends from each noncontrolled section 902 corporation............................. ** ** ** ** ** Dividends from an IC-DISC or former DISC ¹................................................... -- -- -- -- -- Miscellaneous separately calculated limitation................................................. -- -- -- -- -- Distributions from a FSC or former FSC ²......................................................... -- -- -- -- -- General limitation income................................................................................. 293,678 37,659 256,020 82,224 -- Section 901(j) income....................................................................................... -- -- -- -- -- Income resourced by treaty............................................................................... -- -- -- -- -- Footnotes at end of table.
Foreign taxes available for credit
4
4

229
Corporate Foreign Tax Credit, 2001
Table 2.--U.S. Corporation Income Tax Returns with a Foreign Tax Credit, 2001: Foreign Income, Deductions, and Taxes, by Industrial Sector and by Type of Foreign Income for Which Separate Credit Was Computed--Continued[All figures are estimates based on a sample--money amounts are in thousands of dollars]
Foreign income and taxes--Continued
Taxable Taxable
Industrial sector and type of foreign income income Adjustments income
for which separate credit was computed (less loss) to taxable (less loss) Total Reduction for
before income after certain foreign
adjustments adjustments taxes(22) (23) (24) (25) (26)
INFORMATION All income types................................................................................................. 13,279,995 263,658 13,016,337 3,550,463 *540 Passive income.................................................................................................. 665,859 -22,705 688,564 72,454 -- High withholding tax interest............................................................................... *1,560 *-954 *2,514 *216 -- Financial services income.................................................................................. *-55,542 *-60,860 *5,318 ( ) -- Shipping income................................................................................................. *220,389 *154,126 *66,263 *4 -- Dividends from each noncontrolled section 902 corporation.............................. 1,330,256 46,266 1,283,990 491,214 -- Dividends from an IC-DISC or former DISC ¹..................................................... -- -- -- -- -- Miscellaneous separately calculated limitation................................................... -- -- -- -- -- Distributions from a FSC or former FSC ².......................................................... -- *-756 *756 -- -- General limitation income................................................................................... 11,071,074 149,832 10,921,242 2,984,579 *540 Section 901(j) income......................................................................................... ** ** ** ** ** Income resourced by treaty................................................................................ ** ** ** ** **
FINANCE, INSURANCE, REAL ESTATE, AND RENTAL AND LEASING
All income types................................................................................................. 20,350,486 6,069,796 14,280,690 4,969,775 *323 Passive income.................................................................................................. 740,710 931 739,779 90,208 -- High withholding tax interest............................................................................... 25,184 -70,232 95,416 36,765 -- Financial services income.................................................................................. 18,743,699 6,075,209 12,668,489 4,639,605 -- Shipping income................................................................................................. ** ** ** ** ** Dividends from each noncontrolled section 902 corporation.............................. 52,970 *4,436 48,534 19,156 -- Dividends from an IC-DISC or former DISC ¹..................................................... ** ** ** ** ** Miscellaneous separately calculated limitation................................................... -- -- -- -- -- Distributions from a FSC or former FSC ².......................................................... -- -- -- -- -- General limitation income................................................................................... 785,843 87,955 697,888 183,062 *323 Section 901(j) income......................................................................................... -- -- -- -- -- Income resourced by treaty................................................................................ -- -- -- -- --
SERVICES All income types................................................................................................. 23,034,241 1,551,547 21,482,694 6,109,436 *16,060 Passive income.................................................................................................. 342,786 14,965 327,821 58,788 -- High withholding tax interest............................................................................... 630,972 7,749 623,222 160,338 -- Financial services income.................................................................................. 13,976,800 1,020,795 12,956,004 3,279,241 -- Shipping income................................................................................................. ** ** ** ** ** Dividends from each noncontrolled section 902 corporation.............................. 399,035 -37,522 436,557 176,778 -- Dividends from an IC-DISC or former DISC ¹..................................................... ** ** ** ** ** Miscellaneous separately calculated limitation................................................... -- -- -- -- -- Distributions from a FSC or former FSC ².......................................................... *96,770 *392 *96,378 -- -- General limitation income................................................................................... 7,484,545 548,703 6,935,842 2,420,945 *16,060 Section 901(j) income......................................................................................... ** ** ** ** ** Income resourced by treaty................................................................................ ** ** ** ** ** Footnotes at end of table.
Foreign taxes available for credit
4

230
Corporate Foreign Tax Credit, 2001
230
Table 2.--U.S. Corporation Income Tax Returns with a Foreign Tax Credit, 2001: Foreign Income, Deductions, and Taxes, by Industrial Sector and by Type of Foreign Income for Which Separate Credit Was Computed--Continued[All figures are estimates based on a sample--money amounts are in thousands of dollars]
Industrial sector and type of foreign income
for which separate credit was computed Carryover Total paid,
accrued, and Total Rents, royalties,
deemed paid and license fees(27) (28) (29) (30) (31) (32)
ALL INDUSTRIESAll income types...................................................................................... 12,900,280 44,505,156 17,161,245 1,426,868 710,381 2,327,460 Passive income....................................................................................... 48,818 624,229 243,690 37,534 115,399 18,498 High withholding tax interest.................................................................... 32,255 237,247 214,283 *62 214,221 -- Financial services income....................................................................... 1,271,275 6,869,522 4,306,125 121,598 223,577 47,124 Shipping income...................................................................................... *31,140 98,461 35,342 *702 *642 *4,776 Dividends from each noncontrolled section 902 corporation................... 737,802 1,118,739 62,170 58,636 *17 *124 Dividends from an IC-DISC or former DISC ¹.......................................... ** ** ** ** ** ** Miscellaneous separately calculated limitation....................................... ** ** ** ** ** ** Distributions from a FSC or former FSC ²............................................... ( ) -- -- -- -- -- General limitation income........................................................................ 10,776,901 35,494,361 12,244,451 1,208,199 156,525 2,256,938 Section 901(j) income.............................................................................. ( ) *13,278 *13,255 -- -- -- Income resourced by treaty..................................................................... *2,089 49,002 *41,611 *137 -- --
AGRICULTURE, FORESTRY, FISHING, AND HUNTING All income types...................................................................................... *144 107,431 847 127 *15 *519 Passive income....................................................................................... ( ) 56 51 *15 *2 *22 High withholding tax interest.................................................................... ** ** ** ** ** ** Financial services income....................................................................... ** ** ** ** ** ** Shipping income...................................................................................... ** ** ** ** ** ** Dividends from each noncontrolled section 902 corporation................... ** ** ** ** ** ** Dividends from an IC-DISC or former DISC ¹.......................................... -- -- -- -- -- -- Miscellaneous separately calculated limitation....................................... -- -- -- -- -- -- Distributions from a FSC or former FSC ²............................................... -- -- -- -- -- -- General limitation income........................................................................ *144 *107,362 *783 *112 -- *497 Section 901(j) income.............................................................................. -- -- -- -- -- -- Income resourced by treaty..................................................................... -- -- -- -- -- --
MINING All income types...................................................................................... 771,569 911,811 593,716 12,705 8,782 6,768 Passive income....................................................................................... *148 13,312 910 *158 *359 *198 High withholding tax interest.................................................................... *5,412 *3,899 *3,514 -- *3,514 -- Financial services income....................................................................... ** ** ** ** ** ** Shipping income...................................................................................... ** ** ** ** ** ** Dividends from each noncontrolled section 902 corporation................... *462 *32,957 *168 *168 -- -- Dividends from an IC-DISC or former DISC ¹.......................................... -- -- -- -- -- -- Miscellaneous separately calculated limitation....................................... -- -- -- -- -- -- Distributions from a FSC or former FSC ²............................................... -- -- -- -- -- -- General limitation income........................................................................ 765,547 861,643 589,125 12,379 4,909 *6,570 Section 901(j) income.............................................................................. ** ** ** ** ** ** Income resourced by treaty..................................................................... -- -- -- -- -- --
UTILITIES All income types...................................................................................... *233,930 323,139 18,433 *5,798 *3,579 *935 Passive income....................................................................................... *1,081 16,158 *6,745 *1,922 *601 -- High withholding tax interest.................................................................... ** ** ** ** ** ** Financial services income....................................................................... *635 *38 *38 -- *38 -- Shipping income...................................................................................... -- -- -- -- -- -- Dividends from each noncontrolled section 902 corporation................... *15,105 *35,951 -- -- -- -- Dividends from an IC-DISC or former DISC ¹.......................................... -- -- -- -- -- -- Miscellaneous separately calculated limitation....................................... -- -- -- -- -- -- Distributions from a FSC or former FSC ²............................................... -- -- -- -- -- -- General limitation income........................................................................ *217,109 270,774 *11,481 *3,876 *2,771 *935 Section 901(j) income.............................................................................. -- -- -- -- -- -- Income resourced by treaty..................................................................... ** ** ** ** ** ** Footnotes at end of table.
Foreign income and taxes--Continued
Foreign taxes available for credit--Continued
Paid or accrued
Taxes withheld at source on--
Dividends Interest
4
4
4

231
Corporate Foreign Tax Credit, 2001
Table 2.--U.S. Corporation Income Tax Returns with a Foreign Tax Credit, 2001: Foreign Income, Deductions, and Taxes, by Industrial Sector and by Type of Foreign Income for Which Separate Credit Was Computed--Continued[All figures are estimates based on a sample--money amounts are in thousands of dollars]
Industrial sector and type of foreign income
for which separate credit was computed Carryover Total paid, accrued, and Total Rents, royalties,
deemed paid and license fees(27) (28) (29) (30) (31) (32)
CONSTRUCTIONAll income types...................................................................................... 3,373 19,361 7,032 831 *314 *1,700 Passive income....................................................................................... *112 334 329 33 *288 *2 High withholding tax interest.................................................................... ** ** ** ** ** ** Financial services income....................................................................... ** ** ** ** ** ** Shipping income...................................................................................... -- -- -- -- -- -- Dividends from each noncontrolled section 902 corporation................... -- *1,577 *12 *12 -- -- Dividends from an IC-DISC or former DISC ¹.......................................... -- -- -- -- -- -- Miscellaneous separately calculated limitation....................................... -- -- -- -- -- -- Distributions from a FSC or former FSC ²............................................... -- -- -- -- -- -- General limitation income........................................................................ 3,212 17,425 6,666 787 -- *1,698 Section 901(j) income.............................................................................. -- -- -- -- -- -- Income resourced by treaty..................................................................... -- -- -- -- -- --
MANUFACTURING All income types...................................................................................... 8,383,054 30,038,255 9,523,835 1,101,403 157,563 1,364,609 Passive income....................................................................................... 21,242 337,006 108,224 20,886 26,899 6,308 High withholding tax interest.................................................................... *8,074 46,670 25,332 *1 25,331 -- Financial services income....................................................................... *19,303 162,657 96,304 *17,204 *6,203 *4,903 Shipping income...................................................................................... *19,476 *39,819 *531 ( ) ( ) -- Dividends from each noncontrolled section 902 corporation................... 473,839 552,684 39,445 36,340 *17 *122 Dividends from an IC-DISC or former DISC ¹.......................................... ** ** ** ** ** ** Miscellaneous separately calculated limitation....................................... ** ** ** ** ** ** Distributions from a FSC or former FSC ²............................................... ( ) -- -- -- -- -- General limitation income........................................................................ 7,841,028 28,850,370 9,212,310 1,026,835 99,114 1,353,276 Section 901(j) income.............................................................................. ( ) *23 -- -- -- -- Income resourced by treaty..................................................................... *91 48,948 *41,610 *137 -- --
WHOLESALE AND RETAIL TRADE All income types...................................................................................... 532,133 1,282,789 317,507 39,144 15,404 111,326 Passive income....................................................................................... 4,682 54,085 14,548 742 1,707 4,658 High withholding tax interest.................................................................... *567 4,730 4,729 *7 4,722 -- Financial services income....................................................................... -- *39,317 *6,715 *258 -- -- Shipping income...................................................................................... ** ** ** ** ** ** Dividends from each noncontrolled section 902 corporation................... 28,647 28,011 1,319 1,005 -- -- Dividends from an IC-DISC or former DISC ¹.......................................... -- -- -- -- -- -- Miscellaneous separately calculated limitation....................................... ** ** ** ** ** ** Distributions from a FSC or former FSC ²............................................... -- -- -- -- -- -- General limitation income........................................................................ 494,928 1,153,986 289,956 37,132 8,975 106,668 Section 901(j) income.............................................................................. ** ** ** ** ** ** Income resourced by treaty..................................................................... ** ** ** ** ** **
TRANSPORTATION AND WAREHOUSING All income types...................................................................................... 28,807 123,043 60,609 4,694 3,439 5,137 Passive income....................................................................................... *45 3,337 1,067 *740 *41 -- High withholding tax interest.................................................................... *50 *2,526 *2,526 -- *2,526 -- Financial services income....................................................................... ** ** ** ** ** ** Shipping income...................................................................................... *8,265 55,242 *33,831 *701 *642 *3,796 Dividends from each noncontrolled section 902 corporation................... ** ** ** ** ** ** Dividends from an IC-DISC or former DISC ¹.......................................... -- -- -- -- -- -- Miscellaneous separately calculated limitation....................................... -- -- -- -- -- -- Distributions from a FSC or former FSC ²............................................... -- -- -- -- -- -- General limitation income........................................................................ 20,447 61,778 23,174 3,240 *231 *1,341 Section 901(j) income.............................................................................. -- -- -- -- -- -- Income resourced by treaty..................................................................... -- -- -- -- -- -- Footnotes at end of table.
Foreign income and taxes--Continued Foreign taxes available for credit--Continued
Paid or accrued
Taxes withheld at source on--
Dividends Interest
4 4
4
4

232
Corporate Foreign Tax Credit, 2001
232
Table 2.--U.S. Corporation Income Tax Returns with a Foreign Tax Credit, 2001: Foreign Income, Deductions, and Taxes, by Industrial Sector and by Type of Foreign Income for Which Separate Credit Was Computed--Continued[All figures are estimates based on a sample--money amounts are in thousands of dollars]
Industrial sector and type of foreign income
for which separate credit was computed Carryover Total paid,
accrued, and Total Rents, royalties,
deemed paid and license fees(27) (28) (29) (30) (31) (32)
INFORMATIONAll income types........................................................................................ 879,959 2,671,044 1,391,000 53,408 20,082 605,375 Passive income......................................................................................... *7,501 64,953 16,215 *4,597 *7,678 3,142 High withholding tax interest..................................................................... -- *216 *216 -- *216 -- Financial services income......................................................................... -- ( ) ( ) -- -- -- Shipping income....................................................................................... -- *4 -- -- -- -- Dividends from each noncontrolled section 902 corporation.................... *183,530 307,684 *4,923 *4,923 -- -- Dividends from an IC-DISC or former DISC ¹........................................... -- -- -- -- -- -- Miscellaneous separately calculated limitation......................................... -- -- -- -- -- -- Distributions from a FSC or former FSC ²................................................. -- -- -- -- -- -- General limitation income......................................................................... 686,931 2,298,187 1,369,646 43,887 12,188 602,233 Section 901(j) income............................................................................... ** ** ** ** ** ** Income resourced by treaty...................................................................... ** ** ** ** ** **
FINANCE, INSURANCE, REAL ESTATE, AND RENTAL AND LEASING
All income types........................................................................................ 980,790 3,989,308 2,244,226 78,339 150,065 39,863 Passive income......................................................................................... 2,051 88,157 78,757 5,154 70,474 *825 High withholding tax interest..................................................................... *12,915 23,849 23,538 *54 23,484 -- Financial services income......................................................................... 925,504 3,714,101 2,054,479 59,469 50,709 *32,270 Shipping income....................................................................................... ** ** ** ** ** ** Dividends from each noncontrolled section 902 corporation.................... *6,089 13,067 *680 *567 -- -- Dividends from an IC-DISC or former DISC ¹........................................... ** ** ** ** ** ** Miscellaneous separately calculated limitation......................................... -- -- -- -- -- -- Distributions from a FSC or former FSC ²................................................. -- -- -- -- -- -- General limitation income......................................................................... 34,232 149,153 85,793 13,095 5,399 5,788 Section 901(j) income............................................................................... -- -- -- -- -- -- Income resourced by treaty...................................................................... -- -- -- -- -- --
SERVICES All income types........................................................................................ 1,086,522 5,038,974 3,004,039 130,418 351,137 191,228 Passive income......................................................................................... 11,957 46,831 16,844 3,287 7,350 3,343 High withholding tax interest..................................................................... *5,188 155,150 154,221 -- 154,221 -- Financial services income......................................................................... *325,833 2,953,408 2,148,588 44,666 166,628 *9,951 Shipping income....................................................................................... ** ** ** ** ** ** Dividends from each noncontrolled section 902 corporation.................... 30,131 146,647 15,612 15,609 ( ) *2 Dividends from an IC-DISC or former DISC ¹........................................... ** ** ** ** ** ** Miscellaneous separately calculated limitation......................................... -- -- -- -- -- -- Distributions from a FSC or former FSC ²................................................. -- -- -- -- -- -- General limitation income......................................................................... 713,323 1,723,683 655,518 66,856 22,939 177,932 Section 901(j) income............................................................................... ** ** ** ** ** ** Income resourced by treaty...................................................................... ** ** ** ** ** ** Footnotes at end of table.
Taxes withheld at source on--
Dividends Interest
Foreign income and taxes--Continued
Foreign taxes available for credit--Continued
Paid or accrued
4 4
4

233
Corporate Foreign Tax Credit, 2001
Table 2.--U.S. Corporation Income Tax Returns with a Foreign Tax Credit, 2001: Foreign Income, Deductions, and Taxes, by Industrial Sector and by Type of Foreign Income for Which Separate Credit Was Computed--Continued[All figures are estimates based on a sample--money amounts are in thousands of dollars]
Industrial sector and type of foreign income
for which separate credit was computed Taxes
Branch Specifically allocable Service Other deemed
income income [section 863(b)] income income paid (33) (34) (35) (36) (37)
ALL INDUSTRIESAll income types......................................................................................... 5,474,925 50,127 288,060 6,883,424 27,343,911 Passive income.......................................................................................... 15,929 *66 *283 55,981 380,539 High withholding tax interest...................................................................... -- -- -- -- 22,964 Financial services income.......................................................................... 2,446,726 *444 61,310 1,405,345 2,563,397 Shipping income......................................................................................... *16,326 -- *9,507 *3,390 63,119 Dividends from each noncontrolled section 902 corporation..................... *319 -- -- 3,074 1,056,569 Dividends from an IC-DISC or former DISC ¹............................................ ** ** ** ** ** Miscellaneous separately calculated limitation.......................................... ** ** ** ** ** Distributions from a FSC or former FSC ².................................................. -- -- -- -- -- General limitation income.......................................................................... 2,994,500 49,616 216,720 5,361,953 23,249,909 Section 901(j) income................................................................................ -- -- -- *13,255 *23 Income resourced by treaty........................................................................ *1,126 -- ( ) *40,348 *7,391
AGRICULTURE, FORESTRY, FISHING, AND HUNTING All income types......................................................................................... -- -- -- *185 *106,584 Passive income.......................................................................................... -- -- -- *12 *5 High withholding tax interest...................................................................... ** ** ** ** ** Financial services income.......................................................................... ** ** ** ** ** Shipping income......................................................................................... ** ** ** ** ** Dividends from each noncontrolled section 902 corporation..................... ** ** ** ** ** Dividends from an IC-DISC or former DISC ¹............................................ -- -- -- -- -- Miscellaneous separately calculated limitation.......................................... -- -- -- -- -- Distributions from a FSC or former FSC ².................................................. -- -- -- -- -- General limitation income.......................................................................... -- -- -- *173 *106,579 Section 901(j) income................................................................................ -- -- -- -- -- Income resourced by treaty........................................................................ -- -- -- -- --
MINING All income types......................................................................................... 183,266 *10,271 *10,240 361,685 318,094 Passive income.......................................................................................... *28 -- -- *167 *12,402 High withholding tax interest...................................................................... -- -- -- -- *385 Financial services income.......................................................................... ** ** ** ** ** Shipping income......................................................................................... ** ** ** ** ** Dividends from each noncontrolled section 902 corporation..................... -- -- -- -- *32,789 Dividends from an IC-DISC or former DISC ¹............................................ -- -- -- -- -- Miscellaneous separately calculated limitation.......................................... -- -- -- -- -- Distributions from a FSC or former FSC ².................................................. -- -- -- -- -- General limitation income.......................................................................... 183,239 *10,271 *10,240 361,518 272,518 Section 901(j) income................................................................................ ** ** ** ** ** Income resourced by treaty........................................................................ -- -- -- -- --
UTILITIES All income types......................................................................................... *460 -- *2,045 *5,616 *304,706 Passive income.......................................................................................... -- -- -- *4,222 *9,413 High withholding tax interest...................................................................... ** ** ** ** ** Financial services income.......................................................................... -- -- -- -- -- Shipping income......................................................................................... -- -- -- -- -- Dividends from each noncontrolled section 902 corporation..................... -- -- -- -- *35,951 Dividends from an IC-DISC or former DISC ¹............................................ -- -- -- -- -- Miscellaneous separately calculated limitation.......................................... -- -- -- -- -- Distributions from a FSC or former FSC ².................................................. -- -- -- -- -- General limitation income.......................................................................... *460 -- *2,045 *1,394 *259,293 Section 901(j) income................................................................................ -- -- -- -- -- Income resourced by treaty........................................................................ ** ** ** ** ** Footnotes at end of table.
Foreign income and taxes--Continued
Foreign taxes available for credit--Continued
Paid or accrued--Continued
Other taxes paid or accrued on--
4

234
Corporate Foreign Tax Credit, 2001
234
Table 2.--U.S. Corporation Income Tax Returns with a Foreign Tax Credit, 2001: Foreign Income, Deductions, and Taxes, by Industrial Sector and by Type of Foreign Income for Which Separate Credit Was Computed--Continued[All figures are estimates based on a sample--money amounts are in thousands of dollars]
Industrial sector and type of foreign income
for which separate credit was computed Taxes
Branch Specifically allocable Service Other deemed
income income [section 863(b)] income income paid (33) (34) (35) (36) (37)
CONSTRUCTIONAll income types......................................................................................... *741 -- 2,963 483 12,328 Passive income.......................................................................................... -- -- -- *5 *5 High withholding tax interest...................................................................... ** ** ** ** ** Financial services income.......................................................................... ** ** ** ** ** Shipping income......................................................................................... -- -- -- -- -- Dividends from each noncontrolled section 902 corporation..................... -- -- -- -- *1,565 Dividends from an IC-DISC or former DISC ¹............................................ -- -- -- -- -- Miscellaneous separately calculated limitation.......................................... -- -- -- -- -- Distributions from a FSC or former FSC ².................................................. -- -- -- -- -- General limitation income.......................................................................... *741 -- 2,963 *478 *10,758 Section 901(j) income................................................................................ -- -- -- -- -- Income resourced by treaty........................................................................ -- -- -- -- --
MANUFACTURING All income types......................................................................................... 2,009,795 28,396 50,692 4,811,376 20,514,420 Passive income.......................................................................................... 12,883 *33 -- 41,215 228,781 High withholding tax interest...................................................................... -- -- -- -- *21,338 Financial services income.......................................................................... *3,711 -- *14 *64,269 66,353 Shipping income......................................................................................... -- -- -- *531 *39,288 Dividends from each noncontrolled section 902 corporation..................... *319 -- -- *2,647 513,239 Dividends from an IC-DISC or former DISC ¹............................................ ** ** ** ** ** Miscellaneous separately calculated limitation.......................................... ** ** ** ** ** Distributions from a FSC or former FSC ².................................................. -- -- -- -- -- General limitation income.......................................................................... 1,991,757 28,363 50,678 4,662,287 19,638,060 Section 901(j) income................................................................................ -- -- -- -- *23 Income resourced by treaty........................................................................ *1,126 -- -- *40,348 *7,338
WHOLESALE AND RETAIL TRADE All income types......................................................................................... 104,028 *5,936 4,178 37,490 965,282 Passive income.......................................................................................... *469 *33 -- *6,940 39,537 High withholding tax interest...................................................................... -- -- -- -- ( ) Financial services income.......................................................................... *761 *444 -- *5,252 *32,603 Shipping income......................................................................................... ** ** ** ** ** Dividends from each noncontrolled section 902 corporation..................... -- -- -- *314 26,692 Dividends from an IC-DISC or former DISC ¹............................................ -- -- -- -- -- Miscellaneous separately calculated limitation.......................................... ** ** ** ** ** Distributions from a FSC or former FSC ².................................................. -- -- -- -- -- General limitation income.......................................................................... 102,798 *5,459 3,939 24,985 864,030 Section 901(j) income................................................................................ ** ** ** ** ** Income resourced by treaty........................................................................ ** ** ** ** **
TRANSPORTATION AND WAREHOUSING All income types......................................................................................... *25,829 -- 17,770 *3,740 62,434 Passive income.......................................................................................... -- -- *283 *2 *2,271 High withholding tax interest...................................................................... -- -- -- -- -- Financial services income.......................................................................... ** ** ** ** ** Shipping income......................................................................................... *16,326 -- *9,507 *2,860 *21,411 Dividends from each noncontrolled section 902 corporation..................... ** ** ** ** ** Dividends from an IC-DISC or former DISC ¹............................................ -- -- -- -- -- Miscellaneous separately calculated limitation.......................................... -- -- -- -- -- Distributions from a FSC or former FSC ².................................................. -- -- -- -- -- General limitation income.......................................................................... *9,503 -- 7,979 *879 38,604 Section 901(j) income................................................................................ -- -- -- -- -- Income resourced by treaty........................................................................ -- -- -- -- -- Footnotes at end of table.
Foreign income and taxes--Continued
Foreign taxes available for credit--Continued
Paid or accrued--Continued
Other taxes paid or accrued on--
4

235
Corporate Foreign Tax Credit, 2001
Table 2.--U.S. Corporation Income Tax Returns with a Foreign Tax Credit, 2001: Foreign Income, Deductions, and Taxes, by Industrial Sector and by Type of Foreign Income for Which Separate Credit Was Computed--Continued[All figures are estimates based on a sample--money amounts are in thousands of dollars]
Industrial sector and type of foreign income
for which separate credit was computed Taxes
Branch Specifically allocable Service Other deemed
income income [section 863(b)] income income paid (33) (34) (35) (36) (37)
INFORMATIONAll income types.......................................................................................... 478,556 *2,675 29,347 201,556 1,280,044 Passive income........................................................................................... *560 -- -- *238 48,737 High withholding tax interest....................................................................... -- -- -- -- -- Financial services income........................................................................... -- -- ( ) -- -- Shipping income.......................................................................................... -- -- -- -- *4 Dividends from each noncontrolled section 902 corporation....................... -- -- -- -- *302,761 Dividends from an IC-DISC or former DISC ¹.............................................. -- -- -- -- -- Miscellaneous separately calculated limitation............................................ -- -- -- -- -- Distributions from a FSC or former FSC ²................................................... -- -- -- -- -- General limitation income............................................................................ 477,997 *2,675 29,347 201,318 928,542 Section 901(j) income.................................................................................. ** ** ** ** ** Income resourced by treaty......................................................................... ** ** ** ** **
FINANCE, INSURANCE, REAL ESTATE, AND RENTAL AND LEASING
All income types.......................................................................................... 888,060 *566 52,134 1,035,200 1,745,082 Passive income........................................................................................... -- -- -- 2,305 9,400 High withholding tax interest....................................................................... -- -- -- -- *312 Financial services income........................................................................... 884,331 -- 46,150 981,550 1,659,622 Shipping income.......................................................................................... ** ** ** ** ** Dividends from each noncontrolled section 902 corporation....................... -- -- -- *112 12,388 Dividends from an IC-DISC or former DISC ¹.............................................. ** ** ** ** ** Miscellaneous separately calculated limitation............................................ -- -- -- -- -- Distributions from a FSC or former FSC ²................................................... -- -- -- -- -- General limitation income............................................................................ *3,729 *566 5,984 51,233 63,361 Section 901(j) income.................................................................................. -- -- -- -- -- Income resourced by treaty......................................................................... -- -- -- -- --
SERVICES All income types.......................................................................................... 1,784,189 *2,282 118,691 426,094 2,034,935 Passive income........................................................................................... *1,990 -- -- 875 29,987 High withholding tax interest....................................................................... -- -- -- -- *929 Financial services income........................................................................... 1,557,923 -- *15,146 354,275 804,820 Shipping income.......................................................................................... ** ** ** ** ** Dividends from each noncontrolled section 902 corporation....................... -- -- -- ( ) 131,035 Dividends from an IC-DISC or former DISC ¹.............................................. ** ** ** ** ** Miscellaneous separately calculated limitation............................................ -- -- -- -- -- Distributions from a FSC or former FSC ²................................................... -- -- -- -- -- General limitation income............................................................................ 224,276 *2,282 103,544 57,689 1,068,164 Section 901(j) income.................................................................................. ** ** ** ** ** Income resourced by treaty......................................................................... ** ** ** ** ** * Data should be used with caution because of the small number of sample returns on which they were based. ** Not shown to avoid disclosure of information about specific taxpayers. However, the data are included in the appropriate totals.
¹ Interest-Charge Domestic International Sales Corporation (IC-DISC) and Domestic International Sales Corporation (DISC).
² Foreign Sales Corporation (FSC).
³ Included in gross income (less loss) shown in columns 2-8.
Less than $500.
Included in deductions shown in columns 11-20.
NOTE: Detail may not add to totals because of rounding.
Paid or accrued--Continued
Other taxes paid or accrued on--
Foreign income and taxes--Continued
Foreign taxes available for credit--Continued
4
4
4
5

236
Corporate Foreign Tax Credit, 2001
236
Table 3.--U.S. Corporation Income Tax Returns with a Foreign Tax Credit, 2001: Foreign Income, Deductions, and Taxes by Selected Country to Which Foreign Taxes Were Paid[All figures are estimates based on a sample--money amounts are in thousands of dollars]
Selected country Number
of returns
(1) (2) (3) (4) (5) (6)
All geographic areas.................................................... 5,478 372,905,130 65,166,156 27,329,970 68,435,076 50,837,026 Canada.......................................................................... 1,576 24,637,380 4,874,629 3,031,747 3,162,234 3,177,514 Latin America, total...................................................... 892 39,029,520 8,200,122 2,113,896 11,280,874 4,623,211 Mexico........................................................................ 591 12,414,208 2,439,582 860,014 2,906,475 1,904,492 Central America, total................................................ 217 1,580,002 290,290 139,730 258,569 134,483 Belize..................................................................... 25 6,267 *440 *360 *1,036 *452 Costa Rica............................................................. 124 201,060 30,788 7,714 15,350 57,032 El Salvador............................................................. 86 183,793 10,894 3,020 36,761 9,176 Guatemala.............................................................. 102 379,958 12,655 4,792 48,054 30,088 Honduras................................................................ 78 430,627 169,908 *110,142 8,306 7,010 Nicaragua............................................................... 57 50,565 *443 *110 *4,367 2,107 Panama (including Canal Zone)............................. 133 319,583 65,163 13,593 144,696 28,488 Central America not allocable................................ 3 *8,149 -- -- -- *130 Caribbean countries, total.......................................... 280 7,506,747 3,149,402 278,685 1,892,724 682,420 Cayman Islands (British)........................................ 148 4,765,399 2,295,293 219,417 1,722,535 158,859 Dominican Republic............................................... 112 308,036 77,064 *20,567 78,911 10,266 Haiti........................................................................ 29 74,507 *780 *98 *12,599 *2,190 Jamaica.................................................................. 76 207,488 8,348 *4,843 38,335 17,157 Trinidad.................................................................. 95 870,144 96,789 11,495 37,001 19,721 Other Caribbean countries..................................... 87 1,281,173 671,129 22,266 3,344 474,225 South America, total................................................... 602 17,599,141 2,320,847 835,467 6,223,103 1,864,231 Argentina................................................................ 319 5,041,261 462,030 183,815 2,591,646 284,474 Bolivia.................................................................... 65 63,763 *7,869 *1,608 26,929 3,060 Brazil...................................................................... 413 6,667,645 991,435 480,636 2,344,292 843,280 Chili........................................................................ 224 1,667,203 390,548 39,258 578,992 104,151 Colombia................................................................ 198 1,241,289 92,361 42,206 113,287 111,900 Ecuador.................................................................. 124 175,748 15,588 3,842 31,482 26,418 Paraguay................................................................ 52 70,356 *282 *50 52,670 3,370 Peru........................................................................ 148 861,806 29,305 7,365 170,846 275,944 Uruguay.................................................................. 93 196,759 28,266 8,491 65,912 19,808 Venezuela.............................................................. 218 1,498,287 303,158 68,196 239,365 188,173 Other South American countries............................ 35 115,023 *5 -- *7,683 3,653 Latin America not allocable........................................ 10 *-70,579 -- -- *2 *37,585 Other Western Hemisphere, total............................... 252 7,430,526 4,391,104 739,625 1,391,529 106,235 Bahamas.................................................................... 90 1,277,267 314,281 20,389 605,139 15,139 Bermuda..................................................................... 179 5,521,513 3,779,565 679,285 608,744 50,999 Netherlands Antilles................................................... 60 290,411 114,048 28,470 105,335 12,243 Other British West Indies........................................... 72 267,206 180,731 10,098 49,724 23,825 All other Western Hemisphere................................... 44 73,714 *2,478 *1,382 22,587 4,031 Europe, total................................................................. 2,167 153,761,933 33,493,805 15,538,494 30,738,085 21,524,052 European Union, total................................................ 2,100 129,822,149 26,929,067 11,772,864 29,210,434 17,608,451 Austria.................................................................... 173 1,402,740 401,564 115,800 111,722 446,260 Belgium.................................................................. 250 2,973,373 593,574 177,332 211,764 862,063 Denmark................................................................. 205 1,522,937 286,748 90,153 79,043 225,233 Finland................................................................... 189 318,563 29,083 16,977 67,932 92,377 France (including Andorra)..................................... 409 8,074,225 1,426,955 1,004,497 1,044,586 2,116,668 Germany................................................................ 475 14,244,336 1,503,545 756,192 2,744,419 2,904,965 Greece................................................................... 150 558,284 25,537 24,439 199,429 119,272 Ireland.................................................................... 231 6,481,298 2,570,102 236,477 331,604 2,779,444 Italy (including San Marino).................................... 348 4,501,048 703,056 598,156 329,795 1,031,621 Luxembourg........................................................... 107 3,487,853 2,084,647 619,408 459,936 119,267 Footnotes at end of table.
Total DividendsRents, royalties, and license fees
Foreign dividend income from foreign taxes deemed paid
(gross-up)
Interest
Gross income (less loss)
Foreign income and taxes

237
Corporate Foreign Tax Credit, 2001
Table 3.--U.S. Corporation Income Tax Returns with a Foreign Tax Credit, 2001: Foreign Income, Deductions, and Taxes by Selected Country to Which Foreign Taxes Were Paid--Continued[All figures are estimates based on a sample--money amounts are in thousands of dollars]
Selected country Number
of returns
(1) (2) (3) (4) (5) (6)
Europe--continued European Union--continued Netherlands............................................................ 763 11,268,819 4,482,218 1,418,587 868,652 1,872,548 Portugal.................................................................. 140 629,134 236,327 87,043 44,886 107,801 Spain...................................................................... 417 5,178,051 1,774,783 1,598,758 114,478 557,082 Sweden.................................................................. 248 1,352,635 470,533 77,720 156,798 290,886 United Kingdom...................................................... 1,396 67,788,151 10,314,958 4,940,077 22,445,390 4,082,789 European Union not allocable................................ 4 *40,700 *25,437 *11,247 -- *176 Other West European countries, total........................ 358 19,346,160 6,168,513 3,651,211 1,061,133 3,038,981 Liechtenstein.......................................................... 10 3,800 *1,524 *46 *188 *1,724 Monaco.................................................................. 13 12,578 *5,653 *2,087 *2,062 *3 Norway................................................................... 161 7,918,569 2,458,077 2,271,299 144,251 120,593 Switzerland............................................................. 284 9,736,923 3,678,059 1,347,596 579,961 1,880,654 Turkey.................................................................... 147 725,020 22,571 29,736 329,885 100,155 Other West European countries not allocable....... 64 949,269 *2,629 *447 4,786 935,853 East European countries, total................................... 313 4,313,034 396,226 114,419 466,517 806,717 Romania................................................................. 70 296,127 3,633 *1,190 11,286 24,833 Former Soviet Union.............................................. 200 2,185,491 120,096 28,266 324,406 113,724 Other East European countries.............................. 225 1,831,416 272,498 84,963 130,825 668,160 Europe not allocable.................................................. 18 280,590 -- -- -- *69,903 Africa, total.................................................................... 346 7,431,642 735,025 352,963 427,760 531,773 North Africa, total....................................................... 169 1,448,031 31,046 11,046 186,775 71,739 Algeria.................................................................... 51 104,993 *34 -- *25,548 *4,473 Egypt...................................................................... 119 1,212,673 18,458 *6,950 137,850 51,351 Libya...................................................................... 10 *5,817 *4,270 *1 *364 *355 Morocco................................................................. 49 71,767 *1,415 *721 *1,681 11,256 Other North African countries................................. 36 52,780 *6,870 *3,374 *21,332 4,304 East Africa, total......................................................... 95 745,999 323,457 167,009 24,213 76,427 Ethiopia.................................................................. 13 36,232 -- -- *647 *9,355 Kenya..................................................................... 51 129,027 *15,291 *13,193 22,974 46,341 Tanzania................................................................ 14 6,838 *10 *6 *158 *4,041 Uganda................................................................... 11 5,209 *2,078 *1,203 -- *949 Other East African countries.................................. 68 568,693 306,079 152,607 433 15,740 West and Central Africa, total.................................... 110 4,372,834 306,137 115,165 50,548 21,768 Gabon.................................................................... 14 157,602 *104,072 *34,811 *2,828 *95 Ghana.................................................................... 18 10,430 *5,148 *1,835 *1 *423 Liberia.................................................................... 25 66,766 43,796 *2,313 13,693 *3,340 Nigeria.................................................................... 54 2,615,452 142,543 *65,885 8,664 13,746 Zaire....................................................................... 13 21,896 *634 *147 *434 *127 Other West and Central African countries.............. 68 1,500,688 9,944 *10,176 24,927 4,038 Southern Africa, total.................................................. 235 864,495 74,385 59,743 166,225 361,554 Malawi.................................................................... 11 1,074 *359 *105 ( ² ) *276 Zimbabwe.............................................................. 32 14,442 *2,612 *1,266 *1,814 1,822 South Africa (including Namibia)............................ 226 790,169 65,886 50,181 164,298 315,786 Zambia................................................................... 13 11,095 *2,455 *7,288 ( ² ) *589 Other Southern African countries........................... 16 47,715 *3,073 *902 *113 *43,081 Footnotes at end of table.
Total Dividends
Foreign dividend income from foreign taxes deemed paid
(gross-up)
Interest Rents, royalties, and license fees
Foreign income and taxes
Gross income (less loss)
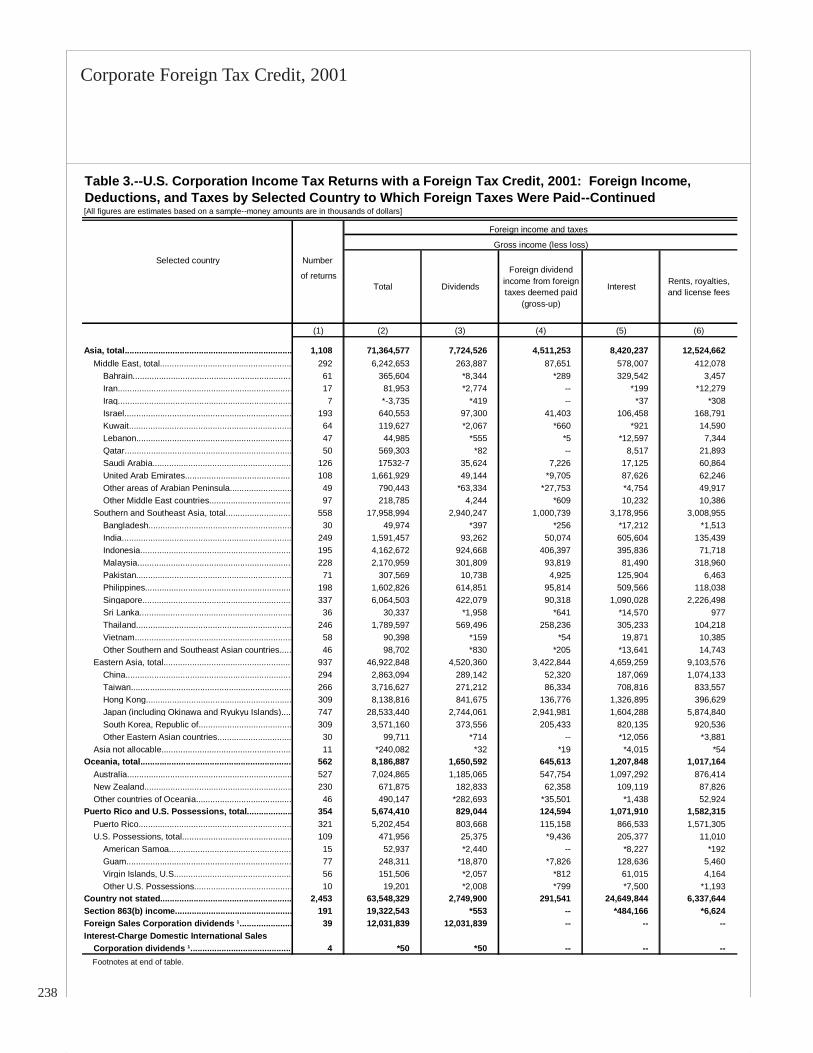
238
Corporate Foreign Tax Credit, 2001
238
Table 3.--U.S. Corporation Income Tax Returns with a Foreign Tax Credit, 2001: Foreign Income, Deductions, and Taxes by Selected Country to Which Foreign Taxes Were Paid--Continued[All figures are estimates based on a sample--money amounts are in thousands of dollars]
Selected country Number
of returns
(1) (2) (3) (4) (5) (6)
Asia, total...................................................................... 1,108 71,364,577 7,724,526 4,511,253 8,420,237 12,524,662 Middle East, total....................................................... 292 6,242,653 263,887 87,651 578,007 412,078 Bahrain................................................................... 61 365,604 *8,344 *289 329,542 3,457 Iran......................................................................... 17 81,953 *2,774 -- *199 *12,279 Iraq......................................................................... 7 *-3,735 *419 -- *37 *308 Israel...................................................................... 193 640,553 97,300 41,403 106,458 168,791 Kuwait.................................................................... 64 119,627 *2,067 *660 *921 14,590 Lebanon................................................................. 47 44,985 *555 *5 *12,597 7,344 Qatar...................................................................... 50 569,303 *82 -- 8,517 21,893 Saudi Arabia.......................................................... 126 17532-7 35,624 7,226 17,125 60,864 United Arab Emirates............................................. 108 1,661,929 49,144 *9,705 87,626 62,246 Other areas of Arabian Peninsula.......................... 49 790,443 *63,334 *27,753 *4,754 49,917 Other Middle East countries................................... 97 218,785 4,244 *609 10,232 10,386 Southern and Southeast Asia, total............................ 558 17,958,994 2,940,247 1,000,739 3,178,956 3,008,955 Bangladesh............................................................ 30 49,974 *397 *256 *17,212 *1,513 India....................................................................... 249 1,591,457 93,262 50,074 605,604 135,439 Indonesia................................................................ 195 4,162,672 924,668 406,397 395,836 71,718 Malaysia................................................................. 228 2,170,959 301,809 93,819 81,490 318,960 Pakistan................................................................. 71 307,569 10,738 4,925 125,904 6,463 Philippines.............................................................. 198 1,602,826 614,851 95,814 509,566 118,038 Singapore............................................................... 337 6,064,503 422,079 90,318 1,090,028 2,226,498 Sri Lanka................................................................ 36 30,337 *1,958 *641 *14,570 977 Thailand................................................................. 246 1,789,597 569,496 258,236 305,233 104,218 Vietnam.................................................................. 58 90,398 *159 *54 19,871 10,385 Other Southern and Southeast Asian countries..... 46 98,702 *830 *205 *13,641 14,743 Eastern Asia, total...................................................... 937 46,922,848 4,520,360 3,422,844 4,659,259 9,103,576 China...................................................................... 294 2,863,094 289,142 52,320 187,069 1,074,133 Taiwan.................................................................... 266 3,716,627 271,212 86,334 708,816 833,557 Hong Kong............................................................. 309 8,138,816 841,675 136,776 1,326,895 396,629 Japan (including Okinawa and Ryukyu Islands)..... 747 28,533,440 2,744,061 2,941,981 1,604,288 5,874,840 South Korea, Republic of....................................... 309 3,571,160 373,556 205,433 820,135 920,536 Other Eastern Asian countries............................... 30 99,711 *714 -- *12,056 *3,881 Asia not allocable....................................................... 11 *240,082 *32 *19 *4,015 *54 Oceania, total................................................................ 562 8,186,887 1,650,592 645,613 1,207,848 1,017,164 Australia..................................................................... 527 7,024,865 1,185,065 547,754 1,097,292 876,414 New Zealand.............................................................. 230 671,875 182,833 62,358 109,119 87,826 Other countries of Oceania........................................ 46 490,147 *282,693 *35,501 *1,438 52,924 Puerto Rico and U.S. Possessions, total................... 354 5,674,410 829,044 124,594 1,071,910 1,582,315 Puerto Rico................................................................ 321 5,202,454 803,668 115,158 866,533 1,571,305 U.S. Possessions, total.............................................. 109 471,956 25,375 *9,436 205,377 11,010 American Samoa.................................................... 15 52,937 *2,440 -- *8,227 *192 Guam..................................................................... 77 248,311 *18,870 *7,826 128,636 5,460 Virgin Islands, U.S................................................. 56 151,506 *2,057 *812 61,015 4,164 Other U.S. Possessions......................................... 10 19,201 *2,008 *799 *7,500 *1,193 Country not stated....................................................... 2,453 63,548,329 2,749,900 291,541 24,649,844 6,337,644 Section 863(b) income................................................. 191 19,322,543 *553 -- *484,166 *6,624 Foreign Sales Corporation dividends ¹...................... 39 12,031,839 12,031,839 -- -- -- Interest-Charge Domestic International Sales Corporation dividends ¹........................................... 4 *50 *50 -- -- -- Footnotes at end of table.
Total Dividends
Foreign dividend income from foreign taxes deemed paid
(gross-up)
Interest Rents, royalties, and license fees
Foreign income and taxes
Gross income (less loss)

239
Corporate Foreign Tax Credit, 2001
Table 3.--U.S. Corporation Income Tax Returns with a Foreign Tax Credit, 2001: Foreign Income, Deductions, and Taxes by Selected Country to Which Foreign Taxes Were Paid--Continued[All figures are estimates based on a sample--money amounts are in thousands of dollars]
Selected country
Service Other Foreign branch Total
income income income ³ deductions
(7) (8) (9) (10) (11)
All geographic areas........................................................................... 19,042,809 142,094,092 30,945,555 80,847,969 208,151,787 Canada................................................................................................. 2,556,546 7,834,711 *2,067,902 3,417,316 12,853,272 Latin America, total............................................................................. 1,677,917 11,133,500 1,619,100 9,906,568 20,863,128 Mexico............................................................................................... 451,954 3,851,691 -- 2,686,360 6,403,781 Central America, total....................................................................... 40,868 716,061 ( ² ) 310,973 968,489 Belize............................................................................................ *169 *3,810 -- *29 1,670 Costa Rica.................................................................................... 3,337 86,840 -- 79,723 106,390 El Salvador................................................................................... 5,355 118,588 -- *20,120 98,918 Guatemala.................................................................................... 23,726 260,645 -- *32,597 263,051 Honduras....................................................................................... 11,814 123,446 -- *31,149 202,039 Nicaragua...................................................................................... *1,652 41,887 -- *2,961 38,382 Panama (including Canal Zone).................................................... -5,184 72,828 ( ² ) 136,411 254,523 Central America not allocable....................................................... -- *8,019 -- *7,984 *3,518 Caribbean countries, total................................................................. 60,834 1,442,682 *628,642 827,853 2,673,677 Cayman Islands (British)............................................................... *20,617 348,678 -- *615,884 1,780,104 Dominican Republic...................................................................... 8,744 112,485 -- 111,373 139,651 Haiti............................................................................................... *2,789 56,051 -- *15,710 49,957 Jamaica......................................................................................... 7,712 131,093 -- 34,968 126,515 Trinidad......................................................................................... 17,006 688,133 *613,012 25,948 295,888 Other Caribbean countries............................................................ 3,967 106,242 *15,630 23,971 281,562 South America, total.......................................................................... 990,584 5,364,908 990,458 6,081,381 10,614,090 Argentina....................................................................................... 420,902 1,098,395 *467,590 2,380,215 3,684,827 Bolivia........................................................................................... 373 23,924 -- *35,088 47,344 Brazil............................................................................................. 264,353 1,743,650 *46,518 2,012,016 3,369,132 Chili............................................................................................... 14,136 540,118 *636 581,110 918,287 Columbia....................................................................................... 88,519 793,017 *218,586 237,439 729,681 Ecuador......................................................................................... 3,590 94,828 *-18 31,900 119,660 Paraguay....................................................................................... *1,041 12,942 -- *62,070 52,680 Peru.............................................................................................. 70,950 307,395 *2,537 312,102 647,542 Uruguay......................................................................................... *7,178 67,105 -- 148,519 168,375 Venezuela..................................................................................... 118,320 581,076 *254,608 279,908 800,900 Other South American countries................................................... *1,223 102,459 -- *1,015 75,662 Latin America not allocable............................................................... *133,677 *-241,842 -- *2 *203,091 Other Western Hemisphere, total...................................................... 85,106 716,927 *1,354,584 913,713 1,983,376 Bahamas........................................................................................... 1,586 320,733 *1,636 *822,821 669,691 Bermuda........................................................................................... *54,418 348,501 *1,352,948 *3,459 1,064,526 Netherlands Antilles.......................................................................... 2,481 27,835 -- *6,935 103,717 Other British West Indies.................................................................. *5,930 -3,104 -- 47,334 100,128 All other Western Hemisphere.......................................................... *20,840 22,396 -- *33,164 45,462 Europe, total........................................................................................ 6,214,853 46,252,645 13,351,500 32,350,549 75,809,842 European Union, total....................................................................... 5,444,784 38,856,550 7,105,705 28,547,397 67,710,213 Austria........................................................................................... 21,604 305,792 *34,508 102,694 699,305 Belgium......................................................................................... 68,906 1,059,734 -- 645,266 2,180,483 Denmark....................................................................................... 40,262 801,498 *412,679 181,232 729,031 Finland.......................................................................................... 22,122 90,071 -- 49,527 167,971 France (including Andorra)............................................................ 560,220 1,921,300 *2,604 819,104 4,526,972 Germany....................................................................................... 1,690,634 4,644,581 *922 4,743,821 9,406,072 Greece.......................................................................................... 20,321 169,286 -- 283,594 426,284 Ireland........................................................................................... 56,191 507,480 *75 104,670 1,930,433 Italy (including San Marino).......................................................... 348,828 1,489,591 -- 1,173,000 2,524,047 Luxembourg.................................................................................. *1,408 203,186 *381,745 *16,415 617,193 Footnotes at end of table.
Oil and gas extraction income ³
Foreign income and taxes--Continued
Gross income (less loss)--Continued

240
Corporate Foreign Tax Credit, 2001
240
Table 3.--U.S. Corporation Income Tax Returns with a Foreign Tax Credit, 2001: Foreign Income, Deductions, and Taxes by Selected Country to Which Foreign Taxes Were Paid--Continued[All figures are estimates based on a sample--money amounts are in thousands of dollars]
Selected country
Service Other Foreign branch Total
income income income ³ deductions
(7) (8) (9) (10) (11)
Europe--continued European Union--continued Netherlands................................................................................... 427,192 2,199,623 *450,062 1,542,774 3,433,530 Portugal......................................................................................... 2,341 150,736 *-10 81,199 255,286 Spain............................................................................................. 176,058 956,892 *662,010 315,358 1,973,282 Sweden......................................................................................... 20,121 336,577 -- 264,568 821,114 United Kingdom............................................................................ 1,988,577 24,016,360 *5,161,110 18,224,173 38,009,647 European Union not allocable....................................................... -- *3,840 -- -- *9,564 Other West European countries, total............................................... 147,148 5,279,174 *5,762,416 2,639,568 5,174,462 Liechtenstein................................................................................. -- *319 -- -- *1,062 Monaco......................................................................................... *195 *2,579 -- *3,371 3,584 Norway.......................................................................................... 20,768 2,903,582 *5,762,416 1,399,289 1,157,259 Switzerland................................................................................... 100,109 2,150,543 -- 780,223 3,023,166 Turkey........................................................................................... 24,603 218,070 ( ² ) 456,497 523,732 Other West European countries not allocable.............................. 1,472 4,082 -- *188 465,658 East European countries, total.......................................................... 608,357 1,920,798 *483,379 1,135,996 2,694,520 Romania........................................................................................ 175,421 79,764 -- *70,096 329,653 Former Soviet Union..................................................................... 197,244 1,401,754 *483,379 572,752 1,359,493 Other East European countries..................................................... 235,691 439,280 -- 493,148 1,005,374 Europe not allocable......................................................................... *14,564 *196,122 -- *27,589 230,647 Africa, total.......................................................................................... 752,940 4,631,181 *4,108,147 1,096,484 3,813,179 North Africa, total.............................................................................. 95,713 1,051,712 *493,782 332,931 868,206 Algeria........................................................................................... *39,337 35,601 *93 *35,762 125,987 Egypt............................................................................................. 48,380 949,685 *491,864 225,485 653,613 Libya............................................................................................. -- *827 -- -- 15,696 Morocco........................................................................................ *6,992 49,701 -- *42,364 44,160 Other North African countries........................................................ *1,004 15,897 *1,824 *29,320 28,749 East Africa, total................................................................................ 5,571 149,321 *11,522 55,018 305,422 Ethiopia......................................................................................... *199 *26,030 -- *8,396 30,341 Kenya............................................................................................ *1,962 29,266 -- *42,497 162,661 Tanzania....................................................................................... *52 *2,571 -- *52 4,866 Uganda......................................................................................... *271 *708 -- *271 931 Other East African countries......................................................... *3,087 90,746 *11,522 *3,802 106,623 West and Central Africa, total........................................................... 525,122 3,354,094 *3,602,843 441,180 1,995,739 Gabon........................................................................................... *2,107 *13,689 *132,737 *15,348 14,931 Ghana........................................................................................... *7,356 *-4,333 -- *7,356 8,460 Liberia........................................................................................... *1 *3,624 -- -- 53,723 Nigeria.......................................................................................... 70,911 2,313,704 *2,529,178 *41,336 1,058,258 Zaire.............................................................................................. *4,694 *15,859 *15,118 *18,933 14,600 Other West and Central African countries.................................... 440,053 1,011,550 *925,810 358,208 845,767 Southern Africa, total........................................................................ 126,533 76,055 -- 267,355 641,778 Malawi........................................................................................... *328 *5 -- *90 *512 Zimbabwe..................................................................................... *56 6,871 -- *2,918 6,132 South Africa (include Namibia)..................................................... 125,502 68,516 -- 264,841 608,223 Zambia.......................................................................................... -- *764 -- *-642 699 Other Southern African countries.................................................. *647 *-101 -- *148 26,211 Footnotes at end of table.
Oil and gas extraction income ³
Foreign income and taxes--Continued
Gross income (less loss)--Continued

241
Corporate Foreign Tax Credit, 2001
Table 3.--U.S. Corporation Income Tax Returns with a Foreign Tax Credit, 2001: Foreign Income, Deductions, and Taxes by Selected Country to Which Foreign Taxes Were Paid--Continued[All figures are estimates based on a sample--money amounts are in thousands of dollars]
Selected country
Service Other Foreign branch Total
income income income ³ deductions
(7) (8) (9) (10) (11)
Asia, total............................................................................................. 2,312,932 35,870,966 6,755,518 27,234,938 43,199,658 Middle East, total.............................................................................. 583,098 4,317,933 *2,700,962 1,371,595 5,713,041 Bahrain.......................................................................................... 9,834 14,138 *-4,432 *321,518 351,494 Iran................................................................................................ *59 *66,642 *46,109 *99 56,368 Iraq................................................................................................ -- *-4,499 -- -- *852 Israel............................................................................................. 105,484 121,117 -- 146,940 289,535 Kuwait........................................................................................... 27,779 73,609 *-77 *34,607 61,658 Lebanon........................................................................................ *231 24,252 -- *18,348 20,635 Qatar............................................................................................. *50,627 488,184 *194,923 *226,455 378,699 Saudi Arabia................................................................................. 186,113 1,446,255 *1,007,960 69,794 2,787,021 United Arab Emirates.................................................................... 76,133 1,377,074 *1,024,731 380,575 1,347,217 Other areas of Arabian Peninsula................................................. *123,388 521,295 *431,748 *89,077 269,639 Other Middle East countries.......................................................... 3,450 189,866 -- 84,182 149,923 Southern and Southeast Asia, total................................................... 407,499 7,422,598 *3,902,723 5,055,668 9,847,181 Bangladesh................................................................................... *599 29,997 -- *40,956 31,416 India.............................................................................................. 88,310 618,769 *-7 838,426 967,542 Indonesia...................................................................................... 52,138 2,311,914 *2,087,086 575,591 2,172,986 Malaysia........................................................................................ -68,858 1,443,739 *923,958 217,061 997,971 Pakistan........................................................................................ *17,226 142,312 *79,153 129,802 159,505 Philippines.................................................................................... -19,640 284,198 *62,670 597,212 716,113 Singapore...................................................................................... 237,063 1,998,517 -- 2,070,101 3,916,099 Sri Lanka....................................................................................... *1,047 11,144 -- *14,168 16,125 Thailand........................................................................................ 85,374 467,040 *749,864 516,969 781,860 Vietnam......................................................................................... 14,898 45,030 -- 33,100 48,834 Other Southern and Southeast Asian countries............................ *-656 69,938 -- *22,283 38,731 Eastern Asia, total............................................................................. 1,184,624 24,032,185 *151,832 20,695,566 27,395,830 China............................................................................................. 184,511 1,075,920 *136,885 463,153 1,548,354 Taiwan.......................................................................................... 284,553 1,532,155 -- 1,740,861 2,482,274 Hong Kong.................................................................................... 338,983 5,097,858 -- 4,698,733 4,338,712 Japan (including Okinawa and Ryukyu Islands)........................... 288,312 15,079,958 *14,948 12,560,043 16,983,857 South Korea, Republic of.............................................................. 86,871 1,164,630 -- 1,232,605 2,008,422 Other Eastern Asian countries...................................................... *1,394 81,666 -- *171 34,211 Asia not allocable.............................................................................. *137,711 *98,250 -- *112,109 *243,605 Oceania, total....................................................................................... 325,105 3,340,565 *881,684 1,718,391 3,663,435 Australia............................................................................................ 311,484 3,006,856 *755,279 1,571,938 3,252,204 New Zealand..................................................................................... 10,843 218,897 *48,634 120,779 312,945 Other countries of Oceania............................................................... *2,778 114,812 *77,772 *25,675 98,285 Puerto Rico and U.S. Possessions, total.......................................... 490,198 1,576,349 -- 1,706,454 4,652,029 Puerto Rico....................................................................................... 468,493 1,377,297 -- 1,415,770 4,220,424 U.S. Possessions, total..................................................................... 21,705 199,052 -- 290,683 431,604 American Samoa.......................................................................... *427 *41,650 -- *8,226 53,844 Guam............................................................................................ 14,709 72,811 -- 167,278 225,535 Virgin Islands, U.S........................................................................ 6,011 77,448 -- 99,976 140,140 Other U.S. Possessions................................................................ *559 *7,143 -- *15,203 *12,085 Country not stated.............................................................................. 4,453,091 25,066,308 *807,119 2,507,719 55,174,555 Section 863(b) income........................................................................ *113,202 18,717,998 -- -- 14,429,543 Foreign Sales Corporation dividends ¹............................................. -- -- -- -- 11,935,068 Interest-Charge Domestic International Sales Corporation dividends ¹.................................................................. -- -- -- -- -- Footnotes at end of table.
Oil and gas extraction income ³
Foreign income and taxes--Continued
Gross income (less loss)--Continued

242
Corporate Foreign Tax Credit, 2001
242
Table 3.--U.S. Corporation Income Tax Returns with a Foreign Tax Credit, 2001: Foreign Income, Deductions, and Taxes by Selected Country to Which Foreign Taxes Were Paid--Continued[All figures are estimates based on a sample--money amounts are in thousands of dollars]
Deductions Taxable income
Selected country from oil and gas (less loss)
extraction before Taxes withheld at source on--
income 4 adjustments Total
(12) (13) (14) (15) (16) (17)
All geographic areas..................................................... 9,994,224 164,753,343 44,505,156 17,161,245 1,426,868 710,381 Canada........................................................................... *410,831 11,784,109 4,067,258 1,035,511 186,103 64,899 Latin America, total....................................................... 725,647 18,166,392 4,369,874 2,254,729 148,176 242,347 Mexico......................................................................... -- 6,010,428 1,585,132 723,860 50,891 43,161 Central America, total................................................. *1 611,513 178,333 38,603 2,946 663 Belize...................................................................... -- 4,597 *582 *222 -- *130 Costa Rica.............................................................. -- 94,671 20,869 13,155 *868 *163 El Salvador.............................................................. -- 84,875 7,991 4,971 *87 *205 Guatemala.............................................................. *1 116,907 13,545 8,754 *194 *71 Honduras................................................................. -- 228,588 114,905 4,762 *798 *47 Nicaragua................................................................ -- 12,183 803 694 -- -- Panama (including Canal Zone).............................. -- 65,060 17,880 4,287 *999 *48 Central America not allocable................................. -- *4,631 *1,758 *1,758 -- -- Caribbean countries, total........................................... *207,588 4,833,070 491,179 212,494 11,813 *2,758 Cayman Islands (British)......................................... -- 2,985,295 222,272 *2,855 *73 -- Dominican Republic................................................ -- 168,385 44,832 24,266 *7,372 *580 Haiti......................................................................... -- 24,551 *6,120 *6,021 -- -- Jamaica................................................................... -- 80,973 11,669 6,826 *501 *2,174 Trinidad................................................................... *182,717 574,256 180,650 169,155 *3,834 *4 Other Caribbean countries...................................... *24,871 999,611 25,636 3,370 *32 -- South America, total.................................................... 518,059 6,985,050 2,063,757 1,228,299 82,527 195,755 Argentina................................................................. *306,387 1,356,435 460,802 276,987 *3,723 59,032 Bolivia..................................................................... ( ² ) 16,419 5,198 3,590 *113 *53 Brazil....................................................................... *34,358 3,298,513 1,012,468 531,841 46,691 127,005 Chili......................................................................... ( ² ) 748,916 125,031 85,774 25,182 3,202 Columbia................................................................. *62,504 511,608 193,340 151,134 5,974 *436 Ecuador................................................................... *286 56,088 15,810 11,968 *513 *-318 Paraguay................................................................. *3 17,676 3,250 3,200 -- *14 Peru......................................................................... *1,670 214,265 76,789 69,424 *212 1,341 Uruguay................................................................... -- 28,384 21,062 12,570 *60 *207 Venezuela............................................................... *112,852 697,387 134,490 66,294 *58 4,783 Other South American countries............................. ( ² ) 39,361 *15,517 *15,517 -- -- Latin America not allocable......................................... -- *-273,669 *51,473 *51,473 -- *10 Other Western Hemisphere, total................................ *16,996 5,447,149 744,819 5,172 487 *49 Bahamas..................................................................... *7 607,577 20,389 *1 -- -- Bermuda...................................................................... *16,990 4,456,987 677,355 *-1,930 *90 -- Netherlands Antilles.................................................... -- 186,694 32,306 *3,814 *375 -- Other British West Indies............................................ -- 167,077 10,701 602 *22 *49 All other Western Hemisphere.................................... *32 28,253 *4,067 *2,685 -- -- Europe, total.................................................................. 2,681,320 77,952,092 21,611,291 6,072,528 717,557 255,377 European Union, total................................................. 1,558,072 62,111,937 15,507,898 3,734,943 314,302 227,849 Austria..................................................................... *3,622 703,435 133,497 17,697 2,900 *917 Belgium................................................................... *-271 792,891 250,261 72,925 10,127 722 Denmark.................................................................. *119,229 793,906 218,687 128,534 1,921 *13 Finland.................................................................... -- 150,592 23,275 6,297 892 *90 France (including Andorra)...................................... *168 3,547,254 1,238,867 234,370 22,524 795 Germany................................................................. *961 4,838,264 1,226,022 468,336 46,300 302 Greece.................................................................... *90 132,000 62,731 38,291 *1,227 *3 Ireland..................................................................... ( ² ) 4,550,866 247,896 11,419 2,785 *1,364 Italy (including San Marino).................................... *3,820 1,977,001 774,460 176,043 11,574 3,878 Luxembourg............................................................ *-204 2,870,660 624,708 5,300 3,969 -- Footnotes at end of table.
Total
InterestDividends
Foreign income and taxes--Continued
Foreign taxes paid, accrued, and deemed paid
Foreign taxes paid or accrued

243
Corporate Foreign Tax Credit, 2001
Table 3.--U.S. Corporation Income Tax Returns with a Foreign Tax Credit, 2001: Foreign Income, Deductions, and Taxes by Selected Country to Which Foreign Taxes Were Paid--Continued[All figures are estimates based on a sample--money amounts are in thousands of dollars]
Deductions Taxable income
Selected country from oil and gas (less loss)
extraction before Taxes withheld at source on--
income 4 adjustments Total
(12) (13) (14) (15) (16) (17)
Europe--continued European Union--continued Netherlands............................................................. *94,606 7,835,289 1,700,399 281,812 49,198 *3,660 Portugal................................................................... -- 373,848 111,662 25,343 3,058 *888 Spain....................................................................... *-352 3,204,769 1,742,683 143,962 44,071 787 Sweden................................................................... -- 531,521 92,651 14,931 1,724 *77 United Kingdom...................................................... *1,336,404 29,778,504 7,047,798 2,108,628 111,198 214,353 European Union not allocable................................. -- *31,137 *12,301 *1,054 *833 -- Other West European countries, total......................... *667,968 14,171,698 5,584,690 1,933,301 371,836 20,278 Liechtenstein........................................................... -- 2,738 *46 ( ² ) ( ² ) -- Monaco................................................................... -- 8,994 *2,130 *42 -- -- Norway.................................................................... *666,734 6,761,310 3,681,006 1,409,708 6,335 *3,728 Switzerland............................................................. -- 6,713,757 1,756,138 408,364 363,762 *197 Turkey..................................................................... *1,220 201,288 144,366 114,629 1,739 *16,354 Other West European countries not allocable........ *14 483,611 1,004 *557 -- ( ² ) East European countries, total.................................... *455,281 1,618,515 513,865 399,446 30,917 7,249 Romania.................................................................. *5 -33,526 12,835 11,645 *275 *278 Former Soviet Union............................................... *455,275 825,998 342,387 314,121 2,371 6,743 Other East European countries............................... ( ² ) 826,042 158,643 73,680 28,271 229 Europe not allocable................................................... -- 49,943 *4,837 *4,837 *501 -- Africa, total..................................................................... *1,728,657 3,618,463 1,715,561 1,362,598 8,831 1,409 North Africa, total........................................................ *402,983 579,825 218,412 207,366 *361 *1,151 Algeria..................................................................... *60,736 -20,994 *20,986 *20,986 *4 -- Egypt....................................................................... *342,072 559,060 183,579 176,629 -- *438 Libya....................................................................... -- -9,880 *1 -- -- -- Morocco.................................................................. -- 27,607 9,171 8,451 *357 *713 Other North African countries.................................. *175 24,031 *4,674 *1,300 -- -- East Africa, total.......................................................... *732 440,576 177,628 10,619 *1,685 ( ² ) Ethiopia................................................................... -- 5,891 *1,685 *1,685 -- -- Kenya...................................................................... -- -33,634 18,714 5,521 *1,428 -- Tanzania................................................................. -- 1,972 *464 *458 -- -- Uganda.................................................................... -- 4,277 *1,547 *344 -- -- Other East African countries................................... *732 462,071 155,217 2,610 *256 ( ² ) West and Central Africa, total..................................... *1,324,942 2,377,095 1,236,008 1,120,842 5,866 *6 Gabon..................................................................... *2,593 142,671 *38,984 *4,174 *814 -- Ghana..................................................................... *35 1,970 *1,892 *57 *41 -- Liberia..................................................................... -- 13,043 *2,313 -- -- -- Nigeria..................................................................... *948,975 1,557,194 1,003,069 937,184 *4,252 *5 Zaire........................................................................ *8,052 7,296 *3,832 *3,686 *84 -- Other West and Central African countries.............. *365,288 654,921 185,918 175,742 *675 ( ² ) Southern Africa, total................................................... *1 222,717 83,514 23,772 919 *252 Malawi..................................................................... -- 561 *129 *24 *24 -- Zimbabwe............................................................... -- 8,309 3,091 *1,824 *380 *234 South Africa (include Namibia)............................... -- 181,946 68,578 18,397 *247 *17 Zambia.................................................................... *1 10,396 *7,380 *92 *90 -- Other Southern African countries............................ -- 21,505 *4,337 *3,435 *178 -- Footnotes at end of table.
Total
Dividends Interest
Foreign income and taxes--Continued
Foreign taxes paid, accrued, and deemed paid
Foreign taxes paid or accrued

244
Corporate Foreign Tax Credit, 2001
244
Table 3.--U.S. Corporation Income Tax Returns with a Foreign Tax Credit, 2001: Foreign Income, Deductions, and Taxes by Selected Country to Which Foreign Taxes Were Paid--Continued[All figures are estimates based on a sample--money amounts are in thousands of dollars]
Deductions Taxable income
Selected country from oil and gas (less loss)
extraction before Taxes withheld at source on--
income 4 adjustments Total
(12) (13) (14) (15) (16) (17)
Asia, total....................................................................... 3,633,250 28,164,919 9,009,574 4,500,933 263,780 52,725 Middle East, total........................................................ *2,154,626 529,612 499,009 411,358 3,821 3,730 Bahrain.................................................................... *1,581 14,110 *747 *458 -- *198 Iran.......................................................................... *47,492 25,586 -- -- -- -- Iraq.......................................................................... -- *-4,587 -- -- -- -- Israel....................................................................... -- 351,018 86,915 45,512 2,708 3,004 Kuwait..................................................................... *2,750 57,969 9,863 9,202 -- -- Lebanon.................................................................. -- 24,350 1,544 1,539 *65 *30 Qatar....................................................................... *124,703 190,604 *62,727 *62,727 -- -- Saudi Arabia........................................................... *899,474 -1,033,815 130,297 123,071 *628 *430 United Arab Emirates.............................................. *954,225 314,712 *49,301 *39,595 -- -- Other areas of Arabian Peninsula........................... *124,118 520,804 151,151 123,398 ( ² ) -- Other Middle East countries.................................... *282 68,862 6,464 5,855 *420 *67 Southern and Southeast Asia, total............................. *1,394,111 8,111,812 2,515,525 1,514,654 50,384 30,238 Bangladesh............................................................. -- 18,558 *11,310 *11,054 *61 -- India........................................................................ *226 623,915 155,471 105,391 1,579 1,210 Indonesia................................................................. *774,304 1,989,687 899,744 493,347 8,951 9,391 Malaysia.................................................................. *501,921 1,172,988 363,589 269,769 3,001 642 Pakistan.................................................................. *6,183 148,064 41,697 36,772 1,002 *1 Philippines............................................................... *2,101 886,713 201,003 105,063 27,074 9,428 Singapore................................................................ *1,778 2,148,404 335,929 245,611 1,084 5,381 Sri Lanka................................................................. -- 14,212 *3,058 *2,417 *126 -- Thailand.................................................................. *107,599 1,007,737 496,516 238,280 7,469 4,060 Vietnam................................................................... ( ² ) 41,564 2,550 2,496 -- *126 Other Southern and Southeast Asian countries...... -- 59,971 *4,658 *4,453 *38 -- Eastern Asia, total....................................................... *84,512 19,527,018 5,993,741 2,573,642 209,496 18,737 China....................................................................... *84,221 1,314,740 137,198 87,240 *2,846 4,813 Taiwan.................................................................... -- 1,234,353 372,364 286,030 50,560 5,505 Hong Kong.............................................................. -- 3,800,103 461,047 324,271 1,758 *985 Japan (including Okinawa and Ryukyu Islands)...... *292 11,549,583 4,549,401 1,607,436 117,432 5,612 South Korea, Republic of........................................ -- 1,562,738 473,255 268,189 36,900 1,424 Other Eastern Asian countries................................ -- 65,500 *476 *476 -- *398 Asia not allocable........................................................ -- -3,523 *1,299 *1,280 *79 *21 Oceania, total................................................................. 205,880 4,523,451 1,079,347 433,735 13,818 23,908 Australia...................................................................... *171,054 3,772,661 938,719 390,965 2,830 22,173 New Zealand............................................................... *10,952 358,930 97,246 34,888 10,912 1,254 Other countries of Oceania......................................... *23,873 391,861 43,382 7,881 *76 *482 Puerto Rico and U.S. Possessions, total.................... -- 1,022,381 544,303 419,709 9,436 7,522 Puerto Rico................................................................. -- 982,029 511,744 396,586 9,433 7,345 U.S. Possessions, total............................................... -- 40,352 32,559 23,123 *3 *177 American Samoa.................................................... -- -907 *724 *724 *3 -- Guam...................................................................... -- 22,776 22,673 14,847 -- -- Virgin Islands, U.S.................................................. -- 11,367 6,577 5,765 -- *177 Other U.S. Possessions.......................................... -- 7,116 *2,585 *1,786 -- -- Country not stated........................................................ *591,611 8,373,774 1,479,620 1,173,066 94,083 73,757 Section 863(b) income.................................................. -- 4,893,001 32,253 32,253 -- -- Foreign Sales Corporation dividends ¹....................... -- *96,770 -- -- -- -- Interest-Charge Domestic International Sales Corporation dividends ¹............................................ -- *50 ( ² ) ( ² ) ( ² ) -- Footnotes at end of table.
Dividends Interest
Total
Foreign income and taxes--Continued
Foreign taxes paid or accrued
Foreign taxes paid, accrued, and deemed paid
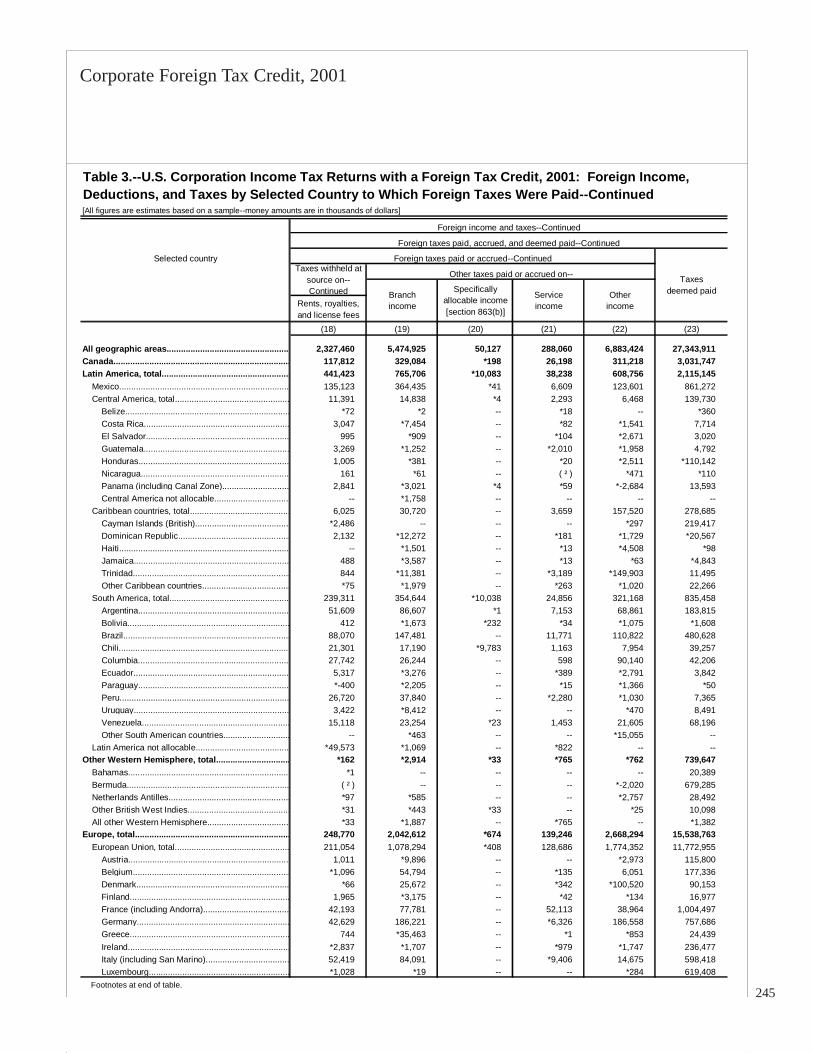
245
Corporate Foreign Tax Credit, 2001
Table 3.--U.S. Corporation Income Tax Returns with a Foreign Tax Credit, 2001: Foreign Income, Deductions, and Taxes by Selected Country to Which Foreign Taxes Were Paid--Continued[All figures are estimates based on a sample--money amounts are in thousands of dollars]
Selected country
Rents, royalties, and license fees
(18) (19) (20) (21) (22) (23)
All geographic areas.................................................... 2,327,460 5,474,925 50,127 288,060 6,883,424 27,343,911 Canada.......................................................................... 117,812 329,084 *198 26,198 311,218 3,031,747 Latin America, total...................................................... 441,423 765,706 *10,083 38,238 608,756 2,115,145 Mexico....................................................................... 135,123 364,435 *41 6,609 123,601 861,272 Central America, total................................................ 11,391 14,838 *4 2,293 6,468 139,730 Belize..................................................................... *72 *2 -- *18 -- *360 Costa Rica............................................................. 3,047 *7,454 -- *82 *1,541 7,714 El Salvador............................................................ 995 *909 -- *104 *2,671 3,020 Guatemala............................................................. 3,269 *1,252 -- *2,010 *1,958 4,792 Honduras............................................................... 1,005 *381 -- *20 *2,511 *110,142 Nicaragua.............................................................. 161 *61 -- ( ² ) *471 *110 Panama (including Canal Zone)............................ 2,841 *3,021 *4 *59 *-2,684 13,593 Central America not allocable................................ -- *1,758 -- -- -- -- Caribbean countries, total.......................................... 6,025 30,720 -- 3,659 157,520 278,685 Cayman Islands (British)........................................ *2,486 -- -- -- *297 219,417 Dominican Republic............................................... 2,132 *12,272 -- *181 *1,729 *20,567 Haiti....................................................................... -- *1,501 -- *13 *4,508 *98 Jamaica................................................................. 488 *3,587 -- *13 *63 *4,843 Trinidad.................................................................. 844 *11,381 -- *3,189 *149,903 11,495 Other Caribbean countries..................................... *75 *1,979 -- *263 *1,020 22,266 South America, total.................................................. 239,311 354,644 *10,038 24,856 321,168 835,458 Argentina............................................................... 51,609 86,607 *1 7,153 68,861 183,815 Bolivia.................................................................... 412 *1,673 *232 *34 *1,075 *1,608 Brazil...................................................................... 88,070 147,481 -- 11,771 110,822 480,628 Chili........................................................................ 21,301 17,190 *9,783 1,163 7,954 39,257 Columbia............................................................... 27,742 26,244 -- 598 90,140 42,206 Ecuador................................................................. 5,317 *3,276 -- *389 *2,791 3,842 Paraguay............................................................... *-400 *2,205 -- *15 *1,366 *50 Peru....................................................................... 26,720 37,840 -- *2,280 *1,030 7,365 Uruguay................................................................. 3,422 *8,412 -- -- *470 8,491 Venezuela.............................................................. 15,118 23,254 *23 1,453 21,605 68,196 Other South American countries............................ -- *463 -- -- *15,055 -- Latin America not allocable....................................... *49,573 *1,069 -- *822 -- -- Other Western Hemisphere, total............................... *162 *2,914 *33 *765 *762 739,647 Bahamas.................................................................... *1 -- -- -- -- 20,389 Bermuda.................................................................... ( ² ) -- -- -- *-2,020 679,285 Netherlands Antilles................................................... *97 *585 -- -- *2,757 28,492 Other British West Indies........................................... *31 *443 *33 -- *25 10,098 All other Western Hemisphere................................... *33 *1,887 -- *765 -- *1,382 Europe, total................................................................. 248,770 2,042,612 *674 139,246 2,668,294 15,538,763 European Union, total................................................ 211,054 1,078,294 *408 128,686 1,774,352 11,772,955 Austria.................................................................... 1,011 *9,896 -- -- *2,973 115,800 Belgium.................................................................. *1,096 54,794 -- *135 6,051 177,336 Denmark................................................................ *66 25,672 -- *342 *100,520 90,153 Finland................................................................... 1,965 *3,175 -- *42 *134 16,977 France (including Andorra).................................... 42,193 77,781 -- 52,113 38,964 1,004,497 Germany................................................................ 42,629 186,221 -- *6,326 186,558 757,686 Greece................................................................... 744 *35,463 -- *1 *853 24,439 Ireland.................................................................... *2,837 *1,707 -- *979 *1,747 236,477 Italy (including San Marino)................................... 52,419 84,091 -- *9,406 14,675 598,418 Luxembourg........................................................... *1,028 *19 -- -- *284 619,408 Footnotes at end of table.
Branch income
Service income
Taxes deemed paid
Taxes withheld at source on--Continued Other
income
Specifically allocable income [section 863(b)]
Foreign income and taxes--Continued
Foreign taxes paid, accrued, and deemed paid--Continued
Foreign taxes paid or accrued--Continued
Other taxes paid or accrued on--

246
Corporate Foreign Tax Credit, 2001
246
Table 3.--U.S. Corporation Income Tax Returns with a Foreign Tax Credit, 2001: Foreign Income, Deductions, and Taxes by Selected Country to Which Foreign Taxes Were Paid--Continued[All figures are estimates based on a sample--money amounts are in thousands of dollars]
Selected country
Rents, royalties, and license fees
(18) (19) (20) (21) (22) (23)
Europe--continued European Union--continued Netherlands........................................................... 3,417 69,388 -- *432 155,717 1,418,587 Portugal................................................................. 8,261 *10,907 -- *387 *1,842 86,318 Spain...................................................................... 36,379 17,051 *90 572 45,011 1,598,721 Sweden.................................................................. *50 9,215 -- *418 3,447 77,720 United Kingdom..................................................... 16,906 492,914 *317 57,533 1,215,406 4,939,170 European Union not allocable................................ *53 -- -- -- *168 *11,247 Other West European countries, total........................ 10,704 771,741 -- *592 758,150 3,651,389 Liechtenstein.......................................................... -- -- -- -- -- *46 Monaco.................................................................. -- *42 -- -- -- *2,087 Norway................................................................... ( ² ) *663,416 -- *296 *735,932 2,271,299 Switzerland............................................................ 4,490 18,622 -- *208 21,086 1,347,774 Turkey.................................................................... 5,694 *89,623 -- *89 *1,131 29,736 Other West European countries not allocable....... *520 *38 -- -- -- *447 East European countries, total................................... 22,676 192,576 *266 9,968 135,792 114,419 Romania................................................................ 1,697 *6,155 -- *789 *2,451 *1,190 Former Soviet Union.............................................. 3,101 168,772 -- *2,687 130,446 28,266 Other East European countries.............................. 17,878 17,649 *266 6,492 2,896 84,963 Europe not allocable.................................................. *4,336 -- -- -- -- -- Africa, total................................................................... 9,590 121,455 -- 2,109 1,219,205 352,963 North Africa, total....................................................... 1,510 *49,813 -- *624 *153,906 11,046 Algeria................................................................... -- *20,982 -- -- -- -- Egypt...................................................................... 1,106 *20,829 -- *481 *153,776 *6,950 Libya...................................................................... -- -- -- -- -- *1 Morocco................................................................. 356 *6,750 -- *144 *130 *721 Other North African countries................................ *48 *1,252 -- -- -- *3,374 East Africa, total........................................................ 602 *4,070 -- *246 *4,016 167,009 Ethiopia.................................................................. -- *292 -- -- *1,393 -- Kenya..................................................................... *274 *3,568 -- *246 *5 *13,193 Tanzania................................................................ *7 -- -- -- *452 *6 Uganda.................................................................. -- -- -- -- *344 *1,203 Other East African countries.................................. *322 *209 -- -- *1,823 152,607 West and Central Africa, total.................................... *662 *53,487 -- *940 *1,059,880 115,165 Gabon.................................................................... ( ² ) *3,359 -- -- -- *34,811 Ghana.................................................................... *16 -- -- -- -- *1,835 Liberia.................................................................... -- -- -- -- -- *2,313 Nigeria................................................................... *631 *12,740 -- *152 *919,404 *65,885 Zaire...................................................................... -- *3,601 -- -- -- *147 Other West and Central African countries............. *16 *33,787 -- *788 *140,476 *10,176 Southern Africa, total................................................. 6,815 14,085 -- *298 *1,403 59,743 Malawi................................................................... -- -- -- -- -- *105 Zimbabwe.............................................................. *52 *1,158 -- -- *1 *1,266 South Africa (include Namibia).............................. 3,505 12,927 -- *298 *1,402 50,181 Zambia................................................................... *2 -- -- -- -- *7,288 Other Southern African countries........................... *3,256 -- -- -- -- *902 Footnotes at end of table.
Taxes deemed paid
Taxes withheld at source on--Continued Branch
income
Specifically allocable income [section 863(b)]
Service income
Other income
Foreign income and taxes--Continued
Foreign taxes paid, accrued, and deemed paid--Continued
Foreign taxes paid or accrued--Continued
Other taxes paid or accrued on--

247
Corporate Foreign Tax Credit, 2001
Table 3.--U.S. Corporation Income Tax Returns with a Foreign Tax Credit, 2001: Foreign Income, Deductions, and Taxes by Selected Country to Which Foreign Taxes Were Paid--Continued[All figures are estimates based on a sample--money amounts are in thousands of dollars]
Selected country
Rents, royalties, and license fees
(18) (19) (20) (21) (22) (23)
Asia, total...................................................................... 960,841 1,629,944 *7,104 22,695 1,563,845 4,508,640 Middle East, total....................................................... 18,544 103,347 -- 4,063 277,853 87,651 Bahrain.................................................................. -- *260 -- -- -- *289 Iran......................................................................... -- -- -- -- -- -- Iraq......................................................................... -- -- -- -- -- -- Israel...................................................................... 12,627 *8,606 -- *557 18,010 41,403 Kuwait.................................................................... *1,576 *5,813 -- -- *1,813 *660 Lebanon................................................................. *-12 *1,404 -- *11 *42 *5 Qatar...................................................................... *5 *57,519 -- *105 *5,099 -- Saudi Arabia.......................................................... 4,062 *12,194 -- *3,022 *102,736 7,226 United Arab Emirates............................................ -- *8,617 -- -- *30,979 *9,705 Other areas of Arabian Peninsula.......................... *41 *5,510 -- *283 *117,564 *27,753 Other Middle East countries.................................. *246 *3,425 -- *86 *1,611 *609 Southern and Southeast Asia, total........................... 143,334 433,407 *562 7,053 849,676 1,000,871 Bangladesh............................................................ -- *10,993 -- -- -- *256 India....................................................................... 10,645 75,348 *58 2,499 14,053 50,080 Indonesia............................................................... 6,037 *57,001 -- 677 411,290 406,397 Malaysia................................................................ 14,141 10,829 *4 1,417 239,736 93,819 Pakistan................................................................. *221 *16,508 -- *294 *18,746 4,925 Philippines............................................................. 13,447 40,998 *13 *680 13,423 95,940 Singapore.............................................................. 55,432 168,883 *486 531 13,814 90,318 Sri Lanka................................................................ *5 *2,276 -- *10 -- *641 Thailand................................................................. 43,292 43,950 -- 925 138,585 258,236 Vietnam.................................................................. *113 *2,221 -- *21 *15 *54 Other Southern and Southeast Asian countries..... ( ² ) *4,401 -- -- *14 *205 Eastern Asia, total..................................................... 798,561 1,093,189 *6,542 10,800 436,317 3,420,099 China..................................................................... 40,311 15,658 -- 1,624 21,987 49,958 Taiwan................................................................... 115,339 88,836 *135 3,048 22,606 86,334 Hong Kong............................................................. 2,875 86,503 -- *111 232,038 136,776 Japan (including Okinawa and Ryukyu Islands).... 551,669 777,543 *6,124 4,910 144,146 2,941,965 South Korea, Republic of....................................... 88,288 124,649 *283 *1,106 15,539 205,066 Other Eastern Asian countries............................... *78 -- -- -- -- -- Asia not allocable...................................................... *401 -- -- *779 -- *19 Oceania, total............................................................... 66,879 61,346 *190 8,820 258,774 645,613 Australia..................................................................... 58,014 51,785 *170 8,356 247,636 547,754 New Zealand.............................................................. 8,820 5,011 *20 *464 8,409 62,358 Other countries of Oceania........................................ *45 *4,550 -- -- *2,729 *35,501 Puerto Rico and U.S. Possessions, total................... 265,863 94,523 *36 16,824 25,505 124,594 Puerto Rico................................................................ 265,228 76,360 *3 14,791 23,427 115,158 U.S. Possessions, total.............................................. *636 18,163 *33 *2,034 2,077 *9,436 American Samoa................................................... *1 *720 -- -- -- -- Guam..................................................................... *5 12,708 -- *397 1,737 *7,826 Virgin Islands, U.S................................................. *629 *3,006 *33 *1,637 *282 *812 Other U.S. Possessions......................................... -- *1,729 -- -- *58 *799 Country not stated....................................................... 222,371 437,388 -- 33,166 312,299 306,555 Section 863(b) income................................................. -- -- 31,809 -- *444 -- Foreign Sales Corporation dividends ¹...................... -- -- -- -- -- -- Interest-Charge Domestic International Sales Corporation dividends ¹.......................................... -- -- -- -- -- -- * Data should be used with caution because of the small number of sample returns on which they are based. ¹ Dividends from an Interest-Charge Domestic International Sales Corporation or a Foreign Sales Corporation were not reported for specific foreign countries. ² Less than $500. ³ Included in gross income (less loss), columns 2-8. Included in total deductions, column 11. NOTE: Detail may not add to totals because of rounding.
Other income
Foreign income and taxes--Continued
Foreign taxes paid, accrued, and deemed paid--Continued
Foreign taxes paid or accrued--Continued
Other taxes paid or accrued on-- Taxes deemed paid
Taxes withheld at source on--Continued Branch
income
Specifically allocable income [section 863(b)]
Service income
4